remote sensing and geographical information … sensing and geographical information analytical...
TRANSCRIPT

Remote Sensing and Geographical Information Analytical
Techniques for Modelling Ommatissus lybicus (Hemiptera:
Tropiduchidae) Habitat and Population Densities
Khalifa M Al-Kindi 1 , Paul Kwan Corresp., 1 , Nigel Andrew 2 , Mitchell Welch 1
1 School of Science and Technology, University of New England, Armidale, NSW, Australia
2 Centre for Behavioural and Physiological Ecology, University of New England, Armidale, NSW, Australia
Corresponding Author: Paul Kwan
Email address: [email protected]
In order to understand the distribution and prevalence of Ommatissus lybicus (Homoptera:
Tropiduchidae) as well as analyse their current biographical patterns and predict their
future spread, comprehensive and highly sophisticated information on the environmental,
climatic, and agricultural practices are essential. The analytical techniques available in
modern spatial analysis packages, such as Remote Sensing and Geographical Information
Systems, can help detect and model spatial links and correlations between the presence,
absence and density of O. lybicus in response to climatic, environmental and human
factors. The main objective of this paper is to review remote sensing and geographical
information analytical techniques that can be applied in mapping and modelling the
habitat and population density of O. lybicus in Oman. An exhaustive search of related
literature revealed that there are few studies linking location-based infestation levels of
pests like the O. lybicus with climatic, environmental and human practice related variables
in the Middle East. Our review also highlights the accumulated knowledge and addresses
the gaps in this area of research. Furthermore, it makes recommendations for future
studies, and gives suggestions on monitoring and surveillance sites that are necessary in
designing both local and regional level integrated pest management (IPM) policing of palm
tree and other affected cultivated crops.
PeerJ Preprints | https://doi.org/10.7287/peerj.preprints.2716v1 | CC BY 4.0 Open Access | rec: 13 Jan 2017, publ: 13 Jan 2017
1 Remote sensing and Geographical Information Analytical Techniques for Modelling
2 Ommatissus lybicus (Hemiptera: Tropiduchidae) Habitat and Population Densities
3 Khalifa M. Al-Kindi 1 *, Paul Kwan 1 Nigel R. Andrew 2 and Mitchell Welch 1,
4 1 School of Science and Technology, University of New England, Armidale, NSW 2351,
5 Australia; [email protected] (KA), [email protected] (PK) and
6 [email protected] (MW)
7 2 Centre for Behavioural and Physiological Ecology, University of New England, Armidale,
8 NSW 2351, Australia; [email protected] (NA)
9 * Correspondence: [email protected]; Tel.: +61 2 6773 2034
10 Abstract: In order to understand the distribution and prevalence of Ommatissus lybicus
11 (Homoptera: Tropiduchidae) as well as analyse their current biographical patterns and predict
12 their future spread, comprehensive and highly sophisticated information on the environmental,
13 climatic, and agricultural practices are essential. The analytical techniques available in modern
14 spatial analysis packages, such as Remote Sensing and Geographical Information Systems, can
15 help detect and model spatial links and correlations between the presence, absence and density of
16 O. lybicus in response to climatic, environmental and human factors. The main objective of this
17 paper is to review remote sensing and geographical information analytical techniques that can be
18 applied in mapping and modelling the habitat and population density of O. lybicus in Oman. An
19 exhaustive search of related literature revealed that there are few studies linking location-based
20 infestation levels of pests like the O. lybicus with climatic, environmental and human practice
21 related variables in the Middle East. Our review also highlights the accumulated knowledge and
22 addresses the gaps in this area of research. Furthermore, it makes recommendations for future
PeerJ Preprints | https://doi.org/10.7287/peerj.preprints.2716v1 | CC BY 4.0 Open Access | rec: 13 Jan 2017, publ: 13 Jan 2017

23 studies, and gives suggestions on monitoring and surveillance sites that are necessary in designing
24 both local and regional level integrated pest management (IPM) policing of palm tree and other
25 affected cultivated crops.
26 Keywords: Remote Sensing; GIS; Dubas Bug; Ommatissus lybicus
27 Abbreviations used in the paper
PeerJ Preprints | https://doi.org/10.7287/peerj.preprints.2716v1 | CC BY 4.0 Open Access | rec: 13 Jan 2017, publ: 13 Jan 2017

28
AFRI Aerosol Free Vegetation Index
ANN Artificial neural network
AI Artificial Intelligence
ASTER Advanced Space Thermal Emission and Reflection Radiometer
AVHRR Advanced Very High Resolution Radiometer
AVIRIS Airborne Visible/Infrared Imaging Spectrometer
ALOS Advanced Land Observing Satellite
AC Atmospheric correction
ARVI Atmospherically Resistant Vegetation Index
BIO Bare soil index
CA Cellular Automata
CART Classification and regression tree
CIR Colour-infrared
DEM Digital Elevation Model
DVI Different vegetation index
NDV Normalized different vegetation
NDMI Normalisation different moisture index
FS Fluorescence spectroscopy
GIS Geographical Information Systems
GEMI Global Environmental Monitoring Index
GR Geometrical rectification
GWR Geographically Weighted Regression
HTI Humid-Thermal Index
HTO Humid-Thermal Ratio
IPM Integrated Pest Management
IR Image registration
LIDAR Light detection and ranging
LAI Leaf area index
LWCI Leaf water content index
MIR Mid-infrared
MODIS Moderate Resolution Imaging Spectroradiometer
MAS Multi-agent system
MSS Landsat Multi-Spectral Scanner
NAIP National Agricultural Imagery Programme
NIR Near-infrared
MNF Minimum noise fraction
OBIA Object-based image analysis
PVI Perpendicular Vegetation Index
PCA Principal Components Analysis
REPD Red-edge position determination
RVI Ratio vegetation Index
SAVI Soil adjusted vegetation
SCI Shadow canopy index
SPOT Satellite Probatoire l’Observation de la Terre
SVM Support vector machines
TM Thematic Mapper
TC Topographic correction
UAV Unmanned aerial vehicle
VIS Visible
VI Vegetation Indices
PeerJ Preprints | https://doi.org/10.7287/peerj.preprints.2716v1 | CC BY 4.0 Open Access | rec: 13 Jan 2017, publ: 13 Jan 2017

29 1. Introduction
30 Remote sensing is a powerful technology that has been applied in precision agriculture
31 applications. Remotely sensed data can be used in mapping tools to classify crops and examine
32 their health and viability. They can also be used for monitoring farming practices and to measure
33 soil moisture across a wide area instead of at discrete point locations that are inherent to ground
34 measurement. Based on these spatial differences, variable rate application of chemicals such as
35 fertilisers or pesticides can be made. Remote sensing information can further be used to establish
36 sub-field management zones, providing a less expensive yet finer resolution option than grid
37 sampling. Although remote sensing technologies are more widely used in other industries, their
38 potential for profitable use by farmers is less frequently studied. As examples in agriculture,
39 remote sensing technologies have been used successfully for monitoring and mapping water stress,
40 crop quality and growth, wetland, water quality, phosphorus and nitrogen deficiencies in
41 vegetation, as well as detecting insect infestations (e.g. O. lybicus) and plant diseases.
42 1.1 Background
43 The date palm, Phoenix dactylifera Linnaeus, is an important economic resource in the Sultanate
44 of Oman. Plant-parasitic nematodes, associated with date palm trees in Oman and in most other
45 Arab countries, can reduce their economic yields (El-Juhany 2010). A variety of insect pests can
46 cause major damages to this crop through production losses and plant death (Abdullah et al. 2010;
47 Al-Khatri 2004; Blumberg 2008; El-Shafie 2012; Howard 2001). One such species, Ommatissus
48 lybicus de Bergevin 1930 (Hemiptera: Tropiduchidae), which is known more commonly as Dubas
49 bug, has been identified as a major economic threat, and is presently affecting palm growth yield
50 in Oman (Al-Yahyai 2006). Indeed, the Dubas bug has been identified as one of the primary
51 reasons for the decline in date production in Oman (Al-Yahyai & Al-Khanjari 2008; Al-Zadjali et
PeerJ Preprints | https://doi.org/10.7287/peerj.preprints.2716v1 | CC BY 4.0 Open Access | rec: 13 Jan 2017, publ: 13 Jan 2017

52 al. 2006) (Table 1). It is also a principal pest of date palms in many locations throughout the Middle
53 East, North Africa, Spain, and southeast Russia (Klein & Venezian 1985; Mifsud et al. 2010). The
54 Dubas bug is believed to have been introduced into the Tigris-Euphrates River Valley, from where
55 it has spread to other zones in recent decades (Blumberg 2008; El-Haidari et al. 1968) .
56 The Dubas bug is a sap feeding insect; both adults and nymphs suck the sap from date palms,
57 thereby causing chlorosis (removal of photosynthetic cells and yellowing of fronds). Prolonged
58 high infestation level will result in the flagging and destruction of palm plantations (Al-Khatri
59 2004; Howard 2001; Hussain 1963; Mahmoudi et al. 2015; Mokhtar & Al Nabhani 2010; Shah et
60 al. 2013). There is also an indirect effect whereby honeydew secretions produced by the Dubas
61 bug can promote the growth of black sooty mould on the foliage and consequently a reduction in
62 the photosynthetic rates of date palms (Blumberg 2008; Mokhtar & Al-Mjeini 1999; Shah et al.
63 2012). Nymphs pass through five growth instars (Hussain 1963; Shah et al. 2012), with adult
64 female Dubas bug reaching 5–6 mm and the males 3–3.5 mm in length (Aldryhim 2004; Mokhtar
65 & Al Nabhani 2010). Their colour is yellowish-green while the main distinguishing feature
66 between males and females is the presence of spots on females; males have a more tapered
67 abdomen and larger wings relative to the abdomen.
PeerJ Preprints | https://doi.org/10.7287/peerj.preprints.2716v1 | CC BY 4.0 Open Access | rec: 13 Jan 2017, publ: 13 Jan 2017

68 Table 1. Classification of the Dubas bug
Phylum Arthropoda References
Class Insecta
Order Hemiptera (previously Homoptera)
Family Tropiduchidae
Genus Ommatissus
Full Name Ommatissus lybicus Bergevin
Preferred common name Date palm Dubas bug
Synonym Old world Dubas bug
(Al-Azawi
1986; Al-
Mahmooli
et al. 2005;
Elwan &
Al-
Tamimi
1999;
Hussein &
Ali 1996;
Jasim &
Al-
Zubaidy
2010;
Kaszab et
al. 1979;
Khalaf et
al. 2012;
Mokhtar &
Al
Nabhani
2010;
Thacker et
al. 2003)
Colour Yellowish-green
69
70 1.2.Biology and Life History
71 The biology of this species has been investigated in a number of studies (Al-Azawi 1986;
72 Arbabtafti et al. 2014; Hussain 1963; Jasim & Al-Zubaidy 2010; Klein & Venezian 1985;
73 Payandeh & Dehghan 2011; Shah et al. 2012). The Dubas bug produces two generations annually,
74 including the spring and autumn generations (Blumberg 2008; Hussain 1963). In the spring
PeerJ Preprints | https://doi.org/10.7287/peerj.preprints.2716v1 | CC BY 4.0 Open Access | rec: 13 Jan 2017, publ: 13 Jan 2017
75 generation, eggs start hatching from February to April, after which nymphs pass through five
76 instars to become adults in approximately 6–7 weeks. The eggs aestivate during the hot season
77 (i.e., summer) until the autumn generation, when they start hatching from late August to the last
78 week of October. A nymph takes about 6 weeks to develop into an adult, which then lives for about
79 12 weeks. Females lay between 100 and 130 eggs (Elwan & Al-Tamimi 1999; Mokhtar & Al
80 Nabhani 2010).The female Dubas bug lays her eggs by inserting them into holes in the tissue of
81 the date palm frond at the end of each generation. The eggs remain dormant for about three months.
82 When they hatch, the resulting nymphs remain on the fronds of the same tree, feeding on the sap
83 and defecating large amounts of honeydew, which eventually covers the palm fronds and promotes
84 the growth of black sooty mould.
85 In extreme cases, the sooty mould that develops from the honeydew secretions can block the
86 stomata of the leaves, causing partial or complete suffocation of the date palm, which in turn
87 reduces its yield. The honeydew secretion also makes the dates unpalatable (Aminaee et al. 2010;
88 El-Juhany 2010; El-Shafie et al. 2015; Gassouma 2004). The eggs of Dubas bug are sensitive to
89 temperature. In summer, the eggs can hatch within 18–21 days, but in winter they may take up to
90 170 days to hatch (Blumberg 2008). The developmental time of Dubas bug’s eggs has been studied
91 at three different temperatures, 17.6, 27.5 and 32.4 °C in Oman (Al-Khatri 2011). The results
92 showed that a temperature of 27.5 °C appeared to be the optimal temperature for the biological
93 activities of this species (Al-Khatri 2011). At 35 °C, the biological processes of the pest are
94 disrupted, thus leading to high mortality, particularly in females (Bagheri et al. 2016; Bedford et
95 al. 2015).
96 Investigations into the population and the fluctuation in spatial distribution of the two Dubas bug
97 generations in the Bam region of Iran showed that this pest has an aggregated spatial distribution
PeerJ Preprints | https://doi.org/10.7287/peerj.preprints.2716v1 | CC BY 4.0 Open Access | rec: 13 Jan 2017, publ: 13 Jan 2017

98 pattern (Payandeh et al. 2010). Seasonal activities showed that nymphs were dynamic from April
99 to May in the first generation and August to October in the second generation. In the first and
100 second generations, the adults are active from May to June and from September to November,
101 respectively. Earlier work (Blumberg 2008) reported that temperature exposure below 0 °C
102 adversely affects the ability of adults to survive. The Dubas bug avoids direct sunlight (Klein &
103 Venezian 1985; Shah et al. 2013), and it is spread via the transfer of infested offshoots as well as
104 by wind or wind dust (Hassan 2014; Jasim & Al-Zubaidy 2010).
105 1.3. Biological Control
106 Some research has also been conducted on the natural biological control of the Dubas bug, such
107 as using predators and parasites. Early results showed a variety of natural predators that could be
108 used as biological control agents, among these being Aprostocetus sp., Oligosita sp.and Runcinia
109 sp.(Cammell & Knight 1992) . Furthermore, (Hussain 1963) reported that the eggs of the Dubas
110 bug could be parasitized by a small Chalcidoid, while the nymphs and adults were preyed upon by
111 the larvae of the lace wing (Chrysopa carnea Steph.). Hussain also stated three adult species of
112 Coccinellids that prey on nymphs and adults of the Dubas bug. However, further study is needed
113 to determine the distributions of these natural enemies in Oman and their effectiveness in
114 controlling Dubas bug populations. Some measure of success was also achieved with pathogenic
115 bacteria as microbiological control agents, although their toxicological aspects require further
116 research in order to assess the safety of their implementation at a large scale (Cannon 1998).
117 1.4. Chemical Control
118 Given the significant economic impact of this pest, research into effective management strategies
119 demands high priority. Several insecticides have been evaluated for Dubas bug control in Oman
PeerJ Preprints | https://doi.org/10.7287/peerj.preprints.2716v1 | CC BY 4.0 Open Access | rec: 13 Jan 2017, publ: 13 Jan 2017

120 with SUMI-ALPHA® 5 EC being effective as a ground spray and KARATE® 2 ULV, TREBON®
121 30 ULV and SUMICOMBI® 50 ULV achieving some measure of success as aerial sprays.
122 KARATE-ZEON was also found to be very effective as it gave 100% reduction in numbers of
123 Dubas bug instars and adults, between three and seven days after application. However, the use of
124 this particular pesticide is restricted due to its side effects such as irritation (Al-Yahyai & Khan
125 2015). In Israel, systemic carbamates such as aldicarb and butocarboxim have been successful,
126 while in Iraq dichlorvos (DDVP) injected directly into the infected palms were also successful in
127 suppressing the pest population (Blumberg 2008). Nonetheless, this method of control is expensive
128 with negative environmental impacts on non-target species (particularly natural enemies of Dubas
129 bug) as well as on human health.
130 Research has shown that some pesticide residues persist in the fruit up to 60 days after application
131 (Al-Samarrie & Akela 2011; Khan et al. 2001). In addition, chemical control has achieved limited
132 successes and Dubas bug continues to pose a major challenge to Omani agriculture. More
133 information about the biological and chemical control and their impacts can be found in literature
134 (Shifley et al. 2014; Thacker et al. 2003).
135 1.5. Research Opportunities
136 A number of opportunities exist for research into the biology and ecology of this species in order
137 to gain a thorough understanding of its life cycle and its distribution. The climatic factors that
138 influence its survival and distribution also merit study because such information may be useful in
139 determining current and future potential distributions, particularly in light of climate change.
140 In a review of the effects of climate change on pest populations, an earlier report (Cammell &
141 Knight 1992) suggested that increases in mean global temperatures, as well as changes in rainfall
142 and wind patterns, could have profound impacts on the population dynamics, abundance and
PeerJ Preprints | https://doi.org/10.7287/peerj.preprints.2716v1 | CC BY 4.0 Open Access | rec: 13 Jan 2017, publ: 13 Jan 2017

143 distribution of insect pests of agricultural crops. More recent research has supported this finding
144 (Bale et al. 2002; Cannon 1998; Cook 2008; Shifley et al. 2014; Tobin et al. 2014). A key issue in
145 ecology and conservation is the mapping of pest species distributions as this information can be
146 used to devise more effective management strategies for their control.
147 Mapping of Dubas bug infestations is important for developing predictive models that give the
148 probability of occurrence, spatial distributions and densities under different environmental,
149 meteorological, anthropogenic and resource availability conditions. Maps such as the Dubas bug
150 hazard map can be used to devise an Integrated Palm Management (IPM) plan, thus enhancing
151 capacity and educating farmers on how to apply IPM for the control of this pest.
152 Mapping Dubas bug are also beneficial in terms of better planning of date palm orchard locations,
153 better design and management of farms, what cultivars to plant, distance between palms,
154 irrigations, pesticides, fertilisations, etc. There will also be savings in the cost of monitoring since
155 remote sensing based techniques developed as parts of this study can provide a more efficient and
156 cost-effective means for large scale monitoring of infestations and observation of stress levels on
157 date palm trees.
158 The aim of this review is to highlight technological advances in the fields of remote sensing (i.e.
159 by aircraft or a satellite platform) and Geographical Information System (GIS) that can be used to
160 significantly enhance our ability to detect and characterise physical and biological stresses on
161 several plant species. In particular, advanced remote sensing and GIS techniques need to be
162 developed and implemented for the surveillance and control of Dubas bug adults and nymphs over
163 large spatial scales. In turn, this will greatly assist Plant Protection Service (PPS) projects,
164 Integrated Pest Management Technology (IPMT) programs and farmers in protecting their palm
165 tree orchards by adopting timely preventative actions.
PeerJ Preprints | https://doi.org/10.7287/peerj.preprints.2716v1 | CC BY 4.0 Open Access | rec: 13 Jan 2017, publ: 13 Jan 2017

166 2. Remote Sensing Data
167 2.1 Data Requirements for Crop Management
168 It is important to collect data regarding crops and soil and to identify the changes that occur in the
169 field to achieve precise crop management in the agricultural sector. Data are needed on the
170 conditions that are stable across seasons (e.g. crop type, soil fertility), differing during the seasons
171 (e.g. pest attacks, water quality and quantity, nutrient contents, moisture, temperature), and on
172 factors that contribute to crop yield variability. The acquisition of remote sensing data can be very
173 valuable for assessing many of the agricultural variables described above and for determining the
174 unique phenological cycles of agricultural crops in different geographic regions (Jensen 2000).
175 This type of remote sensing information can be obtained through satellite and aircraft imagery.
176 Typically, date palm trees are 7–10 m tall with crowns 2–4 m in diameter, and the trees are
177 normally spaced 3–5 m apart. The understory of date palm plantations might include banana palms,
178 mango trees, acacia bushes, vegetable crops, grain crops, forage crops. The reflectance
179 characteristics of a date palm area are often driven by the density and health of the understory
180 vegetation (Harris 2003). It can be difficult to use small pixel data to study date palm areas with
181 little or no understory vegetation because the small pixel effects may make it difficult to identify
182 infestations (e.g. where date palms are infested between mountains and dry rivers) given the tree
183 spacing and density of leaves and branches. Studies like (Hussain 1963; Mahmoudi et al. 2015)
184 have revealed that heavy infestations occur mostly along valleys. Additionally, the characteristics
185 of the understory vegetation may dominate the contribution of spectral responses rather than the
186 tree vegetation themselves.
187 However, small pixel data might be useful for investigating some palm tree areas, particularly
188 those with close spacing and high branch densities when using Landsat data for example.
PeerJ Preprints | https://doi.org/10.7287/peerj.preprints.2716v1 | CC BY 4.0 Open Access | rec: 13 Jan 2017, publ: 13 Jan 2017

189 Similarly, spectral indices can be very widespread in remote sensing imagery of vegetation
190 features, and thus the reflection of soil and rocks can become more dominant features than the
191 reflection of sparse vegetation in arid and semi-arid areas. This will increase the difficulty in
192 separating plants signals.
193 Dubas bugs are active on leaflets, rachis, fruiting bunches and spines during different stages of
194 growth of date palm trees. According to the Ministry of Agricultural and Fisheries (MAF), North
195 Oman (26°50ʹ N to 22°26ʹ N, and 55°50ʹ E to 59°50ʹ E) (see Figure 1) experiences different levels
196 of Dubas bug infestation and this has resulted in both direct and indirect damage to date palms and
197 other trees nearby.
198 These infestations are capable of causing up to 50% crop loss during a heavy infestation. Studies
199 of insect pest of date tree palm indicated more than 54 arthropods species insects connected with
200 date plantations. Nevertheless, Dubas bug and red weevil (RPW) Rhynchophorusferrugineus
201 Oliver, and lesser moth, are considered major economically significant pests affecting growth and
202 yield of date palm trees (Al-Zadjali et al. 2006).
PeerJ Preprints | https://doi.org/10.7287/peerj.preprints.2716v1 | CC BY 4.0 Open Access | rec: 13 Jan 2017, publ: 13 Jan 2017

203
204 Figure 1. Region of Oman showing plantations and areas of infestation with Dubas
205 bugs
206 2.2 Optical Remote Sensing Data
207 The vital feature of remote sensing is the detection of radiant energy emitted by various objects.
208 The energy detected might be in the form of acoustic energy (sound) or electromagnetic energy
209 (visible light, infrared heat, ultraviolet and microwaves). Remote sensing technology deployed
210 from the ground, air, or space-based platforms is capable of providing detailed spectral, spatial and
211 temporal information on vegetation health and is particularly useful for crop yield estimation
212 applications. An earlier study (Justice et al. 2002) reported that remote sensing data can be linearly
213 and nonlinearly transformed into information that is more highly correlated with real world
214 phenomena through principle components analysis and various vegetation indices.
PeerJ Preprints | https://doi.org/10.7287/peerj.preprints.2716v1 | CC BY 4.0 Open Access | rec: 13 Jan 2017, publ: 13 Jan 2017

215 However, implementing change-detection analysis by using remote sensing data requires careful
216 consideration of the remote sensor system, environmental characteristics and image processing
217 methods.
218 The temporal, spatial, spectral and radiometric resolution of remotely sensed data can have a
219 significant impact on the success of remote sensing change detection projects (Coppin & Bauer
220 1996; Lu et al. 2004; McFeeters 1996). Numerous remote sensing data are available that can be
221 used for change detection agricultural indices applications, such as data from the Landsat Multi-
222 spectral Scanner (MSS), Landsat Thematic Mapper (TM), Satellite Pour l'Observation de la Terre
223 (SPOT), Advanced Very High Resolution Radiometer (AVHRR), and radar and aerial
224 photography. New sensors are also being deployed like the Moderate Resolution Imaging
225 Spectroradiometer (MODIS) and the Advanced Space Borne Thermal Emission and Reflection
226 Radiometer (ASTER) (Kattenborn et al. 2014).
227 2.2.1. Temporal Resolution of Remote Sensing Data
228 The temporal resolution of remote sensing data is important for commercial monitoring or
229 management projects. The commercial Landsat and SPOT have revisit intervals of 16 and 26 days,
230 respectively. The IKONOS revisit times range from 1 to 3 days. On the other hand, airborne
231 (aircraft-mounted) sensors are more amenable to user defined re-visitation, and they have the
232 added benefit of being able to run under a high cloud base. The capacity of high temporal resolution
233 remote sensing technology has been exploited for monitoring seasonal vegetation variations.
234 Monitoring seasonal changes in vegetation activities and crop phenology over wide areas is
235 essential for several applications, including the estimation of net primary production and deciding
236 time boundary conditions for crop yield modelling. We believe temporal remote sensing data can
PeerJ Preprints | https://doi.org/10.7287/peerj.preprints.2716v1 | CC BY 4.0 Open Access | rec: 13 Jan 2017, publ: 13 Jan 2017

237 be used to study seasonal Dubas bug infestations because there are two generations, namely spring
238 and autumn.
239 Temporal images (e.g. covering a 15-year period) can be used to classify and to determine the
240 directions and speed of spread of Dubas bug infestations. Classification of all areas covered in the
241 images typically represents the first task of a study, and a number of different areas can be selected
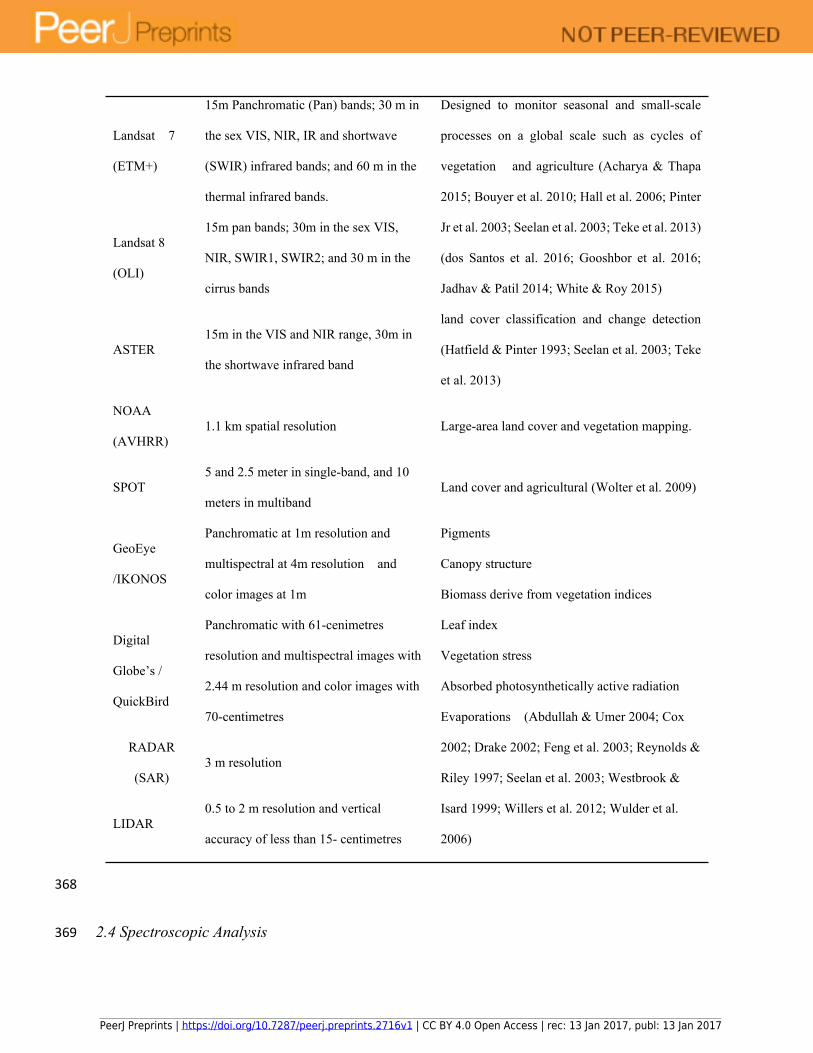
242 to perform more intensive spatio-temporal risk assessment work. This approach can also be applied
243 to historical images to obtain as much information as possible on selected areas. Moreover, change
244 detection tools can be used for analyses by applying standard change detection algorithms. Change
245 detection should be performed to quantify the degree of variation in the infestation levels that is
246 needed to occur before the change can be detected by satellite technology. This is important for
247 the development of a management and surveillance strategy for Dubas bug.
248 Multi-temporal RapidEye green-light data can be used to distinguish between different types of
249 pest attacks on green vegetation (Marx et al. 2010). One study (Eitel et al. 2011) used the red-edge
250 for early detection of infestations by girdling in New Mexico (USA). The limitation of using
251 RapidEye data is that it may result in moderate classification accuracies, especially when the data
252 are used alone (Ortiz et al. 2013).
253 2.2.2. Spatial Resolution of Remote Sensing Data
254 Spatial resolution is measured in terms of the smallest target on the ground. The number of
255 available image-forming pixels in the sensor and its distance from the ground contribute to
256 determining the pixel-size on the ground and the overall image footprint. Notably, there are many
257 types of sensors, including aerial cameras, aircraft scanners and satellite instruments that can
258 collect low and high spatial resolution data on insect pests like Dubas bug. Ground-based
259 spectrometer measurements can also be used to collect electromagnetic information. Depending
PeerJ Preprints | https://doi.org/10.7287/peerj.preprints.2716v1 | CC BY 4.0 Open Access | rec: 13 Jan 2017, publ: 13 Jan 2017
260 on the goals of a study, technology with an appropriate spatial resolution should be chosen. For
261 example, certain Landsat data sets have spatial resolution of 30 m while certain SPOT data sets
262 have spatial resolution of 20 m in each dimension. If it is a large scale study (e.g. large orchard),
263 Landsat imagery at a 30 m resolution may be sufficient.
264 However, if the study is for small orchards surrounding the mountains where several types of
265 plantations are present, high resolution data would be needed. High resolution imagery products
266 are available, such as SPOT’s panchromatic 10 m resolution data sets and Landsat’s multispectral
267 scanner 20 m resolution imagery. Furthermore, very high resolution imagery are available,
268 including QuickBird’s 2.15 m resolution images or the National Agricultural Imagery
269 Programme’s (NAIP’s) 1m resolution orthophotographs.
270 More recently, high resolution satellite imagery from IKONOS, which consists of 4 m resolution
271 multispectral imagery, have become available; but the costs for obtaining such data remain a
272 significant impediment to their widespread use. IKONOS can also provide 1 m resolution data.
273 Aircraft mounted sensors flown up to approximately 3 km above the ground are capable of
274 achieving 1–2 m resolution. These high resolution images as well as those from QuickBird and the
275 new 8-band WorldView can be used to classify and map the spatial distribution and infestation
276 levels of Dubas bug. In addition, the use of high resolution (and ultra- high resolution) airborne
277 remote sensing data in agricultural applications has become more common in the last few years
278 because of the proliferation of multispectral digital airborne sensors (Colomina & Molina 2014;
279 Nebiker et al. 2008). Furthermore, very high resolution data collected with unmanned aerial
280 vehicle (UAV)-based remote sensing technology can be used for detecting and mapping of plant
281 diseases and infestations such as those due to Dubas bug.
PeerJ Preprints | https://doi.org/10.7287/peerj.preprints.2716v1 | CC BY 4.0 Open Access | rec: 13 Jan 2017, publ: 13 Jan 2017

282 More information about UAV technology can be found in reference (Sperlich et al. 2014).
283 Limitations to the use of this technology include some practical constraints such as the weight of
284 the imaging system, flight stability, equipment costs, operational logistics, lack of experienced
285 personnel, and short flight durations due to the reliance on batteries (Zhang & Kovacs 2012).
286 2.2.3 Spectral Resolution of Remote Sensing Data
287 Spectral resolution is typically defined as the number of bands of the electromagnetic spectrum
288 that are sensed by the remote sensing device. A very important aspect of spectral resolution is the
289 width of the bands. Different band-widths have been employed extensively in multispectral
290 imagery applications, and these data often cover an entire colour or colours such as, the red and
291 blue bands of the spectrum. Multispectral systems commonly obtain data for 3–7 bands in a single
292 observation such as in the visible and near-infrared regions of the electromagnetic spectrum.
293 Multispectral imagery, however, lacks the sensitivity to detect subtle changes in tree canopy
294 reflectance that are caused by physiologic stress from insects or pathogens (Lawrence & Labus
295 2003).
296
297 Nevertheless, the suitability depends also on what type of classification method is being used in
298 the project. An earlier study (Dakshinamurti et al. 1971) found that multispectral photography is
299 useful for clearly differentiating between coconut plantations and other crops such as jack fruit,
300 mangoes and bananas in India. Another relevant study (Leckie et al.) used multispectral data for
301 detecting and assessing trees infested with Phellinus weirii which causes Laminated root rot
302 disease . Other work (Stephens et al. 1971) has shown that multispectral photography can be used
303 to clearly distinguish between many types of fruit orchards and crops.
PeerJ Preprints | https://doi.org/10.7287/peerj.preprints.2716v1 | CC BY 4.0 Open Access | rec: 13 Jan 2017, publ: 13 Jan 2017

304 On the other hand, hyperspectral imagery tends to have much narrower band widths, with several
305 to many bands within a single colour of the spectrum. These might include the visible (VIS), near-
306 infrared (NIR), mid-infrared (MIR) and thermal infrared portions. In the visible portion of the
307 electromagnetic spectrum (400 to 700 nm), the reflectance of healthy green vegetation is relatively
308 low because of the strong absorption of light by the pigments in plant leaves. If there is a reduction
309 in pigments (e.g. chlorophyll) due to pests, the reflectance in the affected spectral region will
310 increase. A past study (Vigier et al. 2004) reported that reflectance in the red wavelengths (e.g.
311 675–685 nm) dominated most of detection data for Sclerotinia spp. stem rot infections in soybeans.
312 Over approximately 700 to 1300 nm (the NIR portion), the reflectance of healthy vegetation is
313 very high. Damages caused by Dubas bug infestations in the form of black sooty mould on palm
314 tree leaves and understory vegetation that is promoted by bug excrement causes overall reflectance
315 in the NIR region to be lower than expected.
316 Hyperspectral imaging is of considerable interest for applications in precision agriculture.
317 Hyperspectral remote sensing is useful for extracting vegetation parameters such as the Leaf Area
318 Index (LAI), chlorophyll content and leaf nutrient concentrations. One study (Demetriades-Shah
319 et al. 1990) reported that the red edge in hyperspectral remote sensing technology represent the
320 transition from low reflectance in the visible region of spectrum to high NIR reflectance that
321 especially sensitive to chlorosis and crop stress. In general, the spectral responses reflect the
322 conditions of plant leaves and crops to stress (Carter & Knapp 2001; Mazza et al. 2000; Zwiggelaar
323 1998). Hyperspectral data were used to map high-risk areas for insect infestations in Malaysia
324 (Shafri & Hamdan 2009). The new hyperspectral remote sensing technology could be used to
325 develop early (pre-visual) detection methods for Dubas bug infestations.
PeerJ Preprints | https://doi.org/10.7287/peerj.preprints.2716v1 | CC BY 4.0 Open Access | rec: 13 Jan 2017, publ: 13 Jan 2017
326 Recently, some optical satellite products that include red-edge band data have been produced.
327 These could allow for the identification of changes in the health of green vegetation during early
328 stages of change (Apan et al. 2005; Eitel et al. 2011; Pinter Jr et al. 2003; Prabhakar et al. 2011) .
329 Optical remote sensing can be used to estimate vegetation biomass though the use of common
330 vegetation indices such as Ratio Vegetation Index (RVI) and Soil Adjusted Vegetation (SAVI).
331 Aerial photography and videography have been found to be valuable for assessing trees
332 management in many applications in agriculture worldwide (Lamb & Brown 2001; Lema et al.
333 1988). In particular, colour-infrared (CIR) aerial photographs are tremendously useful for many
334 applications, including stress detection in vegetation. Healthy vegetation is highly reflective in the
335 NIR band of the electromagnetic spectrum, and this causes healthy vegetation to appear magenta
336 on a CIR photo. Vegetation that is stressed because of drought, pest infestations or contamination,
337 exhibits lower NIR reflectance, and this is readily visible in a CIR photograph. More information
338 and examples of the use of CIR to detect insect infestations in agricultural crops and forests can
339 be found in (Singh et al. 2009; Singh et al. 2010).
340 Colour-infrared technology with supporting hyperspectral reflectance data could be used to
341 identify specific trees and fronds of date palm trees that have been infested with Dubas bug. These
342 methods can be used to monitor changes in infestation levels according to honeydew, which is
343 converted to sooty mould on the fronds during high levels of infestation. Honeydew secretion is a
344 good indicator of Dubas bug feeding activity (Al-Abbasi 1988). The indirect assessments of the
345 insect populations can be carried out by measuring the amounts of honeydew caused by the insects
346 (Southwood 1978). Additionally, Airborne Visible/Infrared Imaging Spectrometer (AVIRIS) can
347 be used to determine the extent and severity of Dubas bug infestation damage in different areas.
348 2.3 Radar Data
PeerJ Preprints | https://doi.org/10.7287/peerj.preprints.2716v1 | CC BY 4.0 Open Access | rec: 13 Jan 2017, publ: 13 Jan 2017

349 For many years, airborne technology has been employed in agricultural operations. Nevertheless,
350 space-borne synthetic aperture radar (SAR) technology such as those of the Advanced Land
351 Observing satellite; TerraSAR-X and Phased Array L-band have become available since the 2000s.
352 Multiple radar sensors can work autonomously to detect solar radiation variation, but dissimilar
353 optical sensors from which spectral reflectance measurements are taken affected differently by
354 variation in the solar emission. Radar technology has found limited applications in regional studies
355 because of its high costs, the narrow swath widths and limited extent of coverage. However, active
356 radar systems have been widely used to monitor the dispersal and migratory flight behaviour of
357 economically important insects such as honeybees, noctuid moths and grasshoppers (Loper 1992;
358 Reynolds et al. 2009; Riley 1989).
359 The data can be extracted routinely by using the existing network of weather radars, and it can be
360 used to alert growers that local crops are at heightened risk (Westbrook & Isard 1999). Such
361 information can then be used for fine tuning pest management practices such as pesticide
362 applications, and could potentially reduce pesticide use by nearly 50% and lessen the overall
363 impact of toxic chemicals on the environment (Dupont et al. 2000), as well as on the natural
364 enemies of these insect pests. Table 2 shows example applications of different remote sensing
365 technologies used to detect change in vegetation.
366 Table 2. Example applications of the use of remote sensing technologies to detect change
367 in vegetation
Satellite and
aircraft sensor
Spatial resolution Biophysical variables for vegetation
PeerJ Preprints | https://doi.org/10.7287/peerj.preprints.2716v1 | CC BY 4.0 Open Access | rec: 13 Jan 2017, publ: 13 Jan 2017
Landsat 7
(ETM+)
15m Panchromatic (Pan) bands; 30 m in
the sex VIS, NIR, IR and shortwave
(SWIR) infrared bands; and 60 m in the
thermal infrared bands.
Landsat 8
(OLI)
15m pan bands; 30m in the sex VIS,
NIR, SWIR1, SWIR2; and 30 m in the
cirrus bands
Designed to monitor seasonal and small-scale
processes on a global scale such as cycles of
vegetation and agriculture (Acharya & Thapa
2015; Bouyer et al. 2010; Hall et al. 2006; Pinter
Jr et al. 2003; Seelan et al. 2003; Teke et al. 2013)
(dos Santos et al. 2016; Gooshbor et al. 2016;
Jadhav & Patil 2014; White & Roy 2015)
ASTER
15m in the VIS and NIR range, 30m in
the shortwave infrared band
land cover classification and change detection
(Hatfield & Pinter 1993; Seelan et al. 2003; Teke
et al. 2013)
NOAA
(AVHRR)
1.1 km spatial resolution Large-area land cover and vegetation mapping.
SPOT
5 and 2.5 meter in single-band, and 10
meters in multiband
Land cover and agricultural (Wolter et al. 2009)
GeoEye
/IKONOS
Panchromatic at 1m resolution and
multispectral at 4m resolution and
color images at 1m
Digital
Globe’s /
QuickBird
Panchromatic with 61-cenimetres
resolution and multispectral images with
2.44 m resolution and color images with
70-centimetres
RADAR
(SAR)
3 m resolution
LIDAR
0.5 to 2 m resolution and vertical
accuracy of less than 15- centimetres
Pigments
Canopy structure
Biomass derive from vegetation indices
Leaf index
Vegetation stress
Absorbed photosynthetically active radiation
Evaporations (Abdullah & Umer 2004; Cox
2002; Drake 2002; Feng et al. 2003; Reynolds &
Riley 1997; Seelan et al. 2003; Westbrook &
Isard 1999; Willers et al. 2012; Wulder et al.
2006)
368
369 2.4 Spectroscopic Analysis
PeerJ Preprints | https://doi.org/10.7287/peerj.preprints.2716v1 | CC BY 4.0 Open Access | rec: 13 Jan 2017, publ: 13 Jan 2017

370 Fluorescence spectroscopy (FS) is a type of spectroscopic method by which fluorescence is
371 measured of an object of interest following excitation by rays of light. Fluorescence has been used
372 for vegetation research to monitor stress levels and physiological states in plants. There are two
373 types of fluorescence. The first is blue-green fluorescence in the ~400–600 nm range and the
374 second type is chlorophyll fluorescence in the ~650–800 nm range. Fluorescence spectroscopy can
375 be used to monitor nutrient deficiencies, environmental conditions based on stress levels,
376 infestations and plant diseases. In fact, it can be used to monitor fruit quality, photosynthetic
377 activity, tissue stress and infestations in many types of crops (Karoui & Blecker 2011; Tremblay
378 et al. 2012).
379 Remote Sensing is a powerful technique for visualising, diagnosing and quantifying plant
380 responses to stress like temperature, drought, salinity, flooding and mineral toxicity. Approaches
381 can range from the use of simple combinations of thermal and reflectance sensor data to visible
382 reflectance and fluorescence data. In particular, combined fluorescence reflectance and thermal
383 imaging sensor data can be used for quick investigations of vegetation stress (Lenk et al. 2007).
384 2.5 Solar Radiation and the Humid-Thermal Index (HTI)
385 Biological systems are highly dependent on two most important climatic factors, namely
386 temperature and precipitation. Temperature is influenced by solar radiation and thermal emissions,
387 while precipitation controls the dry or wet conditions (humidity) associated with plant growth.
388 These factors are especially important in regions where extreme temperatures and humidity
389 conditions are prevalent and large fluctuations exist throughout the seasons as such conditions can
390 predispose plants to insect pests and diseases. In this regard, solar radiation models can be used to
391 investigate insect infestations. Solar radiation models can be applied to calculate the potential solar
392 radiation at a chosen location over a 12-month period. An earlier study (Kirkpatrick & Nunez
PeerJ Preprints | https://doi.org/10.7287/peerj.preprints.2716v1 | CC BY 4.0 Open Access | rec: 13 Jan 2017, publ: 13 Jan 2017

393 1980) discovered positive results after investigating the relationships between solar radiation and
394 the distribution of several species of eucalyptus along a single transect in the Risdon Hills in
395 Tasmania. The advantage of modelling solar radiation is that it can be calculated at any slope and
396 for any latitude.
397 Solar radiation models have been widely used for applications in ecology, biology, forestry and
398 agriculture where the spatial variation of solar radiation is more significant than averaged regional
399 values. Solar radiation models that collect data over long periods of time for huge areas can be
400 useful for acquiring diverse information on features such as plant biomass, species locations,
401 biodiversity and possible vegetation, wildlife locations, and for mapping topographic variants
402 using direct shortwave radiation. One limitation of these models is that data are affected by the
403 precision of the digital elevation model (DEM) that was used. Errors in the DEM will incur errors
404 in the calculated values of slope and that can affect the accuracy of shading by adjacent terrain.
405 However, the accuracy of solar radiation models may be affected more by atmospheric conditions
406 than by terrain features.
407 Solar radiation can be used to calculate the potential solar inputs at infested and non-infested palm
408 tree locations seasonally (i.e. for the spring and autumn Dubas bug generations) for a 12-month
409 period. The results from solar radiation studies can then be used to find correlations with different
410 infestation levels to examine if solar radiation plays a determinant role in different infestation
411 levels (see Figure 3). Solar radiation can also be used to study the presence/absence and density of
412 animals, plants diseases and infestations such as those caused by Dubas bug. More information on
413 the theory and technical aspects of solar radiation models can be found in (Bonan 1989; Dubayah
414 & Rich 1995; Flint & Childs 1987; Geiger et al. 2002; Hetrick et al. 1993; Kumar et al. 1997; Swift
415 1976).
PeerJ Preprints | https://doi.org/10.7287/peerj.preprints.2716v1 | CC BY 4.0 Open Access | rec: 13 Jan 2017, publ: 13 Jan 2017

416
417 Figure 2. A diagram showing the design and use of solar radiation models to analyse the
418 relationship between Dubas bug infestation levels and positional solar radiation
419 The Humid-Thermal Index (HTI), which sometimes called the Humid-Thermal Ratio (HTR), has
420 successfully been used to develop and test relationships between different plant infestations levels
421 in varied climate conditions in areas such as Australia, India, Europe, and North America. An HTR
422 prototype has been developed to simulate ecological conditions appropriate for the establishments
423 and spread of plant diseases in India (Jhorar et al. 1997). The HTR method has also been used to
424 evaluate the risk of the establishment and spread of Karnal in wheat, grown under a variety of
425 climatic conditions and in different areas (Mavi et al. 1992; Stansbury & Pretorius 2001; Workneh
426 et al. 2008). This method has potential value in researching insect pests and their associated
427 diseases, which may allow for the predictions of occurrence and non-occurrence under specific
428 combinations of climate and weather conditions.
429 Such predictions would be useful to help prioritise human effort when conditions are expected to
430 be unfavourable. Predictions could also be used for preparation in advanced to meet the challenges
PeerJ Preprints | https://doi.org/10.7287/peerj.preprints.2716v1 | CC BY 4.0 Open Access | rec: 13 Jan 2017, publ: 13 Jan 2017

431 posed by threats of heavy crop losses. The HTR data can be extracted from remote sensing pre-
432 visual reductions in chlorophyll, which are useful for early stress detection at the palm tree-level
433 or in different aged stands.
434 3. Vegetation
435 3.1 Image processing for vegetation
436 In order to detect changes, important information must be provided including spatial distributions
437 of change, change rates, change trajectories for different vegetation types, and assessment of the
438 accuracy of the change detection results. The three main steps in implementing change detection
439 are (1) image pre-processing, e.g geometrical rectification (GR), image registration (IR), minimum
440 noise fraction (MNF) analysis, radiometric, automorphic and topographic correction (the latter is
441 needed if the study area is close to mountains) (Bishop & Colby 2002; Civco 1989; Muller et al.
442 1988; Teillet et al. 1982); (2) selection of optimal techniques to conduct the change detection
443 analysis; and (3) accuracy assessments (Datt et al. 2003; Lu et al. 2004; Lunetta et al. 2006; Lyon
444 et al. 1998; Song et al. 2001) (see Fig.3).
445 Although the selection of appropriate change detection techniques is important for the accuracy of
446 change results; in practice, it might not be easy to select a suitable algorithm for a specific change
447 detection application. Some simple techniques can be used to provide change and non-change
448 information (e.g. image differencing). Other techniques may be used to provide a complex matrix
449 of change direction data such as that used for post-classification comparisons (Lu et al. 2004). This
450 review provides examples of change detection methods that can be used to address Dubas bug
451 infestations and their impacts on date palm trees.
452 3.2 Techniques and Methods
PeerJ Preprints | https://doi.org/10.7287/peerj.preprints.2716v1 | CC BY 4.0 Open Access | rec: 13 Jan 2017, publ: 13 Jan 2017

453 3.2.1 Vegetation Indices
454 Vegetation indexes (VIs) are used to compile data into a single number that quantifies vegetation
455 biomass and/or plant vigour for each pixel in a remote sensing image. An index is computed by
456 using several spectral bands that are sensitive to plant biomass and vigour. Such indices can be
457 used to (1) specify the amount of vegetation (e.g. biomass, SAVI, the percentage of vegetation
458 cover); (2) discriminate between soil and vegetation; and (3) reduce atmospheric and topographic
459 effects. However, variability in VI data can arise from atmospheric effects, viewing and
460 illumination angles, sensor calibrations, errors in geometric registration, subpixel water and
461 clouds, snow cover, background materials, image compositing and landscape topography (e.g.
462 slope and relief). For example, in sparsely vegetated areas, the reflectance of soil and sand are
463 much higher than the reflection of vegetation; so the detection of reflection from the vegetation
464 cover is difficult.
465 3.2.1.1 Difference Vegetation Index
466 The Difference Vegetation Index (DVI) is the simplest vegetation index (DVI = NIR – Red). DVI
467 is sensitive to the amount of vegetation, and it can be used to distinguish between soil and
468 vegetation. However, it does consider the difference between reflectance and radiance caused by
469 the atmosphere and shadows (Jiang et al. 2006). Previous research (Glenn et al. 2008) that used
470 the utility of image differencing, image rationing, and the vegetation index for detecting gypsy
471 moth defoliation found that a difference of the MSS7/MSS5 ratio was more useful for delineating
472 defoliated areas than any single band-pair difference.
473 3.2.1.2 Ratio-Based Vegetation Indices
PeerJ Preprints | https://doi.org/10.7287/peerj.preprints.2716v1 | CC BY 4.0 Open Access | rec: 13 Jan 2017, publ: 13 Jan 2017

474 Ratio-based Vegetation Indices are also called the simple ratio (SR) or RVI (SR = NIR/Red). The
475 SR provides valuable information about vegetation biomass or Leaf Area Index (LAI) variations
476 in high-biomass vegetation areas such as forests. It is also useful in low-biomass situations, such
477 as those containing soil, water, ice, etc., where the SR indicates the amount of vegetation present.
478 The SR is capable of reducing the effects of the atmosphere and topography on the analysis results.
479 3.2.1.3. Normalised Difference Vegetation Index
480 Normalised Difference Vegetation Index (NDVI) are generally well-documented, quality-
481 controlled data sources that have been re-processed for many applications and problems.
482 Limitations and causes of error in the NDVI data are related to satellites and include such issues
483 as the sensor resolution, standardisation techniques, digital quantisation errors, ground and
484 atmospheric conditions, and orbital and sensor variations (Gutman 1999; James & Kalluri 1994).
485 It is possible to use the NDVI values to discriminate between dense forests, non-forested areas,
486 agricultural fields and savannahs; however, distinguishing between forests with different dominant
487 species is not possible by using this type of remote sensing data because several assemblages of
488 plant species can produce similar NDVI values or similar NDVI temporal trends. Atmospheric
489 conditions are another aspect that must be considered when using the NDVI.
490 One study (Nageswara Rao et al. 2004) reported that bananas and coconuts have close greenness
491 profiles in mid-April, but have rather distinct greenness profiles in mid-March. Another study
492 (Chavez & MacKinnon 1994) reported that red band image differencing provided better change
493 detection results for vegetation than red data when using the NDVI in arid and semi-arid
494 environments of south-western United States. The NDVI may not be appropriate to use in dry
495 areas, and caution is warranted for such applications. Date palms trees are often planted in a regular
PeerJ Preprints | https://doi.org/10.7287/peerj.preprints.2716v1 | CC BY 4.0 Open Access | rec: 13 Jan 2017, publ: 13 Jan 2017

496 grid pattern, as are olive trees and such trees may be able to be easily distinguished with NDVI
497 data.
498 3.2.1.4. Normalisation Difference Moisture Index
499 The Normalisation Difference Moisture Index (NDMI) data can be used to determine the threshold
500 presence of pest infestations (green attack). Such data can also be potentially used for deriving
501 regional estimates of the year of stand death, for example, by using Landsat data and decision tree
502 analysis. However, there are limitations associated with using the NDMI, which include
503 difficulties in detecting low rates of infestation and the need to add images from other dates (to
504 achieve a higher temporal frequency) to quantify the spectral response to insects such as the Dubas
505 bug.
506 The application of a VI such as the NDVI and SAVI to multispectral satellite imagery (blue, red
507 and NIR) has been shown to be useful to quantify variations in plant vigour, make relative biomass
508 predictions, assess yields and investigate the occurrences of pests and disease attacks outbreaks
509 (Plant 2001). Landsat TM data can be used to assess both plant age and LAI values by applying a
510 number of indices such as the Shadow Index (SI), Bare soil Index (BI), NDVI, and Advanced
511 Vegetation Index (AVI).
512 3.2.2. Transformation
513 Feature space transformation, which relates to band space, involves processing data that are n-
514 dimensions. It may be difficult to visualise these data because the feature space (where n is roughly
515 the number of bands). However, several mathematical techniques are readily available to analyse
516 the feature space; they include Principal Components Analysis (PCA), Kauth’s Tasseled Cap
517 (KTC), Perpendicular Vegetation Index (PVI), Leaf Water content Index (LWCI), SAVI, NDMI,
PeerJ Preprints | https://doi.org/10.7287/peerj.preprints.2716v1 | CC BY 4.0 Open Access | rec: 13 Jan 2017, publ: 13 Jan 2017

518 Atmospherically Resistant Vegetation Index (ARVI), Aerosol Free Vegetation Index (AFRI),
519 Global Environmental Monitoring Index (GEMI), and Red-Edge Position (REP) Determination.
520 These techniques and many more can be used to find areas that contain plentiful spectral
521 information. Feature space transformation is useful to visualise pixel data and analyse information.
522 It involves transforming the feature space mathematically in order to isolate groups of pixels that
523 may be related (e.g. certain types of vegetation).
524 The PCA and the KTC transformations can be used for land cover change detection via NIR
525 reflectance or greenness data that can detect crop type changes between vegetation and non-
526 vegetation features (Gorczyca et al. 1993; Lu et al. 2004). An earlier study (Rondeaux et al. 1996)
527 found that SAVI, where the value X was tuned to 0.16, easily out-performed all other indices when
528 applied to agricultural surfaces. Others (Kaufman & Tanre 1992; Leprieur et al. 1996) have
529 concluded that the GEMI and ARVI are less sensitive to atmosphere, but may be incapable of
530 dealing with variation in soil reflectance. More information about feature space transformation can
531 be found in (Crippen 1990; Richardson & Wiegand 1977). According to (Darvishzadeh et al.
532 2008), REP is the most studied feature on vegetation spectral curve because it is strongly correlated
533 with foliar chlorophyll content and can be a sensitive indicator of stress in vegetation.
534 3.2.3. Classification
535 The objective of image classification is to categorise all pixels in the imagery into one of several
536 land cover classes or themes. The categorised data can then be used to produce thematic maps of
537 land cover (e.g. vegetation type) based on remotely sensed data. Most image processing techniques
538 offers several methods to test hypotheses. The best-known methods include supervised and
539 unsupervised classification; however, these techniques require ground reference data.
PeerJ Preprints | https://doi.org/10.7287/peerj.preprints.2716v1 | CC BY 4.0 Open Access | rec: 13 Jan 2017, publ: 13 Jan 2017

540 Maximum Likelihood Classification, for example, requires samples of pixels obtained by field
541 observations or aerial photography interpretations that are deemed to be representative of specific
542 land cover types. The Maximum Likelihood method relies on the assumption that the populations
543 from which these training samples are drawn, are multivariate–normal in their distributions. The
544 traditional methods employ classical image classification algorithms (e.g. k-means and
545 ISODATA) for unsupervised classification, and maximum likelihood classification for supervised
546 classification.
547 3.2.3.1. Maximum likelihood classification algorithm
548 The maximum likelihood classification algorithm (or parametric information extraction) is the
549 most widely adopted parametric classification algorithm. However, it requires normally distributed
550 training data, especially for n (rarely the case) to compute the class variance and covariance
551 matrices. Another limitation is that it is difficult to integrate non-image categorical data into a
552 maximum likelihood classification. However, fuzzy maximum likelihood classification algorithms
553 are also available (Zhang & Foody 2001).
554 3.2.3.2. Classification techniques
555 Supervised classification. The supervised classification methods can be used to select
556 representative samples for each land cover class in a digital image. Sample land classes are more
557 commonly called training sites. The image classification software uses the training sites to identify
558 the land cover classes in the entire image. The classification of land cover is based on spectral
559 signatures defined in the training set. The digital image classification software determines the class
560 based on what it resembles most in the training set. The limitation on the use of supervised
561 classification is that analysis are required to identify areas on an image of known informational
PeerJ Preprints | https://doi.org/10.7287/peerj.preprints.2716v1 | CC BY 4.0 Open Access | rec: 13 Jan 2017, publ: 13 Jan 2017

562 types and to create a training area (group of pixels) from which the computer generates a statistics
563 file (Mountrakis et al. 2011).
564 Unsupervised classification. The advantage of the use of unsupervised classification is that all
565 spectral variation in the image are captured and used to group the imagery data into clusters. The
566 major disadvantage is that is difficult to completely label all the clusters to produce the thematic
567 map.
568 Combined and advanced methods. Many examples exist whereby the supervised and unsupervised
569 techniques were combined together in analyses. The associated advantages and disadvantages can
570 be found in (Castellana et al. 2007; Pao & Sobajic 1992). However, the combined approach only
571 slightly improves the ability to create thematic maps when compared to using each technique
572 separately. Moreover, a large amount of effort has been devoted to developing advanced
573 classification approaches to improve our ability to create thematic maps from digital remotely
574 sensed imagery. One of the most recent advances has been the adoption of artificial neural
575 networks (ANNs) in the place of maximum likelihood classification (standard in most remote
576 sensing software). This review only covers a few of the non-parametric techniques.
577 The difference between parametric and non-parametric techniques is that a parametric signature is
578 based on statistical parameters (e.g., the mean) of the pixels that are in the training area
579 (assumption of normal distribution), while the non-parametric signature is not based on statistics.
580 Artificial neural network (ANNs). Fortunately, the ANN methods (non-parametric information
581 extraction) do not require normally distributed training data, and may be used to integrate with
582 virtually any type of spatially distributed data in classification. The disadvantage of using ANN is
583 that occasionally it is difficult to determine exactly how the ANN came up with a certain
584 assumption because such information is locked within weights in a hidden layer or layers. The
PeerJ Preprints | https://doi.org/10.7287/peerj.preprints.2716v1 | CC BY 4.0 Open Access | rec: 13 Jan 2017, publ: 13 Jan 2017
585 method has been used successfully for classifying infestations, diseases/conditions of plants and
586 the associated damage based on spectral data (Cox 2002; Liu et al. 2010; Pydipati et al. 2005). In
587 recent years, spectral mixture analysis, ANNs, GISs and remote sensing data have become
588 important tools for change detection applications.
589 Artificial intelligence (AI). Use of nonmetric information extraction or AI methods allows the
590 computer to analyse data perhaps better than people. The benefits of using AI for image analysis
591 involve the use of expert systems that place all the information contained within an image in its
592 proper context with ancillary data and then to extract valuable information (Duda et al. 2001).
593 Classification and regression tree (CART). Classification and regression tree is a non-parametric
594 algorithm that uses a set of training data to develop a hierarchical decision tree. The decision tree
595 is created by using a binary partitioning algorithm that selects the best variable by which to split
596 the data into separate categories at each level of the hierarchy. Once the final tree is generated, it
597 can be used to label all unknown pixels in the image. This method has been widely used in the last
598 few years both for pixel-based and object-based image classification. This method is also
599 extremely robust and provides significantly better map accuracies than those that have been
600 achieved by using more basic approaches (Lawrence & Wright 2001).
601 Support vector machines (SVMs). Support vector machines are derived from the field of statistical
602 learning theory and have been used in the machine vision field for the last 10 years. These methods
603 have been developed for use in creating thematic maps from remotely sensed imagery. The SVM
604 performs by projecting the training data using a kernel function and this results in a data set that
605 can then be linearly separated. The capability to separate out the various informational classes in
606 the imagery is a powerful advantage. The use of SVM is relatively new, but it offers great potential
607 for creating thematic maps from digital imagery.
PeerJ Preprints | https://doi.org/10.7287/peerj.preprints.2716v1 | CC BY 4.0 Open Access | rec: 13 Jan 2017, publ: 13 Jan 2017

608 Several advanced techniques for classifying digital remotely sensed data involve the extensive
609 development and adoption of object-based image analysis. Moreover, advanced image
610 classification techniques such as k-means, ISODATA, fuzzy ARTMP, fuzzy multivariate cluster
611 analysis, the WARD minimum variance technique, SOM, the artificial neural classification
612 algorithm (i.e. for the propagation of neural networks and self-organising maps) and Bayesian
613 analysis can be used (1) for the classification of remotely sensed data; and (2) to delineate
614 horticultural crops in satellite maps. The major advantage of these techniques is their ability to
615 generate a matrix of change information and to reduce external impacts from the atmospheric and
616 environmental differences among the multi-temporal images. However, it may be difficult to select
617 high quality and sufficiently numerous training sets for image classification, in particular for
618 important historical image data classifications due to the lack of data. Notably, it is a time
619 consuming and difficult task to produce highly accurate classifications when high quality training
620 sample data are not available. More information about improving classification results and reviews
621 of these advanced methods can be found in the literature (Lu et al. 2003; Lu & Weng 2007; Lunetta
622 et al. 2006; Monteiro et al. 2003; Rogan et al. 2002).
623 All these classifications are performed on a pixel-by-pixel basis. Therefore, given that a pixel maps
624 an arbitrary delineation of an area on the ground, any selected pixel may or may not be
625 reprehensive of the vegetation/land cover of that area. In object-based image analysis (OBIA),
626 unlabelled pixels are grouped into meaningful polygons that are then classified as polygon pixels.
627 The OBIA technique can be used to increases the number of attributes such as polygon shapes,
628 textures, perimeter to area ratios, and many others that can be used to classify accurately groups
629 of pixels. More information about this method, also called segmentation, can be found in (Blaschke
630 2010; Dey et al. 2010; Haralick & Shapiro 1985; Stafford 2000) .
PeerJ Preprints | https://doi.org/10.7287/peerj.preprints.2716v1 | CC BY 4.0 Open Access | rec: 13 Jan 2017, publ: 13 Jan 2017

631 Classified satellite imagery can also be used to extract palm crown data. The centre of crowns can
632 be isolated because they often remain green and are not as severely impacted by the Dubas bug as
633 the palm fronds. Densities of the Dubas bug tend to be highest outside of the crown region. The
634 removal of the centre and concentration on the outer parts of the vegetation can then lead to a
635 higher probability of detecting the impacts of Dubas bug and categorising the infestation levels
636 accurately. The images can also be used by classification techniques (e.g. unsupervised) to detect
637 stages for which users do not have ground truth data.
638 3.2.4 Image Segmentation Techniques
639 Image segmentation techniques can be used to extract information on palm canopies. The crown
640 information can be used to calculate the density of palms per unit. This information can then be
641 applied as part of a GIS-based spatial analysis to answer questions about whether infestation levels
642 are linked to the density of palms or not. The crown information could also be used to determine
643 the random or systematic nature of farms.
644 This information can be further used in GIS-based analyses to answer questions about whether or
645 not randomly situated plants have a higher risk of infestation than non-randomly situated plants.
646 Such information would be useful for determining the optimal row spacing. Research published in
647 the literature suggests that those plantations that have wide row spacing have a lesser likelihood
648 of Dubas bug infestations (Ali & Hama 2016). The row spacing data extracted from satellite
649 imagery could thus be used to confirm the relationship between row spacing and infestation levels.
650 3.2.5. Image Fusion
651 Image fusion is a technology that merges two or more images of the same area collected by
652 different sensors or at different wavelengths. For example, merging a 2.5 m multispectral image
PeerJ Preprints | https://doi.org/10.7287/peerj.preprints.2716v1 | CC BY 4.0 Open Access | rec: 13 Jan 2017, publ: 13 Jan 2017

653 with a 0.7 m panchromatic image can be done to capitalise on the advantages of both image sets.
654 The panchromatic images have very good spatial resolution but lack the multiband information
655 that the 2.3 m multispectral image provides. Thus, the advantage of using image fusion for change
656 detection is that fusion can allow for both high spatial and spectral resolutions, which will enable
657 users to extract high quality land cover/vegetation information. Image fusion techniques such as
658 the HSV (hue, saturation, value), Brovey, Gram-Schmidt and Principle Components methods can
659 be used to compare the accuracy and distortion levels of images (e.g., 8-band Worldview images).
660 4. Accuracy Assessment
661 Accuracy assessment is an important part of any classification algorithm process, and it should be
662 undertaken for every project because it is difficult to know how accurate a classification is without
663 an accuracy assessment. The accuracy of a classification is usually assessed by comparing the
664 classification with some reference data that is believed to accurately reflect the true land-cover.
665 Reference data may include ground truth data, higher resolution satellite images and maps derived
666 from aerial photographic interpretations. However, in the case for all reference data, even ground
667 truth data, these data sets may also contain some inaccuracies. More information about accuracy
668 assessments can be found in (Congalton 2001; Foody 2002; Gibbs et al. 2010; Hirano et al. 2003;
669 Huang et al. 2007; Hughes et al. 2006; Stehman & Czaplewski 1998).
670 An essential aspect of any digital remote sensing project is accuracy assessment. (Congalton &
671 Green 2008) reported that historically, thematic maps generated from information analogous to
672 remotely sensed data through the use of photographic interpretations were not assessed for
673 accuracy. However, the accuracy of thematic maps became a standard part of mapping projects
674 with the advent of digital remote sensing technologies and quantitative assessment tools. There are
675 two methods for assessing the accuracy of a map derived from remotely sensed imagery. They
PeerJ Preprints | https://doi.org/10.7287/peerj.preprints.2716v1 | CC BY 4.0 Open Access | rec: 13 Jan 2017, publ: 13 Jan 2017
676 assess the positional and thematic accuracy. The accuracy of a map is actually a combination of
677 these two accuracy features, and neither can be ignored in a valid assessment process. An error
678 can appear if the map location is wrong (i.e. missing polygons or distorted lines) or if the map
679 labels are wrong.
680 Positional accuracy methods can be used to provide an assessment of the differences in distance
681 among a sample of locations on the map and those same locations on a reference data set. This
682 same basic process can be used in assessing the thematic accuracy of a map, and it involves a
683 number of initial considerations such as taking into account the sources of errors and the proper
684 selection of classification systems. Determination of the thematic accuracy is more complicated
685 than that of the positional accuracy.
686 This is due to the size requirements for sampling thematic accuracy assessments, which are larger
687 than those for positional accuracy assessments. An error matrix technique can be used to compute
688 the thematic accuracy, and the error matrix can be generated by using reference data and correct
689 or incorrect designations; one can also use qualifiers such as good, acceptable and poor to produce
690 a fuzzy error matrix. Additionally, there are a number of analysis techniques that can be performed
691 using the error matrix, such as the Kappa analysis. The Kappa analysis can be used to test
692 statistically whether or not one error matrix is significantly different than another (Goodchild
693 1994).
694
PeerJ Preprints | https://doi.org/10.7287/peerj.preprints.2716v1 | CC BY 4.0 Open Access | rec: 13 Jan 2017, publ: 13 Jan 2017

695
696 Figure 3. Flowchart of an image processing methodology, which include three main steps for
697 implementing change detection research, namely (1) image pre–processing work; geometrical
698 replication (GR), image registration (IR), minimum nose fraction (MNF) analysis, radiometric
699 correction (RC), atmospheric correction (AC) and topographic correction (TC); (2) selection
700 of optimal techniques to conduct the change detection; and (3) accuracy assessments to obtain
701 final maps.
702 5. Modelling the spatial relationships between insect infestations and the environmental
703 and climate factors
704 While remote sensing techniques focus on visual and pre-visual detection and mapping, GIS
705 techniques can be used to evaluate correlations, identify important variables, and develop
706 predictive models. Geographical Information system functions and tools have made it possible to
707 implement state-of-the-art spatial autoregressive techniques to investigate many research
708 problems. Advances in GIS software, such as ArcInfo®, have greatly reduced the time for
PeerJ Preprints | https://doi.org/10.7287/peerj.preprints.2716v1 | CC BY 4.0 Open Access | rec: 13 Jan 2017, publ: 13 Jan 2017
709 estimating spatial parameters. For example, regression analysis allows users to examine, model
710 and explore spatial relationships in order to better understand the factors behind the observed
711 spatial patterns. It also allows users to predict hypotheses based on understanding of these factors.
712 There are three main types of regressions, namely, linear regression, local regression, and logistic
713 regression. Linear regression can be used to predict the values of y from values of xi as follows:
714 (1)1 1 2 2 ... n ny a b x b x b x
715 where y is the dependent variable, xi represents the independent variables i, and bi, …, bn are the
716 regression coefficients. However, this requires several assumptions about the error, or residuals,
717 between the predicted values and the actual values (Miles & Shevlin 2001). Some errors are related
718 to a normal distribution for a set of independent variables, while others are related to the expected
719 mean value of zero. Linear regression has been used to model wildlife home ranges (Anderson et
720 al. 2005) and soil moisture (Lookingbill & Urban 2004). According to (Harris et al.), Local
721 Regression or Geographically Weighted Regression (GWR) analysis can be used to predict
722 information for every known point in order to derive a local model. Moreover, parameters for this
723 method can include variations in space, thereby providing a basis for exploring non-stationary
724 spatial relationships. The logistic regression method can be applied to model spatial relationships
725 between features, such as when the dependent variable is categorical (e.g., presence or absence
726 data) and when the independent variables are categorical, numeric or both (Menard 2002). The
727 advantage of using the logistic regression is that it does not require the same set of rigid
728 assumptions as required by linear regression.
729 Various studies have involved the use of autoregressive models to investigate the relationships
730 between insect infestations and factors that are based on environmental information. (Munar-Vivas
731 et al.) combined environmental information, spatial data and attribute data in GIS-based maps to
PeerJ Preprints | https://doi.org/10.7287/peerj.preprints.2716v1 | CC BY 4.0 Open Access | rec: 13 Jan 2017, publ: 13 Jan 2017

732 assess the impact of Moko disease on banana yields in Colombia. Specifically, they used a
733 regression model to investigate the relationship between infested areas and distances from the
734 Moko foci to cable-ways and drainage channels. (Coops et al.) studied the associations among the
735 likelihood of occurrence, forest structure and forest predisposition variables using regression tree
736 models. They found through modelling that location and slope were the major factors driving
737 variations in the probability of red tree outbreaks. The GWR model has been used to detect high-
738 risk infestations caused by mountain pine beetle invasions of lodge-pole pine forests over large
739 areas (Robertson et al. 2008).
740 It is important to start by using single variables to develop correlations before moving to more
741 complicated predictive models and regression analyses, where all factors are incorporated to
742 investigate which combination of factors is most conducive to the survival and spread of insects
743 or diseases. In our study, for instance, GWR could be used to model the correlation between Dubas
744 bug infestation and meteorological variables such as humidity, rainfall, temperature, wind
745 direction and wind speed; GWR could also be applied to model the correlations between Dubas
746 bug infestations and environmental variables including soil type, slope, aspect ratio, ecology, soil
747 salinity and solar radiation. Additionally, autoregressive models could be used to investigate the
748 relationships between Dubas bug infestations and human practices such as irrigation, plantation
749 systems, insecticide use, and methods of spraying.
750 5.1 Suitability Model for Detecting and Investigating Insect Infestations
751 All of the methods used to study the relationships between dependent and independent variables
752 discussed previously are traditional statistical methods, which sometimes might not reflect the
753 complicated relationships between infestations and environmental factors. In particular, ecological
754 and geographical environments represent complex systems in which individual elements interact
PeerJ Preprints | https://doi.org/10.7287/peerj.preprints.2716v1 | CC BY 4.0 Open Access | rec: 13 Jan 2017, publ: 13 Jan 2017

755 to create complex behaviour, and consequently, complex methods such as ANN, Cellular
756 Automata (CA), and multi-agent systems (MAS) may be better suited to study the relationships
757 and conduct factor analyses in insect infestation or disease detection research and to perform
758 spread simulations (De Smith et al. 2007).
759 Numerous suitability models have been proposed to identify locations that have a particular set of
760 characteristics. These models, which can be used to estimate the suitability, include BIOCLIM,
761 DOMAIN, GARP, MAXENT, RNNDOM, FOREST, GLM and GAM. For example, BIOCLIM
762 methods can be used to map the distributions of any biological entity, including pest species
763 (Hernandez et al. 2006). These methods use algorithms to compute the similarity of locations by
764 comparing the values for environmental factors at any location to a percentile distribution of the
765 values at known location occurrences.
766 In (Hernandez et al. 2006), the authors compared four different models (BIOCLIM, GAPP,
767 DOMIN and MAXENT) and found that MAXENT was most capable for producing useful results
768 with small sample sizes and minimum species occurrences. These models can also be used to
769 identify areas that are susceptible to risks such as insect infestations, based on conditions favoured
770 by the species. For example, a relevant study (Drees et al. 2010) used the habitat suitability
771 selection method to model potential conservation areas for a rare ground beetle species (using
772 Barcode Index Number or BIN). Specifically, they used five different data sets to identify several
773 key habitat factors for Carabus variolosus stress levels. A model was developed in (Bone et al.
774 2005) by using fuzzy theory to identify areas of susceptibility to Dendroctonus ponderosae
775 Hopkins in Canada. However, GIS data have unique characteristics that can impact the results of
776 the model (Crooks & Castle 2012). For example, a vector data models use the geometric features
777 of points, polygons and lines to represent spatial objects, which is ideal for working with discrete
PeerJ Preprints | https://doi.org/10.7287/peerj.preprints.2716v1 | CC BY 4.0 Open Access | rec: 13 Jan 2017, publ: 13 Jan 2017

778 factors with well-defined locations and shapes. However, vector data models do not work well
779 with spatial features that vary continuously over space such as elevation, temperature, soil
780 moisture, rainfall, solar radiation and slope. Raster data models are better at representing
781 geographical phenomena that are spatially continuous because they are much easier to manipulate
782 than vector data models.
783 As a result, raster data models are often used for finding and rating suitable locations and the raster
784 overlay results are formatted in a single layer of suitable versus unsuitable cells, rather than in a
785 vector layer with many polygons and an attribute table, which contains the attribute values for each
786 of the polygons.There are two ways to create raster suitability layers. The first approach is to query
787 the individual sources to create the suitability layer. The query can be used to create a suitability
788 layer with two values, ‘1’ for cells meeting all criteria of a suitable habitat, and ‘0’ for the others.
789 Because the layer consists of only two values, one indicating suitable and the other unsuitable
790 cells, they are called binary suitability layers. Binary processing however is not always necessary.
791 Combined with other evaluation models, suitability mapping can be achieved by overlaying
792 directly or by post processing the overlay results. Figure 4 shows a process that could be used to
793 find suitable location conditions (habitat) for insects such as Dubas bug by using a raster method
794 overlay.
795
PeerJ Preprints | https://doi.org/10.7287/peerj.preprints.2716v1 | CC BY 4.0 Open Access | rec: 13 Jan 2017, publ: 13 Jan 2017

796 Figure 4. Schematic of the process that can be used to model the suitable location for
797 Dubas bug infestations
798 The uncertainty that results from geo-processing operations, demonstrates that sophisticated
799 spatial analysis cannot be achieved using traditional, deterministic geoprocessing methods alone
800 (Goodchild & Glennon 2010; Zhang & Goodchild 2002) . Fuzzy logic is a superset of Boolean
801 logic and has the ability to handle uncertainty in data that arises from vagueness instead of
802 randomness alone (Li et al. 2010).
803 Fuzzy logic can be utilised to extract information from high resolution remote sensing data and
804 combined with a raster-based GIS to produce maps representing the spatial variation of
805 vulnerability to pests across a landscape. This method also allows for partial association with one
806 or more classes, meaning that objects may be represented by a value based on a membership
807 function between ‘0’ and ‘1’. The membership function of an element x belonging to a fuzzy set
808 A is computed by:
809
810 (2): [0,1]A U
811 where U is the universal set of x. The concept of fuzzy sets has also been employed for defining
812 the spatial and attributes characteristics of geographic objects (Burrough & Frank 1996; Wang &
813 Hall 1996). The results of such analysis can be rendered directly into a decision framework via
814 maps, tables, and charts. The results can also be used in further analyses or to provide additional
815 understanding of the problem.
816 The challenge in any particular area of study is the geographical extent and the resolution of
817 analysis, which is determined by the phenomenon being modelled. To achieve validity, researchers
818 must ensure that they are using accurate and current data whenever possible. If the data are from
PeerJ Preprints | https://doi.org/10.7287/peerj.preprints.2716v1 | CC BY 4.0 Open Access | rec: 13 Jan 2017, publ: 13 Jan 2017

819 one’s own organisation, one can rely on data quality controls that are in place. Data quality should
820 be checked against alternate sources if possible in order to ensure it meets the requirements of the
821 analysis. Assessing the quality of data will provide guidance to predicting what level of confidence
822 can be attributed to the result of the modelling work.
823 6. Conclusions
824 In this review, a variety of spatial information technologies, including remote sensing and GIS
825 methods, have been shown to be useful in areas of research involving insect infestations
826 worldwide. Environmental and climatic conditions are very important in determining the
827 distribution and survival of any species, including the Dubas bug, which is a problematic pest in
828 date palm plantations. We argue that most of the current research on Dubas bug has focused on its
829 ecology, biology or control mechanisms only. There has been very limited research linking the
830 presence/absence, density, spatial and temporal distributions (Al-Kindi et al. 2017) of Dubas bug
831 with environmental, meteorological, and human practices that promote its development,
832 prevalence and spread. Understanding the distribution and affinity of the Dubas bug in terms of
833 these variables and mapping of the data can play a key role in its control and management, as well
834 as resource allocation.
835 Accurate data on the area involved and resources affected are needed. Similarly, data on areas
836 where the problem is more severe than others are similarly required. The presence of insect
837 infestation causing widespread damage is often an indication of a deeper agricultural health
838 problem. Therefore, it is necessary to examine site and stand conditions, past management
839 practices, climatic variables, and other conditions that may favour the spared of damaging agents.
840 Technical advances in the field of remote sensing from aircraft or satellite platforms have greatly
841 enhanced the ability to detect and quantify physical and biological stresses in several plant species.
PeerJ Preprints | https://doi.org/10.7287/peerj.preprints.2716v1 | CC BY 4.0 Open Access | rec: 13 Jan 2017, publ: 13 Jan 2017

842 Argent techniques need to be developed and implemented in surveillance and control of the Dubas
843 bug over large areas in order to provide IPM and relevant information in time for preventative
844 action to be taken. Remotely sensed satellite data are another source of useful information for GIS
845 users. For instance, the spatial resolution of satellite images relates to ground pixels. Satellite
846 images can be processed digitally to produce a wide variety of thematic data for a GIS project such
847 as ones involving land use, vegetation types, crop health or eroded soil. Satellite images can
848 provide timely data if they are collected at regular intervals. They can also provide temporal data
849 that are valuable for recording and monitoring changes in both terrestrial and aquatic
850 environments.
851 GIS can assist environmental modellers with data visualisation, database management and
852 exploration. A regression model relies on overlays to combine data for the statistical analysis of
853 dependent and independent variables. GIS and its functionalities can be used to build or assist in
854 building a spatially explicit model from geospatial data. Climatic factors such as extreme
855 temperature, high relative humidity, the occurrence of cyclones, severe rain and hail storms, and
856 environmental factors like soil and water salinity and human practices such as traditional and
857 outdated methods of cultivation, all require further investigation in future research.
858 Acknowledgments: We thank the Unit of Cultivations Protection in the Ministry of Agriculture
859 and Fisheries of the Sultanate of Oman for providing the data on DB infestations in the study area.
860 References
861 Abdullah A, and Umer M. 2004. Applications of remote sensing in pest scouting: evaluating options and
862 exploring possibilities. National University of Computers and Emerging Sciences, Pakistan.
863 Abdullah SK, Lorca L, and Jansson H. 2010. Diseases of date palms (Phoenix dactylifera L.). Basrah J for
864 Date Palm Res 9:40.
865 Acharya M, and Thapa R. 2015. REMOTE SENSING AND ITS APPLICATION IN AGRICULTURAL PEST
866 MANAGEMENT. " Seven Billion Dreams One Planet Consume With Care.
PeerJ Preprints | https://doi.org/10.7287/peerj.preprints.2716v1 | CC BY 4.0 Open Access | rec: 13 Jan 2017, publ: 13 Jan 2017

867 Al-Abbasi S. 1988. Antennal sense organs of Ommatissus binotatus de Berg (Tropiduchidae: Homoptera).
868 Date Palm Journal (FAO/NENADATES) eng (1988) v 6 (2,= no 12) p 426-432.
869 Al-Azawi A. 1986. A survey of insect pests of date palms in Qatar. Date Palm Journal 4:247-266.
870 Al-Khatri S. Date palm pests and their control. J. E. Peña (Ed.), Proceedings of date palm regional workshop
871 on ecosystem-based IPM for date palm in gulf Countries ,28–30 Mar 2004. Al-Ain. pp. 84-88.
872 Al-Khatri S. 2004. Date palm pests and their control. Proceedings, Date Palm Regional Workshop on
873 Ecosystem-Based IPM for Date Palm in Gulf Countries UAE University, Al Ain, UAE. p 84-88.
874 Al-Khatri SAH. 2011. Biological, ecological and phylogenic studies of Pseudoligosita babylonica viggiani, a
875 native egg parasitoid of Dubas bug Ommatissus lybicus de Bergevin, the major pest of date palm
876 in the Sultanate of Oman. University of Reading.
877 Al-Kindi KM, Kwan P, Andrew NR, and Welch M. 2017. Modelling spatiotemporal patterns of dubas bug
878 infestations on date palms in northern Oman: A geographical information system case study. Crop
879 protection 93:113-121.
880 Al-Mahmooli H, Deadman M, and Al-Wahabi A. 2005. Evaluation of azadirachtin formulation for the
881 control of dubas bug in Oman. Proceedings of the BCPC international congress of crop science and
882 technology. p 551-556.
883 Al-Samarrie AI, and Akela AA. 2011. Distribution of injected pesticides in data palm trees. Agric Biol JN Am
884 12:1416-1426.
885 Al-Yahyai R. 2006. Improvement of date palm production in the Sultanate of Oman. III International Date
886 Palm Conference 736. p 337-343.
887 Al-Yahyai R, and Al-Khanjari S. 2008. Biodiversity of date palm in the Sultanate of Oman. African Journal
888 of Agricultural Research 3:389-395.
889 Al-Yahyai R, and Khan MM. 2015. Date Palm Status and Perspective in Oman. Date Palm Genetic
890 Resources and Utilization: Springer, 207-240.
891 Al-Zadjali TS, Abd-Allah F, and El-Haidari H. 2006. Insect pests attacking date palms and dates in Sultanate
892 of Oman. Egyptian Journal of Agricultural Research 84:51-59.
893 Aldryhim Y. 2004. Dubas Bug (Old World Date Bug), Ommatissus Lybicus Bergerin (Tropiduchidae:
894 Hemiptera). Encyclopedia of Entomology: Springer, 727-727.
895 Ali A-SA, and Hama NN. 2016. Integrated management for major date palm pests in Iraq. Emirates Journal
896 of Food and Agriculture 28:24.
897 Aminaee MM, Zare R, and Assari MJ. 2010. Isolation and selection of virulent isolates of Beauveria
898 bassiana for biological control of Ommatissus lybicus in Kerman province. Archives of
899 Phytopathology and Plant Protection 43:761-768.
900 Anderson DP, Forester JD, Turner MG, Frair JL, Merrill EH, Fortin D, Mao JS, and Boyce MS. 2005. Factors
901 influencing female home range sizes in elk (Cervus elaphus) in North American landscapes.
902 Landscape Ecology 20:257-271.
903 Apan A, Datt B, and Kelly R. 2005. Detection of pests and diseases in vegetable crops using hyperspectral
904 sensing: a comparison of reflectance data for different sets of symptoms. Proceedings of the 2005
905 Spatial Sciences Institute Biennial Conference 2005: Spatial Intelligence, Innovation and Praxis
906 (SSC2005): Spatial Sciences Institute. p 10-18.
907 Arbabtafti R, Sheikhigarjan A, Gharalari AH, and Damghani R. 2014. Effects of Adjuvants on the Efficacy of
908 Certain Insecticides Against Ommatissus lybicus Bergevin (Hem.: Tropiduchidae) in Iran. Jordan
909 Journal of Agricultural Sciences 10.
910 Bagheri A, Fathipour Y, Askari-Seyahooei M, and Zeinolabedini M. 2016. How Different Populations and
911 Host Plant Cultivars Affect Two-Sex Life Table Parameters of the Date Palm Hopper, Ommatissus
912 lybicus (Hemiptera: Tropiduchidae). Journal of Agricultural Science and Technology 18:1605-1619.
PeerJ Preprints | https://doi.org/10.7287/peerj.preprints.2716v1 | CC BY 4.0 Open Access | rec: 13 Jan 2017, publ: 13 Jan 2017

913 Bale JS, Masters GJ, Hodkinson ID, Awmack C, Bezemer TM, Brown VK, Butterfield J, Buse A, Coulson JC,
914 and Farrar J. 2002. Herbivory in global climate change research: direct effects of rising
915 temperature on insect herbivores. Global Change Biology 8:1-16.
916 Bedford GO, Al-Deeb MA, Khalaf MZ, Mohammadpour K, and Soltani R. 2015. Dynastid Beetle Pests.
917 Sustainable Pest Management in Date Palm: Current Status and Emerging Challenges: Springer,
918 73-108.
919 Bishop M, and Colby J. 2002. Anisotropic reflectance correction of SPOT-3 HRV imagery. International
920 journal of remote sensing 23:2125-2131.
921 Blaschke T. 2010. Object based image analysis for remote sensing. ISPRS journal of photogrammetry and
922 remote sensing 65:2-16.
923 Blumberg D. 2008. Review: Date palm arthropod pests and their management in Israel. Phytoparasitica
924 36:411-448.
925 Bonan GB. 1989. A computer model of the solar radiation, soil moisture, and soil thermal regimes in boreal
926 forests. Ecological Modelling 45:275-306.
927 Bone C, Dragicevic S, and Roberts A. 2005. Integrating high resolution remote sensing, GIS and fuzzy set
928 theory for identifying susceptibility areas of forest insect infestations. International journal of
929 remote sensing 26:4809-4828.
930 Bouyer J, Seck MT, Sall B, Ndiaye EY, Guerrini L, and Vreysen MJ. 2010. Stratified entomological sampling
931 in preparation for an area-wide integrated pest management program: the example of Glossina
932 palpalis gambiensis (Diptera: Glossinidae) in the Niayes of Senegal. Journal of medical entomology
933 47:543-552.
934 Burrough PA, and Frank A. 1996. Geographic objects with indeterminate boundaries: CRC Press.
935 Cammell M, and Knight J. 1992. Effects of climatic change on the population dynamics of crop pests.
936 Advances in Ecological Research 22:117-162.
937 Cannon RJ. 1998. The implications of predicted climate change for insect pests in the UK, with emphasis
938 on non-indigenous species. Global Change Biology 4:785-796.
939 Carter GA, and Knapp AK. 2001. Leaf optical properties in higher plants: linking spectral characteristics to
940 stress and chlorophyll concentration. American Journal of Botany 88:677-684.
941 Castellana L, D’Addabbo A, and Pasquariello G. 2007. A composed supervised/unsupervised approach to
942 improve change detection from remote sensing. Pattern Recognition Letters 28:405-413.
943 Chavez PS, and MacKinnon DJ. 1994. Automatic detection of vegetation changes in the southwestern
944 United States using remotely sensed images. Photogrammetric engineering and remote sensing
945 60.
946 Civco DL. 1989. Topographic normalization of Landsat Thematic Mapper digital imagery. Photogrammetric
947 engineering and remote sensing 55:1303-1309.
948 Colomina I, and Molina P. 2014. Unmanned aerial systems for photogrammetry and remote sensing: A
949 review. ISPRS Journal of Photogrammetry and Remote Sensing 92:79-97.
950 Congalton RG. 2001. Accuracy assessment and validation of remotely sensed and other spatial
951 information. International Journal of Wildland Fire 10:321-328.
952 Congalton RG, and Green K. 2008. Assessing the accuracy of remotely sensed data: principles and
953 practices: CRC press.
954 Cook DC. 2008. Benefit cost analysis of an import access request. Food Policy 33:277-285.
955 Coops NC, Johnson M, Wulder MA, and White JC. 2006. Assessment of QuickBird high spatial resolution
956 imagery to detect red attack damage due to mountain pine beetle infestation. Remote sensing of
957 environment 103:67-80.
958 Coppin PR, and Bauer ME. 1996. Digital change detection in forest ecosystems with remote sensing
959 imagery. Remote sensing reviews 13:207-234.
PeerJ Preprints | https://doi.org/10.7287/peerj.preprints.2716v1 | CC BY 4.0 Open Access | rec: 13 Jan 2017, publ: 13 Jan 2017

960 Cox S. 2002. Information technology: the global key to precision agriculture and sustainability. Computers
961 and Electronics in Agriculture 36:93-111.
962 Crippen RE. 1990. Calculating the vegetation index faster. Remote Sensing of Environment 34:71-73.
963 Crooks AT, and Castle CJ. 2012. The integration of agent-based modelling and geographical information
964 for geospatial simulation. Agent-based models of geographical systems: Springer, 219-251.
965 Dakshinamurti C, Krishnamurthy B, Summanwar A, Shanta P, and Pisharoty P. 1971. Remote sensing for
966 coconut wilt. Proceedings of the seventh international symposium on remote sensing, Ann Arbor,
967 MI. p 25-29.
968 Darvishzadeh R, Skidmore A, Schlerf M, Atzberger C, Corsi F, and Cho M. 2008. LAI and chlorophyll
969 estimation for a heterogeneous grassland using hyperspectral measurements. ISPRS journal of
970 photogrammetry and remote sensing 63:409-426.
971 Datt B, McVicar TR, Van Niel TG, Jupp DL, and Pearlman JS. 2003. Preprocessing EO-1 Hyperion
972 hyperspectral data to support the application of agricultural indexes. IEEE Transactions on
973 Geoscience and Remote Sensing 41:1246-1259.
974 De Smith MJ, Goodchild MF, and Longley P. 2007. Geospatial analysis: a comprehensive guide to principles,
975 techniques and software tools: Troubador Publishing Ltd.
976 Demetriades-Shah TH, Steven MD, and Clark JA. 1990. High resolution derivative spectra in remote
977 sensing. Remote Sensing of Environment 33:55-64.
978 Dey V, Zhang Y, and Zhong M. 2010. A review on image segmentation techniques with remote sensing
979 perspective: na.
980 dos Santos A, Oumar Z, Arnhold A, da Silva N, Oliveira Silva C, and Zanetti R. 2016. Multispectral
981 characterization, prediction and mapping of Thaumastocoris peregrinus (Hemiptera:
982 Thamascoridae) attack in Eucalyptus plantations using remote sensing. Journal of Spatial
983 Science:1-11.
984 Drake A. 2002. Automatically operating radars for monitoring insect pest migrations. Insect Science 9:27-
985 39.
986 Drees C, Matern A, von Oheimb G, Reimann T, and Assmann T. 2010. Multiple glacial refuges of unwinged
987 ground beetles in Europe: molecular data support classical phylogeographic models. Relict
988 species: Springer, 199-215.
989 Dubayah R, and Rich PM. 1995. Topographic solar radiation models for GIS. International Journal of
990 Geographical Information Systems 9:405-419.
991 Duda R, Hart P, and Stork D. 2001. Non-metric methods. Pattern classification 2:1-66.
992 Dupont J, Campanella R, and Seal M. 2000. Spatially variable insecticide applications through remote
993 sensing. Proceedings of the Beltwide Cotton Conferences.
994 Eitel JU, Vierling LA, Litvak ME, Long DS, Schulthess U, Ager AA, Krofcheck DJ, and Stoscheck L. 2011.
995 Broadband, red-edge information from satellites improves early stress detection in a New Mexico
996 conifer woodland. Remote Sensing of Environment 115:3640-3646.
997 El-Haidari H, Mohammed I, and Daoud A. 1968. Evaluation of DDVP against the Dubas bug, Ommatissus
998 binotatus libycus Berg., on date palms in Iraq (Hemiptera: Homoptera: Tropiduchidae). Bull
999 Entomol Soc Egypt Econ Ser 2:91-94.
1000 El-Juhany LI. 2010. Degradation of date palm trees and date production in Arab countries: causes and
1001 potential rehabilitation. Australian Journal of Basic and Applied Sciences 4:3998-4010.
1002 El-Shafie H. 2012. Review: List of arthropod pests and their natural enemies identified worldwide on date
1003 palm, Phoenix dactylifera L. Agriculture and Biology Journal of North America 3:516-524.
1004 El-Shafie HA, Peña JE, and Khalaf MZ. 2015. Major Hemipteran Pests. Sustainable Pest Management in
1005 Date Palm: Current Status and Emerging Challenges: Springer, 169-204.
1006 Elwan A, and Al-Tamimi S. 1999. Life cycle of Dubas bug Ommatissus binotatus lybicus De
1007 Berg.(Homoptera: Tropiduchidae) in Sultanate of Oman. Egypt J Agric Res 77:1547-1553.
PeerJ Preprints | https://doi.org/10.7287/peerj.preprints.2716v1 | CC BY 4.0 Open Access | rec: 13 Jan 2017, publ: 13 Jan 2017

1008 Feng H, Wu K, Cheng D, and Guo Y. 2003. Radar observations of the autumn migration of the beet
1009 armyworm Spodoptera exigua (Lepidoptera: Noctuidae) and other moths in northern China.
1010 Bulletin of entomological research 93:115-124.
1011 Flint AL, and Childs SW. 1987. Calculation of solar radiation in mountainous terrain. Agricultural and forest
1012 meteorology 40:233-249.
1013 Foody GM. 2002. Status of land cover classification accuracy assessment. Remote sensing of Environment
1014 80:185-201.
1015 Gassouma MS. 2004. Pests of the date palm (Phoenix dactylifera). Proceedings of the regional workshop
1016 on date palm development in the GCC countries of the Arabian Peninsula, Abu Dhabi, 29-31 May
1017 2004.
1018 Geiger M, Diabaté L, Ménard L, and Wald L. 2002. A web service for controlling the quality of
1019 measurements of global solar irradiation. Solar energy 73:475-480.
1020 Gibbs HK, Ruesch AS, Achard F, Clayton MK, Holmgren P, Ramankutty N, and Foley JA. 2010. Tropical
1021 forests were the primary sources of new agricultural land in the 1980s and 1990s. Proceedings of
1022 the National Academy of Sciences 107:16732-16737.
1023 Glenn EP, Huete AR, Nagler PL, and Nelson SG. 2008. Relationship between remotely-sensed vegetation
1024 indices, canopy attributes and plant physiological processes: what vegetation indices can and
1025 cannot tell us about the landscape. Sensors 8:2136-2160.
1026 Goodchild MF. 1994. Integrating GIS and remote sensing for vegetation analysis and modeling:
1027 methodological issues. Journal of vegetation science 5:615-626.
1028 Goodchild MF, and Glennon JA. 2010. Crowdsourcing geographic information for disaster response: a
1029 research frontier. International Journal of Digital Earth 3:231-241.
1030 Gooshbor L, BAVAGHAR MP, Amanollahi J, and Ghobari H. 2016. Monitoring Infestations of Oak Forests
1031 by Tortrix viridana (Lepidoptera: Tortricidae) using Remote Sensing. Plant Protection Science 52.
1032 Gorczyca W, Gong J, and Darzynkiewicz Z. 1993. Detection of DNA strand breaks in individual apoptotic
1033 cells by the in situ terminal deoxynucleotidyl transferase and nick translation assays. Cancer
1034 research 53:1945-1951.
1035 Gutman GG. 1999. On the use of long-term global data of land reflectances and vegetation indices derived
1036 from the advanced very high resolution radiometer. Journal of Geophysical Research:
1037 Atmospheres 104:6241-6255.
1038 Hall RJ, Skakun RS, and Arsenault EJ. 2006. Remotely sensed data in the mapping of insect defoliation.
1039 Understanding forest disturbance and spatial pattern: Remote sensing and GIS approaches:85-
1040 111.
1041 Haralick RM, and Shapiro LG. 1985. Image segmentation techniques. Computer vision, graphics, and image
1042 processing 29:100-132.
1043 Harris P, Fotheringham A, Crespo R, and Charlton M. 2010. The use of geographically weighted regression
1044 for spatial prediction: an evaluation of models using simulated data sets. Mathematical
1045 Geosciences 42:657-680.
1046 Harris R. 2003. Remote sensing of agriculture change in Oman. International journal of remote sensing
1047 24:4835-4852.
1048 Hassan N. 2014. Biorational control strategies for important date palm pests. International Pest Control
1049 56:92.
1050 Hatfield P, and Pinter P. 1993. Remote sensing for crop protection. Crop protection 12:403-413.
1051 Hernandez PA, Graham CH, Master LL, and Albert DL. 2006. The effect of sample size and species
1052 characteristics on performance of different species distribution modeling methods. Ecography
1053 29:773-785.
PeerJ Preprints | https://doi.org/10.7287/peerj.preprints.2716v1 | CC BY 4.0 Open Access | rec: 13 Jan 2017, publ: 13 Jan 2017

1054 Hetrick WA, Rich PM, Barnes FJ, and Weiss SB. 1993. GIS-based solar radiation flux models. ACSM ASPRS
1055 ANNUAL CONVENTION: AMERICAN SOC PHOTOGRAMMETRY & REMOTE SENSING+ AMER CONG
1056 ON. p 132-132.
1057 Hirano A, Welch R, and Lang H. 2003. Mapping from ASTER stereo image data: DEM validation and
1058 accuracy assessment. ISPRS Journal of Photogrammetry and Remote Sensing 57:356-370.
1059 Howard F. 2001. Insect pests of palms and their control. Pesticide outlook 12:240-243.
1060 Huang S, Liao Q, Hua M, Wu X, Bi K, Yan C, Chen B, and Zhang X. 2007. Survey of heavy metal pollution
1061 and assessment of agricultural soil in Yangzhong district, Jiangsu Province, China. Chemosphere
1062 67:2148-2155.
1063 Hughes ML, McDowell PF, and Marcus WA. 2006. Accuracy assessment of georectified aerial photographs:
1064 implications for measuring lateral channel movement in a GIS. Geomorphology 74:1-16.
1065 Hussain AA. 1963. Biology and control of the dubas bug, Ommatissus binotatus lybicus De
1066 Berg.(Homoptera, Tropiduchidae), infesting date palms in Iraq. Bulletin of entomological research
1067 53:737-745.
1068 Hussein A, and Ali M. 1996. New records of the Dubas bug, Ommatissus binotatus lybicus de Berg., a threat
1069 to date palms in Bahria Oases. Egypt Bull Entomol Soci Egypt (ARE) 74:1-8.
1070 Jadhav B, and Patil P. 2014. Hyperspectral Remote Sensing For Agricultural Management: A Survey.
1071 International Journal of Computer Applications 106.
1072 James M, and Kalluri SN. 1994. The Pathfinder AVHRR land data set: an improved coarse resolution data
1073 set for terrestrial monitoring. International Journal of Remote Sensing 15:3347-3363.
1074 Jasim H, and Al-Zubaidy H. 2010. Eggs Distribution of Old World Bug (Dubas Bug) Ommatissus lybicus
1075 (Derbeg) Asche and Wilson (Homoptera: Tropiduchidae) on Fronds Rows and Effect of Dust
1076 Storms on Three Varieties of Date Palm Trees. IV International Date Palm Conference 882. p 465-
1077 470.
1078 Jensen R. 2000. Agricultural volatility and investments in children. The American Economic Review 90:399-
1079 404.
1080 Jhorar O, Mathauda S, Singh G, Butler D, and Mavi H. 1997. Relationships between climatic variables and
1081 Ascochyta blight of chickpea in Punjab, India. Agricultural and forest meteorology 87:171-177.
1082 Jiang Z, Huete AR, Chen J, Chen Y, Li J, Yan G, and Zhang X. 2006. Analysis of NDVI and scaled difference
1083 vegetation index retrievals of vegetation fraction. Remote sensing of environment 101:366-378.
1084 Justice C, Townshend J, Vermote E, Masuoka E, Wolfe R, Saleous N, Roy D, and Morisette J. 2002. An
1085 overview of MODIS Land data processing and product status. Remote sensing of Environment
1086 83:3-15.
1087 Karoui R, and Blecker C. 2011. Fluorescence spectroscopy measurement for quality assessment of food
1088 systems—a review. Food and Bioprocess technology 4:364-386.
1089 Kaszab Z, Wittmer W, and Buttiker W. 1979. Insects of Saudi Arabia: Coleoptera: Fam. Tenebrionidae.
1090 Fauna of Saudi Arabia, Vol 1:257-288.
1091 Kattenborn T, Sperlich M, Bataua K, and Koch B. 2014. Automatic Single Tree Detection in Plantations
1092 using UAV-based Photogrammetric Point clouds. The International Archives of Photogrammetry,
1093 Remote Sensing and Spatial Information Sciences 40:139.
1094 Kaufman YJ, and Tanre D. 1992. Atmospherically resistant vegetation index (ARVI) for EOS-MODIS. IEEE
1095 Transactions on Geoscience and Remote Sensing 30:261-270.
1096 Khalaf MZ, Shbar AK, Naher FH, Jabo NF, Abdulalhamza BH, and Sami RA. 2012. Activity of insect fauna
1097 during the night in the palm orchards of central Iraq. Journal of Food Science and Engineering
1098 2:277.
1099 Khan A, Azam K, and Razvi S. 2001. Pesticide residue analysis of date palm fruits by gas chromatography
1100 mass spectrophotometry. Proc Second International Conference on Date Palms (Al-Ain, UAE:
1101 Citeseer. p 211-215.
PeerJ Preprints | https://doi.org/10.7287/peerj.preprints.2716v1 | CC BY 4.0 Open Access | rec: 13 Jan 2017, publ: 13 Jan 2017

1102 Kirkpatrick J, and Nunez M. 1980. Vegetation-radiation relationships in mountainous terrain: eucalypt-
1103 dominated vegetation in the Risdon Hills, Tasmania. Journal of Biogeography:197-208.
1104 Klein M, and Venezian A. 1985. The dubas date Tropiduchid, Ommatissus binotatus lybicus, a threat to
1105 date palms in Israel. Phytoparasitica 13:95-101.
1106 Kumar L, Skidmore AK, and Knowles E. 1997. Modelling topographic variation in solar radiation in a GIS
1107 environment. International Journal of Geographical Information Science 11:475-497.
1108 Lamb D, and Brown R. 2001. Pa—precision agriculture: Remote-sensing and mapping of weeds in crops.
1109 Journal of Agricultural Engineering Research 78:117-125.
1110 Lawrence R, and Labus M. 2003. Early detection of Douglas-fir beetle infestation with subcanopy
1111 resolution hyperspectral imagery. Western Journal of Applied Forestry 18:202-206.
1112 Lawrence RL, and Wright A. 2001. Rule-based classification systems using classification and regression
1113 tree (CART) analysis. Photogrammetric engineering and remote sensing 67:1137-1142.
1114 Leckie D, Jay C, Gougeon F, Sturrock R, and Paradine D. 2004. Detection and assessment of trees with
1115 Phellinus weirii (laminated root rot) using high resolution multi-spectral imagery. International
1116 Journal of Remote Sensing 25:793-818.
1117 Lema J, Mendez R, and Blazquez R. 1988. Characteristics of landfill leachates and alternatives for their
1118 treatment: a review. Water, Air, and Soil Pollution 40:223-250.
1119 Lenk S, Chaerle L, Pfündel EE, Langsdorf G, Hagenbeek D, Lichtenthaler HK, Van Der Straeten D, and
1120 Buschmann C. 2007. Multispectral fluorescence and reflectance imaging at the leaf level and its
1121 possible applications. Journal of Experimental Botany 58:807-814.
1122 Leprieur C, Kerr Y, and Pichon J. 1996. Critical assessment of vegetation indices from AVHRR in a semi-arid
1123 environment. Remote Sensing 17:2549-2563.
1124 Li Y, Huang G, Guo P, and Nie S. 2010. Interval-fuzzy possibilistic mixed integer linear programming for
1125 environmental management under uncertainty. International Journal of Environment and
1126 Pollution 42:107-124.
1127 Liu Z-Y, Wu H-F, and Huang J-F. 2010. Application of neural networks to discriminate fungal infection levels
1128 in rice panicles using hyperspectral reflectance and principal components analysis. Computers and
1129 Electronics in Agriculture 72:99-106.
1130 Lookingbill T, and Urban D. 2004. An empirical approach towards improved spatial estimates of soil
1131 moisture for vegetation analysis. Landscape Ecology 19:417-433.
1132 Loper GM. 1992. What do we really know about drone flight behaviour? Bee World 73:198-203.
1133 Lu D, Mausel P, Brondizio E, and Moran E. 2004. Change detection techniques. International journal of
1134 remote sensing 25:2365-2401.
1135 Lu D, Moran E, and Batistella M. 2003. Linear mixture model applied to Amazonian vegetation
1136 classification. Remote sensing of Environment 87:456-469.
1137 Lu D, and Weng Q. 2007. A survey of image classification methods and techniques for improving
1138 classification performance. International journal of remote sensing 28:823-870.
1139 Lunetta RS, Knight JF, Ediriwickrema J, Lyon JG, and Worthy LD. 2006. Land-cover change detection using
1140 multi-temporal MODIS NDVI data. Remote sensing of Environment 105:142-154.
1141 Lyon JG, Yuan D, Lunetta RS, and Elvidge CD. 1998. A change detection experiment using vegetation
1142 indices. Photogrammetric Engineering and Remote Sensing 64:143-150.
1143 Mahmoudi M, Sahragard A, Pezhman H, and Ghadamyari M. 2015. Demographic Analyses of Resistance
1144 of Five Varieties of Date Palm, Phoenix dactylifera L. to Ommatissus lybicus De Bergevin
1145 (Hemiptera: Tropiduchidae). Journal of Agricultural Science and Technology 17:263-273.
1146 Marx A, Sagischewski H, Sossna I, and Chmara S. 2010. Detecting bark beetle infestation in spruce stands
1147 using multi-temporal RapidEye Satellite Data. Forst und Holz 65:36-40.
1148 Mavi H, Jhorar O, Sharma I, Singh G, Mahi G, Mathauda S, and Aujla S. 1992. Forecasting Karnal bunt
1149 disease of wheat-a meteorological method. Cereal Research Communications:67-74.
PeerJ Preprints | https://doi.org/10.7287/peerj.preprints.2716v1 | CC BY 4.0 Open Access | rec: 13 Jan 2017, publ: 13 Jan 2017

1150 Mazza CA, Boccalandro HE, Giordano CV, Battista D, Scopel AL, and Ballaré CL. 2000. Functional
1151 significance and induction by solar radiation of ultraviolet-absorbing sunscreens in field-grown
1152 soybean crops. Plant physiology 122:117-126.
1153 McFeeters SK. 1996. The use of the Normalized Difference Water Index (NDWI) in the delineation of open
1154 water features. International journal of remote sensing 17:1425-1432.
1155 Menard S. 2002. Applied logistic regression analysis: Sage.
1156 Mifsud D, Cocquempot C, Mühlethaler R, Wilson M, and Streito J-C. 2010. Other Hemiptera
1157 Sternorrhyncha (Aleyrodidae, Phylloxeroidea, and Psylloidea) and Hemiptera Auchenorrhyncha.
1158 Chapter 9.4. BioRisk 4:511.
1159 Miles J, and Shevlin M. 2001. Applying regression and correlation: A guide for students and researchers:
1160 Sage.
1161 Mokhtar A, and Al-Mjeini A. 1999. A novel approach to determine the efficacy control measures against
1162 Dubas bug Ommatissus lybicus de Berg on date palm. Agriculture Science 4:1-4.
1163 Mokhtar AM, and Al Nabhani SS. 2010. Temperature-dependent development of dubas bug, Ommatissus
1164 lybicus (Hemiptera: Tropiduchidae), an endemic pest of date palm, Phoenix dactylifera. European
1165 Journal of Entomology 107:681.
1166 Monteiro A, Souza Jr C, and Barreto P. 2003. Detection of logging in Amazonian transition forests using
1167 spectral mixture models. International journal of remote sensing 24:151-159.
1168 Mountrakis G, Im J, and Ogole C. 2011. Support vector machines in remote sensing: A review. ISPRS journal
1169 of photogrammetry and remote sensing 66:247-259.
1170 Muller J-P, Scott J, and Quegan S. 1988. Key Issues in Image Understanding in Remote Sensing [and
1171 Discussion]. Philosophical Transactions of the Royal Society of London A: Mathematical, Physical
1172 and Engineering Sciences 324:381-395.
1173 Munar-Vivas O, Morales-Osorio JG, and Castañeda-Sánchez DA. 2010. Use of field-integrated information
1174 in GIS-based maps to evaluate Moko disease (Ralstonia solanacearum) in banana growing farms
1175 in Colombia. Crop protection 29:936-941.
1176 Nageswara Rao P, Ravishankar H, Raj U, and Nagajothi K. 2004. Production estimation of horticultural
1177 crops using irs-1d liss-iii data. Journal of the Indian Society of Remote Sensing 32:393-398.
1178 Nebiker S, Annen A, Scherrer M, and Oesch D. 2008. A light-weight multispectral sensor for micro UAV—
1179 Opportunities for very high resolution airborne remote sensing. The international archives of the
1180 photogrammetry, remote sensing and spatial information sciences 37:1193-1199.
1181 Ortiz SM, Breidenbach J, and Kändler G. 2013. Early detection of bark beetle green attack using TerraSAR-X
1182 and RapidEye data. Remote Sensing 5:1912-1931.
1183 Pao Y-H, and Sobajic DJ. 1992. Combined use of unsupervised and supervised learning for dynamic security
1184 assessment. IEEE Transactions on Power Systems 7:878-884.
1185 Payandeh A, and Dehghan A. 2011. Life table parameters of the dubas bug, Ommatissus lybicus (Hem:
1186 Tropiduchidae) at three constant temperatures. African Journal of Biotechnology 10:19489-
1187 19493.
1188 Payandeh A, Kamali K, and Fathipour Y. 2010. Population structure and seasonal activity of Ommatissus
1189 lybicus in Bam Region of Iran (Homoptera: tropiduchidae). Munis Entomol Zool 5:726-733.
1190 Pinter Jr PJ, Hatfield JL, Schepers JS, Barnes EM, Moran MS, Daughtry CS, and Upchurch DR. 2003. Remote
1191 sensing for crop management. Photogrammetric Engineering & Remote Sensing 69:647-664.
1192 Plant RE. 2001. Site-specific management: the application of information technology to crop production.
1193 Computers and Electronics in Agriculture 30:9-29.
1194 Prabhakar M, Prasad Y, Thirupathi M, Sreedevi G, Dharajothi B, and Venkateswarlu B. 2011. Use of ground
1195 based hyperspectral remote sensing for detection of stress in cotton caused by leafhopper
1196 (Hemiptera: Cicadellidae). Computers and Electronics in Agriculture 79:189-198.
PeerJ Preprints | https://doi.org/10.7287/peerj.preprints.2716v1 | CC BY 4.0 Open Access | rec: 13 Jan 2017, publ: 13 Jan 2017

1197 Pydipati R, Burks T, and Lee W. 2005. Statistical and neural network classifiers for citrus disease detection
1198 using machine vision. Transactions of the ASAE 48:2007-2014.
1199 Reynolds A, Reynolds D, and Riley J. 2009. Does a ‘turbophoretic’effect account for layer concentrations
1200 of insects migrating in the stable night-time atmosphere? Journal of The Royal Society Interface
1201 6:87-95.
1202 Reynolds D, and Riley J. 1997. Flight behaviour and migration of insect pests. Radar studies in developing
1203 countries: Natural Resources Institute (NRI).
1204 Richardson AJ, and Wiegand C. 1977. Distinguishing vegetation from soil background information.[by gray
1205 mapping of Landsat MSS data.
1206 Riley J. 1989. Remote sensing in entomology. Annual review of entomology 34:247-271.
1207 Robertson C, Wulder M, Nelson T, and White J. 2008. Risk rating for mountain pine beetle infestation of
1208 lodgepole pine forests over large areas with ordinal regression modelling. Forest ecology and
1209 management 256:900-912.
1210 Rogan J, Franklin J, and Roberts DA. 2002. A comparison of methods for monitoring multitemporal
1211 vegetation change using Thematic Mapper imagery. Remote sensing of Environment 80:143-156.
1212 Rondeaux G, Steven M, and Baret F. 1996. Optimization of soil-adjusted vegetation indices. Remote
1213 Sensing of Environment 55:95-107.
1214 Seelan SK, Laguette S, Casady GM, and Seielstad GA. 2003. Remote sensing applications for precision
1215 agriculture: A learning community approach. Remote Sensing of Environment 88:157-169.
1216 Shafri HZ, and Hamdan N. 2009. Hyperspectral Imagery for Mapping Disease Infection in Oil Palm
1217 PlantationUsing Vegetation Indices and Red Edge Techniques. American Journal of Applied
1218 Sciences 6:1031.
1219 Shah A, Mohsin AU, Hafeez Z, Naeem M, and Haq MIU. 2013. Eggs Distribution Behaviour of Dubas Bug
1220 (Ommatissus Lybicus: Homoptera: Tropiduchidae) in Relation to Seasons and Some Physico-
1221 Morphic Characters of Date Palm Leaves. Journal of insect behavior 26:371-386.
1222 Shah A, Naeem M, Nasir MF, Irfan-ul-Haq M, and Hafeez Z. 2012. Biology of Dubas Bug, Ommatissus
1223 lybicus (Homoptera: Tropiduchidae), a Pest on Date Palm During Spring and Summer Seasons in
1224 Panjgur, Pakistan. Pakistan Journal of Zoology 44.
1225 Shifley SR, Moser WK, Nowak DJ, Miles PD, Butler BJ, Aguilar FX, DeSantis RD, and Greenfield EJ. 2014.
1226 Five anthropogenic factors that will radically alter forest conditions and management needs in the
1227 northern United States. Forest Science 60:914-925.
1228 Singh C, Jayas D, Paliwal J, and White N. 2009. Detection of insect-damaged wheat kernels using near-
1229 infrared hyperspectral imaging. Journal of Stored Products Research 45:151-158.
1230 Singh CB, Jayas DS, Paliwal J, and White ND. 2010. Identification of insect-damaged wheat kernels using
1231 short-wave near-infrared hyperspectral and digital colour imaging. Computers and Electronics in
1232 Agriculture 73:118-125.
1233 Song C, Woodcock CE, Seto KC, Lenney MP, and Macomber SA. 2001. Classification and change detection
1234 using Landsat TM data: when and how to correct atmospheric effects? Remote sensing of
1235 Environment 75:230-244.
1236 Southwood T. 1978. Ecological methods: with particular reference to study ofinsect populations.
1237 Sperlich M, Kattenborn T, Koch B, and Kattenborn G. 2014. Potential of unmanned aerial vehicle based
1238 photogrammetric point clouds for automatic single tree detection. Available onlilne: http://www
1239 dgpf de/neu/Proc2014/proceedings/papers/Beitrag270 pdf (accessed on 15 January 2015).
1240 Stafford JV. 2000. Implementing precision agriculture in the 21st century. Journal of Agricultural
1241 Engineering Research 76:267-275.
1242 Stansbury C, and Pretorius Z. 2001. Modelling the potential distribution of Karnal bunt of wheat in South
1243 Africa. South African Journal of Plant and Soil 18:159-168.
PeerJ Preprints | https://doi.org/10.7287/peerj.preprints.2716v1 | CC BY 4.0 Open Access | rec: 13 Jan 2017, publ: 13 Jan 2017
1244 Stehman SV, and Czaplewski RL. 1998. Design and analysis for thematic map accuracy assessment:
1245 fundamental principles. Remote sensing of Environment 64:331-344.
1246 Stephens M, Havlicek V, and Dakshinamurti K. 1971. Pyridoxine deficiency and development of the central
1247 nervous system in the rat. Journal of neurochemistry 18:2407-2416.
1248 Swift LW. 1976. Algorithm for solar radiation on mountain slopes. Water Resources Research 12:108-112.
1249 Teillet P, Guindon B, and Goodenough D. 1982. On the slope-aspect correction of multispectral scanner
1250 data. Canadian Journal of Remote Sensing 8:84-106.
1251 Teke M, Deveci HS, Haliloğlu O, Gürbüz SZ, and Sakarya U. 2013. A short survey of hyperspectral remote
1252 sensing applications in agriculture. Recent Advances in Space Technologies (RAST), 2013 6th
1253 International Conference on: IEEE. p 171-176.
1254 Thacker J, Al-Mahmooli I, and Deadman M. 2003. Population dynamics and control of the dubas bug
1255 Ommatissus lybicus in the Sultanate of Oman. The BCPC International Congress: Crop Science and
1256 Technology, Volumes 1 and 2 Proceedings of an international congress held at the SECC, Glasgow,
1257 Scotland, UK, 10-12 November 2003: British Crop Protection Council. p 987-992.
1258 Tobin PC, Parry D, and Aukema BH. 2014. The influence of climate change on insect invasions in temperate
1259 forest ecosystems. Challenges and Opportunities for the World's Forests in the 21st Century:
1260 Springer, 267-293.
1261 Tremblay N, Wang Z, and Cerovic ZG. 2012. Sensing crop nitrogen status with fluorescence indicators. A
1262 review. Agronomy for sustainable development 32:451-464.
1263 Vigier F, Coutanceau C, Hahn F, Belgsir E, and Lamy C. 2004. On the mechanism of ethanol electro-
1264 oxidation on Pt and PtSn catalysts: electrochemical and in situ IR reflectance spectroscopy studies.
1265 Journal of Electroanalytical Chemistry 563:81-89.
1266 Wang F, and Hall GB. 1996. Fuzzy representation of geographical boundaries in GIS. International journal
1267 of geographical information systems 10:573-590.
1268 Westbrook J, and Isard S. 1999. Atmospheric scales of biotic dispersal. Agricultural and forest meteorology
1269 97:263-274.
1270 White EV, and Roy DP. 2015. A contemporary decennial examination of changing agricultural field sizes
1271 using Landsat time series data. Geo: Geography and Environment 2:33-54.
1272 Willers JL, Wu J, O’Hara C, and Jenkins JN. 2012. A categorical, improper probability method for combining
1273 NDVI and LiDAR elevation information for potential cotton precision agricultural applications.
1274 Computers and Electronics in Agriculture 82:15-22.
1275 Wolter PT, Townsend PA, and Sturtevant BR. 2009. Estimation of forest structural parameters using 5 and
1276 10 meter SPOT-5 satellite data. Remote Sensing of Environment 113:2019-2036.
1277 Workneh F, Allen T, Nash G, Narasimhan B, Srinivasan R, and Rush C. 2008. Rainfall and temperature
1278 distinguish between Karnal bunt positive and negative years in wheat fields in Texas.
1279 Phytopathology 98:95-100.
1280 Wulder MA, Dymond CC, White JC, Erickson B, Safranyik L, and Wilson B. 2006. Detection, mapping, and
1281 monitoring of the mountain pine beetle. The mountain pine beetle: A synthesis of biology,
1282 management, and impacts on lodgepole pine Natural Resources Canada, Canadian Forest Service,
1283 Pacific Forestry Centre, Victoria, BC:123-154.
1284 Zhang C, and Kovacs JM. 2012. The application of small unmanned aerial systems for precision agriculture:
1285 a review. Precision agriculture 13:693-712.
1286 Zhang J, and Foody G. 2001. Fully-fuzzy supervised classification of sub-urban land cover from remotely
1287 sensed imagery: statistical and artificial neural network approaches. International journal of
1288 remote sensing 22:615-628.
1289 Zhang J, and Goodchild MF. 2002. Uncertainty in geographical information: CRC press.
1290 Zwiggelaar R. 1998. A review of spectral properties of plants and their potential use for crop/weed
1291 discrimination in row-crops. Crop Protection 17:189-206.
PeerJ Preprints | https://doi.org/10.7287/peerj.preprints.2716v1 | CC BY 4.0 Open Access | rec: 13 Jan 2017, publ: 13 Jan 2017

1292
1293
PeerJ Preprints | https://doi.org/10.7287/peerj.preprints.2716v1 | CC BY 4.0 Open Access | rec: 13 Jan 2017, publ: 13 Jan 2017