remote sensing of barrier island morphology: evaluation
TRANSCRIPT
Journal of Coastal Research 207-220 West Palm Beach, Florida Winter 2001
Remote Sensing of Barrier Island Morphology:Evaluation of Photogrammetry-derived Digital TerrainModelsElizabeth K. judge", Margery F. Overton'
'S.c. Sea Grant ExtensionProgram
287 Meeting StreetCharleston, SC [email protected]
'North Carolina StateUniversity
Department of CivilEngineering
Box 7908Raleigh, NC [email protected]
.tllllllll:.~~.~~-+ &-
ABSTRACT _
JUDGE, E.K. and OVERTON, M.F., 2001. Remote Sensing of Barrier Island Morphology: Evaluation of Photogrammetry-derived Digital Terrain Models. Journal of Coastal Research, 17(1), 207-220. West Palm Beach (Florida), ISSN0749-0208.
This study evaluates the use of detailed, highly accurate digital terrain models (DTMs) in the study of coastal processes. DTMs are digital cartographic representations of the continuous surface of the ground by a large number ofselected points with known X, Y, and Z coordinates. Advances in Geographic Information Systems (GIS) and terrainmodeling software allow these models to be easily manipulated for analysis of coastal morphology. The DTMs in thisstudy were derived using high-accuracy photogrammetric techniques.
We compare 101 ground-surveyed beach and dune profiles and profiles derived by interpolation of a terrain modelof the area. The model is found to be sufficiently accurate to measure changes in the dune field. Aerial surveyscurrently cost 1.5 times more than ground surveys. Examples of the spatial richness of the DTMs are also presented,including one application in coastal hazard mitigation.
ADDITIONAL INDEX WORDS: Dune mapping, beach mapping, digital photogrammetry, digital terrain model, beachprofiles.
INTRODUCTION
Low altitude aerial photography is a primary data sourceused in the study of barrier island morphology and shorelinechange ie.g., LANGFELDER et al., 1970; DOLAN et al., 1978;CROWELL et al., 1991). Photogrammetric techniques for processing controlled vertical aerial photography have been usedsince World War II to produce highly accurate topographicmaps, compliant with National Mapping Accuracy Standards(SLAMA et al., 1980). However, many aerial photo sets, bothrecent and historic, lack ground control placed at the time ofthe photography, making the three-dimensional processing ofthese data difficult, if not impossible. Researchers havetherefore focused much attention on various geo-referencingtechniques to rectify uncontrolled modern and historic photography with respect to the horizontal plane (X-Y or topview) (e.g., THIELER and DANFORTH, 1994). Although thistype of rectification has been useful in identifying horizontalchange oflandforms, including inlet migration, shoreline erosion, and storm overwash fans (e.g., FISHER and SIMPSON,1979; WEBB et al., 1989; DAVIDSON-ARNOTT and FISHER,1992), it is unable to capture vertical changes.
Traditionally, when elevation data were needed, shore perpendicular transects were surveyed using traditional tech-
99064 received 18 August 1999; accepted in revision 8 August 2000.
niques at a specified interval along the shoreline. Coastal engineers have measured beach and dune change mostly by interpolation of these ground-surveyed transects. Profilechange has long been used as a measure of dune erosion andis used almost exclusively in current storm-induced beachand dune erosion models (e.g., ZHENG and DEAN, 1997; WISEet al., 1996; KRIEBEL, 1990). Because of cost and time factors,these profiles are typically widely spaced, and thus have limited accuracy for volume change calculations.
For this reason, researchers are investigating new techniques designed to provide detailed spatial coverage of elevation differences. Techniques with application along coastalregions include softcopy photogrammetry using low-altitudeaerial photography, (OVERTON and FISHER, 1996), small-format aerial mapping with softcopy techniques (HAPKE andRICHMOND, 2000), and LIDAR (LIght Detection And Ranging) (see KRABILL et al., 2000; BROCK et al., 1999; CARTERand SHRESTHA, 1997). These investigations indicate a highdegree of spatial variability in coastal changes and the techniques show promise in improving the quality of coastal morphologic data. However, little published work demonstratestheir accuracy in coastal areas, often due to a lack of data forcomparisons.
Softcopy photogrammetry is the term used to describe thephotogrammetric work flow in a completely digital environ-
208 Judge and Overton
DIGITAL TERRAIN MODEL ACCURACY
(2)
The theoretical accuracy of DTMs produced using photogrammetric techniques is dependent upon aircraft heightduring the aerial survey. The relationship between contouraccuracy and flying height is as follows:
where CI is the contour interval, H is the flying height, andthe C-factor is a constant property of the photogrammetricequipment (for high accuracy softcopy or analytic photogrammetry C ~ 2000) (SLAMA et al., 1980; LIGHT, 1999).
The flying height H is related to the scale of the photography and the camera parameters as:
(1)H
CI = ---C-factor'
where S is the photo scale, f is the focal length of the camera(for a typical aerial survey camera, f = 153 mm), and H isthe flying height (SLAMA et al., 1980). These relationshipsgive an indication of the best possible vertical contour accuracy of a DTM, assuming that the ground control accuracy isbetter than the contour accuracy indicated. If the ground control is not surveyed with a high-accuracy GPS or other precisesystem, it becomes the limiting factor. If the control accuracyis not limiting, however, the theoretical horizontal accuracyof a photogrammetry-derived DTM is approximately twice asgood as the vertical accuracy. HUISING and VAESSEN (1997)note that in bare areas of low relief, such as beaches, a lackof texture in the aerial photos may result in an increase in
inal DTM points and breaklines mayor may not be plottedon the contour maps, depending on the intended use.) In theabsence of the original DTM data points and breaklines,DTMs can be re-created from the contour lines using digitalterrain modeling software. However, these re-sampled datado not capture the original point elevations and have characteristic features that reveal their indirect source (GUTH,1999).
This study evaluates the use of re-sampled digital terrainmodels in the study of coastal topographic change. Dune andbeach profile data extracted from these DTMs developed fromaerial photography are compared with ground survey data at101 transects in Dare County, North Carolina. Dune characteristics and cross sectional areas from heel to toe are compared as well as horizontal position of various shoreface contours. An error analysis of the remotely sensed profiles ispresented with respect to a variety of parameters. The remotely sensed topography is sufficiently accurate to quantifydune areas and dune characteristics such as peak elevation.The comparison of shoreface characteristics, however, revealsdifferences on some profiles; greater disparity was found closer to the ocean. A comparison of volumes calculated usinginterpolation of ground survey transects and the topographicsurface of the DTM between one set of transects is presentedto illustrate the spatial richness of the DTM data, and wegive one typical application of these data for hazard mitigation.
ment (GREVE, 1996). Ground-controlled aerial photography isprocessed into digital orthophotos and elevation models usingstandard photogrammetric techniques. In an orthophoto, thepositional displacement due to terrain relief and camera distortion is removed to create a scaled map. Orthophotos aregenerated from stereo pairs of aerial photos, using standardtechniques based on camera attributes, altitude, aircraft attitude and ground control. When a photogrammetrist createsa digital orthophoto, he or she must collect digital terrainmodel (DTM) points (WELCH, 1989). The DTM is a digitalcartographic representation of the continuous ground surfaceby a large number of selected points and breaklines withknown X, Y, and Z coordinates. A DTM differs from a digitalelevation model (DEM) in that the known points can be nonuniformly spaced, and breaklines are used, providing moreaccuracy in areas of sudden topographic change. The termDEM generally refers to a digital cartographic representationof land elevation at regularly spaced intervals in the X andY directions (casting and northing or longitude and latitude).Contour maps can be generated by interpolation from thiscollection of points, yielding a spatially continuous model ofthe coastal topography. Depending on the grid size used forthe DTM collection phase and the detail in the model, thesetypes of remotely sensed data can have the advantage of providing much greater spatial detail than practical with groundsurveys.
Softcopy photogrammetric techniques and DTMs are beingused in a number of coastal applications, and represent advances in our ability to analyze coastal morphology. The digital processing of DTMs has promoted the development of terrain modeling software tools that allow the user to quicklyand easily quantify topographical features and change. Forperspective, contrast the ease in which volume change cannow be calculated by subtracting two DTMs with previouswork done using a mirror stereoscope and parallax bar tomeasure topographic changes in migrating dunes (HENNIGAR, 1980).
Digital processing has also promoted investigations that attempt to re-create historical topography from archived aerialphotography. BROWN and ARBOGAST (1999) describe a project using digital photogrammetry, archived photography,and DTMs to analyze historic changes in a large coastalMichigan dune field. OVERTON et al. (1996) used aerial photographs dating to 1955 combined with GPS surveyed groundcontrol to reconstruct the terrain of a North Carolina barrierisland beach. These data were compared with 1992 topography and used to calculate long-term erosion rates for thearea. The use of a DTM-derived contour position instead of aphoto-identifiable wet-dry line for shoreline position has beenexamined as well (OVERTON and FISHER, 1996). The DTM isa common format for elevation data; DTMs derived from softcopy photogrammetry can be used in conjunction with datasets developed using other techniques, such as LIDAR orground surveys.
DTMs can also be derived using existing contour maps. Anormal workflow in photogrammetry includes collection ofDTM data directly from a stereo model of the aerial imagery.Often contour lines are interpolated using these data andplotted on the orthophotos as final mapping products. (Orig-
Journal of Coastal Research, Vol. 17, No.1, 2001
Aerial Survey
The aerial survey used to develop the contour maps andorthophotos was conducted February 25, 1995. Control to georeference the photography consisted of 90 targets distributedthroughout the study area. The presence of the water surfaceon the photography limits the terrain model to approximately0.6 m elevation above NAVD 88 (the upper swash zone).
We should note that a six-month difference exists in thetiming of the ground and aerial surveys. These data were notcollected with this particular study in mind but were generously made available when we expressed an interest in thecomparison. Obviously it would be preferable for a comparison to have conducted temporally coincident surveys. Storms
where M is the distance in miles and the vertical point ofclosure (vpoc) is in feet. Typical survey length was about 91m (300 ft) or 183 m total (600 ft) for closure, the horizontalaccuracy is estimated as 0.009 m (0.03 ft), and the verticalaccuracy as 0.004 m (0.012 ft) (DENNIS, 1999) .
A baseline was established along the west right-of-way ofthe beach front highway (NC Highway 12) using eleven NorthCarolina Geodetic Survey markers as reference. Profiles weresurveyed along this baseline at 305 m (l000 ft) intervals. Depending on the location of the road, the profiles may includeone or two beachfront lots, and in a few locations no lots wereincluded as the road runs right next to the dune. Survey dataextend into the surf zone to approximately 1.5 m belowNAVD 88 (low-tide wading depth).
Remote Sensing of Barrier Island Morphology
,21313 ,4013 ,6013
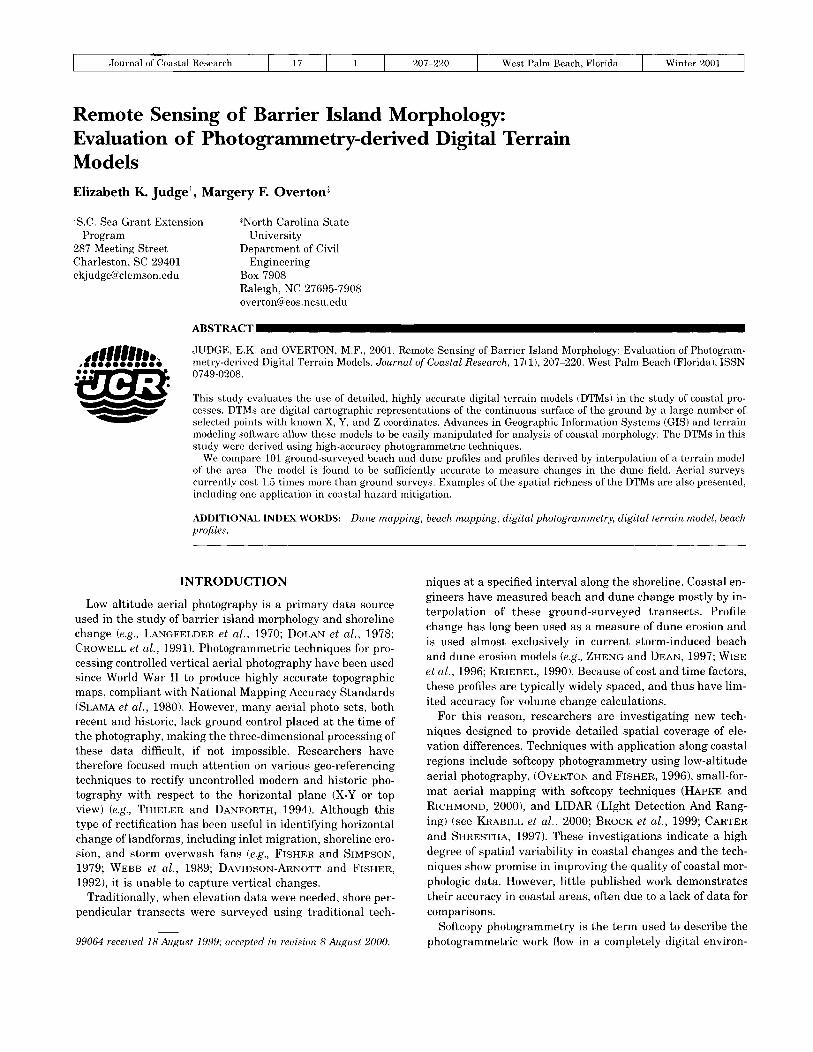
Figure 1. Location map of study area. The study area spans approximately 30 km.
error over the standard contour accuracy. We are especiallyconcerned about this source of error, since we know thatground control panels were not set on the beach face for thecurrent data set.
The DTMs examined in this study were derived from anaerial survey flown at 1220 m (4000 ft) above mean groundsurface (for a photo scale of 1:8000). From equations (1) and(2), theoretical contour accuracy is 0.6 m (2 ft) and horizontalaccuracy is 0.3 m (1 ft).
METHODOLOGY
Study Area and Data
The data discussed here were collected in Dare County,North Carolina (Figure 1). The U. S. Army Corps of Engineers (USACE) provided the data used. The data include aseries of 101 ground surveyed beach profiles, 31 digital contour maps with 0.6 m (2 ft) contour intervals, and 31 digitalorthophoto maps developed using photogrammetric techniques. Both the ground and aerial surveys cover an approximately 32 km (20 mile) section of the coast. Transect linesare spaced at approximately 305 m (1000 ft),
Ground Survey
Technicians performed the ground survey over a 22-day period from 11 July 1994 through 1 August 1994 using a Topcon301 Total Station. The survey was conducted to Second OrderClass II accuracy, indicating a horizontal control survey closure standard ratio of 1:20,000 and a vertical survey closurestandard of
vpoc = 0.35M1I2
209
(3)
Journal of Coastal Research, Vol. 17, No.1 , 2001
210 Judge and Overton
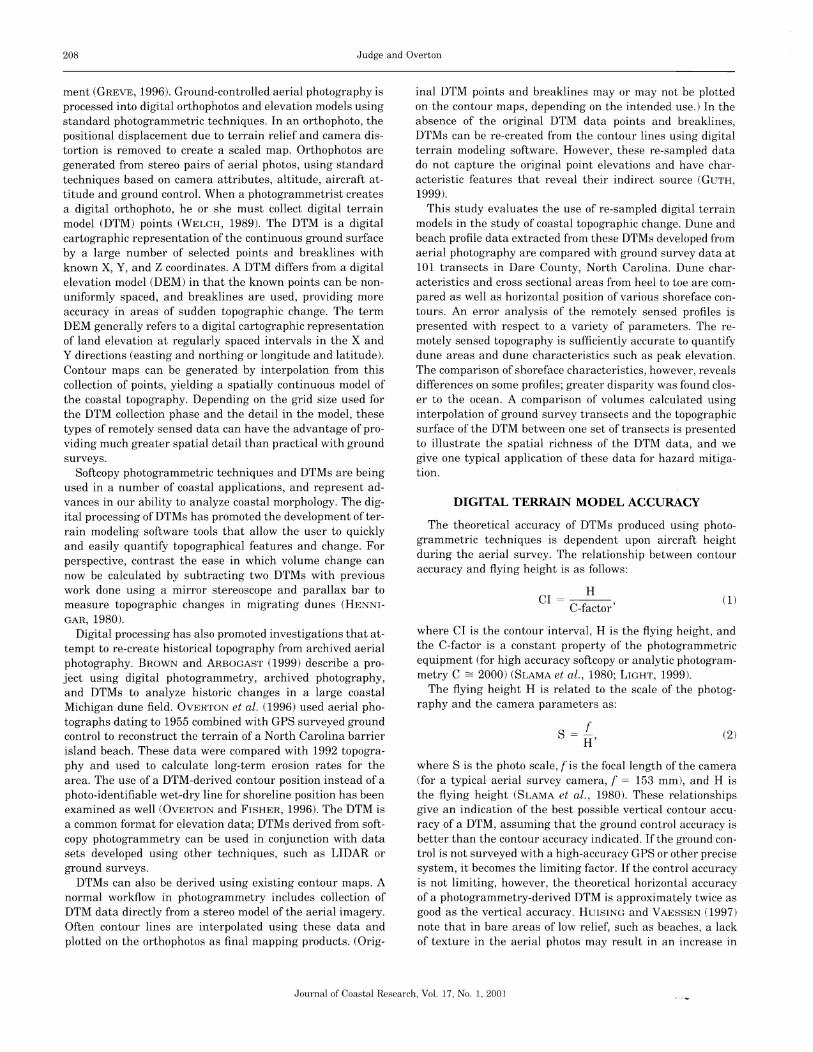
Figure 2. Triangulated Irregular Network (TIN) and profile transects along 1 km of the study area.
during this six-month interval may have caused significantalteration of landforms on the beach and dune. However, thetime scales of significant change in the dune field should belarger than six months, depending on the severity of storms.Errors resulting from the non-synoptic data collection shouldbe smaller than those due to mapping error. This is in contrast to the active shoreface, which has smaller time scalesfor change and where the effects of both the sources of errorshould be apparent.
Methods
The original DTMs developed as part of the photogrammetry process were not available for this analysis. Digitalcontour maps (0.6 m interval) originally created from thoseDTMs were, however. These contour maps were importedinto a terrain modeling software package and converted tonew DTMs. While the original DTM points were expected tohave a vertical accuracy greater than the contour accuracy of0.6 m (2 ft), the re-created DTMs were limited to this accuracy. In addition to the loss of accuracy provided by the original DTM points, GUTH (1999) has observed a disproportionate concentration of points at contour elevations when DTMsare built using this method. Furthermore, the re-sampledDTM lacks the maximum or minimum elevation points thatnecessarily exist within concentric contours.
We compared the series of ground surveyed beach profiles
with profiles generated at corresponding locations using there-created DTMs. The USACE provided the elevation data foreach ground-surveyed profile, as well as a computer designfile mapping the locations of the profile transects. Image filesof the orthophoto maps were also used for reference. Geographic Information Systems (GIS) software was used tomerge the data sets.
We used each re-created DTM design file to generate a Triangulated Irregular Network (TIN) (Figure 2). The TIN consists of a series of non-overlapping triangles connectingpoints of known elevation. The terrain modeling software algorithm linearly interpolates elevations along the edges ofthe triangles. Where points are the most dense, the originalcontours were closely spaced -in this case on the beach anddune. The triangles in that area are smaller and tighter. Toextract the profile elevations, we referenced the computer filemapping the locations of the ground surveyed transects to theTIN file so that the lines representing the profile transectsoverlaid the TIN. The transects were then projected onto thetriangulated surface. In the projection algorithm, an elevation point is generated wherever a transect line intersects atriangle. These elevation points may be actual DTM points(corners of triangles) or, more likely, they may be points alongwhich the elevation has been interpolated between two DTMpoints (edges of triangles).
We first compared the data using a qualitative inspection
Journal of Coastal Research, Vol. 17, No.1, 2001
Remote Sensing of Barrier Island Morphology 211
of plots of both profiles for each transect. Additional analyseswere conducted to quantify the differences between the twosets of profiles as discussed in the following section.
RESULTS AND DISCUSSION
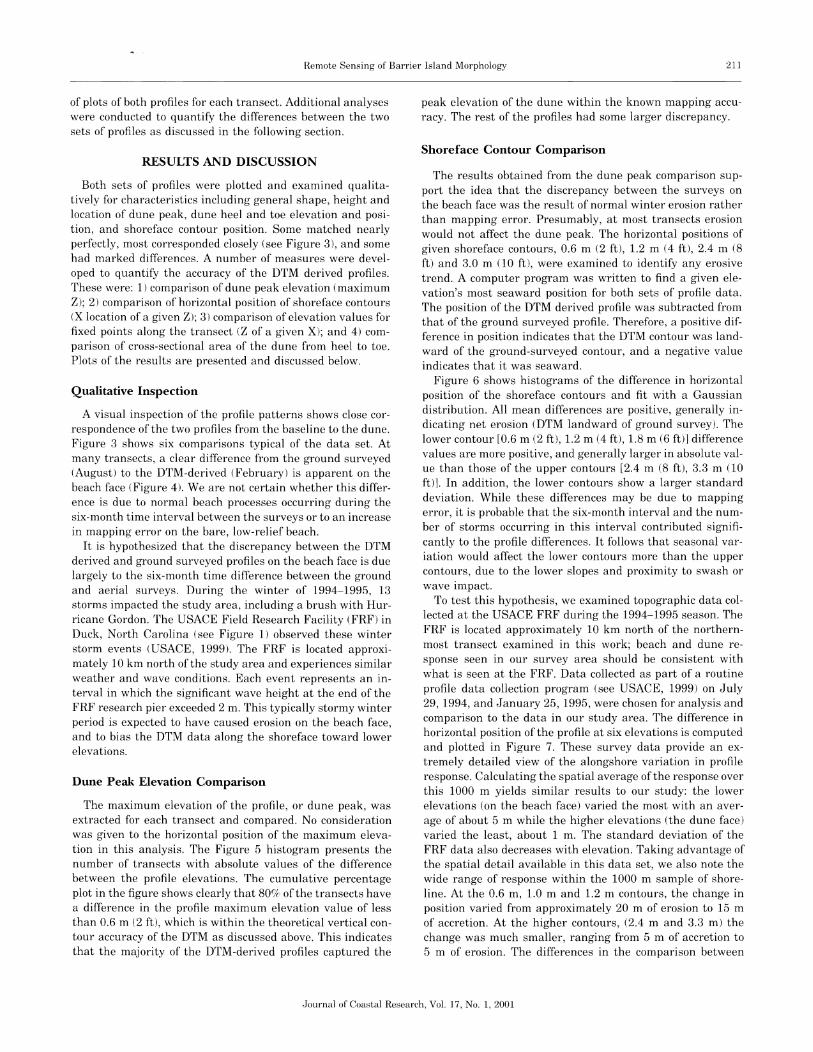
Both sets of profiles were plotted and examined qualitatively for characteristics including general shape, height andlocation of dune peak, dune heel and toe elevation and position, and shoreface contour position. Some matched nearlyperfectly, most corresponded closely (see Figure 3), and somehad marked differences. A number of measures were developed to quantify the accuracy of the DTM derived profiles.These were: 1) comparison of dune peak elevation (maximumZ); 2) comparison of horizontal position of shoreface contours(X location of a given Z); 3) comparison of elevation values forfixed points along the transect (Z of a given X); and 4) comparison of cross-sectional area of the dune from heel to toe.Plots of the results are presented and discussed below.
Qualitative Inspection
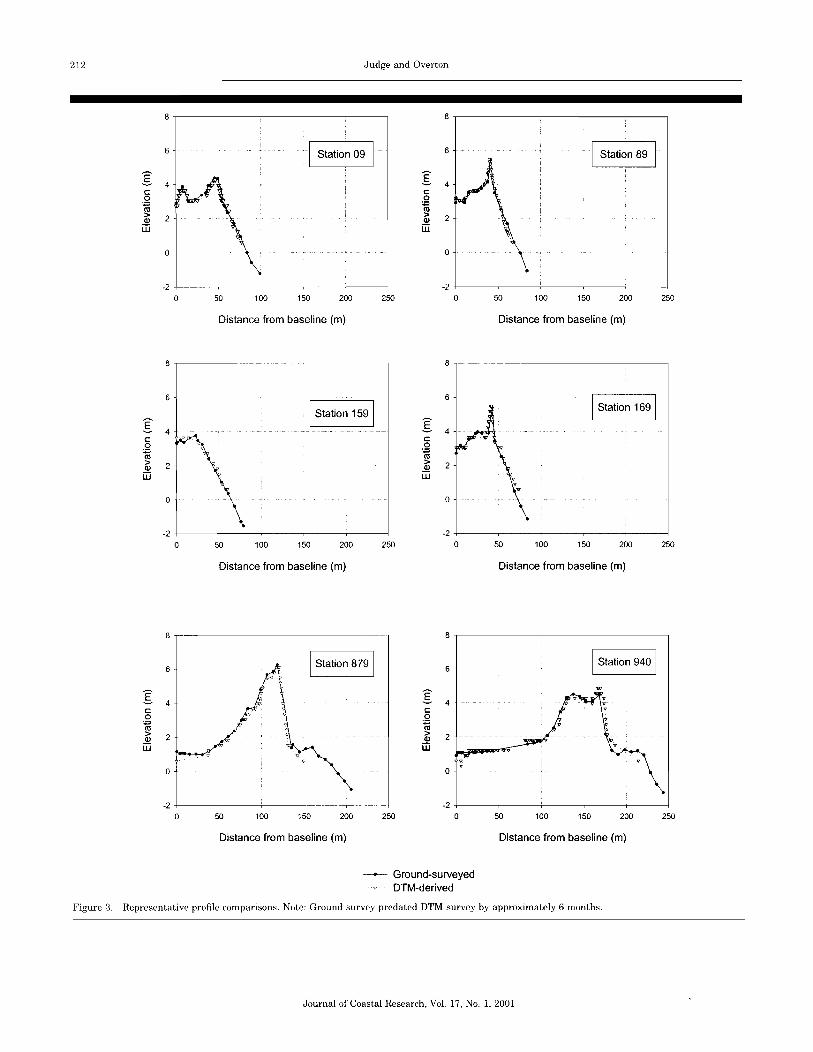
A visual inspection of the profile patterns shows close correspondence of the two profiles from the baseline to the dune.Figure 3 shows six comparisons typical of the data set. Atmany transects, a clear difference from the ground surveyed(August) to the DTM-derived (February) is apparent on thebeach face (Figure 4). We are not certain whether this difference is due to normal beach processes occurring during thesix-month time interval between the surveys or to an increasein mapping error on the bare, low-relief beach.
It is hypothesized that the discrepancy between the DTMderived and ground surveyed profiles on the beach face is duelargely to the six-month time difference between the groundand aerial surveys. During the winter of 1994-1995, 13storms impacted the study area, including a brush with Hurricane Gordon. The USACE Field Research Facility (FRF) inDuck, North Carolina (see Figure 1) observed these winterstorm events (USACE, 1999). The FRF is located approximately 10 km north of the study area and experiences similarweather and wave conditions. Each event represents an interval in which the significant wave height at the end of theFRF research pier exceeded 2 m. This typically stormy winterperiod is expected to have caused erosion on the beach face,and to bias the DTM data along the shoreface toward lowerelevations.
Dune Peak Elevation Comparison
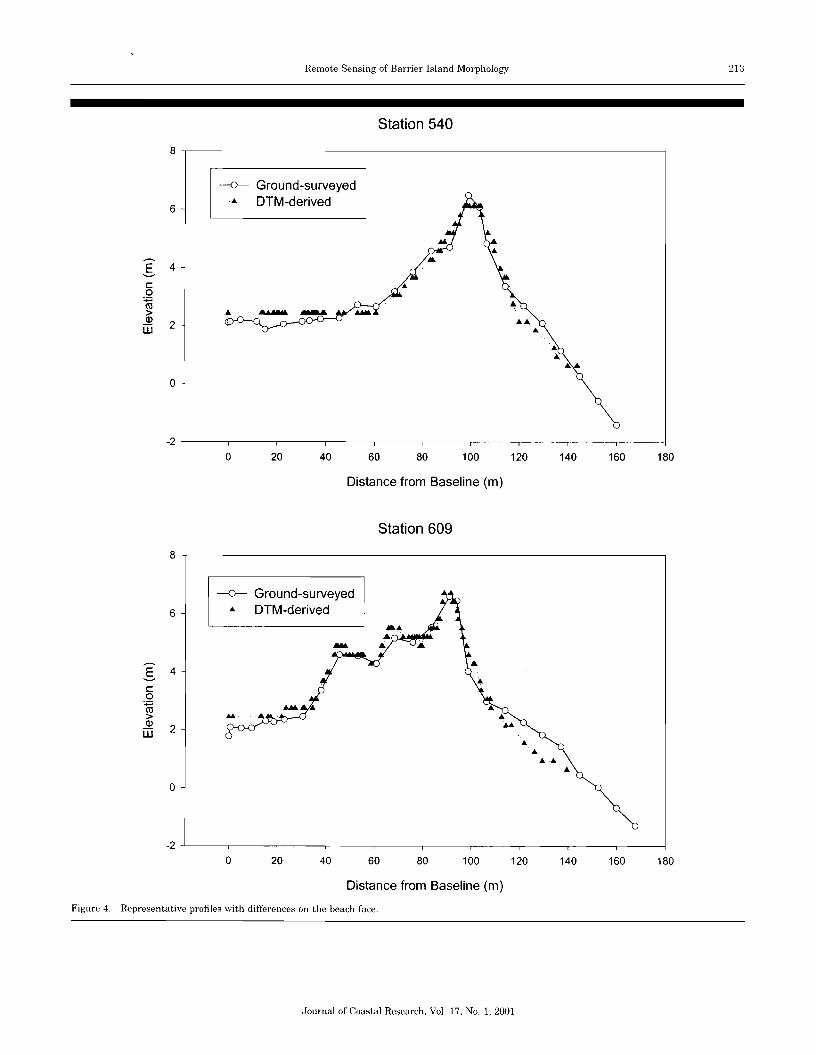
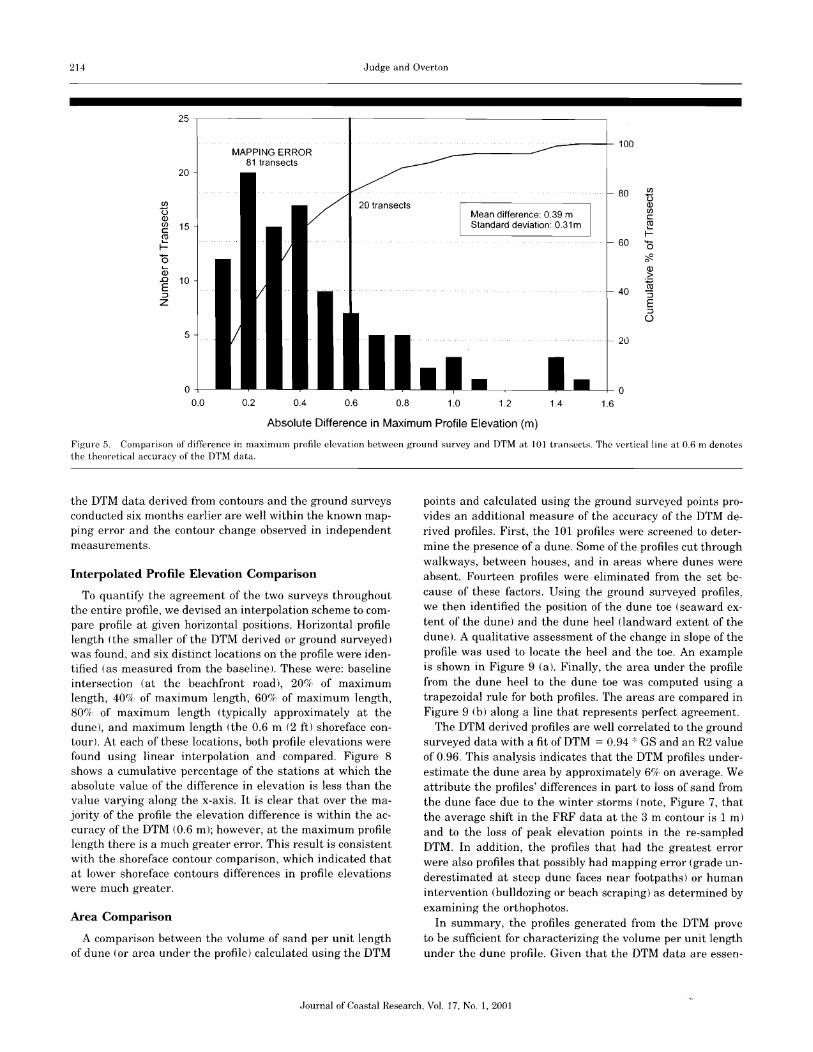
The maximum elevation of the profile, or dune peak, wasextracted for each transect and compared. No considerationwas given to the horizontal position of the maximum elevation in this analysis. The Figure 5 histogram presents thenumber of transects with absolute values of the differencebetween the profile elevations. The cumulative percentageplot in the figure shows clearly that 80{k) of the transects havea difference in the profile maximum elevation value of lessthan 0.6 m (2 ft) , which is within the theoretical vertical contour accuracy of the DTM as discussed above. This indicatesthat the majority of the DTM-derived profiles captured the
peak elevation of the dune within the known mapping accuracy. The rest of the profiles had some larger discrepancy.
Shoreface Contour Comparison
The results obtained from the dune peak comparison support the idea that the discrepancy between the surveys onthe beach face was the result of normal winter erosion ratherthan mapping error. Presumably, at most transects erosionwould not affect the dune peak. The horizontal positions ofgiven shoreface contours, 0.6 m (2 ft), 1.2 m (4 ft), 2.4 m (8ft) and 3.0 m (10 ft), were examined to identify any erosivetrend. A computer program was written to find a given elevation's most seaward position for both sets of profile data.The position of the DTM derived profile was subtracted fromthat of the ground surveyed profile. Therefore, a positive difference in position indicates that the DTM contour was landward of the ground-surveyed contour, and a negative valueindicates that it was seaward.
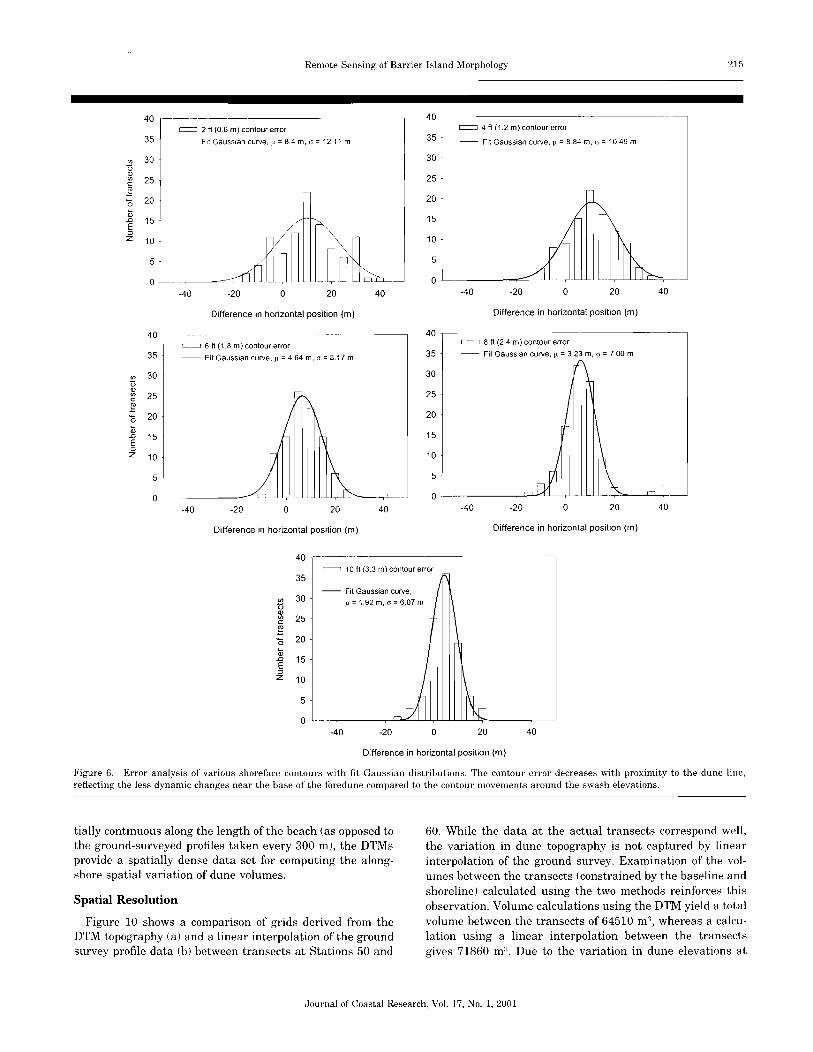
Figure 6 shows histograms of the difference in horizontalposition of the shoreface contours and fit with a Gaussiandistribution. All mean differences are positive, generally indicating net erosion (DTM landward of ground survey). Thelower contour [0.6 m (2 ft), 1.2 m (4 ft), 1.8 m (6 ft)] differencevalues are more positive, and generally larger in absolute value than those of the upper contours [2.4 m (8 ft), 3.3 m (10ft)]. In addition, the lower contours show a larger standarddeviation. While these differences may be due to mappingerror, it is probable that the six-month interval and the number of storms occurring in this interval contributed significantly to the profile differences. It follows that seasonal variation would affect the lower contours more than the uppercontours, due to the lower slopes and proximity to swash orwave impact.
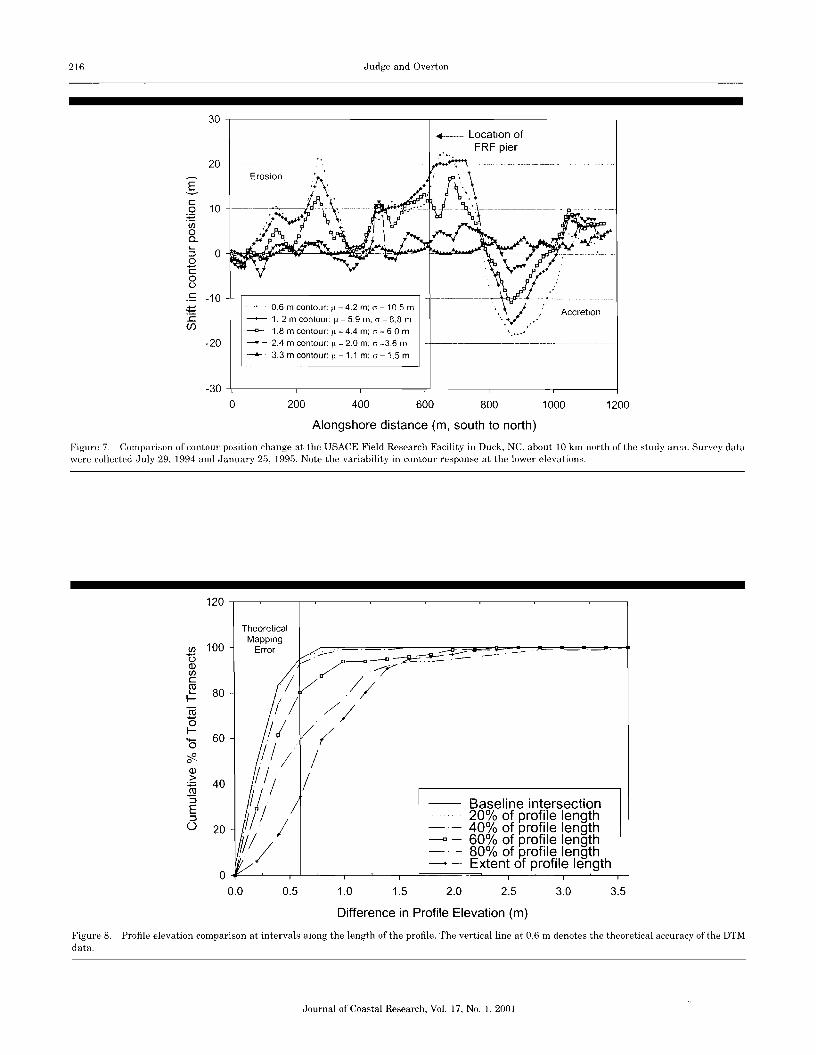
To test this hypothesis, we examined topographic data collected at the USACE FRF during the 1994-1995 season. TheFRF is located approximately 10 km north of the northernmost transect examined in this work; beach and dune response seen in our survey area should be consistent withwhat is seen at the FRF. Data collected as part of a routineprofile data collection program (see USACE, 1999) on July29,1994, and January 25,1995, were chosen for analysis andcomparison to the data in our study area. The difference inhorizontal position of the profile at six elevations is computedand plotted in Figure 7. These survey data provide an extremely detailed view of the alongshore variation in profileresponse. Calculating the spatial average of the response overthis 1000 m yields similar results to our study: the lowerelevations (on the beach face) varied the most with an average of about 5 m while the higher elevations (the dune face)varied the least, about 1 m. The standard deviation of theFRF data also decreases with elevation. Taking advantage ofthe spatial detail available in this data set, we also note thewide range of response within the 1000 m sample of shoreline. At the 0.6 m, 1.0 m and 1.2 m contours, the change inposition varied from approximately 20 m of erosion to 15 mof accretion. At the higher contours, (2.4 m and 3.3 m) thechange was much smaller, ranging from 5 m of accretion to5 m of erosion. The differences in the comparison between
Journal of Coastal Research, Vol. 17, No.1, 2001
212 Judge and Overton
8 8
6 I Station 09 I 6 I Station 89 I
g4
g4
c: c:0 0
~ ~> 2 > 2Q) Q)
m [jj
0 0
-2 -20 50 100 150 200 250 0 50 100 150 200 250
Distance from baseline (m) Distance from baseline (m)
8 8
6 6
g g4 4
c c:.2 0
«; ~> 2 > 2Q) Q)
m m
0 0
-2 -20 50 100 150 200 250 0 50 100 150 200 250
Distance from baseline (m) Distance from baseline (rn)
8 8
6 6
g4
g4
c: c:0 0
~ ~> 2 > 2Q) Q)
m mv
0 •0
-2 -20 50 100 150 200 250 0 50 100 150 200 250
Distance from baseline (m) Distance from baseline (rn)
-- Ground-surveyedDTM-derived
Figure 3. Representative profile comparisons. Note: Ground survey predated DTM survey by approximately 6 months.
Journal of Coastal Research, Vol. 17, No.1, 2001
Remote Sensing of Barrier Island Morphology 213
Station 540
8,-------------------------------------,
-0--- Ground-surveyed.... DTM-derived
6
.s 4
c0
~>Q)
2UiJro:....
III ....
0
-2
0 20 40 60 80 100 120 140 160 180
Distance from Baseline (m)
Station 609
8
-0--- Ground-surveyed6 .... DTM-derived
.s 4....
c0
~>Q)
2tn....
............
....
0
-2 -'-------,------,----,-------,---,-------,----.--------,------,-------1
o 20 40 60 80 100 120 140 160 180
Distance from Baseline (m)
Figure 4. Representative profiles with differences on the beach face.
Journal of Coastal Research, Vol. 17, No.1, 2001
214 Judge and Overton
----1--0
1.61.41.21.00.80.60.40.2
o0.0
25
100MAPPING ERROR
81 transects20
80 (/)
t3(/) 20 transects Q)
t5 Mean difference: 0.39 m(j)
Q.) c::if) 15 Standard deviation: 0.31m rnc:: ~rn~ 60 '+-
0'+- ~0 0
CD Q)>.D 10~E 40:J "5
z E:::Jo
520
Absolute Difference in Maximum Profile Elevation (m)
Figure 5. Comparison of difference in maximum profile elevation between ground survey and DTM at 101 transects. The vertical line at 0.6 m denotesthe theoretical accuracy of the DTM data.
the DTM data derived from contours and the ground surveysconducted six months earlier are well within the known mapping error and the contour change observed in independentmeasurements.
Interpolated Profile Elevation Comparison
To quantify the agreement of the two surveys throughoutthe entire profile, we devised an interpolation scheme to compare profile at given horizontal positions. Horizontal profilelength (the smaller of the DTM derived or ground surveyed)was found, and six distinct locations on the profile were identified (as measured from the baseline). These were: baselineintersection (at the beachfront road), 20lfr, of maximumlength, 40%, of maximum length, 600/0 of maximum length,80 f1!l-; of maximum length (typically approximately at thedune), and maximum length (the 0.6 m (2 ft) shoreface contour). At each of these locations, both profile elevations werefound using linear interpolation and compared. Figure 8shows a cumulative percentage of the stations at which theabsolute value of the difference in elevation is less than thevalue varying along the x-axis. It is clear that over the majority of the profile the elevation difference is within the accuracy of the DTM (0.6 m); however, at the maximum profilelength there is a much greater error. This result is consistentwith the shoreface contour comparison, which indicated thatat lower shoreface contours differences in profile elevationswere much greater.
Area Comparison
A comparison between the volume of sand per unit lengthof dune (or area under the profile) calculated using the DTM
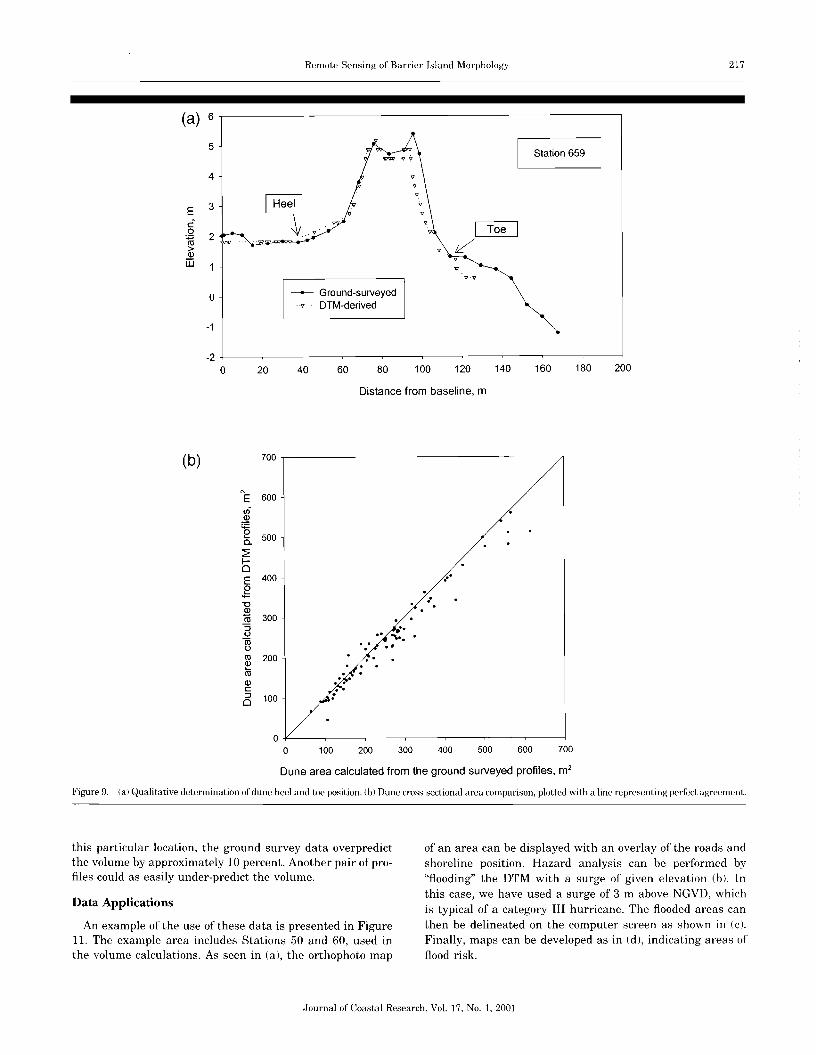
points and calculated using the ground surveyed points provides an additional measure of the accuracy of the DTM derived profiles. First, the 101 profiles were screened to determine the presence of a dune. Some of the profiles cut throughwalkways, between houses, and in areas where dunes wereabsent. Fourteen profiles were eliminated from the set because of these factors. Using the ground surveyed profiles,we then identified the position of the dune toe (seaward extent of the dune) and the dune heel (landward extent of thedune). A qualitative assessment of the change in slope of theprofile was used to locate the heel and the toe. An exampleis shown in Figure 9 (a). Finally, the area under the profilefrom the dune heel to the dune toe was computed using atrapezoidal rule for both profiles. The areas are compared inFigure 9 (b) along a line that represents perfect agreement.
The DTM derived profiles are well correlated to the groundsurveyed data with a fit of DTM = 0.94 * GS and an R2 valueof 0.96. This analysis indicates that the DTM profiles underestimate the dune area by approximately 6fj(, on average. Weattribute the profiles' differences in part to loss of sand fromthe dune face due to the winter storms (note, Figure 7, thatthe average shift in the FRF data at the 3 m contour is 1 m)and to the loss of peak elevation points in the re-sampledDTM. In addition, the profiles that had the greatest errorwere also profiles that possibly had mapping error (grade underestimated at steep dune faces near footpaths) or humanintervention (bulldozing or beach scraping) as determined byexamining the orthophotos.
In summary, the profiles generated from the DTM proveto be sufficient for characterizing the volume per unit lengthunder the dune profile. Given that the DTM data are essen-
Journal of Coastal Research, Vol. 17, No.1, 2001
Remote Sensing of Barrier Island Morphology 215
40
40
20
20
o
o
-20
-20
Difference in horizontal position (m)
-40
= 8 It (2.4 m) contourerror-- Fit Gaussian curve, j.1:;: 3.23 m, cr:;: 7.00 m
-40
= 41t(1.2m)contourerror
-- Fit Gaussian curve, ~l:;: 8.84 m, (J:;: 10.46 m
25
30
35
40,---------------------,
20
40
40
35
30
25
20
15
10
5
:1.-___ 04020
20
o
o
-20
-20
Difference in horizontal position (m)
-40
= 2 It (0.6 m) contourerror-- Fit Gaussian curve, p :;: 8.4 m, a :;: 12.11 m
-40
--_..__._---------------
o
5
25
30
10
40 1---------- .... -------~-.- ..--c==J 6 ft (1.8 m) contour error
35 -- FitGaussian curve,~ ; 4.64 m, (J ; 8.17 m
20
15
'"uOJ
'"Cjg'0;;;.DE:::lZ
40
35
'" 30UOJ
'" 25 ]cjg'0 20;;;.D 15E:::lZ 10
5
0
Difference in horizontal position (m) Difference in horizontal position (m)
40 ._._------
= 10 ft (3.3 m)contourerror35
-- FitGaussian curve,<J) 30
~; 1.92rn,(J; 6.07 mUQ)<J) 25cjg'5 20;;;.D 15E:::lZ 10
5
0-40 -20 o 20 40
Difference in horizontal position (m)
Figure 6. Error analysis of various shoreface contours with fit Gaussian distributions. The contour error decreases with proximity to the dune line,reflecting the less dynamic changes near the base of the foredune compared to the contour movements around the swash elevations.
tially continuous along the length of the beach (as opposed tothe ground-surveyed profiles taken every 300 m), the DTMsprovide a spatially dense data set for computing the alongshore spatial variation of dune volumes.
Spatial Resolution
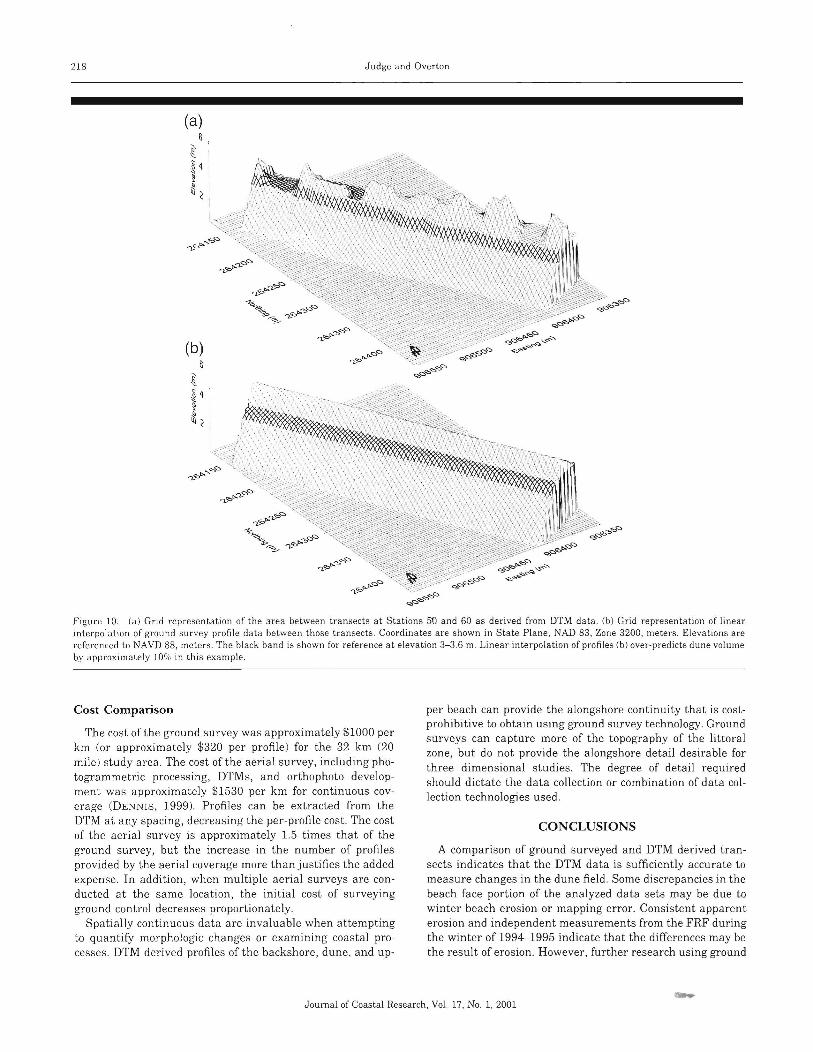
Figure 10 shows a comparison of grids derived from theDTM topography (a) and a linear interpolation of the groundsurvey profile data (b) between transects at Stations 50 and
60. While the data at the actual transects correspond well,the variation in dune topography is not captured by linearinterpolation of the ground survey. Examination of the volumes between the transects (constrained by the baseline andshoreline) calculated using the two methods reinforces thisobservation. Volume calculations using the DTM yield a totalvolume between the transects of 64510 m", whereas a calculation using a linear interpolation between the transectsgives 71860 m-, Due to the variation in dune elevations at
Journal of Coastal Research, Vol. 17, No.1, 2001
216 Judge and Overton
30 ,-------------------,--------------~
20--------Erosion
. 0.6 m contour: ~l ~ 4.2 m; " ~ 10.5 m~ 1. 2 m contour: Il ~ 5.9 m; ,,~8.8 m~ 1.8 m contour: Il =4.4 m; " = 6.0 m- - 2.4 m contour: Il = 2.0 m; o ~3.6 m--. 3.3 m contour: Il~ 1.1 m; c ~ 1.5 m
.-- Location of. _. FRF pier
-20 -
g§ 10:E<f)oa.
-30 +-----,------,--------,-"-----,-----,--------1
o 200 400 600 800 1000
Alongshore distance (rn, south to north)
1200
Figure 7. Comparison of contour position change at the USACE Field Research Facility in Duck, NC, about 10 km north of the study area. Survey datawere collected July 29, 1994 and January 25, 1995. Note the variability in contour response at the lower elevations.
TheoreticalMapping
Error V~· .. ~--- -'I~/7~~--'-
./II //Ii //1/ .:
/t: /. /~/ / --- Baseline intersection
yl/ I 20% of profile length_.- 40% of profile length
1/1///---a - 60% of profile length_.- 80% of Rrofile length
~. ~- Extent of profile length
120
<f) 1001:5Q)<f)C<Il
80l-
I--ro(5I--
60--0~0
Q)> 40~
"'5E::::lo 20
o0.0 0.5 1.0 1.5 2.0 2.5 3.0 3.5
Difference in Profile Elevation (m)
Figure 8. Profile elevation comparison at intervals along the length of the profile. The vertical line at 0.6 m denotes the theoretical accuracy of the DTMdata.
Journal of Coastal Research, Vol. 17, No.1, 2001
Remote Sensing of Barrier Island Morphology 217
(a) 6
5Station 659
4
E 3
CI Toe I0
2~ i/> v.Q)
m ..0 Ground-surveyed
DTM-derived
-1
-20 20 40 60 80 100 120 140 160 180 200
Distance from baseline, m
(b) 700
N
E 600<IiQ)
~ 500a.:2:fo-0E 400 ....g .."02 300Cll:5 •..0 "\.. .Cii .. .'0Cll 200 ..~ .Cll ...Q) ..c :..:::J 1000
7006005004003002001000-1L--,------~--____,_---,-----~--.,__-_____1
o
Dune area calculated from the ground surveyed profiles, m2
Figure 9. (a) Qualitative determination of dune heel and toe position. (b) Dune cross-sectional area comparison, plotted with a line representing perfect agreement.
this particular location, the ground survey data overpredictthe volume by approximately 10 percent. Another pair of profiles could as easily under-predict the volume.
Data Applications
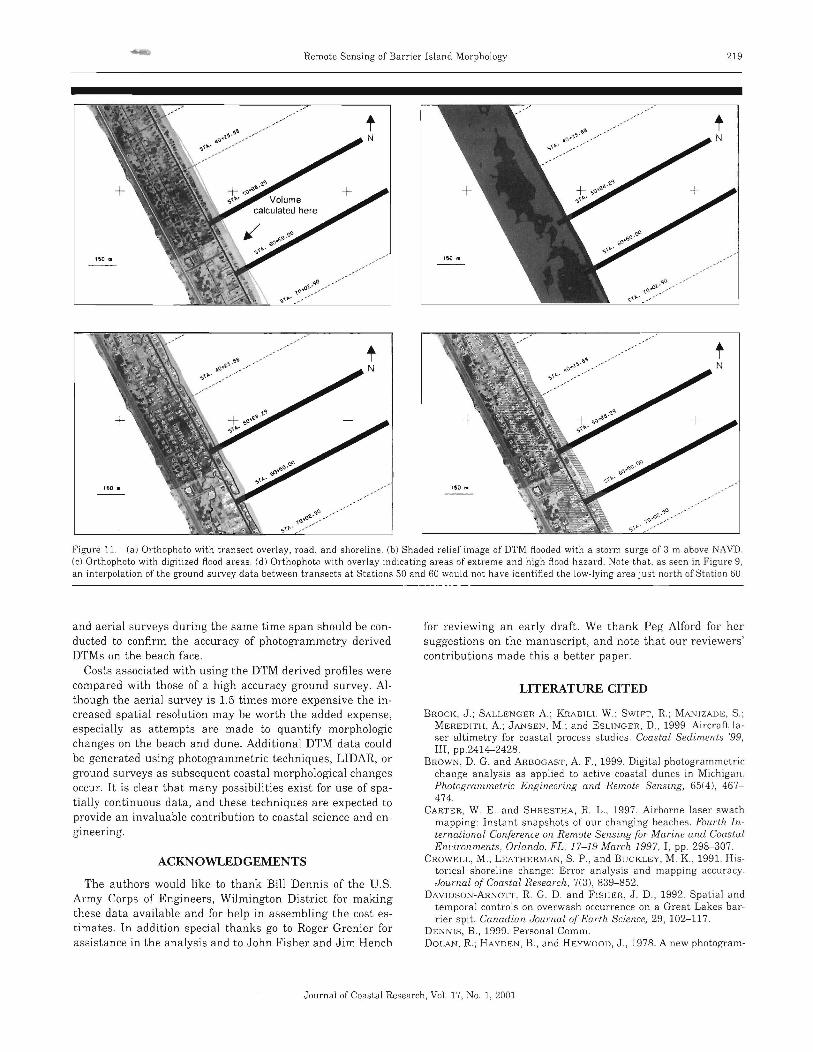
An example of the use of these data is presented in Figure11. The example area includes Stations 50 and 60, used inthe volume calculations. As seen in (a), the orthophoto map
of an area can be displayed with an overlay of the roads andshoreline position. Hazard analysis can be performed by"flooding" the DTM with a surge of given elevation (b). Inthis case, we have used a surge of 3 m above NGVD, whichis typical of a category III hurricane. The flooded areas canthen be delineated on the computer screen as shown in (c).Finally, maps can be developed as in (d), indicating areas offlood risk.
Journal of Coastal Research, Vol. 17, No.1, 2001
218 Judge and Overton
Figure 10. (a) Gr id re prese n tat ion of the a rea bet ween tra nsect s at Stations 5tl a nd 60 as deri ved from DTM da ta . (b) Grid represen tation of line arinte rp olation of gro und survey profile data between those transects. Coordina tes a re shown in Sta te Plane, NAD 83 , Zone 3200, meter s . Elevation s arerefer enced to NAVD 88, meters. Th e black band is show n for refer en ce a t eleva tion 3-3.6 m. Linear interpolation of profil es (b) ove r -predicts dune volumeby ap proximate ly 10% in thi s example.
Cost Comparison
The cost of th e ground survey was approximately $1000 perkm (or approx imately $320 per profile) for the 32 km (20mil e) st udy area . The cost of the aerial survey, including photogrammetric proce ssin g, DTMs, and orthophoto development wa s approximately $1530 per km for continuous cover age (DENNIS , 1999 ). Profil es can be extracted from theDTM at any spa cing, decreasing the per-profile cost. Th e costof the aerial survey is approximately 1.5 times that of theground survey, but the increase in the number of profile sprovided by the aerial coverage mor e than justifies the addedexpense. In addition, wh en multiple aerial surveys are conducted at the sa me location , the initial cost of surveyingground control decre ases proportionately.
Spatially continuous data a re invaluable when attemptingto qu antify morphologic changes or examining coastal processes. DTM derived profil es of the backshore, dune, and up-
per beach ca n provide the alongshore continuity that is cost prohibitive to obtain using ground surv ey technology. Groundsurveys can capture mor e of the topography of the littoralzone , but do not pro vide the alon gshore detail desirable forthree dimensional s tudies. Th e degree of detail requiredshould dictate th e data collect ion or combination of da ta collection technologies used.
CONCLUSIONS
A comparison of ground surveyed and DTM derived transects indi cates that the DTM data is sufficiently accurate tomeasure changes in the dune field. Some discrepancies in thebeach face portion of the analyzed data sets ma y be due towinter beach erosion or mapping error. Consi stent a pparenterosion and ind ependent measurements from the FRF duringth e winter of 1994-1995 indicate that th e differences may beth e resul t of ero sion. However, further research using ground
J ournal of Coastal Research, Vol. 17, No. 1, 2001
Remote Sensing of Barrier Island Morphology 219
Figure 11. (a) Orthophoto with transect overlay, road, and shoreline. (b) Shaded relief image of DTM flooded with a storm surge of 3 m abo ve NAYD.(c) Orthophoto with digitized flood areas. (d) Orthophoto with overlay indicating areas of extreme and high flood hazard. Note that, as seen in Figure 9,an interpolation of the ground survey data between transects at Stations 50 and 60 would not have identified the low-lying area just north of Station 60.
and aerial surveys during the same time span should be conducted to confirm the accuracy of photogrammetry derivedDTMs on the beach face.
Costs associated with using the DTM derived profiles werecompared with those of a high accuracy ground survey. Although the aerial survey is 1.5 times more expensive the increased spatial resolution may be worth the added expense,especially as attempts are made to quantify morphologicchanges on the beach and dune. Additional DTM data couldbe generated using photogrammetric techniques, LIDAR, orground surveys as subsequent coastal morphological changesoccur. It is clear that many possibilities exist for use of spatially continuous data, and these techniques are expected toprovide an invaluable contribution to coastal science and engineering.
ACKNOWLEDGEMENTS
The authors would like to thank Bill Dennis of the U.S.Army Corps of Engineers, Wilmington District for makingthese data available and for help in assembling the cost estimates. In addition special thanks go to Roger Grenier forassistance in the analysis and to John Fisher and Jim Hench
for reviewing an early draft. We thank Peg Alford for hersuggestions on the manuscript, and note that our reviewers'contributions made this a better paper.
LITERATURE CITED
BROCK, J.; SALLENGER A.; KRABILL W.; SWIFT, R. ; MANIZAD", S .;MEREDITH, A.; JANSEN, M.; and ESLINGER, D., 1999. Air craft laser altimetry for coastal process studies. Coastal Sediments '99,III, pp.2414-2428.
BROWN, D. G. and ARBOGAST, A. F., 1999. Digital photogrammetricchange analysis as applied to active coastal dunes in Michigan.Photogrammetric E ngineering and Remote Sensing, 65(4 ), 467474.
CARTER, W. E. and SHRESTHA, R. L. , 1997. Airborne laser swathmapping: Instant snapshots of our changing beaches . Fourth International Conference on Remote Sensing {or Marine and CoastalEnvironments. Orlando. FL, 17-19 March 1997, I , pp. 298-307.
CROWELL, M.; LEATHERMAN, S. P., and BUCKLEY,M. K. , 1991. Hi storical shoreline change: Error analysis and mapping accuracy.Journal of Coastal Research, 7(3) , 839- 852.
DAVIDSON-ARNOTT, R. G. D. and FISHER, J. D., 1992. Spatial andtemporal controls on overwash occurrence on a Great Lakes harrier spit. Canadian Journal o] Ea rth Science, 29 , 102-117.
DENNIS, B., 1999. Personal Comm.DOLAN. R.; HAVDEN , B., and HEYWOOD, J., 1978. A new photogram-
Journal of Coastal Research , Vol. 17, No.1, 2001
220 Judge and Overton
metric method for determining shoreline ero sion. Coastal Engineering, 2, 21-39.
FISHEll, J. J. and S IMPSO;'oJ , E. J. , 1979 . Washover and tidal sedimentation rates as environme nta l factors in development of atransgressive barrier shoreline. Coastal Research Symposium1978 IBoston ). Barrier islan ds from the GulfofSt . Lawrence to theGul f of Mexico, edited by St ephen P. Leatherman , pp . 127-148.
GIlEVE, C. W., En. , 1996 . Digital Photogrammetry: An Addendum tothe Manual of Photogram.metry. Bethesd a, MD: American Societyof Photogrammetry and Remote Sensing, 247p.
GIl'I'H, P. L., 1999 . Contour line "ghosts" in USGS level 2 DEMs.Photogram metric Eng ineering and Remot e Sensing, 65(3 ), 298296 ,
HAPKE, C, J, and RICH:YIONIl, B. M., 2000 , Monitoring beach morphology chan ges using small-format aeri al photography and digital softcopy photogrammetry. Environmental Geosciences, in press.
Ih :NNI<1 AI{, H. F" 1980 , Qu antification of changes in coastal topography usin g simple parallax measurements. Photogram metric En f{ineerinf{ and Remote Sensin g, 46(1), 71-75.
HUISI;'oJ(; , E. J . and VA1':SS~;N , E. M. J., 1997. Evaluating laser scanning and other techniques to obtain elevation data on the coastalzone. Fourth Int ernational Conference on Remot e Sen sing for Marine and Coastal En vironm ents, Orlando, FL. 17-19 March 1997,II, pp. 510-517.
KI{AB ILL, W. B.; WRI<1HT, C. W.; SWIFT, R.N. ; FRlm~;]{ICK , E.B.;MAi'IY.AIlE, S.S.; YU:\(; EIl, J .K.; MAI{'\'IN, C.F.; SONNTAG, J.G. ;DUFFY, M.; HIlLSLANIlEI{ , W., and BI{()cK, J.C., 2000. AirborneLaser Mapping of Assateague National Seashore Beach. Journalof Photogrametric Engine ering and Remote Sensing, 66(1 ), 65-71.
KIHEBEL, D. L., 1990. Advances in numerical modeling of dune erosion Proc, 22mlint. Con]. Coastal Engr. , pp . 2305-2317 .
LAN(;FELllI.;\{ , L. J .; STAFFOIW, D. B., and A\IEI i' , M., 1970 . Coastale rosion in North Carolina . Journal of the Waterways and HarborsDivision IASCE), !J6, 53 1-545.
LI(;HT, D. L., 1999. Cofactor for softcopy photogrammetry. Photogram metric Engin eering and Remote Sensin g, 65(6 ), 667-669.
OVERTON, M. F. and FISHEI{, J. S. , 1996. Sho reline analysis usin gdigital photogrammetry. Proc. 25th Int . Con]. Coastal Engrg; pp .3750- 3761.
OVEIlTON, M. F. ; PI·;TI{I NA, C., and FIsHEll, J. S., 1996. Determiningshoreline position using hi storical photography and digital soft copy photogrammetry. ASPHS I ACSM An nual Convent ion & Exposition, 1, 512-513.
SLAMA, C. C.; THEUIU;R, C., a nd HENIlIKSEN, S. W., Eds., 1980.Manual of Photogrammetry. Falls Church, VA: American Societyof Photogrammetry, 1056 p.
THIELER, E. R. and DANFOIrI'H , W. W., 1994. Historical ShorelineMapping .1. Improving Techniques and Redu cing Positioning Error s . Journal of Coastal Research , lOt3 l, 549-563.
USACE, 1999 . Storms a t th e FRF. http: / /www.j.rfusace.arm y.mi l!storme .litml, World Wide Web Site for th e US Army Engineer Waterways Experiment St ation, Field Research Fa cility. Home pageat http: / /www.j.rfusace.army.mil.
WEBB, C. K.; STOW, D. A , and BAI{()N, K. S., 1989. Morphologicre sponse of an inlet, barrier bea ch sys te m to a major storm. Shore& Beach, 57(4), 37-40.
WI'I ,CH, R., 1989 . Desktop mapping with personal computers. Photogrammetric Engineering and Remote Sensing, 55(11), 16511662.
WISE, R. A.; SMITH, S. J ., and LAI{sON, M., 1996 . SBEACH: nume rical model for simulating storm -induced beach change. CERC-89-9Rept. 4. U.S. Arm y Engineer Waterways Exp eriment St ation,Vicksburg, Miss., 140p.
ZIIEN(;, J . and DEAN, R. G., 1997 . Numerical model s and intercomparison s of beach profile evolution. Coastal Engi neering , 30(3-4),169-201.
RESUMEN (en espanol:Est o proy ccto avalua c l usn de modolos digitales del terrene (1vl D'fs) muy pre cisos en e l es tudio de los procosos costcros . Los MDTs son re presentaciones cartograficosdel superficie del terrene por un gran nurnero de puntos con coorden ad as X, Y, y Z que se sa ben. Los avan ces por los prograrnas de siste mas geognificas de informac ionpermiten que Xl' ma ni pula n facilmc ntc los rnodelos para e l anali sis rnorfodinamico de la cost a . Los 1\1D'1's se pu ed en crear utili zando una variedad de met.odos . inclu sola agr imons ura . el lid ar, y la fotogramet.na digit al. Los MDTs en es te es tudio se h icieron con las t ecni cas de la fotog ram etrta digit al.
Una compa racion se haec entre tInOS 101 perfiles medidos por 13 agr irnens ura Y los rnismo s med idos por rnanipulacion dell\1DT del urea . El modelo se encuentrasuficiente mc ntc pr ecise para mod ir los ca rnbios en la zona de las duna s . Una comparacion de los costo s de los metod os de med ir indica que los cost os de Infotogrumetrta son 1.5 voces mas que los de 13 agrimen sura trad icion al. Unos ejernplos de aplicaciones de los MDTs se pr esentan.
Journal of Coast al Research, Vol. 17, No. 1, 2001