remote sensing of environment - core · remote sensing of environment 145 (2014) 154–172 ⁎...
TRANSCRIPT

Remote Sensing of Environment 145 (2014) 154–172
Contents lists available at ScienceDirect
Remote Sensing of Environment
j ourna l homepage: www.e lsev ie r .com/ locate / rse
Landsat-8: Science and product vision for terrestrial globalchange research
D.P. Roy a,⁎, M.A.Wulder b, T.R. Loveland c, C.E.Woodcock d, R.G. Allen e, M.C. Anderson f, D. Helder g, J.R. Irons h,D.M. Johnson i, R. Kennedy d, T.A. Scambos j, C.B. Schaaf k, J.R. Schott l, Y. Sheng m, E.F. Vermote n, A.S. Belward o,R. Bindschadler p, W.B. Cohen q, F. Gao r, J.D. Hipple s, P. Hostert t, J. Huntington u, C.O. Justice v, A. Kilic w,V. Kovalskyy a, Z.P. Lee k, L. Lymburner x, J.G. Masek y, J. McCorkel y, Y. Shuai z, R. Trezza e, J. Vogelmann c,R.H. Wynne aa, Z. Zhu d
a Geographic Information Science Center of Excellence, South Dakota State University, Brookings, SD 57007, USAb Canadian Forest Service (Pacific Forestry Centre), Natural Resources Canada, 506 West Burnside Road, Victoria, British Columbia, V8Z 1M5, Canadac U.S. Geological Survey Earth Resources Observation and Science (EROS) Center 47914 252nd Street, Sioux Falls, SD 57198, USAd Department of Earth and Environment, Boston University, MA 02215, USAe University of Idaho Research and Extension Center, Kimberly, ID 83341, USAf United States Department of Agriculture, Agricultural Research Service, Hydrology and Remote Sensing Laboratory, Beltsville, MD 20705, USAg College of Engineering, South Dakota State University Brookings, SD 57007, USAh Laboratory for Atmospheres, NASA Goddard Space Flight Center, Greenbelt, MD 20771, USAi United States Department of Agriculture, National Agricultural Statistics Service, 3251 Old Lee Highway, suite 305, Fairfax, VA 22030, USAj National Snow and Ice Data Center, University of Colorado, 1540 30th Street, Boulder CO 80303, USAk School for the Environment, University of Massachusetts Boston, Boston, MA 02125, USAl Rochester Institute of Technology, Chester F. Carlson Center for Imaging Science, Rochester, NY 14623, USAm Department of Geography, University of California, Los Angeles (UCLA), Los Angeles, CA 90095, USAn Terrestrial Information Systems Laboratory, NASA Goddard Space Flight Center, Greenbelt, MD, 20771, USAo European Commission, Joint Research Centre, Institute for Environment and Sustainability, 20133 VA, Italyp Hydrospheric and Biospheric Sciences Laboratory, NASA Goddard Space Flight Center, Greenbelt, MD 20771, USAq USDA Forest Service, PNW Research Station, Corvallis, OR 97331, USAr USDA Agricultural Research Service, Hydrology and Remote Sensing Laboratory, Beltsville, MD 20705, USAs United States Department of Agriculture, Risk Management Agency, Washington, DC 20250, USAt Geography Department, Humboldt-Universität zu Berlin, Unter den Linden 6, 10099 Berlin, Germanyu Desert Research Institute, Reno, NV, 89501, USAv Department of Geographical Sciences, University of Maryland, College Park, MD 20742, USAw Dept. of Civil Engineering, School of Natural Resources, University of Nebraska-Lincoln, Lincoln, NE 65816, USAx Geoscience Australia, GPO Box 378 Canberra ACT 2601, Australiay Biospheric Sciences Laboratory, NASA Goddard Space Flight Center, Greenbelt, MD 20771, USAz ERT Inc. at the Biospheric Sciences Laboratory of NASA's Goddard Space Flight Center, Greenbelt, MD 20771, USAaa Virginia Tech, Forest Resources and Environmental Conservation, 310 West Campus Dr, Blacksburg, VA 24061, USA
⁎ Corresponding author.
http://dx.doi.org/10.1016/j.rse.2014.02.0010034-4257/© 2014 The Authors. Published by Elsevier Inc
a b s t r a c t
a r t i c l e i n f oArticle history:Received 9 October 2013Received in revised form 28 January 2014Accepted 1 February 2014Available online 4 March 2014
Keywords:Landsat 8OLITIRSLandsat Science Team
Landsat 8, a NASA and USGS collaboration, acquires globalmoderate-resolutionmeasurements of the Earth's ter-restrial and polar regions in the visible, near-infrared, short wave, and thermal infrared. Landsat 8 extends theremarkable 40 year Landsat record and has enhanced capabilities including new spectral bands in the blue andcirrus cloud-detection portion of the spectrum, two thermal bands, improved sensor signal-to-noise performanceand associated improvements in radiometric resolution, and an improved duty cycle that allows collection of asignificantly greater number of images per day. This paper introduces the current (2012–2017) Landsat ScienceTeam's efforts to establish an initial understanding of Landsat 8 capabilities and the steps ahead in support of pri-orities identified by the team. Preliminary evaluation of Landsat 8 capabilities and identification of new scienceand applications opportunities are describedwith respect to calibration and radiometric characterization; surfacereflectance; surface albedo; surface temperature, evapotranspiration and drought; agriculture; land cover, condi-tion, disturbance and change; fresh and coastalwater; and snowand ice. Insights into thedevelopment of derived‘higher-level’ Landsat products are provided in recognition of the growing need for consistently processed, mod-erate spatial resolution, large area, long-term terrestrial data records for resource management and for climateand global change studies. The paper concludes with future prospects, emphasizing the opportunities for land
. This is an open access article under the CC BY-NC-SA license (http://creativecommons.org/licenses/by-nc-nd/3.0/).
155D.P. Roy et al. / Remote Sensing of Environment 145 (2014) 154–172
imaging constellations by combining Landsat data with data collected from other international sensing systems,and consideration of successor Landsat mission requirements.
© 2014 The Authors. Published by Elsevier Inc. This is an open access article under the CC BY-NC-SA license(http://creativecommons.org/licenses/by-nc-nd/3.0/).
1. Introduction
At over 40 years, the Landsat series of satellites provides the longesttemporal record of space-based surface observations. Landsat 1 waslaunched in 1972 and was followed by a series of consecutive, tempo-rally overlapping, Landsat observatories (Landsat 2, 3, 4, 5 and 7) thathave provided near-global coverage reflective and thermal wavelengthobservations with increasing spectral and spatial fidelity (Lauer,Morain, & Salomonson, 1997; Loveland & Dwyer, 2012; Williams,Goward, & Arvidson, 2006). Remarkably, the Landsat record is unbro-ken, with most land locations acquired at least once per year since1972, capturing a period when the global human population has morethan doubled (United Nations Population Division, 2011) and evidencefor climate change has become discernible (Hansen, Sato, & Ruedy,2012; IPCC, 2013). Landsat data offer a unique record of the land surfaceand its modification over time. The Landsat moderate spatial resolutionis sufficiently resolved to enable chronicling of anthropogenic and nat-ural change at local to global scale (Gutman et al., 2008; Townshend &Justice, 1988) and the data time series are calibrated to provide a char-acterized consistent record (Markham&Helder, 2012) that is needed toenable discrimination between data artifacts and actual land surfacetemporal changes (Roy et al., 2002). Landsat data have demonstratedcapabilities for mapping and monitoring of land cover and land surfacebiophysical and geophysical properties (Hansen & Loveland, 2012;Wulder, Masek, Cohen, Loveland, & Woodcock, 2012) and potentialutility for terrestrial assimilation and biogeochemical cycling and landuse forecasting applications (Lewis et al., 2012; Nemani et al., 2009;Sleeter et al., 2012). Applications addressed with Landsat data involveboth scientific discovery andmanaging andmonitoring resources for eco-nomic and environmental quality, public health and human well-being,and national security. Analyses of the economic benefits of Landsat varyfrom $935 million/year (ASPRS, 2006) to $2.19 billion/year (Miller,Richardson, Koontz, Loomis, & Koontz, 2013) in support of applicationsincluding water resource analysis and management, agriculture and for-est analysis andmanagement, homeland security, infrastructure analysis,disaster management, climate change science, wetland protection, andmonitoring land cover change.
The 40+ year Landsat record was continued with the successfulFebruary 11th 2013 launch of Landsat 8 from Vandenburg Air ForceBase, California. This new Landsat observatory was developed throughan interagency partnership between the National Aeronautics andSpace Administration (NASA) and the Department of the Interior U.S.Geological Survey (USGS) (Irons & Loveland, 2013). NASA led the mis-sion andwas responsible for systemengineering and design, developingthe flight segment, securing launch services, flight ground systems inte-gration, and conducting on-orbit initialization and verification. NASAreferred to the effort as the Landsat Data Continuity Mission (LDCM)during the development, launch, and on-orbit commissioning. USGSled the ground system development and the LDCM was renamedLandsat 8 on May 30th 2013 when the USGS formally took responsibil-ity for mission operations, including collecting, archiving, processing,and distributing Landsat 8 data. Landsat 8 carries two sensors, the Oper-ational Land Imager (OLI) and the Thermal Infrared Sensor (TIRS), andover 500 image scenes per day are ingested into the U.S. Landsat dataarchive at the USGS Earth Resource Observation and Science (EROS)Center, South Dakota. The new Landsat 8 scenes complement the nowmore than four million scenes acquired by previous Landsat missionsthat are stored in the U.S. Landsat archive and are freely available viathe internet (Woodcock et al., 2008).
This paper introduces the current (2012–2017)USGS–NASA LandsatScience Team (LST) efforts to establish an initial understanding ofLandsat 8 capabilities and the steps ahead in support of science teamidentified priorities. These priorities and the purpose and focus of thecurrent LST are first introduced. This is followed by an overview of theLandsat 8 mission objectives, sensors, orbit, data acquisition, and stan-dard data products to provide context for the subsequent sections. Pre-liminary evaluation of Landsat 8 capabilities and identification of newscience and applications opportunities are highlighted, followed by in-sights into the development of derived ‘higher-level’ Landsat products,international synergies between Landsat and othermoderate resolutionremote sensing satellites, and a conclusion that includes considerationof successor Landsat mission requirements.
2. Landsat 8 Science Team
This paper is authored by members and affiliates of the current LST.There have been several LSTs, each selected through a competitiveproposal review process to serve a five-year term funded by the USGSand/or NASA. The science teams were charged to provide feedback oncritical design issues, including functional performance specificationsof the Landsat instruments, data systems and data formats that affectLandsat data users, and to consider interoperability of Landsat withother planned and in orbit remote sensing systems, and to provide in-sights on future missions. The previous LST (2005–2011) provided jus-tification for making the U.S. Landsat data archive available at no cost,recommended strategies for the effective expansion and use of the ar-chived Landsat data, and investigated the requirements for Landsat 8to meet the needs of users including policy makers (Woodcock et al.,2008; Wulder & Masek, 2012). The LST prior to that (1996–2001) wasformulated as part of the Landsat 7 development phase in a periodwhen Landsat 5was the only operating Landsat due to the 1993 Landsat6 failure (Goward et al., 2006; Irons & Masek, 2006). It developed aLandsat 7 long-term data acquisition plan, undertook research to devel-op methods to analyze Landsat data for global change studies, andevaluated the data quality acquired by Landsat 7 after it was launchedin April 1999 (Arvidson, Gasch, & Goward, 2001; Goward, Masek,Williams, Irons, & Thompson, 2001).
The current LST (2012–2017) was selected with an aim to representthe breadth of Landsat user perspectives and their requirements. TheLST is comprised of 21 principal investigator-lead teams of scientistsand engineers drawn from academia, U.S. Federal science and missionagencies, and includes representation from non-U.S. institutions to en-sure an international perspective. The majority of the science teammembers have expertise in processing and characterizing Landsat dataand/or expertise using Landsat data for a specific application domain.The LST met prior to and shortly after Landsat 8 launch and establishedthe following four core priorities for the next five years:
(1) evaluation of Landsat 8 capabilities and identification of new sci-ence and applications opportunities,
(2) development of strategies and prototype approaches for the de-velopment of ‘higher-level’ derived Landsat science productsneeded in support of global change research,
(3) identification of international land imaging constellationopportunities,
(4) definition of science and applications requirements forsucceeding Landsat missions for operational long-term obser-vational continuity.

156 D.P. Roy et al. / Remote Sensing of Environment 145 (2014) 154–172
Section 4 of this paper focuses on the first priority, which ismost im-mediate and is described in the hierarchy of processing required totransform Landsat 8 data into derived products and provide core appli-cations. Sections 5 and 6 reflect current LST perspectives on the secondand third priorities respectively as they are evolving. The conclusion in-cludes consideration of successor Landsat mission requirements.
3. Landsat 8 overview
3.1. Mission objectives
The primary Landsat 8 mission objective is to extend the Landsat re-cord into the future and maintain continuity of observations so thatLandsat 8 data are consistent and comparable with those from the pre-vious Landsat systems. Landsat supports the global data and informa-tion needs of the NASA Earth Science program, which seeks to developa scientific understanding of the Earth system and its response to natu-ral and human-induced changes to enable improved prediction ofclimate, weather, and natural hazards (Irons, Dwyer, & Barsi, 2012;NRC, 2007). The Landsat legacy has been relatively consistent inmissionobjectives, with capabilities modified by incremental improvements insatellite, sensor, transmission, reception, data processing, and data dis-tribution technologies. Landsat currently provides an integral role inNASA's multi-scale global observing strategy. Notably, the NASA Terrasatellite was placed in the same morning orbit as Landsat 7 to provideopportunities for multi-scale global land surface change monitoring(Skole, Justice, Janetos, & Townshend, 1997), particularly using datafrom the Moderate Resolution Imaging Spectroradiometer (MODIS)and the Advanced Spaceborne Thermal Emission and Reflection Radi-ometer (ASTER) that include Landsat heritage spectral bands (Justiceet al., 1998; Yamaguchi, Kahle, Tsu, Kawakami, & Pniel, 1998). Landsatalso supports the national data and information needs of the USGS na-tional science strategy (USGS, 2007) and USGS initiatives such as theU.S. National Land Cover Database (Fry et al., 2011) that are reliant onthe U.S. Landsat data coverage.
Landsat 8 is a science mission, and as for the previous Landsat sys-tems, has no operational mandate (Wulder, White, Masek, Dwyer, &Roy, 2011). Specifically, this means that if the current Landsat 8 systemfails there will be no quick replacement with another Landsat. The de-velopment of the Landsat 8 mission is reviewed in Irons et al. (2012).In 2005 NASA began planning for a free-flyer government-only Landsat7 successor mission with the following objectives (Irons et al., 2012):
(a) collect and archive moderate-resolution, reflective multispectralimage data affording seasonal coverage of the global land massfor a period of no less than five years;
(b) collect and archive moderate-resolution, thermal multispectralimage data affording seasonal coverage of the global land massfor a period of no less than three years;
(c) ensure that the data are sufficiently consistent with data fromthe earlier Landsat missions, in terms of acquisition geometry,calibration, coverage characteristics, spectral and spatial charac-teristics, output product quality, and data availability, to permitstudies of land cover and land use change over multi-decadalperiods;
(d) distribute standard data products on a nondiscriminatory basisand at no cost to users.
These four objectives, the lessons learned from the Earth Observing-1 mission that demonstrated the advantages and challenges associatedwith a multispectral optical wavelength pushbroom sensor (Ungar,Pearlman, Mendenhall, & Reuter, 2003), and recommendations fromthe previous Landsat Science Teams provided the basis for the Landsat8 capabilities and performance specifications that are summarized inthe remainder of this Section.
3.2. Landsat 8 sensor overview
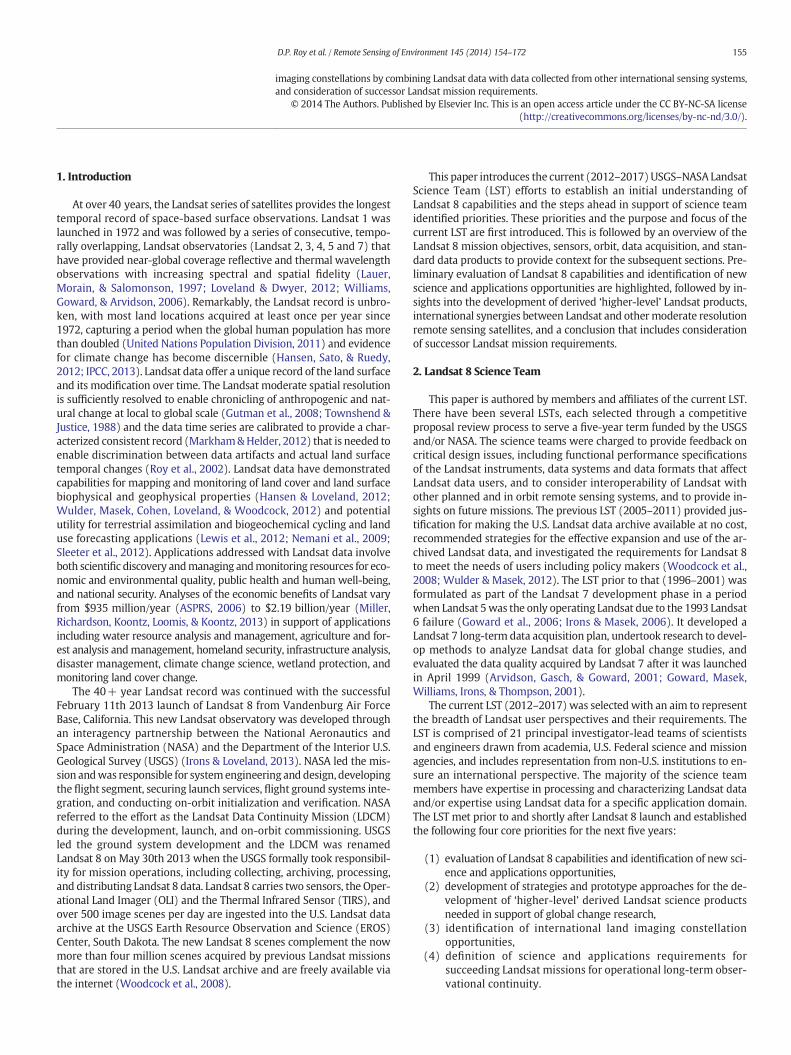
The Landsat 8 satellite carries a two-sensor payload, the OperationalLand Imager (OLI) and the Thermal Infrared Sensor (TIRS), which aredescribed in detail in Irons et al. (2012) and are summarized inTable 1. The OLI and TIRS spectral bands remain broadly comparableto the Landsat 7 Enhanced Thematic Mapper plus (ETM+) bands. Com-pared to the ETM+, the OLI has two additional reflective wavelengthbands: a new shorter wavelength blue band (0.43–0.45 μm) intendedfor improved sensitivity to chlorophyll and other suspended materialsin coastal waters and for retrieving atmospheric aerosol properties,and a new shortwave infrared band (1.36–1.39μm) for cirrus cloud de-tection. The other OLI bands are spectrally narrower in most cases thanthe corresponding ETM+ bands. In particular, the OLI near-infrared(NIR) band is closer in width to the MODIS NIR band and avoids the0.825 μm water vapor absorption feature that occurs in the ETM+ NIRband. The TIRS senses emitted radiance in two 100 m thermal infraredbands, compared to the high and low gain single thermal infrared 60m ETM+ band. The reduced TIRS spatial resolution is not optimal butwas necessitated by engineering cost restrictions. However, the twothermal TIRS bands enable thermal wavelength atmospheric correctionand more reliable retrieval of surface temperature and emissivity.
The OLI and TIRS designs incorporate technical advancements thatimprove their performance over the previous Landsat sensors. Signifi-cantly, like the Advanced Land Imager (ALI) on EO-1, both the OLI andTIRS are pushbroom sensorswith focal planes aligning long arrays of de-tectors across-track. This provides improved geometric fidelity, radio-metric resolution and signal-to-noise characteristics (Irons et al.,2012) compared to the whisk-broom sensor technology used by previ-ous Landsat instruments (Lee, Storey, Choate, & Hayes, 2004) and byMODIS (Wolfe et al., 2002). The OLI band signal-to-noise ratios exceedthose achieved by the Landsat ETM+ by a factor of at least eight(Irons et al., 2012). These improvements enable the OLI and TIRSanalog-to-digital converters to quantize the sensed radiance into 12bits (4096 levels) of meaningful data, rather than the 8 bits (256 levels)used by Landsat ETM+. The greater 12-bit quantization permits im-provedmeasurement of subtle variability in surface conditions. Calibra-tion coefficients for all Landsat sensors are configured to globallymaximize the range of land surface radiance in each spectral band(Markham, Goward, Arvidson, Barsi, & Scaramuzza, 2006). The dynamicrange of the OLI is improved compared to previous Landsat sensors, re-ducing band saturation over highly reflective surfaces such as snow orcloud.
3.3. Landsat 8 orbit and data acquisition
The Landsat 8 satellite is in the same near-polar, sun-synchronous,705 km circular orbit and position as the recently decommissionedLandsat 5 satellite. Landsat 8 data are acquired in 185 km swaths andsegmented into 185 km × 180 km scenes defined in the secondWorld-wide Reference System (WRS-2) of path (groundtrack parallel)and row (latitude parallel) coordinates also used by the Landsat 4, 5,and 7 satellites (Arvidson et al., 2001). Landsat 8 has a 16 day repeatcycle; eachWRS-2 path/row is overpassed every 16days andmaybe ac-quired a maximum of 22 or 23 times per year, as for Landsat 4, 5 and 7.Combined, the Landsat 8 and 7 sensors provide the capability to acquireany WRS-2 path/row every 8 days at the Equator and more frequentcoverage at higher latitudes due to the poleward convergence of theLandsat orbits (Kovalskyy & Roy, 2013).
The amount of Landsat data in the U.S. Landsat archive has not beenconstant among Landsat sensors, from year to year, or geographically,because of differing Landsat data acquisition strategies, data receptioncapabilities, and system health issues (Goward et al., 2006; Loveland &Dwyer, 2012; Markham, Storey, Williams, & Irons, 2004). Landsat 7was the first Landsat mission that adopted a systematic acquisitionplan in 1999, and Landsat 7 data continue to be acquired systematically
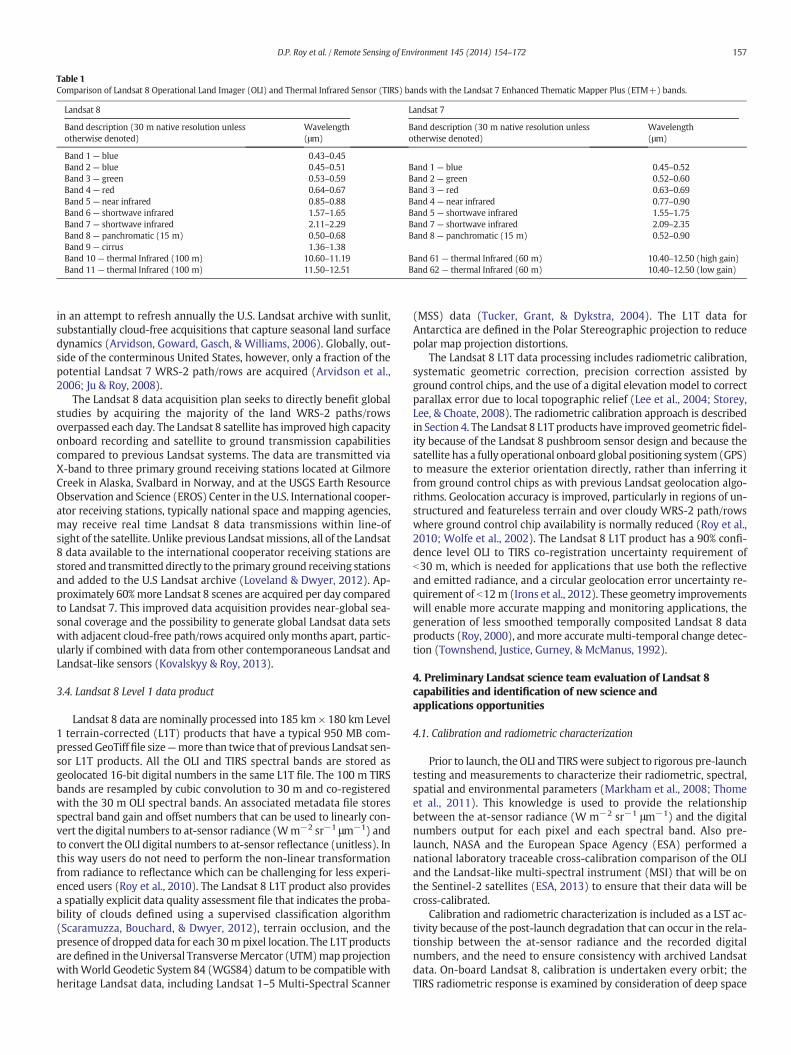
Table 1Comparison of Landsat 8 Operational Land Imager (OLI) and Thermal Infrared Sensor (TIRS) bands with the Landsat 7 Enhanced Thematic Mapper Plus (ETM+) bands.
Landsat 8 Landsat 7
Band description (30 m native resolution unlessotherwise denoted)
Wavelength(μm)
Band description (30 m native resolution unlessotherwise denoted)
Wavelength(μm)
Band 1 — blue 0.43–0.45Band 2 — blue 0.45–0.51 Band 1 — blue 0.45–0.52Band 3 — green 0.53–0.59 Band 2 — green 0.52–0.60Band 4 — red 0.64–0.67 Band 3 — red 0.63–0.69Band 5 — near infrared 0.85–0.88 Band 4 — near infrared 0.77–0.90Band 6 — shortwave infrared 1.57–1.65 Band 5 — shortwave infrared 1.55–1.75Band 7 — shortwave infrared 2.11–2.29 Band 7 — shortwave infrared 2.09–2.35Band 8 — panchromatic (15 m) 0.50–0.68 Band 8 — panchromatic (15 m) 0.52–0.90Band 9 — cirrus 1.36–1.38Band 10— thermal Infrared (100 m) 10.60–11.19 Band 61 — thermal Infrared (60 m) 10.40–12.50 (high gain)Band 11— thermal Infrared (100 m) 11.50–12.51 Band 62 — thermal Infrared (60 m) 10.40–12.50 (low gain)
157D.P. Roy et al. / Remote Sensing of Environment 145 (2014) 154–172
in an attempt to refresh annually the U.S. Landsat archive with sunlit,substantially cloud-free acquisitions that capture seasonal land surfacedynamics (Arvidson, Goward, Gasch, & Williams, 2006). Globally, out-side of the conterminous United States, however, only a fraction of thepotential Landsat 7 WRS-2 path/rows are acquired (Arvidson et al.,2006; Ju & Roy, 2008).
The Landsat 8 data acquisition plan seeks to directly benefit globalstudies by acquiring the majority of the land WRS-2 paths/rowsoverpassed each day. The Landsat 8 satellite has improved high capacityonboard recording and satellite to ground transmission capabilitiescompared to previous Landsat systems. The data are transmitted viaX-band to three primary ground receiving stations located at GilmoreCreek in Alaska, Svalbard in Norway, and at the USGS Earth ResourceObservation and Science (EROS) Center in the U.S. International cooper-ator receiving stations, typically national space and mapping agencies,may receive real time Landsat 8 data transmissions within line-ofsight of the satellite. Unlike previous Landsatmissions, all of the Landsat8 data available to the international cooperator receiving stations arestored and transmitted directly to the primary ground receiving stationsand added to the U.S Landsat archive (Loveland & Dwyer, 2012). Ap-proximately 60%more Landsat 8 scenes are acquired per day comparedto Landsat 7. This improved data acquisition provides near-global sea-sonal coverage and the possibility to generate global Landsat data setswith adjacent cloud-free path/rows acquired only months apart, partic-ularly if combined with data from other contemporaneous Landsat andLandsat-like sensors (Kovalskyy & Roy, 2013).
3.4. Landsat 8 Level 1 data product
Landsat 8 data are nominally processed into 185 km × 180 km Level1 terrain-corrected (L1T) products that have a typical 950 MB com-pressed GeoTifffile size—more than twice that of previous Landsat sen-sor L1T products. All the OLI and TIRS spectral bands are stored asgeolocated 16-bit digital numbers in the same L1T file. The 100 m TIRSbands are resampled by cubic convolution to 30 m and co-registeredwith the 30 m OLI spectral bands. An associated metadata file storesspectral band gain and offset numbers that can be used to linearly con-vert the digital numbers to at-sensor radiance (Wm−2 sr−1 μm−1) andto convert the OLI digital numbers to at-sensor reflectance (unitless). Inthis way users do not need to perform the non-linear transformationfrom radiance to reflectance which can be challenging for less experi-enced users (Roy et al., 2010). The Landsat 8 L1T product also providesa spatially explicit data quality assessment file that indicates the proba-bility of clouds defined using a supervised classification algorithm(Scaramuzza, Bouchard, & Dwyer, 2012), terrain occlusion, and thepresence of dropped data for each 30m pixel location. The L1T productsare defined in theUniversal TransverseMercator (UTM)map projectionwithWorld Geodetic System 84 (WGS84) datum to be compatible withheritage Landsat data, including Landsat 1–5 Multi-Spectral Scanner
(MSS) data (Tucker, Grant, & Dykstra, 2004). The L1T data forAntarctica are defined in the Polar Stereographic projection to reducepolar map projection distortions.
The Landsat 8 L1T data processing includes radiometric calibration,systematic geometric correction, precision correction assisted byground control chips, and the use of a digital elevation model to correctparallax error due to local topographic relief (Lee et al., 2004; Storey,Lee, & Choate, 2008). The radiometric calibration approach is describedin Section 4. The Landsat 8 L1T products have improved geometric fidel-ity because of the Landsat 8 pushbroom sensor design and because thesatellite has a fully operational onboard global positioning system (GPS)to measure the exterior orientation directly, rather than inferring itfrom ground control chips as with previous Landsat geolocation algo-rithms. Geolocation accuracy is improved, particularly in regions of un-structured and featureless terrain and over cloudy WRS-2 path/rowswhere ground control chip availability is normally reduced (Roy et al.,2010; Wolfe et al., 2002). The Landsat 8 L1T product has a 90% confi-dence level OLI to TIRS co-registration uncertainty requirement ofb30 m, which is needed for applications that use both the reflectiveand emitted radiance, and a circular geolocation error uncertainty re-quirement of b12m (Irons et al., 2012). These geometry improvementswill enable more accurate mapping and monitoring applications, thegeneration of less smoothed temporally composited Landsat 8 dataproducts (Roy, 2000), andmore accuratemulti-temporal change detec-tion (Townshend, Justice, Gurney, & McManus, 1992).
4. Preliminary Landsat science team evaluation of Landsat 8capabilities and identification of new science andapplications opportunities
4.1. Calibration and radiometric characterization
Prior to launch, the OLI and TIRSwere subject to rigorous pre-launchtesting and measurements to characterize their radiometric, spectral,spatial and environmental parameters (Markham et al., 2008; Thomeet al., 2011). This knowledge is used to provide the relationshipbetween the at-sensor radiance (W m−2 sr−1 μm−1) and the digitalnumbers output for each pixel and each spectral band. Also pre-launch, NASA and the European Space Agency (ESA) performed anational laboratory traceable cross-calibration comparison of the OLIand the Landsat-like multi-spectral instrument (MSI) that will be onthe Sentinel-2 satellites (ESA, 2013) to ensure that their data will becross-calibrated.
Calibration and radiometric characterization is included as a LST ac-tivity because of the post-launch degradation that can occur in the rela-tionship between the at-sensor radiance and the recorded digitalnumbers, and the need to ensure consistency with archived Landsatdata. On-board Landsat 8, calibration is undertaken every orbit; theTIRS radiometric response is examined by consideration of deep space
158 D.P. Roy et al. / Remote Sensing of Environment 145 (2014) 154–172
and on-board blackbody observations, and the OLI response is exam-ined by observations of on-board solar diffuser panels. Due to the rigorsof launch and the harsh space environment, on-board calibration is sup-plemented with vicarious techniques that use ground-based measure-ments to predict sensor outputs (Schott et al., 2012; Slater et al.,1987). For Landsat 8 a suite of globally distributed well-characterizedsites based on previous Landsat vicarious calibration studies are beingused (Helder et al., 2013). Other sensors will be cross-calibrated withLandsat 8 by comparison of near-simultaneous sensor observationsover these sites. In addition, Landsat 8 vicarious calibration is being un-dertaken by sensing the moon, which is a known target with minimalatmospheric contamination (Kieffer et al., 2003), andwill be used to de-tect long-term sensor degradations.
Shortly after launch the Landsat 8 orbit was configured to under-flyLandsat 7 to provide a vicarious cross-calibration opportunity. TheLandsat 7 ETM+ calibration is well defined, with 5% absolute reflectiveband calibration uncertainty (Markham & Helder, 2012) and thermalband uncertainties of approximately 0.6 K when expressed as a changein apparent temperature of a 300 K surface (Schott et al., 2012). Duringthe under-flight, contemporaneous ground-based measurements weremade continuously for four days. In addition, an airborne sensor packageconsisting of a hyperspectral imager, lidar, and thermal camera mademeasurements over several sites (McCorkel, Thome, & Lockwood,2013).
Together, these pre-launch, onboard and vicarious calibration tech-niques established confidence in Landsat 8 calibration accuracy andcontinuity with predecessor Landsats. Initial results indicate absolutecalibration within the pre-launch specification OLI requirements of 3%reflectance and 5% radiance (Czapla-Myers, Anderson, & Biggar, 2013;Markham, Irons, & Storey, 2013). Currently the TIRS data show an ap-proximate 2% (band 10) and 4% (band 11) bias in absolute radiancewhen compared to vicarious measurements from buoys in Lake Tahoe,the Salton Sea, anddeepoceans. This bias translates to an approximately2 K to 4 K over estimate when expressed as a change in the apparenttemperature of a 300 K surface and exceeds the 2% accuracy require-ments for TIRS. Stray light from beyond the nominal 15° TIRS field ofview has been identified as the cause of the bias and a correction ap-proach is being studied. Until these studies produce amore comprehen-sive correction, the USGS plans to reprocess Landsat 8 data and subtract0.29 W/m2/sr/um from TIRS band 10 and 0.51 W/m2/sr/um from TIRSband 11 to improve the accuracy of the data products for surface tem-peratures typical of mid-latitudes during the growing season, that is,temperatures near the 280 K to 300 K range of the buoy observations.On-orbit assessments also indicate that OLI and TIRSmeet their geomet-ric performance requirements with wide margins, giving confidencethat their data can be readily incorporated into the Landsat time series(Markham et al., 2013).
4.2. Surface reflectance
The spectral bidirectional surface reflectance, i.e., derived top ofatmosphere (TOA) reflectance corrected for the varying scattering andabsorbing effects of atmospheric gases and aerosols is needed to moni-tor the surface reliably (Kaufman, 1989). Although the OLI's spectralbands are narrow and chosen to avoid atmospheric absorption features(Section 3.2), atmospheric effects are still challenging to correct. In par-ticular, the impact of aerosols can be difficult to correct because of theircomplex scattering and absorbing properties that vary spectrally andwith the aerosol size, shape, chemistry and density (Dubovik et al.,2002). A number of atmospheric correction methodologies have beendeveloped, but those using radiative transfer algorithms and atmo-spheric characterization data provide the most potential for automatedlarge-area application (Vermote, El Saleous, & Justice, 2002; Roy et al.,2014). For example, the MODIS reflective wavelength bands havebeen atmospherically corrected using the 6SV radiative transfer codeto generate global daily and 8-day surface reflectance products since
2000 (Vermote et al., 2002). The 6SV code has also been implementedfor correction of Landsat TM and ETM+ data (Masek et al., 2006). Theapproach relies on inverting the aerosol effect, using the bands centeredat the shortest (blue) wavelengthswhere the surface reflectance is gen-erally small and the aerosol signal strong. Consequently, the accuracyof the blue and green surface reflectance is lower than in the longerwavelengths, and these bands should be used with caution (Vermote& Kotchenova, 2008; Ju, Roy, Vermote, Masek, & Kovalskyy, 2012).
A Landsat 8 OLI land surface atmospheric correction algorithm isbeing prototyped using the 6SV approach refined to take advantage ofthe narrow OLI spectral bands, improved radiometric resolution andsignal to noise, and the new OLI blue band (0.43–0.45 μm). The newblue band is particularly helpful for retrieving aerosol properties, as ithas shorter wavelength than the conventional OLI, TM and ETM+blue bands. Fig. 1 shows results of preliminary tests applied to a Landsat8 OLI scene acquired overWashingtonD.C. and Baltimore. The true colorsurface reflectance and uncorrected TOA reflectance are shown inFig. 1a and b respectively, and illustrate the impact of the correction atvisible wavelengths. Fig. 1c shows the extent of cirrus cloud depictedby the shortwave infrared band (1.36–1.39μm) sensor that was specifi-cally added to the OLI for this purpose. This band is being evaluated asan atmospheric correction pre-filter, as aerosol properties near cloudscan be very different than far from clouds (Tackett & Di Girolamo,2009). Figs. 2 and 3 illustrate full resolution surface reflectance imagesextracted from Fig. 1a over Dulles Airport and Baltimore Inner Harbor,respectively. The Landsat 8 OLI 15 m panchromatic band was used topan sharpen (Tu, Huang, Hung, & Chang, 2004) these two images. Theimproved OLI 12-bit radiometric resolution, particularly over water,and the high level of geographic detail provided by the OLI, are clearlyapparent.
4.3. Surface albedo
The surface albedo – the proportion of solar energy that is reflectedby the Earth's surface – is an essential climate variable describing theenergy available to drive atmospheric, land, oceanic, and cryospherictemperature and evaporation regimes as well as vegetative evapotrans-piration, photosynthesis, and carbon assimilation (Schaaf, Cihlar,Belward, Dutton, & Verstraete, 2009; Schaaf, Liu, Gao, & Strahler, 2011,chap. 24). Long-term surface albedos are required by climate, biogeo-chemical, hydrological, andweather forecastmodels at a range of spatialand temporal scales. The albedo varies as a result of solar illumination,snowfall, inundation, vegetation growth, littoral variation, and withnatural and anthropogenic disturbance and land cover and land usechange. Improving the spatial detail and precision of surface albedomeasures using Landsat is especially important in understanding theimpacts of local land cover change. Variations in surface albedo, partic-ularly in areas of permanent and seasonal snow cover, have been shownto play a significant role in the radiative forcing of the Earth system andrepresent a significant contributor to ongoing changes in the terrestrialenergy balance (Barnes & Roy, 2010; Flanner, Shell, Barlage, Perovich, &Tschudi, 2011; Myhre, Kvalevag, & Schaaf, 2005).
Remote sensing offers the only viable method of measuring andmonitoring the global heterogeneity of albedo (GCOS, 2004; Schaafet al., 2009). Surface albedo cannot be retrieved directly from Landsatspectral bidirectional surface reflectance because of the narrow field ofview, which precludes sampling of the intrinsic reflectance anisotropyof most land surfaces. However, 30 m surface albedo can be derivedusing the coarser resolution (500 m) MODIS Bidirectional ReflectanceDistribution Function (BRDF) product (Schaaf et al., 2002, 2011, chap.24) to capture the generalized surface anisotropy of different surfaceland covers, and then coupling these with concurrent 30 m Landsatspectral bidirectional surface reflectance (Shuai, Masek, Gao, & Schaaf,2011). This approach is being used to develop a Landsat 8 OLI surface al-bedo algorithm to derive spectral and broadband intrinsic albedo values(white-sky albedo and black-sky albedo). The improved OLI radiometry

159D.P. Roy et al. / Remote Sensing of Environment 145 (2014) 154–172
and atmospheric correction will provide more reliable spectral albedo,and the greater number of OLI spectral bands will contribute to im-proved broadband albedo values. In addition, the new OLI blue band
may improve albedo retrieval over littoral areas, to help characterize es-tuaries, mangroves and coral reefs.
4.4. Surface temperature, evapotranspiration and drought
Land surface temperature is one of the key variables needed to de-scribe surface states and processes critical in studies of climate, hydrol-ogy, ecology, biogeochemistry and human health (Kalma, McVicar, &McCabe, 2008; Quattrochi & Luvall, 2004). Prior to Landsat 8, the landsurface temperature could not be derived reliably without use of ancil-lary data because of the availability of only a single Landsat thermalwavelength band. The two thermal TIRS bands are spectrally similar totwo of the 1 kmMODIS thermal bands and enable, for the first time, at-mospheric correction of Landsat thermal imagery using split-windowtechniques. Thiswill provide simpler andmore accurate retrieval of sur-face temperature and emissivity than was possible with previousLandsat sensor data.
Landsat provides the spatial resolution and continuous recordneeded to capture time histories of water consumption at the scale ofhuman use, critically, at the scale of typical agricultural fields. Landsat-based field-aggregated evapotranspiration (ET) is currently being usedin a number of U.S states for water rights management (Sullivan,Huntington, & Morton, 2011) and for conjunctive management ofsurface and ground-water (Anderson, Allen, Morse, & Kustas, 2011;Burkhalter et al., 2013), and in other countries to estimate non-sustainable ground-water depletion (Santos, Lorite, Allen, & Tasumi,2012). Water budgets, groundwater modeling, and expert evidencesubmitted for water rights hearings have relied on Landsat to identifyareas and quantities of groundwater discharge consumedby natural veg-etation and to define the perennial water yield (Allen, Tasumi, Morse,et al., 2007; Burns & Drici, 2011; NSEO, 2012). Many groundwater dis-charge areas are small or narrowandhavehigh spatial variability, requir-ing Landsat's spatial resolution to estimate spatially representative andaccurate ET fluxes. Fig. 4 shows a map of ET produced from Landsat 8for a coastal area of California about 150 km south of where Landsat 8was launched. The center image is relative ET produced by the METRICsurface energy balance application (Allen, Tasumi, & Trezza, 2007),expressed as a fraction of maximum, weather-based reference ET(ETrF) for the day, shown at the native 100 m TIRS resolution. Theright image is relative ET produced by METRIC following a ‘sharpening’of the thermal data to the 30 m OLI resolution, achieved by associatingvariations in surface temperature and shortwave OLI vegetation indices(Trezza et al., 2008). Outlines of areas of water consumption associatedwith individual fields become clearer after thermal sharpening, and theconsistency of ET between field edges and field centers supports the use-fulness of the sharpening to better define total water consumption asso-ciated with individual fields and water rights.
Continental-scale thermal-based ETrF anomalymaps generated usingcoarse-scale geostationary satellite thermal data have been shown toprovide a robust and high-resolution alternative to precipitation-basedindices for drought monitoring (Anderson, Hain, Wardlow, Mecikalski,& Kustas, 2011; Anderson et al., 2013). Landsat scale ET time-series pro-vide a unique opportunity to investigate field-scale vegetation stress andto study how drought vulnerability varies spatially with plant-functionaltype, land/water management and edaphic condition, and to enhancedrought early warning systems for targeted mitigation efforts and im-proved yield estimation (Anderson, Kustas, et al., 2011). Fusion of ETdata-streams from Landsat and daily MODIS data provide the
Fig. 1. a. Prototype Landsat 8 OLI surface reflectance product derived from a 185 km ×180 km L1T image acquired over Chesapeake Bay, MD, USA, April 21 2013. True-colorcomposite of the OLI red (0.630–0.680 μm), green (0.525–0.600 μm) and blue (0.450–0.515 μm) bands. b. Top of atmosphere true-color composite for the same scene and OLIbands shown in Fig. 1a. Illustrated using the same contrast stretch as for Fig. 1a. c. Cirrus,and also other clouds, apparent in the new OLI cirrus band (1.360–1.390 μm) for thescene shown in Fig. 1a and b.
Fig. 2. Full resolution depiction of Dulles Airport, in Virginia just west of Washington, DC, extracted from the OLI surface reflectance image (Fig. 1a). The OLI panchromatic band(0.500–0.680 μm) has been used to sharpen the resolution of the red, green and blue bands. A region of 9 km × 9 km is shown.
160 D.P. Roy et al. / Remote Sensing of Environment 145 (2014) 154–172
opportunity to enable more timely detection of incipient crop stress(Cammalleri, Anderson, Gao, Hain, & Kustas, 2013). Landsat 8will contin-ue to serve as the primary data source for the development of technolo-gies for estimating cumulative water consumption over growing-seasontimescales, for estimating groundwater discharge, perennial water yield,and for monitoring changes in water use and availability as populationsincrease and pressures to develop new freshwater resources rise.
4.5. Agriculture
Landsat-based agricultural applications were developed shortlyafter the launch of Landsat 1 and have been subject to multi-agencyfunded support through initiatives including the Large Area Crop Inven-tory Experiment (LACIE) (MacDonald, Hall, & Erb, 1976) and the Agri-culture and Resources Inventory Surveys through Aerospace RemoteSensing (AgRISTARS) Program (AgRISTARS Program Support Staff,1981). Landsat 8 will build upon this rich history, adding to the tempo-ral archive of agricultural change information and allowing for contin-ued monitoring.
The U.S. Department of Agricultural (USDA) uses Landsat andLandsat-like satellite data to monitor cropping systems domesticallyand abroad. A flagship example is the Cropland Data Layer (CDL)which is annually generated to define over 100 land cover and croptype classes at 30 m for all the conterminous U.S. It is used primarily
to help estimate crop area of dominant commodities and supplementsinformation from ongoing ground-based surveys (USDA, 2013).The CDL is generated using a supervised classification approach withextensive agricultural ground truth (Boryan, Yang, Mueller, & Craig,2011; Johnson & Mueller, 2010) applied to a variety of sensor data in-cluding from Landsat 5 TM, Landsat 7 ETM+, Indian Remote SensingResourcesat-1 Advanced Wide Field Sensor (AWiFS), and DisasterMonitoring Constellation (DMC) Demios-1 and UK-2 (Johnson, 2008).Non-U.S. satellite data have been utilized to complement Landsat databecause they have a more frequent revisit rate (less than 16 days) anddo not suffer from the Landsat 7 ETM+ scan line corrector problem(Markham et al., 2004). The USDA has already begun integratingLandsat 8 data into the CDL generation to benefit from the greaterdata coverage and the improved OLI radiometric resolution and spectralband locations. Fig. 5 shows CDL for 2012 and 2013madewith DMC andwith Landsat 8 OLI data respectively. It is anticipated that because of theimproved radiometric resolution and spectral characteristics combinedwith the greater number of images collected, Landsat 8 will be a keydata source for USDA programs and reduce organizational reliance onnon-US satellite assets that have incremental costs and processingrequirements.
Satellite-based crop yield estimation is also of interest to the USDAand others because in situ surveys are expensive and often do notcapture rapid within season changes. Furthermore, in many regions
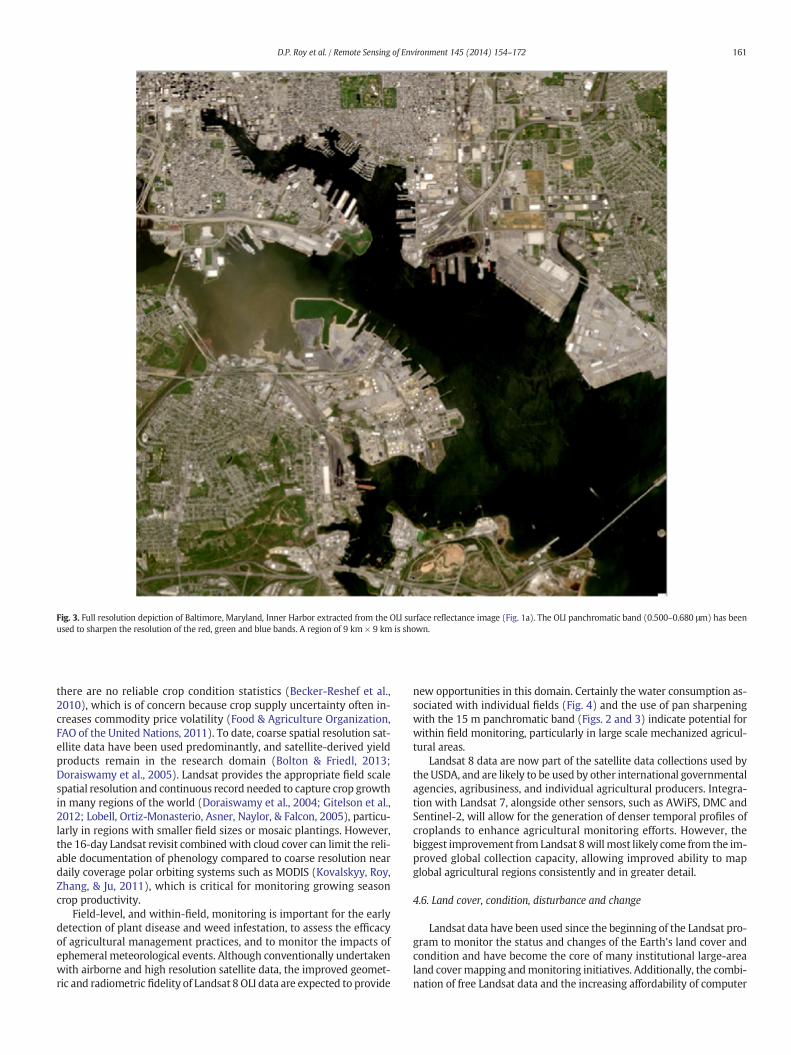
Fig. 3. Full resolution depiction of Baltimore, Maryland, Inner Harbor extracted from the OLI surface reflectance image (Fig. 1a). The OLI panchromatic band (0.500–0.680 μm) has beenused to sharpen the resolution of the red, green and blue bands. A region of 9 km × 9 km is shown.
161D.P. Roy et al. / Remote Sensing of Environment 145 (2014) 154–172
there are no reliable crop condition statistics (Becker-Reshef et al.,2010), which is of concern because crop supply uncertainty often in-creases commodity price volatility (Food & Agriculture Organization,FAO of the United Nations, 2011). To date, coarse spatial resolution sat-ellite data have been used predominantly, and satellite-derived yieldproducts remain in the research domain (Bolton & Friedl, 2013;Doraiswamy et al., 2005). Landsat provides the appropriate field scalespatial resolution and continuous record needed to capture crop growthin many regions of the world (Doraiswamy et al., 2004; Gitelson et al.,2012; Lobell, Ortiz-Monasterio, Asner, Naylor, & Falcon, 2005), particu-larly in regions with smaller field sizes or mosaic plantings. However,the 16-day Landsat revisit combinedwith cloud cover can limit the reli-able documentation of phenology compared to coarse resolution neardaily coverage polar orbiting systems such as MODIS (Kovalskyy, Roy,Zhang, & Ju, 2011), which is critical for monitoring growing seasoncrop productivity.
Field-level, and within-field, monitoring is important for the earlydetection of plant disease and weed infestation, to assess the efficacyof agricultural management practices, and to monitor the impacts ofephemeral meteorological events. Although conventionally undertakenwith airborne and high resolution satellite data, the improved geomet-ric and radiometric fidelity of Landsat 8 OLI data are expected to provide
new opportunities in this domain. Certainly the water consumption as-sociated with individual fields (Fig. 4) and the use of pan sharpeningwith the 15 m panchromatic band (Figs. 2 and 3) indicate potential forwithin field monitoring, particularly in large scale mechanized agricul-tural areas.
Landsat 8 data are now part of the satellite data collections used bytheUSDA, and are likely to be used by other international governmentalagencies, agribusiness, and individual agricultural producers. Integra-tion with Landsat 7, alongside other sensors, such as AWiFS, DMC andSentinel-2, will allow for the generation of denser temporal profiles ofcroplands to enhance agricultural monitoring efforts. However, thebiggest improvement from Landsat 8willmost likely come from the im-proved global collection capacity, allowing improved ability to mapglobal agricultural regions consistently and in greater detail.
4.6. Land cover, condition, disturbance and change
Landsat data have been used since the beginning of the Landsat pro-gram to monitor the status and changes of the Earth's land cover andcondition and have become the core of many institutional large-arealand covermapping andmonitoring initiatives. Additionally, the combi-nation of free Landsat data and the increasing affordability of computer

Fig. 4. A 11 km × 22 km coastal area near Ventura, California from a Landsat 8 L1T image acquired May 4 2013. Left: false color image of OLI short-wave infrared (1.57–1.65 μm), near-infrared (0.85–0.88 μm) and red (0.64–0.67 μm) expressed as red, green, blue, Center: relative ET produced by METRIC surface energy balance application using native resolution 100m TIRS thermal bands, Right: relative ET produced by METRIC following ‘sharpening’ of the TIRS thermal data.
162 D.P. Roy et al. / Remote Sensing of Environment 145 (2014) 154–172
processing and storage hardware have catalyzed a blossoming of novelresearch in both mapping and change detection. Landsat 8 continuityextends the record that is the foundation for land change investigations,and preserves the institutional investments made by land change sci-ence and applications programs.
4.6.1. Systematic institutional large-area land cover mapping andmonitoring initiatives
US Federal agencies have relied on Landsat data for operational landcover mapping since the 1990's. The United States Multi-ResolutionLandCharacteristics (MRLC) Consortiumwas initiated during the Landsatcommercial in 1994 to cost-share the compilation of a national dataset ofprocessed Landsat scenes for use in various agency land cover projects.The USGS National Land Cover Dataset (Fry et al., 2011), the USGS GapAnalysis Project natural vegetation mapping project (Jennings, 2000),and the NOAA Coastal Change Analysis Program (C-CAP) coastal zoneland cover mapping (Dobson et al., 1995) were the initial products ofthe joint data buy. These initiatives continue, and now include the Land-scape Fire and ResourceManagement Planning Tools Project (LANDFIRE)(Rollins, 2009; Vogelmann et al., 2011) and the USDA CroplandData Layer (see Section 4.5). Other countries have adopted Landsat fornational mapping activities. Canada used circa 2000 Landsat TM andETM+ data to produce the Earth Observation for Sustainable Develop-mentmap of forests (EOSD) (Wulder et al., 2008) and this detailed prod-uct plays a role in a variety of Canadian applications including theNational Forest Inventory, forest fragmentation assessment (Soverel,Coops, White, & Wulder, 2010), and conservation protection (Andrew,Wulder, & Coops, 2012; Cardille, White, Wulder, & Holland, 2012). TheAustralian Landsat archive currently underpins natural resourcemanage-ment at state levels (Armston, Denham,Danaher, Scarth, &Moffiet, 2009)and supports national scale carbon inventories (Lehmann, Wallace,
Caccetta, Furby, & Zdunic, 2013) using Geoscience Australia surface re-flectance Landsat 5 and Landsat 7 data (Li et al., 2010).
Landsat data anchor international tropical forest monitoringefforts. NASA's Landsat Pathfinder Program laid the foundation forlarge-area Landsat mapping of tropical regions (Justice et al., 1995;Skole & Tucker, 1993). The operational PRODES Project (Projeto deMonitoramento do Desflorestamento na Amazonia Legal), conductedby Brazil's National Institute for Space Research (INPE), has been usingLandsat data tomonitor deforestation rates across the Brazilian Amazonannually since 1988 (INPE, 2013; Shimabukuro, Batista, Mello, Moreira,& Duarte, 1998). The Observatoire Satellital des Forêts d'AfriqueCentrale (OSFAC) initiative is using Landsat and other data to monitorCongo Basin forests (Hansen et al., 2008). The European Commission'sJoint Research Centre TREES-III project uses a pan-tropical grid sam-pling approach to characterize tropical forest loss for 20 by 20 km sam-ple blocks of Landsat TM data from 2000 to 2010 (Achard et al., 2002;Beuchle et al., 2011; Mayaux et al., 2013). Hansen et al. (2013) recentlydocumented a decade of global forest gains and losses using LandsatETM+ data. As a result of the success of these and other tropical forestmonitoring investigations, Landsat data are a key input to the UN-REDD(Reducing Emissions from Deforestation and forest Degradation) Pro-gramme that was launched in 2008 to support the measurement,reporting and verification of forest cover and carbon stocks in develop-ing countries (GOFC-GOLD, 2012).
Landsat 8 data will enable these initiatives to continue, therebyensuring relevance to their resource management, policy, researchand application user communities. In particular, the continuity of the in-formation content of the Landsat TM and ETM+ reflective wavelengthbands, including the short-wave infrared bands to improve discrimina-tion of bare soil from non-photosynthetic vegetation (Ustin, Roberts,Gamon, Asner, & Green, 2004) and to distinguish broadleaf and ever-green forest types (Horler & Ahern, 1986), is critical. In a classification

Fig. 5. Summer 2012 (left) and 2013 (right) USDA/NASS Cropland Data Layer (CDL) for a 17 km × 24 km portion of southeastern South Dakota. The 2012 CDL was derived by supervisedclassification of the red, green and near infrared wavelength 22 m Deimos-1 and UK-2 data. The 2013 CDL was derived by supervised classification of the 30 m Landsat 8 OLI reflectivewavelength bands. The northern part of the city of Sioux Falls is shown as gray and is located in the south of the image. The USGS Earth Resources Observation and Science (EROS) center,home of the U.S. Landsat archive, is located in the northeast image corner.
163D.P. Roy et al. / Remote Sensing of Environment 145 (2014) 154–172
context, the improved OLI signal-to-noise ratio promises to enable bet-ter discrimination of low reflectance targets, and to improve discrimina-tion among various soil and non-photosynthetic vegetation targets. Thenew shortwave infrared band will improve detection of cirrus clouds(Fig. 1c) and facilitate more reliable land cover mapping. This is partic-ularly important in persistently cloudy areas, where less reliable clouddetection has necessitated aggressive cloud masking and reliance ontemporal compositing of Landsat data from very different time periods(Lindquist, Hansen, Roy, & Justice, 2008). International studies, particu-larly in the tropics and high latitudes, will also benefit from the in-creased daily image acquisition capacity and improved image geodeticproperties, the latter should enable more accurate image geometry incloudy regions. In addition, the Landsat 8 OLI panchromatic band has anarrower bandpass compared to previous Landsat sensors to providegreater contrast between vegetated and bare surfaces, andwill enhanceclassification training and validation data collection.
4.6.2. Emerging mapping and change detection approachesAlthough spatial and spectral properties have made Landsat data the
workhorse of land surface characterization, the opening of the Landsatarchive has fostered newanalytical time series approaches for describingland surface condition and dynamics. The critical change has been amovement from image-based to pixel-based analysis. Because Landsatdata are now free and readily available, users are able to develop ap-proaches based upon using all the available Landsat images for a givenregion and time period rather than just a select subset of cloud-free im-ages. This has led to the development of new time-series change
characterization approaches and new cloud and shadow masking,mosaicking, and temporal compositing approaches, whereby the highestquality pixels from multiple acquisitions are utilized. For example, tem-poral compositing approaches are now being used to select a bestLandsat observation from all the Landsat observations collected oversome reporting period to generate gridded weekly, monthly, seasonaland annual composites (Roy et al., 2010) that have been used to mapconterminous U.S. 30 m percent tree cover, bare ground, and five yeartree cover loss and bare ground gain (Hansen et al., 2011; 2014). RecentLandsat mapping and change detection approaches have focused onquantifying land cover change over an unprecedented range of timescales (Cohen, Zhiqiang, & Kennedy, 2010) and using novel time seriesapproaches (Zhu, Woodcock, & Olofsson, 2012; Brooks et al., 2013). Forexample, the Vegetation Change Tracker (VCT) provides a set of auto-mated algorithms designed to detect forest disturbance using Landsattime-series (Huang et al., 2010) and has been used to estimate annualforest disturbance rates for the conterminous U.S. (Masek et al., 2013).The LandTrendr algorithms capture abrupt disturbance events in forests(Kennedy, Yang, & Cohen, 2010) and other land cover changes, allowinglinkage of disturbance rates with changes in policy and economicconditions (Griffiths et al., 2012; Kennedy et al., 2012). All pixel-leveldisturbance and change mapping approaches will benefit from theimproved quality and data coverage of Landsat 8. Landsat 8 data rep-resent an extension of the unbroken Landsat spectral record, provid-ing a set of relatively consistent spectral bands critical for capturingmany land cover processes and providing a baseline for temporalcomparison.

Fig. 6. Signal-to-Noise Ratio (SNR) for uniform water regions extracted over a regionof uniformbrightness in theRed Sea from Landsat 8 OLI (circles) and Landsat 7 ETM+(tri-angles), along with the specified SNR for Landsat 8 at typical radiance (L) levels(diamonds).
164 D.P. Roy et al. / Remote Sensing of Environment 145 (2014) 154–172
4.7. Fresh and coastal water
Surface fresh water sources comprise a small fraction of the globalwater pool, yet they are the foundation of life in terrestrial ecosystems.Present knowledge on fresh water distributions is limited at regionaland global scales. Global databases of lakes, reservoirs and wetlandsexist, but they have not been generated in a systematic manner orusing the same data sources (Lehner & Döll, 2004). The Shuttle RadarTopography Mission (SRTM) Water Body Dataset (SWBD) was devel-oped to improve the quality of SRTM digital elevation products(SWBD, 2005), and was subsequently improved by the global 250 mMODIS water mask product (Carroll, Townshend, Dimiceli, Noojipady,& Sohlberg, 2009). The 15 m and 30 m resolution of the Landsat 8 OLI,combined with high global data availability, present a unique opportu-nity to provide the first and most up-to-date global inventory of theworld's lakes at high spatial resolution and positional accuracy using re-cent Landsat algorithms (Li & Sheng, 2012; Sheng & Li, 2011; Smith,Sheng, MacDonald, & Hinzman, 2005). This global high-resolution lakedatabase is expected to contain millions of lakes with a size of one hect-are or larger (Downing et al., 2006; Meybeck, 1995).
In addition to measuring the extent of water bodies satellite datahave utility for water quality information retrieval. The Landsat TMand ETM+ sensors have limited capability to map water quality infresh and coastal waters and have been largely restricted to mappingturbidity or single constituent variations (assuming all observed changewas due to only one constituent). (Olmanson, Bauer, & Brezonik, 2008;Onderka & Pekárová, 2008). These limitations are due to the relativelylow signal-to-noise ratio (SNR) of previous Landsat sensors as well asto the limited number of spectral bands in the visible region wherewater quality spectral signatures are manifest.
Fig. 3 illustrates the quality of OLI data over the Baltimore Inner Har-bor, using the heritage Landsat visible bands, illustrating qualitativelythe improved radiometricfidelity of these data overwater. The SNRpos-sible with OLI and the actual performance on orbit have considerably
Fig. 7. Preliminary Landsat 8 cryospheric applications. Top: winter thermal TIRS 10.6–11.2 m brightness temperatures (BT) over the East Antarctic Plateau near DomeF acquired on 31 July 2013, showing low BT in clear-sky areas south of the dome summit(elevation contours in green) and nearby Automatic Weather Stations (AWS), Middle:glacier ice speed of a region of southeastern Alaska derived by surface feature trackingfrom a pair of Landsat-8 OLI images acquired 12 July and 13 August 2013 (color bar atright is inmeters/day), Bottom:meltwater lake depthmap for a small region of northwestGreenland from Landsat 8 OLI image acquired 18 July 2013.
exceeded expectations. This is illustrated in Fig. 6, comparing Landsat8 OLI SNR values for a uniform sample of water in the Red Sea with asimilar sample taken from a Landsat 7 ETM+ image and the instrument

165D.P. Roy et al. / Remote Sensing of Environment 145 (2014) 154–172
specified values at a typical radiance level. These high SNR values are ex-tremely important for water constituent mapping because the very lowsignal from water causes variations in water quality to be lost in thenoise of low SNR systems (Gordon & Clark, 1981).
Atmospheric correction over coastal waters is particularly challeng-ing because of the much lower SNR compared to land; consequently,water-specific Landsat 8 atmospheric correction techniques are beingdeveloped that take advantage of the new shorter wavelength blueband (Gerace & Schott, 2012). Using simulated data and spectralmatching algorithms, Gerace, Schott, and Nevins (2013) demonstratedthat the combination of the new OLI blue band and the improved SNRshould reduce error in constituent retrieval values to about half of theerror expected from Landsat 7 ETM+, with most of this improvementattributable to the improved SNR. These results were for the simulta-neous retrieval of chlorophyll, colored dissolved organic material(CDOM) and suspended material (SM) at the instrument specifiedSNR. Given the SNR values observed on orbit (Fig. 6), the expected er-rors should be again reduced by one half (total reduction to about onefourth the ETM+ expected errors). As a result of these simulated stud-ies and the initial observed OLI SNR values on orbit, we expect Landsat 8to enable a new era of water quality monitoring in the critical coastaland fresh water regions of the globe.
4.8. Snow and ice
Landsat cryospheric applications began with the earliest Landsatmissions, in particularwith the extensive 1972–1975 Antarctic coverageby Landsat 1, 2, and 3 (Swithinbank, 1988). Landsat data have remaineda central tool for documenting the profound changes throughout theglobal cryosphere in the past 40 years (e.g., Bindschadler, Dowdeswell,Hall, & Winther, 2001; Bindschadler et al., 2008; Williams, Ferrigno,Swithinbank, Lucchitta, & Seekins, 1995). Cryospheric research willbenefit from the improved geometric and radiometric fidelity ofthe Landsat 8 OLI visible bands, allowing subtle surface features ofthe large ice sheets to be better mapped and tracked for flow velocity(Bindschadler, 2003). High radiometric sensitivity in the TIRS bandsalso holds promise for better mapping of summertime ocean surfacetemperature in fjords adjacent to tidewater and floating-front glaciers,providing insight into ice-ocean interactions that can dramaticallyaffect ice front retreat and flow speed (Mankoff, Jacobs, Tulaczyk, &Stammerjohn, 2012; Motyka, Hunter, Echelmeyer, & Connor, 2003).The TIRS data also have potential for mapping debris-cover thicknessover mountain glaciers through seasonal and diurnal variations in tem-perature as thin debris cover shows amodified response to solar heatingdue to the underlying ice (Bhambri, Bolch, & Chaujar, 2011; Shukla,Arora, & Gupta, 2010).
Chief among the specific cryospheric issues that will be addressedwith Landsat-8 data is the determination of the net ice outflow of thegreat ice sheets, including variation over time, and mapping the iceflowvelocity of theworld'smountain glaciers. This is currently conduct-ed by automated feature tracking in sequential time series images(Berthier et al., 2005; Debella-Gilo & Kääb, 2011; Scambos, Dutkiewitcz,Wilson, & Bindschadler, 1992). The increased global OLI data acquisitionwill lead tomore frequent cloud-free image pairs suitable for flowmap-ping, and the improved OLI data geometry and radiometry should im-prove tracking accuracy and the ability to track ice flow in low-contrast areas of glaciers and ice sheets (Bindschadler, 2003).
Examples of ongoing Landsat 8 applications to polar and glacier icestudy areas demonstrate several useful techniques using the OLI andTIRS data (Fig. 7). In Fig. 7 (top), a very low temperature calibrationtest site in the high-elevation areas of East Antarctica is illustrated. In-creased thermal sensor precision and extended calibrated temperaturerange at the 100m TIRS resolution can be used to investigate the spatialdistribution of extremely low ice sheet temperatures. In Fig. 7 (middle)the geolocation and high radiometric precision of the OLI panchromaticband facilitate ice velocity mapping using image cross-correlation
algorithms based on refinements to established algorithms. Landsat 8will also contribute to detailedmapping of surfacemelt ponds occurringon glaciers and ice sheets, including their extent, depth, and volume,with enhanced precision due to the higher radiometry relative to pastLandsat studies (e.g., Tedesco & Steiner, 2011). Empirical relationshipsbetween field-based estimates of lake-bottom albedo and the declinein radiance in the OLI green (0.525–0.600 μm) reflectance with waterdepth can be used to definemeltwater depth (Fig. 7, bottom). This capa-bility is particularly notable as surfacewater on ice sheets and glaciers isdifficult to monitor but can have a complex interaction with the under-lying ice, through fracture, penetration, and sub-glacial lubrication (Daset al., 2008; Scambos, Bohlander, Shuman, & Skvarca, 2004; Stearns,Smith, & Hamilton, 2008; Zwally et al., 2002).
5. Higher-Level Landsat product generation needs, opportunitiesand challenges
The provision of ‘higher-level’ Landsat products, i.e., geographicallyseamless, gridded products that have been subject to geophysical trans-formations and processed to derive environmental variables over differ-ent time periods (monthly, seasonal, annual), have been advocated bythe LST and by the user community. Higher-level products are neededto meet demands for consistently processed, moderate spatial resolu-tion, large area, long-term terrestrial data records for climate and globalchange studies, to help national and international reporting linked tomultilateral environmental agreements, and for regional and nationalresource management applications.
The Millennium Ecosystem Assessment (Carpenter et al., 2006) andoutcomes of the Rio+20United Nations Conference on Sustainable De-velopment (UN, 2012) highlighted the need for transparent, systematic,and repeatable measures of a variety of ecosystem characteristics. Theconcept of a climate data record has been introduced as a data set de-signed to enable study of long-term climate change, with ‘long-term’
meaning year-to-year and decade-to-decade change, (NRC, 2000). The40+ year continuity of the Landsat program, with consecutive, tempo-rally overlapping Landsat observatories and cross-sensor calibration, isa key reason the Landsat program has value for climate studies(Trenberth et al., 2013). The Global Climate Observing System has iden-tified a set of Essential Climate Variables (ECVs) needed in support ofthe United Nations Framework Convention on Climate Change (GCOS-154, 2011), and listed the following terrestrial ECVs as feasible forsustained monitoring from satellite data: snow areal extent; outlinesof glaciers and ice caps; ice sheet elevation changes; lake level andarea; surface reflectance anisotropy and black and white sky albedo;land cover type and maps for detection of land cover change; fractionof absorbed photosynthetically active radiation (FAPAR); leaf areaindex (LAI); above-ground forest biomass; burned area and active firedetection; soil moisture; and land surface temperature. The preliminaryLST evaluation of Landsat 8 capabilities and identification of new scienceand applications described in Section 4 illustrate that the majority ofthese ECVs can be retrieved directly or indirectly from Landsat data. Ofthe ECVs identified, only ice sheet elevation changes, soil moisture,and above-ground forest biomass cannot be reliably retrieved fromLandsat 8 or predecessor Landsat sensor data. However, Landsat-basedforest biomass estimates can be made in certain biomes, such as borealforests, with accuracies comparable to estimates derived using higherspatial resolution satellite and airborne data (Mora, Wulder, White, &Hobart, 2013). The fAPAR and LAI can be derived by empirical biomeor land cover class specific parameterization of NDVI (Butson &Fernandes, 2004) or by model inversion against Landsat reflectance(Ganguly et al., 2012). Landsat burned area mapping involves a highdegree of human intervention (Bastarrika, Chuvieco, & Martin, 2011)and large area Landsat burned area mapping initiatives have significantreporting lags (Eidenshink et al., 2007). Landsat active fire detectionalgorithms have also been developed but have limited sampling capa-bilities (Schroeder et al., 2008).

166 D.P. Roy et al. / Remote Sensing of Environment 145 (2014) 154–172
The experience of generating and distributing global decadal scalecoarse spatial resolution land products derived from MODIS andAdvanced Very High Resolution Radiometer (AVHRR) data (Justiceet al., 1998; Tucker et al., 2005) is informative of the opportunities and
challenges to generating higher-level Landsat products. Global long-term AVHRR land surface data records have been derived to advanceunderstanding of the terrestrial carbon and biogeochemical cycles andinteractions with climate (Myneni, Tucker, Asrar, & Keeling, 1998). To

167D.P. Roy et al. / Remote Sensing of Environment 145 (2014) 154–172
date, however, no definitively processed long-termAVHRR land data re-cord has been generated and those that are publically available are sub-ject to scientific debate (Beck et al., 2011). This is because, unlikeLandsat, the AVHRR sensors have no onboard reflective wavelength cal-ibration capability and theywere not designed for land surfacemonitor-ing (Vermote, Saleous, & Holben, 1995; Wu, Sullivan, & Heidinger,2010). MODIS combines characteristics of the AVHRR and Landsat sen-sor designs and includes onboard reflective and thermal wavelengthcalibration systems (Justice et al., 1998). A suite of higher-level MODISland products are being generated to meet the needs of the globalchange research community, with the recognition that the productsare also used at regional scales and in support of applications (Justiceet al., 2002; Masuoka et al., 2011, chap. 22). The acceptance and utilityof the MODIS Land products by the resource management, policy, re-search and application communities indicate the need for similar prod-ucts and product generation approaches but at Landsat resolution.
It is feasible to process long-term and large-area Landsat data sets toprovide a medium spatial resolution analog to the coarse spatial resolu-tion higher-level land products generated from the MODIS and AVHRRdata streams. The Web-enabled Landsat Data (WELD) project hasstarted to demonstrate this capability by generating ten years of 30 mweekly, seasonal, monthly and annual composited Landsat 7 ETM+mosaics of the conterminous United States (CONUS) and Alaska (Royet al., 2010). TheWELDproducts enable the development of turnkey ap-proaches to, for example, land cover and land cover change characteri-zation (Hansen et al., 2011; 2014), by employing systematic andautomated Landsat processing, including conversion of digital numbersto calibrated top of atmosphere reflectance and brightness temperature,cloudmasking, and reprojection into a gridded continental map projec-tion. The WELD processing has been adapted and applied to Landsat 8data. Fig. 8 shows the WELD processing applied to all the Landsat 8L1T data acquired over the CONUS in August 2013. Unlike currentlyavailable WELD Landsat 7 ETM+ products (WELD, 2013), the reflec-tance saturation usually seen over clouds is not evident due to the im-proved OLI dynamic range, there are no missing data because theimproved Landsat 8 geolocation enables more images to be processedto L1T products, and there are no missing data due to the ETM+ SLC-off issue.
Additional steps are needed during the Landsat 8 era if the needs ofthe global change research user community are to be met. Not least isthe need to generate global coverage Landsat higher-level products forthe entire Landsat sensor data record. These data should be atmospher-ically corrected to provide an accurate and stable surface reflectance re-cord. Algorithms to combine contemporaneous Landsat sensor data, e.g.Landsat 5 and 7, or Landsat 7 and 8, should also be developed to providemore frequent acquisition coverage and improved probabilities of ac-quiring cloud-free land observations (Kovalskyy & Roy, 2013). Higher-level product generation algorithms that are computationally efficientand automated should be developed as approaches that require highlevels of user intervention will not be scalable. The global annualLandsat data volume is more than an order of magnitude greater thanfor MODIS, requiring processing on high performance supercomputerswith petabyte data storage solutions (Nemani, Votava, Michaelis,Melton, & Milesi, 2011). Distribution will also need to be scaled appro-priately. Recent developments in web services and value added webproduct delivery systems have the potential to provide natural resourcemanagers, policymakers and researcherswith anunprecedented capac-ity to access, analyze and interpret higher-level products derived fromthe multi-petabyte scale archive of global Landsat data. In the next de-cade, the ability to extract Landsat 1–8 time series of derived
Fig. 8. Conterminous United States Landsat 8 monthly WELD product browse images, August 2scenes processed to L1T. Browse images composed of 16,500 × 11,000 300 m pixels each geneshown with a similar stretch as Fig. 1b. Bottom: TOA Normalized Difference Vegetation Index (of Arizona Vegetation Index and Phenology Laboratory.
environmental information at any pixel location globally is desired.Moreover, there are significant, but currently unrealized, opportunitiesfor fast and automated processing to systematically produce near-realtime Landsat 8 higher-level monitoring products, for example, to gener-ate ET and drought information (Section 4.4) or disturbance informa-tion (Section 4.6).
6. International synergies between Landsat and other moderateresolution optical wavelength remote sensing satellites
The value of Landsat data and products is well established. A mainshortcoming, clearly articulated in the above sections, remains theneed for more frequent observations to mitigate atmospheric effectsand tomonitor high temporal frequency phenomena.More frequent ob-servations provide (a) more opportunities for cloud-free, shadow-free,and atmospherically uncontaminated surface observations withoutmissing data, within desired annual, seasonal and monthly windows,(b) increasingly detailed descriptions of time-dependent phenomena,and (c) more reliable time-series and change detection analyses. Im-proving the Landsat temporal resolution can be achieved by launchingmore Landsat sensors, to provide a constellation, increasing the imagingswathwidth, or by combining Landsat datawith data fromother compa-rable remote sensing satellites.
There are a number of satellites with spatial and spectral characteris-tics similar to those of Landsat (Stoney, 2008): at least 20missions carry-ing moderate spatial resolution multispectral imagers were operationalas of 30th June 2013 (Belward & Skoien, under review). In particular,Europe's Copernicus Earth Observation program includes two plannedSentinel-2 satellites designed to provide, under a free and open data pol-icy, multiple global acquisitions with similar spectral and spatial charac-teristics as Landsat. The Multi Spectral Instrument (MSI) onboardSentinel-2 has 13 spectral bands ranging from 0.433 μm to 2.19 μm;four 10 m visible and near-infrared bands, six 20 m red edge, near-infrared and SWIR bands, and three 60 m bands for characterizing aero-sols, water vapor and cirrus clouds (Drusch et al., 2012). Landsat 8 andSentinel-2 pre-launch cross-calibration was undertaken (Section 4.1)to specifically support their combined data use. Scientific and applica-tions uses aremaximized through known and communicated calibrationcharacteristics. Landsat is currently the only satellite program to provideconsistent, cross-calibrated data spanning more than four decades(Chander, Markham, & Helder, 2009; Markham & Helder, 2012), whichgives the program a crucial role in the provision of terrestrial essentialclimate variables and long-term climate data records. The addition ofother sensors and space agencies to implement instrument cross-calibration will be of considerable benefit to the user community. Com-plementary to calibration activities is a recommendation to move to-wards increasingly standardized processing, empowering users tointegrate data from different systems into science and applications in aseamless fashion. A central question concerns how data from additionalsensors can be integrated in a systematic and robust fashion to advanceglobal land monitoring capabilities, with options reviewed in Wulderet al. (2011).
At the international level, the needs for and utility of information pro-vided by satellites is clear: government and/or private entities in 32 sov-ereign states/geopolitical blocs have financed at least 186 land coverobserving missions over the last four decades (Belward & Skoien, underreview; Stoney, 2008). Since the 1970s the average number of land imag-ing satellites launched per-year has increased from two to over nine, av-erage longevity has increased almost threefold, and costs of ‘entry-level’systems is falling. Free and open data access stimulates new science and
013, equal area Albers projection. Generated from all the available (890) August 2013 OLIrated from 10 × 10 30 m OLI pixels. Top: Top of atmosphere (TOA) true color reflectanceNDVI) displayed with the standard MODIS NDVI color palette provided by the University
168 D.P. Roy et al. / Remote Sensing of Environment 145 (2014) 154–172
applications, but alternative business models and lower costs stimulatewider system ownership. For example, the data sharing and commonground segment established by the Disaster Monitoring Constellation(DMC) have enabled launches of land imaging systems by agencies inEurope, Africa and Asia (Da Silva Curiel et al., 2005). Whilst more peoplein more countries have access to global land surface observations fromspace than ever before, a note of caution is needed. Smaller and lightersatellites may be cheaper to build and launch (Xue, Li, Guang, Zhang, &Guo, 2008), but there is an inescapable need for tightly specified, high re-liability, high performance systems such as Landsat to maintain long–term consistent data records and facilitate fusion of data from differentsatellites. Satellite costs rise as performance specifications and reliabilityrise. The use of proven technologies, for example through follow-onmis-sions of similar sensors, such as the two Sentinel-2 sensors, or the twoMODIS sensors onboard the Terra and Aqua satellites, is one means tocontrol costs and shorten development timelines. In all cases, restrictivedata policies and data access limitations should be avoided. Explorativecross-platform experiments of benefit to the wider research communityare required, and realistically onlymadepossible by the free and open ac-cess to analysis ready data products.
7. Conclusion
The successful launch of Landsat 8 is planned to extend the 40-yearLandsat record at least another 5 years, further advancing global changeresearch, while protecting andmaximizing the previous investments inLandsat. The importance of continuity of the Landsat record cannot beunderestimated. Just as theMauna Loa, Hawaii, atmospheric CO2 recordis now considered a vital indicator of human activity, but whose conti-nuity was also not always guaranteed (Keeling, 1998), Landsat providesthe longest consistent satellite terrestrial record. The free availability ofall Landsat data in the U.S. archive provides an unprecedented opportu-nity for analysis of the past and future terrestrial change. Terrestrialchanges, both gradual and sudden,may be understood in quite differentways in the context of multi-decadal rather than decadal time series.When considering the new observations from Landsat 8 as a continua-tion of the complementary and calibrated previously collected Landsatseries, the importance, and value, of Landsat 8 is evident.
From this communication it should be clear that Landsat 8 is an excit-ing collection of spatial, spectral, temporal, and radiometric (perfor-mance, accuracy, and dynamic range) resolutions, combined withrobust pre- and post-launch calibration, high geometric and geodetic ac-curacy, as well as a systematic global acquisition strategy. Looking for-ward, it is critical that follow-on missions enable continuity withprevious Landsat missions, including data coverage, spatial and spectralresolution, and rigorous calibration. Continuity of the informationcontent of the Landsat TM and ETM+ reflective visible and short-wave infrared bands at 30 m is needed to monitor the surface at scaleswhere anthropogenic change is occurring. Continuity of coincident ther-mal band information is required to provide cloud masking capabilitiesand to enable surface temperature, evapotranspiration, drought andcryospheric monitoring. Continuity of radiometric calibration is funda-mental tomaintain a long-term consistent Landsat data record, facilitatefusion of Landsat data with other satellite sensor data, and to enablequantitative information extraction. Based on the insights of representa-tives from university, government, and industry, a recent report fromthe US National Research Council (NRC, 2013) describes the past historyof the Landsat program, the core elements of the current imaging systemthat require continuity, and offers some suggestions on future potentialland imaging systems and observation capacities. Insights on howLandsat system costs can be reduced in the future, such as purchase ofmultiple spacecraft and fixed price contracting, are also described. Be-sides reinforcing the need and demand for Landsat data, land imagingdata from Landsat increasingly appears as a necessary element of na-tional infrastructure. In any forward looking scenario regarding Landsat,
the current capacity and the benefits of continuity must be maintained,with science and applications information needs driving requirements.
This paper summarizes the Landsat Science Team (LST) efforts to es-tablish an initial understanding of Landsat 8 capabilities and the stepsahead in support of science team identified priorities. The aims of theLST align with the current scientific and applications challenges thatare known or anticipated. The thematic sections above capture what isknown and how to build on that existing knowledge with the recentavailability of Landsat 8 data. The sensor improvements to Landsat 8are already showing measurement and categorization improvements,and offer refined opportunities for quantitative approaches to Landsatinformation extraction. These benefits arise first through improvedpre-processing (e.g., atmospheric correction), and then by enablingphysically-based information extraction approaches (e.g., albedo,water quality, evapotranspiration; via model inversion and data assim-ilation). It is also evident from the thematic sections that the continuedand well understood Landsat data stream offers increased capacity forsystematic production of scientifically supported higher-level Landsatproducts. The acceptance and utility of the MODIS land products bythe resource management, policy, research and application communi-ties indicate the need for similar products and product generation ap-proaches with Landsat. It is important that higher-level Landsatproducts are community endorsed and subject to external scientificscrutiny, quality assessed, validated, and reprocessed as needed. Acore challenge is to scale current capabilities to generate global coverageLandsat higher-level products for all the Landsat data record.
Landsat-like is often used to describe data from other optical wave-length remote sensing systems with a similar spatial resolution asLandsat. Detection of change and monitoring of terrestrial ecosystemsusing these systems is hampered by cloud cover, leading to interest inradar data (De Sy et al., 2012). The free and open access to the Landsatarchive has mitigated this situation through a change from scene-based to pixel-based processing, data blending, and cross-sensor dataintegration. The capacity of large numbers of images to create cloud-free composites at Landsat spatial resolution has been demonstrated.Landsat 8 is offering continuity of such measures, plus an effective8-day revisit in combination with Landsat 7. The planned launch ofSentinel-2 by the European Space Agency will offer additional uniqueand complementary measures. Advances made through multi-sensordata integrationmay provide requiredmeasurements aswell as provid-ing insights on the development and deployment of additional, lowercost, satellites to complement the well calibrated and systematicallycollected Landsat data series.
Landsat occupies a valuable niche in global satellite remote sensing;the platform collects images at a spatial resolution indicative of humaninteractions with terrestrial ecosystems yet with an image extent com-patible with systematic analyses over large areas. A ground-segmentbased on reliable science provides free and open access to Level 1 prod-ucts of known, documented, and traceable quality. The integrity of thisproduction chain and the confidence users have in Landsat data has ledto a proliferation of science and applications— the Landsat program pro-vides an example to be emulated. By expanding the Landsat archive, andby providing improved data quality, Landsat 8 has enabled continuityand early results have shownadvances in establishedmapping andmon-itoring programs, allowing for a general fostering of development of newapproaches for characterizing state, condition, and dynamics of theEarth's surface. Building upon these successes, near-term emphasisshould be placed on ensuring operational status for the incoming Landsatdata stream and outgoing Level 1 and higher-level data products.
Acknowledgements
Weare grateful to theNASA–USGS-industry Landsat Data ContinuityMission (LDCM) development team for their efforts to meet an aggres-sive launch schedule, and we thank the USGS Climate and LandUse Change Mission's Land Remote Sensing Program and the Earth

169D.P. Roy et al. / Remote Sensing of Environment 145 (2014) 154–172
Resources Observation and Science (EROS) Center for co-sponsoringand funding the USGS–NASA Landsat Science Team.
References
Achard, F., Eva, H. D., Stibig, H. -J., Mayaux, P., Gallego, J., Richards, T., & Malingreau, J. -P.(2002). Determination of deforestation rates of the world's humid tropical forests.Science, 297, 999–1002.
AgRISTARS Program Support Staff (1981). AgRISTARS: Agriculture and resources inventorysurveys through aerospace remote sensing, annual report—fiscal year 1980. Houston,TX: NASA, Lyndon B. Johnson Space Center.
Allen, R. G., Tasumi, M., Morse, A., Trezza, R., Wright, J. L., Bastiaanssen, W., Kramber, W.,Lorite, I. J., & Robison, C. W. (2007). Satellite-based energy balance for mappingevapotranspiration with internalized calibration (METRIC) — Applications. Journalof Irrigation and Drainage Engineering. ASCE, 133, 395–406.
Allen, R. G., Tasumi, M., & Trezza, R. (2007). Satellite-based energy balance for mappingevapotranspiration with internalized calibration (METRIC) — Model. Journal ofIrrigation and Drainage Engineering. ASCE, 133, 380–394.
Anderson, M. C., Allen, R. G., Morse, A., & Kustas, W. P. (2011). Use of Landsat thermal im-agery in monitoring evapotranspiration and managing water resources. RemoteSensing of Environment, 122, 50–65.
Anderson, M. C., Hain, C. R., Otkin, J. A., Zhan, X., Mo, K. C., Svoboda, M., Wardlow, B., &Pimstein, A. (2013). An intercomparison of drought indicators based on thermal re-mote sensing and NLDAS-2 simulations with U.S. drought monitor classifications.Journal of Hydrometeorology, 14, 1035–1056.
Anderson, M. C., Hain, C. R., Wardlow, B., Mecikalski, J. R., & Kustas, W. P. (2011). Evalua-tion of a drought index based on thermal remote sensing of evapotranspiration overthe continental U.S. Journal of Climate, 24, 2025–2044.
Anderson, M. C., Kustas, W. P., Norman, J. M., Hain, C. R., Mecikalski, J. R., Schultz, L.,Gonzalez-Dugo, M. P., Cammalleri, C., d'Urso,, G., Pimstein, A., & Gao, F. (2011).Mapping daily evapotranspiration at field to continental scales using geostation-ary and polar orbiting satellite imagery. Hydrology and Earth System Sciences, 15,223–239.
Andrew, M. E., Wulder, M.A., & Coops, N. C. (2012). Identification of de facto protectedareas in boreal Canada. Biological Conservation, 146(1), 97–107.
Armston, J.D., Denham, R. J., Danaher, T. J., Scarth, P. F., & Moffiet, T. N. (2009). Predictionand validation of foliage projective cover from Landsat-5 TM and Landsat-7 ETM+imagery. Journal of Applied Remote Sensing, 3, 033540.
Arvidson, T., Gasch, J., & Goward, S. N. (2001). Landsat 7's long-term acquisition plan— aninnovative approach to building a global imagery archive. Remote Sensing ofEnvironment, 78, 13–26.
Arvidson, T., Goward, S., Gasch, J., & Williams, D. (2006). Landsat-7 long-term acquisitionplan: Development and validation. Photogrammetric Engineering and Remote Sensing,72, 1137–1146.
ASPRS (2006, November 6). Report to the future land imaging working group onthe American Society for Photogrammetry and Remote Sensing Survey on the futureof land imaging. available at. http://www.asprs.org/a/news/fli/Summary_of_Final_Results-ASPRS_Moderate_Resolution_Imagery_Survey.pdf (Last accessed October1st 2013)
Barnes, C. A., & Roy, D. P. (2010). Radiative forcing over the conterminous United Statesdue to contemporary land cover land use change and sensitivity to snow and interan-nual albedo variability. Journal of Geophysical Research, 115, G04033, http://dx.doi.org/10.1029/2010JG001428.
Bastarrika, A., Chuvieco, E., & Martin, M. P. (2011). Mapping burned areas from LandsatTM/ETM plus data with a two-phase algorithm: Balancing omission and commissionerrors. Remote Sensing of Environment, 115, 1003–1012.
Beck, H. E., McVicar, T. R., van Dijk, A. I. J. M., Schellekens, J., de Jeu, R. A.M., & Bruijnzeel, L.A. (2011). Global evaluation of four AVHRR–NDVI data sets: Inter-comparison and as-sessment against Landsat imagery. Remote Sensing of Environment, 115, 2547–2563.
Becker-Reshef, I., Justice, C., Sullivan, M., Vermote, E., Tucker, C., Anyamba, A., Small, J.,Pak, E., Masuoka, E., Schmaltz, J., Hansen, M., Pittman, K., Birkett, C., Williams, D.,Reynolds, C., & Doorn, B. (2010). Monitoring global croplands with coarse resolutionearth observations: The Global Agriculture Monitoring (GLAM) project. RemoteSensing, 2, 1589–1609.
Belward, A. S., & Skoien, J. O. (2014). Who launchedwhat, when andwhy; trends in Glob-al Land-Cover Observation capacity from civilian Earth Observation satellites.Photogrammetric Engineering and Remote Sensing (under review).
Berthier, E., Vadon, H., Baratoux, D., Arnaud, Y., Vincent, C., Feigl, K. L., Rémy, F., & Legrésy,B. (2005). Surface motion of mountain glaciers derived from satellite optical imagery.Remote Sensing of Environment, 95, 14–28.
Beuchle, R., Eva, H. D., Stibig, H. J., Bodart, C., Brink, A., Mayaux, P., Johansson, D., Achard, F.,& Belward, A. (2011). A satellite data set for tropical forest area change assessment.International Journal of Remote Sensing, 32, 7009–7031.
Bhambri, R., Bolch, T., & Chaujar, R. K. (2011). Mapping of debris-covered glaciers in theGarhwal Himalayas using ASTER DEMs and thermal data. International Journal ofRemote Sensing, 32, 8095–8119.
Bindschadler, R. A. (2003). Tracking sub-pixel-scale sastrugi with Advanced Land Imager.IEEE Transactions on Geoscience and Remote Sensing, 41, 1373–1377.
Bindschadler, R., Dowdeswell, J., Hall, D., & Winther, J. -G. (2001). Glaciological applica-tions with Landsat-7 imagery. Early assessments. Remote Sensing of Environment,78, 163–179.
Bindschadler, R., Vornberger, P., Fleming, A., Fox, A., Mullins, J., Binnie, D., Paulsen, S. J.,Granneman, B., & Gorodetzky, D. (2008). The Landsat image mosaic of Antarctica.Remote Sensing of Environment, 112, 4214–4226.
Bolton, D. K., & Friedl, M.A. (2013). Forecasting crop yield using remotely sensed vegeta-tion indices and crop phenology metrics. Agricultural and Forest Meteorology, 173,74–84.
Boryan, C., Yang, Z., Mueller, R., & Craig, M. (2011). Monitoring US agriculture: The USDepartment of Agriculture, National Agricultural Statistics Service, cropland datalayer program. Geocarto International, 26, 341–358.
Brooks, E. B., Wynne, R. H., Thomas, V. A., Blinn, C. E., & Coulston, J. W. (2013). On-the-flymassively multitemporal change detection using statistical quality control charts andLandsat data. IEEE Transactions on Geoscience and Remote Sensing, http://dx.doi.org/10.1109/TGRS.2013.2272545.
Burkhalter, J. P., Martin, T. C., Allen, R. G., Kjaersgaard, J., Wilson, E., Alvarado, R., & Polly, J. S.(2013). Estimating crop water use via remote sensing techniques vs. conventionalmethods in the South Platte River Basin, Colorado. Journal of the American WaterResources Association, 49, 498–517.
Burns, A. G., & Drici, W. (2011, June). Hydrology and water resources of Spring, Cave, DryLake, and Delamar valleys, Nevada and vicinity. Presentation to the Office of the NevadaState Engineer: Southern Nevada Water Authority, Las Vegas, Nevada.
Butson, C. R., & Fernandes, R. A. (2004). A consistency analysis of surface reflectance andleaf area index retrieval from overlapping clear-sky Landsat ETM+ imagery. RemoteSensing of Environment, 89, 369–380.
Cammalleri, C., Anderson, M. C., Gao, F., Hain, C. R., & Kustas, W. P. (2013). A data fusionapproach for mapping daily evapotranspiration at field scale. Water ResourcesResearch, http://dx.doi.org/10.1002/wrcr.20349.
Cardille, J. A., White, J. C., Wulder, M.A., & Holland, T. (2012). Representative landscapes inthe forested area of Canada. Environmental Management, 49, 163–173.
Carpenter, S. R., DeFries, R., Dietz, T., Mooney, H. A., Polasky, S., Reid, W. V., & Scholes, R. J.(2006). Millennium ecosystem assessment: Research needs. Ecology, 314, 257–258.
Carroll, M. L., Townshend, J. R., Dimiceli, C. M., Noojipady, P., & Sohlberg, R. A. (2009). Anew global raster water mask at 250 m resolution. International Journal of DigitalEarth, 2(4), 291–308.
Chander, G., Markham, B.L., & Helder, D. L. (2009). Summary of current radiometric cali-bration coefficients for Landsat MSS, TM, ETM+, and EO-1 ALI sensors. RemoteSensing of Environment, 113, 893–903.
Cohen, W. B., Zhiqiang, Y., & Kennedy, R. E. (2010). Detecting trends in forest disturbanceand recovery using yearly Landsat time series: 2. TimeSync — Tools for calibrationand validation. Remote Sensing of Environment, 114, 2911–2924.
Czapla-Myers, J. S., Anderson, N. J., & Biggar, S. F. (2013). Early ground-based vicariouscalibration results for Landsat 8 OLI. Proceedings of SPIE, 8866.
Da Silva Curiel, A., Boland, L., Cooksley, J., Bekhti, M., Stephens, P., Sun, W., & Sweeting, M.(2005). First results from the disaster monitoring constellation (DMC). ActaAstronautica, 56, 261–271.
Das, S. B., Joughin, I., Behn, M., Howat, I., King, M., Lizarraldi, D., & Bhatia, M. (2008). Frac-ture propagation to the base of the Greenland Ice Sheet during supraglacial lakedrainage. Science, 320, 778–781.
De Sy, V., Herold, M., Achard, F., Asner, G. P., Held, A., Kellndorfer, J., & Verbesselt, J. (2012).Synergies of multiple remote sensing data sources for REDD+ monitoring. CurrentOpinion in Environmental Sustainability, 4, 696–706.
Debella-Gilo, M., & Kääb, A. (2011). Sub-pixel precision image matching for measuringsurface displacements on mass movements using normalized cross-correlation.Remote Sensing of Environment, 115, 130–142.
Dobson, J. E., Bright, E. A., Ferguson, R. L., Field, D.W.,Wood, L. L., Haddad, K. D., Iredale, H.,III, Jenson, J. R., Klemas, V. V., Orth, R. J., & Thomas, J. P. (1995). In D.O. Commerce(Ed.), Coastal Change Analysis Program (C-CAP): guidance for regional implementation(Seattle, WA).
Doraiswamy, P. C., Hatfield, J. L., Jackson, T. J., Akhmedov, B., Prueger, J., & Stern, A. (2004).Crop condition and yield simulations using Landsat and MODIS. Remote Sensing ofEnvironment, 92, 548–559.
Doraiswamy, P. C., Sinclair, T. R., Hollinger, S., Akhmedov, B., Stern, A., & Prueger, J. (2005).Application of MODIS derived parameters for regional crop yield assessment. RemoteSensing of Environment, 97, 192–202.
Downing, J. A., Prairie, Y. T., Cole, J. J., Duarte, C. M., Tranvik, L. J., Striegl, R. G., McDowell,W. H., Kortelainen, P., Caraco, N. F., Melack, J. M., & Middelburg, J. J. (2006). The globalabundance and size distribution of lakes, ponds, and impoundments. Limnology andOceanography, 51, 2388–2397.
Drusch, M., Del Bello, U., Carlier, S., Colin, O., Fernandez, V., Gascon, F., Hoersch, B., Isola, C.,Laberinti, P., Martimort, P., Meygret, A., Spoto, F., Sy, O., Marchese, F., & Bargellini, P.(2012). Sentinel-2: ESA's Optical High-Resolution Mission for GMES OperationalServices. Remote Sensing of Environment, 120, 25–36.
Dubovik, O., Holben, B., Eck, T. F., Smirnov, A., Kaufman, Y. J., King, M.D., Tanre, D., &Slutsker, I. (2002). Variability of absorption and optical properties of key aerosoltypes observed in worldwide locations. Journal of the Atmospheric Sciences, 59,590–608.
Eidenshink, J., Schwind, B., Brewer, K., Zhu, Z. L., Quayle, B., & Howard, S. (2007). A projectfor monitoring trends in burn severity. Fire Ecology, 3, 3–21.
ESA (2013). ESA-NASA collaboration fosters comparable land imagery. http://www.esa.int/Our_Activities/Observing_the_Earth/GMES/ESA_NASA_collaboration_fosters_comparable_land_imagery (Last accessed October 1st 2013)
Flanner, M. G., Shell, K. M., Barlage, M., Perovich, D. K., & Tschudi, M.A. (2011). Radiativeforcing and albedo feedback from the Northern Hemisphere cryosphere between1979 and 2008. Nature Geoscience, 4, 151–155.
Food and Agriculture Organization (FAO) of the United Nations (2011). FAOSTAT/Resources/Land/. http://faostat3.fao.org/. (Last accessed October 1st 2013).
Fry, J. A., Xian, G., Jin, S., Dewitz, J. A., Homer, C. G., Yang, L., Barnes, C. A., Herold, N. D., &Wickham, J.D. (2011). Completion of the 2006 National Land Cover Database for theconterminous United States. Photogrammetric Engineering and Remote Sensing, 77,858–864.

170 D.P. Roy et al. / Remote Sensing of Environment 145 (2014) 154–172
Ganguly, S., Nemani, R. R., Zhang, G., Hashimoto, H., Milesi, C., Michaelis, A., Wang, W.,Votava, P., Samanta, A., Melton, F., Dungan, J. L., Vermote, E., Gao, F., Knyazikhin, Y.,& Myneni, R. B. (2012). Generating global Leaf Area Index from Landsat: Algorithmformulation and demonstration. Remote Sensing of Environment, 122, 185–202.
GCOS (2004). Implementation Plan for the Global Observing System for Climate in Sup-port of the UNFCCC, WMO/TD 1219. www.wmo.int/pages/prog/gcos/Publications/gcos-92_GIP.pdf
GCOS-154 (2011). Systematic observation requirements for satellite-based products forclimate supplemental details to the satellite-based component of the implementationplan for the global observing system for climate in support of the UNFCCC - (2011 up-date). In A. Simmons (Ed.), GCOS-154 Geneva, Switzerland: United Nations Environ-ment Programme, World Meteorological Organization and International Council forScience.
Gerace, A., & Schott, J. (2012, June 1). Over-water atmospheric correction for Landsat'snew OLI sensor. Proceeding of SPIE Ocean Sensing and Monitoring IV, 837211, Baltimore,Maryland.
Gerace, A.D., Schott, J. R., & Nevins, R. (2013). Increased potential tomonitor water qualityin the near-shore environment with Landsat's next-generation satellite. Journal ofApplied Remote Sensing, 7 (073558-073558).
Gitelson, A. A., Peng, Y., Masek, J. G., Rundquist, D. C., Verma, S., Suyker, A., Baker, J. M.,Hatfield, J. L., & Meyers, T. (2012). Remote estimation of crop gross primary produc-tion with Landsat data. Remote Sensing of Environment, 121, 404–414.
GOFC-GOLD (2012). A sourcebook of methods and procedures for monitoring andreporting anthropogenic greenhouse gas emissions and removals associated with de-forestation, gains and losses of carbon stocks in forests remaining forests, and fores-tation. GOFC-GOLD Report version COP18-1. The Netherlands: GOFC-GOLD Land CoverProject Office, Wageningen University (219 pp.).
Gordon, H. R., & Clark, D. K. (1981). Clear water radiances for atmospheric correction ofcoastal zone color scanner imagery. Applied Optics, 20, 4175–4180.
Goward, S., Arvidson, T., Williams, D., Faundeen, J., Irons, J., & Franks, S. (2006). Historicalrecord of Landsat global coverage: Mission operations, NSLRSDA, and internationalcooperator stations. Photogrammetric Engineering and Remote Sensing, 72, 1155–1169.
Goward, S. N., Masek, J. G., Williams, D. L., Irons, J. R., & Thompson, R. J. (2001). TheLandsat 7 mission, Terrestrial research and applications for the 21st century.Remote Sensing of Environment, 78, 3–12.
Griffiths, P., Kuemmerle, T., Kennedy, R. E., Abrudan, I. V., Knorn, J., & Hostert, P. (2012).Using annual time-series of Landsat images to assess the effects of forest restitutionin post-socialist Romania. Remote Sensing of Environment, 118, 199–214.
Gutman, G., Byrnes, R., Masek, J., Covington, S., Justice, C., Franks, S., & Headley, R. (2008).Towards monitoring Land-cover and land-use changes at a global scale: The globalland survey. Photogrammetric Engineering and Remote Sensing, 74, 6–10.
Hansen, J., Sato, M., & Ruedy, R. (2012). Perception of climate change. Proceedings of theNational Academy of Sciences of the United States of America, 109, E2415–E2423.
Hansen, M. C., Egorov, A., Potapov, P. V., Stehman, S. V., Tyukavina, A., Turubanova, S. A.,Roy, D. P., Goetz, S. J., Loveland, T. R., Ju, J., Kommareddy, A., Kovalskyy, V., Forsythe,C., & Bents, T. (2014). Monitoring conterminous United States (CONUS) land coverchange with Web-Enabled Landsat Data (WELD). Remote Sensing of Environment,140, 466–484.
Hansen, M. C., Egorov, A., Roy, D. P., Potapov, P., Ju, J., Turubanova, S., Kommareddy, I., &Loveland, T. R. (2011). Continuous fields of land cover for the conterminous UnitedStates using Landsat data: First results from the Web-Enabled Landsat Data(WELD) project. Remote Sensing Letters, 2, 279–288.
Hansen, M. C., & Loveland, T. R. (2012). A review of large area monitoring of land coverchange using Landsat data. Remote Sensing of Environment, 2012, 66–74.
Hansen, M. C., Potapov, P. V., Moore, R., Hancher, M., Turubanova, S. A., Tyukavina, A.,Thau, D., Stehman, S. V., Goetz, S. J., Loveland, T. R., Kommareddy, A., Egorov, A.,Chini, L., Justice, C. O., & Townshend, J. R. G. (2013). High-resolution global maps of21st-century forest cover change. Science, 342(6160), 850–853.
Hansen,M. C., Roy, D. P., Lindquist, E., Adusei, B., Justice, C. O., & Altstatt, A. (2008). Ameth-od for integrating MODIS and Landsat data for systematic monitoring of forest coverand change in the Congo Basin. Remote Sensing of Environment, 112(5), 2495–2513.
Helder, D., Thome, K. J., Mishra, N., Chander, G., Xiong, X., Angal, A., & Taeyoung, C. (2013).Absolute radiometric calibration of Landsat using a pseudo invariant calibration site.IEEE Transactions on Geoscience and Remote Sensing, 51, 1360–1369.
Horler, D. N., & Ahern, F. J. (1986). Forestry information content of thematic mapper data.International Journal of Remote Sensing, 7, 405–428.
Huang, C., Goward, S. N., Masek, J. G., Thomas, N., Zhu, Z., & Vogelmann, J. E. (2010). Anautomated approach for reconstructing recent forest disturbance history usingdense Landsat time series stacks. Remote Sensing of Environment, 114, 183–198.
INPE (2013). http://www.obt.inpe.br/prodes/index.php (Last accessed October 1st 2013)IPCC (2013). Working Group I contribution to the IPCC Fifth Assessment Report Climate
Change 2013. The Physical Science Basis, Final Draft Underlying Scientific-TechnicalAssessment (http://www.ipcc.ch/report/ar5/wg1/ (Last accessed October 1st 2013)).
Irons, J. R., Dwyer, J. L., & Barsi, J. A. (2012). The next Landsat satellite: The Landsat DataContinuity Mission. Remote Sensing of Environment, 122, 11–21.
Irons, J. R., & Loveland, T. R. (2013). Eighth Landsat satellite becomes operational.Photogrammetric Engineering and Remote Sensing, 79, 398–401.
Irons, J. R., & Masek, J. G. (2006). Requirements for a Landsat Data Continuity Mission.Photogrammetric Engineering and Remote Sensing, 72, 1102–1108.
Jennings, M.D. (2000). Gap analysis: Concepts, methods, and recent results. LandscapeEcology, 15, 5–20.
Johnson, D.M. (2008). A comparison of coincident Landsat-5 TM and Resourcesat-1AWiFS imagery for classifying croplands. Photogrammetric Engineering & RemoteSensing, 74, 1413–1423.
Johnson, D.M., & Mueller, R. (2010). The 2009 Cropland Data Layer. PhotogrammetricEngineering and Remote Sensing, 76, 1202–1205.
Ju, J., & Roy, D. P. (2008). The availability of cloud-free Landsat ETM+ data over the con-terminous United States and globally. Remote Sensing of Environment, 112, 1196–1211.
Ju, J., Roy, D. P., Vermote, E., Masek, J., & Kovalskyy, V. (2012). Continental-scale validationof MODIS-based and LEDAPS Landsat ETM+ atmospheric correction methods.Remote Sensing of Environment, 122, 175–184.
Justice, C. O., Bailey, G. B., Maiden, M. E., Rasool, S. I., Strebel, D. E., & Tarpley, J.D. (1995).Recent data and information system initiatives for remotely sensed measurements ofthe land surface. Remote Sensing of Environment, 51, 235–244.
Justice, C., Townshend, J., Vermote, E., Masuoka, E., Wolfe, R., Saleous, N., Roy, D., &Morisette, J. (2002). An overview of MODIS Land data processing and product status.Remote Sensing of Environment, 83, 3–15.
Justice, C. O., Vermote, E., Townshend, J., Defries, R., Roy, D. P., Hall, D., Salomonson, V.,Privette, J., Riggs, G., Strahler, A., Lucht, W., Myneni, R., Knyazikhin, Y., Running, S.,Nemani, R., Wan, Z., Huete, A., van Leeuwen, W., Wolfe, R., Giglio, L., Muller, J. -P.,Lewis, P., & Barnsley, M. (1998). TheModerate Resolution Imaging Spectroradiometer(MODIS): Land remote sensing for global change research. IEEE Transactions onGeoscience and Remote Sensing, 36, 1228–1249.
Kalma, J.D., McVicar, T. R., & McCabe, M. F. (2008). Estimating land surface evaporation: Areview of methods using remotely sensing surface temperature data. SurveyGeophysics, http://dx.doi.org/10.1007/s10712-10008-19037-z.
Kaufman, Y. J. (1989). The atmospheric effect on remote sensing and its correction. In G.Asrar (Ed.), Theory and Application of Optical Remote Sensing (pp. 341). New York:Wiley-Interscience.
Keeling, C. D. (1998). Rewards and penalties of monitoring the earth. Annual Review ofEnergy and the Environment, 23, 25–82.
Kennedy, R. E., Yang, Z., & Cohen,W. B. (2010). Detecting trends in forest disturbance andrecovery using yearly Landsat time series: 1. LandTrendr — Temporal segmentationalgorithms. Remote Sensing of Environment, 114, 2897–2910.
Kennedy, R. E., Zhiqiang, Y., Cohen, W. B., Pfaff, E., Braaten, J., & Nelson, P. (2012). Spatialand temporal patterns of forest disturbance and regrowth within the area of theNorthwest Forest Plan. Remote Sensing of Environment, 122, 117–133.
Kieffer, H. H., Stone, T. C., Barnes, R. A., Bender, S.C., Eplee, R. E., Mendenhall, J. A., et al.(2003). On-orbit radiometric calibration over time and between spacecraft usingthe moon. Proceedings of SPIE, 4881, 287–298.
Kovalskyy, V., & Roy, D. P. (2013). The global availability of Landsat 5 TM and Landsat 7ETM+ land surface observations and implications for global 30m Landsat data prod-uct generation. Remote Sensing of Environment, 130, 280–293.
Kovalskyy, V., Roy, D. P., Zhang, X., & Ju, J. (2011). The suitability of multi-temporalWeb-Enabled Landsat Data (WELD) NDVI for phenological monitoring — a compari-son with flux tower and MODIS NDVI. Remote Sensing Letters, 3(4), 325–334.
Lauer, D. T., Morain, S. A., & Salomonson, V. V. (1997). The Landsat program: Its origins,evolution, and impacts. Photogrammetric Engineering and Remote Sensing, 63, 831–838.
Lee, D. S., Storey, J. C., Choate, M. J., & Hayes, R. (2004). Four years of Landsat-7 on-orbitgeometric calibration and performance. IEEE Transactions on Geoscience and RemoteSensing, 42, 2786–2795.
Lehmann, E. A., Wallace, J. F., Caccetta, P. A., Furby, S. L., & Zdunic, K. (2013). Forest covertrends from time series Landsat data for the Australian continent. InternationalJournal of Applied Earth Observation and Geoinformation, 21, 453–462.
Lehner, B., & Döll, P. (2004). Development and validation of a global database of lakes, res-ervoirs and wetlands. Journal of Hydrology, 296, 1–22.
Lewis, P., Gómez-Dans, J., Kaminski, T., Settle, J., Quaife, T., Gobron, N., Styles, J., & Berger,M. (2012). An Earth Observation Land Data Assimilation System (EO-LDAS). RemoteSensing of Environment, 120, 219–235.
Li, F., Jupp, D. L., Reddy, S., Lymburner, L., Mueller, N., Tan, P., & Islam, A. (2010). An eval-uation of the use of atmospheric and BRDF correction to standardize Landsat data.IEEE Journal of Selected Topics in Applied Earth Observations and Remote Sensing, 3,257–270.
Li, J., & Sheng, Y. (2012). An automated scheme for glacial lake dynamics mapping usingLandsat imagery and digital elevation models: A case study in the Himalayas.International Journal of Remote Sensing, 33, 5194–5213.
Lindquist, E., Hansen, M. C., Roy, D. P., & Justice, C. O. (2008). The suitability of decadalimage data sets for mapping tropical forest cover change in the Democratic Republicof Congo: Implications for themid-decadal global land survey. International Journal ofRemote Sensing, 29, 7269–7275.
Lobell, D. B., Ortiz-Monasterio, J. I., Asner, G. P., Naylor, R. L., & Falcon, W. P. (2005).Combining field surveys, remote sensing, and regression trees to understand yieldvariations in an irrigated wheat landscape. Agronomy Journal, 97, 241–249.
Loveland, T. R., & Dwyer, J. L. (2012). Landsat: Building a strong future. Remote Sensing ofEnvironment, 122, 22–29.
MacDonald, R. B., Hall, F. G., & Erb, R. B. (1976, Oct. 6–10). The use of Landsat data in aLarge Area Crop Inventory Experiment (LACIE). Proceedings of the Tenth Interna-tional Symposium of Remote Sensing of Environment, Volume I (Ann Arbor,Michigan).
Mankoff, K. D., Jacobs, S. S., Tulaczyk, S. M., & Stammerjohn, S. (2012). The role of PineIsland Glacier ice shelf basal channels in deep-water upwelling, polynyas, andocean circulation in Pine Island Bay, Antarctica. Annals of Glaciology, 53, 123–128.
Markham, B.L., Dabney, P. W., Storey, J. C., Morfitt, R., Knight, E. J., Kvaran, G., & Lee, K.(2008, November 18-20). Landsat Data Continuity Mission calibration and validation.Proceedings of the PECORA 17 Conference.
Markham, B.L., Goward, S., Arvidson, T., Barsi, J., & Scaramuzza, P. (2006). Landsat-7long-term acquisition plan radiometry — Evolution over time. PhotogrammetricEngineering & Remote Sensing, 72, 1129–1135.
Markham, B.L., & Helder, D. L. (2012). Forty-year calibrated record of earth-reflected radi-ance from Landsat: A review. Remote Sensing of Environment, 122, 30–40.
Markham, B.L., Irons, J. R., & Storey, J. C. (2013). Landsat data continuity mission(LDCM) — Now Landsat-8: Six months on-orbit. Proceedings of SPIE, 8866.

171D.P. Roy et al. / Remote Sensing of Environment 145 (2014) 154–172
Markham, B.L., Storey, J. C., Williams, D. L., & Irons, J. R. (2004). Landsat sensorperformance: History and current status. IEEE Transactions on Geoscience andRemote Sensing, 42, 2691–2694.
Masek, J. G., Goward, S. N., Kennedy, R. E., Cohen, W. B., Moisen, G. G., Schleeweis, K., &Huang, C. (2013). United States forest disturbance trends observed using Landsattime series. Ecosystems, 16, 1087–1104.
Masek, J. G., Vermote, E. F., Saleous, N. E., Wolfe, R., Hall, F. G., Huemmrich, K. F.,Gao, F., Kutler, J., & Lim, T. K. (2006). A Landsat surface reflectance dataset forNorth America 1990–2000. IEEE Geoscience and Remote Sensing Letters, 3,68–72.
Masuoka, E., Roy, D. P., Wolfe, R., Morisette, J., Sinno, S., Teague, M., Saleous, N., Devadiga,S., Justice, C., & Nickeson, J. (2011). MODIS land data products—Generation, qualityassurance and validation. In B. Ramachandran, C. Justice, & M. Abrams (Eds.), Landremote sensing and global environmental change: NASA's Earth observing system andthe science of ASTER and MODIS. Remote Sensing and Digital Image Processing Series,Vol. 11, Springer (873 pp.).
Mayaux, P., Pekel, J. F., Desclée, B., Donnay, F., Lupi, A., Achard, F., Clerici, M., Bodart, C.,Brink, A., Nasi, R., & Belward, A. (2013). State and evolution of the African rainforestsbetween 1990 and 2010. Philosophical Transactions of the Royal Society, B: BiologicalSciences, 368(1625).
McCorkel, J., Thome, K., & Lockwood, R. B. (2013). Absolute radiometric calibrationof narrow-swath imaging sensors with reference to non-coincident wide-swath sensors. IEEE Transactions on Geoscience and Remote Sensing, 51,1309–1318.
Meybeck, M. (1995). Global distribution of lakes. In A. Lerman, D.M. Imboden, & J. R. Gat(Eds.), Physics and chemistry of lakes (pp. 1–35). Berlin: Springer-Verlag.
Miller, H. M., Richardson, Leslie, Koontz, S. R., Loomis, John, & Koontz, Lynne (2013).Users, uses, and value of Landsat satellite imagery—Results from the 2012 survey ofusers. U.S. Geological Survey Open-File Report 2013–1269, http://dx.doi.org/10.3133/ofr20131269 (51 pp.).
Mora, B., Wulder, M.A., White, J. C., & Hobart, G. (2013). Modeling stand height, volume,and biomass from very high spatial resolution satellite imagery and samples ofairborne-lidar. Remote Sensing, 5, 2308–2326.
Motyka, R. J., Hunter, L., Echelmeyer, K., & Connor, C. (2003). Submarine melting at theterminus of a temperate tidewater glacier, LeConte Glacier, Alaska, USA. Annals ofGlaciology, 36, 57–65.
Myhre, G., Kvalevag, M. M., & Schaaf, C. B. (2005). Radiative forcing due to anthropogenicvegetation change based on MODIS surface albedo data set. Geophysical ResearchLetters, 32, L21410, http://dx.doi.org/10.1029/2005GL024004.
Myneni, R., Tucker, C., Asrar, G., & Keeling, C. (1998). Interannual variations insatellite-sensed vegetation index data from 1981 to 1991. Journal of GeophysicalResearch, 103, 6145–6160.
Nemani, R., Hashimoto, H., Votava, P., Melton, F., Wang, W., Michaelis, A., Mutch, L., Milesi,C., Hiatt, S., & White, M. (2009). Monitoring and forecasting ecosystem dynamicsusing the Terrestrial Observation and Prediction System (TOPS). Remote Sensing ofEnvironment, 113, 1497–1509.
Nemani, R., Votava, P., Michaelis, A., Melton, F., & Milesi, C. (2011). NASA Earth Exchange:A collaborative supercomputing environment for global change science. Transactionof EOS, 13, 109–110.
NRC, National Research Council (2000). Issues in the Integration of Research and OperationalSatellite Systems for Climate Research: Part I. Requirements and capabilities.WashingtonD.C.: The National Academies Press (152 pp.).
NRC, National Research Council (2007). Earth science and applications from space: Impera-tives for the next DECADE AND BEYOND. Washington DC: National Research Council(456 pp.).
NRC, National Research Council (2013). Landsat and beyond: Sustaining and enhancingthe nation's land imaging program. Washington, DC: The National Academies Press(73 pp.).
NSEO (The Office of the State Engineer of the State of Nevada) (2012). The Ruling (#6164)in the matter of applications 54003 through 54021, inclusive, filed to appropriate theunderground waters of the Spring Valley hydrographic basin (184). Nevada: Lincolnand White Pine Counties (218 pp.).
Olmanson, L. G., Bauer, M. E., & Brezonik, P. L. (2008). A 20-year Landsat water claritycensus of Minnesota's 10,000 lakes. Remote Sensing of Environment, 112,4086–4097.
Onderka, M., & Pekárová, P. (2008). Retrieval of suspended particulate matter concentra-tions in the Danube River from Landsat ETM data. Science of the Total Environment,397, 238–243.
Quattrochi, D. A., & Luvall, J. C. (Eds.). (2004). Thermal remote sensing in land surfaceprocesses. Boca Raton, FL: CRC Press (440 pp.).
Rollins, M. G. (2009). LANDFIRE: A nationally consistent vegetation, wildland fire, and fuelassessment. International Journal of Wildland Fire, 18, 235–249.
Roy, D. P. (2000). The impact of misregistration upon composited wide field of view sat-ellite data and implications for change detection. IEEE Transactions on Geoscience andRemote Sensing, 38, 2017–2032.
Roy, D. P., Borak, J. S., Devadiga, S., Wolfe, R. E., Zheng, M., & Descloitres, J. (2002). TheMODIS Land product quality assessment approach. Remote Sensing of Environment,83, 62–76.
Roy, D. P., Ju, J., Kline, K., Scaramuzza, P. L., Kovalskyy, V., Hansen, M. C., Loveland, T. R.,Vermote, E. F., & Zhang, C. (2010). Web-enabled Landsat Data (WELD): LandsatETM+ Composited Mosaics of the Conterminous United States. Remote Sensing ofEnvironment, 114, 35–49.
Roy, D. P., Qin, Y., Kovalskyy, V., Vermote, E. F., Ju, J., Egorov, A., Hansen, M. C.,Kommareddy, I., & Yan, L. (2014). Conterminous United States demonstration andcharacterization of MODIS-based Landsat ETM+ atmospheric correction. RemoteSensing of Environment, 140, 433–449.
Santos, C., Lorite, I. J., Allen, R. G., & Tasumi, M. (2012). Aerodynamic parameterization ofthe satellite-based energy balance (METRIC) Model for ET estimation in rainfed oliveorchards of Andalusia, Spain. Water Resources Management, 26, 3267–3283.
Scambos, T. A., Bohlander, J. A., Shuman, C. A., & Skvarca, P. (2004). Glacier accelerationand thinning after ice shelf collapse in the Larsen B embayment, Antarctica.Geophysical Research Letters, 31(18), L18402.
Scambos, T. A., Dutkiewitcz, M. J., Wilson, J. C., & Bindschadler, R. A. (1992). Application ofimage cross-correlation software to the measurement of glacier velocity using satel-lite image data. Remote Sensing of Environment, 42, 177–186.
Scaramuzza, P. L., Bouchard, M.A., & Dwyer, J. L. (2012). Development of the Landsatdata continuity mission cloud-cover assessment algorithms. IEEE Transactions onGeoscience and Remote Sensing, 50, 1140–1153.
Schaaf, C. B., Cihlar, J., Belward, A., Dutton, E., & Verstraete, M. (2009, May). Albedoand reflectance anisotropy. In R. Sessa (Ed.), ECV-T8: GTOS assessment of the sta-tus of the development of standards for the terrestrial essential climate variables.Rome: FAO.
Schaaf, C., Gao, F., Strahler, A. H., Lucht,W., Li, X., Tsang, T., Strugnell, N. C., Zhang, X., Jin, Y.,Muller, J. -P., Lewis, P., Barnsley, M., Hobson, P., Disney, M., Roberts, G., Dunderdale,M., Doll, C., d'Entremont, R., Hu, B., Liang, S., Privette, J. L., & Roy, D. P. (2002). Firstoperational BRDF, albedo and nadir reflectance products from MODIS. RemoteSensing of Environment, 83, 135–148.
Schaaf, C. L. B., Liu, J., Gao, F., & Strahler, A. H. (2011). MODIS albedo and reflectance an-isotropy products from aqua and terra. In B. Ramachandran, C. Justice, & M. Abrams(Eds.), Land remote sensing and global environmental change: NASA's earch observingsystem and the science of ASTER and MODIS. Remote Sensing and Digital ImageProcessing Series, Vol. 11, Springer (873 pp.).
Schott, J. R., Hook, S. J., Barsi, J. A., Markham, B.L., Miller, J., Padula, F. P., & Raqueno, N. G.(2012). Thermal infrared radiometric calibration of the entire Landsat 4, 5, and 7archive (1982–2010). Remote Sensing of Environment, 41–49.
Schroeder, W., Prins, E., Giglio, L., Csiszar, I., Schmidt, C., Morisette, J., & Morton, D. (2008).Validation of GOES andMODIS active fire detection products using ASTER and ETM+data. Remote Sensing of Environment, 112, 2711–2726.
Sheng, Y., & Li, J. (2011). Satellite-observed endorheic lake dynamics across the TibetanPlateau between circa 1976 and 2000. In Y. Q.Wang (Ed.), Remote sensing of protectedlands (pp. 305–319). New York: CRC Press.
Shimabukuro, Y. E., Batista, G. T., Mello, E. M. K., Moreira, J. C., & Duarte, V. (1998). Usingshade fraction image segmentation to evaluate deforestation in Landsat Thematic Map-per images of the Amazon Region. International Journal of Remote Sensing, 19, 535–541.
Shuai, Y., Masek, J. G., Gao, F., & Schaaf, C. B. (2011). An algorithm for the retrieval of 30-msnow-free albedo from Landsat surface reflectance and MODIS BRDF. Remote Sensingof Environment, 115, 2204–2216.
Shukla, A., Arora, M. K., & Gupta, R. P. (2010). Synergistic approach for mappingdebris-covered glaciers using optical–thermal remote sensing data withinputs from geomorphometric parameters. Remote Sensing of Environment, 114,1378–1387.
Skole, D. S., Justice, C. O., Janetos, A., & Townshend, J. R. G. (1997). A land cover changemonitoring program: a strategy for international effort. Mitigation and AdaptationStrategies for Global Change. Amsterdam, The Netherlands: Kluwer, 1–19.
Skole, D., & Tucker, C. (1993). Tropical deforestation and habitat fragmentation in theAmazon: Satellite data from 1978 to 1988. Science, 260, 1905–1910.
Slater, P. N., Biggar, S. F., Holm, R. G., Jackson, R. D., Mao, Y., Moran, M. S., Palmer, J. M., &Yuan, B. (1987). Reflectance-and radiance-based methods for the in-flight absolutecalibration of multispectral sensors. Remote Sensing of Environment, 22, 11–37.
Sleeter, B.M., Sohl, T. L., Bouchard, M.A., Reker, R. R., Soulard, C. E., Acevedo,W., Griffith, G.E., Sleeter, R. R., Auch, R. F., Sayler, K. L., Prisley, S., & Zhu, Z. (2012). Scenarios of landuse and land cover change in the conterminous United States: Utilizing the special re-port on emission scenarios at ecoregional scales. Global Environmental Change, 22,896–914.
Smith, L. C., Sheng, Y., MacDonald, G. M., & Hinzman, L. D. (2005). Disappearing Arcticlakes. Science, 308(5727), 1429.
Soverel, N. O., Coops, N. C., White, J. C., & Wulder, M.A. (2010). Characterizing the forestfragmentation of Canada's national parks. Environmental Monitoring and Assessment,164, 481–499.
Stearns, L., Smith, B., & Hamilton, G. (2008). Increased flow speed on a large Antarctic gla-cier caused by sub-glacial floods. Nature Geoscience, 1, 827–838.
Stoney, W. E. (2008). ASPRS guide to land imaging satellites.Noblis Inc. (15 pp. URL: http://www.asprs.org/a/news/satellites/ASPRS_DATABASE_021208.pdf (Last accessedOctober 1st 2013)).
Storey, J., Lee, K., & Choate, M. (2008, November 18–20). Geometric performance compar-ison between the OLI and the ETM+. Proceedings of the PECORA 17 Conference.
Sullivan, A., Huntington, J., & Morton, C. (2011). Remote sensing of consumptive usein the Walker River Basin, Nevada. American Water Resource Association AnnualConference, Albuquerque, NM, 2011.
SWBD (2005). Shuttle Radar Topography Mission water body data set. http://www2.jpl.nasa.gov/srtm/index.html (Digital Media (Last accessed October 1st 2013))
Swithinbank, C. (1988). Satellite image atlas of glaciers of the world: Antarctica. In R.S. Williams, & J. G. Ferrigno (Eds.), U.S. Geological Survey Professional Paper1386-B.
Tackett, J. L., & Di Girolamo, L. (2009). Enhanced aerosol backscatter adjacent to tropicaltrade wind clouds revealed by satellite-based lidar. Geophysical Research Letters, 36,L14804.
Tedesco, M., & Steiner, N. (2011). In-situ multispectral and bathymetric measurementsover a supraglacial lake in western Greenland using a remotely controlled watercraft.The Cryosphere, 5(2), 445–452.
Thome, K., Reuter, D., Lunsford, A., Montanaro, M., Smith, R., Tesfaye, Z., & Wenny, B.(2011). Calibration of the thermal infrared sensor on the Landsat Data Continuity
172 D.P. Roy et al. / Remote Sensing of Environment 145 (2014) 154–172
Mission. Geoscience and Remote Sensing Symposium (IGARSS), 24–29 July 2011, 2011IEEE International (pp. 985–988).
Townshend, J. R. G., & Justice, C. O. (1988). Selecting the spatial-resolution of satellite sen-sors required for global monitoring of land transformations. International Journal ofRemote Sensing, 9, 187–236.
Townshend, J. R. G., Justice, C. O., Gurney, C., & McManus, J. (1992). The impact of misreg-istration on change detection. IEEE Transactions on Geoscience and Remote Sensing, 30,1054–1060.
Trenberth, K. E., Anthes, R. A., Belward, A., Brown, O., Habermann, T., Karl, T. R., Running,S., Ryan, B., Tanner, M., & Wielicki, B. (2013). Challenges of a sustained climateobserving system. In G. R. Asrar, & J. W. Hurrell (Eds.), Climate Science for ServingSociety: Research, Modeling and Prediction Priorities. Springer (484 pp.).
Trezza, R., Allen, R. G., Robison, C.W., Kramber,W., Kjaersgaard, J., Tasumi,M., & Garcia, M.(2008). Enhanced resolution of evapotranspiration from riparian systems and fieldedges by sharpening the Landsat thermal band. Proceedings of the ASCE EWRI WorldEnvironmental & Water Resources Congress, May 12–16, 2008. Honolulu, Hawaii, USA(9 pp.).
Tu, T. M., Huang, P.S., Hung, C. L., & Chang, C. P. (2004). A fast intensity-hue-saturation fu-sion technique with spectral adjustment for IKONOS imagery. IEEE Geoscience andRemote Sensing Letters, 1, 309–312.
Tucker, C. J., Grant, D.M., & Dykstra, J.D. (2004). NASA's global orthorectified Landsat dataset. Photogrammetric Engineering and Remote Sensing, 70, 313–322.
Tucker, C. J., Pinzon, J. E., Brown, M. E., Slayback, D. A., Pak, E. W., Mahoney, R., Vermote, E.F., & El Saleous, N. (2005). An extended AVHRR 8‐km NDVI dataset compatible withMODIS and SPOT vegetation NDVI data. International Journal of Remote Sensing, 26,4485–4498.
U.S. Geological Survey (2007). Facing tomorrow's challenges—U.S. Geological Survey sciencein the decade 2007–2017. U.S. Geological Survey Circular, 1309, (70 pp.).
UN (2012). The future we want. Outcome of the United Nations Conference on SustainableDevelopment, Rio de Janeiro, Brazil 20–22 June 2012, A/CONF.216/L (pp. 53).
Ungar, S. G., Pearlman, J. S., Mendenhall, J. A., & Reuter, D. (2003). Overview of the EarthObserving One (EO-1) mission. IEEE Transactions on Geoscience and Remote Sensing,41, 1149–1159.
United Nations Population Division (2011).World population prospects: The 2010 revision.New York: United Nations (http://esa.un.org/unpd/wpp/index.htm).
USDA, National Agricultural Statistics Service Cropland Data Layer (2013). Publishedcrop-specific data layer [Online]. Washington, DC: USDA-NASS (Available at http://nassgeodata.gmu.edu/CropScape/ (accessed 13.05.14)).
Ustin, S. L., Roberts, D. A., Gamon, J. A., Asner, G. P., & Green, R. O. (2004). Using imagingspectroscopy to study ecosystem processes and properties. BioScience, 54, 523–534.
Vermote, E. F., El Saleous, N. Z., & Justice, C. O. (2002). Atmospheric correction of MODISdata in the visible to middle infrared: first results. Remote Sensing of Environment,83, 97–111.
Vermote, E. F., & Kotchenova, S. (2008). Atmospheric correction for themonitoring of landsurfaces. Journal of Geophysical Research, 113, D23S90.
Vermote, E., Saleous, N. E. L., & Holben, B. (1995). Aerosol retrieval and atmospheric cor-rection. In G. D'Souza, A. S. Belward, & J. P. Malingreau (Eds.), Advances in the use ofNOAA AVHRR data for land applications (pp. 93–124). Springer.
Vogelmann, J. E., Kost, J. R., Tolk, B., Howard, S., Short, K., Chen, X. X., Huang, C. Q., Pabst, K.,& Rollins, M. G. (2011). Monitoring landscape change for LANDFIRE using multi-temporal satellite imagery and ancillary data. IEEE Journal of Selected Topics inApplied Earth Observations and Remote Sensing, 4, 252–264.
WELD (2013). WELD Version 1.5 Product Distribution Web Site. http://weld.cr.usgs.gov/(Last accessed October 1st 2013)
Williams, R. S., Ferrigno, J. G., Swithinbank, C., Lucchitta, B. K., & Seekins, B.A. (1995).Coastal-change and glaciological maps of Antarctica. Annals of Glaciology, 21, 284–290.
Williams, D. L., Goward, S., & Arvidson, T. (2006). Landsat: yesterday, today, and tomor-row. Photogrammetric Engineering & Remote Sensing, 72(10), 1171–1178.
Wolfe, R., Nishihama, M., Fleig, A., Kuyper, J., Roy, D., Storey, J., & Patt, F. (2002). Achievingsub-pixel geolocation accuracy in support of MODIS land science. Remote Sensing ofEnvironment, 83, 31–49.
Woodcock, C. E., Allen, R., Anderson, M., Belward, A., Bindschadler, R., Cohen,W. B., Gao, F.,Goward, S. N., Helder, D., Helmer, E., Nemani, R., Oreopoulos, L., Schott, J., Thenkabail,P.S., Vermote, E. F., Vogelmann, J., Wulder, M.A., & Wynne, R. (2008). Free access toLandsat imagery. Science, 320, 1011.
Wu, X., Sullivan, J. T., & Heidinger, A. K. (2010). Operational calibration of the AdvancedVery High Resolution Radiometer (AVHRR) visible and near-infrared channels.Canadian Journal of Remote Sensing, 36, 602–616.
Wulder, M.A., & Masek, J. G. (2012). Preface to Landsat Legacy Special Issue: Continuingthe Landsat legacy. Remote Sensing of Environment, 122, 1.
Wulder, M.A., Masek, J. G., Cohen, W. B., Loveland, T. R., & Woodcock, C. E. (2012). Open-ing the archive: How free data has enabled the science and monitoring promise ofLandsat. Remote Sensing of Environment, 122, 2–10.
Wulder, M.A., White, J. C., Cranny, M., Hall, R. J., Luther, J. E., Beaudoin, A., Goodenough,D.G., & Dechka, J. A. (2008). Monitoring Canada's forests. Part 1: Completion of theEOSD land cover project. Canadian Journal of Remote Sensing, 34, 549–562.
Wulder, M.A., White, J. C., Masek, J. G., Dwyer, J., & Roy, D. P. (2011). Continuity of Landsatobservations: Short term considerations. Remote Sensing of Environment, 115, 747–751.
Xue, Y., Li, Y., Guang, J., Zhang, X., & Guo, X. (2008). Small satellite remote sensing andapplications — History, current AND FUTURE. International Journal of RemoteSensing, 29, 4339–4372.
Yamaguchi, Y., Kahle, A.B., Tsu, H., Kawakami, K., & Pniel, M. (1998). Overview of Ad-vanced Spaceborne Thermal Emission and Reflection Radiometer (ASTER). IEEETransactions on Geoscience and Remote Sensing, 36, 1062–1071.
Zhu, Z., Woodcock, C. E., & Olofsson, P. (2012). Continuous monitoring of forestdisturbance using all available Landsat imagery. Remote Sensing of Environment,122, 75–91.
Zwally, H. J., Abdalati, W., Hering, T., Larson, K., Saba, J., & Steffen, K. (2002).Surface melt-induced acceleration of Greenland ice-sheet flow. Science, 297,218–222.