remote sensing of precipitation, cloud, aerosol and water
TRANSCRIPT
Remote Sensing of Precipitation, Cloud, Aerosol and Water Vapor Using Radar, Lidar and Microwave
Radiometer
Presentation at IMD, Delhi October 1, 2012

2

Overarching proposition: The physical and dynamical processes key to MJO initiation are closely connected to the unique features of the tropical Indian Ocean (e.g., monsoon flows, thermocline ridge,
Wyrtki jets) and must be adequately understood using local observations.
Goal: Expedite our understanding of MJO initiation processes and efforts to improve simulation and prediction of the MJO
Objectives: – Collect observations (field campaign)
– Establish empirical statistics; prepare data for model constraints, validation, and evaluation (analysis)
– Test hypotheses; identify model deficiencies; provide better physical basis for model improvement (modeling)
– Develop prediction indices for MJO initiation; benchmark improvement in MJO prediction (forecast)

DYNAMO (Dynamics of the MJO)
The US Participation in CINDY2011 (Cooperative Indian Ocean Experiment on Intraseasonal Variability in Year 2011)
October 1, 2011 – March 31, 2012
Land-based operational sounding site
R/V Mirai R/V Ron Brown R/V Southern Surveyor
R/V Sagar Kanya
Land-based enhanced sounding site
R/V Revelle
10S
Eq
65E 75E 85E
Gan
Diego Garcia
NE
SE
RAMA

Hypotheses: Three essential factors for MJO initiation
I. Interaction between convection and its environmental moisture
II. Distinct roles of different types of convective clouds at each MJO initiation stage
III. Upper ocean processes and air-sea interaction
Central Problem: Maintenance and transition of different MJO initiation stages
A B C
Conceptual Model for MJO initiation: Pre-onset stage (A): Convectively suppressed; recharging
with deepening moist layer, aided by shallow clouds Onset stage (B): Convectively active, with both shallow and deep (including stratiform) convective clouds; deep
moist layer, maintained by low-level moisture supply Post-onset stage (C): strong surface wind and entrainment
cooling; deep convection declining due to low SST

Facility Platform Period Hypothesis Testing
S-PolKa radar Gan IOP I, II
SMART radar Gan EOP I, II
AMF2 Gan EOP I, II
ISS Diego Garcia IOP I, II
GAUS/wind profiler US ship IOP I, II
TOGA radar US ship IOP I, II
aerosol US ship IOP II
surface flux, Doppler lidar, cloud radar
US ship IOP I, II, III
upper-ocean mixing US ship IOP III
surface current and temperature drifters EOP III
surface meteorology and upper-ocean profiles
moorings IOP III
Summary of DYNAMO Observations
IOP: October 1, 2011 – January 15, 2012 EOP: October 1, 2011 – March 31, 2012
Gan
Sup
er si
te

Indian Ocean region for DYNAMO
7
India
Male
Maldives
Sri Lanka
Addu Atoll
Diego Garcia

Addu Atoll
Gan Island
habitat islands linked by the road
Wharf

Cloud particles
Light rain
Moderate rain Heavy rain
Drizzle
Hail
Rain/hail mix
Graupel/small hail Graupel/rain
Dry snow
Wet snow Oriented ice crystals
Irregular ice crystals Super cooled liquid drople
Insects
Birds Ground clutter
Reflectivity (dBZ)
Differential Reflectivity (dB)
Particle classification
S-PolKa Radar • Mass, Latent Heating Rates,
Profiles • Hydrometeor Identification
• Detection of cloud droplets
• Raindrop size
distribution
• Effect of Bragg scatter is less at
Ka-band
• Improved cloud microphysical
retrieval (precipitation type,
shape, size and concentration)
using both dual-wavelength and dual-polarization
observations

Objectives
• Retrieve path-integrated humidity – Differential gaseous absorption – Compare reflectivity at nearest edge of
cloud – Create profile by plotting mid-point of
path integrated estimates
Range
Hei
ght
Range resolved cloud liquid
Path integrated water vapor profiles
+ +
+
• Retrieve range-resolved liquid water content (LWC) and median volume
diameter (MVD) through clouds – Differential absorption through
clouds
+ +

Method: Humidity retrieval
• Run radiation model many times varying T, P and specific humidity (SH, g m-3)
• Compute polynomial fit of SH to attenuation Sp
ecifi
c hu
mid
ity (g
m-3
)
1-way atm attenuation (dB km-1)
SH = 201.40A3 – 209.60A2 + 120.55A – 2.25
Where SH is specific humidity (g m-3) and A is gaseous attenuation (dB km-1)
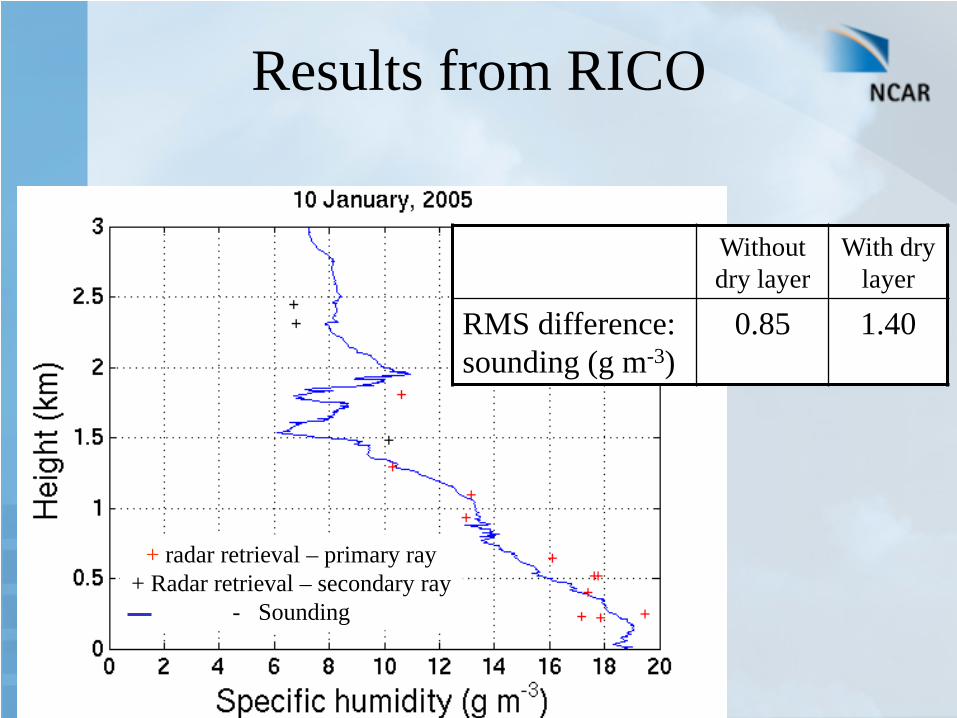
Results from RICO
+ radar retrieval – primary ray + Radar retrieval – secondary ray
- Sounding
Without dry layer
With dry layer
RMS difference: sounding (g m-3)
0.85 1.40

Detection of Cloud Droplets/Ice Using IMD S-band Radars
Minimum detectable signal (dBZ) with SNR = 3 dB versus range for no attenuation losses (blue), 0.1 dB km-1 (red) and 0.2 dB km-1 (green) gaseous attenuation loss (2-way).

LWC from radar alone
• Z = 0.34LWC1.42 (gm-3) • Physical basis • Assumes no ice!!!!!
From Vivekanandan et al. 1999
Modeled Gamma DSD’s

Sample Plane Parallel Indicator (PPI) Scan From WISP04, 2004.

Method: Liquid retrieval
• Liquid water attenuation at Ka-band (Aka) linearly related to LWC (g m-3) – No dependence on drop size distribution – Small temperature correction (CT)
• MVD (mm) retrieved from LWC and reflectivity (Ze, mm6 m-3)
LWC = 0.74*Aka*CT
MVD3 = 2.16 x 10⁻⁴*Ze/LWC


Comparison of liquid water content between radar/radiometer retrievals and in-situ measurements during WISP04. In-situ measurements are from a liquid water probe on board the UND Citation research aircraft.
+ In-situ
Radar
Liquid water content, g m-3
Alti
tude
, m

Comparison of dual-wavelength radar and radiometer-derived liquid water path for 22 March 1991 from 0900 to 0912 GMT.
National Center for Atmospheric Research
Azimuth (deg)
Path
-inte
grat
ed
Liq
uid
Wat
er C
onte
nt (m
m)

LWC and MVD retrievals
S-band reflectivity (dBZ) LWC (g m-3)
Distance from radar (km) Distance from radar (km)
LWC ~ 0.05 – 0.1 g m-3

Rain and biological scatterers:dBZ of insects
21

Rain and biological scatterers: ZDR of insects
22

Rain and biological scatterers: Velocity of insects
23

Rain and biological scatterers: dBZ of bird
24

Rain and biological scatterers: ZDR of birds
25

Rain and biological scatterers: Velocity of birds
26

Rain and biological scatterers: Propagation Phase of birds
27

Is it possible track insects as they migrate over the oceans?
28

HSRL on the NCAR Gulf Stream-V Research Aircraft
Technical Specifications: Wavelength: 532 nm Pulse repetition rate: 6 KHz Average power: up to 400 mW Range resolution: 7.5 m Telescope diameter: 40 cm Angular field of view 0.025 deg Filter bandwidth: 1.8 GHz

Background on Lidar Calibration
a. Relative calibration: Transmit power, optics and receiver
b. Absolute calibration: Rayleigh molecular backscatter
c. Automatic self-calibration
-Integrated baclkscatter, B= 1/2S - S: lidar ratio =extinction/backscatter - Measurements from a thick startocumulus clouds that have droplets sizes between 5 and 25 microns - S doesn’t vary for cloud droplets - No drizzle or ice particles - Backscatter > 1.e-5 1/(m Sr) - No strong background aerosol: attenuation in BL increase S
d. Similarity to radar calibration using phase measurements

GV HSRL measurements of aerosol and smoke at NCAR’s Foothills campus on September 6, 2010

GV HSRL measurements of aerosols and clouds

Backscatter Measurement

Depolarization Measurement

Particle Types

Backscatter Measurement

Depolarization Measurement

Particle Types

Model calculations of scattering.

Model calculation: Median volume diameter verses Lidar Ratio

Particle Types

Analysis of Calibration Results
Status Median Volume
Diameter, microns
Lidar ratio: gate-by-gate
ratio of extinction to backscatter
Integration of attenuated backscatter
Raw backscatter measurements, Beta
18 22 26
Adjusted backscatter measurements: Beta’=Beta*1.22
17.4 19.2 22

• GV HSRL Designed and built by University of Wisconsin – Madison
• Provides accurate measurement of optical depth, extinction and backscatter cross sections of aerosols and thin clouds
• Eye-safe at the exit port (532-nm wavelength operation)
• GV HSRL is already operational operation as ground based instrument
• To be used to in combination with HCR to measure: –cloud fraction, precipitation rate, scattering cross sections, particle shape
measurements on 1-Oct of 2008 by the arctic HSRL and MMCR Courtesy of University of Wisconsin
High Spectral Resolution Lidar and mm-wave radar

Instruments • Ground-based radar: (i) total phase or delay and (ii) absorption
using a dual-wavelength radar • Ground-based multi-wavelength microwave radiometer
• Satellite-borne microwave radiometer
•Differential absorption lidar and Raman lidars
•GPS receivers

Vertical distribution of water vapor (US Standard atmosphere)

Remote Observations of WV
• Cm and mm wave radars
• Microwave radiometer
• Differential absorption lidar (DIAL)
• Solar occultation
• GPS receivers

Radiometer Technique • Radiometers measure brightness
temperatures Tb, that are converted into optical depths, τ.
• Optical depths are linearly
related to LWP and VWP • kl and kv are path averaged
coefficients. • τd is the ‘dry’ optical depth • Two wavelengths, two equations,
two unknowns – retrieve LWP and VWP.

Times series measurements of temperature, integrated vapor and liquid

Spatial and Temporal Resolutions (a) Radiosondes: • Synoptic scale; twice daily. Thermodynamic vertical profiles for
weather diagnostics and prediction
• Not suitable for resolving microscale and mesoscale features of minutes to hours and 1-10 km scale
(b) Satellite: Crude vertical resolution within boundary layer (c) Radiometer: Continuous observations to fill temporal gaps between
radiosondes (i) Microwave: Measurements during both cloudy and clear air (ii) Infrared: Biased in cloudy condition

Ground-based radiometer

Radiation Transfer Equation
Radiation transfer equation:
Source:
Rayleigh-Jeans limit to Planck function:
Planck function or intensity and temperature:
α: Absorption coefficient

Boundary conditions for the solution of RT equation

Radiation Transfer Equation (Cont.)
Solution to the above:
Optical depth:
Microwave radiometry:

Profiling Using a Microwave Radiometer
Frequency of the emitted radiation Bohr’s Equation
Total internal energy of a molecule:
Two important rotational transitions: 22.235 and 183.31 GHz

Brightness Temperature and weighting function
TB : Brightness temperature W(f,z) : Weighting function g(z): Water vapor density

Sensing Using Passive instruments

Comparison of RAOB and CMR-H Retrieved Water Vapor Density Profile on Oct 9, 2007
09 Oct 07 at 6 UT. A priori from Denver Station RAOB at 0 UT
CMR-H RAOB PWV (cm) 0.85 0.78

Radiometer retrieval of temperature, RH, and liquid water content during a supercooled fog event
(Knupp et al., JAOT 2009)
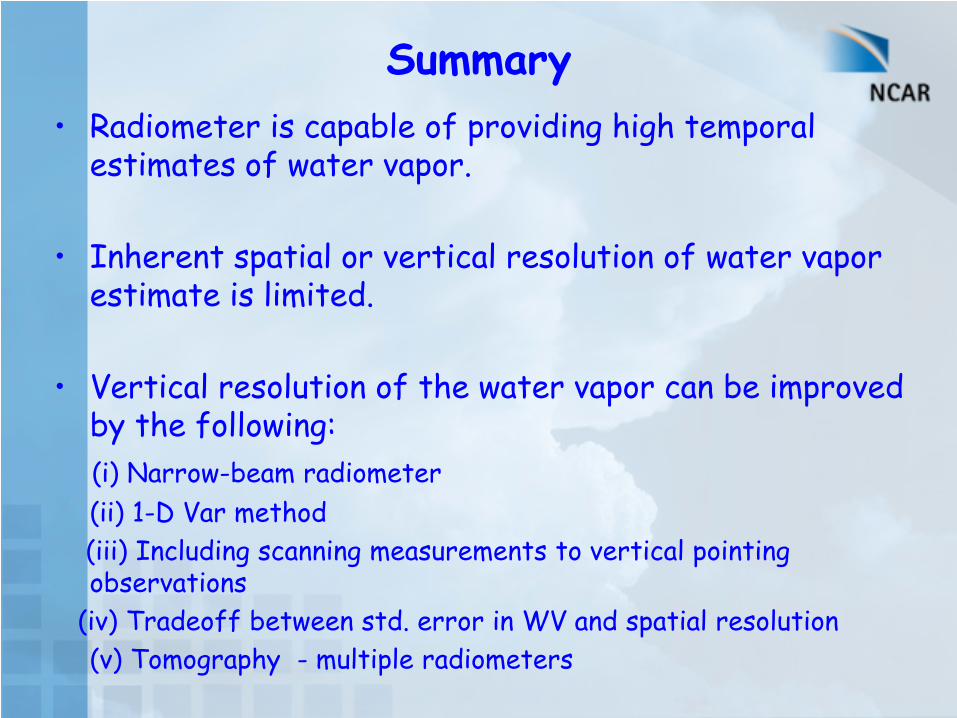
Summary • Radiometer is capable of providing high temporal
estimates of water vapor.
• Inherent spatial or vertical resolution of water vapor estimate is limited.
• Vertical resolution of the water vapor can be improved by the following:
(i) Narrow-beam radiometer (ii) 1-D Var method (iii) Including scanning measurements to vertical pointing
observations (iv) Tradeoff between std. error in WV and spatial resolution (v) Tomography - multiple radiometers


Motivations: (i) Very limited prediction skill for MJO initiation over the Indian Ocean; (ii) The inability of global models to produce the MJO, which degrades their seasonal to interannual prediction and lessens our confidence in their ability to project future climate.
Correlation between predicted (by CFS) and observed MJO indices (Courtesy of Jon Gottschalck and Qin
Zhang)
Importance of the MJO: Bridging Weather and Climate
• Monsoons, ENSO • Extreme events (flood, tropical
cyclones) • Teleconnections, extratropical
circulation/weather • North Atlantic Oscillation, Arctic
Oscillation, Antarctic Oscillation • Atmospheric and oceanic chemistry and biosystem (ozone, CO2, aerosols,
chlorophyll)
Tracks of hurricanes (1947-1997) in two contacting phases of the MJO (Maloney and
Hartmann 2000)

Rain and biological scatterers: Propagation Phase of insects
62

Corrections for finite beamwidth and mean radiating temperature
T’B : Corrected brightness temperature
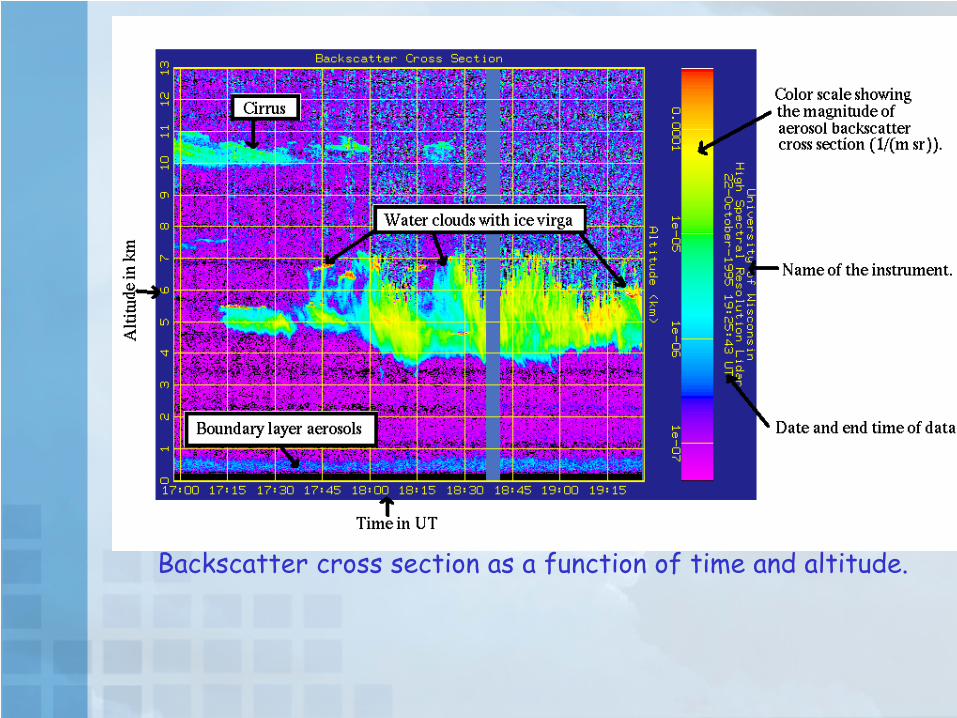
Backscatter cross section as a function of time and altitude.

Depolarization ratio as a function of time and altitude