removal of total suspended solids and oil …eprints.utar.edu.my/71/1/cl-2011-0706059-1.pdf ·...
TRANSCRIPT

REMOVAL OF TOTAL SUSPENDED SOLIDS AND OIL
AND GREASE USING FLOTATION UNIT
LAU ONN SEIN
A project report submitted in partial fulfilment of the
requirements for the award of Bachelor of Engineering
(Hons.) Chemical Engineering
Faculty of Engineering and Science
Universiti Tunku Abdul Rahman
May 2011

ii
DECLARATION
I hereby declare that this project report is based on my original work except for
citations and quotations which have been duly acknowledged. I also declare that it
has not been previously and concurrently submitted for any other degree or award at
UTAR or other institutions.
Signature : _________________________
Name : _________________________
ID No. : _________________________
Date : _________________________
iii
APPROVAL FOR SUBMISSION
I certify that this project report entitled “REMOVAL OF TOTAL SUSPENDED
SOLIDS AND OIL AND GREASE USING FLOTATION UNIT” was prepared
by LAU ONN SEIN has met the required standard for submission in partial
fulfilment of the requirements for the award of Bachelor of Engineering (Hons.)
Chemical Engineering at Universiti Tunku Abdul Rahman.
Approved by,
Signature : _________________________
Supervisor : Dr. Lai Soon Onn
Date : _________________________
iv
The copyright of this report belongs to the author under the terms of the
copyright Act 1987 as qualified by Intellectual Property Policy of University Tunku
Abdul Rahman. Due acknowledgement shall always be made of the use of any
material contained in, or derived from, this report.
© 2010, Lau Onn Sein. All right reserved.
v
ACKNOWLEDGEMENTS
I would like to thank everyone who had contributed to the successful completion of
this project. I would like to express my gratitude to my research supervisor
Dr. Lai Soon Onn for his invaluable advice, guidance and his enormous patience
throughout the development of this research from constructing the scope of this
project up till the final documentation phase of results data.
In addition, I would also like to express my gratitude to my loving parent and
friends who had helped and given me encouragement in completing this final year
project. A token of appreciation is also forwarded to Miss Yong Lee Mei, the
laboratory officer and both Mr. Tan and Mr. Chua. These individuals have always
been very helpful in giving advice pertaining to laboratory works and giving me
guidance in usage of laboratory glass wares. Special appreciation is also credited to
Miss Sharifah binti Sulaiman for her patience and guidance during the laboratory
session.
I would also like to credit Dr. Gulnaziya Issabayeva for her guidance and
invaluable knowledge pertaining to jar test which had certainly helped to clear the
confusion pertaining to conversion of jar test results into the actual flotation
equipment as well as preparation of stock solutions. In addition, I would also like to
thank Dr.Hii Siew Ling for her helpfulness in answering my various queries and
doubts during the development of this research project. Without each of these
aforementioned individuals, completing this project will definitely be a monumental
task.

vi
REMOVAL OF TOTAL SUSPENDED SOLIDS AND OIL
AND GREASE USING FLOTATION UNIT
ABSTRACT
This report documents the findings of the study on the removal of total suspended
solids (TSS) and oil and grease (O&G) using Dispersed Air Flotation Unit (DiAF) by
localising the scope of the research using synthetic wastewater sample. This study
was carried out due to limited research that has been done on the application of
dispersed air flotation in wastewater treatment as typical application of dispersed air
flotation was in mineral flotation (mineral processing) and flotation deinking (paper
recycling). Process parameters governing the performance of dispersed air flotation
in removal of TSS and O&G such as air pressure, pH, coagulation rotation speed and
flocculation rotation speed were investigated. This research was performed in five
continuous phases, whereby the first phase was spearheaded by jar test and the
subsequent four phases aimed to evaluate the aforementioned factors quantitatively.
Jar test results revealed initial figures for chemical dosing indicating optimum
aluminium sulphate dosage at 30 mg/L, while optimum anionic polymer dosage was
at 400 mg/L thriving on optimum pH 3. The results obtained were based on the
overall removal of TSS, O&G and turbidity. Air pressure affected bubble size
formation, confirming the previous benchmarked study at optimum air pressure of
0.3 MPa. O&G removal thrived on pH 10, while TSS removal was optimum at pH 2,
indicating the stark difference in pH for optimum removal of these two parameters
affected by various factors such as water quality, bubble size and equipment design.
Mixing rate affected both flocculation and coagulation efficiencies. O&G removal
improved at higher coagulation rotation speed, while TSS removal decreased under
similar condition and was optimum at 250 to 300 rpm. O&G and TSS removal also
decreased when flocculation rotation speed was operated beyond 200 and 250 rpm,
respectively, resulting in the optimum flocculation rotation speed ranging from 60 to
72 rpm.

vii
TABLE OF CONTENTS
DECLARATION ii
APPROVAL FOR SUBMISSION iii
ACKNOWLEDGEMENTS v
ABSTRACT vi
TABLE OF CONTENTS vii
LIST OF TABLES x
LIST OF FIGURES xi
LIST OF SYMBOLS / ABBREVIATIONS xiv
CHAPTER
1 INTRODUCTION 1
1.1 Project Background 1
1.2 Problem Statement 1
1.3 Research Scope 3
1.4 Research Objectives 4
1.5 Hypotheses 4
2 LITERATURE REVIEW 5
2.1 Principle of Flotation Separation 5
2.1.1 Theoretical Approach in Flotation Separation 6
2.1.2 Flotation Machines 7
2.1.3 Flotation Separation Process 9
1) Dispersed Air Flotation (DiAF) 9
2) Dissolved Air Flotation (DAF) 12
viii
2.2 Factors Affecting DiAF Separation 15
2.2.1 Particle Size 15
2.2.2 Solution pH and Temperature 16
2.2.3 Gas Flow Rate 17
2.2.4 Water Chemistry 18
2.3 Overview of the Application of Flotation in Removal of TSS
and Oil and Grease in the Treatment of Wastewater 19
2.4 Chemically Enhanced Primary Treatment (CEPT) 22
3 METHODOLOGY 24
3.1 Experimental Plan 24
3.2 Preliminary Test: Jar Test 25
3.2.1 Pre-Experimental Procedures in Jar Test 25
3.2.2 Procedures of Jar Test Experiment 29
3.3 Experimental Study: Flotation 31
3.3.1 Experimental Setup 31
3.3.2 Process Flow Diagram 32
3.3.3 Flotation Procedures 32
3.4 Sample Analyses 36
3.4.1 Oil and Grease 36
3.4.2 TSS 39
3.4.3 Turbidity 41
4 RESULTS AND DISCUSSION 42
4.1 Synthetic Wastewater Characterization 42
4.2 Jar Test Results 44
4.2.1 Optimum pH 48
4.2.2 Optimum Alum Dosage 50
4.2.3 Optimum Anionic Polymer Dosage 51
4.3 Application and Aeration Performance of the DiAF in
Treating Synthetic Wastewater Containing Suspended Solids
and Oily Emulsions 54
4.3.1 Application of Flotation Filtration Demonstrator 54

ix
4.3.2 Aeration Performance of Flotation Filtration
Demonstrator 56
4.4 Effect of Processing Parameters on TSS and O&G Removal
Efficiency 58
4.4.1 Effect of Air Pressure 58
4.4.2 Effect of pH 63
4.4.3 Effect of Coagulation Rotation Speed 68
4.4.4 Effect of Flocculation Rotation Speed 72
5 CONCLUSIONS AND RECOMMENDATIONS
76
5.1 Conclusions 77
5.2 Recommendations 78
REFERENCES 79

x
LIST OF TABLES
TABLE TITLE PAGE
3.1 Alum Dosage for Jar Test 26
3.2 Anionic Polymer Dosage for Jar Test 27
3.3 Variations of Coagulation Rotation Speed 35
3.4 Variations of Flocculation Rotation Speed 36
4.1 Characterization of Jar Test Wastewater
Sample 44
4.2 Characterization of DiAF Test Wastewater
Sample 44
4.3 Jar Test Results Obtained using Alum as
Coagulant and Anionic Polymer as Flocculant 46
4.4 Variation of % Removal of Turbidity, TSS and O&G with Air Pressure 58
4.5 Variation of % Removal of Turbidity, TSS and
O&G with pH 63
4.6 Variation of % Removal of Turbidity, TSS and
O&G with Coagulation Rotation Speed 68
4.7 Variation of % Removal of Turbidity, TSS and
O&G with Flocculation Rotation Speed 72
4.8 Summary Table of Optimum Process
Parameter for Effective Removal of TSS, O&G
and Turbidity 76
xi
LIST OF FIGURES
FIGURE TITLE PAGE
2.1 Suspension of Mineral Particle at an Air-Water
Interface 7
2.2 Flotation Column 8
2.3 Schematic of DiAF Unit 10
2.4 Bubble-Particle Capture 12
2.5 Schematic of DAF system: Without recycle in
which entire flow is passed through the
pressurizing tank 14
2.6 Schematic of DAF system: With recycle in
which only the recycle flow is pressurized. The
pressurized flow is mixed with the influent
before being released into the flotation tank. 14
3.1 Jar Test Setup 30
3.2 Setup of Flotation Unit 31
3.3 Process Flow Diagram of Flotation Unit 32
4.1 Constant-Composition Synthetic Wastewater
for Jar Test (left) and 43
4.2 Diagram of the Batch Stirrer 43
4.3 Flocculation Test Unit 44

xii
4.4 Effect of Initial pH on Overall Turbidity
Removal 48
4.5 Effect of Alum Dosage on Turbidity Removal
due to Coagulation 50
4.6 Al Speciation Diagram with pH (10-4
M) (
Kragten, 1978) 51
4.7 Effect of Anionic Polymer Dosage on Turbidity
Removal due to Flocculation 52
4.8 Colloids Formed at t = 30 minute after Alum
Addition 53
4.9 Flocs Formed at t = 30 minute after Anionic
Polymer Addition 53
4.10 LS-26 205 Flotation Filtration Demonstrator 54
4.11 Flocs Formation 55
4.12 Flocs Collected after Skimming 55
4.13 Existing Gas Diffuser Design 56
4.14 New Gas Diffuser Design (Front View) 57
4.15 New Gas Diffuser Design (Top View) 57
4.16 Effect of Air Pressure on Turbidity Removal 59
4.17 Effect of Air Pressure on TSS Removal 60
4.18 Effect of Air Pressure on O&G Removal 61
4.19 Effect of Air Pressure on Overall Removal 62
4.20 Effect of pH on Turbidity Removal 64
4.21 Effect of pH on TSS Removal 65
4.22 Effect of pH on O&G Removal 66
4.23 Effect of pH on Overall Removal 67
4.24 Effect of Coagulation Rotation Speed on
Turbidity Removal 68
xiii
4.25 Effect of Coagulation Rotation Speed on TSS
Removal 69
4.26 Effect of Coagulation Rotation Speed on O&G
Removal 70
4.27 Effect of Coagulation Rotation Speed on
Overall Removal 71
4.28 Effect of Flocculation Rotation Speed on
Turbidity Removal 73
4.29 Effect of Flocculation Rotation Speed on TSS
Removal 74
4.30 Effect of Flocculation Rotation Speed on O&G
Removal 75
4.31 Effect of Flocculation Rotation Speed on
Overall Removal 76

xiv
LIST OF SYMBOLS / ABBREVIATIONS
f lifting force
r radius of cylinder
T surface tension of water
density of water
g acceleration of gravity
h depth of dimple
θ angle of contact
Rc capture radius
Pc probability of collision / capture
RB radius of bubble
ReB bubble Reynolds number
St Stoke number
Sb bubble surface area flux
d32 Saunter mean bubble diameter
Jg superficial gas velocity
DAF Dissolved Air Flotation
DIAF Dispersed Air Flotation
IAF Induced Air Flotation
CEPT Chemically Enhanced Primary Treatment Process
DLVO Derjaguin and Landau, Verwey and Overbeek
1
CHAPTER 1
INTRODUCTION
1.1 Project Background
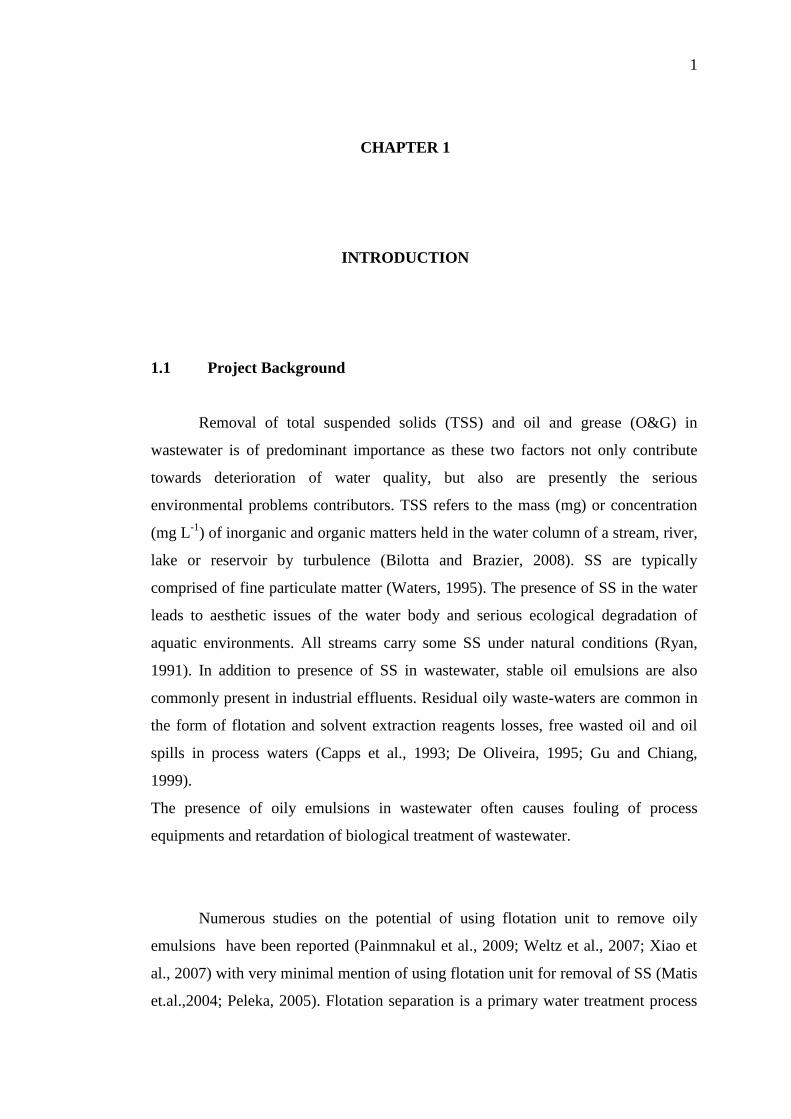
Removal of total suspended solids (TSS) and oil and grease (O&G) in
wastewater is of predominant importance as these two factors not only contribute
towards deterioration of water quality, but also are presently the serious
environmental problems contributors. TSS refers to the mass (mg) or concentration
(mg L-1
) of inorganic and organic matters held in the water column of a stream, river,
lake or reservoir by turbulence (Bilotta and Brazier, 2008). SS are typically
comprised of fine particulate matter (Waters, 1995). The presence of SS in the water
leads to aesthetic issues of the water body and serious ecological degradation of
aquatic environments. All streams carry some SS under natural conditions (Ryan,
1991). In addition to presence of SS in wastewater, stable oil emulsions are also
commonly present in industrial effluents. Residual oily waste-waters are common in
the form of flotation and solvent extraction reagents losses, free wasted oil and oil
spills in process waters (Capps et al., 1993; De Oliveira, 1995; Gu and Chiang,
1999).
The presence of oily emulsions in wastewater often causes fouling of process
equipments and retardation of biological treatment of wastewater.
Numerous studies on the potential of using flotation unit to remove oily
emulsions have been reported (Painmnakul et al., 2009; Weltz et al., 2007; Xiao et
al., 2007) with very minimal mention of using flotation unit for removal of SS (Matis
et.al.,2004; Peleka, 2005). Flotation separation is a primary water treatment process
2
used in many industries to separate one constituent from another using mechanical
and physical means. Generally, flotation separation can be divided into two types:
(1) dispersed air flotation and (2) dissolved air flotation. Dispersed air flotation
(sometimes referred to as induced air flotation) is a selective process commonly used
for mineral flotation and flotation deinking in mineral processing and paper
recycling, respectively, while dissolved air flotation is typically utilized in water
clarification and wastewater treatment (Theodore and Frederick, 2003). Flotation
units typically serve as a preliminary step for water treatment in removal of
suspensions and emulsion due to small differences in the density of continuous phase
and of particulate phase.
A huge number of past and present journal publications and research studies
have been advocated towards dissolved air flotation unit (DAF) (Edzwald, 2009;
Rodrigues and Rubio, 2003; Xiao et al., 2007) with very minimal research on
dispersed air flotation (DiAF) (Lien and Liu, 2006; Painmnakul et al., 2009) even if
these types of flotation separation units are operated under the same basic principles
of (1) aeration, (2) mixing and (3) separation. This may be due to the fact that more
extensive researches have been done for treatment of drinking water and industrial
waste flow using DAF as compared to DiAF as typical application of the latter is in
mineral flotation and flotation deinking.
However, Puget et al. (2003) modelled the operating behaviour of a dispersed
air flotation unit for dairy wastewater treatment. Due to the limited study on
dispersed air flotation unit, this report extends the study on the application of a
dispersed air flotation unit as a primary water treatment process in wastewater along
the same line as dissolved air flotation and induced air flotation (IAF) unit by
investigating the processing parameters affecting the removal efficiency of TSS and
O&G in addition to turbidity.
1.2 Problem Statement
Removal of total suspended solids and oil and grease using floatation unit in
synthetic wastewater.
3
1.3 Research Scope
This report and its discussion that follows address the findings of the removal
of total suspended solids (TSS) and oil grease (O&G) in synthetic wastewater by
using a dispersed air flotation (DiAF) unit. The synthetic wastewater was produced
in the lab by mixing cooking oil, soil and grease with tap water as influent into the
feed tank.
A LS-26 205 Flotation Filtration Demonstrator is the DiAF unit used in this
study which is pre-equipped with a coagulation and flocculation tank for chemically
enhanced primary treatment (CEPT) process using aluminium sulphate (hereafter
abbreviated as alum) solution as coagulant and anionic polymer solution as
flocculant agent. Processing parameters governing the performance of DiAF unit in
removal of TSS and O&G such as air pressure, pH medium, coagulation rotation
speed and flocculation rotation speed were investigated.
This study was performed in five continuous phases. The first phase consisted
of preliminary test conducted via jar test to determine optimum chemical dosage at
optimum pH medium which provided an initial point for investigation of other
factors affecting the removal efficiency of TSS and O&G. The second phase focused
on evaluating optimum air pressure factor, while the third phase measure the
optimum pH medium based on optimum air pressure condition. The forth phase of
this research focused on coagulation rotation speed, whereby the effect of
manipulating impeller speed using alum as coagulant was measured. Finally, the last
phase of this project is a continuation from the forth phase, evaluating optimum
flocculation rotation speed based on optimum coagulation rotation speed using
anionic polymer as a flocculant. Essentially, the last two phases aimed to determine
the effect of mixing rate on coagulation and flocculation efficiencies based on
removal of TSS, O&G and turbidity.

4
1.4 Research Objectives
The objectives of this study are listed as follows:
1. To demonstrate the application and efficiency of a dispersed air flotation unit
as primary water treatment process in treating synthetic wastewater
containing suspended solids and oily emulsions.
2. To investigate the effects of the processing parameters on removing TSS and
O&G in the dispersed air flotation unit.
1.5 Hypotheses
The hypotheses of this study are listed as follows:
1. The Chemically Enhanced Primary Treatment (CEPT) process consisting of
coagulation and flocculation enhanced the removal of the TSS and O&G in
the dispersed air flotation unit in treating synthetic wastewater.
2. Higher air pressure led to higher removal efficiency of TSS and O&G.
3. The removal efficiencies of TSS and O&G were the highest when the pH of
the solution was between pH 7 and 10.
4. The higher the dosing rate of the coagulant and flocculant resulted in higher
removal efficiency of TSS and O&G.
5. The relationship between mixing rate and removal efficiency of TSS and
O&G was non-linear. The removal efficiency increased with mixing rate until
the maximum mixing rate was reached and then decreased.
5
CHAPTER 2
LITERATURE REVIEW
2.1 Principle of Flotation Separation
The principle of flotation separation in this section defines the theoretical
approach in flotation separation. The two major types of flotation machines
consisting of pneumatic machine and mechanical agitation or subaeration machine as
well as the two major types of flotation processes: 1) dispersed air flotation and 2)
dissolved air flotation were being introduced. It is interesting to note that flotation as
a treatment process has been used for almost a decade. During the first half of this
period, flotation was used exclusively in the mining industry, but the Scandinavian
paper industry in the late 1920’s had path way for development of recent flotation
technologies.
The present practice of flotation as applied in wastewater treatment is
confined to the use of air as the flotation agent. Air bubbles are added or caused to
form by (1) injection of air while the liquid is under pressure followed by release of
the pressure (dissolved-air-flotation), and (2) aeration at atmospheric pressure
(dispersed-air-flotation) ( Metcalf and Eddy, 2003). The degree of removal in these
systems can be enhanced through the application of Chemically Enhanced Primary
Treatment (CEPT) process.
6
2.1.1 Theoretical Approach in Flotation Separation
Flotation separation is a primary water treatment process used in many
industries to separate one constituent from another using mechanical and physical
method. Flotation is one of the most important methods for mineral separation due to
its capability in fine processing and as such has been applied in mineral separation of
low-grade ores that other separation methods cannot handle economically
(Masuda et al., 2006). Currently flotation process has been attracting much attention
from scholars and researchers alike due to its high separation efficiency, low capital
investment and low operational costs (Xiao et al., 2007).
Flotation separation is a complex physicochemical process and its
fundamental principles are theoretically approached by two methods: 1) correlation
of the angle of particle with its floatability and 2) correlation of the bubble-particle
attachment with the Derjaguin and Landau, Verwey and Overbeek (DLVO) theory
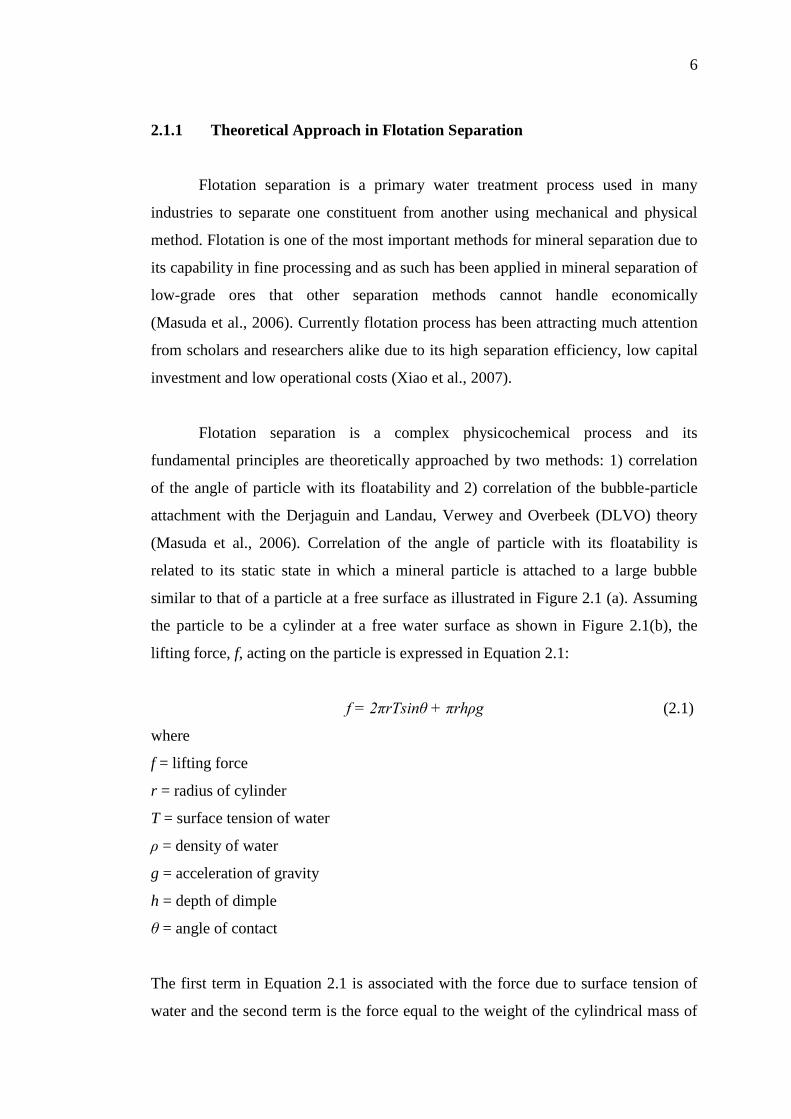
(Masuda et al., 2006). Correlation of the angle of particle with its floatability is
related to its static state in which a mineral particle is attached to a large bubble
similar to that of a particle at a free surface as illustrated in Figure 2.1 (a). Assuming
the particle to be a cylinder at a free water surface as shown in Figure 2.1(b), the
lifting force, f, acting on the particle is expressed in Equation 2.1:
f = 2πrTsinθ + πrhρg (2.1)
where
f = lifting force
r = radius of cylinder
T = surface tension of water
ρ = density of water
g = acceleration of gravity
h = depth of dimple
θ = angle of contact
The first term in Equation 2.1 is associated with the force due to surface tension of
water and the second term is the force equal to the weight of the cylindrical mass of
7
liquid displaced by air. Both terms in the lifting force, f varies with particle size, r.
For small particles, the second term becomes negligible and lifting force, f, becomes
Equation 2.2.
f = 2πrTsinθ (2.2)
Figure 2.1: Suspension of Mineral Particle at an Air-Water Interface
The correlation of the bubble-particle attachment with the DLVO theory
predicts the coagulation of two solid particles by considering the balance of opposing
surface forces consisting of electrostatic repulsion and Van der Waals (molecular)
attraction between the particles. In a slow coagulation condition, an energy barrier is
formed at a certain interparticle distance by the interaction of repulsive and attractive
potential energies. If the relative kinetic energy of the two particles is larger than the
magnitude of the energy barrier, the particles are supposed to collide with each other.
Hence, the interaction energy between the bubble and particle can be calculated
using the DLVO theory, assuming that the bubble is one of the particles. Such energy
barrier prevents bubble-particle attachment, but flotation occurs even if an infinitely
large barrier is predicted (Masuda et al., 2006).
2.1.2 Flotation Machines
Flotation machines which work on the basis of flotation principles can be
broadly categorized into two groups: pneumatic machines and mechanical agitation
or subaeration machines (Masuda et al., 2006).
Pneumatic machine uses air blown in by means of pipes, nozzles or
perforated plates in which the air must be dispersed by baffles to create a great deal
8
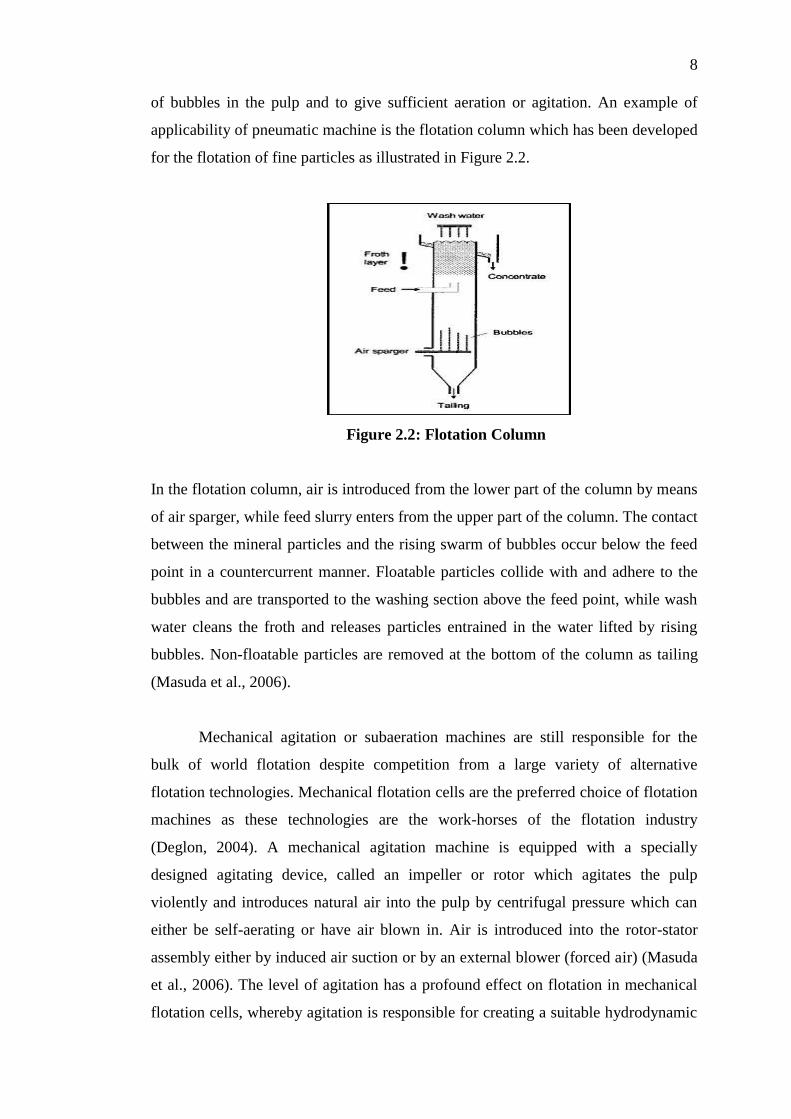
of bubbles in the pulp and to give sufficient aeration or agitation. An example of
applicability of pneumatic machine is the flotation column which has been developed
for the flotation of fine particles as illustrated in Figure 2.2.
Figure 2.2: Flotation Column
In the flotation column, air is introduced from the lower part of the column by means
of air sparger, while feed slurry enters from the upper part of the column. The contact
between the mineral particles and the rising swarm of bubbles occur below the feed
point in a countercurrent manner. Floatable particles collide with and adhere to the
bubbles and are transported to the washing section above the feed point, while wash
water cleans the froth and releases particles entrained in the water lifted by rising
bubbles. Non-floatable particles are removed at the bottom of the column as tailing
(Masuda et al., 2006).
Mechanical agitation or subaeration machines are still responsible for the
bulk of world flotation despite competition from a large variety of alternative
flotation technologies. Mechanical flotation cells are the preferred choice of flotation
machines as these technologies are the work-horses of the flotation industry
(Deglon, 2004). A mechanical agitation machine is equipped with a specially
designed agitating device, called an impeller or rotor which agitates the pulp
violently and introduces natural air into the pulp by centrifugal pressure which can
either be self-aerating or have air blown in. Air is introduced into the rotor-stator
assembly either by induced air suction or by an external blower (forced air) (Masuda
et al., 2006). The level of agitation has a profound effect on flotation in mechanical
flotation cells, whereby agitation is responsible for creating a suitable hydrodynamic
9
environment in the cell for efficient gas dispersion, particle suspension and flotation
(Deglon, 2004).
2.1.3 Flotation Separation Process
Understanding of flotation separation process is fundamental towards
understanding of the basic operating principles in flotation separation as well as
inculcating a sense of appreciation towards flotation separation technologies. The
general process of flotation separation can be divided into two types: 1) dispersed air
flotation (DiAF), and 2) dissolved air flotation (DAF). Although the research interest
of this project focused on the removal of O&G and TSS utilizing a DiAF unit, but
both types of flotation separation processes were reviewed for overall understanding
of flotation process technology as a huge number of past and present journal
publications and research study have also been advocated towards DAF unit (DAF)
(e.g., Xiao et al., 2007; Rodrigues and Rubio, 2003; Edzwald, 2009).
1) Dispersed Air Flotation (DiAF)
Dispersed air flotation (sometimes referred to as induced-air flotation) is
commonly found in mineral processing (mineral flotation) and paper recycling
(flotation deinking) and is seldom used in municipal wastewater treatment. In these
processes, relatively large bubbles are formed by mechanical agitation or sparger and
injection. The gas phase are directly introduced into the liquid phase through a
revolving impeller, whereby the impeller acts as a pump, forcing fluid through a
disperser openings and creating a vacuum in the standpipe (see Figure 2.3). The
vacuum pulls air into the standpipe and thoroughly mixes it with the liquid. As the
gas-liquid mixture travels through the disperser, a mixing force is created that causes
the gas to form very fine bubbles (Metcalf and Eddy, 2003). Bubble particle
aggregates are then formed between bubbles and naturally or chemically induced
hydrophobic particles. Bubbles with sufficient buoyant force carry the particles to
surface for removal. DiAF is a selective separation process, where hydrophobic
mineral or contaminant particles form gauge or desired fibre in mineral flotation and
10
flotation deinking, respectively (Somasundaran and Hubbard, 2006; Theodore and
Frederick, 2003 ).
Mineral flotation is the enrichment of an ore in a desired mineral by
separating the mineral from the ore pulp into a froth, while flotation deinking is a
separation process used to remove ink and other contaminant particles from
reclaimed cellulose fiber in paper recycling. Despite the many differences between
mineral flotation and flotation deinking, all flotation cells are operated on similar
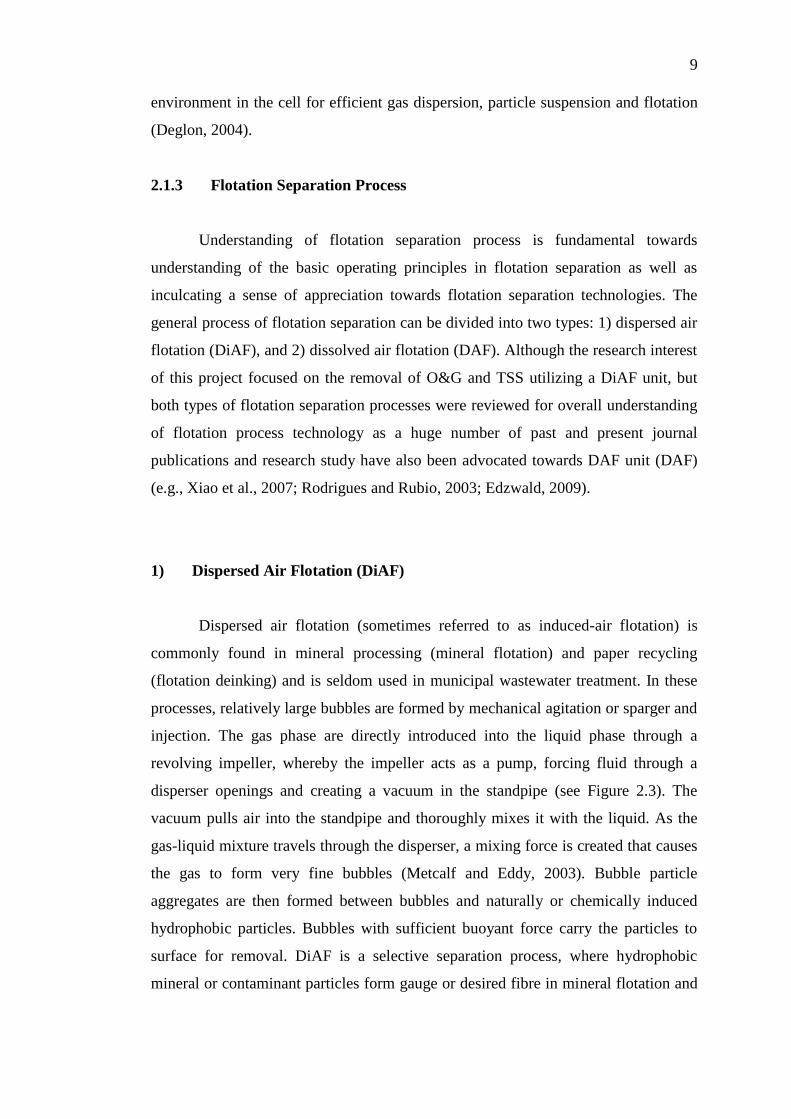
principles (Somasundaran and Hubbard, 2006). In modern DiAF cells, three separate
processes take place in tandem: 1) aeration, where air bubbles are introduced into the
system, 2) mixing where bubble and suspended particles are intimately mixed to
maximize bubble-particle interaction and 3) separation where bubbles and bubble-
particle aggregates are allowed to separate from the bulk mixture and skimmed away.
Figure 2.3 depicts typical layout of a dispersed air flotation unit.
Figure 2.3: Schematic of DiAF Unit
DiAF is based on the principles of bubble-particle interaction, aggregate
formation and aggregate stability. As a particle travels through a flotation cell, it
must travel close to the bubble for it to be captured, whereby this process is known as
collision or interception (Somasundaran and Hubbard, 2006). As such, particle size is
an important parameter in flotation because difficulty in floating fine particles is
11
attributed to low probability of bubble-particle collision (Shahbazi, Rezai and
Koleini, 2010). When collision occurs, a bubble-particle aggregate does not form
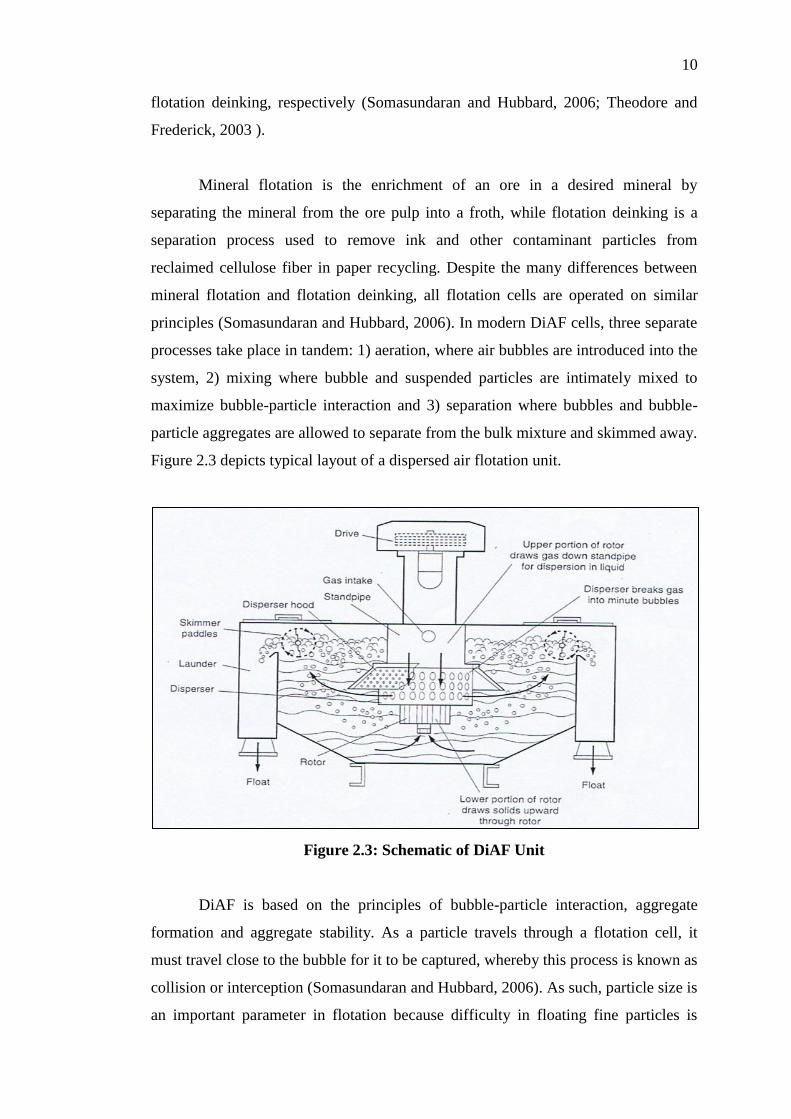
immediately. Only those particles that approach a rising bubble within a streaming
tube of limiting capture radius, Rc will collide with a bubble. The probability of
collision or capture (Pc) is then determined as the ratio of the number of particles
with Rp < RB within a streaming tube of cross-sectional area πRc2 to the number of
particles that approach a bubble in a stream in tube with cross-sectional area π (Rp +
RB) 2
.
Assume Rp < RB, hence
where
Pc = probability of collision or capture
Rc = limiting capture radius of streaming tube
Rp = radius of particle
RB = Radius of bubble
Bubble Reynolds number, ReB and Stoke number, St are the dimensionless parameter
typically encountered when determining probability of collision, Pc. In mineral
flotation, the Stoke number falls in the range of 0 < St<1, while in flotation deinking,
St < 0.1 is more typical.
(2.3)
(2.4)

12
Figure 2.4: Bubble-Particle Capture
The advantages of a DiAF system are (1) compact size, (2) lower capital cost,
and (3) capacity to remove relatively free oil and suspended solids, while its
disadvantages include higher connected power requirements than dissolved air
flotation and its performance is dependent on strict hydraulic control due to less
flocculation flexibility. The quantities of float skimmings are also significantly
higher that the pressurized unit (Metcalf and Eddy, 2003).
2) Dissolved Air Flotation (DAF)
DAF is a clarification process that can be used to remove particles in
membrane plants or in conventional type plants using granular media filtration
(Edzward, 2010) and typically found in water clarification where air is dissolved into
the process stream under pressure. In small pressure systems, the entire flow may be
pressurized by means of a pump to 275 to 350 kPa with compressed air added at the
pump section. When the pressure is reduced through the pressure-reducing valve in
the flotation tank, numerous fine bubbles are released out of solution and float rafts
of aggregated particles typically colloidal in nature and must be flocculated together
before bubble nucleation. As such, DAF is not considered selective (Somasundaran
13
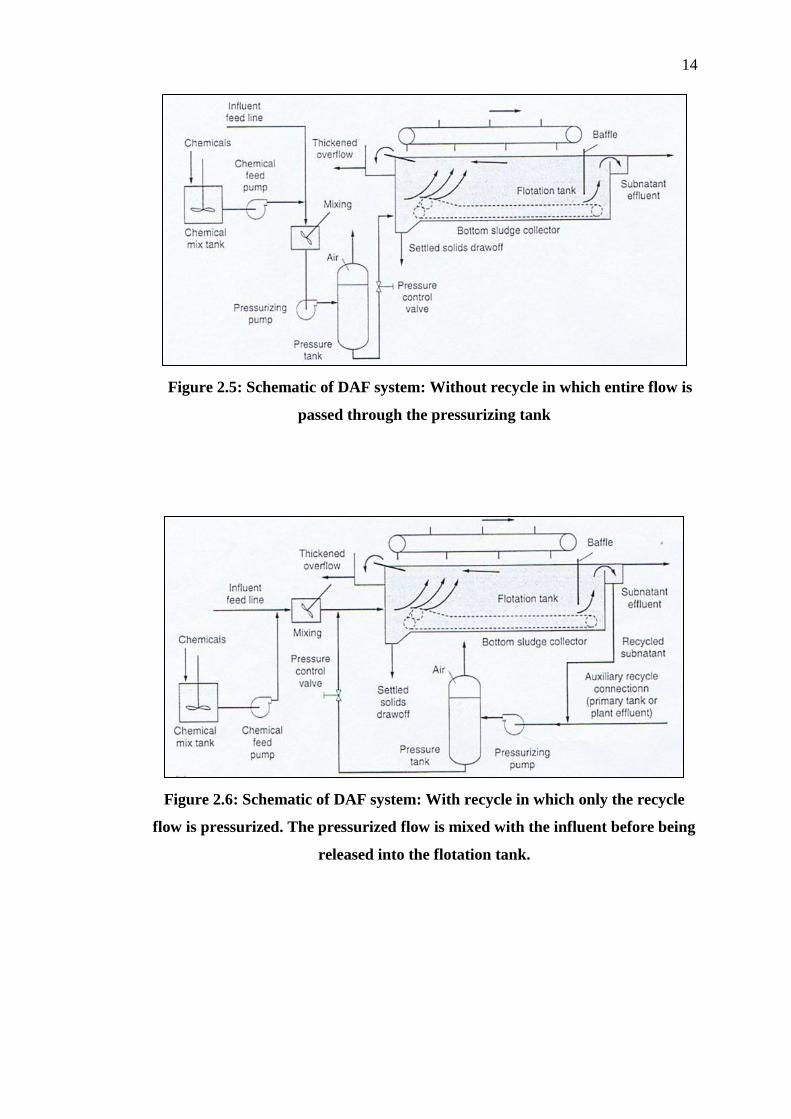
and Hubbard, 2006) which differentiates it from dispersed air flotation as discussed
in Section 2.1.3.1. In the larger units, a portion of the DAF effluent is recycled,
pressurized and semi-saturated with air (Figure 2.6). The recycled flow is mixed with
the unpressurized main stream just before admission to the flotation tank, with the
result that the air comes out of solution in contact with particulate matter at the
entrance of the tank ( Metcalf and Eddy, 2003).
The DAF is used to float particles with specific gravities much greater than
1.0 because the bulk specific gravity of the aggregated air and solids is reduced to
less than 1.0 by the adhesion of low density gas bubbles to the aggregate material.
Gas bubbles can adhere to a solid particle or oil globule by precipitation or collision
mechanisms or trapping of bubbles in the floc structure as the bubbles rise through
the liquid media. The adhesion, trapping and adsorption sequence provide a means of
reducing the aggregate specific gravity of a solid-gas matrix to less than 1.0 in order
for the aggregate to be rapidly floated and removed from the liquid phase
(Vesilind, 2003).
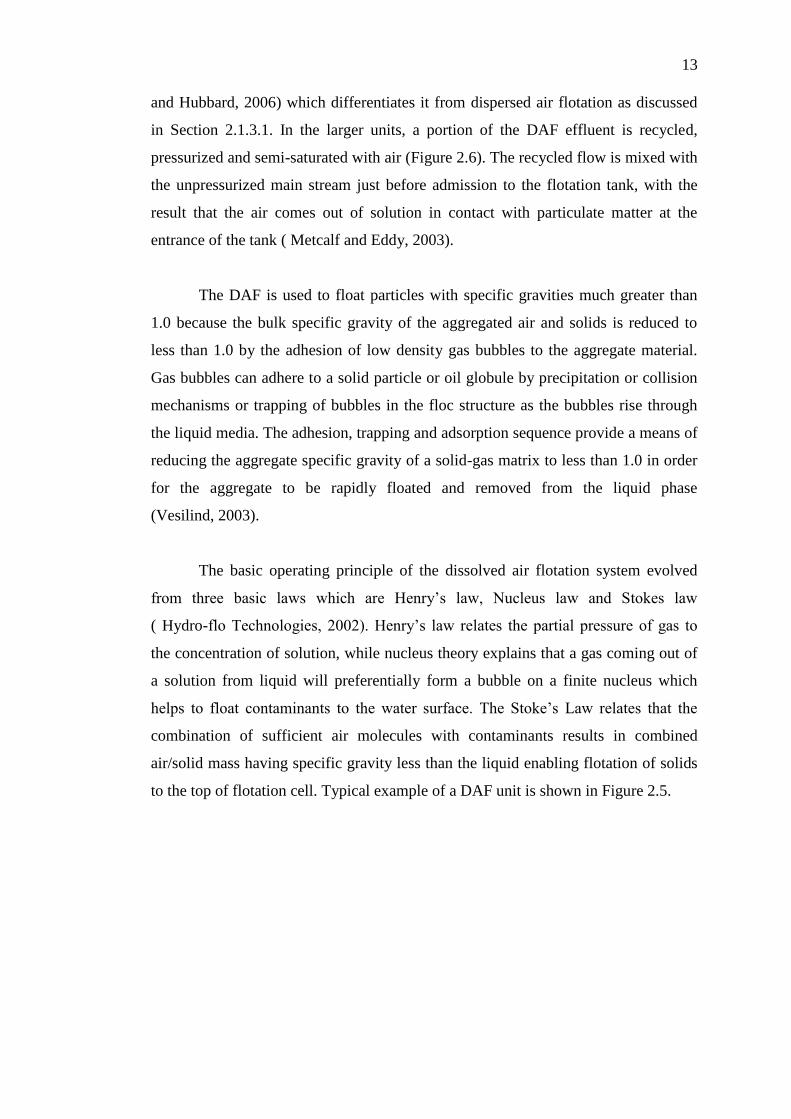
The basic operating principle of the dissolved air flotation system evolved
from three basic laws which are Henry’s law, Nucleus law and Stokes law
( Hydro-flo Technologies, 2002). Henry’s law relates the partial pressure of gas to
the concentration of solution, while nucleus theory explains that a gas coming out of
a solution from liquid will preferentially form a bubble on a finite nucleus which
helps to float contaminants to the water surface. The Stoke’s Law relates that the
combination of sufficient air molecules with contaminants results in combined
air/solid mass having specific gravity less than the liquid enabling flotation of solids
to the top of flotation cell. Typical example of a DAF unit is shown in Figure 2.5.
14
Figure 2.5: Schematic of DAF system: Without recycle in which entire flow is
passed through the pressurizing tank
Figure 2.6: Schematic of DAF system: With recycle in which only the recycle
flow is pressurized. The pressurized flow is mixed with the influent before being
released into the flotation tank.
15
2.2 Factors Affecting DiAF Separation
The efficiency and performance of DiAF separation are affected by numerous
factors such as particle size, solution pH and temperature (Somasundaran and
Hubbard, 2006), gas flow rate and water chemistry. Although both DiAF and DAF
unit do share similar factors affecting separation processes such as particle size, but
due to the nature of DiAF application in mineral flotation and flotation deinking,
differences in factors between these two units do exists. Hence, the following factors
reviewed below are based on mineral flotation and flotation deinking applications.
2.2.1 Particle Size
Numerous researches have been conducted on investigating the effect of
particle size on flotation (e.g., Derjaguin and Dukhin, 1961; Reay and Ratcliff, 1973
and Nguyen et.al., 2006) because understanding the limits of fine particle flotation is
the key to select separation of fine mineral particles. Generally, floatability increases
with the size of particles because fine particles have low collision efficiencies with
gas bubbles (Miettinen et al., 2009). Reay and Ratcliff (1973) suggested that two
flotation regimes might exist. They proposed that the first regime occurs for particles
with diameters greater than 3 μm, where the bubble-particle collision efficiency
increases with increasing particle size. For particles with a diameter less than several
microns, they become susceptible to Brownian diffusion and enter a second flotation
regime. Brownian diffusion is the main collision mechanism operative when particles
approach molecular dimensions. Diffusion is an effective mass transfer mechanism,
and the loss of inertia associated with fine particles becomes a positive advantage in
Brownian motion. Therefore, one would expect the bubble–particle collision
efficiency to increase with a reduction in particle size in the diffusion regime.
In order to enhance fine particle flotation, numerous approaches are
developed either by decreasing bubble size (Anfruns and Kitchener, 1977; Hewitt et
al., 1995) or increasing apparent particle size (Sutherland, 1948; Pyke et al., 2003). A
decrease in bubble size can be obtained using different methods, which can be
divided into mechanical and physiochemical approaches. Mechanical methods

16
include the design of flotation cells, so that the gas bubbles produced at the bottom of
the flotation cell can be dispersed into smaller bubble sizes. A microporous material
can also be used at the bottom of the cell, through which the gas bubbles are
produced (Miettinen et al., 2009).
Increasing particle size involves formation of flocs or aggregates. Depending
on the mechanisms of aggregate formation, these techniques can be divided into
three classes: selective flocculation, coagulation and hydrophobic aggregation. In
selective flocculation, the flocs are formed due to the bridging ability of long-chain
polymer molecules or ions, while coagulation of fine particles can be achieved by the
addition of electrolyte which decreases the electrostatic repulsion between charged
particles (Miettinen et al., 2009).
2.2.2 Solution pH and Temperature
The effects of solution pH and temperature have been investigated by
Theander and Pugh (2003) in flotation deinking (one of the major applications of
dispersed air flotation). Theander and Pugh (2003) reported that generally an
increase in temperature can facilitate the detachment of ink particles from the fibres,
while Larsson et al (1948) had reported that an increase in temperature decreases
flotation of model ink particle. As such, many other secondary parameters such as
the solubility of the fatty acid, the bubble size, and the froth structure must be taken
into account because they may cause changes in equipment performance as
temperature plays an important role in determining the kinetics and extent of surface
reaction between mineral and reagents.
Solution pH is an important factor in controlling flotation process because the
slight variation in pH can change the properties of the minerals and reagents as well
as their interaction (Somasundaran and Hubbard, 2006). Generally, flotation is
carried out in the alkaline range up to pH 10 with the efficiency decreasing at higher
pH. This may be due to the production of a higher surface charge on the ink particles
making them more highly dispersed and difficult to attach to the bubble. In addition,
pH can also affect the solubility of the fatty acids and other chemicals (Theander and
17
Pugh, 2003). Generally, a pH between 8 and 10 was reported to be the optimum pH
for flotation de-inking (Larsson et al., 1984; Ferguson, 1972). This could be
explained by an increase in electrostatic repulsion between charged fibres and ink
particles.
2.2.3 Gas Flow Rate
Since solid, liquid, and gas phases are involved in the flotation process, gas
flow rate and bubble size are critical in the separation efficiency of a dispersed air
flotation unit. The bubble size in dispersed air flotation depends on types of air
sparger and matrix effect. (Lien and Liu, 2006). Gas flow rate affects bubble size
formation which is critical for optimum flotation cell performance and recovery. The
recovery in a flotation cell is directly related to the amount of air added to the cell. It
is critical to generate bubbles of the correct diameter based on the size of particles to
be floated. Smaller bubbles are generally required for fine particle flotation and large
bubbles for coarse particle flotation (Coleman, 2010).
Nesset et al. (2006) in the study of gas dispersion characteristics of
mechanical flotation machines reported that mean bubble size (Sauter mean
diameter) increased with gas flow rate which might be resulted from the effect of
primary and/or secondary (coalescence) processes. An effect on the primary process
may be related to the decrease in power draw as gas rate is increased (Arbiter et al.,
1976), i.e., there is less energy for bubble break-up, but is also seen with porous
spargers (Dobby and Finch, 1986) where the same consideration apparently would
not apply.
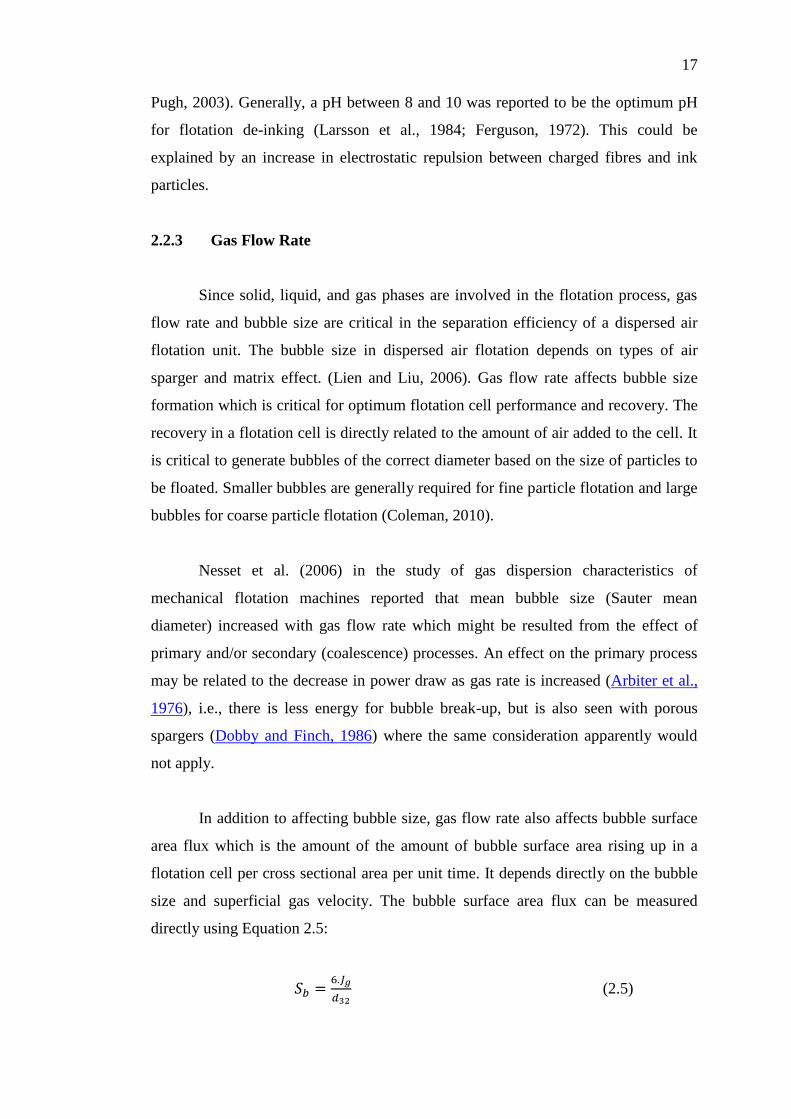
In addition to affecting bubble size, gas flow rate also affects bubble surface
area flux which is the amount of the amount of bubble surface area rising up in a
flotation cell per cross sectional area per unit time. It depends directly on the bubble
size and superficial gas velocity. The bubble surface area flux can be measured
directly using Equation 2.5:
(2.5)

18
where
Sb = Bubble surface area flux (cm2/cm
2.s)
Jg = Superficial gas velocity (cm/s)
d32 = Sauter mean bubble diameter (cm/s)
Nusset et al. (2006) also reported that bubble surface area flux increases with gas
flow rate. The greater the bubble surface area flux, the higher the recovery rate in the
pulp zone in the cell. However, if excessive air is added, the recovery rate in the pulp
zone can decrease due to ‘boiling’ (Coleman, 2010). ‘Boiling’ occurs when as the air
rate increases, the bubbles rise faster in the cell centre as the flotation mechanism
becomes less efficient at air dispersion until the air cannot be dispersed and ‘boiling’
occurs.
2.2.4 Water Chemistry
Water is not only a necessary medium for almost all mineral processing
methods, but also is one of the most important components for flotation. Therefore,
water type is one of the main factors affecting flotation results. Water hardness
results in a loss of selectivity during the flotation and increased reagent consumption
(Ozkan and Acar, 2004). Taggart (1954) stated that water should be as pure as
possible for flotation tests. When contaminated water must be used, its
composition should be maintained as uniform as possible. If reclaimed water is
used, it must be watched to guard against build up of harmful constituents (organic
colloidal matter, oil, frothing agents, heavy metal salts and alkaline earth salts). This
is because flotation processes are seriously affected by ions in water such as calcium
and magnesium (Fuerstenau, 1976, 1981,1982 ; Leja, 1982)
Ozkan and Acar (2004) in the investigation of water type impact on borate
ore floatation reported that hard water would affect floatation processes if anionic
type reagents were employed for collecting or frothing. In addition, when calcium
and magnesium ions were added to the slurry either separately or jointly at known
concentrations, flotation results were seemed to be negatively influenced with
increase in these concentration values.

19
2.3 Overview of the Application of Flotation in Removal of TSS and Oil
and Grease in the Treatment of Wastewater
The removal of total suspended solids (TSS) and oil and grease (O&G) in
wastewater has always been the subject of interest in water treatment and water
research studies. The presence of suspended solids (SS) in water leads to aesthetic
issues of the water body and serious ecological degradation of aquatic environments
while oily emulsions in wastewater often cause fouling of process equipments and
retardation of biological treatment of wastewater.
Numerous journal publications have investigated the potential of using
flotation unit in the removal of oily emulsions (e.g., Painmanakul et al., 2009; Xiao
et al., 2007; Weltz et al., 2007) with very minimal mention of using flotation unit for
removal of the SS (Matis et.al.,2004; Peleka, 2005). While a huge number of past
and present journal publications and research study have been advocated towards
DAF (Edzwald, 2009; Rodrigues and Rubio, 2003; Xiao et al., 2007), very minimal
research has been carried out on using DiAF in wastewater treatment (Lien and Liu,
2006; Painmanakul et al., 2009).
Xiao et al. (2007) investigated the potential of using column flotation in
separation of oil from wastewater based on the DAF process and concluded that
bubble generator was the key component of the dissolved-air flotation column as it
affected the aeration performance of the flotation column and hence the separation
efficiency. The theory of collision and arresting efficiency suggests that the collision
probability of bubbles and oil droplets will reach its maximum when the size of the
bubbles is small. The effects of residence time and bubble size are also investigated
in order to maximize the potential of maximum bubbles generation in the smallest
size with the longest residence time. This is because small bubble size is essential for
fine particle floatation (Anfruns and Kitchener, 1977; Hewitt et al., 1995). The
residence time is defined as the time bubble is released from the generator to the time
the bubble rises to the liquid surface and fractures. In addition to bubble generator,
one of the key findings is on the effect of air pressure on oil removal efficiency,

20
whereby it is discovered that oil removal efficiency increases with the increase in the
dissolved air pressure in the DAF.
The removal of oil emulsion in wastewater had also been studied by
Painmanakul et al. (2009) utilizing the induced air flotation on the study of the effect
of bubble hydrodynamic (such as bubble size and addition of chemical coagulant to
induced air flotation process) and chemical dosage for the treatment of oily
wastewater. This research study showed some similarity with the study of Xiao et al.
(2007), though the former used induced air flotation while the latter used DAF.
However, both studies reported comparable pH value in the study of the effect of pH
on the removal efficiency of oil. Xiao et al. (2007) reported efficient pH value within
the range of pH 6-9, while Painmanakul et al. (2009) studies reported optimum pH
value between the values of 8-10. The study of Painmanakul et al. (2009) on the
effect of pH factor on the removal efficiency of oil was used as a benchmark
indicator for this research because this study also used alum as the chemical
coagulant, while Xiao et al.(2007) used poly-aluminium chloride (PAC).
Overall, both research papers by Xiao et al. (2007) and Painmanakul et al.
(2009) are essentially important because it can be used to benchmark this research
paper for the O&G removal and further develop the factors studied in the application
of dispersed air flotation in removal of both O&G and TSS. Xiao et al. (2007)
studied a number of factors involving the DAF in oil separation and several of these
factors were emulated in this research including air pressure factor, pH effect on oil
removal efficiency and concentration of flocculant. On the other hand, the study of
Painmanakul et al. (2009) on pH factor and alum concentration as coagulant was
benchmarked as well. Both of these research papers reported similar results on the
trends of the factors on oil removal efficiency, where oil removal favoured pH within
the alkaline region and oil removal efficiency increased with increases in both
coagulant and flocculant concentrations. Residual oil concentration of the oily
wastewater also decreased with an increase in the dissolved air pressure (Xiao et al,
2007).
In addition to the aforementioned factors, the effects of impeller speed and
aeration rate (air flow rate) were also studied by Weltz et al. (2007) for oil removal.

21
Their results were clearly tabulated and displayed which enable easy emulation of
these factors for further investigation and use as benchmark for this project. Weltz et
al. (2007) has taken a step further in investigating all the aforementioned factors by
using H3P04 for pH adjustment instead of conventional HCl and NaOH (Xiao et al.,
2007; Painmanakul et al., 2009) and used acidic medium at pH 5.5 for flotation
instead of at optimum pH condition within the alkaline region (Xiao et al., 2007;
Painmanakul et al., 2009).
Limited research was done on removal SS using flotation cells. The research
performed by Matis et.al. (2004) was a solid and liquid separation using micro
filtration. Zeolite was the solid used in the research and the effect of air sparging was
investigated. A year later after this journal publication, Peleka et.al, (2005) further
investigated the removal efficiency in solid–liquid separation using zeolite by
experimenting on the operational characteristics of a hybrid floatation combining
both the advantages of membrane separation and filtration. Both of these papers also
investigated the effect of air sparging (pressure) on solid (zeolite) removal.
As far as the author’s best knowledge, there is very limited research
conducted on wastewater treatment using DiAF as compared to the DAF except
study performed by Lien and Liu (2006) in treatment of polishing wastewater from
semiconductor manufacturer. This research did not overlap much with wastewater
treatment in the removal of O&G and TSS as this paper only focused on the removal
of particles in semiconductor wastewater such as nanosized silica.

22
2.4 Chemically Enhanced Primary Treatment (CEPT)
A chemically enhanced primary treatment (CEPT) process enhances the
removal of the TSS and its associated BOD through chemical coagulation and
flocculation, followed by settling of the floc (Harleman and Murcott, 1992). This is
an important process which enhances the removal of oily emulsion (Painmanakul et
al., 2009 and Xiao et al., 2007) and suspended solids (Harleman and Murcott, 1992)
in the flotation unit which gauges the efficiency of dispersed air flotation in removal
of both O&G and TSS in this project.
The CEPT is the process by which chemicals, typically metal salts and/or
polymers in the form of organic polyelectrolytes, are added to primary sedimentation
basins. The chemicals added cause the suspended particles to clump together via the
processes of coagulation and flocculation. The particle aggregates, or floc, settles
faster thereby enhancing treatment efficiency which is measured as removal of
solids, organic matter and nutrients from the wastewater. Typical chemicals utilized
in the CEPT are ferric chloride and aluminum sulfate (alum), and there are
practically no residual metals in the supernatant (Harleman and Murcott, 1992).
Alum was employed as coagulant in this project, while anionic polymer was used as
flocculant. The dosing rates of both CEPT agent solutions were investigated in terms
of removal efficiency of both O&G and TSS.
Xiao et al. (2007) investigated the potential of using poly-aluminium chloride
and cationic polyacrylamide as flocculant in separation of oil from wastewater in the
DAF, while Painmanakul et al. (2009) also investigated the potential of using alum
as chemical coagulant in treatment of oily wastewater. Both research studies
indicated favourable results when coagulation and flocculation were incorporated in
treatment of oily wastewater using flotation. As the initial phase of this study is
spearheaded by jar test to determine optimum chemical dosage of coagulants and
flocculants prior to DiAF treatment, Zhou et.al (2007) research study on removal of
secondary yeast waste effluents by coagulation using aluminium sulphate conducted
via jar test also serve as a research reference based on similarity on coagulation test
procedures.

23
Although the overall coagulation and flocculation mechanisms lower the
energy barrier between oil droplets and air bubbles, the increase in droplet size,
thereby improving the probability of collision between the oil droplets and air
bubbles, may be the determining factor (Gray et al., 1997). The overall effectiveness
is determined by coagulating agent and dosage, solution pH and ionic strength, and
nature of the organic compounds (Stephenson et al., 1995).
Coagulation enhances the removal of O&G and TSS by destabilizing the
particle’s charges. Oil droplets are negatively charged due to charged surfactants or
adsorption of hydroxyl ions (Al-Shamrani et al.,2002; Marinova et al., 1995). By
introducing coagulants with opposite charges, the coagulants are able to neutralize
these repulsive electrostatic forces and encourage oil droplets to coagulate and assist
in the attachment of coagulated oil droplets to the negative air bubbles (Moosai et al.,
2003). A high-energy, rapid-mix to properly disperse the coagulant and promote
particle collisions is needed to achieve good coagulation. Over-mixing does not
affect coagulation, but insufficient mixing will leave this step incomplete.
Coagulants should be added where sufficient mixing will occur in order to achieve
proper coagulation.
Following the first step of coagulation, a second process called flocculation
occurs. Flocculation is a gentle mixing stage which increases the particle size from
submicroscopic microfloc to visible suspended particles. Flocculation occurs when a
polymer forms larger stabilised hydrophobic flocs through bridging and/or
electrostatic mechanisms. Bridging, the dominant mechanism, occurs when a
polymer is adsorbed onto the surface of two or more droplets, forming a link.
Electrostatic patching involves polymers lying flat on the droplet surface, with
patches of opposite charge on different droplets attracting each other. These
mechanisms overlap if the initial adsorption of the polymer during bridging arises
from electrostatic attraction (Gray et al., 1997). Flocculation depends on type,
molecular weight and ionisation degree of flocculant, composition and size of
particles, pH and chemical composition of solution (Sworska et al., 2000).

24
CHAPTER 3
METHODOLOGY
3.1 Experimental Plan
Start
Jar Test
Determine optimum pH medium and coagulant (alum) dosage. Determine optimum pH medium and flocculant (anionic polymer) dosage.
Determine optimum pH medium at both optimum alum dosage and anionic polymer dosage.
1. PRELIMINARY TEST
Flotation Equipment
Air Pressure pH Coagulation Rotation Speed
650 mL sample is collected from flotation tank after wastewater is retained for 30 min.
2. EXPERIMENTAL STUDY
3. SAMPLING PLAN
Sample Analyses
Oil and Grease
Total Suspended Solids
Standard Methods for the Examination of Water and Wastewater
Section 5520B Section 2540D
Turbidity
Handheld device
4. SAMPLE ANALYSES
Data Collection
5. DATA COLLECTION
Data Analysis using MS Excel
End
6. DATA ANALYSIS
Flocculation Rotation Speed

25
3.2 Preliminary Test: Jar Test
Jar test constituted the preliminary test in this study to determine optimum
dosages of coagulant and flocculant and its optimum pH for optimum removal
efficiency of the TSS and O&G and turbidity. The jar test in this study involved three
phases:
1) Determination of optimum pH based on highest turbidity reduction after
coagulation (alum) and flocculation (anionic polymer) processes.
2) Determination of optimum alum dosage based on highest turbidity reduction
after coagulation process which constituted the first stage of CEPT process.
3) Determination of optimum anionic polymer dosage based on highest turbidity
reduction after flocculation process which constituted the second stage of
CEPT process.
The optimum chemical dosage value and pH condition were used as the initial point
for investigating the factors affecting the removal of TSS and O&G using DiAF.
3.2.1 Pre-Experimental Procedures in Jar Test
a) Preparation of Synthetic Wastewater
1. One litre of tap water was poured into each of the six jar test beakers.
2. Fifty millilitres of cooking oil (Minyak Masak Bertapis“Sawit Emas”) was added into
each of the jar test beakers.
3. Then, 3 g of grease was weighted and added into the jar test beakers with proper
stirring using glass rod.
4. Finally, 30 g of black soil (horticultural) was mixed into the synthetic wastewater
solution of each jar test beakers.
26
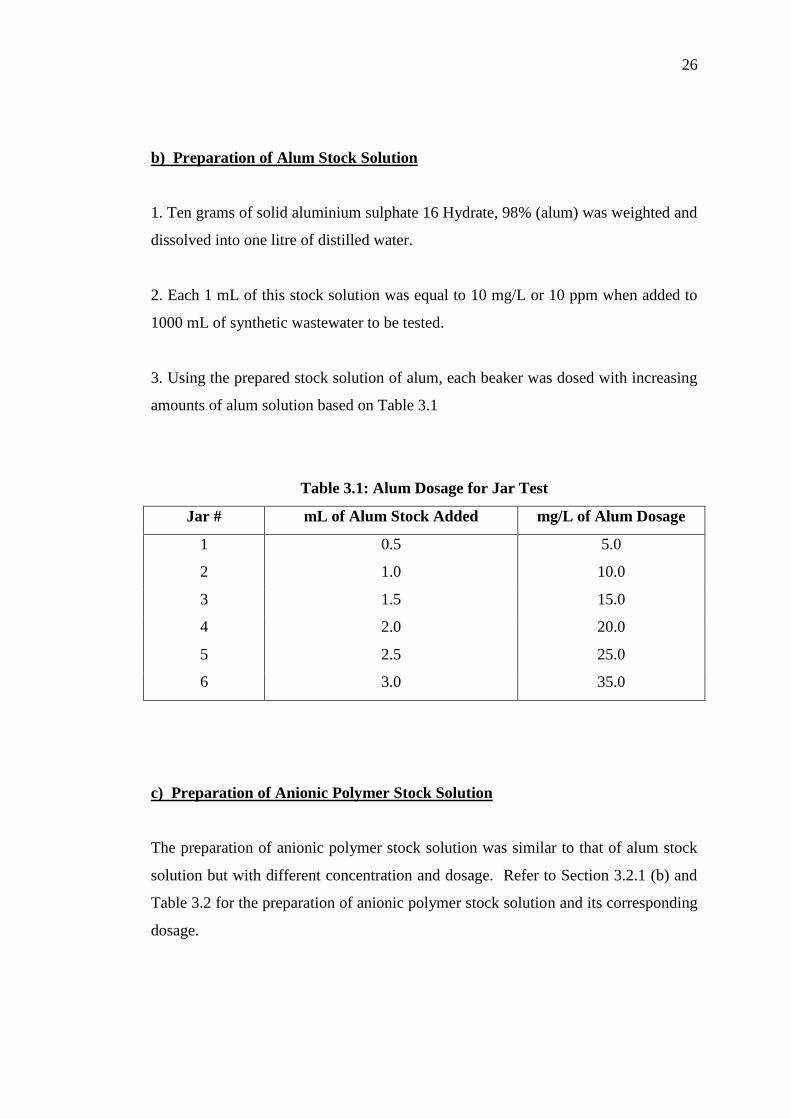
b) Preparation of Alum Stock Solution
1. Ten grams of solid aluminium sulphate 16 Hydrate, 98% (alum) was weighted and
dissolved into one litre of distilled water.
2. Each 1 mL of this stock solution was equal to 10 mg/L or 10 ppm when added to
1000 mL of synthetic wastewater to be tested.
3. Using the prepared stock solution of alum, each beaker was dosed with increasing
amounts of alum solution based on Table 3.1
Table 3.1: Alum Dosage for Jar Test
Jar # mL of Alum Stock Added mg/L of Alum Dosage
1 0.5 5.0
2 1.0 10.0
3 1.5 15.0
4 2.0 20.0
5 2.5 25.0
6 3.0 35.0
c) Preparation of Anionic Polymer Stock Solution
The preparation of anionic polymer stock solution was similar to that of alum stock
solution but with different concentration and dosage. Refer to Section 3.2.1 (b) and
Table 3.2 for the preparation of anionic polymer stock solution and its corresponding
dosage.

27
Table 3.2: Anionic Polymer Dosage for Jar Test
Jar # mL of Polymer Stock Added mg/L of Polymer Dosage
1 20 200
2 30 300
3 40 400
4 50 500
5 60 600
6 70 700
d) Preparation of HCl Aqueous Solution for pH Adjustment
1. One litre of 0.1 M HCl was prepared based on the following calculations:
Initial HCl concentration = 11.64 M HCl
Based on Equation 3.1:
M1V1 = M2V2 (3.1)
where:
subscript 1 denotes starting ( concentrated conditions) and
subscript 2 denotes ending (dilute conditions)
2. Hence, 0.0086 L of 11.64 M HCl was slowly added to 914 mL of deionized water
to prepare 1 L of 0.1 M HCl.
e) Preparation of NaOH Aqueous Solution for pH Adjustment
1. One litre of 0.1 M NaOH was prepared based on the following calculations:
(i) Determine the volume, V1 of 0.5 M NaOH.
Based on Equation 3.1:
M1V1 = M2V2
(3.1)
28
where:
subscript 1 denotes starting ( concentrated conditions) and
subscript 2 denotes ending (dilute conditions)
Hence, 200 mL of 0.5 M NaOH was needed for dilution.
(ii) The mass of 0.5 M NaOH pellets needed to produce 200 mL of 0.5 M NaOH
solution for dilution was determined:
(3.2)
where:
g = mass in gram
M = molarity
V = volume in mL
W = molecular mass
Hence, based on Equation 3.2, 4 g of 0.5 M NaoH pellets was needed to produce
200 mL of NaOH.
2. Four grams of NaOH pellets was weighted and dissolved into 200 mL of deionized
water to prepare 200 mL of 0.5 M NaOH solution.
3. The prepared solution of 0.5 M NaOH was transferred into a 1000 mL reagent
bottled containing 800 mL of deionized water.
.
29
3.2.2 Procedures of Jar Test Experiment
1. The 6 tester jars were filled to 1000 mL each with synthetic wastewater.
2. pH was adjusted to pH 2 using HCL and NaOH solution.
3. The jar test speed of LS-26001-A was set to 250 rpm for at least 5 minutes to mix
the synthetic wastewater. Two hundred millilitres of wastewater sample was
collected for initial turbidity analysis.
4. Alum solution was dosed in accordance with Table 3.1 for each jar.
5. Synthetic wastewater solution continued to be stirred at 250 rpm for 15 minutes.
6. Coagulation was allowed to take place for at least 30 minutes or until the
suspended solids form colloids. Jar test was stopped when coagulation was
completed.
7. Two hundred millilitres of wastewater sample were collected for final turbidity
analysis after alum treatment.
8. After coagulation, anionic polymer solution was dosed into each beaker according
to Table 3.2 to initiate flocculation process.
9. Stirrer speed was set to 30 rpm and mixture was stirred for 15 minutes
10. Flocculation was allowed to take place for at least 30 minutes or until formation
of flocs occurred. Jar test was stopped when flocculation was completed.
11. Step 7 was repeated for final turbidity analysis after anionic polymer treatment.
30
12. Step 1 to step 11 was repeated for different pH: pH 3, 6, 7, 9, 12 and 13.
13. Optimum pH, alum and anionic polymer dosage was determined based on
highest turbidity removal.
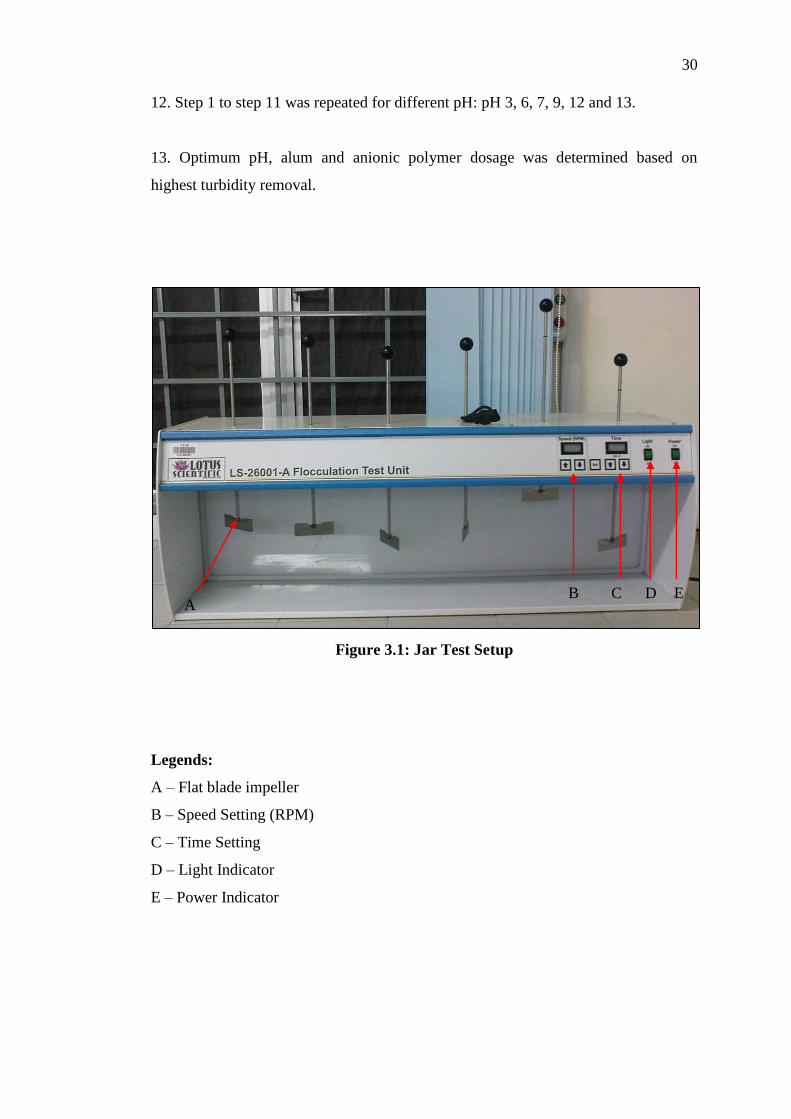
Figure 3.1: Jar Test Setup
Legends:
A – Flat blade impeller
B – Speed Setting (RPM)
C – Time Setting
D – Light Indicator
E – Power Indicator
A B C D E
31
3.3 Experimental Study: Flotation
3.3.1 Experimental Setup
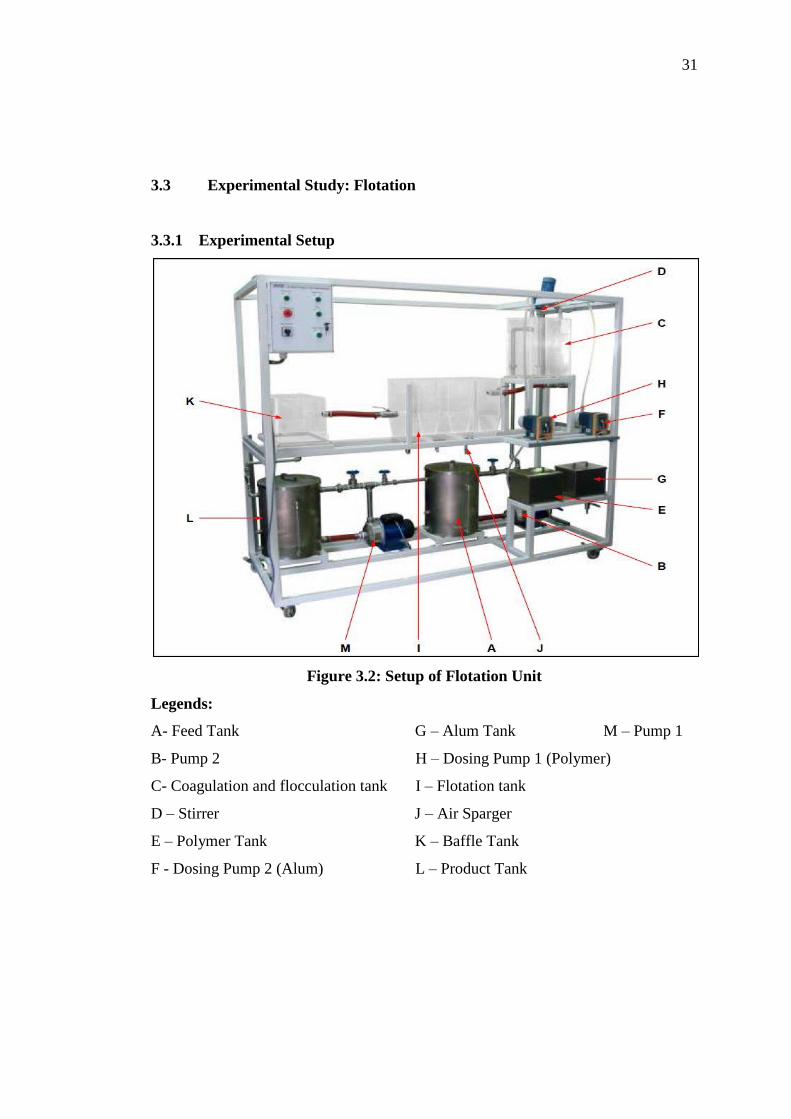
Figure 3.2: Setup of Flotation Unit
Legends:
A- Feed Tank G – Alum Tank M – Pump 1
B- Pump 2 H – Dosing Pump 1 (Polymer)
C- Coagulation and flocculation tank I – Flotation tank
D – Stirrer J – Air Sparger
E – Polymer Tank K – Baffle Tank
F - Dosing Pump 2 (Alum) L – Product Tank

32
3.3.2 Process Flow Diagram
Figure 3.3: Process Flow Diagram of Flotation Unit
3.3.3 Flotation Procedures
(a) Air Pressure
1. Fifty litres of tap water was filled into feed tank and mixed with 150 g of soil
(sieved to remove coarse particles and rocks), 10 g of grease and 100 mL of cooking
oil. Three hundred grams of sodium chloride pellets are dissolved into water.
33
2. The polymer tank was filled with polymer solution at optimum polymer dosage
(Section 3.2.2, Step 13).
3. The alum tank was filled with aluminium sulphate solution at optimum alum
dosage (Section 3.2.2, Step 13).
4. The main switch from the control panel was switched on.
5. Pump 2 was switched on from the control panel and is regulated to adjust the flow.
6. The flocculation and coagulation tank was filled with wastewater (the height of
wastewater in the tank was approximately 35 cm).
7. The stirrer was switched on and the rotation speed was set to 250 rpm. The stirrer
was allowed to mix the wastewater for 5 minutes.
8. While mixing, 650 mL sample of wastewater is collected from the flocculation and
coagulation tank. The sample was tested for initial O&G, TSS and turbidity.
9. pH was adjusted by adding HCL or NaOH solution based on the optimum initial
pH selected from jar test.
10. Dosing Pump 2 (Alum) from the control panel was switched on. The START
button in front of the dosing pump was pressed and the flow rate was set to 4.01 L/hr.
Coagulation was allowed to take place for 30 minutes or until the suspended solids
form colloids.
11. Dosing Pump 1 (Polymer) from the control panel was then switched on after 30
minutes. The START button in front of the dosing pump was pressed and the flow
rate was set to 2 L/hr. Allow 130 minutes for flocculation to take place until larger
flocs were formed.
12. When larger flocs were formed, the dosing pump was switched off.

34
13. All the chemically-treated water were drained into the flotation tank by opening
Valve 1.
14. The pressure on the air pressure regulator was regulated to 0.1 MPa.
15. The air valve was slowly opened in order to produce fine bubbles and adequate
amount of bubbles.
16. The flotation process was allowed to take place for 30 minutes.
17. Another batch of wastewater was prepared by repeating Steps 2 to 12.
18. The process in the flotation tank was observed and flotation process was set to
run for an hour at least.
19. Six hundred and fifty millimetres of the final sample was collected from the
flotation tank at 0.2 m above gas diffuser and tested for final O&G, TSS and
turbidity.
20. Step 14 was repeated for different air pressures at 0.2, 0.3, 0.4 and 0.5 MPa.
21. Optimum air pressure for removal of the O&G and TSS was determined.
(b) pH
1. Steps 1 to 8 in Section 3.3.3 (a) were followed.
2. pH was adjusted to pH 2 by adding HCL and NaOH solution.
3. Steps 10 to 14 in Section 3.3.3 (a) were followed
4. The air pressure was regulated based on the optimum air pressure determined from
the Step 21 in Section 3.3.3 (a).
35
5. Steps 15 to 19 in Section 3.3.3 (a) were followed.
6. Step 20 in Section 3.3.3(a) was repeated for pH 3, 7, 9 and 10.
7. Optimum pH for the removal of O&G and TSS was determined.
(c) Coagulation Rotation Speed
1. Steps 1 to 19 were followed based on Section 3.3.3(a) using optimum air pressure
and optimum pH found in Section 3.3.3(a) Step 21 and Section 3.3.3(b) Step 7,
respectively.
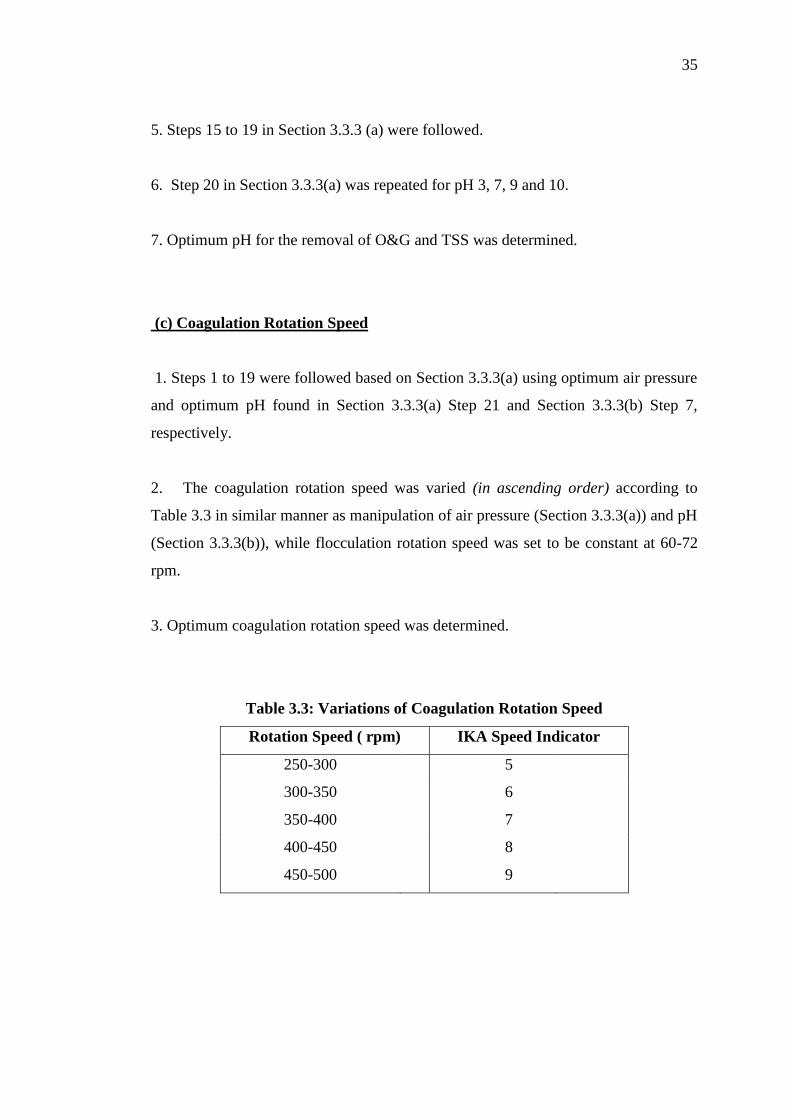
2. The coagulation rotation speed was varied (in ascending order) according to
Table 3.3 in similar manner as manipulation of air pressure (Section 3.3.3(a)) and pH
(Section 3.3.3(b)), while flocculation rotation speed was set to be constant at 60-72
rpm.
3. Optimum coagulation rotation speed was determined.
Table 3.3: Variations of Coagulation Rotation Speed
Rotation Speed ( rpm) IKA Speed Indicator
250-300 5
300-350 6
350-400 7
400-450 8
450-500 9
36
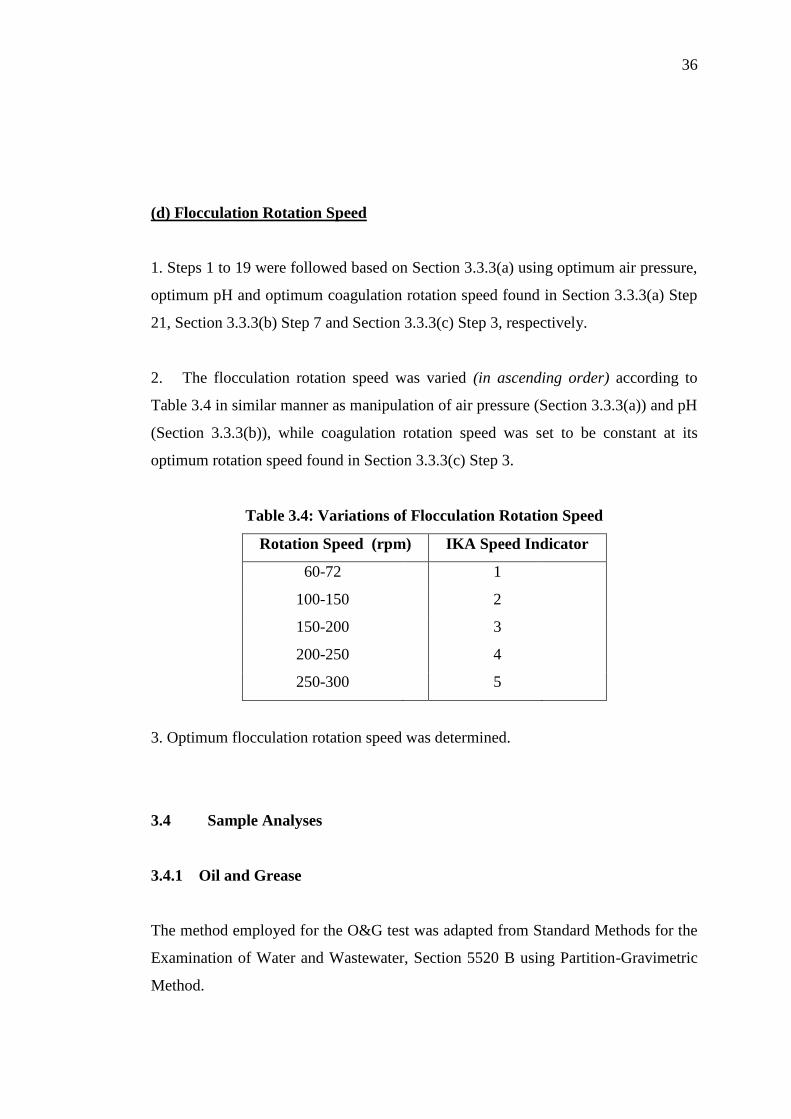
(d) Flocculation Rotation Speed
1. Steps 1 to 19 were followed based on Section 3.3.3(a) using optimum air pressure,
optimum pH and optimum coagulation rotation speed found in Section 3.3.3(a) Step
21, Section 3.3.3(b) Step 7 and Section 3.3.3(c) Step 3, respectively.
2. The flocculation rotation speed was varied (in ascending order) according to
Table 3.4 in similar manner as manipulation of air pressure (Section 3.3.3(a)) and pH
(Section 3.3.3(b)), while coagulation rotation speed was set to be constant at its
optimum rotation speed found in Section 3.3.3(c) Step 3.
Table 3.4: Variations of Flocculation Rotation Speed
Rotation Speed (rpm) IKA Speed Indicator
60-72 1
100-150 2
150-200 3
200-250 4
250-300 5
3. Optimum flocculation rotation speed was determined.
3.4 Sample Analyses
3.4.1 Oil and Grease
The method employed for the O&G test was adapted from Standard Methods for the
Examination of Water and Wastewater, Section 5520 B using Partition-Gravimetric
Method.
37
(a) Apparatus:
a. Separatory funnel, 500 mL, with glass stopcock.
b. Liquid funnel, glass.
c. Filter paper, 9.0-cm diameter (Double Ring)
d. pH paper ( MERCK pH paper indicator strips)
e. pH meter ( EUTECH instruments, pH 300/310 )
f. Water bath at 85oC
g. Vacuum pump (POWER-AIR, VRL-U-02)
h. Waste receptacle, for used solvent
i. Desiccator
j. Volumetric flask, 500 mL
k. Thermometer ( Total immersion mercury type)
(b) Reagents:
a. Hydrochloric acid 40%, 1:1: Mix equal volumes of acid and reagent water.
b. n- hexane 99%, boiling point 69oC
c. Sodium sulphate, Na2S04, anhydrous crystal.
(c) Procedures:
1. Three hundred and fifty millimetres of sample was collected in a clean 500 mL
separatory funnel.
2. Four millimetres of 1:1 hydrochloric acid was added to the separatory funnel
using a pipette and pipette filler. The solution was mixed well and the pH must be
2 to hydrolysed oil and grease and prevent sodium sulphate contamination.
3. A previously dried and cleaned 125 mL distillation flask was weighted. The
weight of the flask was recorded.
38
4. Twenty millimetres of n-hexane was added to the separatory funnel.
5. The funnel was stoppered and inverted to release the gases through the stopcock.
Then, the funnel was vigorously shaked for 2 minutes. (To release gases from the
separatory funnel, invert and shake it once very hard and point the delivery tube in as
safe direction under a hood and slowly open the stopcock to release any gas.)
6. The funnel was left to stand undisturbed for at least 10 minutes to ensure
separation of the lower water layer and solvent layer. If an emulsion forms between
the two phases and about 5 mL exists, drain the emulsion and solvent layers into a
glass centrifuge tube and centrifuge for 5 min at approximately 2400 rpm.
7. The lower aqueous layer (water) was slowly drained from the separatory flask into
a 500 mL flask. This water layer was needed for Step 10. Several drops of solvent
layer were allowed to drain into the water layer until the solvent layer was visible on
top of the water to ensure complete transfer of the aqueous layer.
8. The filtering funnel was set up and the glass funnel is put in the neck of the
distillation flask. An 11 cm filter paper was folded and put on the funnel and 10 g of
anhydrous sodium sulphate was added to the filter paper by rinsing with small
amount of n-hexane.
9. The solvent was drip-drained into the pre-weighted distilling flask through a
funnel containing filter paper and 10 g anhydrous sodium sulphate. The sodium
sulphate was gently stirred with a glass rod while the solvent layer is draining.
10. The water layer was returned to the separatory funnel. Using the same glass
funnel, the second and third extraction was repeated from the Steps 4 to 10 for two
more times.
11. The separatory funnel was rinsed with three separate 5 mL aliquots of fresh n-
hexane to remove any oil film left on the funnel walls. Each aliquot is drained
through the funnel containing sodium sulphate into the distillation flask.
39
12. The tip of the glass funnel is rinsed with 5 mL of n-hexane while removing it
from the distillation flask.
13. A beaker of water was heated on top of the hot plate to 85oC inside the hood. The
distilling flask containing the solvent was put into the hot water bath. When visible
solvent evaporation stops, the flask is removed from the water bath.
14. The remaining solvent vapour is removed from the distilling flask using vacuum
pump for the final 1 minute.
15. The flask was placed in the desiccator for 30 minutes.
16. Using an analytical balance, the weight of the flask is measured to the nearest
0.1 mg. Triplicate readings are obtained.
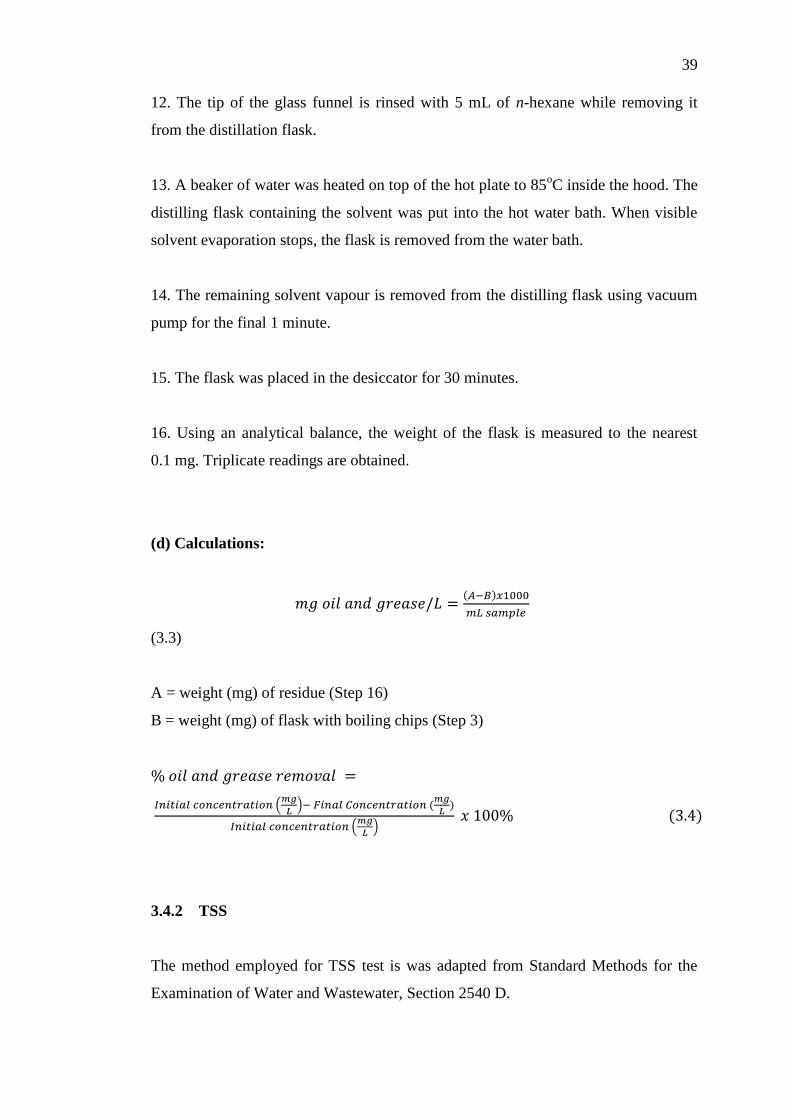
(d) Calculations:
(3.3)
A = weight (mg) of residue (Step 16)
B = weight (mg) of flask with boiling chips (Step 3)
3.4.2 TSS
The method employed for TSS test is was adapted from Standard Methods for the
Examination of Water and Wastewater, Section 2540 D.
40
(a) Apparatus:
a. Drying oven (Memmert - Copens Scientific), for operation at 103oC to
105oC
b. Analytical balance (HR-200 AND, GR-200 AND), capable of weighing to
0.1 mg
c. Magnetic stirrer with TFE stirring bar (IKA RH B 2)
d. Glass-fiber filter disks, 9.0 cm (Double Ring)
e. Filtration apparatus: Gooch crucible, 25 to 40 mL capacity with Gooch
crucible adapter and vacuum pump for filtration (POWER-AIR, VRL-U-02).
(b) Procedures:
1. The filter paper disk was inserted wrinkled side up in the filtration apparatus.
2. Vacuum was applied and the filter disk was washed three times with 20 mL of
deionized water. The vacuum suction was carried out to remove all traces of water
and the washings are discarded.
3. The filter paper was dried in the oven at 103 to 105oC for 15 minutes to remove
moisture from the filter paper absorbed from the air from the filter paper.
4. The weight of the filter paper was recorded as soon as it is removed from the oven.
The mass of filter paper was recorded for triplicate readings.
5. The dried filter paper was put on to the vacuum filtration apparatus.
6. Two hundred millimetres of sample water was collected and sample was mixed
with a glass stirring rod to ensure suspended solids are evenly distributed in the
sample before filtration.
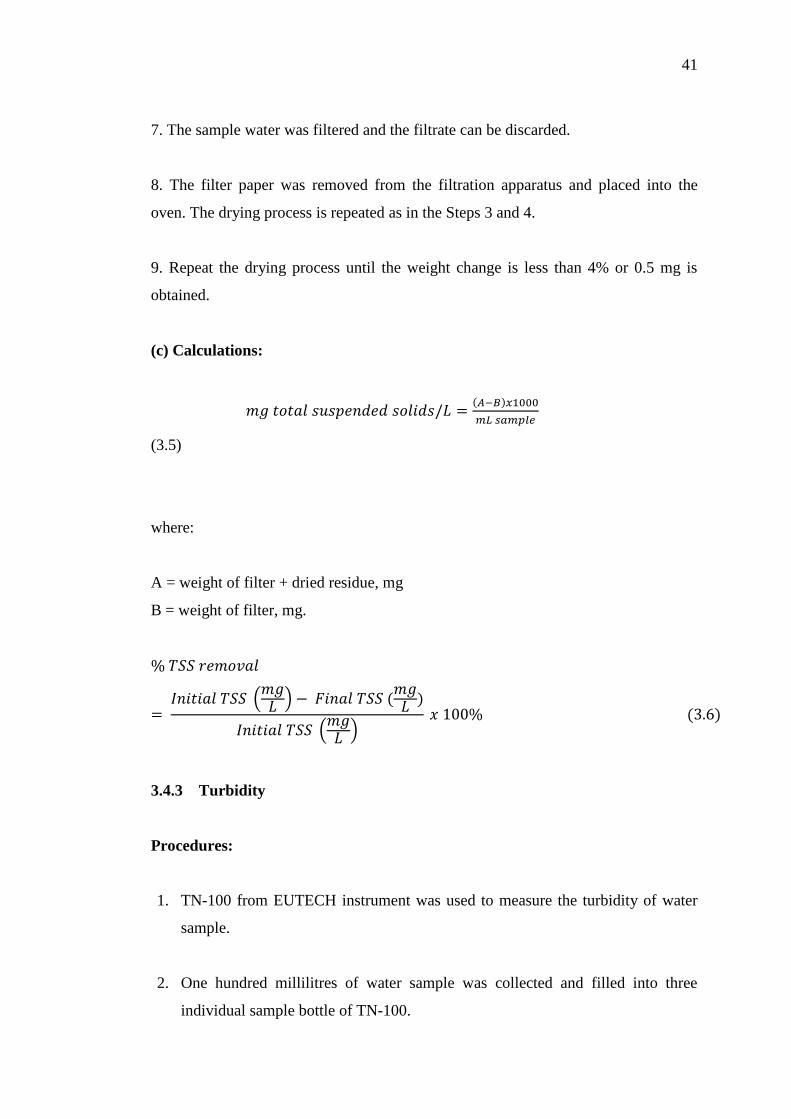
41
7. The sample water was filtered and the filtrate can be discarded.
8. The filter paper was removed from the filtration apparatus and placed into the
oven. The drying process is repeated as in the Steps 3 and 4.
9. Repeat the drying process until the weight change is less than 4% or 0.5 mg is
obtained.
(c) Calculations:
(3.5)
where:
A = weight of filter + dried residue, mg
B = weight of filter, mg.
3.4.3 Turbidity
Procedures:
1. TN-100 from EUTECH instrument was used to measure the turbidity of water
sample.
2. One hundred millilitres of water sample was collected and filled into three
individual sample bottle of TN-100.

42
3. TN-100 was calibrated before measurement. Triplicate results were obtained for
each sample.
CHAPTER 4
4 RESULTS AND DISCUSSION
4.1 Synthetic Wastewater Characterization
The synthetic wastewater used in this project functioned as an analysis media
and experimental influent containing mixture of cooking oil, horticultural black soil
and grease diluted with tap water. The synthetic wastewater produced for the
preliminary test using LS-26001-A jar test unit had constant composition of cooking
oil, horticultural black soil and grease for each batch of pH tested where only
turbidity was measured as turbidity was the sole criteria for determination of
optimum pH, alum and anionic polymer dosage due to its preliminary nature. While
for the DiAF experiment using LS-26 205 unit, various compositions of the
aforementioned materials were mixed into the wastewater mixture where
concentrations of O&G and TSS were measured in addition to turbidity as shown in
Figure 4.1.
The reason for such approach disparity in the wastewater composition was
due to the short stirrer shaft and impeller in the coagulation and flocculation tank in
LS-26 205 unit as shown in Figure 4.2 which reduced the mixing effectiveness in the
tank to produce a well-mixed solution of wastewater whereby the lifting motion of
the soil at the bottom of the tank was deterred. Hence, constancy of synthetic
wastewater composition for LS-26 205 unit was not feasible. The various
43
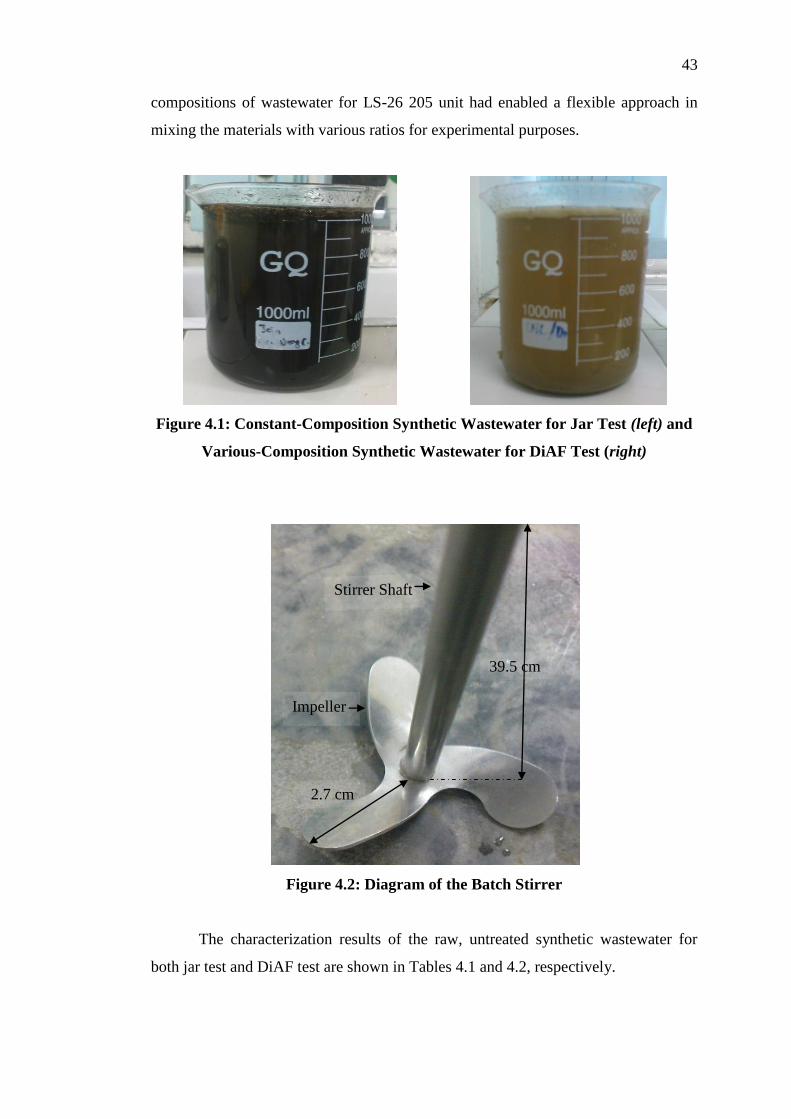
compositions of wastewater for LS-26 205 unit had enabled a flexible approach in
mixing the materials with various ratios for experimental purposes.
Figure 4.1: Constant-Composition Synthetic Wastewater for Jar Test (left) and
Various-Composition Synthetic Wastewater for DiAF Test (right)
Figure 4.2: Diagram of the Batch Stirrer
The characterization results of the raw, untreated synthetic wastewater for
both jar test and DiAF test are shown in Tables 4.1 and 4.2, respectively.
2.7 cm
39.5 cm
Stirrer Shaft
Impeller
44
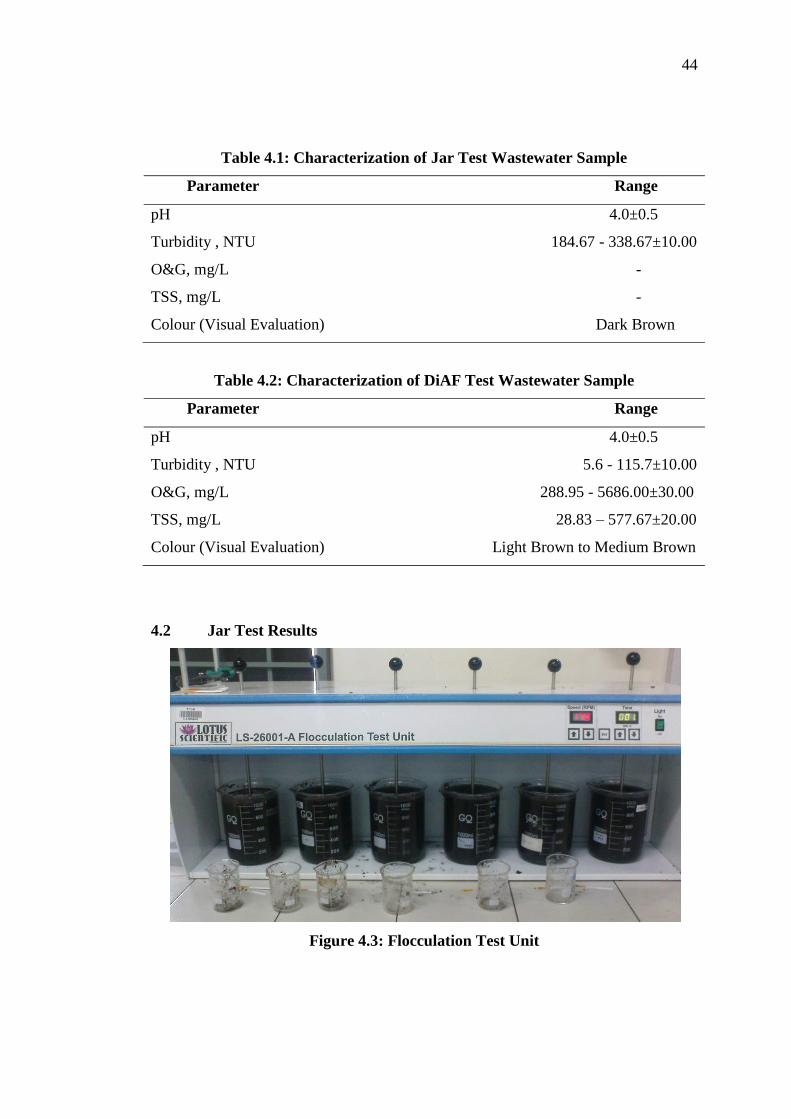
Table 4.1: Characterization of Jar Test Wastewater Sample
Parameter Range
pH 4.0±0.5
Turbidity , NTU 184.67 - 338.67±10.00
O&G, mg/L -
TSS, mg/L -
Colour (Visual Evaluation) Dark Brown
Table 4.2: Characterization of DiAF Test Wastewater Sample
Parameter Range
pH 4.0±0.5
Turbidity , NTU 5.6 - 115.7±10.00
O&G, mg/L 288.95 - 5686.00±30.00
TSS, mg/L 28.83 – 577.67±20.00
Colour (Visual Evaluation) Light Brown to Medium Brown
4.2 Jar Test Results
Figure 4.3: Flocculation Test Unit

45
The following results were achieved after a series of jar tests at varying dosages of
alum and anionic polymer.
46
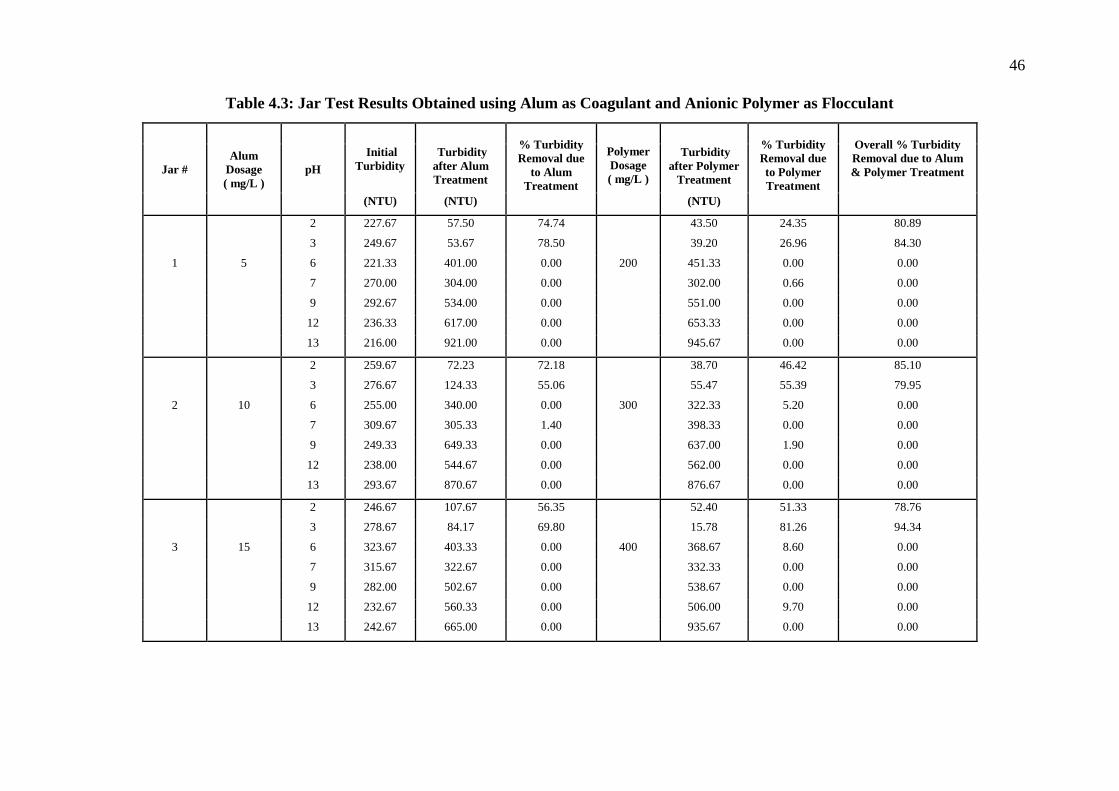
Table 4.3: Jar Test Results Obtained using Alum as Coagulant and Anionic Polymer as Flocculant
Jar #
Alum
Dosage
( mg/L )
pH
% Turbidity
Removal due
to Alum
Treatment
Polymer
Dosage
( mg/L )
% Turbidity
Removal due
to Polymer
Treatment
Overall % Turbidity
Removal due to Alum
& Polymer Treatment
Initial
Turbidity
Turbidity
after Alum
Treatment
Turbidity
after Polymer
Treatment
(NTU) (NTU) (NTU)
2 227.67 57.50 74.74 43.50 24.35 80.89
3 249.67 53.67 78.50 39.20 26.96 84.30
1 5 6 221.33 401.00 0.00 200 451.33 0.00 0.00
7 270.00 304.00 0.00 302.00 0.66 0.00
9 292.67 534.00 0.00 551.00 0.00 0.00
12 236.33 617.00 0.00 653.33 0.00 0.00
13 216.00 921.00 0.00 945.67 0.00 0.00
2 259.67 72.23 72.18 38.70 46.42 85.10
3 276.67 124.33 55.06 55.47 55.39 79.95
2 10 6 255.00 340.00 0.00 300 322.33 5.20 0.00
7 309.67 305.33 1.40 398.33 0.00 0.00
9 249.33 649.33 0.00 637.00 1.90 0.00
12 238.00 544.67 0.00 562.00 0.00 0.00
13 293.67 870.67 0.00 876.67 0.00 0.00
2 246.67 107.67 56.35 52.40 51.33 78.76
3 278.67 84.17 69.80 15.78 81.26 94.34
3 15 6 323.67 403.33 0.00 400 368.67 8.60 0.00
7 315.67 322.67 0.00 332.33 0.00 0.00
9 282.00 502.67 0.00 538.67 0.00 0.00
12 232.67 560.33 0.00 506.00 9.70 0.00
13 242.67 665.00 0.00 935.67 0.00 0.00
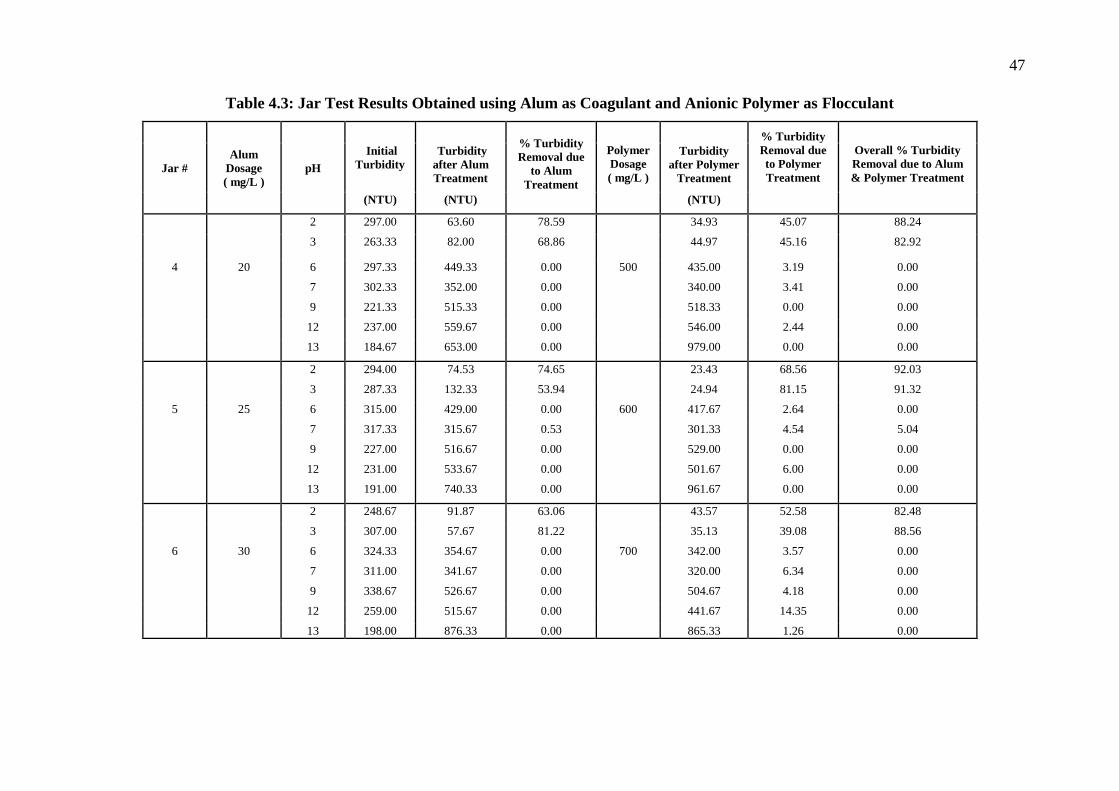
47
Table 4.3: Jar Test Results Obtained using Alum as Coagulant and Anionic Polymer as Flocculant
Jar #
Alum
Dosage
( mg/L )
pH
% Turbidity
Removal due
to Alum
Treatment
Polymer
Dosage
( mg/L )
% Turbidity
Removal due
to Polymer
Treatment
Overall % Turbidity
Removal due to Alum
& Polymer Treatment
Initial
Turbidity
Turbidity
after Alum
Treatment
Turbidity
after Polymer
Treatment
(NTU) (NTU) (NTU)
2 297.00 63.60 78.59 34.93 45.07 88.24
3 263.33 82.00 68.86 44.97 45.16 82.92
4 20 6 297.33 449.33 0.00 500 435.00 3.19 0.00
7 302.33 352.00 0.00 340.00 3.41 0.00
9 221.33 515.33 0.00 518.33 0.00 0.00
12 237.00 559.67 0.00 546.00 2.44 0.00
13 184.67 653.00 0.00 979.00 0.00 0.00
2 294.00 74.53 74.65 23.43 68.56 92.03
3 287.33 132.33 53.94 24.94 81.15 91.32
5 25 6 315.00 429.00 0.00 600 417.67 2.64 0.00
7 317.33 315.67 0.53 301.33 4.54 5.04
9 227.00 516.67 0.00 529.00 0.00 0.00
12 231.00 533.67 0.00 501.67 6.00 0.00
13 191.00 740.33 0.00 961.67 0.00 0.00
2 248.67 91.87 63.06 43.57 52.58 82.48
3 307.00 57.67 81.22 35.13 39.08 88.56
6 30 6 324.33 354.67 0.00 700 342.00 3.57 0.00
7 311.00 341.67 0.00 320.00 6.34 0.00
9 338.67 526.67 0.00 504.67 4.18 0.00
12 259.00 515.67 0.00 441.67 14.35 0.00
13 198.00 876.33 0.00 865.33 1.26 0.00

48
4.2.1 Optimum pH
Figure 4.4: Effect of Initial pH on Overall Turbidity Removal
Based on the jar test results as tabulated in Table 4.3, the effect of initial pH
variation of the synthetic wastewater on its turbidity removal measured in percentage
is plotted in Figure 4.4. The measured overall turbidity removal was due to the dual
effect of coagulation and flocculation. Figure 4.4 underscores that the turbidity
removal of the synthetic wastewater laid towards the acidic region within pH 2 to 3
and pH adjustment towards the alkaline region fail to remove any turbidity.
The percentage of turbidity removal within pH 2 and pH 3 was found to be
within the range of 79 to 94% which was significantly more than the other tested pH,
i.e. pH 6, 7, 9, 12 and 13. The most optimum pH which resulted in highest turbidity
removal at 94% was pH 3. The preliminary result obtained from jar test in regard to
pH value was quite different from previous jar test study (Aragones-Beltran et al.,
2008) which suggested optimum pH within the range of 10.5. This difference in pH
value might primarily be due to the type of sample wastewater tested as Aragones-
Beltran et.al. (2008) used industrial effluent derived from the printing, dyeing and
finishing textile industry containing high COD loading and hazardous substances
with an initial pH of 10.5. The type of wastewater might be the determining factor of
optimum pH as the presence of chemical and biological content interferes with the
49
coagulation and flocculation processes. COD was the most important factor to be
considered based on the criteria weight assessment according to Aragones-Beltran
et.al. (2008). Furthermore, it was also supposed that physical–chemical treatment
would not dramatically change the wastewater characteristics concerning
conductivity, colour and pH. Hence, the synthetic wastewater sample which was not
industry-derived had a drastically lower COD content compared to industrial effluent
which might primarily explain the difference in initial optimum pH obtained between
two studies.
Within the optimum pH at pH 3, it was found that the combination of
15 mg/L of alum with 400 mg/L of anionic polymer would project 94% removal of
turbidity, while the combination of 10 mg/L of alum and 300 mg/L of anionic
polymer would remove the least turbidity at around 80% based on Table 4.3 and
Figure 4.4. The optimization of alum dosage and anionic polymer dosage was further
refined based on the highest turbidity removed, respectively.
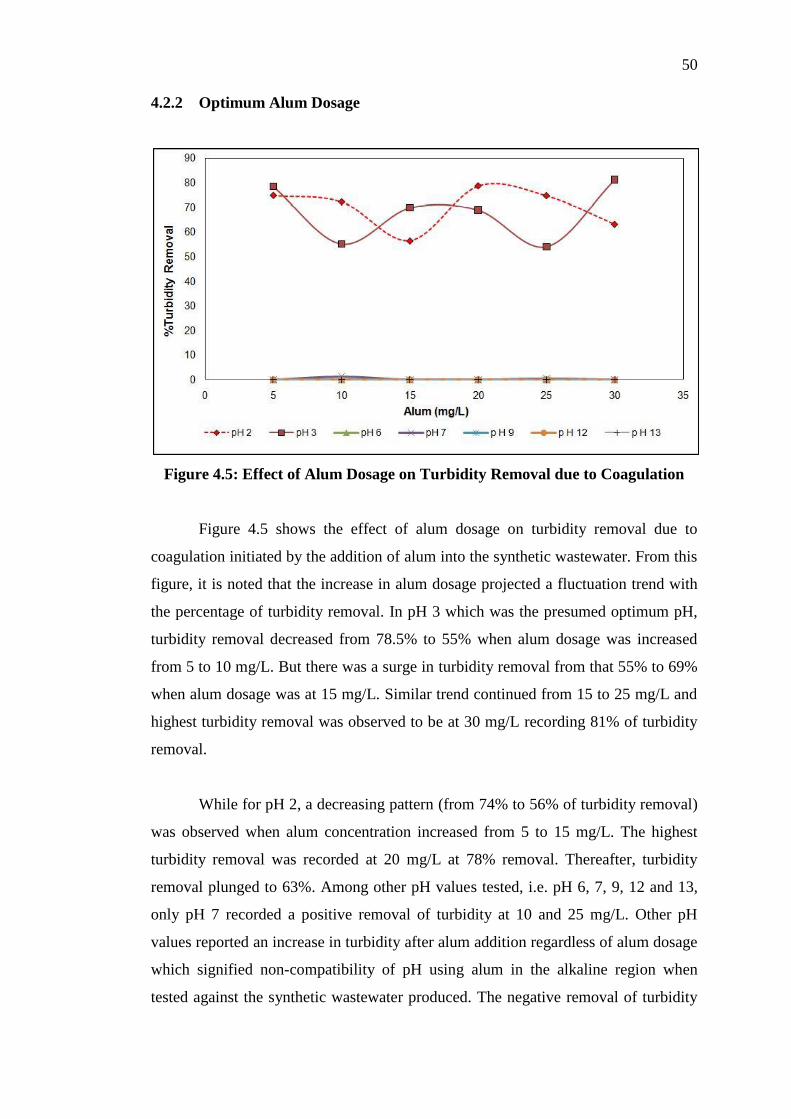
50
4.2.2 Optimum Alum Dosage
Figure 4.5: Effect of Alum Dosage on Turbidity Removal due to Coagulation
Figure 4.5 shows the effect of alum dosage on turbidity removal due to
coagulation initiated by the addition of alum into the synthetic wastewater. From this
figure, it is noted that the increase in alum dosage projected a fluctuation trend with
the percentage of turbidity removal. In pH 3 which was the presumed optimum pH,
turbidity removal decreased from 78.5% to 55% when alum dosage was increased
from 5 to 10 mg/L. But there was a surge in turbidity removal from that 55% to 69%
when alum dosage was at 15 mg/L. Similar trend continued from 15 to 25 mg/L and
highest turbidity removal was observed to be at 30 mg/L recording 81% of turbidity
removal.
While for pH 2, a decreasing pattern (from 74% to 56% of turbidity removal)
was observed when alum concentration increased from 5 to 15 mg/L. The highest
turbidity removal was recorded at 20 mg/L at 78% removal. Thereafter, turbidity
removal plunged to 63%. Among other pH values tested, i.e. pH 6, 7, 9, 12 and 13,
only pH 7 recorded a positive removal of turbidity at 10 and 25 mg/L. Other pH
values reported an increase in turbidity after alum addition regardless of alum dosage
which signified non-compatibility of pH using alum in the alkaline region when
tested against the synthetic wastewater produced. The negative removal of turbidity
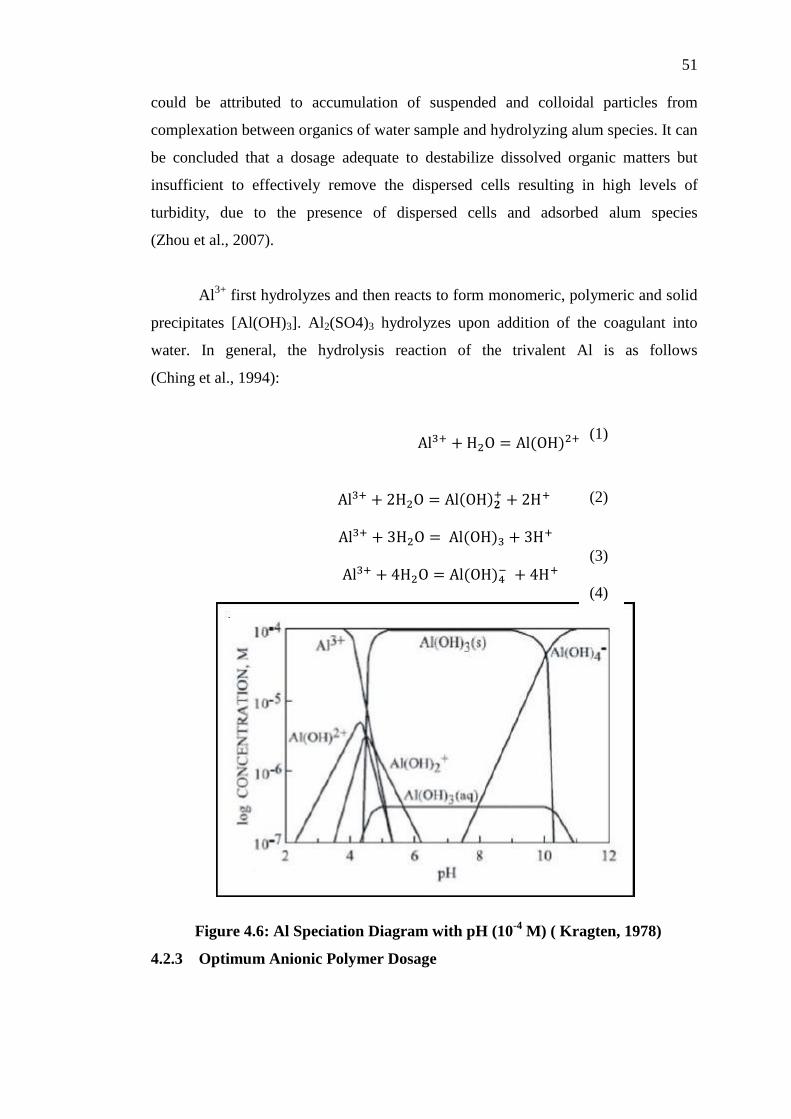
51
could be attributed to accumulation of suspended and colloidal particles from
complexation between organics of water sample and hydrolyzing alum species. It can
be concluded that a dosage adequate to destabilize dissolved organic matters but
insufficient to effectively remove the dispersed cells resulting in high levels of
turbidity, due to the presence of dispersed cells and adsorbed alum species
(Zhou et al., 2007).
Al3+
first hydrolyzes and then reacts to form monomeric, polymeric and solid
precipitates [Al(OH)3]. Al2(SO4)3 hydrolyzes upon addition of the coagulant into
water. In general, the hydrolysis reaction of the trivalent Al is as follows
(Ching et al., 1994):
Figure 4.6: Al Speciation Diagram with pH (10-4
M) ( Kragten, 1978)
4.2.3 Optimum Anionic Polymer Dosage
(1)
(2)
(3)
(4)
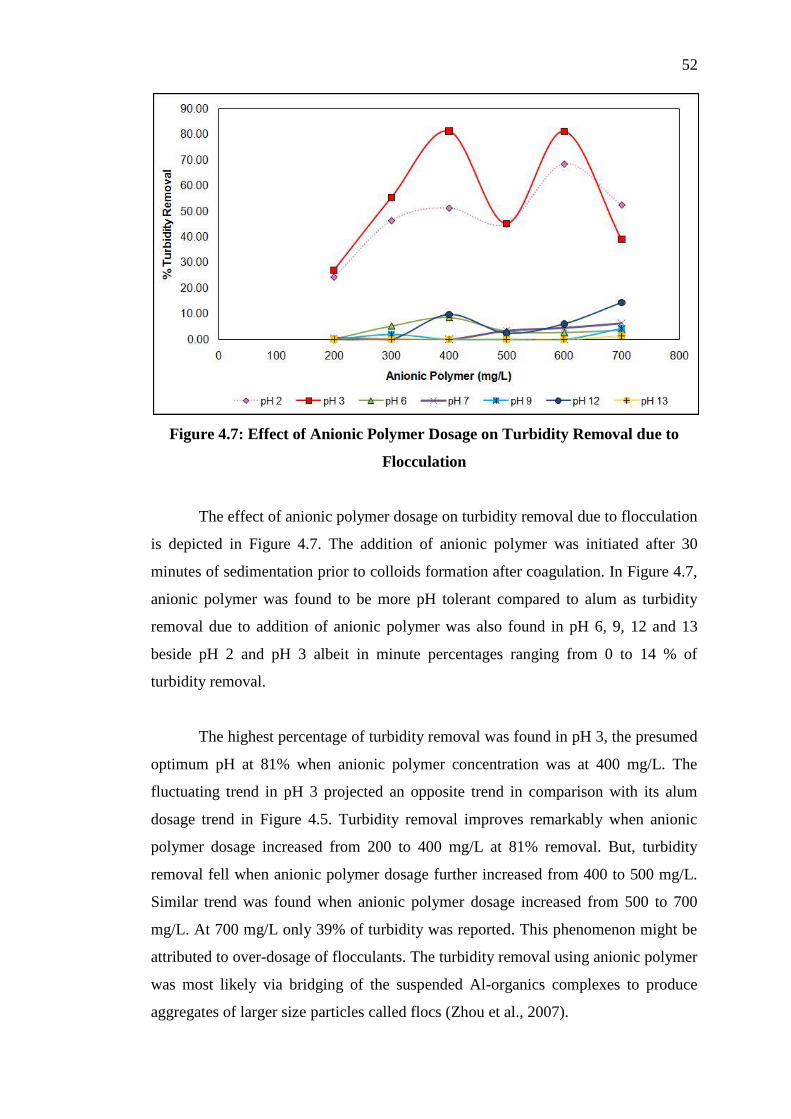
52
Figure 4.7: Effect of Anionic Polymer Dosage on Turbidity Removal due to
Flocculation
The effect of anionic polymer dosage on turbidity removal due to flocculation
is depicted in Figure 4.7. The addition of anionic polymer was initiated after 30
minutes of sedimentation prior to colloids formation after coagulation. In Figure 4.7,
anionic polymer was found to be more pH tolerant compared to alum as turbidity
removal due to addition of anionic polymer was also found in pH 6, 9, 12 and 13
beside pH 2 and pH 3 albeit in minute percentages ranging from 0 to 14 % of
turbidity removal.
The highest percentage of turbidity removal was found in pH 3, the presumed
optimum pH at 81% when anionic polymer concentration was at 400 mg/L. The
fluctuating trend in pH 3 projected an opposite trend in comparison with its alum
dosage trend in Figure 4.5. Turbidity removal improves remarkably when anionic
polymer dosage increased from 200 to 400 mg/L at 81% removal. But, turbidity
removal fell when anionic polymer dosage further increased from 400 to 500 mg/L.
Similar trend was found when anionic polymer dosage increased from 500 to 700
mg/L. At 700 mg/L only 39% of turbidity was reported. This phenomenon might be
attributed to over-dosage of flocculants. The turbidity removal using anionic polymer
was most likely via bridging of the suspended Al-organics complexes to produce
aggregates of larger size particles called flocs (Zhou et al., 2007).
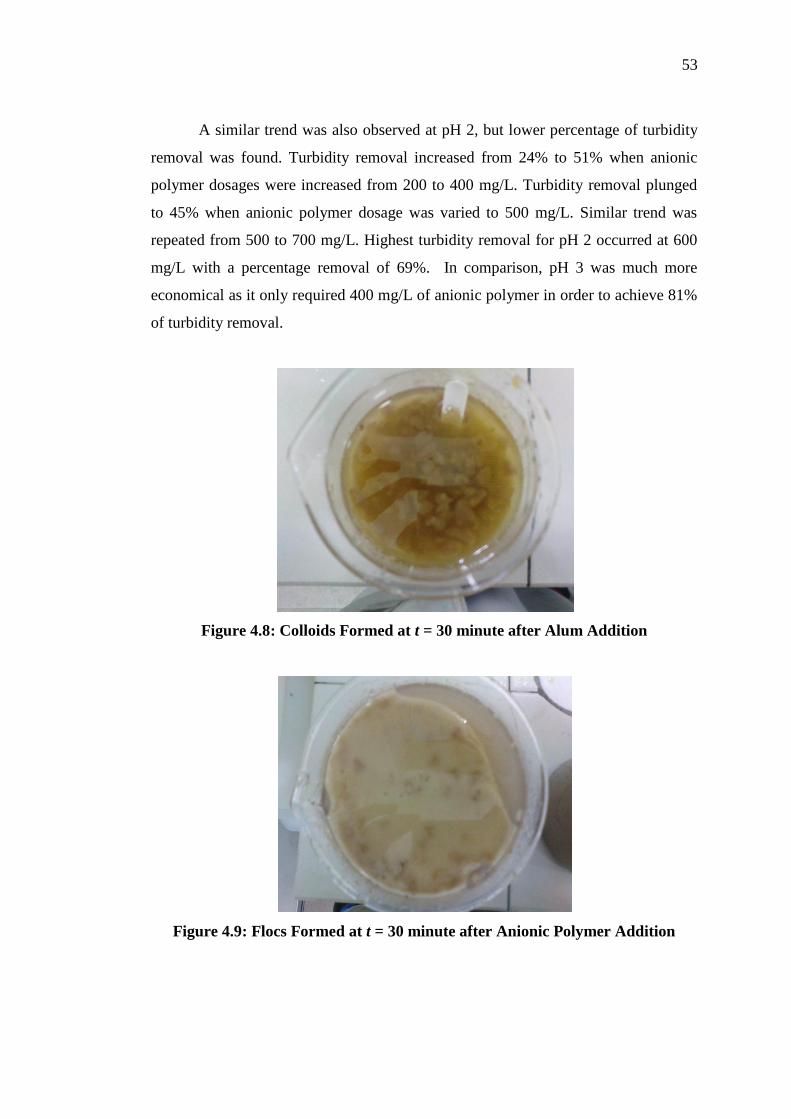
53
A similar trend was also observed at pH 2, but lower percentage of turbidity
removal was found. Turbidity removal increased from 24% to 51% when anionic
polymer dosages were increased from 200 to 400 mg/L. Turbidity removal plunged
to 45% when anionic polymer dosage was varied to 500 mg/L. Similar trend was
repeated from 500 to 700 mg/L. Highest turbidity removal for pH 2 occurred at 600
mg/L with a percentage removal of 69%. In comparison, pH 3 was much more
economical as it only required 400 mg/L of anionic polymer in order to achieve 81%
of turbidity removal.
Figure 4.8: Colloids Formed at t = 30 minute after Alum Addition
Figure 4.9: Flocs Formed at t = 30 minute after Anionic Polymer Addition
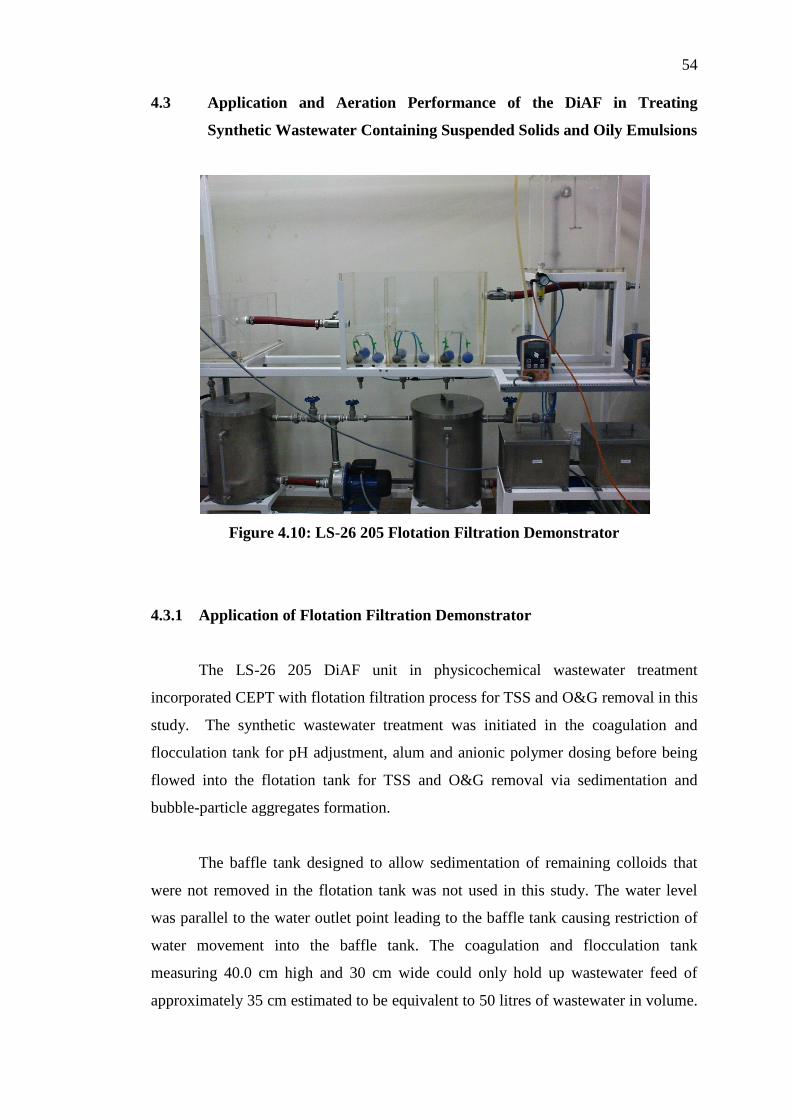
54
4.3 Application and Aeration Performance of the DiAF in Treating
Synthetic Wastewater Containing Suspended Solids and Oily Emulsions
Figure 4.10: LS-26 205 Flotation Filtration Demonstrator
4.3.1 Application of Flotation Filtration Demonstrator
The LS-26 205 DiAF unit in physicochemical wastewater treatment
incorporated CEPT with flotation filtration process for TSS and O&G removal in this
study. The synthetic wastewater treatment was initiated in the coagulation and
flocculation tank for pH adjustment, alum and anionic polymer dosing before being
flowed into the flotation tank for TSS and O&G removal via sedimentation and
bubble-particle aggregates formation.
The baffle tank designed to allow sedimentation of remaining colloids that
were not removed in the flotation tank was not used in this study. The water level
was parallel to the water outlet point leading to the baffle tank causing restriction of
water movement into the baffle tank. The coagulation and flocculation tank
measuring 40.0 cm high and 30 cm wide could only hold up wastewater feed of
approximately 35 cm estimated to be equivalent to 50 litres of wastewater in volume.
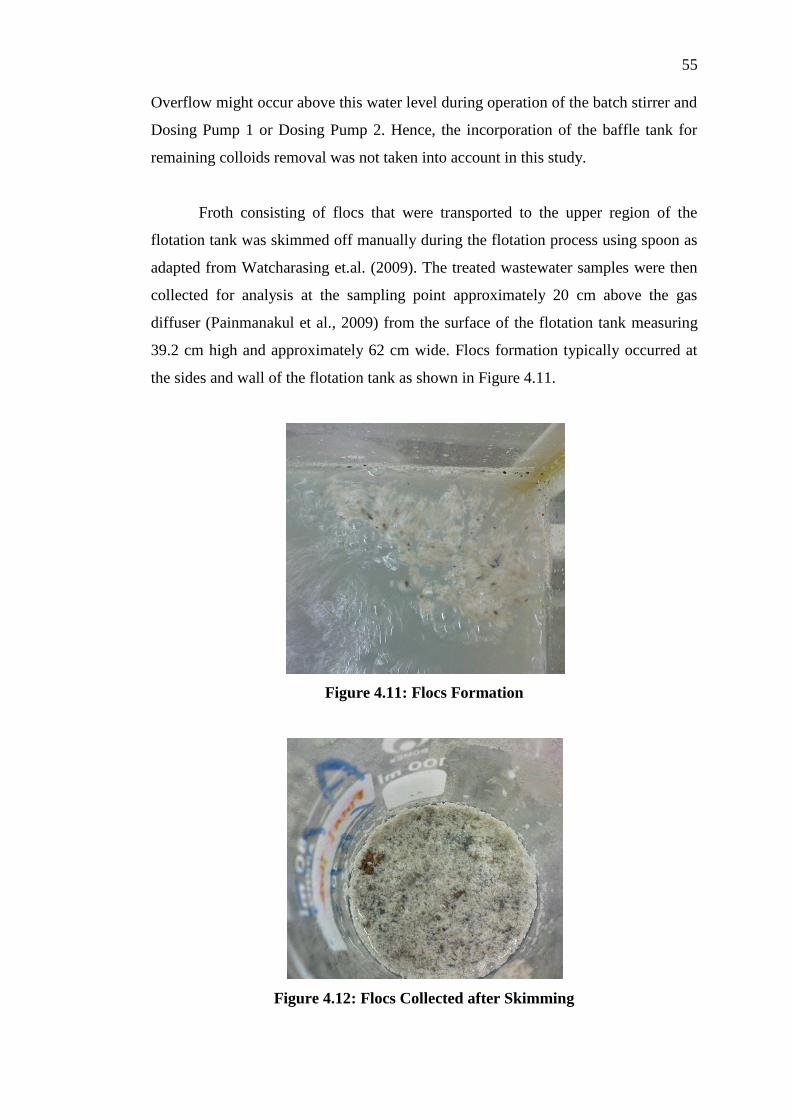
55
Overflow might occur above this water level during operation of the batch stirrer and
Dosing Pump 1 or Dosing Pump 2. Hence, the incorporation of the baffle tank for
remaining colloids removal was not taken into account in this study.
Froth consisting of flocs that were transported to the upper region of the
flotation tank was skimmed off manually during the flotation process using spoon as
adapted from Watcharasing et.al. (2009). The treated wastewater samples were then
collected for analysis at the sampling point approximately 20 cm above the gas
diffuser (Painmanakul et al., 2009) from the surface of the flotation tank measuring
39.2 cm high and approximately 62 cm wide. Flocs formation typically occurred at
the sides and wall of the flotation tank as shown in Figure 4.11.
Figure 4.11: Flocs Formation
Figure 4.12: Flocs Collected after Skimming
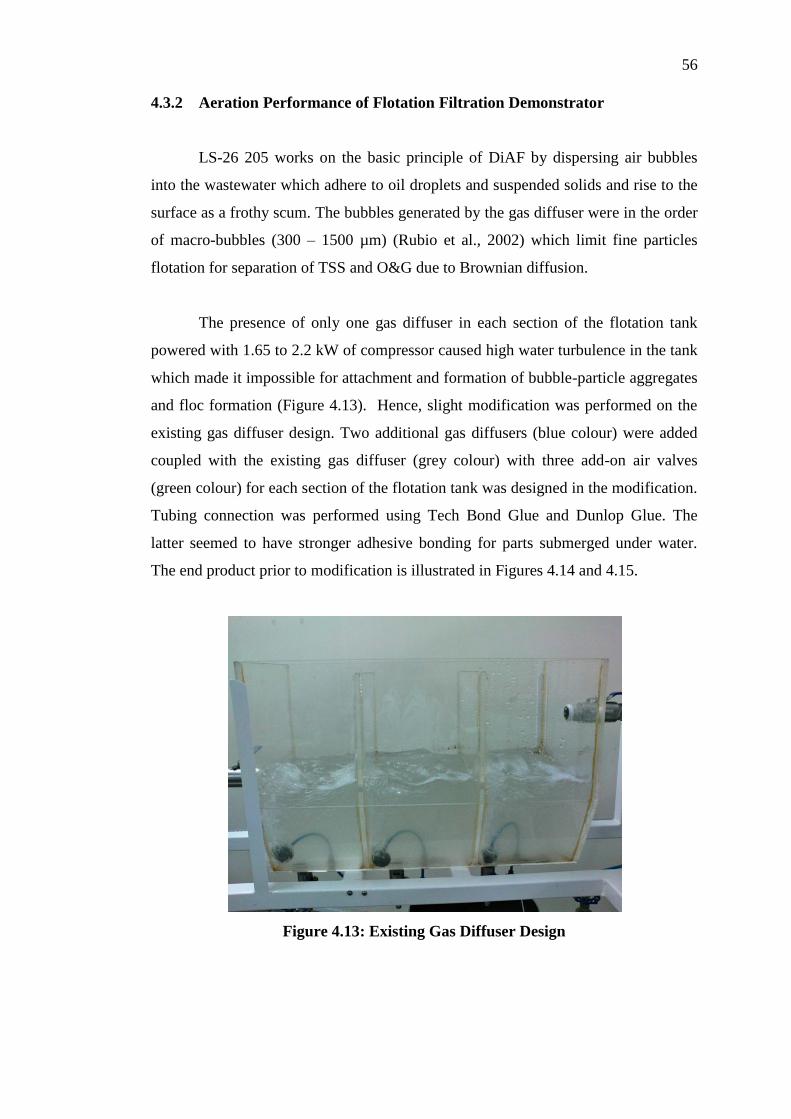
56
4.3.2 Aeration Performance of Flotation Filtration Demonstrator
LS-26 205 works on the basic principle of DiAF by dispersing air bubbles
into the wastewater which adhere to oil droplets and suspended solids and rise to the
surface as a frothy scum. The bubbles generated by the gas diffuser were in the order
of macro-bubbles (300 – 1500 µm) (Rubio et al., 2002) which limit fine particles
flotation for separation of TSS and O&G due to Brownian diffusion.
The presence of only one gas diffuser in each section of the flotation tank
powered with 1.65 to 2.2 kW of compressor caused high water turbulence in the tank
which made it impossible for attachment and formation of bubble-particle aggregates
and floc formation (Figure 4.13). Hence, slight modification was performed on the
existing gas diffuser design. Two additional gas diffusers (blue colour) were added
coupled with the existing gas diffuser (grey colour) with three add-on air valves
(green colour) for each section of the flotation tank was designed in the modification.
Tubing connection was performed using Tech Bond Glue and Dunlop Glue. The
latter seemed to have stronger adhesive bonding for parts submerged under water.
The end product prior to modification is illustrated in Figures 4.14 and 4.15.
Figure 4.13: Existing Gas Diffuser Design
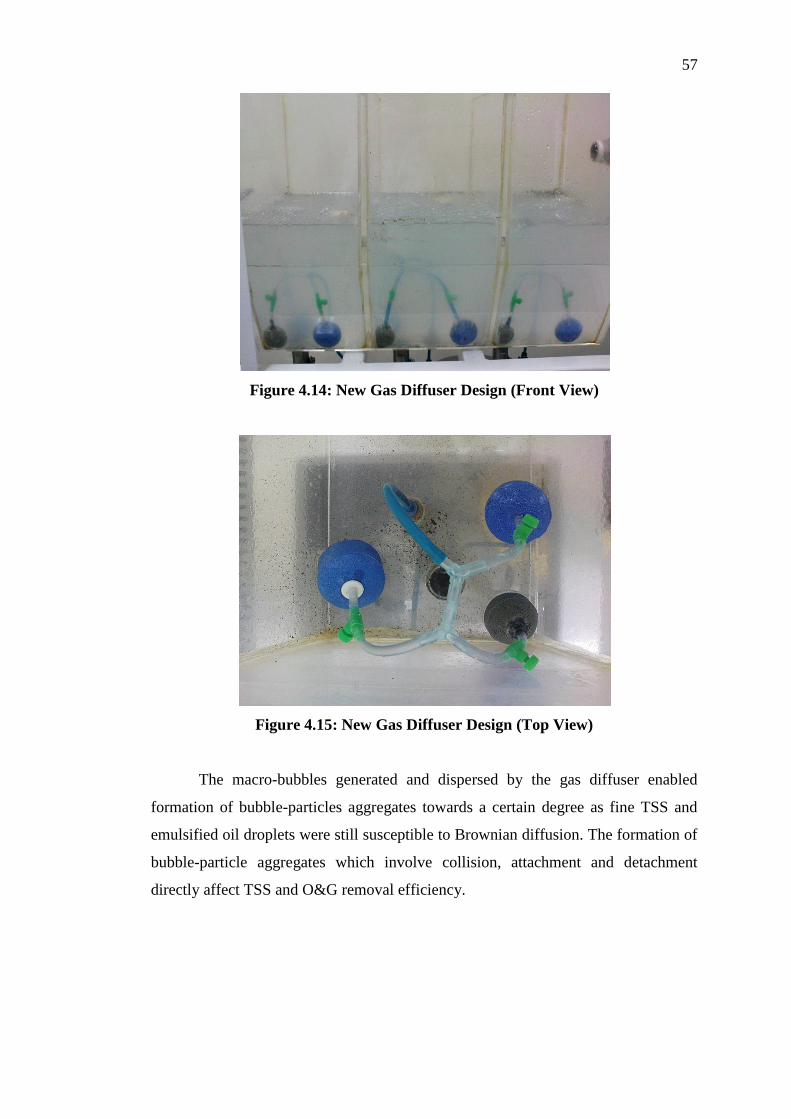
57
Figure 4.14: New Gas Diffuser Design (Front View)
Figure 4.15: New Gas Diffuser Design (Top View)
The macro-bubbles generated and dispersed by the gas diffuser enabled
formation of bubble-particles aggregates towards a certain degree as fine TSS and
emulsified oil droplets were still susceptible to Brownian diffusion. The formation of
bubble-particle aggregates which involve collision, attachment and detachment
directly affect TSS and O&G removal efficiency.
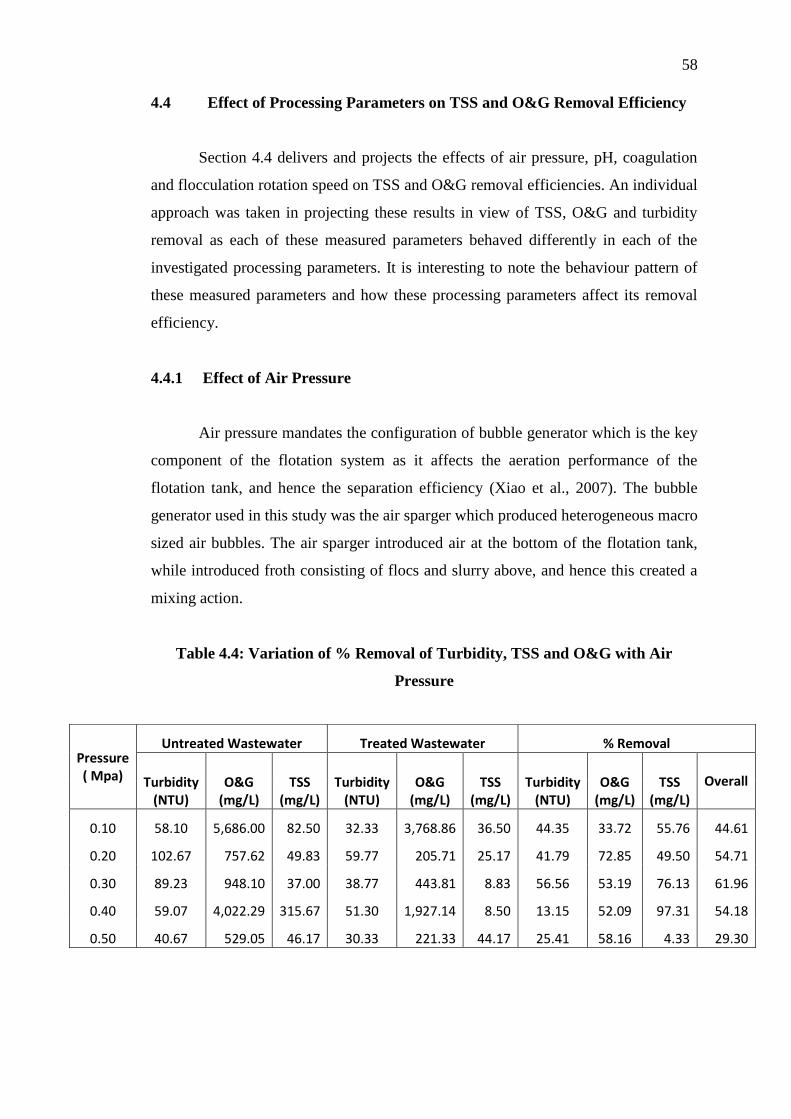
58
4.4 Effect of Processing Parameters on TSS and O&G Removal Efficiency
Section 4.4 delivers and projects the effects of air pressure, pH, coagulation
and flocculation rotation speed on TSS and O&G removal efficiencies. An individual
approach was taken in projecting these results in view of TSS, O&G and turbidity
removal as each of these measured parameters behaved differently in each of the
investigated processing parameters. It is interesting to note the behaviour pattern of
these measured parameters and how these processing parameters affect its removal
efficiency.
4.4.1 Effect of Air Pressure
Air pressure mandates the configuration of bubble generator which is the key
component of the flotation system as it affects the aeration performance of the
flotation tank, and hence the separation efficiency (Xiao et al., 2007). The bubble
generator used in this study was the air sparger which produced heterogeneous macro
sized air bubbles. The air sparger introduced air at the bottom of the flotation tank,
while introduced froth consisting of flocs and slurry above, and hence this created a
mixing action.
Table 4.4: Variation of % Removal of Turbidity, TSS and O&G with Air
Pressure
Pressure ( Mpa)
Untreated Wastewater Treated Wastewater % Removal
Turbidity (NTU)
O&G (mg/L)
TSS (mg/L)
Turbidity (NTU)
O&G (mg/L)
TSS (mg/L)
Turbidity (NTU)
O&G (mg/L)
TSS (mg/L)
Overall
0.10 58.10 5,686.00 82.50 32.33 3,768.86 36.50 44.35 33.72 55.76 44.61
0.20 102.67 757.62 49.83 59.77 205.71 25.17 41.79 72.85 49.50 54.71
0.30 89.23 948.10 37.00 38.77 443.81 8.83 56.56 53.19 76.13 61.96
0.40 59.07 4,022.29 315.67 51.30 1,927.14 8.50 13.15 52.09 97.31 54.18
0.50 40.67 529.05 46.17 30.33 221.33 44.17 25.41 58.16 4.33 29.30

59
Figure 4.16: Effect of Air Pressure on Turbidity Removal
The quantity of dissolved air increased with increased pressure in the
pressurizing vessel and air pressure manipulation varied the amount of air which
saturated the synthetic wastewater in the flotation tank. Figure 4.16 displays the
effect of air pressure on turbidity removal due to air pressure manipulation in the
flotation tank. The behaviour of turbidity removal projected a fluctuating pattern
with the highest turbidity removal occurring at 0.3 MPa effectuating approximately
57% of turbidity removal.
There was a slight decline in the percentage of turbidity removal occurring
between 0.1 to 0.2 MPa projecting a fall of about 3% in total. This reduction in
removal of turbidity could be attributed to accumulation of suspended and colloidal
particles from complexation between organics of water sample and hydrolyzing alum
species. The generation of heterogeneous air bubbles producing macro-sized bubbles
of shorter residence time might also be attributed to the decline in turbidity removal
between 0.1 to 0.2 MPa. Shorter residence time meant lesser opportunity for
collisions between bubbles and oil droplets and TSS as concluded by
Xiao et al. (2007). Operation of air pressure beyond 0.3 MPa yielded a steep decline
of turbidity removal projecting a fall corresponding to approximately 43% at 0.4
MPa. The occurring trend within this region was in agreement with the study of Xiao
et al. (2007) that the pressure had a limit that should not be exceeded, or there would
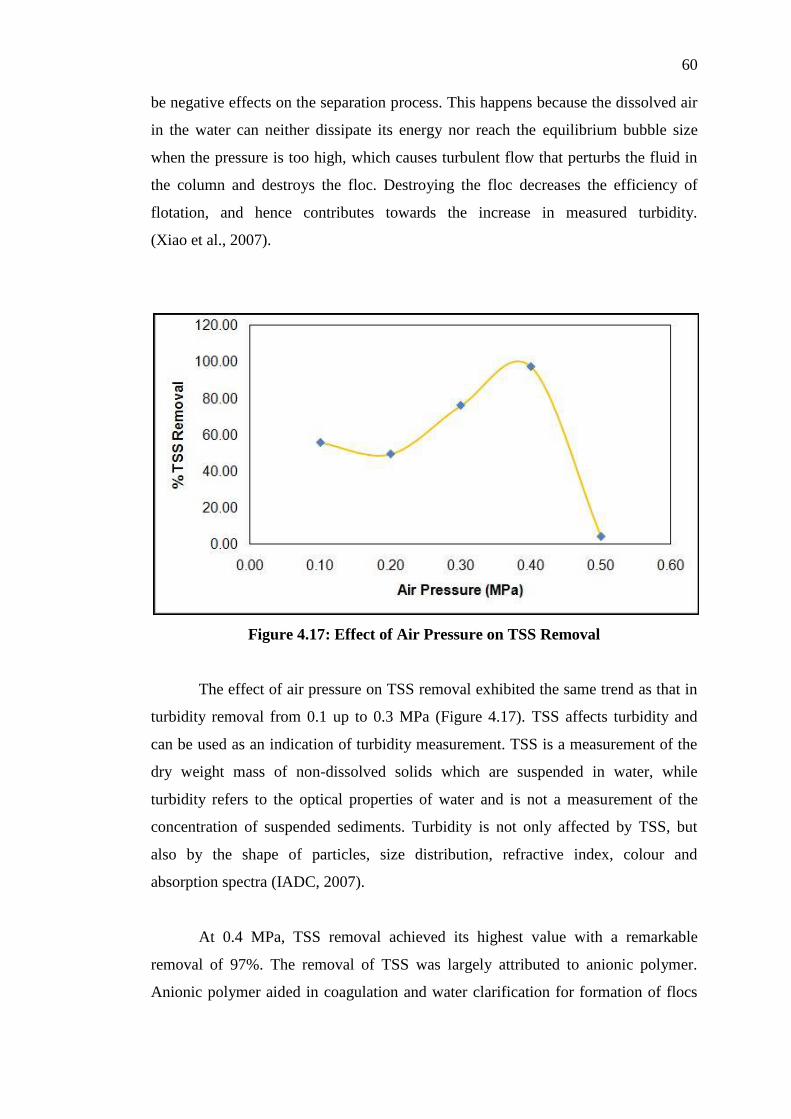
60
be negative effects on the separation process. This happens because the dissolved air
in the water can neither dissipate its energy nor reach the equilibrium bubble size
when the pressure is too high, which causes turbulent flow that perturbs the fluid in
the column and destroys the floc. Destroying the floc decreases the efficiency of
flotation, and hence contributes towards the increase in measured turbidity.
(Xiao et al., 2007).
Figure 4.17: Effect of Air Pressure on TSS Removal
The effect of air pressure on TSS removal exhibited the same trend as that in
turbidity removal from 0.1 up to 0.3 MPa (Figure 4.17). TSS affects turbidity and
can be used as an indication of turbidity measurement. TSS is a measurement of the
dry weight mass of non-dissolved solids which are suspended in water, while
turbidity refers to the optical properties of water and is not a measurement of the
concentration of suspended sediments. Turbidity is not only affected by TSS, but
also by the shape of particles, size distribution, refractive index, colour and
absorption spectra (IADC, 2007).
At 0.4 MPa, TSS removal achieved its highest value with a remarkable
removal of 97%. The removal of TSS was largely attributed to anionic polymer.
Anionic polymer aided in coagulation and water clarification for formation of flocs
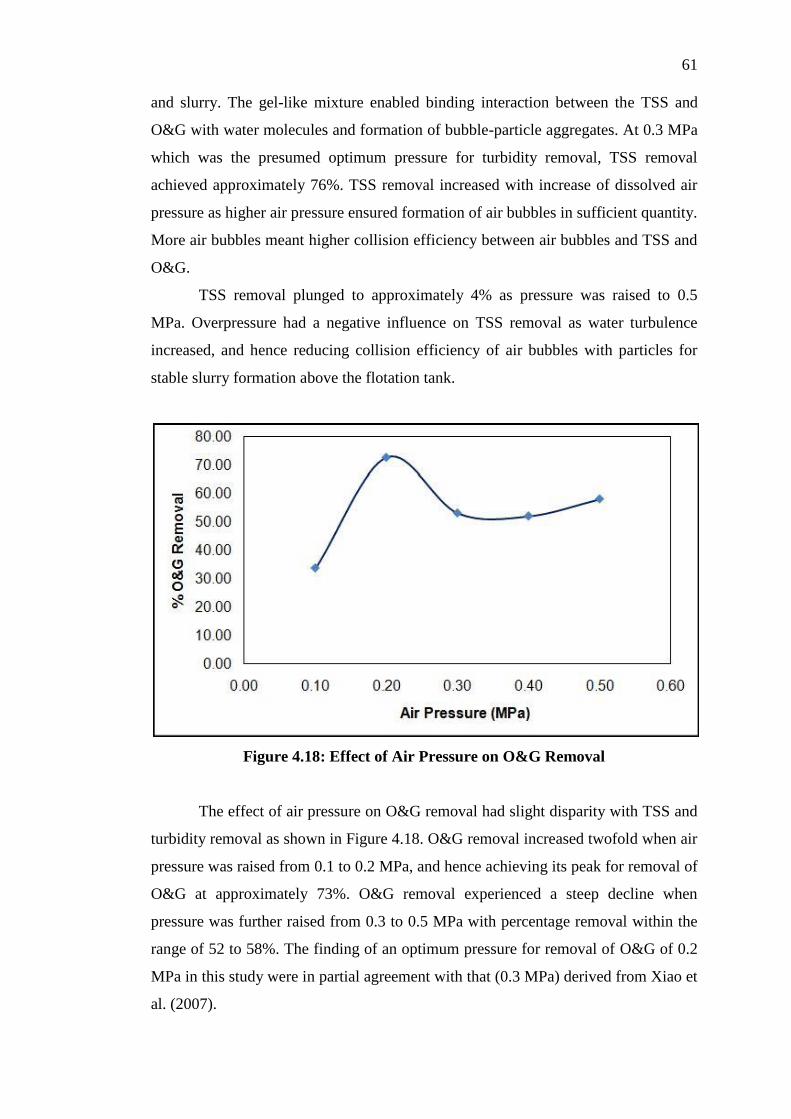
61
and slurry. The gel-like mixture enabled binding interaction between the TSS and
O&G with water molecules and formation of bubble-particle aggregates. At 0.3 MPa
which was the presumed optimum pressure for turbidity removal, TSS removal
achieved approximately 76%. TSS removal increased with increase of dissolved air
pressure as higher air pressure ensured formation of air bubbles in sufficient quantity.
More air bubbles meant higher collision efficiency between air bubbles and TSS and
O&G.
TSS removal plunged to approximately 4% as pressure was raised to 0.5
MPa. Overpressure had a negative influence on TSS removal as water turbulence
increased, and hence reducing collision efficiency of air bubbles with particles for
stable slurry formation above the flotation tank.
Figure 4.18: Effect of Air Pressure on O&G Removal
The effect of air pressure on O&G removal had slight disparity with TSS and
turbidity removal as shown in Figure 4.18. O&G removal increased twofold when air
pressure was raised from 0.1 to 0.2 MPa, and hence achieving its peak for removal of
O&G at approximately 73%. O&G removal experienced a steep decline when
pressure was further raised from 0.3 to 0.5 MPa with percentage removal within the
range of 52 to 58%. The finding of an optimum pressure for removal of O&G of 0.2
MPa in this study were in partial agreement with that (0.3 MPa) derived from Xiao et
al. (2007).

62
Beside these occurring differences, the overall physical trend was in
agreement with the previous study by Xiao et al. (2007). Disparity in two findings
might occur due to difference in aeration performance, types of coagulant and
flocculant aids and also type of synthetic wastewater. The latter used emulsified and
degassed crude oil as the oily wastewater substances, while the current study
reported used cooking oil to produce a heterogeneous mixture of oily wastewater
incorporated with horticultural black soil.
Figure 4.19: Effect of Air Pressure on Overall Removal
The effect of air pressure on overall removal revealed a parabolic curve. The
overall removal in Figure 4.19 refers to the removal of TSS, O&G and turbidity. The
combination effect of these three measured parameters yielded the optimum pressure
at 0.3 MPa. Following this approach, the subsequent experiments on studying the
effects of processing parameters on the removal of TSS, O&G and turbidity were
based on this pressure (0.3 MPa).

63
4.4.2 Effect of pH
pH adjustment is crucial for chemical pre-treatment to improve separation
efficiency via charge mechanism. Charge mechanism modifies the surface charge of
the O&G droplets and TSS in order to enhance the collision and attachment
efficiency between particles and air bubbles for formation of flocs. Chemical
pretreatment can be represented by a stable solution at a specific pH, followed by
coagulation and flocculation (Weltz et al., 2007). In this study, the effect of pH on
measured parameters revealed interesting findings which denote the significance of
pH control as a crucial step in chemical pre-treatment of wastewater.
Six different pH values were tested in order to determine the effect of pH on
measured parameters. The pH adjustment was performed by addition of hydrochloric
acid and sodium hydroxide into the synthetic wastewater. The effects of pH
adjustment on the percentage removal of the measured parameters are presented in
Table 4.5.
Table 4.5: Variation of % Removal of Turbidity, TSS and O&G with pH
pH
Untreated Wastewater Treated Wastewater % Removal
Turbidity (NTU)
O&G (mg/L)
TSS (mg/L)
Turbidity (NTU)
O&G (mg/L)
TSS (mg/L)
Turbidity (NTU)
O&G (mg/L)
TSS (mg/L)
Overall
2 115.67 1,235.24 43.83 28.77 1,189.14 5.50 75.13 3.73 87.45 55.44
3 18.28 974.19 71.50 34.30 894.67 22.83 0.00 8.16 68.07 0.00
7 5.65 1,159.62 43.83 10.02 541.71 18.83 0.00 53.29 57.03 10.98
9 7.67 3,575.14 115.00 15.00 868.19 29.83 0.00 75.72 74.06 18.07
10 49.70 903.43 44.50 40.00 105.52 22.50 19.52 88.32 49.44 52.42
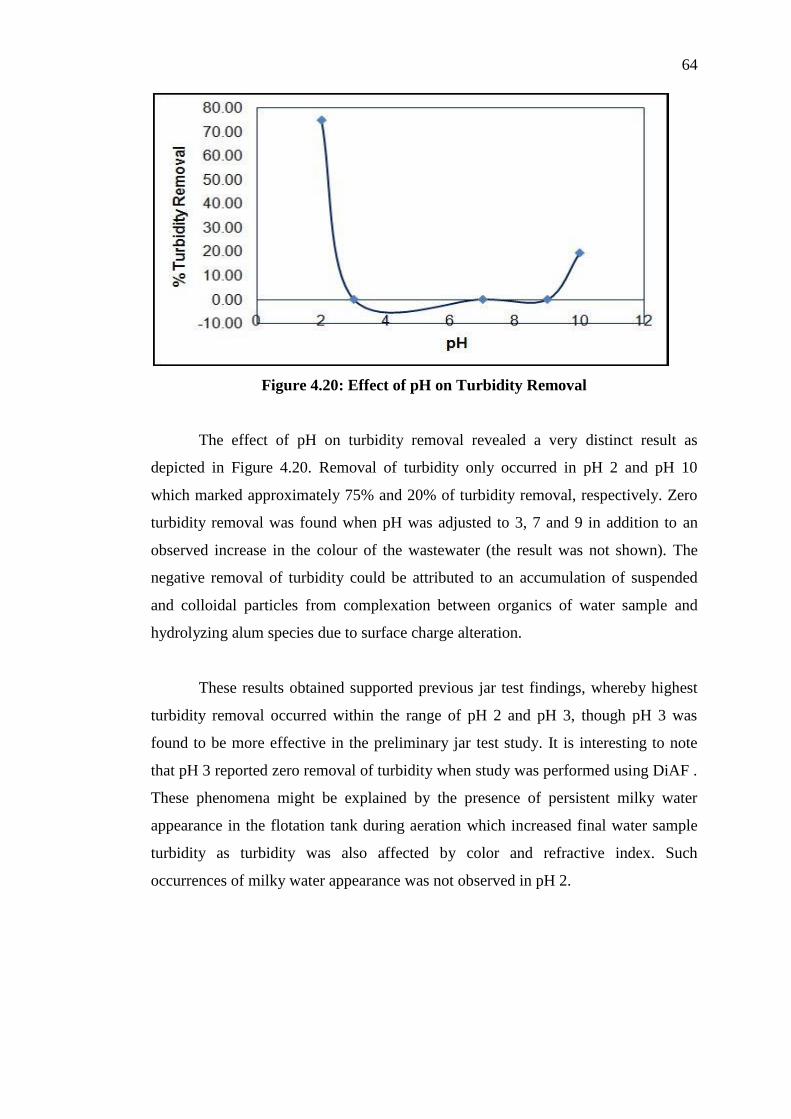
64
Figure 4.20: Effect of pH on Turbidity Removal
The effect of pH on turbidity removal revealed a very distinct result as
depicted in Figure 4.20. Removal of turbidity only occurred in pH 2 and pH 10
which marked approximately 75% and 20% of turbidity removal, respectively. Zero
turbidity removal was found when pH was adjusted to 3, 7 and 9 in addition to an
observed increase in the colour of the wastewater (the result was not shown). The
negative removal of turbidity could be attributed to an accumulation of suspended
and colloidal particles from complexation between organics of water sample and
hydrolyzing alum species due to surface charge alteration.
These results obtained supported previous jar test findings, whereby highest
turbidity removal occurred within the range of pH 2 and pH 3, though pH 3 was
found to be more effective in the preliminary jar test study. It is interesting to note
that pH 3 reported zero removal of turbidity when study was performed using DiAF .
These phenomena might be explained by the presence of persistent milky water
appearance in the flotation tank during aeration which increased final water sample
turbidity as turbidity was also affected by color and refractive index. Such
occurrences of milky water appearance was not observed in pH 2.
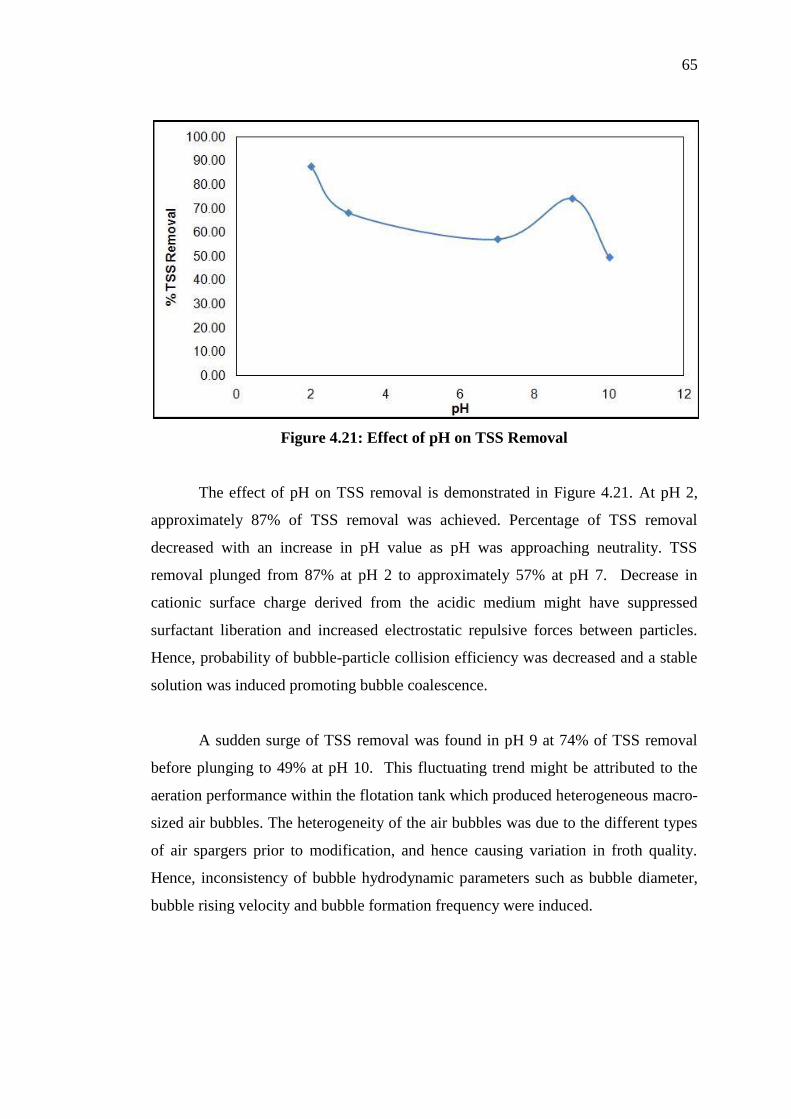
65
Figure 4.21: Effect of pH on TSS Removal
The effect of pH on TSS removal is demonstrated in Figure 4.21. At pH 2,
approximately 87% of TSS removal was achieved. Percentage of TSS removal
decreased with an increase in pH value as pH was approaching neutrality. TSS
removal plunged from 87% at pH 2 to approximately 57% at pH 7. Decrease in
cationic surface charge derived from the acidic medium might have suppressed
surfactant liberation and increased electrostatic repulsive forces between particles.
Hence, probability of bubble-particle collision efficiency was decreased and a stable
solution was induced promoting bubble coalescence.
A sudden surge of TSS removal was found in pH 9 at 74% of TSS removal
before plunging to 49% at pH 10. This fluctuating trend might be attributed to the
aeration performance within the flotation tank which produced heterogeneous macro-
sized air bubbles. The heterogeneity of the air bubbles was due to the different types
of air spargers prior to modification, and hence causing variation in froth quality.
Hence, inconsistency of bubble hydrodynamic parameters such as bubble diameter,
bubble rising velocity and bubble formation frequency were induced.
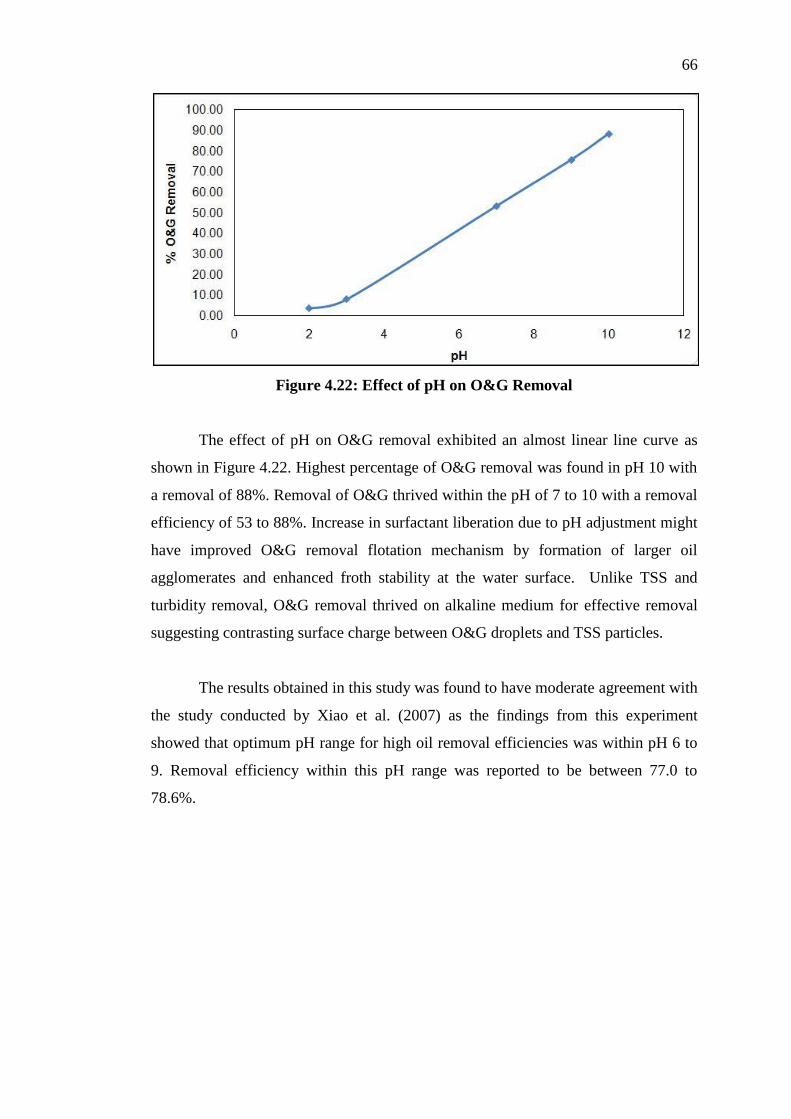
66
Figure 4.22: Effect of pH on O&G Removal
The effect of pH on O&G removal exhibited an almost linear line curve as
shown in Figure 4.22. Highest percentage of O&G removal was found in pH 10 with
a removal of 88%. Removal of O&G thrived within the pH of 7 to 10 with a removal
efficiency of 53 to 88%. Increase in surfactant liberation due to pH adjustment might
have improved O&G removal flotation mechanism by formation of larger oil
agglomerates and enhanced froth stability at the water surface. Unlike TSS and
turbidity removal, O&G removal thrived on alkaline medium for effective removal
suggesting contrasting surface charge between O&G droplets and TSS particles.
The results obtained in this study was found to have moderate agreement with
the study conducted by Xiao et al. (2007) as the findings from this experiment
showed that optimum pH range for high oil removal efficiencies was within pH 6 to
9. Removal efficiency within this pH range was reported to be between 77.0 to
78.6%.

67
Figure 4.23: Effect of pH on Overall Removal
The effects of pH on overall removal of turbidity, TSS and O&G were rather
contrasting as two different effective pH values were found in pH 2 and pH 10 with
overall removal efficiency of approximately 55 and 52%, respectively. pH 2 had a
higher overall removal efficiency due to high removal of turbidity and TSS, while
pH 10 was due to high removal of O&G. These findings might suggest two stages of
pH adjustment, or removal of either substance at a single treatment to be carried out.
An averaging approach was taken for determination of effective pH and hence pH 2
was chosen in this study.

68
4.4.3 Effect of Coagulation Rotation Speed
The effect of rotation speed manipulation during alum dosing was
investigated in order to ascertain the effects of rotation speed on dispersion of
coagulants and also the resulting coagulation performance in the treatment of
wastewater via DiAF. The batch stirrer was operated at 50 to 60 Hz and the stirrer
speed was varied in ascending order. Rotation speed affects coagulation performance
and removal of measured parameters by affecting the agitation condition in the
coagulation and flocculation tank.
Table 4.6: Variation of % Removal of Turbidity, TSS and O&G with
Coagulation Rotation Speed
Figure 4.24: Effect of Coagulation Rotation Speed on Turbidity Removal
IKA Speed
Indicator
Rotation Speed (RPM)
Untreated Wastewater Treated Wastewater % Removal
Turbidity (NTU)
O&G (mg/L)
TSS (mg/L)
Turbidity (NTU)
O&G (mg/L)
TSS (mg/L)
Turbidity (NTU)
O&G (mg/L)
TSS (mg/L)
Overall
5 250-300 76.20
498.38 28.83 18.97 393.71 4.83 75.11 21.00 83.24 59.78
6 300-350 32.97
714.76 43.50 14.15 495.71 5.33 57.07 30.65 87.74 58.48
7 350-400 19.10
817.33 43.00 7.25 559.52 25.83 62.02 31.54 39.92 44.50
8 400-450 13.23
564.95 61.33 4.95 378.57 40.17 62.59 32.99 34.51 43.37
9 450-500 10.11
761.33 77.00 5.19 478.29 41.83 48.70 37.18 45.67 43.85

69
Figure 4.24 illustrates the effect of coagulation rotation speed on turbidity
removal. The overall physical trend displayed a decreasing pattern with an increasing
of rotation speed from 250 to 500 rpm. Highest turbidity removal was found between
250 and 300 rpm, whereby removal efficiency of approximately 75% was found.
Removal efficiency plunged dramatically from 75% to approximately 49% as
rotation speed increased from 250 to 500 rpm with a minute surge in removal
efficiency within 350 to 450 rpm rotation speed.
The results obtained from this study might suggest that turbidity removal
thrived on a moderate agitation environment within the rotation speed of 250 to 300
rpm for turbidity removal. A high-shearing environment with rapid agitation caused
high turbulence and induced disruption of bubble-particle agglomeration during
coagulation. High dispersion rate of coagulants minimized effective contact-time for
destabilization of colloids during charge neutralization for reduction of electrostatic
repulsive forces.
Figure 4.25: Effect of Coagulation Rotation Speed on TSS Removal
Unlike turbidity removal, effective TSS removal thrived on a slightly higher
coagulation rotation speed within the range of 300 to 350 rpm with a removal
efficiency of approximately 88% as depicted in Figure 4.25. Beyond this rotation
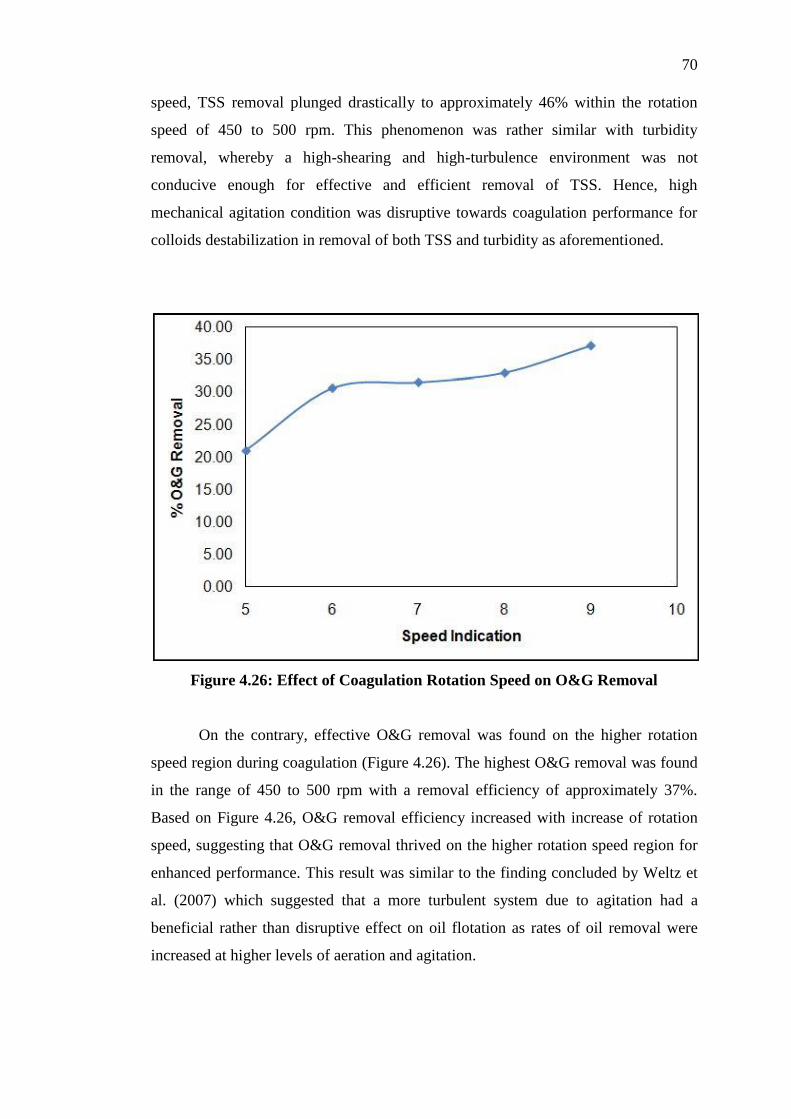
70
speed, TSS removal plunged drastically to approximately 46% within the rotation
speed of 450 to 500 rpm. This phenomenon was rather similar with turbidity
removal, whereby a high-shearing and high-turbulence environment was not
conducive enough for effective and efficient removal of TSS. Hence, high
mechanical agitation condition was disruptive towards coagulation performance for
colloids destabilization in removal of both TSS and turbidity as aforementioned.
Figure 4.26: Effect of Coagulation Rotation Speed on O&G Removal
On the contrary, effective O&G removal was found on the higher rotation
speed region during coagulation (Figure 4.26). The highest O&G removal was found
in the range of 450 to 500 rpm with a removal efficiency of approximately 37%.
Based on Figure 4.26, O&G removal efficiency increased with increase of rotation
speed, suggesting that O&G removal thrived on the higher rotation speed region for
enhanced performance. This result was similar to the finding concluded by Weltz et
al. (2007) which suggested that a more turbulent system due to agitation had a
beneficial rather than disruptive effect on oil flotation as rates of oil removal were
increased at higher levels of aeration and agitation.

71
O&G removal requiring a more turbulent system during coagulation for
effective removal in the flotation process might be attributed by stronger surface
charge compared to TSS. Hence, a more agitated system enables effective surface
charge neutralization for bubble-oil droplet agglomeration.
Figure 4.27: Effect of Coagulation Rotation Speed on Overall Removal
The effect of coagulation rotation speed on overall removal indicated that
rotation speed within the range of 250 to 300 rpm represented the effective rotation
coagulation speed accounting for approximately 60% of overall removal efficiency
of turbidity, TSS and O&G. Within the range of 350 to 500 rpm, overall removal
efficiency was rather similar with only minor differences. Hence, a moderate
agitation condition was most effective for removal of the aforementioned measured
parameters by DiAF during coagulation.
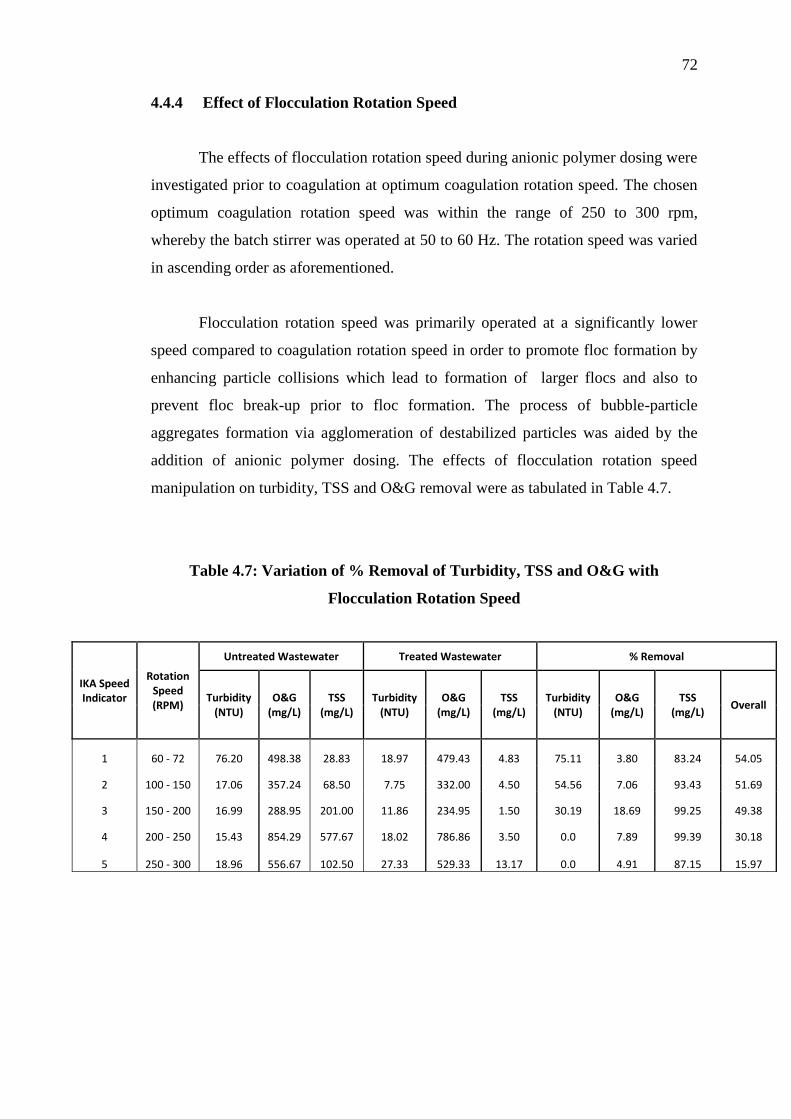
72
4.4.4 Effect of Flocculation Rotation Speed
The effects of flocculation rotation speed during anionic polymer dosing were
investigated prior to coagulation at optimum coagulation rotation speed. The chosen
optimum coagulation rotation speed was within the range of 250 to 300 rpm,
whereby the batch stirrer was operated at 50 to 60 Hz. The rotation speed was varied
in ascending order as aforementioned.
Flocculation rotation speed was primarily operated at a significantly lower
speed compared to coagulation rotation speed in order to promote floc formation by
enhancing particle collisions which lead to formation of larger flocs and also to
prevent floc break-up prior to floc formation. The process of bubble-particle
aggregates formation via agglomeration of destabilized particles was aided by the
addition of anionic polymer dosing. The effects of flocculation rotation speed
manipulation on turbidity, TSS and O&G removal were as tabulated in Table 4.7.
Table 4.7: Variation of % Removal of Turbidity, TSS and O&G with
Flocculation Rotation Speed
IKA Speed Indicator
Rotation Speed (RPM)
Untreated Wastewater Treated Wastewater % Removal
Turbidity (NTU)
O&G (mg/L)
TSS (mg/L)
Turbidity (NTU)
O&G (mg/L)
TSS (mg/L)
Turbidity (NTU)
O&G (mg/L)
TSS (mg/L)
Overall
1 60 - 72 76.20 498.38 28.83 18.97 479.43 4.83 75.11 3.80 83.24 54.05
2 100 - 150 17.06 357.24 68.50 7.75 332.00 4.50 54.56 7.06 93.43 51.69
3 150 - 200 16.99 288.95 201.00 11.86 234.95 1.50 30.19 18.69 99.25 49.38
4 200 - 250 15.43 854.29 577.67 18.02 786.86 3.50 0.0 7.89 99.39 30.18
5 250 - 300 18.96 556.67 102.50 27.33 529.33 13.17 0.0 4.91 87.15 15.97
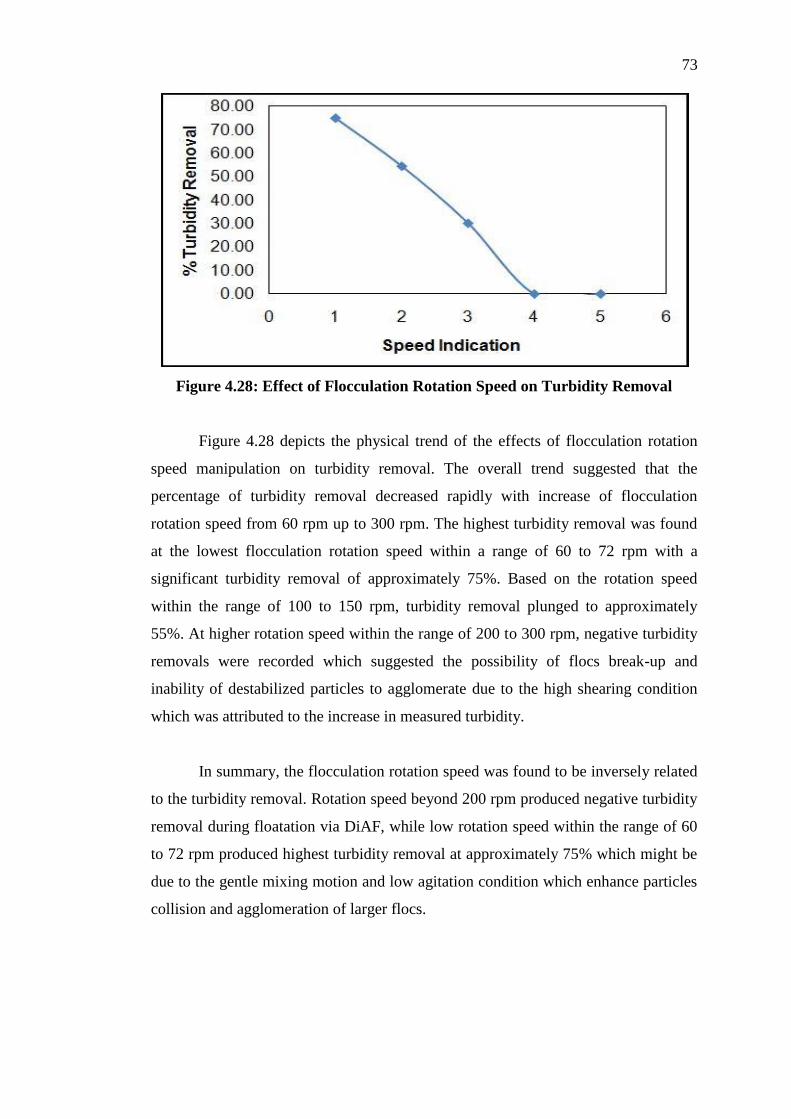
73
Figure 4.28: Effect of Flocculation Rotation Speed on Turbidity Removal
Figure 4.28 depicts the physical trend of the effects of flocculation rotation
speed manipulation on turbidity removal. The overall trend suggested that the
percentage of turbidity removal decreased rapidly with increase of flocculation
rotation speed from 60 rpm up to 300 rpm. The highest turbidity removal was found
at the lowest flocculation rotation speed within a range of 60 to 72 rpm with a
significant turbidity removal of approximately 75%. Based on the rotation speed
within the range of 100 to 150 rpm, turbidity removal plunged to approximately
55%. At higher rotation speed within the range of 200 to 300 rpm, negative turbidity
removals were recorded which suggested the possibility of flocs break-up and
inability of destabilized particles to agglomerate due to the high shearing condition
which was attributed to the increase in measured turbidity.
In summary, the flocculation rotation speed was found to be inversely related
to the turbidity removal. Rotation speed beyond 200 rpm produced negative turbidity
removal during floatation via DiAF, while low rotation speed within the range of 60
to 72 rpm produced highest turbidity removal at approximately 75% which might be
due to the gentle mixing motion and low agitation condition which enhance particles
collision and agglomeration of larger flocs.
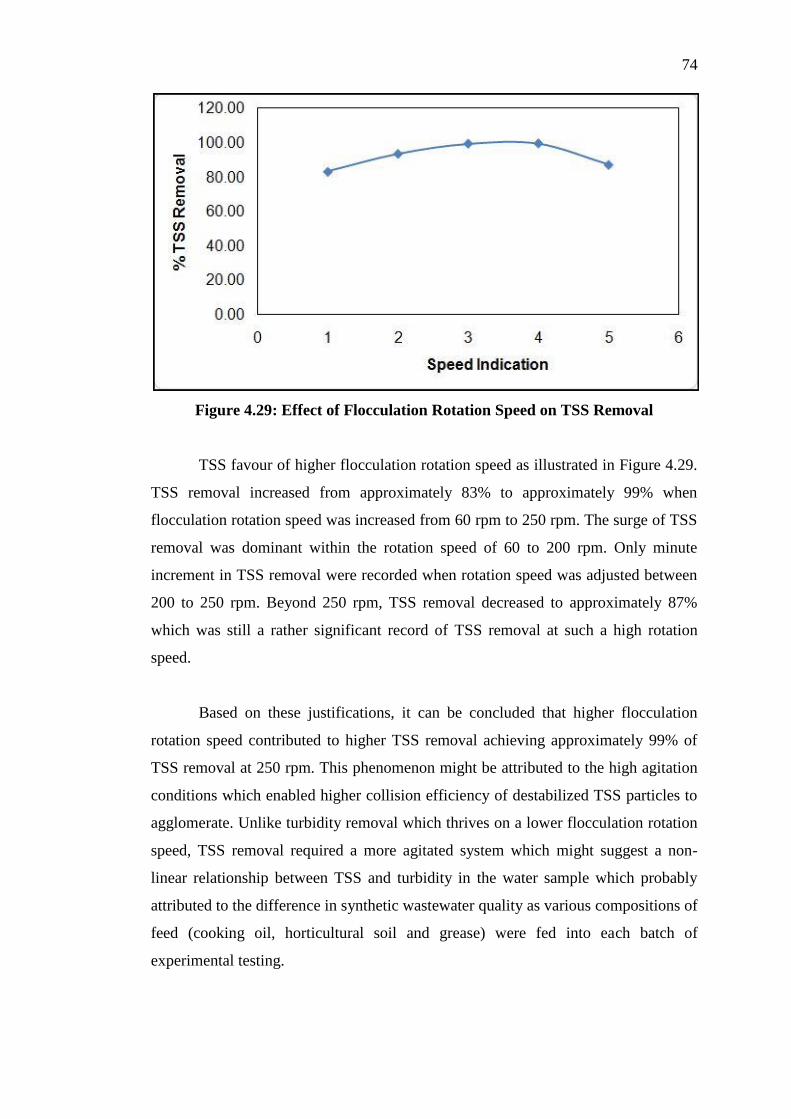
74
Figure 4.29: Effect of Flocculation Rotation Speed on TSS Removal
TSS favour of higher flocculation rotation speed as illustrated in Figure 4.29.
TSS removal increased from approximately 83% to approximately 99% when
flocculation rotation speed was increased from 60 rpm to 250 rpm. The surge of TSS
removal was dominant within the rotation speed of 60 to 200 rpm. Only minute
increment in TSS removal were recorded when rotation speed was adjusted between
200 to 250 rpm. Beyond 250 rpm, TSS removal decreased to approximately 87%
which was still a rather significant record of TSS removal at such a high rotation
speed.
Based on these justifications, it can be concluded that higher flocculation
rotation speed contributed to higher TSS removal achieving approximately 99% of
TSS removal at 250 rpm. This phenomenon might be attributed to the high agitation
conditions which enabled higher collision efficiency of destabilized TSS particles to
agglomerate. Unlike turbidity removal which thrives on a lower flocculation rotation
speed, TSS removal required a more agitated system which might suggest a non-
linear relationship between TSS and turbidity in the water sample which probably
attributed to the difference in synthetic wastewater quality as various compositions of
feed (cooking oil, horticultural soil and grease) were fed into each batch of
experimental testing.

75
Figure 4.30: Effect of Flocculation Rotation Speed on O&G Removal
The effect of flocculation rotation speed on O&G removal displayed a bell-
shaped curve as shown in Figure 4.30 with the highest O&G removal found within
150 to 200 rpm achieving approximately 19 % of O&G removal. Lowest O&G
removal occurred within 60 to 72 rpm, resulting in only approximately 4 % of O&G
removal. Such low removal of O&G was primarily due to pH interference as the
experimental condition was adjusted to pH 2 as the optimum pH based on previous
pH study. The inability of O&G surface charge destabilization due to the high
liberation of cation under acidic condition might have contributed to such
phenomenon.
But under a constant pH chemical environment, the effect of flocculation
rotation speed on O&G removal suggested that O&G removal required a moderately
agitated environment similar to its optimum coagulation rotation speed for enhanced
performance as a moderate agitated system might enable higher removal rate of
O&G in order to initiate agglomeration in the more dispersed O&G droplets.
However, beyond the optimum condition between 150 to 200 rpm, O&G removal
plunged to approximately 5% within the rotation speed of 250 to 300 rpm which
might be due to flocs break-up under high shear condition.

76
Figure 4.31: Effect of Flocculation Rotation Speed on Overall Removal
Based on individual analysis of each measured parameter, it was found that
the optimum flocculation rotation speed to optimize overall removal performance
was found within the rotation speed of 150 to 200 rpm producing approximately 49%
of overall removal. Beyond this rotation speed range, overall removal declined to
approximately 16%. Hence, a low to moderate agitation condition was most optimum
to enhance overall removal of turbidity, TSS and O&G in the synthetic wastewater
via DiAF.
Table 4.8: Summary Table of Optimum Process Parameter for Effective
Removal of TSS, O&G and Turbidity
Process Parameter Optimum Condition for Removal
Turbidity TSS O&G
Air Pressure (MPa) 0.3 0.4 0.2
pH 2 2 10
Coagulation Rotation Speed (RPM) 250-300 300-350 450-500
Flocculation Rotation Speed (RPM) 60-72 60-200 150-200

77
CHAPTER 5
CONCLUSIONS AND RECOMMENDATIONS
5.1 Conclusions
The application and efficiency of a dispersed air flotation (DIAF) unit as a
primary water treatment process in treating synthetic wastewater containing
suspended solids and oily emulsions were successfully demonstrated in this study.
The flotation tank consisting of the bubble generator (air sparger) and the
incorporation of the chemically enhanced primary treatment (CEPT) process is the
key component of the DIAF unit for successful removal of TSS and O&G via
occurrence of bubble-particle aggregate and agglomeration of flocs. The addition of
alum (coagulant) and anionic polymer (flocculant) is necessary to improve flotation
via destabilization of colloids and agglomeration of destabilized particles. .
Based on the effects of the four (4) processing parameters on the removal
efficiencies of TSS, O&G and turbidity by using synthetic wastewater, several
observations were obtained:
The air pressure mandates the configuration of the air sparger which is the
key component of the floatation system. A homogenized mean bubble size
system generation from the air bubble generator is critical in the separation
efficiency of the DiAF unit.
CEPT process was an essential treatment step in a DiAF unit for enhanced
removal of TSS, O&G and turbidity.

78
Overpressure had a negative influence on removal of turbidity, TSS and
O&G due to occurrence of turbulent flow which perturbs the fluid in the
column and destroys floc formation
Removal of turbidity and TSS thrive on the acidic region while O&G
removal requires an alkaline medium for effective removal.
O&G removal required a more agitated system compare to TSS and turbidity
removal which suggest that a more turbulent system had a beneficial rather
than disruptive effect on oil flotation
5.2 Recommendations
Future Potential Research:
1. Utilization of other types of coagulant and flocculant aids and using
industrial or domestic wastewater for comparison purposes in terms of
removal efficiency of TSS, O&G and turbidity.
2. Investigation of other processing parameters as variable affecting removal
efficiency of measured parameters such as detention time in the flotation
tank.
3. Utilization of a homogeneous fine air sparger system to investigate the
potential of using a DiAF in removal of TSS, O&G and turbidity.

79
REFERENCES
Al-Shamrani, A.A., James, A., Xiao,H. (2002). Colloids Surface, Separation of oil
from water by dissolved air flotation, 209(1), 15-26.
Anfruns,J.F., and Kitchener, J.A.,(1977). Transactions of the Institution of Mining
and Metallurgy, Section C: Mineral Processing and Extractive Metallurgy,
Rate of capture of small particles in flotation, 86, 9-15.
Aragones-Beltran, P., Mendoza- Roca, J.A., Bes-Pia, A., Garcia-Melon,M.,
Parra-Ruiz, E. (2008). Journal of Hazardous Materials, Application of
multicriteria decision analysis to jar-test results for chemicals selection in the
physical–chemical treatment of textile wastewater.164 (2009), 288-295
Bilotta, G.S., & Brazier, R.E. (2008). Water research, Understanding the influence of
suspended solids on water quality and aquatic biota, 42 (2008), 2849 - 2861
Capps, R.W., Metelli, G.N., Bradford, M.L. (1993). Reduce oil and grease content in
wastewater. Hydrocarbon Processing (June), 102-110.
Ching, H.W., Tanaka, T.S., Elimelech, M. (1994). Water Res, Dynamics of
coagulation of kaolin particles with ferric chloride. 28 (1994), 559-569
Clesceri, L.S., Greenberg, A.E., Eaton, A.D. (Eds.) (1998). Standard methods for the
examination of water and wastewater (20th ed.) American Public Health
Association, American Water Works Association, Water Environment
Federation
Coleman(2010). Electronic references. Retrived August 4, 2010 from
http://www.infomine.com/publications/docs/InternationalMining/Coleman20
10.pdf

80
Deglon, D.A., (2004). Minerals Engineering, The effect of agitation on the flotation
of platinum ores, 18(8), 839-844
Derjaguin, B.V., and Dukhin, S.S., (1961). Bulletin – Institution of Mining and
Metallurgy, Theory of flotation of small and medium-size particles, 651, 21–
246.
De Oliveira, G.R.C., (1995). Estudo de varia´veis operacionais e interfaciais na
flotac¸a˜o de o´leo por ga´s dissolvido., M.Sc. Thesis (in portuguese),
Universidade Federal de Rio de Janeiro, pp. 120.
Edzwald,J.K.,(2010).Water Research, Dissolved air flotation and me, 44(7), 2077-
2106
Ferguson,L.D., (1972).Tappi, De-inking chemistry, 75-83
Fuerstenau, D.W.(1976). Froth Flotation. SME/AIME: New York, USA
Fuerstenau, D.W., (1981). Mineral and coal flotation circuits (Vol.3), The
Netherlands: Elsevier
Fuerstenau, D.W.,(1982) .Semi-soluble salt flotation. The principles of flotation.
Johannesburg, South Africa: South African Institute of Mining and
Metallurgy.
Gu, Chiang, (1999). A novel flotation column for oily water cleanup, Separation and
Purification Technology, 16, 193-203
Gray, S.R., Harbour, P.J., Dixon, D.R. (1997). Colloids Surface,Effect of
polyelectrolyte charge density and molecular weight on the flotation of oil in
water emulsions, 126 (2-3), 85-95.

81
Harleman, D.R.F., and Murcott, S.E.,(1992). Technical report, World Bank,
Upgrading and multi-stage development of municipal wastewater treatment
plants: Applicability of chemically enhanced primary treatment.
Hewitt, D., Fornasiero, D., and Ralston, J., (1995). Journal of the Chemical Society,
Faraday Transactions, Bubble–particle attachment, 91(13),1997-2001
Hydro-flo Technologies. (2002). Electronic references. Retrieved August 4, 2010
from
http://www.hydroflotech.com/PRODUCT,%20Flotation/Engineering%20Dat
a/Dissolved %20Air%20Flotation%20Theory%20of%20Operation.htm.
Dissolved Air Flotation Theory, 5/8/10.
Kragten, J., Atlas of Metal–Ligand Equilibria in Aqueous Solution, Ellis Horwood,
Chichester, 1978.
Larsson,A., Stenius, P., Odberg,L.,(1984). Surface Chemistry in Flotation De-inking
Part 1. The Flotability of Model Ink Particles, Svensk Paperstidning ,18, 158–
164.
Leja,J., Surface chemistry of froth flotation,(1982) New York, USA : Plenum Press
Lien, C.Y., and Liu J.C.,(2006). Journal of Environmental Engineering, Treatment of
Polishing Wastewater from Semiconductor Manufacturer by Dispersed Air
Flotation, 132(1), 51-57.
Matis, K.A., Peleka, E.N., Zamboulis, D., Erwe, T., Mavrov, V.(2004). Separation
and Purification Technology, Air sparging during the solid/ liquid
separation by microfiltration: application of flotation, 40(1), 1-7.
Marinova, K.G., Alargova, R.G., Denkov, N.D., Velev, O.D, Petsev, D.N, Ivanov,
I.B.(1995).Langmuir, charging of oil-water interfaces due to spontaneous
adsorption of hydroxyl ions. 12, 2045-2051.

82
Masuda, H., Higashitani, K., Hideto Y., (2006).Powder Technology Handbook.United
States of America: CRC Press.
Metcalf and Eddy, (2003), Wastewater Engineering Treatment and Reuse (4th
Ed.):
Mc-Grawhill.
Miettinen, T., Ralston, J .,
and Fornasiero, D., (2009). Minerals Engineering, The
limits of fine particle separation, 23(5), 420-437
Moosai, R. and Dawe, R.A. (2003). Separation Purification Technology, Gas
attachment of oil droplets for gas flotation for oily wastewater cleanup. 33
(3), 303-314.
Nesset, J.E., Hernandez-Aguilar, J.R., Acuna, C., Gomez, C.O., James, A.(2006).
Minerals Engineering, Some gas dispersion characteristics of
mechanical flotation machines, 19(6- 8), 807-815.
Nguyen,A.V., George, P., Jameson, G.J.,(2006) Chemical Engineering Science,
Demonstration of a minimum in the recovery of nanoparticles by
flotation: theory and experiment, 61(8), 2494–2509
Ozkan, S.G., Acar, A.(2004).Water Research. Investigation of impact of water type
on borate ore flotation, 38(7), 1773-1778.
Painmanakul, P., Sastaravet, P., Lersjintanakarn, S., Khaodhiar, S. (2009). Chemical
engineering research and design, Effect of bubble hydrodynamic and
chemical dosage on treatment of oily wastewater by induced air flotation
(IAF) process, CHERD-396, 10
Peleka, E.N., Fanidou, M.M., Mavros, P.P.,Matis, K.A.,(2006).Desalination, A
hybrid flotation microfiltration cell for solid/liquid separation: operational c
haracteristics, 194, 135-145
83
Puget, F.P., Melo, M.V.,Massarani, G.(2003). Brazillian Journal of Chemical
Engineering, Modelling of the dispersed air flotation process applied to dairy
wastewater treatment, 21(2), 229-237.
Pyke, B.L., Fornasiero,D. and Ralston, J.,(2003). Journal of Colloid and Interface
Science, Bubble particle heterocoagulation under turbulent conditions,
265(1), 141–151
Reay, D., and Ratcliff, G.A.,(1973). Canadian Journal of Chemical Engineering,
Removal of fine particles from water by dispersed air flotation. Effects of
bubble size and particle size on collection efficiency, 51,178–185.
Rodrigues, R.T., Rubio, J., (2003). New basis for measuring the size distribution of
bubbles, Minerals Engineering 16 (8), 757–765.
Rubio, J., Souza, M.L. and Smith, R.W., 2002, Overview of flotation as a wastewater
treatment technique. Mineral Engineering,15: 139–155
Ryan, P.A., (1991).Environmental effects of sediment on New Zealand streams: a
review. New Zealand J. Mar. Freshwater Res, 25, 207-221
Shahbazi , B.,Rezai B., and J Koleini., (2010).Chemical Engineering and Processing:
Process Intensification, Bubble–particle collision and attachment probability
on fine particle flotation, 49(6), 622-627
Somasundaran, P., Hubbard, A.T., (2006). Encyclopedia of Surface and Colloid
Science. New York: Taylor & Francis.
Stephenson, R.J., Duff, S.J.B., (1995). Water Research,Coagulation and precipitation
of a mechanical pulping effluent – I. Removal of carbon, colour and
turbidity, 30(4), 781-792.
Sutherland, K.L., (1948). Journal of Physical and Colloid Chemistry, Physical
chemistry of flotation XI. Kinetics of the flotation process, 52, 394–425.

84
Sworska, A., Laskowski, J.S., Cymerman, G. (2000). International Journal of
Mineral Processing, Flocculation of the Syncrude fine tailings Part 1. Effect
of pH, polymer dosage and Mg2+ and Ca2+ cations, 60 (2) 143-152.
Theander, K., Pugh, R.J., (2004). Colloids and Surfaces A: Physicochemical and
Engineering Aspects, Surface chemicals concepts of flotation de-inking,
240(3), 111-130.
Theodore, J.H., Frederick, B. (2003). Chemical engineering science, Modelling
flotation separation in a semi-batch process, 58 (2003), 353-365
Vesilind P.A, (2003).Wastewater Treatment Plant Design. Water Environment
Federation & IWA Publishing.
Watcharasinga, S., Kongkowita, W., Chavadeja, S. Motor oil removal from water by
continuous froth flotation using extended surfactant: Effects of air bubble
parameters and surfactant concentration
Waters, T.F., (1995).Sediment in streams: sources, biological effects and controls
I**n American Fisheries Society Monograph 7, Bethesda, MA.
Weltz,MLS.,Baloyi,N.,Deglon, DA.,(2007). Water SA, Oil removal from industrial
wastewater using flotation in a mechanically agitated flotation cell, 33(4),
453-458
Xiao-bing Jiong-tian, Yong-tian, Cun-ying, Xiao-hua (2007). Journal of China
University of Mining & Technology, Separation oil from wastewater by
column flotation, 17(4),0546-0551.
Zhou,Y., Liang, Z., Wang, Y. (2007). Decolarization and COD removal of secondary
yeast wastewater effluents by coagulation using aluminum sulfate.
Desalination, 225 (2007), 301-311

85