removal of volatile organic contaminants (vocs) from · pdf fileremoval of volatile organic...
TRANSCRIPT

Removal of Volatile Organic Contaminants (VOCs) From the Groundwater Sources of Drinking Water via Granular Activated Carbon Treatment
Subject Area: Water Quality
Web Report #4440

Removal of Volatile Organic Contaminants (VOCs) From the Groundwater Sources of Drinking Water via Granular Activated Carbon Treatment
©2015 Water Research Foundation. ALL RIGHTS RESERVED.
About the Water Research Foundation
The Water Research Foundation (WRF) is a member-supported, international, 501(c)3 nonprofit organization that sponsors research that enables water utilities, public health agencies, and other professionals to provide safe and affordable drinking water to consumers. WRF’s mission is to advance the science of water to improve the quality of life. To achieve this mission, WRF sponsors studies on all aspects of drinking water, including resources, treatment, and distribution. Nearly 1,000 water utilities, consulting firms, and manufacturers in North America and abroad contribute subscription payments to support WRF’s work. Additional funding comes from collaborative partnerships with other national and international organizations and the U.S. federal government, allowing for resources to be leveraged, expertise to be shared, and broad-based knowledge to be developed and disseminated. From its headquarters in Denver, Colorado, WRF’s staff directs and supports the efforts of more than 800 volunteers who serve on the board of trustees and various committees. These volunteers represent many facets of the water industry, and contribute their expertise to select and monitor research studies that benefit the entire drinking water community. Research results are disseminated through a number of channels, including reports, the Website, Webcasts, workshops, and periodicals. WRF serves as a cooperative program providing subscribers the opportunity to pool their resources and build upon each other’s expertise. By applying WRF research findings, subscribers can save substantial costs and stay on the leading edge of drinking water science and technology. Since its inception, WRF has supplied the water community with more than $460 million in applied research value. More information about WRF and how to become a subscriber is available at www.WaterRF.org.
©2015 Water Research Foundation. ALL RIGHTS RESERVED.

Removal of Volatile Organic Contaminants (VOCs) From the Groundwater Sources of Drinking Water via Granular Activated Carbon Treatment Prepared by: R. Scott Summers, David Kempisty, and Tyler Dougherty University of Colorado and Detlef Knappe North Carolina State University Jointly sponsored by: Water Research Foundation 6666 West Quincy Avenue, Denver, CO 80235 Water Environment Research Foundation 635 Slaters Lane, Ste. G-110, Alexandria, VA 22314 and U.S. Environmental Protection Agency Washington, D.C. Published by:
©2015 Water Research Foundation. ALL RIGHTS RESERVED.

DISCLAIMER
This study was jointly funded by the Water Research Foundation (WRF), the Water Environment Research Foundation (WERF), and the U.S. Environmental Protection Agency (EPA) under Cooperative Agreement No. CR-83419201. WRF, WERF, and EPA assume no
responsibility for the content of the research study reported in this publication or for the opinions or statements of fact expressed in the report. The mention of trade names for
commercial products does not represent or imply the approval or endorsement of WRF, WERF, or EPA. This report is presented solely for informational purposes.
Copyright © 2015 by Water Research Foundation
ALL RIGHTS RESERVED. No part of this publication may be copied, reproduced
or otherwise utilized without permission.
Printed in the U.S.A.
©2015 Water Research Foundation. ALL RIGHTS RESERVED.
v
CONTENTS
TABLES ........................................................................................................................................ vii
FIGURES ........................................................................................................................................ ix
FOREWORD .................................................................................................................................. xi
ACKNOWLEDGMENTS ........................................................................................................... xiii
EXECUTIVE SUMMARY ........................................................................................................... xv
CHAPTER 1: INTRODUCTION ....................................................................................................1 Background ......................................................................................................................... 1 Relevance ............................................................................................................................ 1 Goals and Objectives .......................................................................................................... 1 Previous Work .................................................................................................................... 2
Impact of DOM and cVOC Influent Concentration on Breakthrough and CUR ... 2 DOM Effects on cVOC Adsorption ........................................................................ 4 Co-Solute Competition ........................................................................................... 6
Approach ........................................................................................................................... 8 Task I. Carbon Use Rate Evaluation at Different EBCTs for 12 cVOCs ............... 8 Task IIa. Impact of Influent cVOC Concentration on Adsorption and CUR ......... 8 Task IIb. Impact of Background DOM from Different Groundwater Sources and
Influent DOM Concentrations on Adsorption and CUR ............................ 8 Task IIc. Impact of Co-Solutes in DOM on Adsorption and CUR ......................... 9
CHAPTER 2: MATERIALS AND METHODS ...........................................................................11 Materials ........................................................................................................................... 11
Waters ................................................................................................................... 11 Adsorbent .............................................................................................................. 12 Adsorbates............................................................................................................. 12
Methods............................................................................................................................. 13 Total Organic Carbon/Ultraviolet Absorbance/pH/Conductivity/Alkalinity ........ 13 Gas Chromatography/Mass Spectrometry ............................................................ 14 Gas Chromatography/Flame Ionization Dectector ............................................... 14 RSSCT Experimental Setup .................................................................................. 14 RSSCT Design ...................................................................................................... 16 Fixed-Bed Adsorption Modeling .......................................................................... 19
CHAPTER 3: RESULTS AND DISCUSSION .............................................................................21 PSDM Results ................................................................................................................... 21
Tri-Solute RSSCT Results ................................................................................................ 21 Impact of Influent 1,2 DCA Concentration ...................................................................... 29 Impact of DOM Type and Concentration ......................................................................... 31 Impact of Co-Solute on 1,2 DCA Breakthrough .............................................................. 34
Scale-Up Review .............................................................................................................. 36
©2015 Water Research Foundation. ALL RIGHTS RESERVED.

vi
CHAPTER 4: CONCLUSIONS ....................................................................................................39 Task I ............................................................................................................................... 39 Task IIa ............................................................................................................................. 39 Task IIb ............................................................................................................................. 40 Task IIc ............................................................................................................................. 40 Task III .............................................................................................................................. 40
REFERENCES ............................................................................................................................. 41
ABBREVIATIONS .......................................................................................................................45
APPENDIX A ................................................................................................................................47
©2015 Water Research Foundation. ALL RIGHTS RESERVED.
vii
TABLES
1.1 RSSCT conditions ............................................................................................................... 9 2.1 Influent water quality ........................................................................................................ 11 2.2 GAC characteristics .......................................................................................................... 12 2.3 Adsorbate properties, grouped by mix .............................................................................. 13 2.4 Dimensionless numbers used in the scaling of the RSSCT .............................................. 17 3.1 Throughput and carbon use rates to 10% breakthrough (one year of operation at the full
scale is about 35,000 bed volumes at an EBCT of 15 min and 70,000 bed volumes at an EBCT of 7.5 min) ......................................................................................... 27
3.2 Throughput and carbon use rates to 50% breakthrough (one year of operation at the full
scale is about 35,000 bed volumes at an EBCT of 15 min and 70,000 bed volumes at an EBCT of 7.5 min) ......................................................................................... 28
©2015 Water Research Foundation. ALL RIGHTS RESERVED.

©2015 Water Research Foundation. ALL RIGHTS RESERVED.

ix
FIGURES
1.1 1,2 DCA breakthrough and the effects of DOM on adsorption at 7.5 min EBCT .............. 5 1.2 PSDM predicted normalized breakthrough of 1,2 DCA and 1,2 DCP with and without co-
solutes in organic free water at 7.5min EBCT ........................................................ 7 2.1 Generic RSSCT set up ...................................................................................................... 15 3.1 PSDM predicted normalized breakthrough of 1,1 DCA, 1,2 DCP, and 1,2,3 TCP with and
without co-solutes in organic free water at 7.5 min EBCT ................................... 22 3.2 PSDM predicted normalized breakthrough of 1,1,2,2 TCA, 1,1,1,2 TCA, and PCE
without co-solutes in organic free water at 7.5 min EBCT ................................... 22 3.3 PSDM predicted normalized breakthrough of 1,2 DCA, CT, and TCE with and without
co-solutes in organic free water at 7.5 min EBCT ................................................ 23 3.4 Normalized DOC breakthrough at 7.5 and 15 min EBCT (RSSCT 1, 9, and 10) ............ 23 3.5 Normalized breakthrough of DOC, 1,1 DCA, 1,2 DCP, and 1,2,3 TCP in CO II at 7.5 min
and 15 min EBCTs (RSSCT 1) ............................................................................. 25 3.6 Normalized breakthrough of DOC, 1,1,2,2 TCA, 1,1,1,2 TCA, and PCE in CO II at 7.5
min and 15 min EBCTs (RSSCT 3) ...................................................................... 25 3.7 Normalized breakthrough of 1,2 DCA, CT, and TCE in CO II at 7.5 min and 15 min
EBCTs (RSSCT 4) ................................................................................................ 26 3.8 Relationship between PSDM predicted 10% breakthrough and RSSCT measured
breakthrough in CO II ........................................................................................... 29 3.9 Normalized breakthrough of 1,2 DCA at four different influent concentrations in CO I at
7.5 min EBCT (RSSCT 5,6,7 and 8) .................................................................... 30 3.10 Normalized breakthrough of 1,2 DCA at four different influent concentrations in CO I at
15 min EBCT (RSSCT 5,6,7 and 8) ..................................................................... 31 3.11 Normalized breakthrough of DOC, 1,1 DCA, 1,2 DCP, and 1,2,3 TCP in CO II and FL
DIL at 7.5 min EBCT (RSSCTs 1 and 10) ........................................................... 32 3.12 Normalized breakthrough of DOC, 1,1 DCA, 1,2 DCP, and 1,2,3 TCP in CO II and FL
DIL at 15 min EBCT (RSSCTs 1 and 10) .............................................................33
©2015 Water Research Foundation. ALL RIGHTS RESERVED.

x
3.13 Normalized breakthrough of DOC, 1,1 DCA, 1,2 DCP, and 1,2,3 TCP in FL GW and FL DIL at 7.5 min EBCT (RSSCTs 9 and 10) ............................................................34
3.14 Normalized breakthrough of DOC, 1,1 DCA, 1,2 DCP, and 1,2,3 TCP in FL GW and FL
DIL at 15 min EBCT (RSSCTs 9 and 10) .............................................................35 3.15 Normalized breakthrough of 1,2 DCA as a single solute and in a tri-solute mix at 7.5 and
15 min EBCT (RSSCT 4 and 6) ............................................................................35 3.16 Application of predicted and simulated Y values from the Kennedy and Kempisty
regressions to scale-up RSSCT results for 1,2 DCA breakthrough. Dotted lines represent 95% CI around the Kennedy regression; dashed lines represent 95% CI around the Kempisty regression; CO GW II (TOC: 1.5 mg/L), EBCT: 15 min ....38
©2015 Water Research Foundation. ALL RIGHTS RESERVED.
xi
FOREWORD
The Water Research Foundation (WRF) is a nonprofit corporation dedicated to the development and implementation of scientifically sound research designed to help drinking water utilities respond to regulatory requirements and address high-priority concerns. WRF’s research agenda is developed through a process of consultation with WRF subscribers and other drinking water professionals. WRF’s Board of Trustees and other professional volunteers help prioritize and select research projects for funding based upon current and future industry needs, applicability, and past work. WRF sponsors research projects through the Focus Area, Emerging Opportunities, and Tailored Collaboration programs, as well as various joint research efforts with organizations such as the U.S. Environmental Protection Agency and the U.S. Bureau of Reclamation.
This publication is a result of a research project fully funded or funded in part by WRF subscribers. WRF’s subscription program provides a cost-effective and collaborative method for funding research in the public interest. The research investment that underpins this report will intrinsically increase in value as the findings are applied in communities throughout the world. WRF research projects are managed closely from their inception to the final report by the staff and a large cadre of volunteers who willingly contribute their time and expertise. WRF provides planning, management, and technical oversight and awards contracts to other institutions such as water utilities, universities, and engineering firms to conduct the research.
A broad spectrum of water supply issues is addressed by WRF's research agenda, including resources, treatment and operations, distribution and storage, water quality and analysis, toxicology, economics, and management. The ultimate purpose of the coordinated effort is to assist water suppliers to provide a reliable supply of safe and affordable drinking water to consumers. The true benefits of WRF’s research are realized when the results are implemented at the utility level. WRF's staff and Board of Trustees are pleased to offer this publication as a contribution toward that end.
Denise L. Kruger Robert C. Renner, P.E. Chair, Board of Trustees Executive Director Water Research Foundation Water Research Foundation
©2015 Water Research Foundation. ALL RIGHTS RESERVED.

©2015 Water Research Foundation. ALL RIGHTS RESERVED.
xiii
ACKNOWLEDGEMENTS
The project team would like to acknowledge and thank the following for their contributions to the successful completion of this project:
The U.S. Environmental Protection Agency, Water Supply & Water Resources Division
National Risk Management Research Laboratory for providing cVOCs analyses. Grace Jang, Water Research Foundation for providing guidance and leadership. Project Advisory Committee members Jonathan Pressman, U.S. Environmental Protection
Agency, Water Supply & Water Resources Division, National Risk Management Research Laboratory; Joe Drago, Kennedy/Jenks Consultants; and Jacqueline Rhoades, Hazen and Sawyer for providing comments and direction.
Christine Owen, Tampa Bay Water, for providing access to the Florida groundwater. Jonathan Akins, for providing access to the Colorado groundwater (I). Bryan Lee, for providing access to the Colorado groundwater (II).
©2015 Water Research Foundation. ALL RIGHTS RESERVED.

©2015 Water Research Foundation. ALL RIGHTS RESERVED.

xv
EXECUTIVE SUMMARY
The U.S. Environmental Protection Agency (EPA) is considering setting or lowering the
maximum contaminant level (MCL) for several carcinogenic volatile organic contaminants (cVOCs) from their current levels (5 µg/L or 2 µg/L), and a sub-µg/L range is being considered. While current MCLs for organics are commonly attained using granular activated carbon (GAC), an order-of-magnitude reduction may present a challenge to water treatment facilities using GAC. This is especially true when considering the adsorption complexity presented by dissolved organic matter (DOM) and co-solutes in the background matrix of the groundwater (GW) being treated, as both can decrease the adsorption capacity of the target compound. The impact of empty bed contact time (EBCT) on cVOC breakthrough is also not well understood.
The overall goal of this project was to assess the feasibility of GAC for the treatment of cVOCs to sub-µg/L levels using the rapid small scale column test (RSSCT). The project tasks and their objectives were as follows:
Task I: Determine carbon use rates (CURs) at EBCTs of 7.5 min and 15 min for
the cVOCs in a GW Task II:
(a) Determine a threshold where cVOC breakthrough normalized to the influent cVOC concentration is independent of the influent cVOC concentration for one cVOC
(b) Determine the effects of GW DOM type and concentration on breakthrough of three cVOCs
(c) Determine competitive effects between two commonly co-occurring cVOCs in GW on cVOC breakthrough
Task III: Review scale-up method analysis, addressing the current understanding and procedures associated with accurate scale-up
The specific cVOCs evaluated were:
carbon tetrachloride (CT) 1,2-dichloroethane (1,2 DCA) 1,2-dichloropropane (1,2 DCP) tetrachloroethylene (PCE) trichloroethylene (TCE) 1,1-dichloroethane (1,1 DCA) 1,1,2,2-tetrachloroethane (1,1,2,2 TCA) 1,1,1,2-tetrachloroethane (1,1,1,2 TCA) 1,2,3-trichloropropane (1,2,3 TCP)
A baseline influent concentration of 5 µg/L was used. The evaluation of benzene,
dichloromethane (DCM), and 1,3- butadiene (1,3 BD) was initially proposed, but spiking issues precluded their use and evaluation.
©2015 Water Research Foundation. ALL RIGHTS RESERVED.

xvi
TASK I
Breakthrough of PCE and TCE did not occur, even though the columns were run for about 200,000 bed volumes for the 7.5 min EBCT column. This is the equivalent of about three years of operation at the full scale. Breakthrough to 10% and 50% was achieved for six compounds and thus CUR values could be calculated. However, 1,1,2,2 TCA degraded during the run and throughput and CURs could not be calculated. The CUR values were highest for 1,1 DCA and 1,2 DCA at about 0.25 lbs/1,000 gal treated. The CUR values for the other six cVOCs were less than 0.10 lbs/1,000 gal treated and for 1,2,3 TCP, PCE, and TCE the CUR values were less than 0.04 lbs/1,000 gal treated. In most, but not all cases, increasing EBCT to 15 min in all three waters yielded breakthrough at earlier throughput and thus higher CURs, especially for the strongly adsorbing compounds. CUR values below 0.10 lbs/1,000 gal treated are often considered to be economical, but the cost associated with these CURs needs to be compared with that of other treatment technologies. TASK II A
The influent 1,2 DCA concentration, C0, was varied in the range from 50, 5, 0.5, to 0.1 µg/L in four RSSCTs. 1,2 DCA was chosen as it is a weakly adsorbing compound, which yields earlier breakthrough and higher CURs. Breakthrough with the effluent concentration normalized to the influent concentration was found to be dependent on influent concentration at both EBCTs. In other studies a lack of dependence was found, but the influent concentrations of non-VOCs in these studies were all in the sub-parts per billion (ppb) range, and the background matrices were surface waters at higher dissolved organic carbon (DOC) concentrations. Additional RSSCTs were not conducted at influent concentrations less than 0.1 µg/L. Concentrations lower than this are well below the current maximum contaminant level of 5 µg/L and a target effluent concentration being considered (0.5 µg/L), and thus are less of a concern for drinking water utilities. This finding complicates the use of a single adsorption run to predict the breakthrough behavior at other C0s. TASK II B
Compared with cVOC breakthrough in the baseline Colorado groundwater (CO II), the higher DOC and specific ultraviolet absorption (SUVA) Florida groundwater (FL GW) yielded earlier breakthrough for 1,1 DCA and 1,2 DCP. Breakthrough of 1,2,3 TCP did not occur in the FL GW. Comparison of 1,1 DCA, 1,2 DCP, and 1,2,3 TCP breakthrough in CO II and FL GW diluted (FL DIL) to the same DOC as CO II, showed earlier breakthrough for all three cVOCs in the FL DIL, which was attributed to the 80% higher SUVA values of the FL DIL DOM. However, comparison of the FL GW and FL DIL cVOC results also showed earlier breakthrough for 1,1 DCA and 1,2 DCP in the FL DIL. This was not expected as both the influent DOC concentration and SUVA values of FL GW were higher, which was expected to yield earlier breakthrough. No explanation for this behavior is apparent.
©2015 Water Research Foundation. ALL RIGHTS RESERVED.

xvii
TASK II C
The negative impact of DOM on the breakthrough of 1,2 DCA was greater than that of the presence of two co-solutes, CT and TCE. TASK III
The results from RSSCTs are known to over-predict GAC performance. More paired cVOC data at the bench- and field- (-pilot or -full) are needed before adequate scale-up equations can be developed that will decrease the uncertainty of full-scale predictions.
Additional research in the Task II and III areas would facilitate the use of GAC as a viable technology to remove cVOCs from drinking water to meet proposed EPA regulatory levels.
©2015 Water Research Foundation. ALL RIGHTS RESERVED.

©2015 Water Research Foundation. ALL RIGHTS RESERVED.

1
CHAPTER 1 INTRODUCTION
BACKGROUND
The U.S. Environmental Protection Agency (EPA) is considering setting or lowering the maximum contaminant level (MCL) for several carcinogenic volatile organic contaminants (cVOCs) from their current MCL of 5 µg/L or 2 µg/L, and a sub-µg/L1 range is being considered. While current MCLs for organics are commonly attained using granular activated carbon (GAC), an order-of-magnitude reduction in MCLs may present a challenge to water treatment facilities using GAC. This is especially true when considering the adsorption complications presented by dissolved organic matter (DOM) and co-solutes in the background matrix of the water being treated. DOM has been shown to decrease both GAC uptake rates and overall capacity for contaminants.2-5 The overall objective of this research is to determine if GAC can remove cVOCs to the sub-µg/L level in groundwaters (GW) with environmentally relevant DOM concentrations.
RELEVANCE
Demonstrating GAC’s potential as a viable cVOC treatment technology is both environmentally relevant and timely. Many stakeholders benefit from this research: the EPA for regulatory purposes; municipalities for economic reasons; and environmental restoration site managers for implications to future cleanup criteria. Regarding Superfund sites, both the National Contingency Plan and Superfund (i.e. CERCLA) have language stating that in certain cases, remedial action must attain federal standards (MCLs or nonzero health goals) established under the Safe Drinking Water Act (SDWA).6
A common metric used to determine efficiency of GAC treatment for various constituents in the carbon use rate (CUR). The CUR, expressed in mass of carbon required to treat a volume of water to a specified treatment objective, is one metric used to estimate carbon performance. The rapid small scale column test (RSSCT) is a fast way to assess full-scale carbon performance, but often over-predicts the performance for specific organic compounds like cVOCs.3 RSSCTs use the principles of similitude to replicate adsorption phenomena, but do so in a fraction of the time required by pilot-scale columns.7,8 It has been estimated that less than 10% of the time and water is required for RSSCT experiments to produce comparable full-scale column data.7 Adjustments to the empty bed contact time (EBCT), the volume of the adsorber column divided by the volumetric flow rate, can also produce changes in GAC adsorber efficiency. Designed appropriately, the RSSCT allows multiple EBCTs to be quickly evaluated, thus allowing the effects of different EBCTs on GAC performance to be determined.
GOALS AND OBJECTIVES
The overall goal of this project was to assess the feasibility of GAC for the treatment of cVOC to sub-µg/L levels. The objectives of each task are:
Task I - determine CURs at EBCTs of 7.5 min and 15 min for the cVOCs in a GW,
©2015 Water Research Foundation. ALL RIGHTS RESERVED.

2
Task II - address: (a) a threshold where cVOC breakthrough normalized to the influent cVOC concentration is independent of the influent cVOC concentration for one cVOC, (b) the effects of GW DOM type and concentration on breakthrough of three cVOCs, and (c) competitive effects between two commonly co-occurring cVOCs in GW on cVOC breakthrough, and
Task III - review scale-up method analysis, addressing the current understanding and procedures associated with accurate scale-up.
The specific cVOCs to be evaluated were: carbon tetrachloride (CT), 1,2-dichloroethane (1,2 DCA), 1,2-dichloropropane (1,2 DCP), tetrachloroethylene (PCE), trichloroethylene (TCE), 1,1-dichloroethane (1,1 DCA), 1,1,2,2-tetrachloroethane (1,1,2,2 TCA), 1,1,1,2-tetrachloroethane (1,1,1,2 TCA) and 1,2,3-trichloropropane (1,2,3 TCP). A baseline influent concentration of 5 µg/L was used. The evaluation of benzene, dichloromethane (DCM) and 1,3- butadiene (1,3 BD) was initially proposed, but spiking issues precluded their use and evaluation.
Accomplishing Task I would have provided CURs for 12 cVOCs of concern in one GW (nine cVOCs were actually evaluated, but a third DOM was evaluated). Accomplishing Task II provide valuable insight into the impacts of initial cVOC concentrations, another background DOM at two influent concentrations and co-solute occurrence on single cVOC adsorption. Additional research in the Task II and III areas will be needed to advance the discussion of GAC as a viable technology to remove cVOCs from drinking water to meet proposed EPA regulatory levels.
PREVIOUS WORK Impact of DOM and cVOC Influent Concentration on Breakthrough and CUR
The inability to predict GAC’s reduced adsorption capability because of DOM in source waters, termed “carbon fouling”, is one hurdle preventing the determination of accurate carbon use rates. Isotherm constants can be used to predict carbon performance, but correlating the data to full-scale has been problematic. Isotherm values were often obtained from tests done in organic-free water. When conducted in natural waters, direct application of isotherm parameter values is challenging because of the varying quantity and wide variety of DOM characteristics in source waters and fouling phenomena does not occur to the same degree in batch systems as it does in flow through fixed bed reactors. Corwin and Summers developed an effective Freundlich capacity parameter, called K*, predicting apparent capacity of carbon in waters with environmentally relevant concentrations of DOM.9 K* is similar to the Freundlich isotherm K term but involves water with a background matrix containing DOM and is applied to flow-through column conditions. If K* can be accurately predicted, the carbon use rate can be calculated and the feasibility of using GAC as a treatment technique can be quantified.
Combining empirical and theoretical concepts, K* can be developed from the Freundlich isotherm equation represented in Eqn. 1.
. 1
©2015 Water Research Foundation. ALL RIGHTS RESERVED.
3
where q is the solid phase concentration of the contaminant (mass of adsorbate per mass adsorbent), x is the mass micropollutant absorbed to the carbon; MGAC is the mass of carbon; C0 is the influent concentration of the micropollutant; and KF and 1/n are Freundlich coefficients representing the absorbent’s capacity for the micropollutant and the heterogeneity of site energies available for sorption, respectively. Performing a mass balance around the aqueous phase and assuming no losses to the atmosphere, x can be expressed as Eqn. 2.
. 2 Where Q is the flow and t is operation time. An ideal adsorber operating under plug flow conditions has aC of 0 until breakthrough occurs. When micropollutant concentrations are low compared with the background DOM concentration, research has shown 1/n behaves as if it is 1.10,11 Eqn. 3 assumes that the volume of water treated at 50% breakthrough in a flow-through column is equal to the volume treated at breakthrough in an ideal reactor. Sontheimer et al., showed this assumption is valid as long as the breakthrough curve is nearly symmetrical.2
. 3 Incorporating Eqns. 2 and 3 and the assumptions above into Eqn. 1 produces Eqn. 4. KF has been replaced with K* to represent the new apparent capacity term.
∗ . 4
K* can also be represented as the volume of water treated at 50% breakthrough, BV50 divided by the mass of GAC which is the inverse of the carbon use rate as shown in Eqn. 5.
∗ e 1 . 5
Isotherm work in waters containing a background matrix of DOM demonstrated that a
carbon’s affinity for an adsorbate is independent of the initial concentration of the absorbate – as long as the concentration of the absorbate is relatively small compared with the concentration of the background DOM.10-12 This is the equivalent of having a linear isotherm. This was demonstrated mathematically by incorporating the Freundlich isotherm equation into Ideal Adsorbed Solution Theory (IAST) equations. Knappe et al.10 represents the IAST-Freundlich equations as:
,
0 . 6
,
0 . 7
Where Ci,0 is the influent concentration of adsorbate; qi is the solid phase concentration of adsorbate; Cc is the concentration of the carbon; and Ki and ni are Freundlich isotherm constants
©2015 Water Research Foundation. ALL RIGHTS RESERVED.
4
for the respective adsorbates. If C1 represents the adsorbate of interest and C2 is the DOM concentration and C1 << C2, it can be shown that Eqn. 6 and 7 reduce to:
,
1
. 8
Eqn. 8 demonstrates that the adsorbate of interest is removed proportionally to its initial concentration and the adsorption is occurring in a linear manner. Batch experiments conducted by both Knappe and Graham demonstrated and validated this relationship.10,11 Matsui showed this relationship continued to hold even before equilibrium conditions were met.12 The work discussed above focused on geosmin and 2-methylisoborneal and herbicides at low and sub-ppb concentrations in surface waters; cVOCs were not addressed and a specific linear threshold for cVOCs was never determined. Additionally, these efforts were conducted as batch systems, which present some concern as discussed below.
Batch systems and flow-through columns differ in their adsorbate-adsorbent interaction. In a flow-through column, the mass transfer zone (MTZ) for the adsorbate is often shorter than the DOM’s MTZ. When the adsorbate reaches deeper into the carbon bed, the carbon is already loaded with DOM. This results in both reduced GAC capacity and kinetics (i.e. carbon fouling). This is the not case with isotherm work when both the adsorbate and the DOM are introduced at the same time and each component ‘sees’ fresh carbon simultaneously. This creates a different driving force for the adsorption process. In the flow-through column, the concentration gradient in the bulk flow is very small and gradually increases as the MTZ travels through. The opposite is the case for batch systems where the strongest concentration gradient is first encountered and gradually decreases as the fixed quantity of adsorbate is removed. Conducting isotherms with carbon preloaded with DOM has been done, but doesn’t resolve the issue entirely because the flow-through columns are dynamic and non-steady state; preloading carbon with DOM only provides one incremental point in the mass-transfer continuum.
DOM Effects on cVOC Adsorption
Figure 1.1 shows the negative effect DOM has on GAC adsorption of 1,2 DCA. Two columns, one with deionized water and the other in a GW with DOM were run. At 10% breakthrough, the run in Colorado groundwater had approximately 30% less capacity for 1,2 DCA than the run in DI water.
©2015 Water Research Foundation. ALL RIGHTS RESERVED.

5
Figure 1.1 1,2 DCA breakthrough and the effects of DOM on adsorption at 7.5 min EBCT13
Other work has shown both the reduction in capacity and kinetics due to DOM, however,
much of this work was accomplished with surface waters.3-5 While other research has been accomplished with groundwater, the influent concentrations of the target compound were above the range of interest for this effort.14,15 DOM in groundwater differs from DOM in surface waters in both quantity and quality. Generally speaking DOM in groundwater is an order of magnitude lower in concentration compared with DOM in surface waters. Typical groundwaters have DOC concentrations of 0.5 to 1.0 mg/L, while mean surface water DOC concentrations can range from 2.0 to 12.0 mg/L.16 Groundwater DOM is also typically older than surface water DOM. Thurman estimated groundwater varied in age but averaged 660 years old;17 surface waters on the other end of the spectrum can contain DOM that is only hours, days or weeks old. Due to its greater age groundwater DOM is also considered more recalcitrant; chemically or biologically degradable compounds have undergone decomposition. Additionally, the labile DOM portion has reacted and sorbed leaving the remaining DOM recalcitrant to further reactions. These characteristics create a DOM that is more aliphatic with higher hydrogen to carbon ratios and more hydrophilic.17 In addition to a lower groundwater DOM concentration (compared with that of surface water), the different characteristics of groundwater DOM may impact GAC adsorption differently.
On a molecular size basis, work has shown that smaller DOM fractions are preferentially adsorbed over larger DOM fractions.5,18-20 While Kilduff et al.18 used surface waters for their experiments, Li investigated a central Illinois groundwater and determined the DOM MW distribution was between ~50 and 2000 Dalton (Da). Using surrogate compounds to represent different DOM ranges, the smaller MW fraction was shown to directly compete with the herbicide atrazine for sorption sites while the larger MW fraction reduced kinetics but not capacity.5 Li found that approximately 17% of the total DOM was non-absorbable and, interestingly, was also in the smaller DOM fraction range (200 to 500 Da).5 The EPA’s 12 cVOCs of interest in this
0
0.2
0.4
0.6
0.8
1
1.2
1.4
0 10,000 20,000 30,000 40,000 50,000 60,000
1,2
DC
A
No
rmal
ized
Co
nce
ntr
atio
n,
C/C
0
Throughput (Bed volumes)
CO GW; Co=4.9 µg/L
DI Water; Co=5.0 µg/L
©2015 Water Research Foundation. ALL RIGHTS RESERVED.
6
research are only a factor of 3 to 4 smaller than this size range: 1,3 butadiene is the smallest compound at ~54 Da and the isomers of TCE are ~168 Da.
Jarvie, et al.21 attempted to empirically relate DOM capacity reduction to both the specific water being treated and the classes of contaminant being removed. DOM characteristics from two surface waters and three groundwaters were considered. Capacity reduction by chemical class (e.g. halogenated alkanes, aromatics, chlorinated hydrocarbons, phenols) was normalized to the TCE adsorption capacity reduction and empirical correction factors were developed. Using Jarvie’s method to predict DOM capacity reduction, surrogate water most related to the water of interest is selected and the correction factors (according to the contaminant’s chemical class) are chosen. Constants are inserted into equations that predict the degree of DOM fouling based on the time GAC was preloaded with DOM before exposure to adsorbate.21 Incorporating Jarvie’s methodology is an option in the Diffused Flow Pore and Surface Diffusion Model (PSDM) from the Adsorption Design Software (AdDesignS) by Michigan Technological University to predict DOM fouling effects.22
Co-Solute Competition
Over 19% of the groundwater samples from 3,498 wells sampled in a USGS study contained VOCs.23 Often times multiple VOCs are found together. One data query found 7.8%, 6.4%, 4.0%, and 21.8% of 335,000 samples had TCE co-occurring with 1,2 dichloroethane, 1,2 dichloropropane, PCE, and vinyl chloride, respectively.23 Demonstrated with the IAST-Freundlich equations (Eqns. 8–10), it has theoretically been shown that multiple adsorbates will behave linearly in the presence of a significantly higher DOM concentration.10,11,24 Whether this behavior is duplicated in groundwater with multiple cVOCs at environmentally relevant concentrations will be explored in this effort.
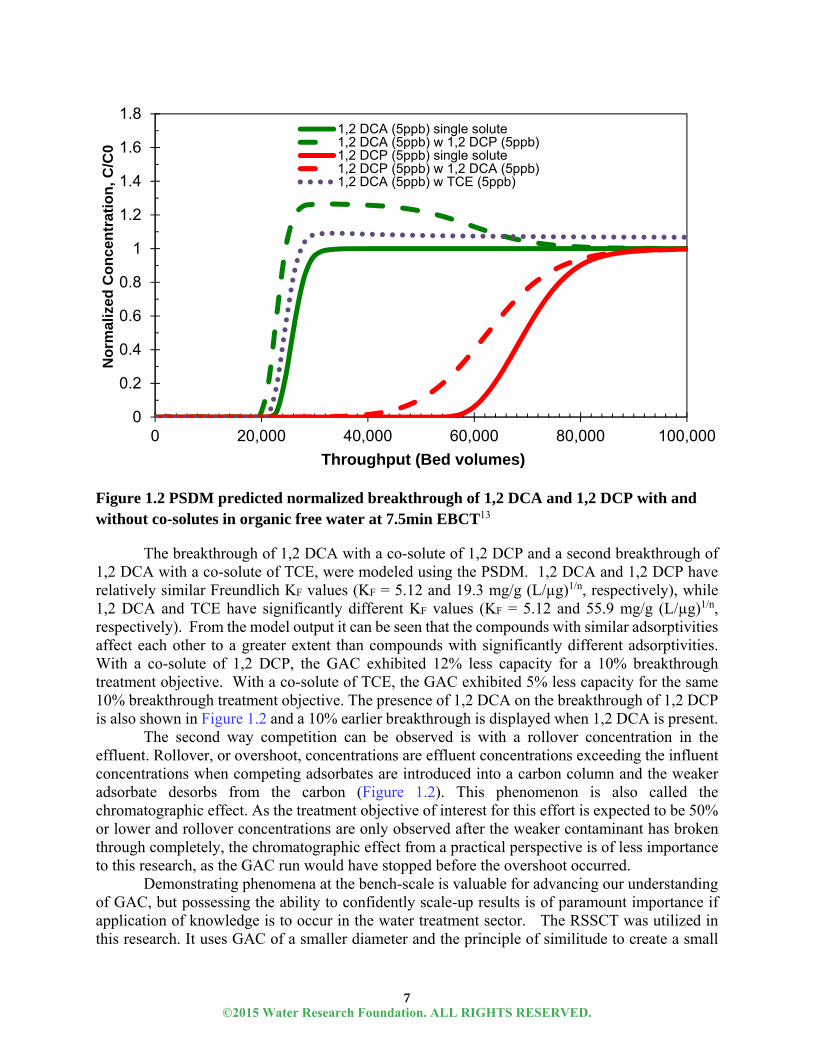
If competition is occurring, it can exhibit itself in one of two ways. If two compounds have similar absorbability, earlier initial breakthrough of the compounds will be observed. The PSDM predicts that co-solutes with similar adsorptivities (similar KF values) will cause earlier breakthrough compared with that for co-solutes with significantly different adsorptivities. This impact is demonstrated in Figure 1.2.
©2015 Water Research Foundation. ALL RIGHTS RESERVED.
7
Figure 1.2 PSDM predicted normalized breakthrough of 1,2 DCA and 1,2 DCP with and without co-solutes in organic free water at 7.5min EBCT13
The breakthrough of 1,2 DCA with a co-solute of 1,2 DCP and a second breakthrough of 1,2 DCA with a co-solute of TCE, were modeled using the PSDM. 1,2 DCA and 1,2 DCP have relatively similar Freundlich KF values (KF = 5.12 and 19.3 mg/g (L/µg)1/n, respectively), while 1,2 DCA and TCE have significantly different KF values (KF = 5.12 and 55.9 mg/g (L/µg)1/n, respectively). From the model output it can be seen that the compounds with similar adsorptivities affect each other to a greater extent than compounds with significantly different adsorptivities. With a co-solute of 1,2 DCP, the GAC exhibited 12% less capacity for a 10% breakthrough treatment objective. With a co-solute of TCE, the GAC exhibited 5% less capacity for the same 10% breakthrough treatment objective. The presence of 1,2 DCA on the breakthrough of 1,2 DCP is also shown in Figure 1.2 and a 10% earlier breakthrough is displayed when 1,2 DCA is present.
The second way competition can be observed is with a rollover concentration in the effluent. Rollover, or overshoot, concentrations are effluent concentrations exceeding the influent concentrations when competing adsorbates are introduced into a carbon column and the weaker adsorbate desorbs from the carbon (Figure 1.2). This phenomenon is also called the chromatographic effect. As the treatment objective of interest for this effort is expected to be 50% or lower and rollover concentrations are only observed after the weaker contaminant has broken through completely, the chromatographic effect from a practical perspective is of less importance to this research, as the GAC run would have stopped before the overshoot occurred.
Demonstrating phenomena at the bench-scale is valuable for advancing our understanding of GAC, but possessing the ability to confidently scale-up results is of paramount importance if application of knowledge is to occur in the water treatment sector. The RSSCT was utilized in this research. It uses GAC of a smaller diameter and the principle of similitude to create a small
0
0.2
0.4
0.6
0.8
1
1.2
1.4
1.6
1.8
0 20,000 40,000 60,000 80,000 100,000
No
rmal
ized
Co
nce
ntr
atio
n,
C/C
0
Throughput (Bed volumes)
1,2 DCA (5ppb) single solute1,2 DCA (5ppb) w 1,2 DCP (5ppb)1,2 DCP (5ppb) single solute1,2 DCP (5ppb) w 1,2 DCA (5ppb)1,2 DCA (5ppb) w TCE (5ppb)
©2015 Water Research Foundation. ALL RIGHTS RESERVED.

8
carbon column that can be scaled to predict full sized column behavior. The RSSCT used in this research offers three primary advantages over alternative experimental methods: (1) an RSSCT may be conducted in a fraction of the time that is required to conduct pilot studies; (2) unlike predictive mathematical models, extensive isotherm or kinetic studies are not required to obtain a full-scale performance prediction; and, (3) a small volume of water is required to conduct the test.8 In addition to the benefits discussed above, the RSSCT allows greater experimental control. Variables such as the EBCT, carbon type, and parallel or series adsorber configuration can be more easily adjusted at the bench scale. The value of these advantages is negated though if accurate scale-up cannot be accomplished. Previous work has explored the utility of the RSSCT to project full-scale column performance but results have varied in accuracy. Additionally, the work accomplished was either done with contaminants other than cVOCs or at concentrations higher than the sub-µg/L range.3,25,26
APPROACH A summary of the conditions used to address the tasks of this research is shown in Table 1.1. The cVOCs were classified as either weakly (1,1 DCA, 1,2 DCA, 1,1,2,2 TCA, DCM), moderately (1,2 DCP, CT, 1,1,1,2 TCA, 1,3 BD), or strongly adsorbing (1,2,3 TCP, TCE, PCE, benzene), relative to the other compounds in their tri-solute mix. Task I. Carbon Use Rate Evaluation at Different EBCTs for 12 cVOCs
Four RSSCT runs (RSSCTs 1, 2, 3 and 4) with tri-solute cVOC mixes at a target influent concentration of 5 µg/L in one background water and at two EBCTs, 7.5 and 15 min, were planned, Use of benzene, DCM, 1,3 BD in Mix 2 was found to be problematic because of the unstable nature during storage and thus, RSSCT 2 was not run and RSSCT 10 was added. CURs were determined from the breakthrough data. The tri-solute mixes were chosen to minimize the impact of the presence of the co-solutes on the breakthrough of each cVOC of interest, thus each mix had a weak, moderate and strongly adsorbing compound.
Task IIa. Impact of Influent cVOC Concentration on Adsorption and CUR
Four RSSCT runs (RSSCTs 5, 6, 7 and 8) with 1,2 DCA at target influent concentrations of 50, 5, 0.5 and 0.1 µg/L in one background water and at two EBCTs, 7.5 and 15 min, yielded breakthrough results from which CURs were determined. The approach could yield a threshold below which there is no effective co-solute adsorption competition (zone of linear adsorption).
Task IIb. Impact of Background DOM from Different Groundwater Sources and Influent DOM Concentrations on Adsorption and CUR
Two RSSCT runs (RSSCTs 9 and 10) with the same tri-solute mix and influent concentration used in RSSCT 1 in a second groundwater at a higher DOC concentration and diluted to the same DOC concentration as that in RSSCT and at two EBCTs, 7.5 and 15 min, yielded breakthrough results from which CURs were determined. The approach should yield insights in the impact of DOM type and concentration.
©2015 Water Research Foundation. ALL RIGHTS RESERVED.
9
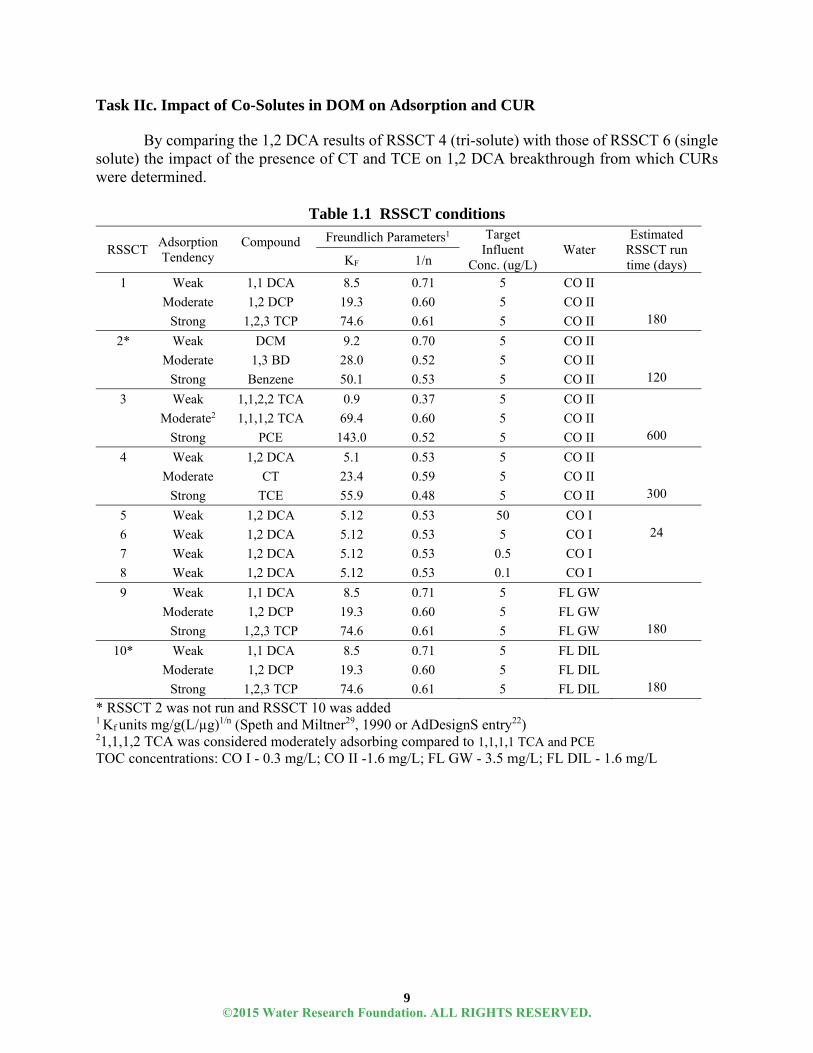
Task IIc. Impact of Co-Solutes in DOM on Adsorption and CUR
By comparing the 1,2 DCA results of RSSCT 4 (tri-solute) with those of RSSCT 6 (single solute) the impact of the presence of CT and TCE on 1,2 DCA breakthrough from which CURs were determined.
Table 1.1 RSSCT conditions
* RSSCT 2 was not run and RSSCT 10 was added 1 Kf units mg/g(L/µg)1/n (Speth and Miltner29, 1990 or AdDesignS entry22) 21,1,1,2 TCA was considered moderately adsorbing compared to 1,1,1,1 TCA and PCE TOC concentrations: CO I - 0.3 mg/L; CO II -1.6 mg/L; FL GW - 3.5 mg/L; FL DIL - 1.6 mg/L
RSSCT Adsorption Tendency
Compound
Freundlich Parameters1 Target Influent
Conc. (ug/L) Water
Estimated RSSCT run time (days) KF 1/n
1 Weak 1,1 DCA 8.5 0.71 5 CO II
Moderate 1,2 DCP 19.3 0.60 5 CO II
Strong 1,2,3 TCP 74.6 0.61 5 CO II 180
2* Weak DCM 9.2 0.70 5 CO II
Moderate 1,3 BD 28.0 0.52 5 CO II
Strong Benzene 50.1 0.53 5 CO II 120
3 Weak 1,1,2,2 TCA 0.9 0.37 5 CO II
Moderate2 1,1,1,2 TCA 69.4 0.60 5 CO II
Strong PCE 143.0 0.52 5 CO II 600
4 Weak 1,2 DCA 5.1 0.53 5 CO II
Moderate CT 23.4 0.59 5 CO II
Strong TCE 55.9 0.48 5 CO II 300
5 Weak 1,2 DCA 5.12 0.53 50 CO I
6 Weak 1,2 DCA 5.12 0.53 5 CO I 24
7 Weak 1,2 DCA 5.12 0.53 0.5 CO I
8 Weak 1,2 DCA 5.12 0.53 0.1 CO I
9 Weak 1,1 DCA 8.5 0.71 5 FL GW
Moderate 1,2 DCP 19.3 0.60 5 FL GW
Strong 1,2,3 TCP 74.6 0.61 5 FL GW 180
10* Weak 1,1 DCA 8.5 0.71 5 FL DIL
Moderate 1,2 DCP 19.3 0.60 5 FL DIL
Strong 1,2,3 TCP 74.6 0.61 5 FL DIL 180
©2015 Water Research Foundation. ALL RIGHTS RESERVED.

©2015 Water Research Foundation. ALL RIGHTS RESERVED.
11
CHAPTER 2 MATERIALS AND METHODS
MATERIALS
Waters
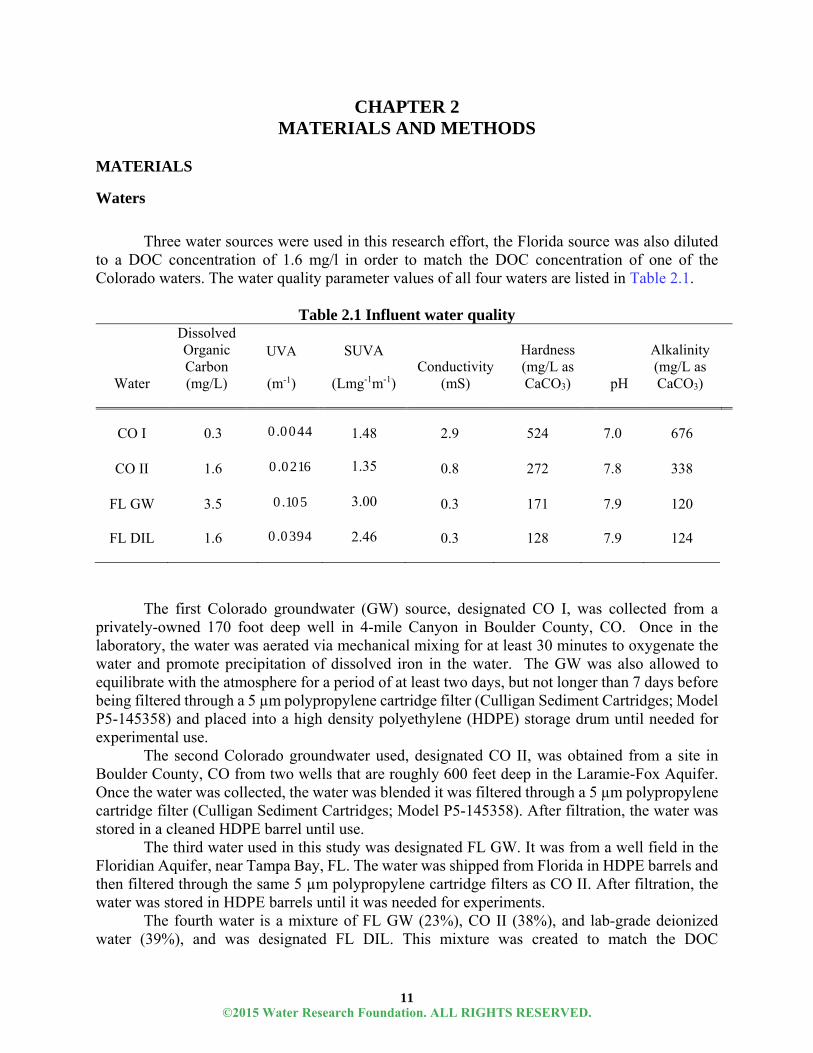
Three water sources were used in this research effort, the Florida source was also diluted to a DOC concentration of 1.6 mg/l in order to match the DOC concentration of one of the Colorado waters. The water quality parameter values of all four waters are listed in Table 2.1.
Table 2.1 Influent water quality
Water
Dissolved Organic Carbon (mg/L)
UVA
(m-1)
SUVA
(Lmg-1m-1) Conductivity
(mS)
Hardness (mg/L as CaCO3) pH
Alkalinity (mg/L as CaCO3)
CO I 0.3 0.0044 1.48 2.9 524 7.0 676
CO II 1.6 0.0216 1.35 0.8 272 7.8 338
FL GW 3.5 0.105 3.00 0.3 171 7.9 120
FL DIL 1.6 0.0394 2.46 0.3 128 7.9 124
The first Colorado groundwater (GW) source, designated CO I, was collected from a privately-owned 170 foot deep well in 4-mile Canyon in Boulder County, CO. Once in the laboratory, the water was aerated via mechanical mixing for at least 30 minutes to oxygenate the water and promote precipitation of dissolved iron in the water. The GW was also allowed to equilibrate with the atmosphere for a period of at least two days, but not longer than 7 days before being filtered through a 5 µm polypropylene cartridge filter (Culligan Sediment Cartridges; Model P5-145358) and placed into a high density polyethylene (HDPE) storage drum until needed for experimental use.
The second Colorado groundwater used, designated CO II, was obtained from a site in Boulder County, CO from two wells that are roughly 600 feet deep in the Laramie-Fox Aquifer. Once the water was collected, the water was blended it was filtered through a 5 µm polypropylene cartridge filter (Culligan Sediment Cartridges; Model P5-145358). After filtration, the water was stored in a cleaned HDPE barrel until use.
The third water used in this study was designated FL GW. It was from a well field in the Floridian Aquifer, near Tampa Bay, FL. The water was shipped from Florida in HDPE barrels and then filtered through the same 5 µm polypropylene cartridge filters as CO II. After filtration, the water was stored in HDPE barrels until it was needed for experiments.
The fourth water is a mixture of FL GW (23%), CO II (38%), and lab-grade deionized water (39%), and was designated FL DIL. This mixture was created to match the DOC
©2015 Water Research Foundation. ALL RIGHTS RESERVED.

12
concentration of CO II. This allowed examination of both concentration and characteristics of different organic matters.
Adsorbent
Norit GAC 400 from Cabot Norit, characteristics summarized in Table 2.2, was used for this research. It is made from bituminous coal and is representative of many bituminous-based GACs. The Norit GAC 400 was received as a U.S. Standard Sieve size of 12 x 40, corresponding to a log-mean diameter of 0.92 mm. The carbon was ground using a mortar and pestle, and then sieved through a U.S. Standard Sieve size of 100 x 200, corresponding to a log mean diameter of 0.11 mm. The GAC was placed into a beaker and decanted between 8 and 20 times in order to remove fines and attain GAC of the correct size. The carbon was put under vacuum for at least 24 hours to remove air from the internal pore space. The bed density was measured at 0.47 g/cm3.
Adsorbates
All adsorbates (Sigma-Aldrich, St. Louis MO) were reagent grade and received in neat form. Adsorbate properties are listed in Table 2.3.
Table 2.2 GAC characteristics
Type U.S. Sieve Size
Iodine #
(mg/g)
Apparent bed
density (g/cm3)
Size Distribution (nm)
Specific Volume (mL/g)
Percentage
Re-agglomerated bituminous coal
12 x 40 >1000 0.47
Micropore (<2) 0.39 49%
Mesopore (2-50) 0.13 16%
Macropore (>50) 0.27 34%
©2015 Water Research Foundation. ALL RIGHTS RESERVED.

13
Table 2.3 Adsorbate properties, grouped by mix
Mix
cVOC Molar Mass
(g/mol)
Dimensionless Henry's Constant
(@10oC; 1 atm)
Solubility (mg/L)
log Kow
1,1 Dichloroethane 99.0 0.160 5040 1.79
1 1,2 Dichloropropane 113.0 0.115 3000 1.97
1,2,3 Trichloropropane 147.4 0.012 1750 2.27
1,2 Dichloroethane 99.0 0.039 8600 1.98
3 Carbon Tetrachloride 153.8 0.634 800 2.83
Trichloroethylene 131.4 0.230 1280 2.61
1,1,2,2 Tetrachloroethane 167.9 0.014 286 2.39
4 1,1,1,2 Tetrachloroethane 167.9 .0419 1070 3.05
Perchloroethene 165.8 0.72 150 3.4
Another group of adsorbates, benzene, DCM, 1,3 BD, (mix 2) was originally proposed, as shown in Table 1.1, but problems with the stability of the compounds eliminated them from further consideration.
After receiving the neat cVOC compounds, they were mixed in volumetric flasks ranging from 250 to 2000 mL to final concentrations between 50 and 572 µg/mL were obtained. In order to increase likelihood of achieving the correct final concentration, the theoretical solubility was halved or decreased by two thirds so all of the compound could be dissolved. The final concentrations were determined in order to meet the lower limit that could be pipetted with lab materials, 50 µL. The volumetric flasks were mixed between 8 and 12 hours, and then pipetted into 2 mL amber gas chromatography vials with zero headspace. The vials containing stock solutions were stored at 4 C until needed. METHODS Total Organic Carbon/Ultraviolet Absorbance/pH/Conductivity/Alkalinity
Total organic carbon was analyzed on a Sievers 5310C (General Electric Instruments, Fairfield, CT) using high temperature/non-purgeable procedures in accordance with EPA Method 415.3. The samples were adjusted to pH < 2 by adding 6N phosphoric acid prior to analysis. Because the samples had been filtered (5 µm polypropylene cartridge filter) they are reported as DOC. A Cary spectrophotometer (Varian Cary Bio 100, Agilent Technologies, Santa Clara, CA)
©2015 Water Research Foundation. ALL RIGHTS RESERVED.
14
was used to measure ultraviolet absorbance at 254 nm. Samples were contained in a 1 cm path length during analysis. pH was measured in accordance with American Public Health Association Standard Method 4500-H+ using a Denver Instrument pH meter (Model 220, Denver Instrument, Bohemia, NY). A Hanna portable conductivity meter (HI 991300, Hanna Instruments, Woonsocket, RI) was used to measure conductivity in accordance with APHA-SM 2510B. Alkalinity was measured using a Hach Digital Titrator (16900-01, Hach Company, Loveland, CO) in accordance with APHA-SM 2320. Gas Chromatography/Mass Spectrometry
The EPA’s Office of Research and Development, Water Supply and Water Resources Division, National Risk Management Research Laboratory in Cincinnati, OH performed sample analyses for all cVOCs, except the FL GW RSSCT run (#9). They used a split-less head space injection method (modified EPA method 524.3) on an Agilent 7890A gas chromatography unit paired with a 5975C mass spectrometer. QA/QC and calibration recommendations from EPA method 524.3 were followed. An 8-point calibration curve was used and a blank or check sample was run every ten samples. Method Reporting Limits were less than 37 g/L or parts per trillion (ppt) for all cVOCs used during experimentation. Gas Chromatography/Flame Ionization Detector
North Carolina State University’s Civil, Construction, and Environmental and Construction Engineering Department performed sample cVOCs analyses for one RSSCT (run #9). The Water Resources, Coastal and Environmental Engineering research group performed analyses using a Shimadzu 2014 gas chromatography (Shimadzu Corporation, Kyoto, Japan) device with a Restek column Rtx-VMS flame ionization detector (Restek Corporation, Bellefonte, PA), Teledyene Aquatek 70 autosampler, and Teledyne Stratum Purge & Trap (Teledyne Technologies, Thousand Oaks, CA). RSSCT Experimental Setup
The RSSCT was used for all of the data in this project. Variables that were modified include GAC type, EBCT, and temperature while maintaining the same general design. The EPA Manual for Bench- and Pilot-Scale Treatment Studies guided the set-up of the RSSCTs.28 Figure 2.1 shows a generic diagram of the RSSCT setup. Groundwater was transferred to 19 or 22 L carboys and then spiked with premixed stock cVOCs. The carboy was gently stirred with a stainless steel rod in order to mix without excessive volatilization. Once the carboy was mixed, it was moved to a shelf roughly four feet above the pump used for the RSSCT in order to provide additional head against the resistance of the columns. In order to minimize volatilization during the run, traps were spiked with three times the carboy concentration, which has been shown to reduce volatilization.
The water was stored in HDPE barrels and then transferred to 19 or 22 L glass carboys for feed to the RSSCT columns. Tubing consisted of 4.76 mm polytetrafluoroethylene (PTFE or Teflon) or 1/4” outer-diameter stainless steel tubing (Nalgene 890 FEP by Thermo Fisher Scientific Inc, Waltham, MA). Valves and fittings were manufactured by Swagelock (Solon, OH). All pumps were PTFE diaphragm pumps made by Cole-Parmer (Vernon Hills, IL) with diaphragm model 7090-62. Two different drivers were used, model numbers 77521-50 and 7521-40. Other materials used were 5 gallon plastic carboys for effluent collection, pipettes (Eppendorf
©2015 Water Research Foundation. ALL RIGHTS RESERVED.

15
International, Hamburg, Germany), and glass wool. The glass wool was used as support for the GAC filters inside of the PFTE columns and also as a prefilter to remove any particulate matter that could cause a blockage of flow and therefore a pressure increase to a point where the pump could not move water through the columns.
Figure 2.1 Generic RSSCT set up13
There were two GAC columns in series during each experiment. Both corresponded to 7.5
minute EBCTs, yielding an overall 15 minute EBCT. A valve was used between the columns to allow sampling at a 7.5 minute EBCT, and adjustments in the flow rate. The columns were created by pushing a glass wool plug as a base for the GAC into the bottom of a 4.76 mm diameter column. The carbon was added using Pasteur pipettes to the column, already full of DI water. After each addition of ground GAC, the column was gently rapped with a wrench to ensure settling of the carbon. This was important because the volume of GAC was used to determine the correct amount of contact time. Once the height of the carbon corresponded with a 0.76 grams of carbon (7.5 minute EBCT), the column was ready for installation.
A glass wool prefilter was used before the columns in order to prevent fines from increasing headloss and decreasing flow through the columns. The prefilters were changed every 7-14 days depending on visual inspection. A pressure gauge was installed before the columns to measure the pressure to determine if clogging of the GAC was occurring. A pressure dampener was installed before the columns to moderate the flow to a steady level instead of the pulsing created by the diaphragm pump. Effluent was collected in a plastic 5 gallon carboy.
EBCT 7.5 minutes
EBCT 15 minutes
Pressure gauge Feed tank
Cinf
Effluent tank
Pump
Sampling ports
Glass wool pre‐filter VOC trap
©2015 Water Research Foundation. ALL RIGHTS RESERVED.

16
Samples were taken every 3-5 days from the influent and effluent. At the same time, the runtime between samples and effluent volume was measured and used to calculate flow rate and overall throughput. Throughput was reported in terms of bed volumes of the column. One bed volume of water equals the volume of the GAC in the column. Another way to report the amount of water treated is in terms of the carbon used. This is expressed as the CUR. The CUR allows direct comparison of amount of carbon utilized per volume of water treated, making it a good measure for utilities. The CUR is defined as the density of the carbon divided by the bed volumes.
In order to study tri-solute columns, three mixes were selected. Each mix contains one cVOC in the weakly, moderately, and strongly adsorbing compound categories, in order to minimize competition. In addition, there is less competition between co-solutes of differing adsorption strength, so the tri-solute breakthroughs can be used to estimate single solute breakthrough parameters. The RSSCTs are listed in Table 1.1 and were run so that the CURs at different EBCTs could be evaluated. The base mix of 1,1 DCA, 1,2 DCP, and 1,2,3 TCP was used for three different RSSCTs; 1 (CO II), 9 (FL GW) and 10 (FL DIL). That allowed the comparison of DOM type and DOM concentration present in the groundwater. Two other mixes (1) 1,2 DCA, carbon tetrachloride, and TCE and (2) 1,1,2,2 TCA, 1,1,1,2 TCA, and PCE, both in CO II, were also tested. 1,2 DCA in CO I was also tested in four RSSCTs to evaluate the impact of influent 1,2 DCA concentration.
RSSCT Design
RSSCTs are bench-scale experiments and use mass transfer relationships from the Diffused Flow Pore and Surface Diffusion Model and the principles of similitude to replicate full-scale adsorption phenomena but do so in a fraction of the time.7,8,25,28 The mass transfer mechanisms addressed in the PSDM account for advection, axial diffusion and dispersion, intraparticle pore and surface diffusion, and mass transfer resistance in the bulk liquid phase. Further discussion on these mechanisms and their respective mathematical equations and dimensionless numbers has been documented extensively elsewhere.2 A table summarizing these mechanisms was prepared by Corwin and is presented in Table 2.4.29 Using GAC of a smaller size and maintaining similitude between the dimensionless parameters responsible for the mass transfer of the target organic in the full- and small-scale columns creates a small column (i.e., RSSCT) that behaves as a full sized column.
©2015 Water Research Foundation. ALL RIGHTS RESERVED.

17
Table 2.4 Dimensionless numbers used in the scaling of the RSSCT29
The ratio of the EBCTs of the small and the large columns could be represented by equation 2.1:
∗ . 2.1
Where SC and LC represent the small and large columns, respectively. D is the intraparticle diffusivity of the target organic and R is the radius of the GAC particle. Mathematically, it is the ratio of the GAC particle sizes that is important and often times, equation 2.1 is written in terms of the GAC diameter. Operationally this may be more convenient as sieve sizes and vendor literature often report GAC diameter. For consistency, the particle radius will continue to be used throughout this chapter.
Equation 2.2 represents the ratio of GAC particle sizes in large and small columns and is referred to as the scaling factor (SF).
. 2.2
Empirically it has been shown that the intraparticle diffusivity can decrease with decreasing particle size.2 This is due to an increasing tortuosity inside a smaller heterogeneous pore. If the intraparticle diffusivities are related to particle size raised to a diffusivity factor, X, then equation 2.3 can be substituted into equation 2.1 to provide equation 2.4, the RSSCT design equation.
. 2.3
©2015 Water Research Foundation. ALL RIGHTS RESERVED.
18
. 2.4
Generally, one of two RSSCT designs has been used to simulate full-scale adsorbers. One
is the constant diffusivity (CD) design and the other is the proportional diffusivity (PD) design. These designs differ in the scaling of the intraparticle diffusion of the target organic. If the intraparticle diffusivities are equal between the GAC sizes, X = 0 and the CD design equation is produced:
. 2.5
If however, the intraparticle diffusivities are linearly proportional to the GAC size ratios,
X = 1 and the PD design equation is produced:
. 2.6
Although the CD- and PD-RSSCT designs have been the default for RSSCT experimental
work, there is nothing keeping the diffusivity relationship strictly constant (X = 0) or strictly linear (X = 1). Mixed results for target organic breakthrough for both the CD- and PD-RSSCT have been reported.2,3,7,8,25,28 The CD-RSSCT seems to predict initial breakthrough of the target organic better than the PD design, while the PD-RSSCT seems to more accurately predict full-scale breakthrough of DOM.
Since this effort focuses to a great extent on the effect of groundwater DOM on target organic breakthrough, equation 2.6 and the PD-RSSCT design was used in this effort. Further justifying the use of the PD-RSSCT are the recently developed scaling equations to improve prediction of full-scale GAC capacity3,27,30,31 (see scale-up review on pages 40-43).
Aside from the EBCT, the other critical design variable in the RSSCT is the hydraulic loading rate. Maintaining external mass transfer similitude between the large and small columns produces an RSSCT of equal length to the large column. This is not ideal, requiring a large volume of water and a high hydraulic loading rate in order to meet the design EBCT. To overcome this, the hydraulic loading rate of the RSSCT can be reduced to a point as long as the Peclet number is greater than or equal to the Peclet number of the large column and thereby ensuring dispersion in the RSSCT doesn’t control mass transfer.2 The Peclet number is the rate of adsorbate transport by advection relative to axial dispersion. Maintaining a minimum Reynolds number would ensure internal mass transfer still controlled over external mass transfer and result in shorter PD-RSSCT column lengths. This adjusted hydraulic loading rate for the PD-RSSCT is represented by equation 2.7:
∗ ∗ , . 2.7
Re represents the Reynolds number and is a measure of turbulence in the adsorber. ReLC is the turbulence in the large column and ReSC,min is the minimum turbulence required to maintain
©2015 Water Research Foundation. ALL RIGHTS RESERVED.

19
dispersion in the mechanical range and ensure that dispersion is not a dominant mechanism. Equations 2.8 and 2.9 were used to calculate Re numbers.
, ∗∗
. 2.8
,500
2.9
Where dp,LC is the diameter of the GAC particle, νLC is the hydraulic loading rate of the large column, ε is the bed porosity, kv is the kinematic viscosity and Sc is the Schmidt number that relates fluid viscosity to the target organic bulk liquid diffusion coefficient. The Sc number was calculated with equation 2.10.
. 2.10
Where µ is the dynamic viscosity and Dw is the diffusivity of the target organic in water. For this effort, Dw was determined using a small fictitious target organic with a molar volume of 105 cm3/mol. The RSSCT design for this project is shown in Table A.1 in appendix A. Fixed-Bed Adsorption Modeling
The model used was the Adsorption Design Software (AdDesignS) by Michigan Technological University.22 There are multiple models that predict GAC removal of organic compounds, but the Pore and Surface Diffusion Model (PSDM) was used because it produces full breakthrough curves for each compound and accounts for competition between compounds in multi-solute runs. Because of this, it requires more inputs such as specific information about adsorbates, operating characteristics, and kinetic properties.
©2015 Water Research Foundation. ALL RIGHTS RESERVED.

©2015 Water Research Foundation. ALL RIGHTS RESERVED.

21
CHAPTER 3 RESULTS AND DISCUSSION
PSDM RESULTS
The results of the PSDM modeling of the compounds used in RSSCTs 1, 3 and 4 are shown in Figures 3.1, 3.2 and 3.3, respectively. The Freundlich parameters values, shown in Table 1.1, were used. The surface diffusion contribution is difficult to calculate and was set very low such that pore diffusion dominated. There is no evidence that this would impact the results as we have used them on a relative breakthrough. The influent concentration was set at 5 g/L and the EBCT was 7.5 min. All other parameters were default values calculated by the AdDesignS software for the specific compounds and the conditions listed in Table A.1 for the full-scale (large) column.
In each figure, model results for each compound are shown for three single solute runs and for a tri-solute mixture. The exception was RSSCT 3, in which the PSDM was unable to model the tri-solute mixture, likely because the range in Freundlich Kf values was greater than two orders of magnitude (Table 1.1). On average, for the compounds in the tri-solute mixes used in RSSCTs 1 and 4, there was a 12% decrease in throughput to 10% breakthrough caused by the presence of the other two compounds. Kempisty has shown that competitive effect increases as the Kf values become more similar, as illustrated in Figure 1.2.13
TRI-SOLUTE RSSCT RESULTS
The DOC breakthrough results from RSSCTs 1 (CO II), 9 (FL GW) and 10 (FL DIL) at both EBCTs are shown in Figure 3.4. As expected the FL GW with the higher influent concentration, DOC = 3.5 mg/L, broke through before the CO II and FL DIL waters, which had lower influent DOC concentrations, 1.6 mg/L. EBCT was found to have little impact on the DOC breakthrough, which has also been seen for surface waters, but is not always consistent. Also shown are the results of a DOC breakthrough model (Z&S).32 The model, developed with results from the treatment of coagulated surface waters, is sensitive to influent DOC concentration and predicts breakthrough at longer throughput values. This would imply that the DOM in the groundwater is less adsorbable than coagulated surface water DOM.
©2015 Water Research Foundation. ALL RIGHTS RESERVED.

22
Figure 3.1 PSDM predicted normalized breakthrough of 1,1 DCA, 1,2 DCP, and 1,2,3 TCP with and without co-solutes in organic free water at 7.5 min EBCT
Figure 3.2 PSDM predicted normalized breakthrough of 1,1,2,2 TCA, 1,1,1,2 TCA, and PCE without co-solutes in organic free water at 7.5 min EBCT
0
0.2
0.4
0.6
0.8
1
1.2
1.4
0 50,000 100,000 150,000 200,000 250,000 300,000 350,000
No
rmal
ized
Co
nce
ntr
atio
n, C
/C0
Throughput (Bed volumes)
1,1 DCA Single Solute1,2 DCP Single Solute1,2,3 TCP Single Solute1,1 DCA Trisolute1,2 DCP Trisolute1,2,3 TCP Trisolute
0
0.2
0.4
0.6
0.8
1
1.2
0 200,000 400,000 600,000 800,000 1,000,000
No
rmal
ized
Co
nce
ntr
atio
n, C
/C0
Throughput (Bed volumes)
1,1,2,2 TCA Single Solute
1,1,1,2 TCA Single Solute
PCE Single Solute
©2015 Water Research Foundation. ALL RIGHTS RESERVED.

23
Figure 3.3 PSDM predicted normalized breakthrough of 1,2 DCA, CT, and TCE with and without co-solutes in organic free water at 7.5 min EBCT
Figure 3.4 Normalized DOC breakthrough at 7.5 and 15 min EBCT (RSSCT 1, 9, and 10)
0
0.2
0.4
0.6
0.8
1
1.2
1.4
0 100,000 200,000 300,000 400,000
No
rmal
ized
Co
nce
ntr
atio
n ,
C/C
0
Throughput (Bed volumes)
1,2 DCA Trisolute
CT Trisolute
TCE Trisolute
1,2 DCA Single Solute
CT Single Solute
TCE Single Solute
0
0.2
0.4
0.6
0.8
1
0 5,000 10,000 15,000 20,000 25,000 30,000 35,000
No
rmal
ized
co
nce
ntr
atio
n, C
/C0
Throughput (Bed Volumes)
CO II (1.6, 7.5)CO II (1.6, 15)FL DIL (1.6, 7.5)FL DIL (1.6, 15)FL GW (3.5, 7.5)FL GW (3.5, 15)Z&S Model (1.6, 10)Z&S Model (3.5, 10)
TOC EBCT (mg/L) (min)
©2015 Water Research Foundation. ALL RIGHTS RESERVED.

24
This might have implications on the adsorption of the cVOCs. If less DOM is adsorbed, then there may be more capacity for the adsorption of the cVOCs. Another implication is that the DOM does not dominate the adsorption and there may be competition on the surface between cVOCs or between the DOM and cVOCs.
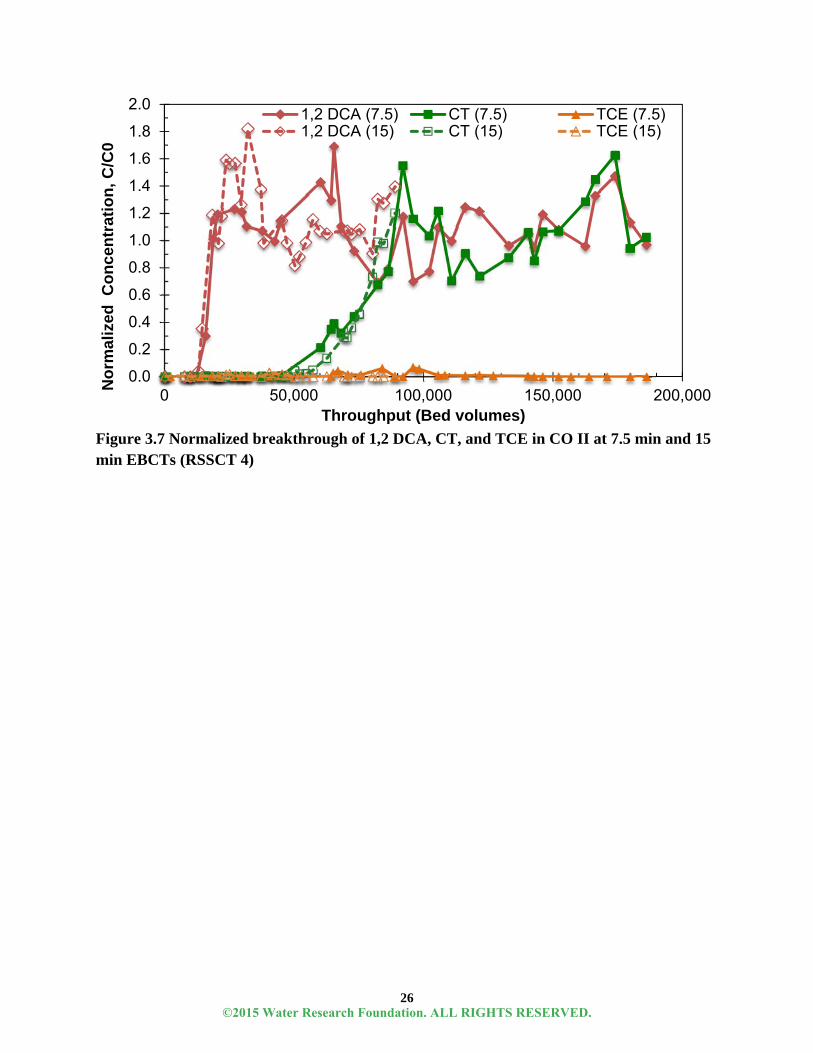
The cVOC breakthrough results from RSSCTs 1, 3 and 4 in the CO II water (DOC= 1.6 mg/L) are shown in Figures 3.5, 3.6 and 3.7, respectively. For each RSSCT a tri-solute mix was used (Table 1.1). The breakthrough in each RSSCT followed the expected order, except for 1,1,2,2 TCA, which should have broken through early, but it was found to degrade during operation to TCE in the carboy and samples before analysis. As a result, throughput in bed volumes to 10% and 50% breakthrough and the corresponding CURs could not be estimated for 1,1,2,2 TCA. The throughput in bed volumes to 10% and 50% breakthrough for each of the other eight compounds are listed in Tables 3.1and 3.2, respectively. The CURs to those same breakthrough levels are also listed.
Breakthrough of PCE and TCE did not occur, even though the columns were run for about 200,000 bed volumes for the 7.5 min EBCT column. This is the equivalent of about 3 years of operation at the full scale. Breakthrough to 10% and 50% was achieved for six other compounds and thus CUR could be calculated. The CURs were highest for 1,1 DCA and 1,2 DCA at about 0.25 lbs/1000 gals treated. The CURs for the other six cVOCs were less than 0.10 lbs/1000 gals treated and for 1,2,3 TCP, PCE and TCE the CURs were less than 0.04 lbs/1000 gals treated. In most, but not all cases increasing EBCT to 15 min in all three waters studied yielded breakthrough at earlier throughput and thus higher CURs, especially for the strongly adsorbing compounds. CUR values below 0.10 lbs/1000 gals treated are often considered to be economical, but the cost associated with these CURs needs to be compared with that of other treatment technologies.
Comparison of the throughput to 10% breakthrough predicted by the PSDM (Figures 3.1, 3.2, and 3.3) for single solutes and that measured for the RSSCT (Figures 3.5, 3.6 and 3.7), yielded the relationship shown in Figure 3.8. Over the 10,000 to 200,000 bed volume range a linear correlation with a slope of 0.50 was found (R2=0.91, n=11). Over the 10,000 to 100,000 bed volume range a linear correlation with a slope of 0.70 was found (R2=0.93, n=8). This indicates that the presence of co-solutes and DOM leads to a 30 to 50% reduction in capacity, depending on the adsorption capacity for a given compound. The impact of co-solutes without DOM present was found to reduce the throughput by about 12% based on the PSDM results (Figures 3.1, 3.2, and 3.3). The PSDM cannot be run with both DOM and co-solutes. This would indicate that most of the lost adsorption capacity is caused by DOM and not co-solutes. However, this is not a strong argument, but only based on indirect analysis. In addition, the RSSCT over-predicts the adsorption capacity compared to full-scale columns, thus this analysis may not hold true at the full-scale.31
©2015 Water Research Foundation. ALL RIGHTS RESERVED.

25
Figure 3.5 Normalized breakthrough of DOC, 1,1 DCA, 1,2 DCP, and 1,2,3 TCP in CO II at 7.5 min and 15 min EBCTs (RSSCT 1)
Figure 3.6 Normalized breakthrough of DOC, 1,1,2,2 TCA, 1,1,1,2 TCA, and PCE in CO II at 7.5 min and 15 min EBCTs (RSSCT 3)
0
0.5
1
1.5
2
2.5
3
0 50,000 100,000 150,000 200,000 250,000 300,000
No
rmal
ized
Co
nce
ntr
atio
n, C
/C0
Throughput (Bed volumes)
1,1 DCA (7.5) 1,2 DCP (7.5)1, 2,3 TCP (7.5) 1,1 DCA (15)1,2 DCP (15) 1,2,3 TCP (15)DOC (7.5) DOC (15)
0
0.5
1
1.5
0 50,000 100,000 150,000 200,000 250,000
No
rmal
ized
Co
nce
ntr
atio
n, C
/C0
Throughput (Bed volumes)
1,1,2,2 TCA (7.5) 1,1,1,2 TCA (7.5)PCE (7.5) 1,1,2,2 TCA (15)1,1,1,2 TCA (15) PCE (15)
©2015 Water Research Foundation. ALL RIGHTS RESERVED.
26
Figure 3.7 Normalized breakthrough of 1,2 DCA, CT, and TCE in CO II at 7.5 min and 15 min EBCTs (RSSCT 4)
0.0
0.2
0.4
0.6
0.8
1.0
1.2
1.4
1.6
1.8
2.0
0 50,000 100,000 150,000 200,000
No
rmal
ized
Co
nce
ntr
atio
n, C
/C0
Throughput (Bed volumes)
1,2 DCA (7.5) CT (7.5) TCE (7.5)1,2 DCA (15) CT (15) TCE (15)
©2015 Water Research Foundation. ALL RIGHTS RESERVED.

27
Table 3.1 Throughput and carbon use rates to 10% breakthrough (one year of operation at the full scale is about 35,000 bed volumes at an EBCT of 15 min and 70,000 bed volumes at
an EBCT of 7.5 min)
Compound Run Water DOC Conc. (mg/L)
Throughput1 (Bed Volumes)
Carbon Use Rate (lbs/1000 gal)
Throughput Difference between
7.5 and 15 min EBCT2
7.5 min
EBCT 15 min EBCT
7.5 min EBCT
15 min EBCT
Bed Volumes
Percent
1,1 DCA 1 CO II 1.6 16,000 13,000 0.227 0.279 3,000 19
1,2 DCP 1 CO II 1.6 42,000 38,000 0.086 0.095 4,000 10
1,2,3 TCP 1 CO II 1.6 109,000 86,000 0.033 0.042 23,000 21
1,1,1,2 TCA 3 CO II 1.6 64,000 64,000 0.057 0.057 0 0
1,1,2,2 TCA 3 CO II 1.6 - - - -
PCE 3 CO II 1.6 >219,000 >109,000 <0.017 <0.033
1,2 DCA 4 CO II 1.6 14,000 14,000 0.259 0.259 0 0
CT 4 CO II 1.6 56,000 60,000 0.065 0.060 -4,000 -7
TCE 4 CO II 1.6 >186,000 >89,000 <0.019 <0.041
1,2 DCA - SS
C0 = 53 g/L 5 CO I 0.3 14,000 13,000 0.259 0.279 1,000 7
C0 = 4.3 g/L 6 CO I 0.3 21,000 21,000 0.173 0.173 0 0
C0 = 0.4 g/L 7 CO I 0.3 25,000 23,000 0.145 0.158 8
C0 = 0.1 g/L 8 CO I 0.3 25,000 26,000 0.145 0.139 -1,000 -4
1,1 DCA 9 FL GW 3.5 13,000 10,000 0.279 0.363 3,000 23
1,2 DCP 9 FL GW 3.5 36,000 >22,000 0.101 <0.165
1,2,3 TCP 9 FL GW 3.5 >48,000 >22,000 <0.076 <0.165
1,1 DCA 10 FL DIL 1.6 5600 6,300 0.604 0.575 -700 -12
1,2 DCP 10 FL DIL 1.6 31,000 21,000 0.118 0.173 10,000 32
1,2,3 TCP 10 FL DIL 1.6 ~53,000 >26,000 ~0.068 <0.139
1 rounded to the nearest 1000 bed volumes 2 decrease in bed volumes from EBCT of 7 min to EBCT of 15 min
3 1,1,2,2 TCA degraded during the run, and breakthrough and CURs could not be calculated
SS – single solute in DOM
©2015 Water Research Foundation. ALL RIGHTS RESERVED.

28
Table 3.2 Throughput and carbon use rates to 50% breakthrough (one year of operation at the full scale is about 35,000 bed volumes at an EBCT of 15 min and 70,000 bed volumes at
an EBCT of 7.5 min)
Compound Run Water DOC Conc. (mg/L)
Throughput1 (Bed Volumes)
Carbon Use Rate (lbs/1000 gal)
Throughput Difference between
7.5 and 15 min EBCT2
7.5 min
EBCT 15 min EBCT
7.5 min EBCT
15 min EBCT
Bed Volumes
Percent
1,1 DCA 1 CO II 1.6 17,000 16,000 0.213 0.227 1,000 6
1,2 DCP 1 CO II 1.6 49,000 44,000 0.074 0.082 5,000 10
1,2,3 TCP 1 CO II 1.6 136,000 105,000 0.027 0.035 31,000 23
1,1,1,2 TCA 3 CO II 1.6 89,000 86,000 0.041 0.042 3,000 3
1,1,2,2 TCA 3 CO II 1.6 - - - - -
PCE 3 CO II 1.6 >219,000 >109,000 <0.017 <0.033
1,2 DCA 4 CO II 1.6 17,000 15,000 0.213 0.242 2,000 12
CT 4 CO II 1.6 75,000 76,000 0.048 0.048 -1,000 -1
TCE 4 CO II 1.6 >186,000 >89,000 <0.019 <0.041
1,2 DCA - SS
C0 = 53 g/L 5 CO I 0.3 15,000 14,000 0.242 0.259 1,000 7
C0 = 4.3 g/L 6 CO I 0.3 23,000 24,000 0.158 0.151 -1,000 -4
C0 = 0.4 g/L 7 CO I 0.3 25,000 >24,000 0.145 <0.151
C0 = 0.1 g/L 8 CO I 0.3 28,000 29,000 0.129 0.125 -1,000 -4
1,1 DCA 9 FL GW 3.5 17,000 12,000 0.213 0.302 5,000 29
1,2 DCP 9 FL GW 3.5 46,000 >20,000 0.079 <0.181 -
1,2,3 TCP 9 FL GW 3.5 >48,000 >20,000 <0.076 <0.181
1,1 DCA 10 FL DIL 1.6 11,000 10,000 0.330 0.362 1,000 9
1,2 DCP 10 FL DIL 1.6 32,000 24,000 0.113 0.151 8,000 25
1,2,3 TCP 10 FL DIL 1.6 >52,000 >26,000 <0.070 <0.139
1 rounded to the nearest 1000 bed volumes 2 decrease in bed volumes from EBCT of 7 min to EBCT of 15 min
3 1,1,2,2 TCA degraded during the run, and breakthrough and CURs could not be calculated
SS – single solute in DOM
©2015 Water Research Foundation. ALL RIGHTS RESERVED.
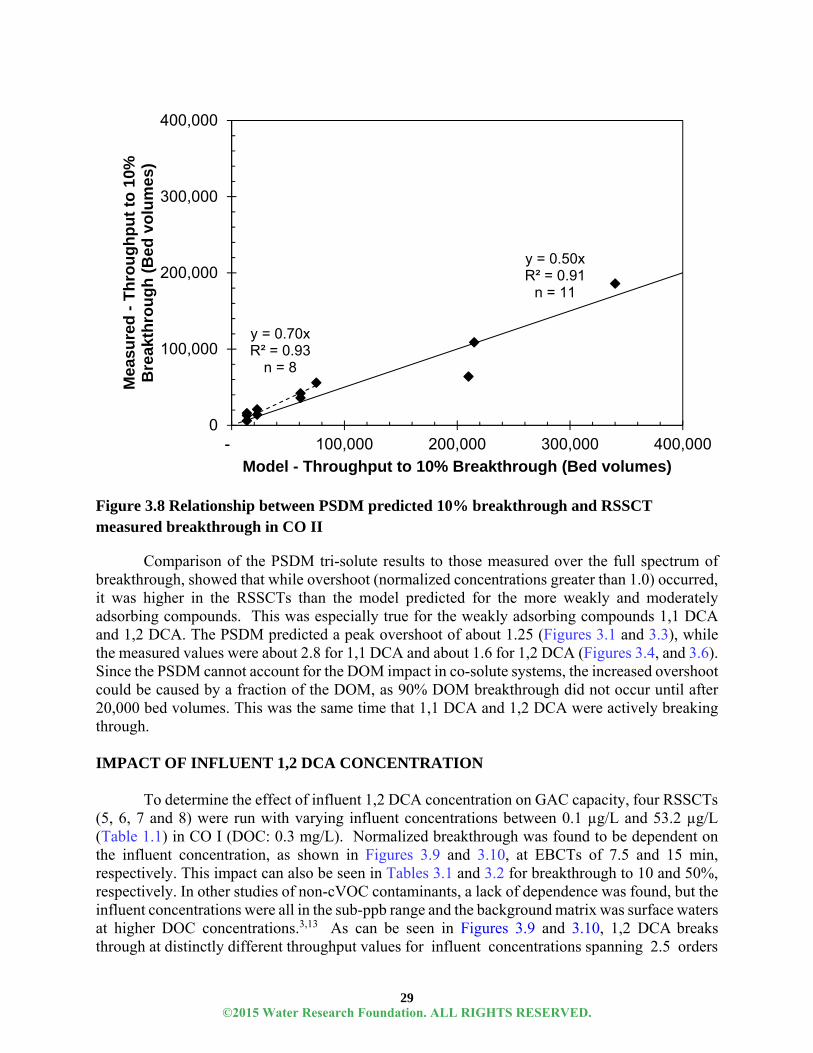
29
y = 0.50xR² = 0.91
n = 11
y = 0.70xR² = 0.93
n = 8
0
100,000
200,000
300,000
400,000
- 100,000 200,000 300,000 400,000
Mea
sure
d -
Th
rou
gh
pu
t to
10%
B
reak
thro
ug
h (
Bed
vo
lum
es)
Model - Throughput to 10% Breakthrough (Bed volumes)
Figure 3.8 Relationship between PSDM predicted 10% breakthrough and RSSCT measured breakthrough in CO II
Comparison of the PSDM tri-solute results to those measured over the full spectrum of breakthrough, showed that while overshoot (normalized concentrations greater than 1.0) occurred, it was higher in the RSSCTs than the model predicted for the more weakly and moderately adsorbing compounds. This was especially true for the weakly adsorbing compounds 1,1 DCA and 1,2 DCA. The PSDM predicted a peak overshoot of about 1.25 (Figures 3.1 and 3.3), while the measured values were about 2.8 for 1,1 DCA and about 1.6 for 1,2 DCA (Figures 3.4, and 3.6). Since the PSDM cannot account for the DOM impact in co-solute systems, the increased overshoot could be caused by a fraction of the DOM, as 90% DOM breakthrough did not occur until after 20,000 bed volumes. This was the same time that 1,1 DCA and 1,2 DCA were actively breaking through.
IMPACT OF INFLUENT 1,2 DCA CONCENTRATION
To determine the effect of influent 1,2 DCA concentration on GAC capacity, four RSSCTs (5, 6, 7 and 8) were run with varying influent concentrations between 0.1 µg/L and 53.2 µg/L (Table 1.1) in CO I (DOC: 0.3 mg/L). Normalized breakthrough was found to be dependent on the influent concentration, as shown in Figures 3.9 and 3.10, at EBCTs of 7.5 and 15 min, respectively. This impact can also be seen in Tables 3.1 and 3.2 for breakthrough to 10 and 50%, respectively. In other studies of non-cVOC contaminants, a lack of dependence was found, but the influent concentrations were all in the sub-ppb range and the background matrix was surface waters at higher DOC concentrations.3,13 As can be seen in Figures 3.9 and 3.10, 1,2 DCA breaks through at distinctly different throughput values for influent concentrations spanning 2.5 orders
©2015 Water Research Foundation. ALL RIGHTS RESERVED.
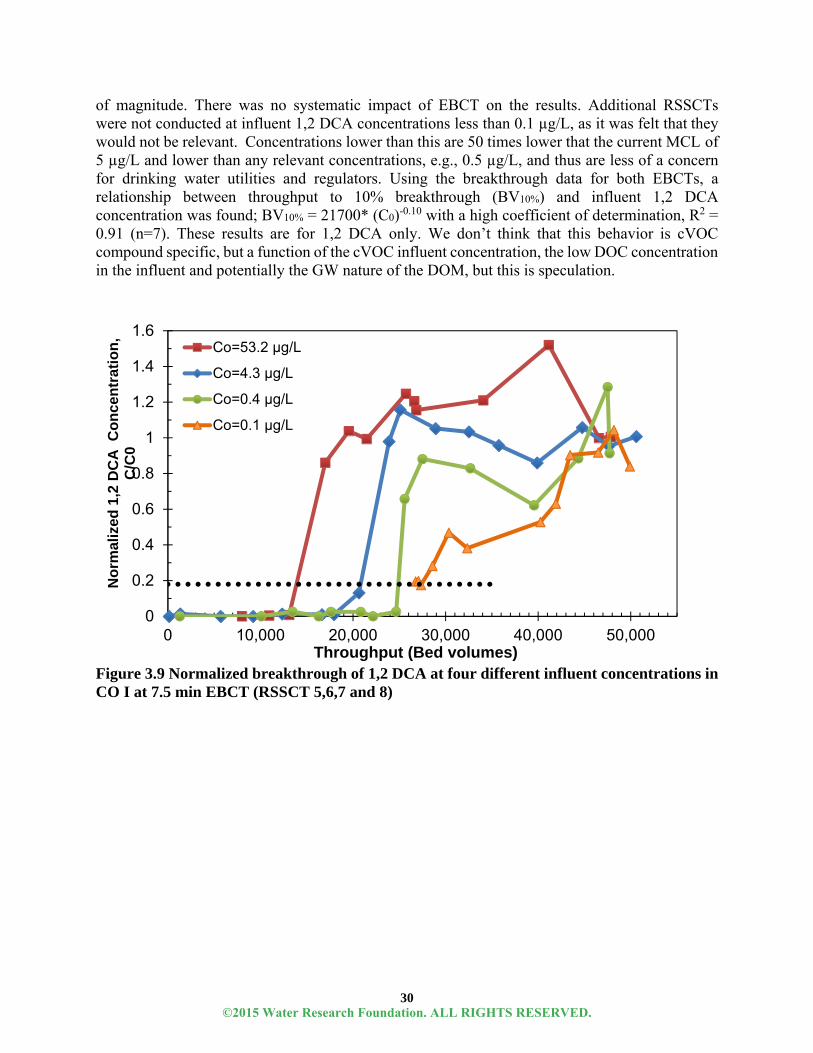
30
of magnitude. There was no systematic impact of EBCT on the results. Additional RSSCTs were not conducted at influent 1,2 DCA concentrations less than 0.1 µg/L, as it was felt that they would not be relevant. Concentrations lower than this are 50 times lower that the current MCL of 5 µg/L and lower than any relevant concentrations, e.g., 0.5 µg/L, and thus are less of a concern for drinking water utilities and regulators. Using the breakthrough data for both EBCTs, a relationship between throughput to 10% breakthrough (BV10%) and influent 1,2 DCA concentration was found; BV10% = 21700* (C0)-0.10 with a high coefficient of determination, R2 = 0.91 (n=7). These results are for 1,2 DCA only. We don’t think that this behavior is cVOC compound specific, but a function of the cVOC influent concentration, the low DOC concentration in the influent and potentially the GW nature of the DOM, but this is speculation.
Figure 3.9 Normalized breakthrough of 1,2 DCA at four different influent concentrations in CO I at 7.5 min EBCT (RSSCT 5,6,7 and 8)
0
0.2
0.4
0.6
0.8
1
1.2
1.4
1.6
0 10,000 20,000 30,000 40,000 50,000
No
rmal
ized
1,2
DC
A
Co
nce
ntr
atio
n,
C/C
0
Throughput (Bed volumes)
Co=53.2 µg/L
Co=4.3 µg/L
Co=0.4 µg/L
Co=0.1 µg/L
©2015 Water Research Foundation. ALL RIGHTS RESERVED.

31
Figure 3.10 Normalized breakthrough of 1,2 DCA at four different influent concentrations in CO I at 15 min EBCT (RSSCT 5,6,7 and 8)
IMPACT OF DOM TYPE AND CONCENTRATION
The impact of DOM type was explored by diluting the FL GW from a DOC concentration of 3.5 mg/L to that of the CO II, 1.6 mg/L, and then spiking with 1,1 DCA , 1,2 DCP and 1,2,3 TCP (RSSCT 10). The DOC, 1,1 DCA , 1,2 DCP and 1,2,3 TCP breakthrough in CO II and FL DIL at 7.5 and 15 min EBCTs are shown in Figures 3.11 and 3.12, respectively and summarized in Table 3.1 and 3.2 for 10% and 50% breakthrough, respectively. One aberrant data set for FL DIL at an EBCT of 7.5 min at a throughput of 26,300 bed volumes was not reported on the figure. The influent values equaled the effluent values, for 1,1 DCA, 1,2 DCP and 1,2,3 TCP, indicating that the influent sample was analyzed for both the influent and effluent samples.
As shown in Figure 3.4, the DOC breakthrough for CO II and FL DIL at both EBCTs are similar, indicating similar DOM type with respect to overall adsorption. Even though the influent DOC concentrations were the same and the DOC breakthrough behavior was similar for the two waters, all three cVOCs broke through earlier in the FL DIL water, as shown in Figures 3.11 and 3.12 and summarized at 10% and 50% breakthrough in Tables 3.1 and 3.2, respectively. Thus the type of DOM in FL DIL had more of a negative impact on the breakthrough of 1,1 DCA, 1,2 DCP and 1,2,3 TCP, compared to that in the CO II. The SUVA of the FL DIL was 80% higher than that of CO II, which may have caused more competition with the three cVOCs.
Compared to that at an EBCT of 7.5 min, 1,1 DCA and 1,2 DCP in the FL DIL water broke through earlier at an EBCT of 15 min by -12% and 30%, respectively, at the 10% breakthrough point and by 9% and 25%, respectively, at the 50% breakthrough point . The 1,1 DCA, 1,2 DCP and 1,2,3 TCP 10% breakthrough in CO II at an EBCT of 15 min also occurred at an earlier throughput compared to that at an EBCT of 7.5 min (Tables 3.1 and 3.2). The 1,1 DCA,
0
0.2
0.4
0.6
0.8
1
1.2
1.4
1.6
0 5,000 10,000 15,000 20,000 25,000 30,000 35,000
No
rmal
ized
1,2
DC
A
Co
nce
ntr
atio
n,
C/C
0
Throughput (Bed Volumes)
Co=53.2 µg/L
Co=4.3 µg/L
Co=0.4µg/L
Co=0.1 µg/L
©2015 Water Research Foundation. ALL RIGHTS RESERVED.
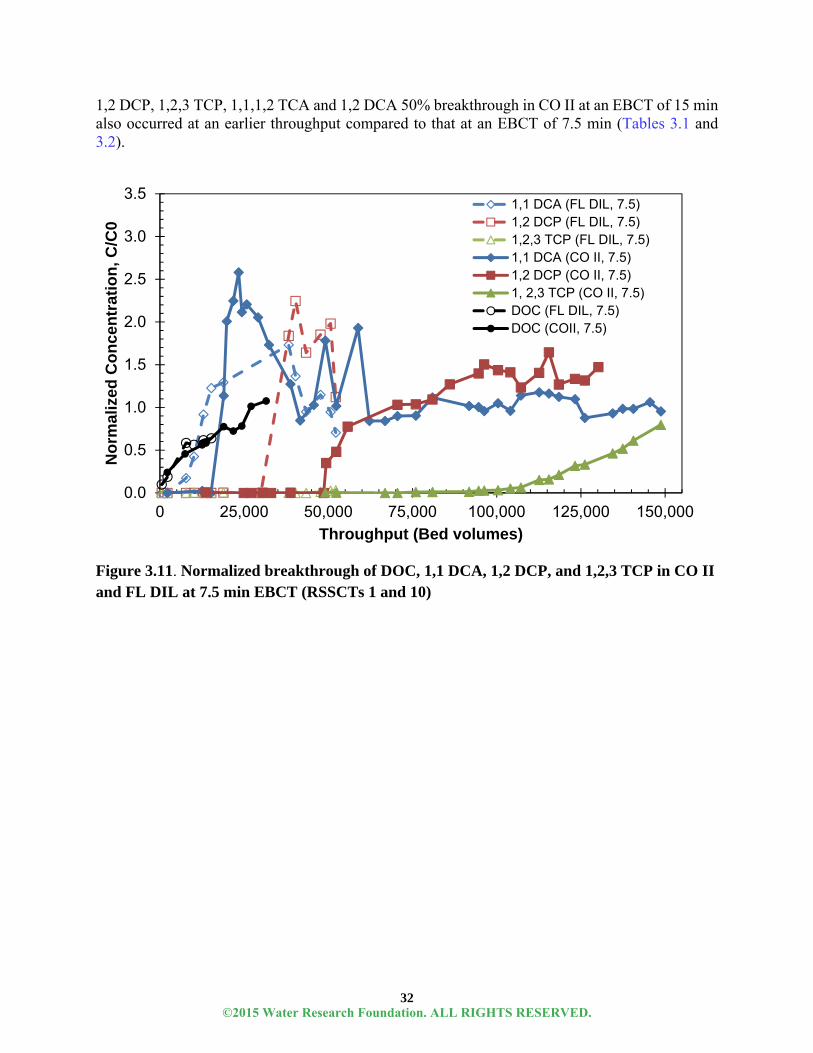
32
1,2 DCP, 1,2,3 TCP, 1,1,1,2 TCA and 1,2 DCA 50% breakthrough in CO II at an EBCT of 15 min also occurred at an earlier throughput compared to that at an EBCT of 7.5 min (Tables 3.1 and 3.2).
Figure 3.11. Normalized breakthrough of DOC, 1,1 DCA, 1,2 DCP, and 1,2,3 TCP in CO II and FL DIL at 7.5 min EBCT (RSSCTs 1 and 10)
0.0
0.5
1.0
1.5
2.0
2.5
3.0
3.5
0 25,000 50,000 75,000 100,000 125,000 150,000
No
rmal
ized
Co
nce
ntr
atio
n, C
/C0
Throughput (Bed volumes)
1,1 DCA (FL DIL, 7.5)1,2 DCP (FL DIL, 7.5)1,2,3 TCP (FL DIL, 7.5)1,1 DCA (CO II, 7.5)1,2 DCP (CO II, 7.5)1, 2,3 TCP (CO II, 7.5)DOC (FL DIL, 7.5)DOC (COII, 7.5)
©2015 Water Research Foundation. ALL RIGHTS RESERVED.

33
Figure 3.12 Normalized breakthrough of DOC, 1,1 DCA, 1,2 DCP, and 1,2,3 TCP in CO II and FL DIL at 15 min EBCT (RSSCTs 1 and 10)
The impact of DOM concentration was explored by comparing the results from the FIL DIL (DOC = 1.6 mg/L) RSSCT (RSSCT 10) to that of the undiluted FL GW (DOC = 3.5 mg/L) RSSCT (RSSCT 9) for 1,1 DCA, 1,2 DCP and 1,2,3 TCP. The DOC, 1,1 DCA , 1,2 DCP and 1,2,3 TCP breakthrough in FL GW and FL DIL at 7.5 and 15 min EBCTs are shown in Figures 3.13 and 3.14, respectively and summarized in Tables 3.1 and 3.2 for 10% and 50% breakthrough, respectively. One aberrant data set for FL GW at an EBCT of 15 min at a throughput of 15,500 bed volumes was not reported on the figure. The influent values equaled the effluent values, for 1,1 DCA, 1,2 DCP, and 1,2,3 TCP, indicating that the influent sample was analyzed for both the influent and effluent samples. A similar case was also found for FIL DIL, as discussed above.
As shown in Figure 3.4, the DOC breakthrough for FL GW occurs earlier than that for FL DIL at both EBCTs. This is expected as the DOC concentration for FL GW is higher. Even though the influent DOC concentration was higher for FL GW and the DOC broke through earlier, 1,1 DCA and 1,2 DCP broke through earlier in the FL DIL water, as shown in Figures 3.13 and 3.14 and summarized at 10% and 50% breakthrough in Tables 3.1 and 3.2, respectively. Thus, the DOM in FL DIL had more of a negative impact on the breakthrough of 1,1 DCA, and 1,2 DCP, compared to that in the FL GW. The SUVA and influent DOC of the FL GW was 20% and 120%, respectively higher than that of FL DIL, which by conventional wisdom would have caused the cVOCs to breakthrough earlier due to more adsorption competition with the DOM. However, that was not the case in this study.
0.000
0.500
1.000
1.500
2.000
2.500
3.000
3.500
0 25,000 50,000 75,000 100,000 125,000 150,000
No
rmal
ized
Co
nce
ntr
atio
n, C
/C0
Throughput (Bed volumes)
1,1 DCA (FL DIL, 15)1,2 DCP (FL DIL, 15)1,2,3 TCP (FL DIL, 15)1,1 DCA (CO II, 15)1,2 DCP (CO II, 15)1,2,3 TCP (CO II, 15)DOC (FL DIL, 15)DOC (COII, 15)
©2015 Water Research Foundation. ALL RIGHTS RESERVED.

34
IMPACT OF CO-SOLUTE ON 1,2 DCA BREAKTHROUGH
If at a high enough concentration, the presence of co-solutes can have a negative impact on the breakthrough of the target compound, even if the target compound is more strongly adsorbed.2 The impact of the presence of the co-solutes in the DOM was explored by comparing the breakthrough results of 1,2 DCA in the tri-solute mix of 1,2 DCA, CT and TCE (RSSCT 4) with that of 1,2 DCA as a single solute in DOM (RSSCT 6). As shown in Figure 3.15 no measurable impact was found. The data analysis is complicated, as the tri-solute mix of 1,2 DCA, CT and TCE (RSSCT 4) was run in CO II at a DOC concentration of 1.6 mg/L, while that for 1,2 DCA as a single solute in DOM (RSSCT 6) was run in CO I at a DOC concentration of 0.3 mg/L. The expectation would be that 1,2 DCA in the single solute run in the lower DOC concentration water (RSSCT 6) would breakthrough later than that with the tri-solute mix in the higher DOC concentration water (RSSCT 4). However, that was not the case.
Figure 3.13 Normalized breakthrough of DOC, 1,1 DCA, 1,2 DCP, and 1,2,3 TCP in FL GW and FL DIL at 7.5 min EBCT (RSSCTs 9 and 10)
0
0.5
1
1.5
2
2.5
0 10,000 20,000 30,000 40,000 50,000 60,000
No
rmal
ized
Co
nce
ntr
atio
n, C
/C0
Throughput (Bed volumes)
1,1 DCA (FL GW, 7.5)1,2 DCP (FL GW, 7.5)1,2,3 TCP (FL GW, 7.5)1,1 DCA (FL DIL, 7.5)1,2 DCP (FL DIL, 7.5)1,2,3 TCP (FL DIL, 7.5)DOC (FL GW, 7.5)DOC (FL DIL, 7.5)
©2015 Water Research Foundation. ALL RIGHTS RESERVED.
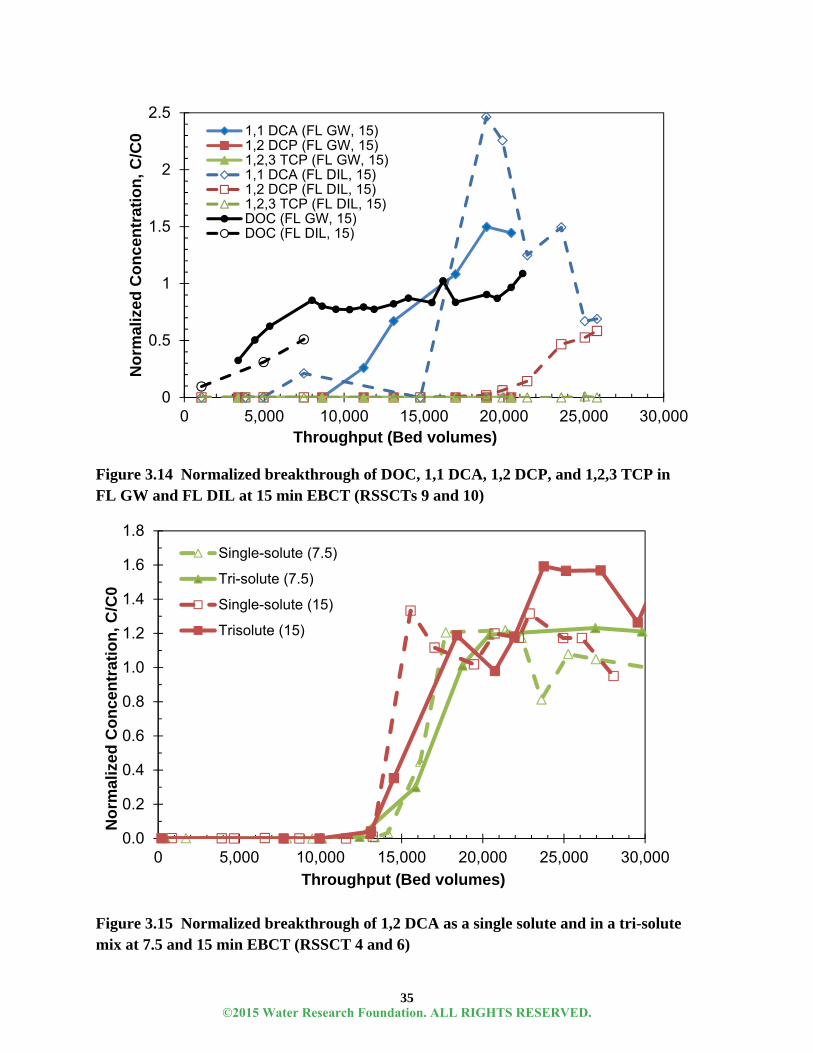
35
0
0.5
1
1.5
2
2.5
0 5,000 10,000 15,000 20,000 25,000 30,000
No
rmal
ized
Co
nce
ntr
atio
n, C
/C0
Throughput (Bed volumes)
Figure 3.14 Normalized breakthrough of DOC, 1,1 DCA, 1,2 DCP, and 1,2,3 TCP in FL GW and FL DIL at 15 min EBCT (RSSCTs 9 and 10)
1,1 DCA (FL GW, 15)1,2 DCP (FL GW, 15)1,2,3 TCP (FL GW, 15)1,1 DCA (FL DIL, 15)1,2 DCP (FL DIL, 15)1,2,3 TCP (FL DIL, 15)DOC (FL GW, 15)DOC (FL DIL, 15)
0.0
0.2
0.4
0.6
0.8
1.0
1.2
1.4
1.6
1.8
0 5,000 10,000 15,000 20,000 25,000 30,000
No
rmal
ized
Co
nce
ntr
atio
n, C
/C0
Throughput (Bed volumes)
Figure 3.15 Normalized breakthrough of 1,2 DCA as a single solute and in a tri-solute mix at 7.5 and 15 min EBCT (RSSCT 4 and 6)
Single-solute (7.5)
Tri-solute (7.5)
Single-solute (15)
Trisolute (15)
©2015 Water Research Foundation. ALL RIGHTS RESERVED.

36
SCALE-UP REVIEW
Scaling up RSSCT data to predict full-scale data is difficult. In environmental waters containing a background matrix of DOM, the RSSCT over predicts full-scale column capacity due to fouling by DOM.3 The degree of fouling was found to be dependent upon the carbon particle diameter (not the ratio of carbon particle sizes in the small and large columns); therefore neither of two available designs of the RSSCT PD or CD, can be expected to match full-scale carbon performance and a correction factor should be applied.3 Although GAC particle sizes exhibit the same overall surface area, Corwin found that the surface area blocked behind a large particle pore was greater than that behind a small particle pore.3 Therefore, overall capacity is reduced more in the larger GAC particles. Corwin created the fouling index (FI), trying to address this phenomenon. The FI is a function of the RSSCT scaling factor (i.e., ratio of the diameters of full-scale GAC to the RSSCT GAC) raised to some fouling factor, Y. The fouling factor was not found to be related to the specific contaminant but rather the ratio of the concentrations of contaminant to DOM.3 The FI corrects the throughput of a column using a smaller GAC particle to predict the capacity of a second, larger GAC particle size column. The throughput of a full-scale adsorber can be predicted with equation 3.1.
FI . 3.1
Where throughput is measured in number of bed volumes passed until the treatment objective is exceeded, and FI is the scaling factor (SF) raised to a fouling factor, Y. The scaling factor is the ratio of GAC particle diameters in the larger and smaller columns. The FI is represented by equation 3.2.
FI SFdiameter
diameter . 3.2
The FI can be determined visually by adjusting the Y value until the RSSCT throughput matches the full-scale adsorber. This approach requires two RSSCTs using different sized GAC particles to obtain the Y factor.
Attempts using the target organic’s octanol-water partition coefficient have been made to predict the fouling factor without conducting multiple RSSCTs.30 Other work however, has shown the fouling factor is dependent upon the contaminant. Preliminary work by Kennedy13 and Fotta30 found a relationship between the Y factor and the adsorbate’s octanol-water partition coefficient (Kow). Fotta found a relationship for cVOCs with log Kow values between 1.5 and 3.2.30 Eqn. 3.3 was developed to determine the Y factor to apply to RSSCT cVOC data to accurately predict full-scale column breakthrough.
0.105 0.218 .3.3
Expanding upon this and using the parameters of the target organic’s pH dependent
octanol-water partition coefficient (log D), the ratio of the target organic concentration to the TOC concentration, and the RSSCT throughput to 10% breakthrough, Kennedy developed a regression
©2015 Water Research Foundation. ALL RIGHTS RESERVED.

37
equation to predict Y values.31 Results from 73 RSSCT breakthrough curves, both VOCs and other compounds, were used in the development of the equation 3.4 (R2=0.68).
2.59 3.94 ∗ 7.87 ∗ % 0.402 ∗
4.2 ∗ 10 ∗∗ % 2.86 ∗ 10 ∗ % ∗ . . 3.4
MP stands for the micropollutant, or target organic.
Kempisty developed a relationship for cVOCs and RSSCTs with a proportional diffusivity design.13 The regression is shown as equation 3.5.
0.13 ∗.
0.76; 12 . 3.5
While the R2 value for the volatile/PD-RSSCT regression is high, the limited number of data points, 12, used to create it results in an unreasonably large 95% confidence interval (predicted breakthrough to 50% occurring between ~1300 and 13000 bed volumes).
Application of equations 3.4 and 3.5 to an independent data set for 1,2 DCA is shown in Figure 3.16.13 Both scale up equations predict earlier breakthrough than that measured. Reliable scale up of cVOC data is not yet possible based on the limited number of paired field- and lab-scale runs. Only two studies have been conducted and more paired data are needed before any conclusions can be made.
©2015 Water Research Foundation. ALL RIGHTS RESERVED.

38
Figure 3.16 Application of predicted and simulated Y values from the Kennedy and Kempisty regressions to scale-up RSSCT results for 1,2 DCA breakthrough. Dotted lines represent 95% CI around the Kennedy regression; dashed lines represent 95% CI around the Kempisty regression; CO GW II (TOC: 1.5 mg/L), EBCT: 15 min.13
0
0.2
0.4
0.6
0.8
1
1.2
1.4
0 2000 4000 6000 8000 10000 12000 14000 16000 18000
Norm
alized 1,2
DCA
Concentra
on ( C/C
0)
Throughput (Bed Volumes)
dp = 0.49 mm dp = 0.11 mm Kempisty Simula on 95% CI Kennedy Predic on 95% CI
©2015 Water Research Foundation. ALL RIGHTS RESERVED.

39
CHAPTER 4 CONCLUSIONS
The overall goal of this project was to assess the feasibility of GAC for the treatment of cVOC to sub-µg/L levels. The objectives of each task were:
Task I - determine carbon use rates (CURs) at EBCTs of 7.5 min and 15 min for
the cVOCs in a GW, Task II - address: (a) a threshold where cVOC breakthrough normalized to the
influent cVOC concentration is independent of the influent cVOC concentration for one cVOC, (b) the effects of GW DOM type and concentration on breakthrough of three cVOCs, and (c) competitive effects between two commonly co-occurring cVOCs in GW on cVOC breakthrough, and
Task III - review scale-up method analysis addressing the current understanding and procedures associated with accurate scale-up.
The specific cVOCs evaluated were: carbon tetrachloride (CT), 1,2-dichloroethane (1,2 DCA), 1,2-dichloropropane (1,2 DCP), tetrachloroethylene (PCE), trichloroethylene (TCE), 1,1-dichloroethane (1,1 DCA), 1,1,2,2-tetrachloroethane (1,1,2,2 TCA), 1,1,1,2-tetrachloroethane (1,1,1,2 TCA) and 1,2,3-trichloropropane (1,2,3 TCP). A baseline influent concentration of 5 µg/L was used. The evaluation of benzene, dichloromethane (DCM) and 1,3- butadiene (1,3 BD) was initially proposed, but spiking issues precluded their use and evaluation. TASK I
Breakthrough of PCE and TCE did not occur, even though the columns were run for about 200,000 bed volumes for the 7.5 min EBCT column. This is the equivalent of about 3 years of operation at the full scale. Breakthrough to 10% and 50% was achieved for six compounds and thus CUR values could be calculated. The CUR values were highest for 1,1 DCA and 1,2 DCA at about 0.25 lbs/1000 gals treated. The CUR values for the other six cVOCs were less than 0.10 lbs/1000 gals treated and for 1,2,3 TCP, PCE and TCE the CUR values were less than 0.04 lbs/1000 gals treated. 1,1,2,2 TCA degraded during the run, and breakthrough and CURs could not be calculated. In most, but not all cases increasing EBCT to 15 min in all three waters studied yielded breakthrough at earlier throughput and thus higher CURs, especially for the strongly adsorbing compounds. CUR values below 0.10 lbs/1000 gals treated are often considered to be economical, but the cost associated with these CURs needs to be compared to that of other treatment technologies.
TASK II A
The influent 1,2 DCA concentration, C0, was varied from 0.1 µg/L to 53.2 µg/L in four RSSCTs. Breakthrough with the effluent concentration normalized to the influent concentration, was found to be dependent on influent concentration at both EBCTs. In other studies a lack of dependence was found, but the influent concentrations in these studies were all in the sub-ppb range and the background matrices were surface waters at higher dissolved organic carbon (DOC)
©2015 Water Research Foundation. ALL RIGHTS RESERVED.
40
concentrations. Additional RSSCTs were not conducted at influent concentrations less than 0.1 µg/L. Concentrations lower than this are well below the current maximum contaminant level of 5 µg/L and the target effluent being considered, 0.5 µg/L, and thus are less of a concern for drinking water utilities. This finding complicates the use of a single adsorption run to predict the breakthrough behavior at other C0s.
TASK II B
Compared to cVOC breakthrough in CO II, the higher DOC and SUVA FL GW yield earlier breakthrough for 1,1DCA and 1,2 DCP. Breakthrough of 1,2,3 TCP did not occur in the FL GW. Comparison of 1,1DCA, 1,2 DCP and 1,2,3 TCP breakthrough in CO II and FL DIL, operated at the same influent DOC concentration, showed earlier breakthrough for all three cVOCs in the FL DIL, which was attributed to the 80% higher SUVA values of the FL DIL DOM. However, comparison of the FL GW and FL DIL cVOC results also showed earlier breakthrough for 1,1DCA and 1,2 DCP in the FL DIL. This was not expected as both the influent DOC concentration and SUVA values of FL DW were higher, which was expected to yield earlier breakthrough. No explanation for this behavior is apparent.
TASK II C
The negative impact of DOM on the breakthrough of 1,2 DCA was greater than that of the presence of two co-solutes, CT and TCE.
TASK III
The results from RSSCTs are known to over-predict GAC performance. More paired cVOC data at the bench- and field- (-pilot or -full) is needed before adequate scale-up equations can be developed which will decrease the uncertainty of full-scale predictions.
©2015 Water Research Foundation. ALL RIGHTS RESERVED.

41
REFERENCES
1. AWWA (American Water Works Association). AWWA Treatment Technology Workshop for Carcinogenic VOCs. October 2011. Washington D.C.
2. Sontheimer, H., J. Crittenden, and R. Summers. Activated Carbon for Water Treatment, 2nd ed. (Karlsruhe, Germany: DVGW-Forschungsstelle, 1988).
3. Corwin, C.J., and R.S. Summers. "Scaling Trace Organic Contaminant Adsorption Capacity by Granular Activated Carbon," Environ. Sci. Technol. 44, no. 14 (June 2010): 5403–5408.
4. Kilduff, J.E., T. Karanfil, and W.J. Weber. "Competitive Effects of Nondisplaceable Organic Compounds on Trichloroethylene Uptake by Activated Carbon. II. Model Verification and Applicability to Natural Organic Matter," J. Colloid. Interface Sci. 205, no. 2 (September 1998): 280–289.
5. Li, Q., V.L. Snoeyink, B.J. Mariãas, and C. Campos. "Elucidating Competitive Adsorption Mechanisms of Atrazine and NOM Using Model Compounds," Water Research 37, no. 4 (February 2003): 773–784.
6. EPA (U.S. Environmental Protection Agency). 2011. 40 CFR 300.430, 4. C. Remedial Investigation/Feasibility Study and Selection of Remedy. Fed. Reg. 41(1): 66-77.
7. Berrigan, J.K. Scale up of Rapid Small Scale Adsorption Tests to Field Scale Adsorbers: Theoretical and Experimental Basis. EPA/600/2-86/086, NTIS PB87103594. (Washington, D.C.: U.S. Environmental Protection Agency, 2004).
8. Crittenden, J.C., J.K. Berrigan, D.W. Hand, and B. Lykins. "Design of Rapid Fixed-Bed Adsorption Tests for Nonconstant Diffusivities," Journal of Environmental Engineering 113, no. 2 (April 1987): 243–259.
9. Corwin, C.J., and R.S. Summers. "Adsorption and Desorption of Trace Organic Contaminants from Granular Activated Carbon Adsorbers After Intermittent Loading and throughout Backwash Cycles," Water Research 45, no. 2 (January 2011): 417–426.
10. Knappe, D., Y. Matsui, and V. Snoeyink. "Predicting the Capacity of Powdered Activated Carbon for Trace Organic Compounds in Natural Waters," Environ. Sci. Technol. 32, no. 11 (April 1998): 1694–1698.
11. Graham, M.R., R.S. Summers, M.R. Simpson, and B.W. Macleod. "Modeling Equilibrium Adsorption of 2-methylisoborneol and Geosmin in Natural Waters," Water Research 34, no. 8 (June 2000): 2291–2300.
©2015 Water Research Foundation. ALL RIGHTS RESERVED.

42
12. Matsui, Y., Y. Fukuda, T. Inoue, and T. Matsushita. "Effect of Natural Organic Matter on Powdered Activated Carbon Adsorption of Trace Contaminants: Characteristics and Mechanism of Competitive Adsorption," Water Research 37, no. 18 (November 2003): 4413–4424.
13. Kempisty, D. "Adsorption of Volatile and Perfluorinated Compounds from Groundwaters using Granular Activated Carbon" (PhD dissertation, University of Colorado - Boulder, 2014).
14. Speth, T.F. "Evaluating Capacities of GAC Preloaded with Natural Water," J. Envir. Engineering 117, no. 1 (January/February 1991): 66–79.
15. Hand, D.W., J.C. Crittenden, H. Arora, J.M. Miller, and B.W.J. Lykins. "Designing Fixed-Bed Adsorbers to Remove Mixtures of Organics," Jour. American Water Works Association 81, no. 1 (January 1989): 67–77.
16. AWWA (American Water Works Association). Water Quality and Treatment: A Handbook on Drinking Water, 6th ed. (Denver, Colo.: American Water Works Association, 2011).
17. Thurman, E.M. "Humic Substances in Groundwater," in Humic Substances in Soil, Sediment, and Water, ed. G.R. Aiken, D.M. McKnight, R.L. Wershaw, and P. MacCarthy, 87–103 (New York: Wiley-Interscience, 1985).
18. Kilduff, J.E., T. Karanfil, Y.P. Chin, and W.J. Weber, Jr. "Adsorption of Natural Organic Polyelectrolytes by Activated Carbon: A Size-Exclusion Chromatography Study," Environ Sci Technol 30, no. 4 (March 1996): 1336–1343.
19. Newcombe, G., M. Drikas, and R. Hayes. "Influence of Characterised Natural Organic Material on Activated Carbon Adsorption: II. Effect on Pore Volume Distribution and Adsorption of 2-methylisoborneol," Water Research 31, no. 5 (May 1997): 1065–1073.
20. Lee, S.-H., W. Nishijima, C.-H. Lee, and M. Okada. "Calcium Accumulation on Activated Carbon Deteriorates Synthetic Organic Chemicals Adsorption," Water Research 37, no. 19 (November 2003): 4631–4636.
21. Jarvie, M., D. Hand, S. Bhuvendralingam, J. Crittenden, and D. Hokanson. "Simulating the Performance of Fixed-Bed Granular Activated Carbon Adsorbers: Removal of Synthetic Organic Chemicals in the Presence of Background Organic Matter," Water Research 39, no. 11 (June 2005): 2407–2421.
22. Hand, D.W., and K. Mertz. 1999. AdDesignS User Manual, 1–126.
©2015 Water Research Foundation. ALL RIGHTS RESERVED.

43
23. Zogorski, J. S., J.M. Carter, T. Ivahnenko, W.W. Lapham, M.J. Moran, B.L. Rowe, P.J. Squillace, and P.L Toccalino. Volatile Organic Compounds in the Nation’s Ground Water and Drinking-Water Supply Wells. (Reston, Va.: U.S. Geological Survey, 2006). http://pubs.usgs.gov/circ/circ1292/pdf/circ1292_front.pdf
24. Li, Q., B.J. Mariñas, V.L. Snoeyink, and C. Campos. "Three-Component Competitive Adsorption Model for Flow-Through PAC Systems. 2. Model Application to a PAC/Membrane System," Environ. Sci. Technol. 37, no. 13 (July 2003): 3005–3011.
25. Crittenden, J.C., P.S. Reddy, H. Arora, J. Trynoski, D.W. Hand, D.L. Perram, and R.S. Summers. "Predicting GAC Performance with Rapid Small-Scale Column Tests," Jour. American Water Works Association 83, no. 1 (January 1991): 77–87.
26. Knappe, D.R.U., V.L. Snoeyink, P. Roche, M.J. Prados, and M.-M. Bourbigot. "The Effect of Preloading on Rapid Small-Scale Column Test Predictions of Atrazine Removal by GAC Adsorbers," Water Research 31, no. 11 (November 1997): 2899–2909.
27. Speth, T.F., and R.J. Miltner. "Technical Note: Adsorption Capacity of GAC for Synthetic Organics," Jour. American Water Works Association 82, no. 2 (February 1990): 72-75.
28. EPA (U.S. Environmental Protection Agency). U.S. ICR Manual for Bench and Pilot Scale Treatment Studies. EPA 814/B-96-003. (Cincinnati, Ohio: Technical Support Division, Office of Ground Water and Drinking Water, U.S. Environmental Protection Agency, 1996).
29. Corwin, C.J. "Trace Organic Contaminant Removal from Drinking Waters by Granular Activated Carbon: Adsorption, Desorption, and the Effect of Background Organic Matter" (PhD Dissertation, University of Colorado - Boulder, 2010).
30. Fotta, M.E. "Effect of Granular Activated Carbon Type on Adsorber Performance and Scale-Up Approaches for Volatile Organic Compound Removal" (master's thesis, North Carolina State University, 2012).
31. Kennedy, A. "Granular Activated Carbon Adsorption of Organic Micropollutants: Scale-Up and Effect of Background Dissolved Organic Matter" (PhD Dissertation, University of Colorado - Boulder, 2013).
32. Zachman, B.A., and R.S. Summers. "Modeling TOC Breakthrough in Granular Activated Carbon Adsorbers," Journal of Environmental Engineering 136, no. 2 (February 2010): 205-210.
©2015 Water Research Foundation. ALL RIGHTS RESERVED.

©2015 Water Research Foundation. ALL RIGHTS RESERVED.

45
ACRONYMS, ABBREVIATIONS, AND SYMBOLS
Compounds
1,1 DCA 1,1-dichloroethane 1,1,1,2 TCA 1,1,1,2-tetrachloroethane 1,1,2,2 TCA 1,1,2,2-tetrachloroethane 1,2 DCA 1,2-dichloroethane 1,2 DCP 1,2-dichloropropane 1,2,3 TCP 1,2,3-trichloropropane 1,3 BD 1,3- butadiene CT carbon tetrachloride DCM dichloromethane PCE tetrachloroethylene TCE trichloroethylene Other BV bed volumes BV50 bed volumes to 50% breakthrough C0 influent concentration CD constant diffusivity CO I Colorado groundwater source I CO II Colorado groundwater source II CURs carbon use rates cVOCs carcinogenic volatile organic contaminants DOC dissolved organic carbon DOM dissolved organic matter EBCT empty bed contact time EPA U.S. Environmental Protection Agency FI fouling index FL DIL diluted Florida groundwater FL GW Florida groundwater GAC granular activated carbon GW groundwater HDPE high density polyethylene
©2015 Water Research Foundation. ALL RIGHTS RESERVED.

46
K* effective Freundlich capacity parameter KF Freundlich capacity coefficient Kow octanol-water partition coefficient MCL maximum contaminant level MGAC mass of carbon 1/n Freundlich power coefficient PD proportional diffusivity q solid phase concentration RSSCT rapid small scale column test SF scaling factor SUVA specific UVA TOC total organic carbon UVA Ultra-violet absorbance X mass micropollutant absorbed to the carbon Y fouling factor
©2015 Water Research Foundation. ALL RIGHTS RESERVED.

47
APPENDIX A RSSCT DESIGN SPREADSHEET
Table A.1 RSSCT design spreadsheet used in experimental design and set-up. Input values are shown in bold all other values are calculated by the governing design equations
RSSCT Design Column
1 2 units Design equation
Car
bon
Manufacturer Norit Norit
Product GAC 400 GAC400
Type Bituminous Bituminous
Dry Bed Density, ρb 0.43 0.43 g/cm3
Bed Porosity, ε 0.38 0.38
Particle Porosity, εp 0.5 0.5
Approach PD PD
X 1.0 1.0
Lar
ge C
olu
mn
Upper Sieve Size (Large Scale) 12 12
Lower Sieve Size (Large Scale) 40 40
dp LC 0.92 0.92 mm
EBCTLC 7.5 15.0 min
Hydraulic Loading Rate, vLC 5.0 5.0 m/hr
ReLC 3.6 3.6
S
mal
l Col
umn
Upper Sieve Size (Small Scale) 100 100
Lower Sieve Size (Small Scale) 200 200
(continued)
©2015 Water Research Foundation. ALL RIGHTS RESERVED.
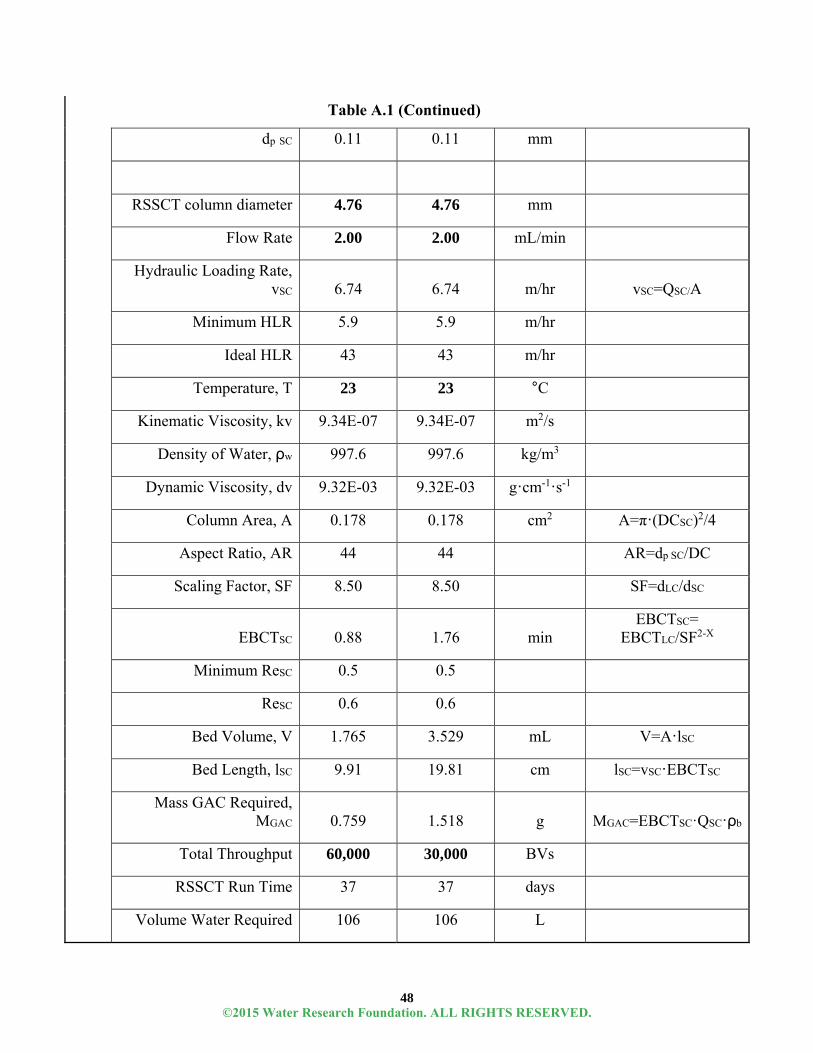
48
dp SC 0.11 0.11 mm
RSSCT column diameter 4.76 4.76 mm
Flow Rate 2.00 2.00 mL/min
Hydraulic Loading Rate, vSC 6.74 6.74 m/hr vSC=QSC/A
Minimum HLR 5.9 5.9 m/hr
Ideal HLR 43 43 m/hr
Temperature, T 23 23 °C
Kinematic Viscosity, kv 9.34E-07 9.34E-07 m2/s
Density of Water, ρw 997.6 997.6 kg/m3
Dynamic Viscosity, dv 9.32E-03 9.32E-03 g·cm-1·s-1
Column Area, A 0.178 0.178 cm2 A=π·(DCSC)2/4
Aspect Ratio, AR 44 44 AR=dp SC/DC
Scaling Factor, SF 8.50 8.50 SF=dLC/dSC
EBCTSC 0.88 1.76 min EBCTSC=
EBCTLC/SF2-X
Minimum ReSC 0.5 0.5
ReSC 0.6 0.6
Bed Volume, V 1.765 3.529 mL V=A·lSC
Bed Length, lSC 9.91 19.81 cm lSC=vSC·EBCTSC
Mass GAC Required, MGAC 0.759 1.518 g MGAC=EBCTSC·QSC·ρb
Total Throughput 60,000 30,000 BVs
RSSCT Run Time 37 37 days
Volume Water Required 106 106 L
Table A.1 (Continued)
©2015 Water Research Foundation. ALL RIGHTS RESERVED.