removing the blindfold with abc/m
TRANSCRIPT

1Removing the Blindfold
with ABC/M
“Whoever is careless with the truth in small matters cannot be trustedwith important matters.”
—Albert Einstein, German-Swiss-American scientist 1
INTRODUCTION
Imagine that you and three friends go to a restaurant. You order a cheeseburgerand they each order an expensive prime rib. When the waiter brings the bill theysay, “Let’s split the check evenly.” How would you feel?
That is how many products and service lines “feel” when the accountants takea large amount of indirect and support overhead expenses and allocate them ascosts without any logic. There is minimal or no link that reflects a true relativeuse of the expenses by the individual products, service lines, or end-users. Thisis unfair. Activity-based cost management (ABC/M) “gets it right.” It more fairlysplits the waiter’s check. Many ABC/M practitioners wish the word allocationnever existed. It implies inequity to many people based on past abuses in their or-ganization’s accounting practices. The word allocation effectively means “mis-allocation” because that is usually the result. ABC/M practitioners will often saythat they do not allocate expenses; instead they trace and assign them based oncause-and-effect relationships.
ABC/M can do much more than simply trace expenses and costs. It providesa tremendous amount of visibility for people to draw insights from and also usefor predicting the possible outcomes of decisions. Many operations people cyni-cally believe that accountants count what is easily counted, but not what counts.Outdated, traditional accounting blocks managers and employees from seeing themore relevant costs.
3740 P-01 7/24/2001 12:39 PM Page 1
Important Messages for ABC/M Project Teams
It is a mistake for ABC/M project teams to refer to ABC/M as an improvementprogram or a change initiative. The ABC/M data are simply used as a means toan end. If ABC/M is described as an improvement program, it might be regardedby managers and employees as a fad, fashion, or “project of the month.” ABC/Mdata make visible the economics of the organization and its consumption of re-source expenses. Money is continuously being spent on organizational resourceswhether or not ABC/M measuring is present.
ABC/M is analogous to a physician’s stethoscope, which allows a doctor to lis-ten to one’s heartbeat. Your heart is beating regardless of the presence of the stetho-scope. Similarly, an organization is continuously burning up its resources through itsactivities into its outputs regardless of whether ABC/M is monitoring these events.
I am deliberately understating ABC/M for an important reason. In the early1990s, when ABC/M was beginning to receive serious attention, the managementconsulting community began selling ABC/M engagements as consulting services.Unfortunately the consultants oversold ABC/M as a magic pill that could possiblysolve all of an organization’s problems (and perhaps solve world hunger, too). Thisraised management’s expectations too high. If the consultants did not solve the prob-lems that their clients engaged them for, some of those clients blamed ABC/M fornot working. However, ABC/M worked just fine; some of the consultants just didnot adequately understand how to interpret and use the data. Some did not know howto design and construct an effective ABC/M system. When one realizes that ABC/Mis fundamentally good data to be used for understanding, discovery, and decisionmaking, then it is better positioned for longer-term use and wider acceptance.
So I am deliberately managing expectations about ABC/M by reducing theperception that it provides all the answers. ABC/M restacks the costs; it does notroot them out. ABC/M’s data can be a great enabler for providing answers; the keyword here is enabler. One controller I met referred to ABC/M as the ultimate ques-tion generator. He observed that, equipped with the ABC/M data, employees andmanagers frequently had reactions like, “What would explain or account for that?”
Organizational improvement is referred to by a variety of terms, among themtotal quality management (TQM) and business process reengineering (BPR).They all have one thing in common: a focus on continuing improvement of workand the pursuit of excellence in daily operations. Many of these programs em-phasize the following:
• Management of processes rather than resources;• Elimination of waste;• Improvement to processes that results in better, faster, and cheaper services
to customers; and• Empowerment of employees to create change.
A common thread runs through all these improvement techniques: a focus on workactivities and their relationship to services or products provided to customers.
2 REMOVING THE BLINDFOLD WITH ABC/M
3740 P-01 7/24/2001 12:39 PM Page 2
The ABC/M data can turbocharge these types of popular performance im-provement programs. It is inevitable that all organizations will eventually rely onsome form of an ABC/M information system to assist in effectively managingtheir affairs. There is no reason to hype or overstate the power of ABC/M; it willcontinue to claim widespread global acceptance based on its merits and on theutility that the ABC/M information provides.
Organizational Shock from ABC/M
Ninety percent of ABC/M is organizational change management and behaviormodifying, and 10 percent of it is the math. Unfortunately most organizations thatimplement ABC/M initially get those two reversed. They spend far too muchtime defining and constructing their ABC/M information system and very littletime thinking about what their organization will do once they have their newABC/M data. This is a huge problem.
This poor implementation habit has adversely affected the rate of adoption ofABC/M. When ABC/M systems fall short of manager and employee teams’ ex-pectations, it is usually because the initial ABC/M system design was substan-tially over-engineered. The typical initial ABC/M system is usually excessivelydetailed and is well past diminishing returns on extra accuracy for each incre-mental effort of work. One manager reacted to seeing the first ABC/M report bysaying, “I feel like a dog watching television. I don’t know what I’m looking at!”With a fraction of the effort and in a much shorter time frame, the implementa-tion team could have started to produce results.
It is important to start getting results quickly from ABC/M because of the or-ganizational shock that some managers and employees may experience whenthey receive the new ABC/M data. That is, it is important to start realizing whatkind of new and possibly disturbing information might come from ABC/M.
When people see the ABC/M data for the first time, they will see things theyhave never seen before—and some of it will not be pretty. For example, theremay be a product manager who for years believed that his or her products or ser-vice lines were the most profitable in the organization. But when ABC/M finishesmore properly tracing the true consumption of expenses, that person’s product orservice line may appear much less profitable than it did under the traditionalbroad cost averaging scheme, and perhaps even unprofitable! That product man-ager will not be happy to see that information or whoever is reporting that infor-mation. Do not underestimate the level of resistance that can come from exposingmanagers and employees to the ABC/M data.
There is an important lesson here: Treat the ABC/M data responsibly.ABC/M is not an accounting police tool. It is an organization-wide managerialinformation system. Its data are not intended to embarrass anyone, and it shouldnot be used to punish anyone. In many cases no one really knew what their truecosts were. Many may have suspected that the existing expense and cost alloca-tion was wrong, but they did not know what the correct calculations would
Introduction 3
3740 P-01 7/24/2001 12:39 PM Page 3
reveal. ABC/M finally gives managers and employee teams the hope that theycan see the truth. But seeing the data and using the data are not the same thing.Much more thinking is required when it comes to using the ABC/M data for man-aging and decision making.
There is an old saying that all truth passes through three phases:
1. It is ridiculed.2. It is violently opposed.3. It is accepted as being obvious.
Whether dealing with the ABC/M methodology itself or the output data com-puted by the ABC/M system, keep the following in mind: There will be resis-tance to ABC/M, due to people being afraid not so much of change—althoughthat is a factor—as of uncertainty. The irony is that ABC/M brings truth, but untilthe ABC/M data are revealed, people are not sure what it is going to show or howit might be used.
In short, even if an activity-based cost model is in place, do not expectABC/M to follow automatically. Using the data is a hurdle.
Overhead Expenses Are Displacing Direct Costs
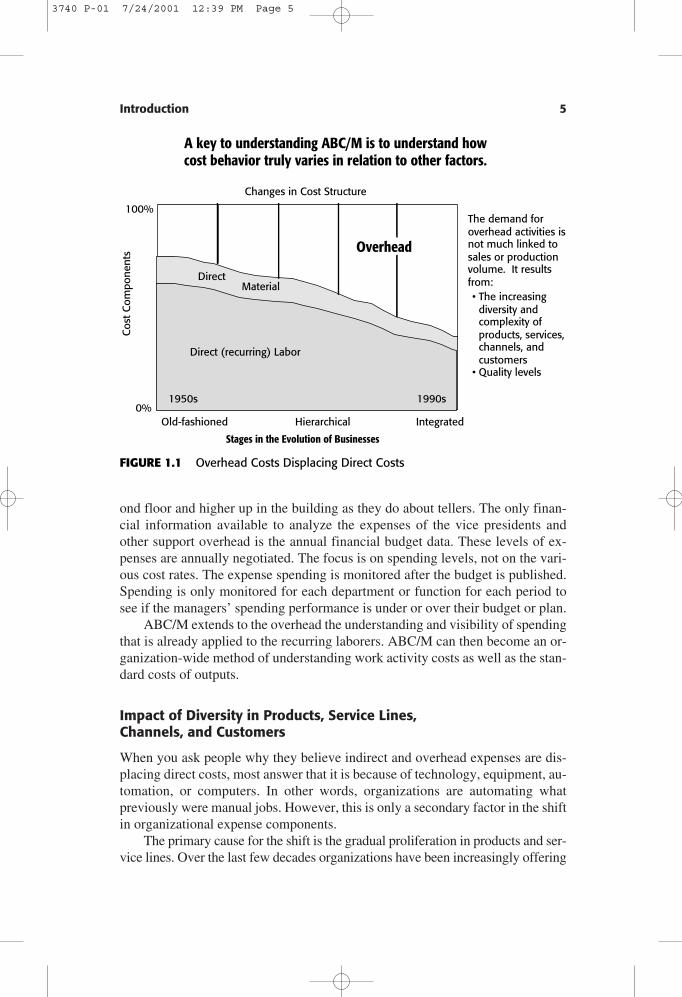
The direct laborers in organizations are the employees who perform the frontline,repeated work that is closest to the products and customers. However, numerousother employees behind the frontline also do recurring work on a daily or weeklybasis. These employees’ work is highly repeatable at some level, for example, ateller in a bank. Figure 1.1 is a chart that includes this type of expense plus theother two major expense components of any organization’s cost structure, itspurchased materials and its overhead.
Most organizations are experienced at monitoring and measuring the work ofsome of the laborers who do recurring work by using cost rates and standardcosts. In the bottom layer of the chart is cost information that also reveals per-formance-related costs other than the period’s spending, such as labor variancereporting. It is in this area of the chart, for example, that manufacturers use laborroutings and process sheets to measure efficiency. These costs are well known bythe name standard costs. Service organizations also measure this type of output-related information. For example, many banks know their standard cost for eachdeposit, each wire transfer, and so forth.
Problems occur in the overhead expense area appearing at the top portion ofFigure 1.1. The chart reveals that over the last few decades, the support overheadexpenses have been displacing the recurring costs. The organization already hassubstantial visibility of its recurring costs, but it does not have any insights intoits overhead or what is causing the level of spending of its overhead. ABC/M canhelp provide for insights and learning.
In a bank, for example, managers and employee teams do not get the samerobustness of financial information about the vice-presidents working on the sec-
4 REMOVING THE BLINDFOLD WITH ABC/M
3740 P-01 7/24/2001 12:39 PM Page 4
ond floor and higher up in the building as they do about tellers. The only finan-cial information available to analyze the expenses of the vice presidents andother support overhead is the annual financial budget data. These levels of ex-penses are annually negotiated. The focus is on spending levels, not on the vari-ous cost rates. The expense spending is monitored after the budget is published.Spending is only monitored for each department or function for each period tosee if the managers’ spending performance is under or over their budget or plan.
ABC/M extends to the overhead the understanding and visibility of spendingthat is already applied to the recurring laborers. ABC/M can then become an or-ganization-wide method of understanding work activity costs as well as the stan-dard costs of outputs.
Impact of Diversity in Products, Service Lines, Channels, and Customers
When you ask people why they believe indirect and overhead expenses are dis-placing direct costs, most answer that it is because of technology, equipment, au-tomation, or computers. In other words, organizations are automating whatpreviously were manual jobs. However, this is only a secondary factor in the shiftin organizational expense components.
The primary cause for the shift is the gradual proliferation in products and ser-vice lines. Over the last few decades organizations have been increasingly offering
Introduction 5
The demand foroverhead activities isnot much linked tosales or productionvolume. It resultsfrom:• The increasing
diversity andcomplexity ofproducts, services,channels, andcustomers
• Quality levels
A key to understanding ABC/M is to understand howcost behavior truly varies in relation to other factors.
Cos
t Com
pone
nts
Stages in the Evolution of Businesses
IntegratedOld-fashioned Hierarchical
Changes in Cost Structure
100%
Overhead
Direct (recurring) Labor
Material
1950s 1990s
Direct
0%
FIGURE 1.1 Overhead Costs Displacing Direct Costs
3740 P-01 7/24/2001 12:39 PM Page 5
a greater variety of products and services as well as using more types of distribu-tion and sales channels. In addition, organizations have been servicing more anddifferent types of customers. Introducing greater variation and diversity (i.e., het-erogeneity) into an organization creates complexity, and increasing complexity re-sults in more overhead expenses to manage it. So the fact that the overheadcomponent of expense is displacing the recurring labor expense does not automat-ically mean that an organization is becoming inefficient or bureaucratic. It simplymeans that the company is offering more variety to different types of customers.
For those who may not be convinced by this explanation, go speak with anemployee who has been in your organization a long time and is shortly due to re-tire. Ask him or her: “How thick was our product catalog when you joined the or-ganization and how thick is it now? What types of customers did the founderserve at the inception of our organization and how many more types do we servenow?” The explanation for increasing overhead will become evident.
In short, the shift to overhead displacing direct labor reveals the cost of com-plexity. ABC/M does not fix or simplify complexity; the complexity is a result ofother things. But what ABC/M does do is point out where the complexity is andwhere it comes from.
How long can organizations go on making decisions with the misinformationreported by their accounting systems? In the 1980s many organizations, reactingto the pressures from high-quality Japanese products, confessed that they had a“quality crisis.” In the twenty-first century, organizations may realize that theyhave an “accounting crisis.”
IF ABC IS THE ANSWER, WHAT IS THE QUESTION?
Growing Discontent with Traditional Calculation of Costs
Why do managers shake their heads in disbelief when they think about theircompany’s cost accounting system? I once heard an operations manager com-plain, “You know what we think of our cost accounting system? It is a bunch offictitious lies—but we all agree to them.” It is a sad thing to see the users of theaccounting data resign themselves to lack of hope. Unfortunately, many accoun-tants are comfortable when the numbers all foot-and-tie in total and could careless if the parts making up the total are correct. The total is all that matters, andany arbitrary cost allocation can tie out to the total.
The sad truth is that when employees and managers are provided with reportsthat have accounting data in them, they use that information regardless of its va-lidity or their skepticism of its integrity. Mind you, they are using the data to drawconclusions and make decisions. This is risky.
Imagine you were a roving reporter who asks managers and employee teamsthroughout your organization: “How happy are you with the existing financialand accounting data to support our decisions to improve our competitiveness?Thumbs up or down?” Many would give the data thumbs down. These people
6 REMOVING THE BLINDFOLD WITH ABC/M
3740 P-01 7/24/2001 12:39 PM Page 6

have basic needs such as knowing where their organization makes or losesmoney. It is amazing, but for many organizations the most fundamental questionsget the poorest answers—or no answers.
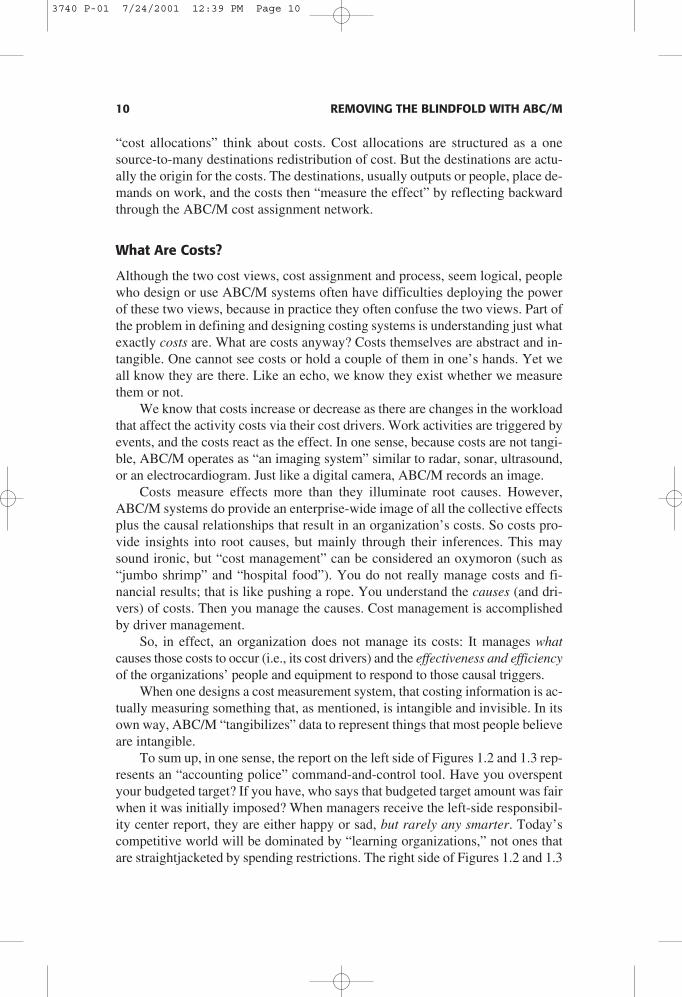
How can traditional accounting, which has been around for so many years,suddenly be considered so bad? The answer is that the existing data are not nec-essarily bad so much as somewhat distorted, incomplete, and unprocessed. Fig-ure 1.2 shows the first hint of a problem. The left side shows the classic monthlyresponsibility-center statement report that managers receive. Note that the exam-ple used is the back office of an insurance company. This is to demonstrate that,despite misconceptions, indirect white-collar workers produce outputs no differ-ently than do factory workers.
If you ask managers who routinely receive this report questions such as“How much of these expenses can you control or influence? How much insightdo you get into the content of work of your employees?” they will likely answerboth questions with, “Not much!” This is because the salary and fringe benefitcosts usually make up the most sizable portion of controllable costs, and all thatthe manager sees are those expenses reported as lump-sum amounts.
When you translate those “chart-of-account” expenses into the work activitiesthat consume the financial general ledger’s expenses, a manager’s insights fromviewing the activity costs begin to increase. The right side of Figure 1.2 is theABC/M view that is used for analysis and as the starting point for calculating the
If ABC Is the Answer, What Is the Question? 7
Key/scan claimsAnalyze claimsSuspend claimsReceive provider inquiriesResolve member problemsProcess batchesDetermine eligibilityMake copiesWrite correspondenceAttend training
Total
Claims Processing Department
Stating activities with an action verb-adjective-noun grammar convention creates an atmosphere for change by providing a new way of looking at something people
are already familiar with, rather than something that is foreign.
Salaries
Equipment
Travel expenses
Supplies
Use andoccupancy
Total
$621,400
161,200
58,000
43,900
30,000
$914,500
$600,000
150,000
60,000
40,000
30,000
$880,000
$(21,400)
(11,200)
2,000
(3,900)
––
$(34,500)
PlanActualFavorable/
(unfavorable)
Chart-of-Accounts ViewChart-of-Accounts View
From: General Ledger
Activity-Based ViewActivity-Based View
To: ABC Database
$ 31,500121,00032,500
101,50083,40045,000
119,000145,50077,100
158,000
$914,500
Claims Processing Dept
When managers get this kind of report, they areeither happy or sad, but they are rarely any smarter!
FIGURE 1.2 Language of ABC/MSource: Gary Cokins, Activity-Based Cost Management: Making It Work, © 1996, McGraw-Hill.Reproduced with the permission of The McGraw-Hill Companies.
3740 P-01 7/24/2001 12:39 PM Page 7
costs for both processes and diverse outputs. In effect, the ABC/M view resolvesthe deficiencies of traditional financial accounting by focusing on work activities.ABC/M is work-centric, whereas the general ledger is transaction-centric.
A key difference between ABC/M and the general ledger and traditionaltechniques of cost allocation (i.e., absorption costing) is that ABC/M describesactivities using an “action-verb-adjective-noun” grammar convention, such as“inspect defective products,” “open new customer accounts,” or “process cus-tomer claims.” This gives ABC/M its flexibility. Such wording is powerful be-cause managers and employee teams can better relate to these phrases, and thewording implies that the work activities can be favorably affected, changed, im-proved, or eliminated. The general ledger uses a chart of accounts, whereasABC/M uses a chart of activities. In translating general ledger data to activitiesand processes, ABC/M preserves the total reported revenues and costs but allowsthe revenues, budgeted funding, and costs to be viewed differently.
Notice how inadequate the data in the “chart-of-accounts” view are for re-porting business process costs that run cross-functionally, penetrating the verti-cal boundaries of the organization chart. The general ledger is organized aroundseparate departments or cost centers. This presents a reporting problem. For ex-ample, with a manufacturer, what is the true total cost of processing engineeringchange notices (ECNs) that travel through so many hands? For a service organi-zation, what is the true cost of opening a new customer account?
Many organizations have been flattened and delayered to the extent that em-ployees from different departments or cost centers frequently perform similaractivities and multi-task in two or more core business processes. Only by reassem-bling and aligning the work activity costs across the business processes, such as“process ECNs” or “open new customer accounts,” can the end-to-end process costsbe seen, measured, and eventually managed. As a result of the general ledger’sstructure of cost center mapping to the hierarchical organization chart, its informa-tion drives vertical behavior, not the much more desirable process behavior.
In effect, using traditional cost systems, managers are denied visibility of thecosts that belong to the end-to-end business processes. This is particularly ap-parent in the stocking, distribution, marketing, and selling costs that the tradi-tional accounting “expenses to the month’s period.” With traditional costallocations, these sales, general, and administrative expenses (SG&A) are notproportionately traced to the costs of the unique products, containers, services,channels, or customers that cause those costs to occur.
In summary, the general ledger view describes “what was spent,” whereasthe activity-based view describes “what it was spent for.” When employees havereliable and relevant information, managers can manage less and lead more.
Drivers Trigger the Workload
Much more information can be gleaned from the right-side view. Look at the sec-ond activity, “analyze claims” for $121,000, and ask, what would make that cost
8 REMOVING THE BLINDFOLD WITH ABC/M
3740 P-01 7/24/2001 12:39 PM Page 8
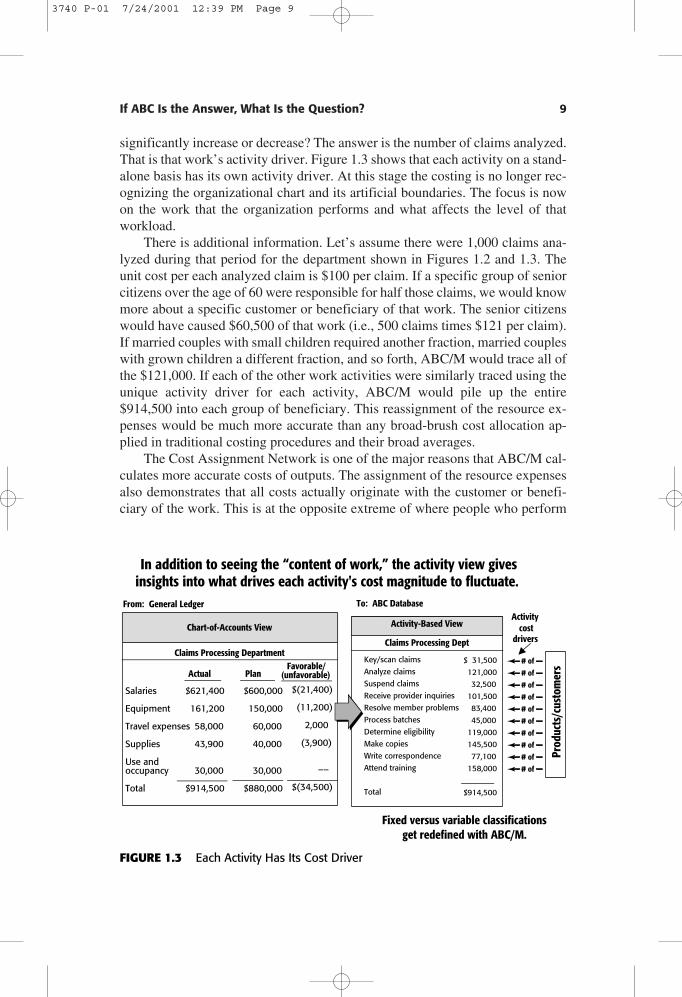
significantly increase or decrease? The answer is the number of claims analyzed.That is that work’s activity driver. Figure 1.3 shows that each activity on a stand-alone basis has its own activity driver. At this stage the costing is no longer rec-ognizing the organizational chart and its artificial boundaries. The focus is nowon the work that the organization performs and what affects the level of thatworkload.
There is additional information. Let’s assume there were 1,000 claims ana-lyzed during that period for the department shown in Figures 1.2 and 1.3. Theunit cost per each analyzed claim is $100 per claim. If a specific group of seniorcitizens over the age of 60 were responsible for half those claims, we would knowmore about a specific customer or beneficiary of that work. The senior citizenswould have caused $60,500 of that work (i.e., 500 claims times $121 per claim).If married couples with small children required another fraction, married coupleswith grown children a different fraction, and so forth, ABC/M would trace all ofthe $121,000. If each of the other work activities were similarly traced using theunique activity driver for each activity, ABC/M would pile up the entire$914,500 into each group of beneficiary. This reassignment of the resource ex-penses would be much more accurate than any broad-brush cost allocation ap-plied in traditional costing procedures and their broad averages.
The Cost Assignment Network is one of the major reasons that ABC/M cal-culates more accurate costs of outputs. The assignment of the resource expensesalso demonstrates that all costs actually originate with the customer or benefi-ciary of the work. This is at the opposite extreme of where people who perform
If ABC Is the Answer, What Is the Question? 9
Activity-Based ViewActivity-Based View
To: ABC Database
Key/scan claims
Analyze claims
Suspend claims
Receive provider inquiries
Resolve member problems
Process batches
Determine eligibility
Make copies
Write correspondence
Attend training
Total
$ 31,500
121,000
32,500
101,500
83,400
45,000
119,000
145,500
77,100
158,000
$914,500
Claims Processing Dept
In addition to seeing the “content of work,” the activity view givesinsights into what drives each activity's cost magnitude to fluctuate.
Salaries
Equipment
Travel expenses
Supplies
Use andoccupancy
Total
$621,400
161,200
58,000
43,900
30,000
$914,500
$600,000
150,000
60,000
40,000
30,000
$880,000
$(21,400)
(11,200)
2,000
(3,900)
––
$(34,500)
PlanActualFavorable/
(unfavorable)
Claims Processing Department
Chart-of-Accounts ViewChart-of-Accounts View
From: General LedgerActivity
costdrivers
Fixed versus variable classificationsget redefined with ABC/M.
Prod
ucts
/cus
tom
ers# of
# of
# of
# of
# of
# of
# of
# of
# of
# of
FIGURE 1.3 Each Activity Has Its Cost Driver
3740 P-01 7/24/2001 12:39 PM Page 9
“cost allocations” think about costs. Cost allocations are structured as a onesource-to-many destinations redistribution of cost. But the destinations are actu-ally the origin for the costs. The destinations, usually outputs or people, place de-mands on work, and the costs then “measure the effect” by reflecting backwardthrough the ABC/M cost assignment network.
What Are Costs?
Although the two cost views, cost assignment and process, seem logical, peoplewho design or use ABC/M systems often have difficulties deploying the powerof these two views, because in practice they often confuse the two views. Part ofthe problem in defining and designing costing systems is understanding just whatexactly costs are. What are costs anyway? Costs themselves are abstract and in-tangible. One cannot see costs or hold a couple of them in one’s hands. Yet weall know they are there. Like an echo, we know they exist whether we measurethem or not.
We know that costs increase or decrease as there are changes in the workloadthat affect the activity costs via their cost drivers. Work activities are triggered byevents, and the costs react as the effect. In one sense, because costs are not tangi-ble, ABC/M operates as “an imaging system” similar to radar, sonar, ultrasound,or an electrocardiogram. Just like a digital camera, ABC/M records an image.
Costs measure effects more than they illuminate root causes. However,ABC/M systems do provide an enterprise-wide image of all the collective effectsplus the causal relationships that result in an organization’s costs. So costs pro-vide insights into root causes, but mainly through their inferences. This maysound ironic, but “cost management” can be considered an oxymoron (such as“jumbo shrimp” and “hospital food”). You do not really manage costs and fi-nancial results; that is like pushing a rope. You understand the causes (and dri-vers) of costs. Then you manage the causes. Cost management is accomplishedby driver management.
So, in effect, an organization does not manage its costs: It manages whatcauses those costs to occur (i.e., its cost drivers) and the effectiveness and efficiencyof the organizations’ people and equipment to respond to those causal triggers.
When one designs a cost measurement system, that costing information is ac-tually measuring something that, as mentioned, is intangible and invisible. In itsown way, ABC/M “tangibilizes” data to represent things that most people believeare intangible.
To sum up, in one sense, the report on the left side of Figures 1.2 and 1.3 rep-resents an “accounting police” command-and-control tool. Have you overspentyour budgeted target? If you have, who says that budgeted target amount was fairwhen it was initially imposed? When managers receive the left-side responsibil-ity center report, they are either happy or sad, but rarely any smarter. Today’scompetitive world will be dominated by “learning organizations,” not ones thatare straightjacketed by spending restrictions. The right side of Figures 1.2 and 1.3
10 REMOVING THE BLINDFOLD WITH ABC/M
3740 P-01 7/24/2001 12:39 PM Page 10
restates those same expenses in a much more useful format and structure for de-cision support.
When expenses are expressed as activity costs they are in a format thatmakes it easy to trace them into outputs. This way employees can never say, “wecould care less about what anything costs.” People care more when they knowwhat things cost and believe that the accuracy of those costs is reliable. Cost ac-counting is outside many individuals’ comfort zones. ABC/M makes cost under-standable and logical.
As ABC/M converts expenses into the calculated costs of work activities andtheir outputs, it starts making expenses appear more concrete. To aid in organi-zational learning, we as a society need to increase the representation of reality—and ABC/M is the foundation for that financial realm. The problem today is thatwhen you have the wrong information coupled with the wrong measurements, itis not difficult to make wrong decisions.
ABC/M as a Translator, Not a Replacement for the General Ledger
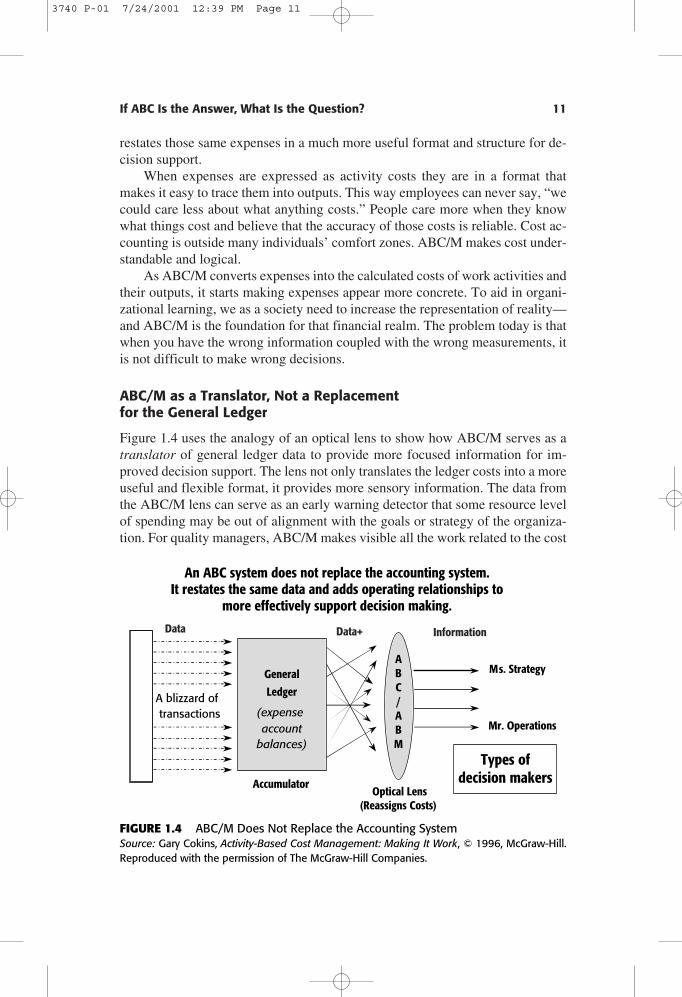
Figure 1.4 uses the analogy of an optical lens to show how ABC/M serves as atranslator of general ledger data to provide more focused information for im-proved decision support. The lens not only translates the ledger costs into a moreuseful and flexible format, it provides more sensory information. The data fromthe ABC/M lens can serve as an early warning detector that some resource levelof spending may be out of alignment with the goals or strategy of the organiza-tion. For quality managers, ABC/M makes visible all the work related to the cost
If ABC Is the Answer, What Is the Question? 11
An ABC system does not replace the accounting system.It restates the same data and adds operating relationships to
more effectively support decision making.
General
Ledger
(expense account
balances)
A blizzard oftransactions
AccumulatorOptical Lens
(Reassigns Costs)
Types ofdecision makers
ABC/ABM
Ms. Strategy
Mr. Operations
Data Data+ Information
FIGURE 1.4 ABC/M Does Not Replace the Accounting SystemSource: Gary Cokins, Activity-Based Cost Management: Making It Work, © 1996, McGraw-Hill.Reproduced with the permission of The McGraw-Hill Companies.
3740 P-01 7/24/2001 12:39 PM Page 11
of quality (COQ). It reveals for them where quality-related costs are located andwhich outputs and products the COQ costs have gone into.
Figure 1.4 illustrates that ABC/M is not a replacement for the traditional gen-eral ledger accounting. Rather, it is a translator or overlay that lies between the costaccount accumulators in the general ledger and the end-users, such as managers andanalysts, who apply cost data in decision making. ABC/M translates expenses intoa language that people can understand. It translates expense into elements of costs,namely the work activities, which can be more flexibly linked or assigned to busi-ness processes or cost objects based on demand-driven consumption patterns, notsimplistic cost allocations. The reason ABC/M is becoming popular is that the gen-eral ledger is now recognized as being structurally deficient for delivering goodbusiness information for decision support. The general ledger is a sound mecha-nism for collecting and accumulating transaction-intensive costs but not for con-verting those costs into useful managerial information.
In the simplest terms, the general ledger acts like a checkbook; one can readthe dollar amounts spent but not really know the what-fors and whys of any indi-vidual “check.” And unfortunately the general ledger’s largest “check” amountsare employee payroll-related, which gives managers virtually no visibility of thecontent of the employee work activities being performed. Furthermore, the pay-roll-related costs do not reveal the interrelationships between that work and otherwork or products and customer services. There are no insights into what eventscause or drive work activity costs to vary. Because an organization’s work activ-ities are probably the most controllable costs that a manager or team can influence,these activities are critical to know and to understand.
In contrast to traditional accounting, ABC/M focuses on the work activitiesassociated with operating a business or managing a not-for-profit organization.As previously mentioned, ABC/M is work-centric, whereas the general ledger istransaction-centric. Both have their place, but the general ledger’s data are tooraw to be considered business intelligence for decision support. ABC/M solvesthe general ledger’s problem of unprocessed expenditure data. However, justtranslating the ledger account expenses into their work activities is an incompletedescription of ABC/M. The total ABC/M picture comes from linking the activi-ties into networks to calculate the cost of outputs for performing analysis, deter-mining trade-offs, and making decisions.
Managing with a process view created a growing need for better managerialand costing data. Managing processes and managing activities (i.e., costs) go to-gether. By defining a business process as comprising two or more logically re-lated work activities intended to serve end-customers, the need for integratingprocesses, outputs, and measured costs becomes even more apparent as an im-portant requirement for managers and teams. And the ABC/M Cross (discussedfurther in the following sections) provides a logical way to visualize and reporton these linkages.
In summary, ABC/M resolves the general ledger’s structural problem. WithABC/M, the general ledger account balances are first converted into activity costs.
12 REMOVING THE BLINDFOLD WITH ABC/M
3740 P-01 7/24/2001 12:39 PM Page 12
Then ABC/M assigns the activity costs to cost objects or reassembles the activitycosts across business processes. These new and transformed ABC/M cost data canbe used to identify operating relationships that can be used effectively in makingproduct, channel, market, and customer-oriented decisions. This ABC/M infor-mation can also be useful in managing processes and any quality-related issueswithin the processes. In all cases, ABC/M transforms the general ledger data intoa different type of cost information that is more useful for decision making.
How Does Activity-Based Costing Compute Better Accuracies?
ABC/M was developed as a practical solution for problems associated with tra-ditional cost management systems that we now realize are distorting and incom-plete. Indirect expense and overhead cost allocation practices of traditionalsystems can bring more damage than good to organizations. In traditional cost-ing the indirect expenses are usually too aggregated to serve any purpose, andthese large groupings destroy any likelihood for calculating an accurate cost ofany type of output.
The next problem with overhead cost allocations is that excessively broad-brush average cost rates are applied to calculate costs. Worse yet, the cost alloca-tions usually rely on a sales-related, volume-based factor or basis, such as directlabor hours or department expenses. It may be an inputs-used or outputs-producedbasis measure, but the basis usually will not accurately measure the segments ofthe total. This flawed basis for allocating costs rarely reflects the specific cause-and-effect relationship between the indirect overhead expense and the work out-put, part, product, service, channel, or customer (i.e., the cost object) that isactually consuming the cost. Many managers are tired of “allocation foodfights.”
The result of inaccurate cost allocations, because allocating is a zero-sumerror game, is that some cost objects are over-costed while the remainder areunder-costed. In other words, as a consequence of unquestioned formula cost al-locations, traditional financial accounting can grotesquely distort the true cost ofproducts and service lines, which in turn can wildly distort their individual profitmargins. Some refer to traditional cost allocation methods as “spreaders.”
The ABC/M logical assignment of expenses and costs obliterates the use ofsimple averages as the basis for tracing costs. Figure 1.5 illustrates the impact of ap-plying ABC/M rather than the traditional allocation. The diagram reveals ABC/M’s“S-curve.” The horizontal line represents the flawed costs that are calculated by atraditional standard costing system. These costs represent the belief system of theorganizations. Many employees accept them as accurate strictly because the ac-countants report them. Other employees are suspicious.
In practice, one discovers that the under-costed products are substantiallyunder-costed because these products may be low-volume with small lot sizes, re-quire more technical attention, consume more handling, or need extra inspection.ABC/M removes the distortions from simplistic cost allocations. An allocation-free
If ABC Is the Answer, What Is the Question? 13
3740 P-01 7/24/2001 12:39 PM Page 13
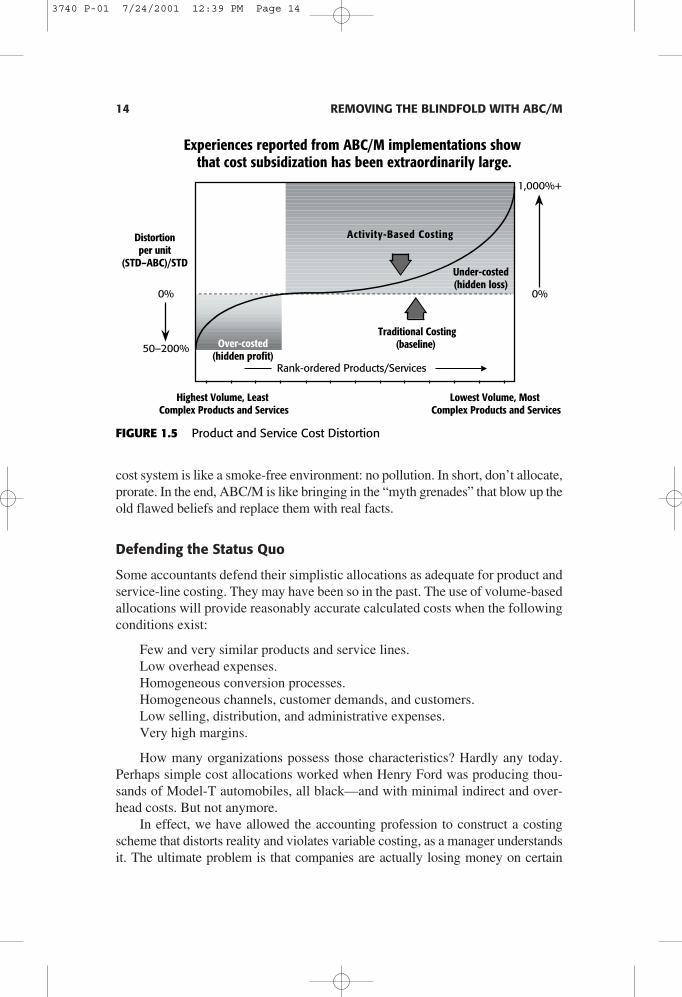
cost system is like a smoke-free environment: no pollution. In short, don’t allocate,prorate. In the end, ABC/M is like bringing in the “myth grenades” that blow up theold flawed beliefs and replace them with real facts.
Defending the Status Quo
Some accountants defend their simplistic allocations as adequate for product andservice-line costing. They may have been so in the past. The use of volume-basedallocations will provide reasonably accurate calculated costs when the followingconditions exist:
Few and very similar products and service lines.Low overhead expenses.Homogeneous conversion processes.Homogeneous channels, customer demands, and customers.Low selling, distribution, and administrative expenses.Very high margins.
How many organizations possess those characteristics? Hardly any today.Perhaps simple cost allocations worked when Henry Ford was producing thou-sands of Model-T automobiles, all black—and with minimal indirect and over-head costs. But not anymore.
In effect, we have allowed the accounting profession to construct a costingscheme that distorts reality and violates variable costing, as a manager understandsit. The ultimate problem is that companies are actually losing money on certain
14 REMOVING THE BLINDFOLD WITH ABC/M
Activity-Based Costing
Traditional Costing(baseline)
Under-costed(hidden loss)
Over-costed(hidden profit)
0%
Highest Volume, Least Complex Products and Services
Lowest Volume, Most Complex Products and Services
1,000%+
50–200%
0%
Distortionper unit
(STD–ABC)/STD
Rank-ordered Products/Services
Experiences reported from ABC/M implementations show that cost subsidization has been extraordinarily large.
FIGURE 1.5 Product and Service Cost Distortion
3740 P-01 7/24/2001 12:39 PM Page 14

products, orders, services, and customers when their accounting systems state thatthey are profitable. And since the price quotation practices usually rely on the sameflawed cost data, quoting unprofitable orders to potentially unprofitable customersis perpetuated with the illusion that the quoted orders are profitable.
ABC/M corrects for these flaws by identifying the work activities that are re-sponsible for costs. It provides a cost flow assignment network, which allows thework activity costs and their output costs to be continuously reassigned, or passedon only if the products, services, or customers, or in some cases other work ac-tivities, actually use the activity. This condition of consumption and use is whatsets ABC/M apart from traditional cost allocation schemes. Figure 1.6 is a pop-ular diagram called the ABC/M Cross.
The ABC/M Cross reveals that work activities, which are located in the cen-ter intersection of the cross, are integral to reporting both the costs of processesand the costs of cost objects. Cost objects are the persons or things that benefitfrom incurring activity costs; examples are products, internal or external cus-tomers, stakeholders, and outputs of internal processes. Cost objects can bethought of as to what and for whom work is done. Figure 1.7 lists the questionsthat the vertical cost assignment view answers.
The vertical cost assignment view explains what specific things cost, whereasthe horizontal process view, which some refer to as ABM, explains what causescosts to exist and to fluctuate.
If ABC Is the Answer, What Is the Question? 15
Why ThingsHave Cost
BetterDecisionMaking
What Things Cost
Cost Assignment View (ABC)
ProcessView
(ABC/M)
Resources
Resource CostAssignment
Activities
Activity CostAssignment
Cost Objects(Outputs)
ManageActivities
ResourceDrivers
ActivityDrivers
CostDrivers
FIGURE 1.6 Activity-Based Cost Management FrameworkSource: The Consortium of Advanced Manfacturing–International (CAM-I), 1990. Used withpermission.
3740 P-01 7/24/2001 12:39 PM Page 15
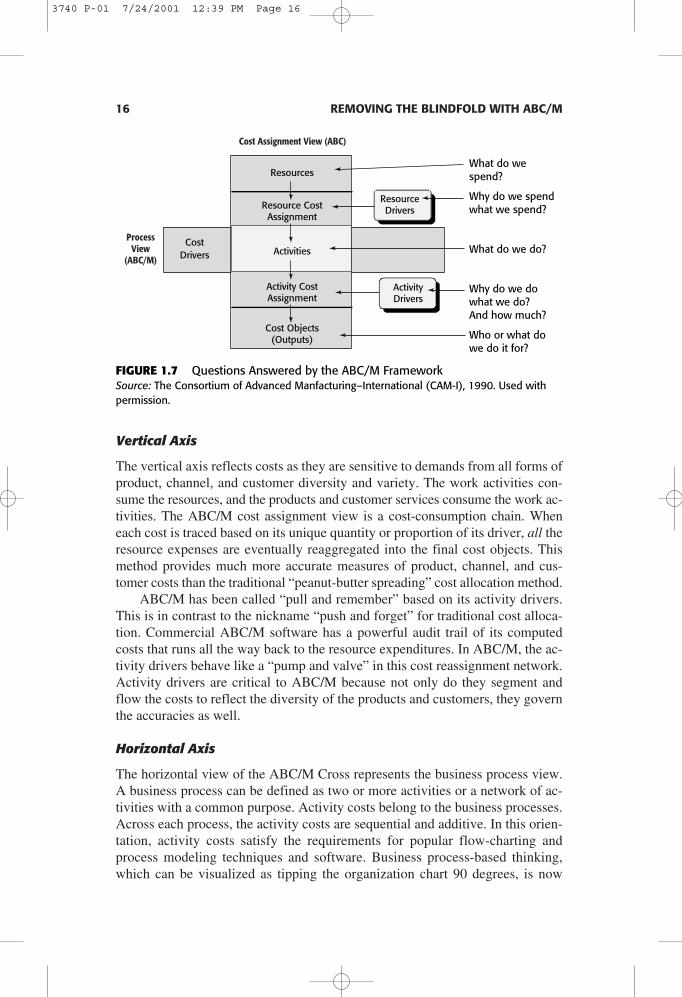
Vertical Axis
The vertical axis reflects costs as they are sensitive to demands from all forms ofproduct, channel, and customer diversity and variety. The work activities con-sume the resources, and the products and customer services consume the work ac-tivities. The ABC/M cost assignment view is a cost-consumption chain. Wheneach cost is traced based on its unique quantity or proportion of its driver, all theresource expenses are eventually reaggregated into the final cost objects. Thismethod provides much more accurate measures of product, channel, and cus-tomer costs than the traditional “peanut-butter spreading” cost allocation method.
ABC/M has been called “pull and remember” based on its activity drivers.This is in contrast to the nickname “push and forget” for traditional cost alloca-tion. Commercial ABC/M software has a powerful audit trail of its computedcosts that runs all the way back to the resource expenditures. In ABC/M, the ac-tivity drivers behave like a “pump and valve” in this cost reassignment network.Activity drivers are critical to ABC/M because not only do they segment andflow the costs to reflect the diversity of the products and customers, they governthe accuracies as well.
Horizontal Axis
The horizontal view of the ABC/M Cross represents the business process view.A business process can be defined as two or more activities or a network of ac-tivities with a common purpose. Activity costs belong to the business processes.Across each process, the activity costs are sequential and additive. In this orien-tation, activity costs satisfy the requirements for popular flow-charting andprocess modeling techniques and software. Business process-based thinking,which can be visualized as tipping the organization chart 90 degrees, is now
16 REMOVING THE BLINDFOLD WITH ABC/M
What do wespend?
Why do we spendwhat we spend?
What do we do?
Why do we dowhat we do? And how much?
Who or what dowe do it for?
Cost Assignment View (ABC)
ProcessView
(ABC/M)
Resources
Resource CostAssignment
Activities
Activity CostAssignment
Cost Objects(Outputs)
ResourceDrivers
ActivityDrivers
CostDrivers
FIGURE 1.7 Questions Answered by the ABC/M Framework Source: The Consortium of Advanced Manfacturing–International (CAM-I), 1990. Used withpermission.
3740 P-01 7/24/2001 12:39 PM Page 16

dominating managerial thinking. ABC/M provides the cost elements for processcosting that are not available from the general ledger.
Cost Drivers and Activity Drivers
There is probably no term, other than activity, that has become more identifiedwith ABC/M than the term driver and its several variations. The problem is thatit has been applied in several ways with varying meanings. To be very clear, acost driver is something that can be described in words but not necessarily innumbers. For example, a storm would be a cost driver that results in much clean-up work and the resulting costs. In contrast, the activity drivers in ABC/M’s costassignments must be quantitative, using measures that apportion costs. In theABC/M vertical cost assignment view there are three types of drivers, and all arerequired to be quantitative:
• Resource drivers trace expenditures (cash outlays) to work activities.• Activity drivers trace activity costs to cost objects.• Cost object drivers trace cost object costs to other cost objects.
In the ABC/M Cross’s vertical cost assignment view, activity drivers willhave their own higher order cost drivers. Events or other influences, which areformally called cost drivers, cause work activities. A cost driver, such as a salesor work order, is the trigger that causes the work activity to utilize resources toproduce output or results. Activity costs are additive along the process and there-fore can be accumulated along the business process.
Cost drivers and activity drivers serve different purposes. Activity drivers areoutput measures that reflect the usage of each work activity, and they must bequantitatively measurable. An activity driver, which relates a work activity to costobjects, “meters out” the work activity based on the unique diversity and variationof the cost objects that are consuming the activity. It is often difficult to understandwhether use of the term activity driver is related to a causal effect (input driver,such as “number of labor hours”) or to the output produced by an activity (outputdriver, such as “number of invoices processed” or “number of gallons produced”).In many cases, this is not a critical issue as long as the activity driver traces the rel-ative proportion of the activity cost to its cost objects. An activity cost has an out-put cost rate that is synonymous with the activity driver rate. Older, less-effectiveterms, such as first and second stage driver, continue to be used to describe itemssimilar to the currently more accepted terms resource driver and activity driver.
A cost driver is a driver of a higher order than activity drivers. One cost dri-ver can affect multiple activities. A cost driver need not be measurable but cansimply be described as a triggering event. The term describes the larger scalecausal event that influences the frequency, intensity, or magnitude of a workloadand, therefore, influences the amount of work done that translates to the cost ofthe activities. For example, a sales promotion can be a cost driver for substantialincreases in the company’s work activities of the order-fulfillment process. The
If ABC Is the Answer, What Is the Question? 17
3740 P-01 7/24/2001 12:39 PM Page 17

amount of effort used in taking orders, for example segmented by teenagers ver-sus senior citizens, would require an activity driver (i.e., number of orders placeddue to promotion) to calculate the proportional costs to customers in each seg-ment. There would be a unique activity driver for each work activity that belongsto the order-fulfillment process.
Figure 1.8 illustrates how activity drivers are lower order drivers of cost dri-vers. ABC/M relies on activity drivers for tracing costs, and collectively they areuseful when combined with quality management (QM) problem-solving tools foridentifying root causes.
Driver data, whether cost driver or activity driver information, spark rootcause analysis. But usually the activity drivers used for ABC/M costing are out-put-based. Therefore, as the quantity of the drivers rises or falls over time,ABC/M can report the trend in terms of per-unit cost of work rates of the activ-ity outputs and ultimately of the products. Alternatively, ABC/M can also pro-vide the per-unit-of-each-output rates for use in predictive planning and what-ifscenarios, a popular use of the ABC/M data. Cost estimating with ABC/M is nat-ural because the activity costs react and behave linearly with changes from theiractivity drivers. Too often in traditional costing the cost rates do not directly varywith changes in volume; this results in mis-estimates and ultimately in errors,poor decisions, and lost profits.
18 REMOVING THE BLINDFOLD WITH ABC/M
Activity drivers have their own cost drivers. It is best to use“symptomatic” and physical output drivers in the ABC model to measure
unit driver rates and segment the diversity of the cost objects…
…and rely on employees to determine the “nth order” drivers using TQMproblem solving techniques outside of ABC’s cost flowing.
Cost Assignment View (ABC)
ProcessView (ABC/M)
Resources
Resource Cost Assignment
Activity Cost Assignment
Cost Objects (Outputs)
ManageActivities
Resource Drivers
Activity Drivers
1st order
2ndorder
3rdorder
4thorder
…RootCause
Cost Drivers
Work Activities
FIGURE 1.8 Drivers Have Drivers
3740 P-01 7/24/2001 12:39 PM Page 18
As mentioned, in the vertical cost assignment view the term driver is ap-pended in three areas. The first deals with the method of assigning resource coststo activities: a resource driver. The second deals with the method of assigning ac-tivity costs to cost objects: an activity driver. The third—a cost object driver—applies to cost objects after all activity costs have already been logically assigned.Note that cost objects can be consumed or used by other cost objects. (In this con-text, references to “first” and “second” stage drivers are being abandoned asbeing obsolete. Their use today would give a misleading impression that ABC/Mcan be easily accomplished as a simplistic two-step allocation. ABC/M practi-tioners have come to recognize that ABC/M is a multistage cost assignmentscheme, as discussed in “Expanded ABC/M Cross” in Chapter 2.) By limiting theuse of the word driver to four clearly defined areas—cost driver, resource driver,activity driver, and cost object driver—I hope to prevent misinterpretation ormisuse of the term.
The ABC/M Cross displays in a simple fashion that the work activities at theintersection of the vertical and horizontal axis are integral to determining the costof an organization’s processes as well as the cost of its cost objects. The activityat the intersection schematically represents an individual activity—a very localview. But from a global perspective, the vertical (cost assignment) and horizon-tal (process) views may consist of many activities that are networked based ontheir relationships to resources, cost objects, and other activities. (This is dis-cussed further in ”Expanded ABC/M Cross” in Chapter 2.)
Large ABC/M Size Does Not Make Better ABC/M
In practice, ABC/M systems will sometimes trace work activity costs to two ormore other intermediate work activities that consume the work upstream from theultimate products and customer services that initially trigger the demands onwork. The reassignment network of cost-segmented consumption is responsiblefor the majority of ABC/M’s superior costing accuracy. ABC/M can tolerate rea-sonable cost driver estimates as proxies for actual transaction detail drivers be-cause the error does not compound; it dampens out on its way to the final costobjects. It is somewhat counterintuitive, but with ABC/M, precision inputs arenot synonymous with accurate outputs. This property significantly lightens theload for data collection.
ABC/M’s property of error-dampening also means that an ABC/M modeldoes not need to be very granular or consequently very large in size. Unfortu-nately, because this idea is counterintuitive, many ABC/M systems are over-engineered. The ABC/M models are well beyond diminishing returns of extraaccuracy for extra levels of effort. This is “ABC/M’s leveling problem.” No oneknows in advance how detailed to make the first ABC/M model. The projectteam, often led by accountants, errs on the side of excess detail. Unfortunately,some activity-based costing projects are exposed to risk because the system be-came unnecessarily difficult to maintain prior to the users comprehending how
If ABC Is the Answer, What Is the Question? 19
3740 P-01 7/24/2001 12:39 PM Page 19
they could apply the ABC/M data. This is why ABC/M advocates’ mantra is: “Itis better to be approximately correct than precisely inaccurate!” In the end, thelevel of accuracy and detail depends on what decisions are made with the data.Usually the accuracy requirements are not unreasonably harsh. So learn how toright-size your ABC/M system. ABC/M is a solution, but a solution to a problemshould not become the next problem. Learn the properties of ABC/M model de-sign and architecture.
Some of the lessons learned about ABC/M and profitability analysis follow:
• Information, although not precise, can provide an organization with sub-stantially improved support for decision making and greatly improve its un-derstanding of profitability.
• An organization does need excellent ABC/M analysis to make great im-provements.
• No ABC/M information and its analysis are perfect. Good judgment and ad-ditional qualitative information are necessary before final decisions aremade.
A simple rule that will be repeated in this book is to constantly ask, “Is theclimb worth the view?” That is, by building a more detailed and slightly more ac-curate ABC/M model, will the answer to your question be better answered?Avoid the “creeping elegance” syndrome. Larger models introduce maintenanceissues. (ABC/M’s leveling problem is discussed in depth in “ABC/M’s AchillesHeel: The Leveling Problem” in Chapter 2.)
What Gave Rise to ABC/M?
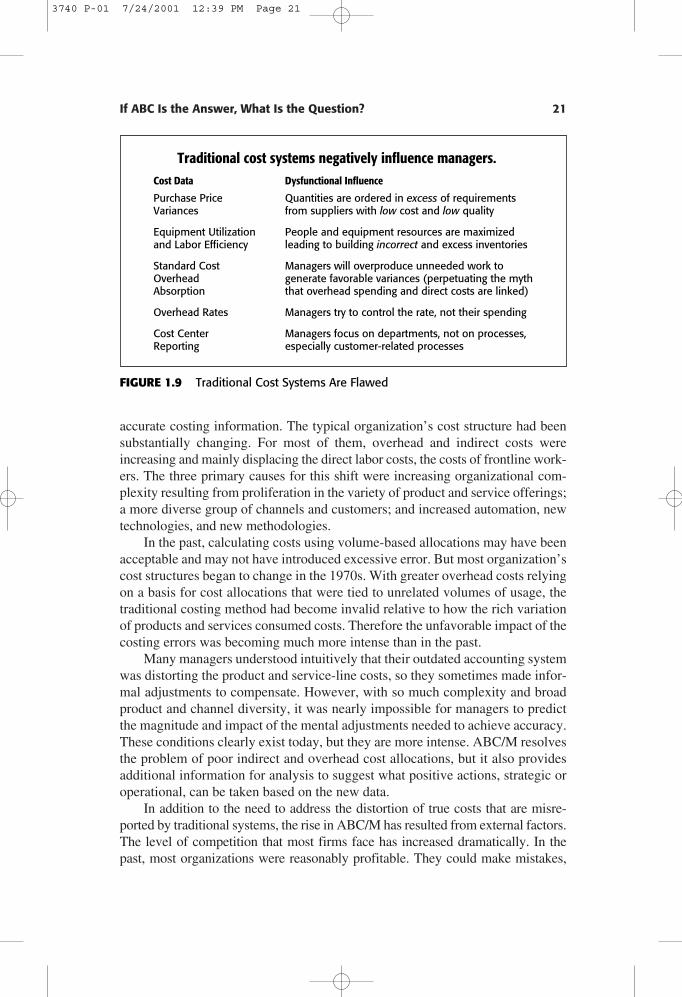
Many organizations have been suspicious that their cost management systemleads to behavior and actions that are counterproductive. Figure 1.9 lists severalunexpected outcomes that can result from strictly adhering to the reporting froma traditional standard costing system. These outcomes mainly affect operationaleffectiveness and efficiency.
It may have been acceptable in the early 1900s, when Frederick Taylor’s sci-entific management revolution was being introduced, to apply standard costing tomaximize work center efficiency and utilization. In those days detailed varianceanalysis was the name of the game. It was useful in that era of standard productsand large run batch-and-queue production. But, as I discuss in Chapter 4, massproduction has given way to mass customization combined with better, faster,and cheaper requirements. Hence, the use of variances and standards has to becarefully reconsidered. Companies can no longer afford to allow their accountingsystem to drive aberrant operations behavior, people performing unneeded worksimply to absorb more costs to avoid unfavorable variances on their report card.
To complicate matters, the traditional cost systems also did not produce thecorrect numbers needed for strategic decisions. In the early 1980s many compa-nies began to realize that their traditional accounting systems were generating in-
20 REMOVING THE BLINDFOLD WITH ABC/M
3740 P-01 7/24/2001 12:39 PM Page 20
accurate costing information. The typical organization’s cost structure had beensubstantially changing. For most of them, overhead and indirect costs wereincreasing and mainly displacing the direct labor costs, the costs of frontline work-ers. The three primary causes for this shift were increasing organizational com-plexity resulting from proliferation in the variety of product and service offerings;a more diverse group of channels and customers; and increased automation, newtechnologies, and new methodologies.
In the past, calculating costs using volume-based allocations may have beenacceptable and may not have introduced excessive error. But most organization’scost structures began to change in the 1970s. With greater overhead costs relyingon a basis for cost allocations that were tied to unrelated volumes of usage, thetraditional costing method had become invalid relative to how the rich variationof products and services consumed costs. Therefore the unfavorable impact of thecosting errors was becoming much more intense than in the past.
Many managers understood intuitively that their outdated accounting systemwas distorting the product and service-line costs, so they sometimes made infor-mal adjustments to compensate. However, with so much complexity and broadproduct and channel diversity, it was nearly impossible for managers to predictthe magnitude and impact of the mental adjustments needed to achieve accuracy.These conditions clearly exist today, but they are more intense. ABC/M resolvesthe problem of poor indirect and overhead cost allocations, but it also providesadditional information for analysis to suggest what positive actions, strategic oroperational, can be taken based on the new data.
In addition to the need to address the distortion of true costs that are misre-ported by traditional systems, the rise in ABC/M has resulted from external factors.The level of competition that most firms face has increased dramatically. In thepast, most organizations were reasonably profitable. They could make mistakes,
If ABC Is the Answer, What Is the Question? 21
Cost Data Dysfunctional Influence
Purchase PriceVariances
Quantities are ordered in excess of requirementsfrom suppliers with low cost and low quality
Equipment Utilizationand Labor Efficiency
People and equipment resources are maximizedleading to building incorrect and excess inventories
Standard CostOverheadAbsorption
Managers will overproduce unneeded work togenerate favorable variances (perpetuating the myththat overhead spending and direct costs are linked)
Overhead Rates Managers try to control the rate, not their spending
Cost CenterReporting
Managers focus on departments, not on processes,especially customer-related processes
Traditional cost systems negatively influence managers.
FIGURE 1.9 Traditional Cost Systems Are Flawed
3740 P-01 7/24/2001 12:39 PM Page 21
and their adequate profitability would mask the impact of their wrong or poordecisions. But competition has intensified. A company can no longer carry un-profitable products and service lines and unprofitable customers by hoping theprofitable ones will more than offset and make up the difference. They can nolonger survive with misleading cost allocations and without having visibility oftheir costs across their end-to-end business processes.
Today the margin for error is slimmer. Businesses cannot make as many mis-takes as they could in the past and remain competitive or effective. Price quota-tions, capital investment decisions, product mix, technology choices, outsourcing,and make versus buy decisions today all require a sharper pencil. More competi-tors are better understanding the cause-and-effect connections that drive costs,and they are fine-tuning their processes, removing COQ, and adjusting theirprices accordingly. The resulting price squeeze from more intense competition ismaking life for businesses much more difficult. Budget tightening is similarlyaffecting government and not-for-profit organizations. Knowing what your realcosts are for outputs, product costs, and the “costs-to-serve” channels and cus-tomers is becoming key to survival. With activity-based costing visibility, orga-nizations can identify where to remove waste, low-value-adding costs, andunused capacity, as well as understanding what drives their costs. They can alsosee the degree of alignment of their cost structure with their organization’s mis-sion and strategy.
Today an organization’s road is no longer long and straight, it is windy, withbends and hills that do not give much visibility or certainty to plan for the future.Organizations need to be agile and continuously transform their cost structureand work activities. This is difficult to do when an organization does not under-stand its own cost structure and economics.
For years, ABC/M was considered an expensive project that only large or-ganizations with extensive resources could undertake. But today, with the prolif-eration of computers for gathering and computing, the cost of data collection andmeasurement has fallen at the same time that information processing has im-proved. Not too long ago, it was cost prohibitive to accumulate, process, and an-alyze the data necessary to run an ABC system. Cost accounting was restricted toa big box mainframe computer and data stored as flat-files.
Today, not only are such activity measurement systems affordable, but muchof the information already exists in some form within the organization. For ex-ample, quality management systems of ISO 9000-registered organizations havean abundance of data, usually not connected to the accounting system. Also, afew knowledgeable employees can usually estimate a large portion of any re-maining data that may not be available. Estimates such as these will have a min-imal adverse impact on accuracy. Hence, all organizations can easily produceABC/M data. Better yet, information technology has dramatically improved thedeployment of ABC/M data for viewing, planning, and decision making. Power-ful database management systems and computing engines make data processingno longer an impediment to understanding costs.
22 REMOVING THE BLINDFOLD WITH ABC/M
3740 P-01 7/24/2001 12:39 PM Page 22
What makes ABC/M even more realizable is the fact that most data for de-cision making need not be accurate to several decimal places. In addition, a tech-nique for implementing ABC/M based on rapid prototyping scale models isassuring implementation success. In contrast to the long, multi-month, one-chance, single-design approach, the ABC/M rapid prototyping technique followsthe quick build of the initial model, built roughly in two days, by iterative re-modeling of increasingly larger scale ABC/M models. Eventually the larger scaleABC/M model becomes the organization’s repeatable and reliable productionsystem.
ABC/M in Advanced, Mature Users
Businesses like the Coca-Cola Company, DeLuxe Check, Navistar, and AlliedSignal Corporation have been performing ABC/M for many years. They are ad-vanced and mature ABC/M users who are interested in two goals: to institution-alize ABC/M company-wide into a permanent, repeatable, and reliable productionreporting system and to establish the ABC/M output data to serve as an enablerto their ongoing improvement programs, such as TQM, change management,cycle-time compression, core competency, BPR, product rationalization, targetcosting, and channel/customer profitability.
More recently, new issues for the advanced and mature ABC/M users areemerging; they include the following:
• Integrating the ABC/M output data with their decision-support systems, suchas their cost estimating, predictive planning, activity-based budgeting (ABB)systems, customer relationship management (CRM), and balanced scorecardperformance measurement systems.
• Learning the skills and rules for resizing, reshaping, releveling, and other-wise readjusting their ABC/M system’s structure in response to solving newbusiness problems with the ABC/M data.
• Collecting and automatically importing data into the ABC/M system.• Automatically exporting the calculated data out of their ABC/M system.
It is evident that among experienced ABC/M users, ABC/M eventually becomespart of their core information technologies.
More specifically, the output data of an ABC/M system is frequently theinput to another system, such as a customer order quotation system. ABC/M dataalso complement other productivity or logistics management tools such as simu-lation software, process modelers, business process flow charters, executive in-formation systems (EIS), and online analytical programs (OLAP). In the nextseveral years, there will be a convergence of tools as these now somewhat sepa-rate software applications become part of the manager’s and analyst’s tool suite.
Advanced, mature users are also masters at employing ABC/M “attributes,”which are scored and graded against the activities. ABC/M attributes allow man-agers to differentiate among activities. A popular attribute involves scoring
If ABC Is the Answer, What Is the Question? 23
3740 P-01 7/24/2001 12:39 PM Page 23

activities along their “high- versus low-value-adding” scale so that teams canfocus on the work that is more important. Multiple activities can be simultane-ously tagged with these attribute grades, and of course the amount of money trailsalong as part of the activity data. As an option, activities can be summarized intothe processes. Another option is to score or grade each activity by how well theorganization performs its work.
Two or more attributes can be combined to gain further insights. A popularcombination is the level of importance and the level of performance. With thesetwo independently judged scores for each activity, organizations can see, for ex-ample, that they are spending a lot of money doing things they are good at butthat they have judged to be unimportant. Some attributes are subjectively scoredor graded by managers and employees, and they introduce emotionally com-pelling business issues. I have often said that, “ABC/M adds the air-conditioningto the ABC/M data.”
Organizational Structure, Behavior, and Value Creation
Organizations are discovering that the business process performance levels nec-essary for their organization to remain competitive (or to continue to be ade-quately funded) exceed what is possible from conventional, highly vertical,functional organization forms. The traditional organizational model is becomingless valid as business processes transcend old departmental boundaries.
Future cost avoidance and performance improvement can be achieved onlythrough reconfiguring work activities into fewer, more integrated jobs. Optimiz-ing a stove-piped functional department can be a poor choice for the total orga-nization. On occasions there are competing performance measures: “As I dogood, you are adversely affected.” With this new way of thinking, traditionalmanagerial accounting comes up short. It fails to provide data for decision sup-port, and it prevents producing the kind of metrics to serve as inputs into balancedscorecard and performance measurement systems, including shareholder valueadded (SVA) methods.
How will managers and teams learn how to operationalize and actualize theirprocess-based thinking? How will they measure their processes or ever knowwhether cost-saving benefits are truly being realized? How will businessprocesses be managed and measured to prove that they are indeed creating valuerelative to their effort and cost?
One important way to answer these questions is to provide managers andteams with fact-based data in place of assertions and intuitive guesses. In addition,managers can benefit from visual aids that are supported with real and tangiblemetrics. Organizations will increasingly use diagrams and pictures, not justracked-and-stacked cost tables, to help employees truly visualize, discover, inter-nalize, and learn. The rate of organizational learning is considered by many astoday’s primary differentiator between gaining and losing organizations. If the rate
24 REMOVING THE BLINDFOLD WITH ABC/M
3740 P-01 7/24/2001 12:39 PM Page 24
of organizational learning is slow, that can be considered a major impediment toan organization’s growth and sustaining power.
ABC/M project managers have been slow to recognize the behavioral changemanagement aspects of the ABC/M data. ABC/M is a socio-technical tool, andthe emphasis should be on the social side. Many managers and ABC/M projectteams see ABC/M as simply a better measuring scheme or cost allocationmethod. However, its real value lies in introducing undebatable fact-based datathat can be used by employees to build business cases, quickly recognize busi-ness problems or opportunities, and test hypotheses. ABC/M has many of thecharacteristics of an organizational methodology.
Many managers are frustrated by the difficulties in bringing about changewithin their organizations. Behavioral change management is receiving wider at-tention, and ABC/M data are playing an important role in change. I encourageyou to be part of this change. One description of old age is that it starts as soonas your attachment to the past exceeds your excitement about the future. Sinceyou will live the rest of your life in the future, think young and be progressive.
One technique to consider comes from the great movie director, AlfredHitchcock. He referred to this method as using the superiority of suspense overshock. Make the audience squirm. Hitchcock would not simply film two menconversing at a table, and—boom—a bomb would go off. He would let the audi-ence know that a time bomb is planted and timed to go off as the two men areconversing. With ABC/M data, I encourage project teams to first have usersspeculate on the results before they see the real data. For example, have them listwho they think might be the unprofitable customers. Whether they guess right orwrong, the users will already have begun to think through many of the cost-and-effect relationships. Either their intuition will be validated or they will be sur-prised, but either reaction prepares them to better understand how ABC/Msupports the correct answer.
A Business Is Multidimensional
ABC/M contends that many important cost categories vary not with short-termchanges in output but with changes in the design, mix, and range of a company’sproducts, services, and customers. Once product and service-line costs are iden-tified, employees and managers begin to see the value of understanding the ac-tivities and their associated costs.
The primary use of ABC/M shifts from an accounting tool to a managementdecision support system for operational streamlining and strategic thinking—ABC/M is business intelligence. Information technology gathers and manages thisABC/M information, combining not just cost but also nonfinancial information andperformance measures. This enterprise-wide technology is called an activity-basedinformation system. As more managers have become aware of the activity and ofthe information that is available, additional applications for ABC/M have emerged,
If ABC Is the Answer, What Is the Question? 25
3740 P-01 7/24/2001 12:39 PM Page 25
including unused capacity management. ABC/M provides the lens that focuses onan organization’s efforts.
ABC/M and the Future
An overarching issue in ABC/M is the perception of it as just another way to spinfinancial data rather than as mission-critical managerial information. The Infor-mation Age can be mind-boggling. In our future, as technology advances, so willthe demand to access massive amounts of relevant information. The companiesthat survive will be those that can answer the following questions:
How do we access all this information?What do we do with it?How do we shape the data and put them in a form with which we can work?What will happen when we apply technologies developed during the Infor-
mation Age for the Information Age?
Clearly, as information technology evolves, organizations will increase theireffectiveness. Further, as markets change, companies and organizations will runinto global competitors that increasingly look to information and informationtechnology for competitive advantage. ABC/M is involved in this broad arena of“outsmartmanship.”
ABC/M puts the “management” back into management reporting. For thosewho are involved with ABC/M projects, the key is to create and orchestratechange rather than merely react to it and attempt to make the best of a poor situ-ation. It will be fun watching organizations move from their learning stages intomastery of building and using ABC/M systems.
STAGES OF EVOLUTION OF COST MANAGEMENT SYSTEMS
In the early 1990s Professor Robert S. Kaplan of the Harvard Business Schooldescribed four stages of cost management systems. Figure 1.10 extends his stagesof evolution with a fifth stage beyond Kaplan’s fourth stage, “integrated” costmanagement systems. The fifth stage that I propose focuses exclusively on deci-sion support. Following is a review of the standard four stages.2
Standard Four Stages of Cost Management Systems
Stage 1: Broken
Stage 1 cost management systems are primitive and fairly useless for managingan enterprise. At an extremely primitive level, an example would be a cigar boxbeing used for cash and coins at a child’s lemonade stand. The box serves the twopurposes of providing change for customers and determining at the close of busi-
26 REMOVING THE BLINDFOLD WITH ABC/M
3740 P-01 7/24/2001 12:39 PM Page 26
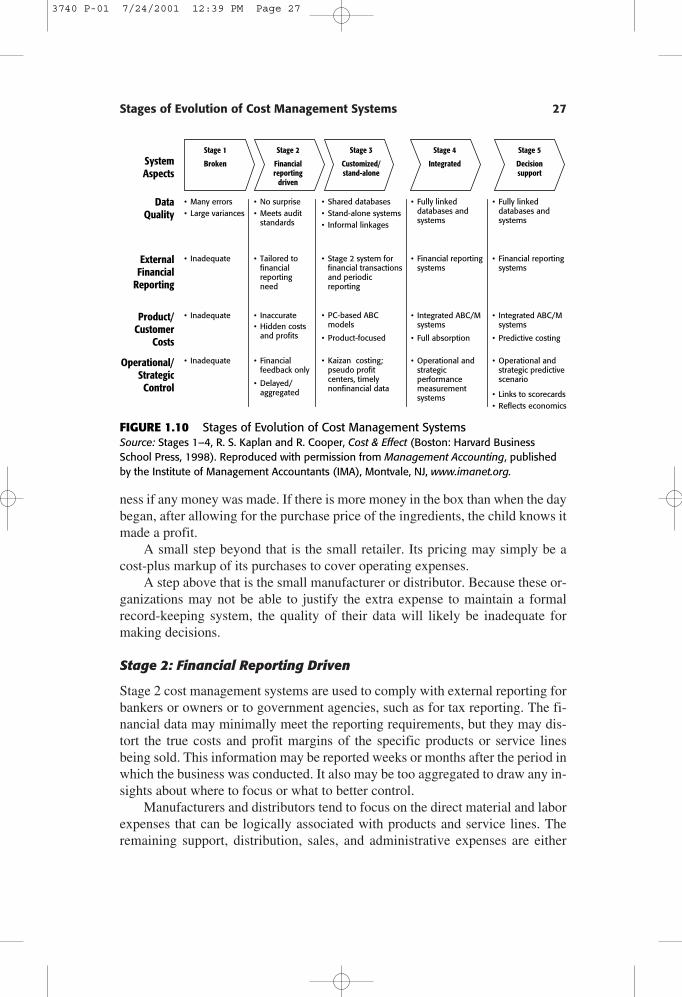
ness if any money was made. If there is more money in the box than when the daybegan, after allowing for the purchase price of the ingredients, the child knows itmade a profit.
A small step beyond that is the small retailer. Its pricing may simply be acost-plus markup of its purchases to cover operating expenses.
A step above that is the small manufacturer or distributor. Because these or-ganizations may not be able to justify the extra expense to maintain a formalrecord-keeping system, the quality of their data will likely be inadequate formaking decisions.
Stage 2: Financial Reporting Driven
Stage 2 cost management systems are used to comply with external reporting forbankers or owners or to government agencies, such as for tax reporting. The fi-nancial data may minimally meet the reporting requirements, but they may dis-tort the true costs and profit margins of the specific products or service linesbeing sold. This information may be reported weeks or months after the period inwhich the business was conducted. It also may be too aggregated to draw any in-sights about where to focus or what to better control.
Manufacturers and distributors tend to focus on the direct material and laborexpenses that can be logically associated with products and service lines. Theremaining support, distribution, sales, and administrative expenses are either
Stages of Evolution of Cost Management Systems 27
• Many errors• Large variances
• Inadequate
• Inadequate
• Inadequate
• No surprise• Meets audit
standards
• Tailored tofinancialreporting need
• Inaccurate• Hidden costs
and profits
• Financialfeedback only
• Delayed/aggregated
• Shared databases• Stand-alone systems• Informal linkages
• Stage 2 system forfinancial transactionsand periodic reporting
• PC-based ABCmodels
• Product-focused
• Kaizan costing;pseudo profit centers, timely nonfinancial data
• Fully linkeddatabases andsystems
• Financial reportingsystems
• Integrated ABC/Msystems
• Full absorption
• Operational andstrategicperformancemeasurementsystems
• Fully linkeddatabases andsystems
• Financial reportingsystems
• Integrated ABC/Msystems
• Predictive costing
• Operational andstrategic predictivescenario
• Links to scorecards• Reflects economics
Stage 2
Financialreporting
driven
Stage 1
BrokenSystemAspects
DataQuality
ExternalFinancial
Reporting
Product/Customer
Costs
Operational/StrategicControl
Stage 3
Customized/stand-alone
Stage 4
Integrated
Stage 5
Decisionsupport
FIGURE 1.10 Stages of Evolution of Cost Management SystemsSource: Stages 1–4, R. S. Kaplan and R. Cooper, Cost & Effect (Boston: Harvard BusinessSchool Press, 1998). Reproduced with permission from Management Accounting, publishedby the Institute of Management Accountants (IMA), Montvale, NJ, www.imanet.org.
3740 P-01 7/24/2001 12:39 PM Page 27

ignored or loosely linked to the costs of outputs. Simplistic overhead expense al-locations introduce distortions that can be large relative to the true costs.
Stage 3: Customized/Stand-Alone
Stage 3 cost management systems are designed to provide reasonable accuracyand visibility for decision making. This is the stage at which activity-based cost-ing begins to emerge. The variety and diversity of the products and service linesof these organizations will have expanded so much that indirect and supportoverhead expenses will have become a significant portion of the cost structure.Simplistic cost allocations, usually volume-based, are no longer sufficient to re-flect how much the individual outputs consume those expenses.
Whether the expenses are direct or indirect, the cost assignments are com-puted in a parallel or off-line model, not necessarily in a repeatable system. Theoperational data, such as the basis for tracing the indirect expenses to costs, isusually input as a separate step. For manufacturers, the assignment of overheadfor inventory costing may be based on simplistic assumptions, whereas the ac-tivity-based costs will be more reflective of use. The two methods produce dif-ferent results for different purposes. The inventory costing is used for externalreporting and the activity-based costing for strategic decision making or pricing.
Stage 4: Integrated
Stage 4 cost management systems are what many organizations aspire to. Thedatabases are linked to the calculation logic that traces the expenses to processesand to outputs. The resulting information can be reported for monitoring perfor-mance or simply to more accurately report spending for control or for profit mar-gin performance. The administrative effort to refresh the input data and updatethe results is much less than in Stage 3. The reporting is highly automated andsupported by powerful query and analysis tools. The distribution of the calculatedresults is more widely accessible to various users throughout the organization.
Fifth-Stage Cost Management System
Stage 5: Decision Support
Stage 5 is my extension of the first four. It represents more of a profit managementand value management system. It goes well beyond simply calculating and dis-tributing accurate and relevant cost information, providing information, and theflexibility to configure assumptions, for decision making.
All decisions affect the future, not the past. The past reflects past decisions,good or bad. The Stages 3 and 4 cost management systems originate in historicalrevenue and expense data. They are descriptive rather than prescriptive. It is toolate to do anything about what already happened. What ABC/M accomplishes is
28 REMOVING THE BLINDFOLD WITH ABC/M
3740 P-01 7/24/2001 12:39 PM Page 28

logical and defensible tracing of expenses so that managers and employee teamscan gain insights into and make inferences about where to focus and what tochange.
The formal step of actually taking actions based on inferences from past in-formation leads us into the broad realm of predictive costing, planning, and re-budgeting (during and after cost overruns). This will be the focus of Stage 5systems. Today this area resides in diverse pockets of an organization where costestimating, planning, and budgeting take place. Cost estimating is usually per-formed as an ad hoc analysis aimed at a single decision, such as a capital invest-ment justification or a make-versus-purchase outsource decision.
Another application of cost estimating may be to determine a price quotationto offer to secure a customer order. In price quoting, there are implicit assump-tions about cost rates and whether expenses are fixed or variable. In some casesthose assumptions may not be completely valid. A more powerful predictivecosting calculation engine and system will allow for more formal and flexibleconfiguring of assumptions of the consequences of decisions, in addition to thespecific inputs and outputs of a decision. These assumptions will recognize theimpact on capacities, specifically the adjustability of capacity and the resultingincreases or decreases in specific expenses during the time periods affected bythe decision.
As the Internet continues to shift power to buyers and away from suppliers,a defense for suppliers will be to induce the customers’ demands through a vari-ety of option offerings. The various options will be combinations of various prod-ucts, promotions, and alternative service levels offered at appropriate pricing tostimulate the customer to order and purchase. Much of this will be Web-basedand automated. Stage 5 systems will recognize the existing capability and ca-pacity of an organization and take that into account as they support predictivecosting. Stage 5 systems will be rule-based. (Chapter 4 discusses the new re-quirements of twenty-first-century e-commerce that will rely on Stage 5 andABC/M systems.)
History of ABC/M
ABC/M has gone through a metamorphosis. Figure 1.11 illustrates its variousstages. The historians of cost management may someday look back and brieflydescribe each era in this manner.
Pre-1950s
Following the days after 1492, when the Italian monk Lucas Pacioli documenteddouble-entry bookkeeping, accountants have put a lot of energy into developingmethods for better assigning expenses to costs. Many assignment methods, suchas project accounting and standard costing, appeared adequate. Some companies
Stages of Evolution of Cost Management Systems 29
3740 P-01 7/24/2001 12:39 PM Page 29
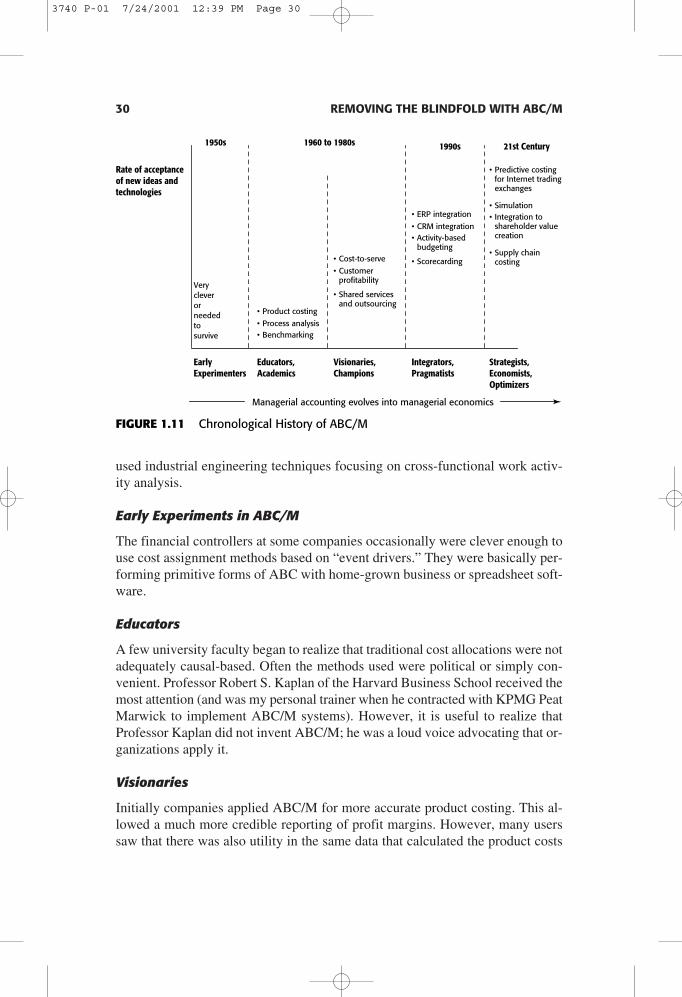
used industrial engineering techniques focusing on cross-functional work activ-ity analysis.
Early Experiments in ABC/M
The financial controllers at some companies occasionally were clever enough touse cost assignment methods based on “event drivers.” They were basically per-forming primitive forms of ABC with home-grown business or spreadsheet soft-ware.
Educators
A few university faculty began to realize that traditional cost allocations were notadequately causal-based. Often the methods used were political or simply con-venient. Professor Robert S. Kaplan of the Harvard Business School received themost attention (and was my personal trainer when he contracted with KPMG PeatMarwick to implement ABC/M systems). However, it is useful to realize thatProfessor Kaplan did not invent ABC/M; he was a loud voice advocating that or-ganizations apply it.
Visionaries
Initially companies applied ABC/M for more accurate product costing. This al-lowed a much more credible reporting of profit margins. However, many userssaw that there was also utility in the same data that calculated the product costs
30 REMOVING THE BLINDFOLD WITH ABC/M
Rate of acceptanceof new ideas andtechnologies
Educators,Academics
EarlyExperimenters
Visionaries,Champions
Integrators,Pragmatists
Strategists,Economists,Optimizers
Verycleverorneededtosurvive
• Product costing
• Process analysis• Benchmarking
• Cost-to-serve
• Customerprofitability
• Shared servicesand outsourcing
• ERP integration
• CRM integration• Activity-based
budgeting
• Scorecarding
• Predictive costingfor Internet tradingexchanges
• Simulation• Integration to
shareholder valuecreation
• Supply chaincosting
1950s 1960 to 1980s 1990s 21st Century
Managerial accounting evolves into managerial economics
FIGURE 1.11 Chronological History of ABC/M
3740 P-01 7/24/2001 12:39 PM Page 30

to address other problems. The ABC/M data were next applied for process analy-sis, BPR, and benchmarking. In 1988 Chris Pieper, the founder of ABC Tech-nologies, introduced an inexpensive yet flexible commercial ABC/M softwarecalled Easy ABC. This tool allowed for the arterial network of flowing costs, andsome of its users became visionaries. It didn’t take too long for these people to re-alize that the ABC/M method could be applied beyond products to other outputs,such as channels and customers. In commercial industry, this led to applyingABC/M for customer profitability analysis.
Integrators
In 1998, the German company SAP, the world leader in enterprise resource plan-ning (ERP) software, purchased a minority equity investment in the world leaderin ABC/M software, ABC Technologies Inc. This was a major event, signalingto the world that the large ERP production and planning systems were acknowl-edging ABC/M as credible and important. Soon other ERP vendors began to an-nounce the availability of ABC/M functionality. ABC/M began to be integratedwith other tools as well.
Economists and Optimizers
The thought leaders in cost management have begun to integrate the ABC/M datato support decision making. This involves predictive costing, not simply seg-menting and tracing historical costs. Linkages of trade-offs between customerprofitability and increases or decreases in shareholder value have been receivingintense scrutiny.
NOTES
1. As quoted in George Seldes, ed., The Great Thoughts (New York: BallantineBooks, 1985), p. 119.
2. Dr. Robert S. Kaplan, “The Four Stage Model of Cost Management,” Man-agement Accounting (February 1990).
Notes 31
3740 P-01 7/24/2001 12:39 PM Page 31