removing the capital cost barrier to low energy, high ... · removing the capital cost barrier to...
TRANSCRIPT
Removing the Capital Cost Barrierto Low Energy, High PerformanceBuildings in the Public Sector
Marlon KobackerDirector, Sustainable Future Group
W www.sustainablefuturegroup.com.au
Removing the Capital Cost Barrier
Removing the Capital Cost Barrier to Low Energy, High Performance Buildings
Removing the Capital Cost Barrier to Low Energy, High Performance Buildings
Removing the Capital Cost Barrier
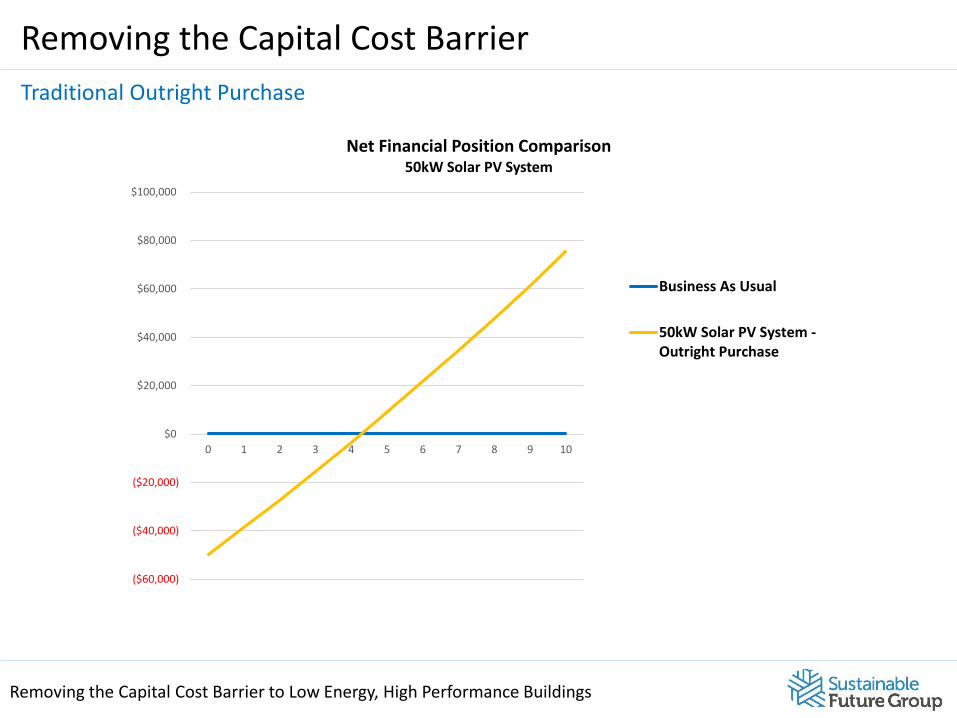
Traditional Outright Purchase
($60,000)
($40,000)
($20,000)
$0
$20,000
$40,000
$60,000
$80,000
$100,000
0 1 2 3 4 5 6 7 8 9 10
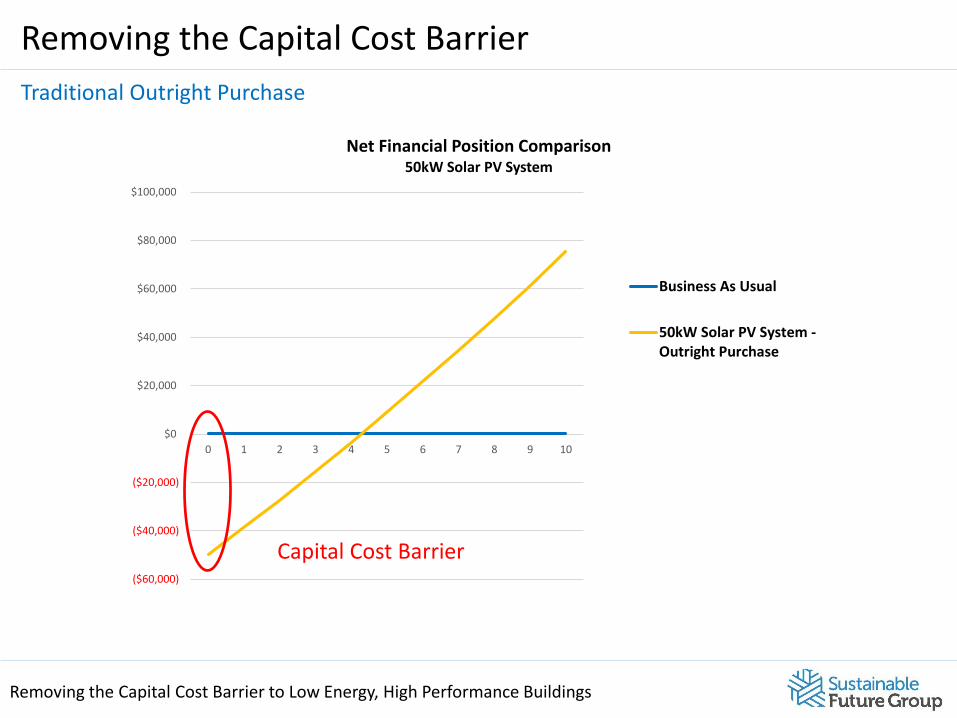
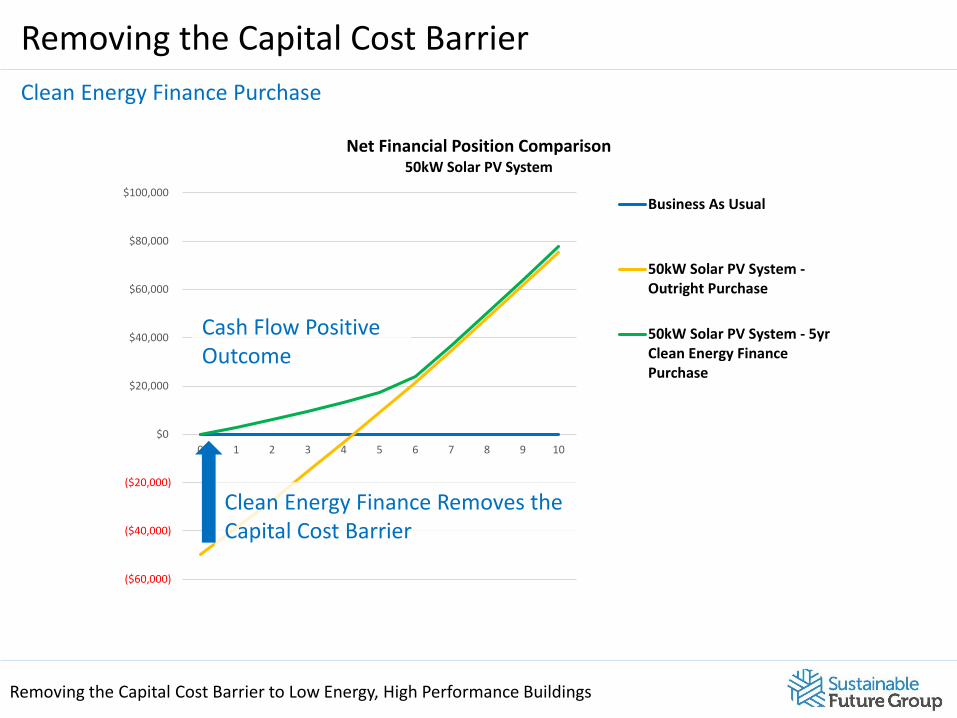
Net Financial Position Comparison50kW Solar PV System
Business As Usual
50kW Solar PV System -Outright Purchase
Removing the Capital Cost Barrier to Low Energy, High Performance Buildings
Removing the Capital Cost Barrier
($60,000)
($40,000)
($20,000)
$0
$20,000
$40,000
$60,000
$80,000
$100,000
0 1 2 3 4 5 6 7 8 9 10
Net Financial Position Comparison50kW Solar PV System
Business As Usual
50kW Solar PV System -Outright Purchase
Traditional Outright Purchase
Capital Cost Barrier
Removing the Capital Cost Barrier to Low Energy, High Performance Buildings
Removing the Capital Cost Barrier
($60,000)
($40,000)
($20,000)
$0
$20,000
$40,000
$60,000
$80,000
$100,000
0 1 2 3 4 5 6 7 8 9 10
Net Financial Position Comparison50kW Solar PV System
Business As Usual
50kW Solar PV System -Outright Purchase
50kW Solar PV System - 5yrClean Energy FinancePurchase
Cash Flow Positive Outcome
Clean Energy Finance Removes the Capital Cost Barrier
Clean Energy Finance Purchase
Clean Energy Finance Explained
Removing the Capital Cost Barrier to Low Energy, High Performance Buildings
Removing the Capital Cost Barrier to Low Energy, High Performance Buildings
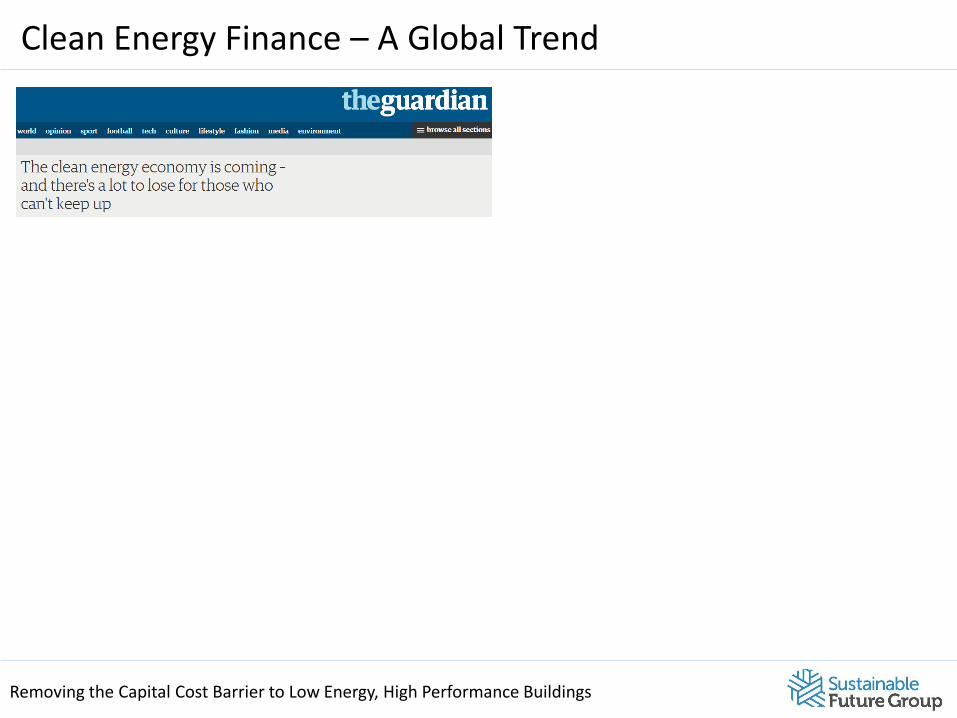
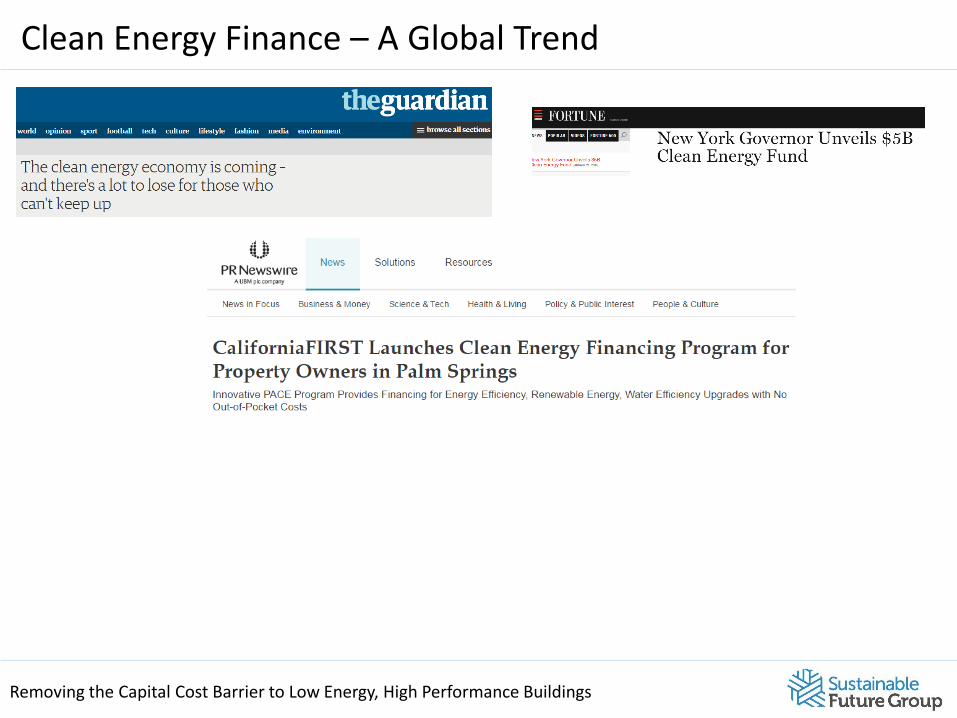
Clean Energy Finance – A Global Trend
Removing the Capital Cost Barrier to Low Energy, High Performance Buildings
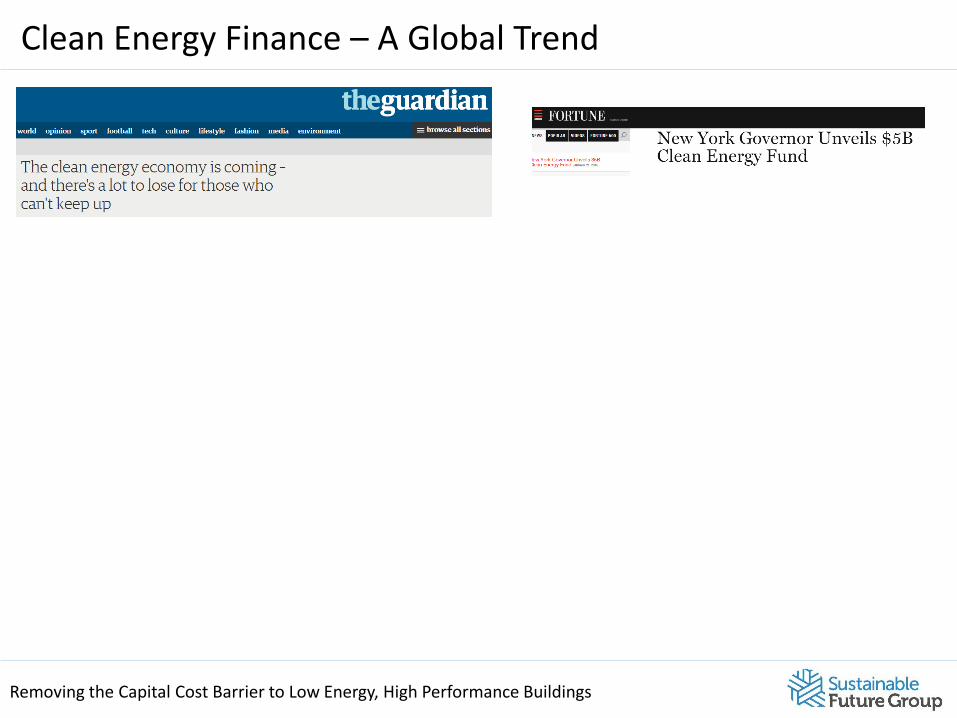
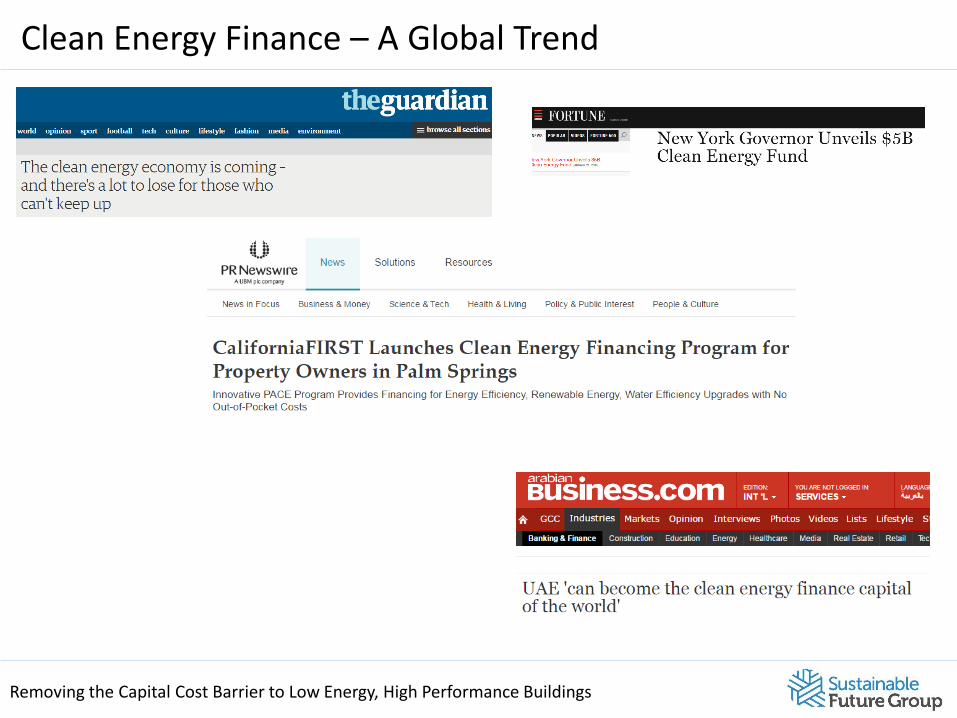
Clean Energy Finance – A Global Trend
Removing the Capital Cost Barrier to Low Energy, High Performance Buildings
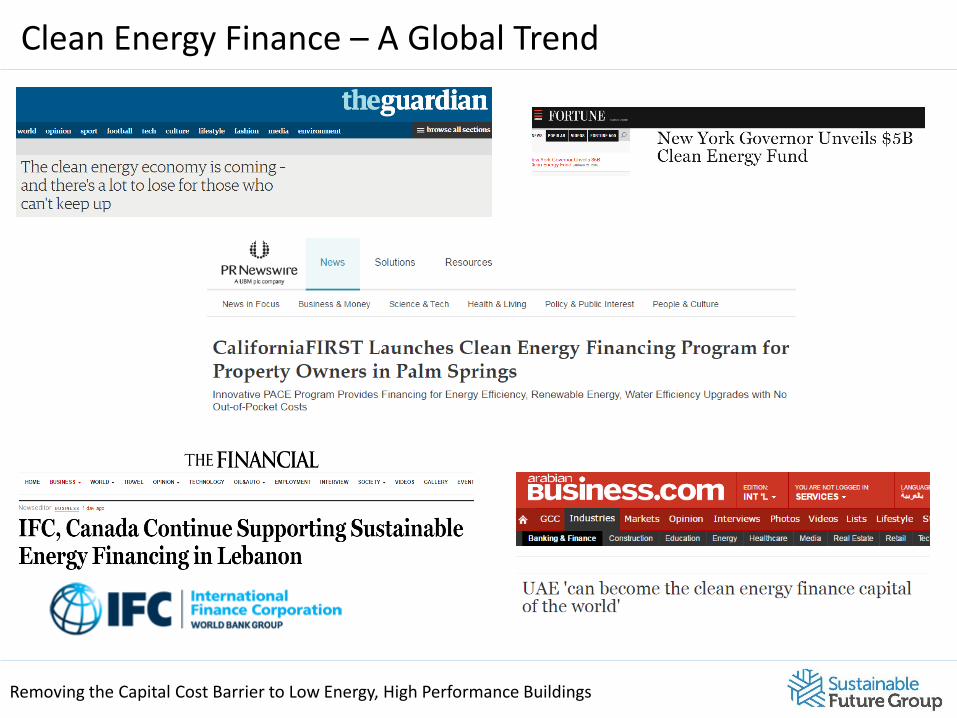
Clean Energy Finance – A Global Trend
Removing the Capital Cost Barrier to Low Energy, High Performance Buildings
Clean Energy Finance – A Global Trend
Removing the Capital Cost Barrier to Low Energy, High Performance Buildings
Clean Energy Finance – A Global Trend
Removing the Capital Cost Barrier to Low Energy, High Performance Buildings
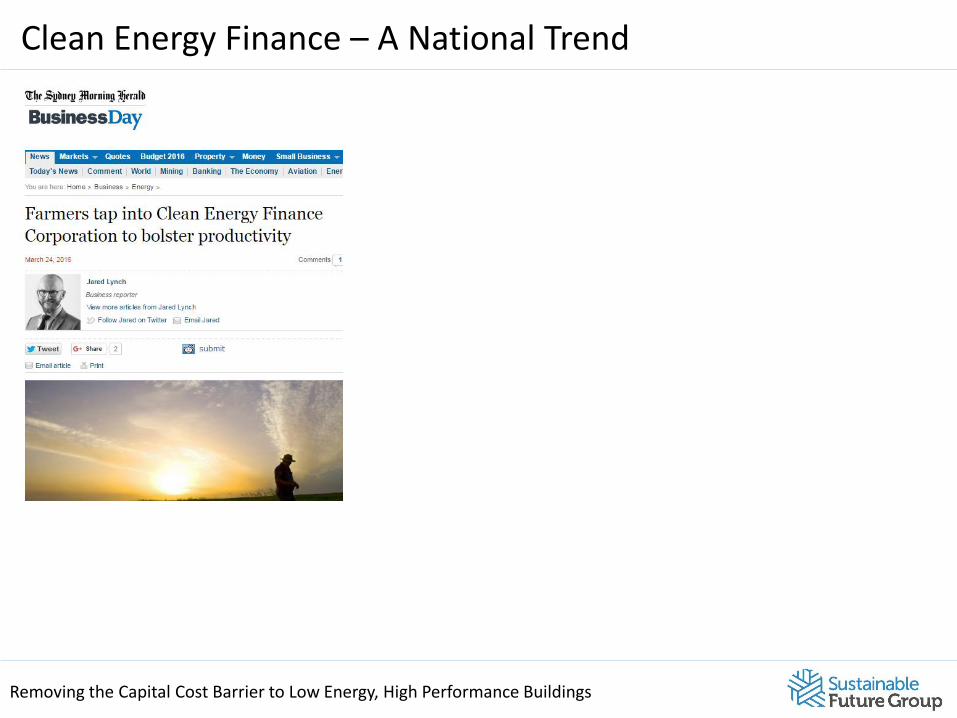
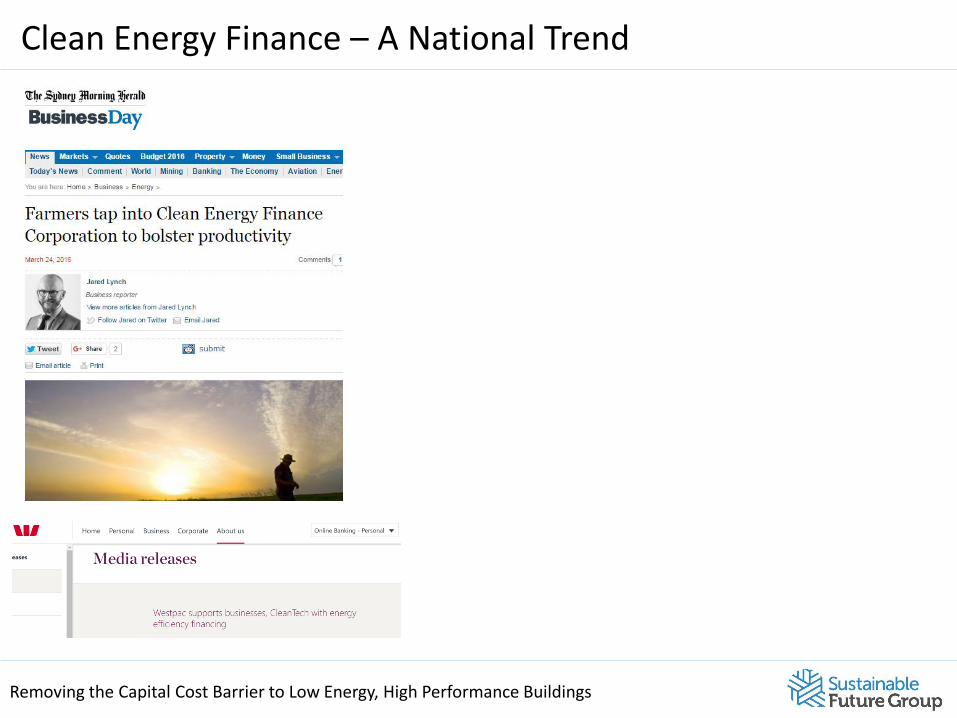
Clean Energy Finance – A National Trend
Removing the Capital Cost Barrier to Low Energy, High Performance Buildings
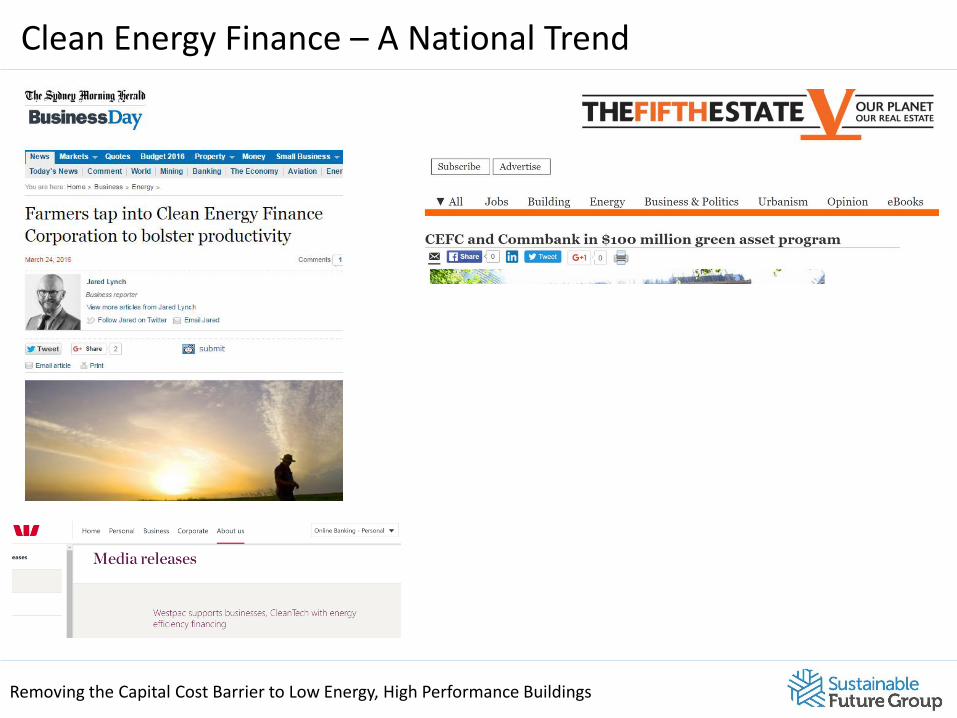
Clean Energy Finance – A National Trend
Removing the Capital Cost Barrier to Low Energy, High Performance Buildings
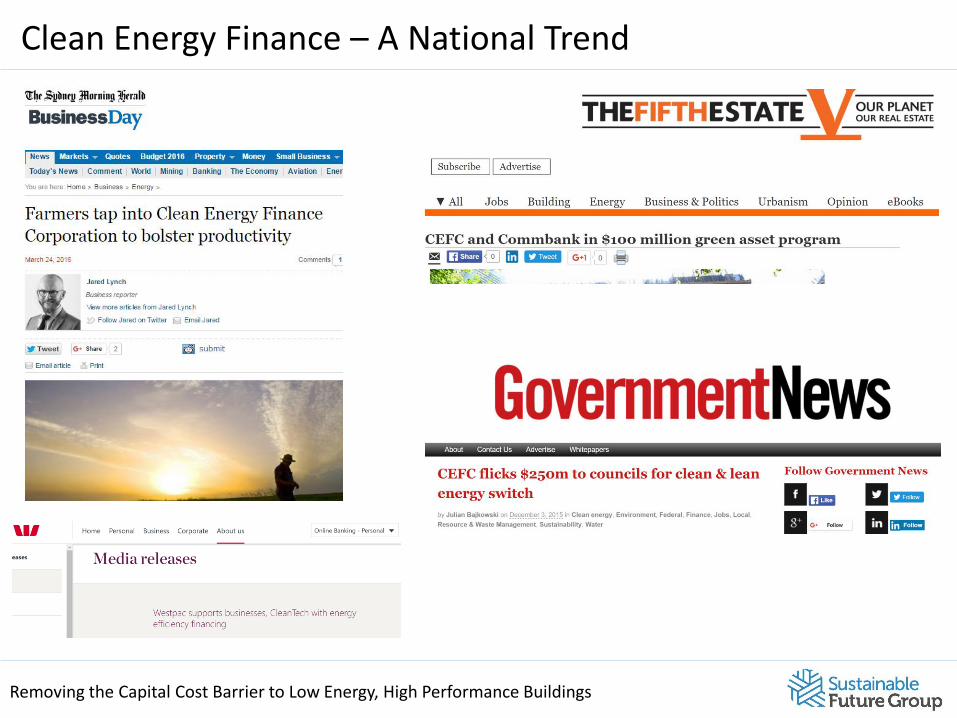
Clean Energy Finance – A National Trend
Removing the Capital Cost Barrier to Low Energy, High Performance Buildings
Clean Energy Finance – A National Trend
Removing the Capital Cost Barrier to Low Energy, High Performance Buildings
Clean Energy Finance Overview
• Typically medium-term loan (3-7 years) provided by a financial institution to fund efficiency projects
Removing the Capital Cost Barrier to Low Energy, High Performance Buildings
Clean Energy Finance Overview
• Typically medium-term loan (3-7 years) provided by a financial institution to fund efficiency projects
• Loan rate lower than market rates due to government subsidisation via Clean Energy Finance Corporation (CEFC)
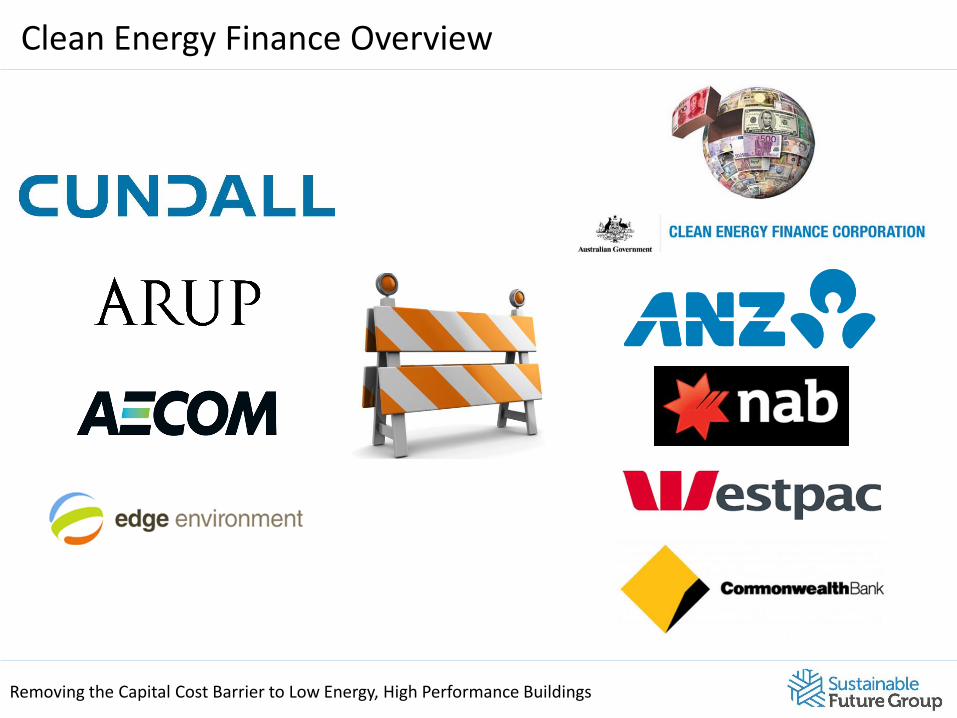
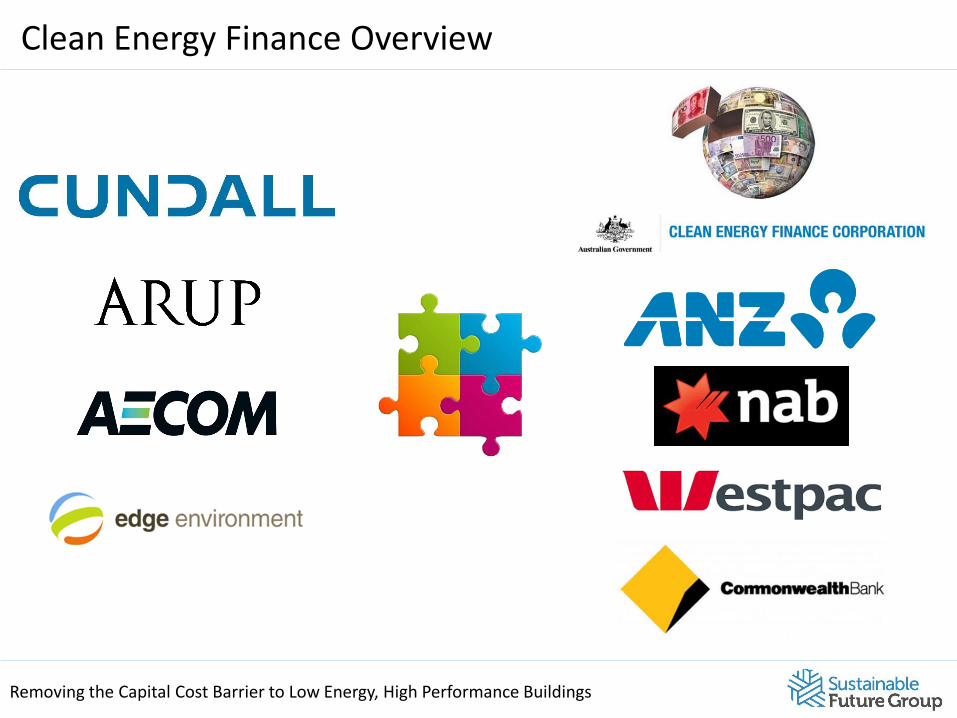
• CEFC funding currently offered by ANZ, NAB, Westpac, CBA, Macquarie (blended rate)
Removing the Capital Cost Barrier to Low Energy, High Performance Buildings
Clean Energy Finance Overview
• Typically medium-term loan (3-7 years) provided by a financial institution to fund efficiency projects
• Loan rate lower than market rates due to government subsidisation via Clean Energy Finance Corporation (CEFC)
• CEFC funding currently offered by ANZ, NAB, Westpac, CBA, Macquarie (blended rate)
• Operational cost savings can cover up to and in excess of 100% of loan repayments (depending on cost effectiveness)
• Loan term typically the length of simple payback period, and can be adjusted to create a cash flow positive outcome
• More cost effective initiatives = shorter loan period
• Once loan is repaid, 100% of savings banked
Removing the Capital Cost Barrier to Low Energy, High Performance Buildings
Clean Energy Finance Overview
Removing the Capital Cost Barrier to Low Energy, High Performance Buildings
Clean Energy Finance Overview
Project Examples
Removing the Capital Cost Barrier to Low Energy, High Performance Buildings
1. Museum
2. Affordable Housing
3. Remote Indigenous Community
4. Schools Program
Removing the Capital Cost Barrier to Low Energy, High Performance Buildings
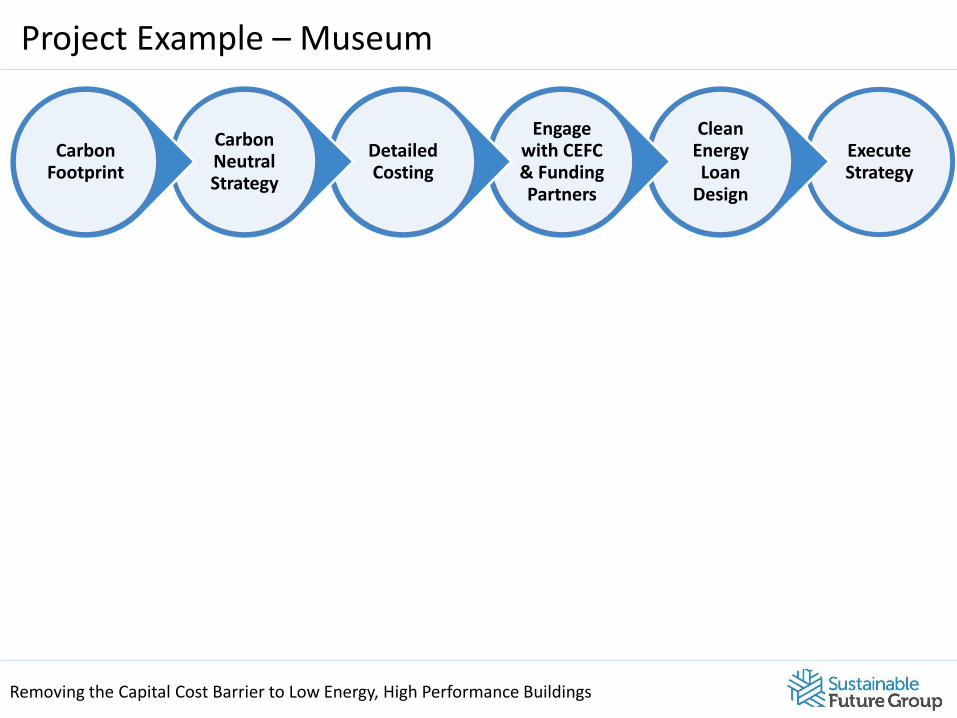
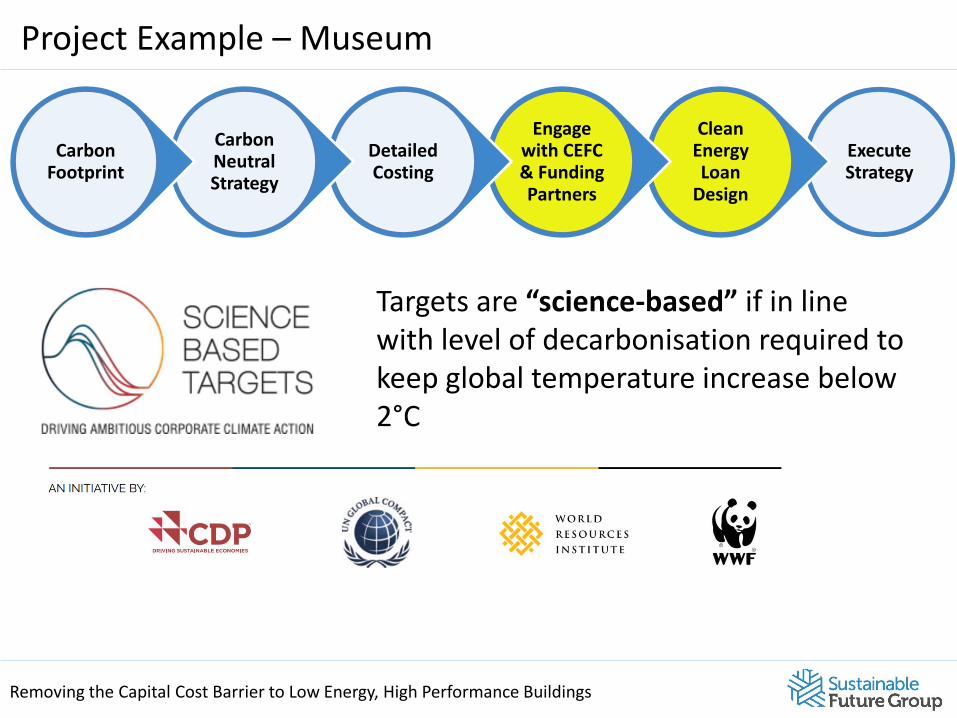
Project Example – Museum
Execute Strategy
Clean Energy Loan
Design
Engage with CEFC & Funding Partners
Detailed Costing
Carbon Neutral Strategy
Carbon Footprint
Removing the Capital Cost Barrier to Low Energy, High Performance Buildings
Project Example – Museum
Execute Strategy
Clean Energy Loan
Design
Engage with CEFC & Funding Partners
Detailed Costing
Carbon Neutral Strategy
Carbon Footprint
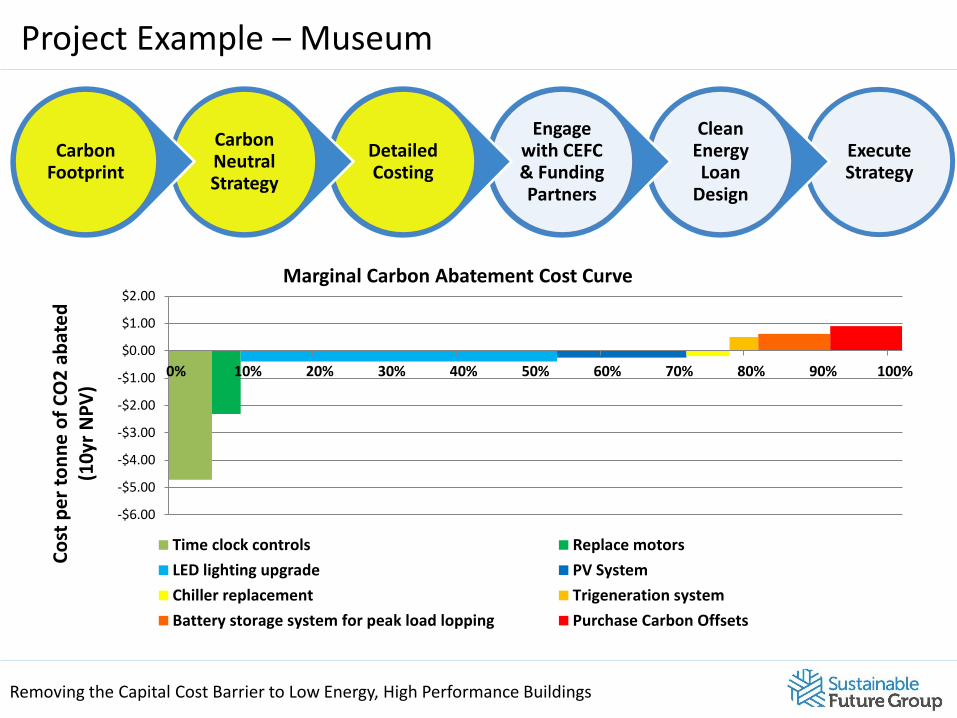
-$6.00
-$5.00
-$4.00
-$3.00
-$2.00
-$1.00
$0.00
$1.00
$2.00
0% 10% 20% 30% 40% 50% 60% 70% 80% 90% 100%
Co
st p
er
ton
ne
of
CO
2 a
bat
ed
(1
0yr
NP
V)
Marginal Carbon Abatement Cost Curve
Time clock controls Replace motors
LED lighting upgrade PV System
Chiller replacement Trigeneration system
Battery storage system for peak load lopping Purchase Carbon Offsets
Removing the Capital Cost Barrier to Low Energy, High Performance Buildings
Project Example – Museum
Execute Strategy
Clean Energy Loan
Design
Engage with CEFC & Funding Partners
Detailed Costing
Carbon Neutral Strategy
Carbon Footprint
($1,500,000)
($1,000,000)
($500,000)
$0
$500,000
$1,000,000
$1,500,000
0 1 2 3 4 5 6 7 8 9 10
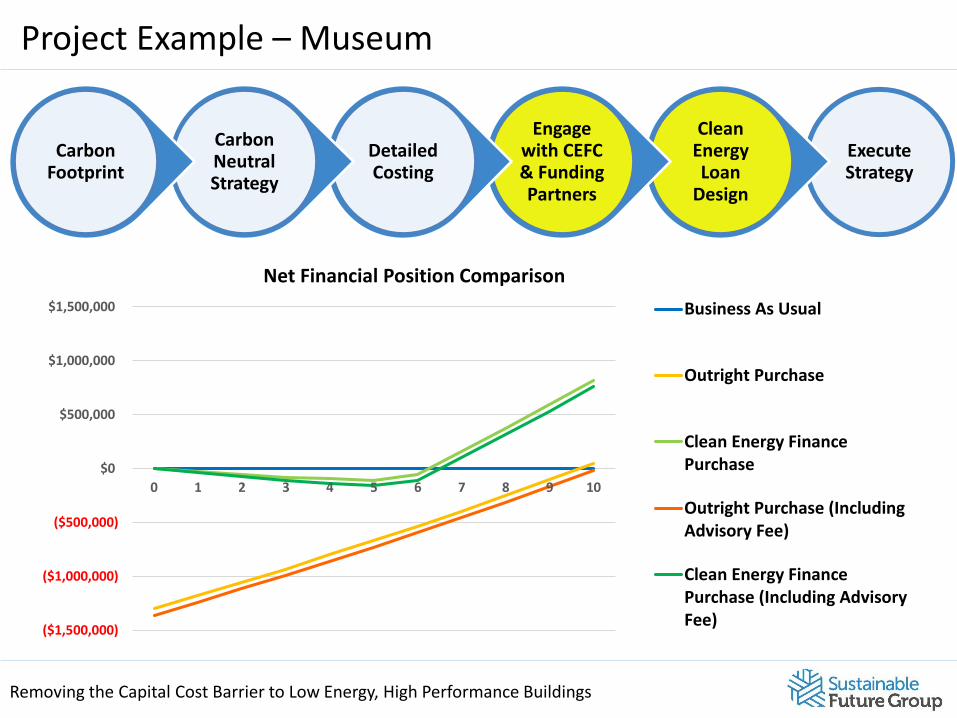
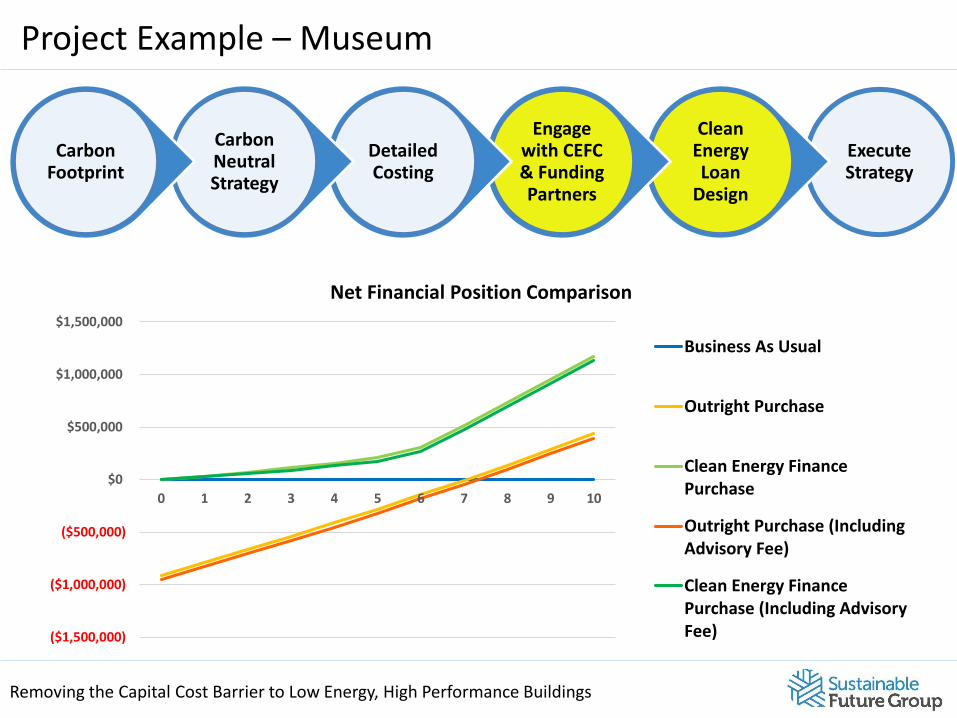
Net Financial Position Comparison
Business As Usual
Outright Purchase
Clean Energy FinancePurchase
Outright Purchase (IncludingAdvisory Fee)
Clean Energy FinancePurchase (Including AdvisoryFee)
Removing the Capital Cost Barrier to Low Energy, High Performance Buildings
Project Example – Museum
Execute Strategy
Clean Energy Loan
Design
Engage with CEFC & Funding Partners
Detailed Costing
Carbon Neutral Strategy
Carbon Footprint
Targets are “science-based” if in line with level of decarbonisation required to keep global temperature increase below 2°C
Removing the Capital Cost Barrier to Low Energy, High Performance Buildings
Project Example – Museum
Execute Strategy
Clean Energy Loan
Design
Engage with CEFC & Funding Partners
Detailed Costing
Carbon Neutral Strategy
Carbon Footprint
($1,500,000)
($1,000,000)
($500,000)
$0
$500,000
$1,000,000
$1,500,000
0 1 2 3 4 5 6 7 8 9 10
Net Financial Position Comparison
Business As Usual
Outright Purchase
Clean Energy FinancePurchase
Outright Purchase (IncludingAdvisory Fee)
Clean Energy FinancePurchase (Including AdvisoryFee)
Removing the Capital Cost Barrier to Low Energy, High Performance Buildings
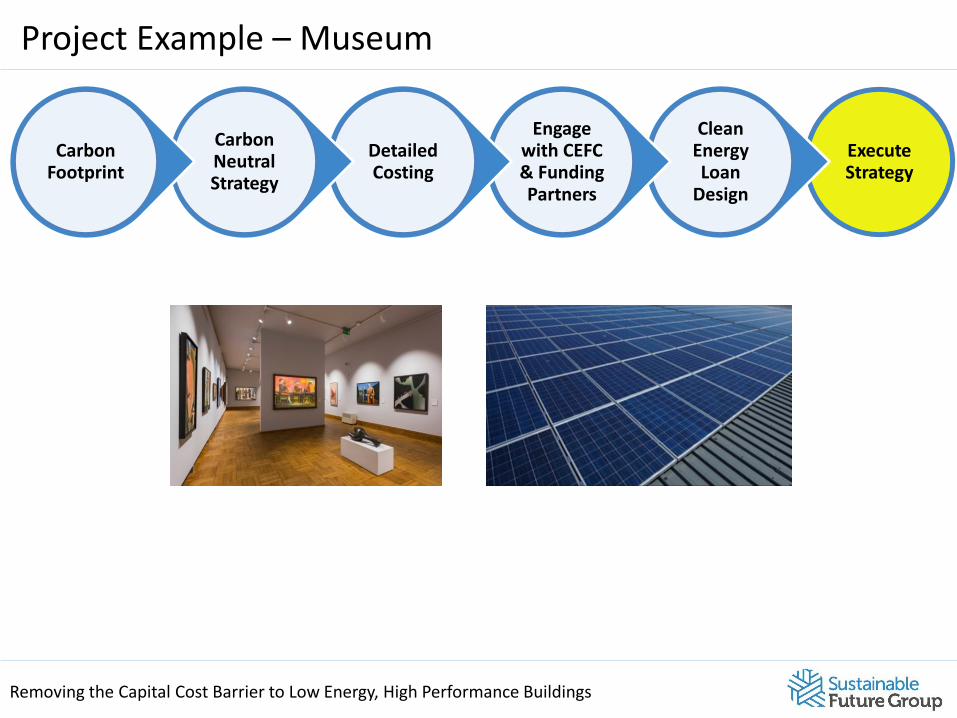
Project Example – Museum
Execute Strategy
Clean Energy Loan
Design
Engage with CEFC & Funding Partners
Detailed Costing
Carbon Neutral Strategy
Carbon Footprint
Removing the Capital Cost Barrier to Low Energy, High Performance Buildings
Global & National Context
2050 Targets0%
-20%
-40%
-60%
-80%
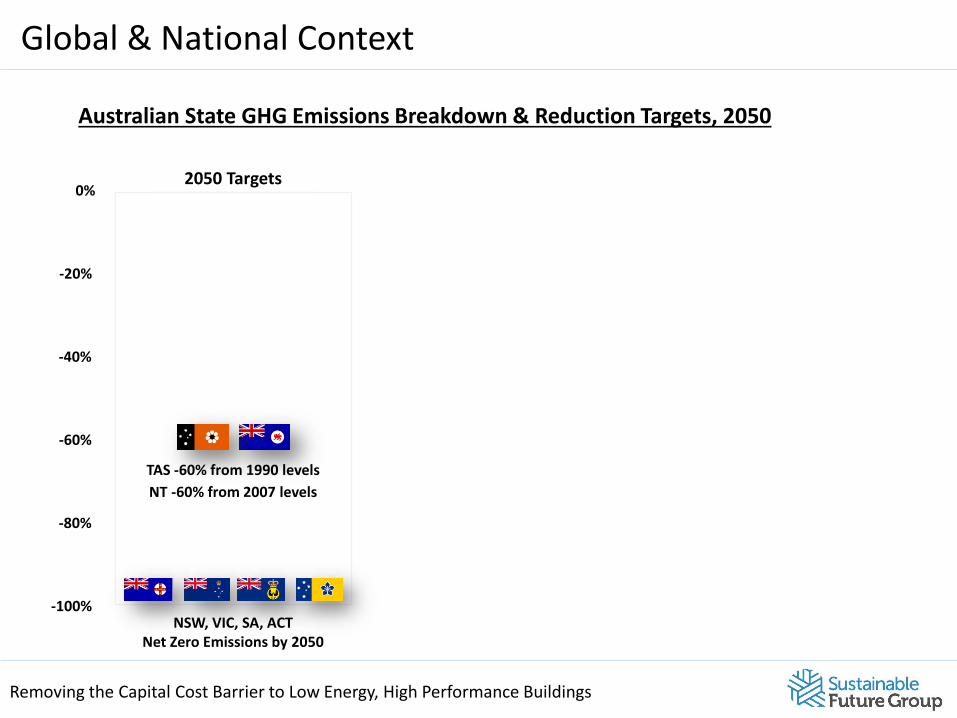
-100%NSW, VIC, SA, ACT
Net Zero Emissions by 2050
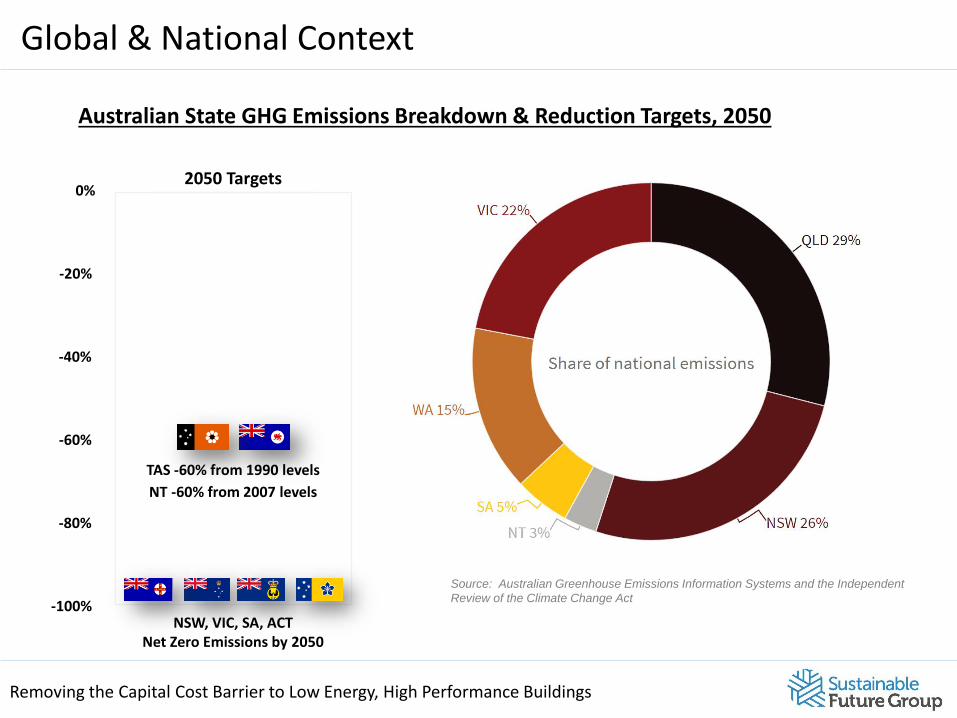
Australian State GHG Emissions Breakdown & Reduction Targets, 2050
TAS -60% from 1990 levels
NT -60% from 2007 levels
Removing the Capital Cost Barrier to Low Energy, High Performance Buildings
Global & National Context
2050 Targets0%
-20%
-40%
-60%
-80%
-100%NSW, VIC, SA, ACT
Net Zero Emissions by 2050
Australian State GHG Emissions Breakdown & Reduction Targets, 2050
Source: Australian Greenhouse Emissions Information Systems and the Independent
Review of the Climate Change Act
TAS -60% from 1990 levels
NT -60% from 2007 levels
Removing the Capital Cost Barrier to Low Energy, High Performance Buildings
Global & National Context
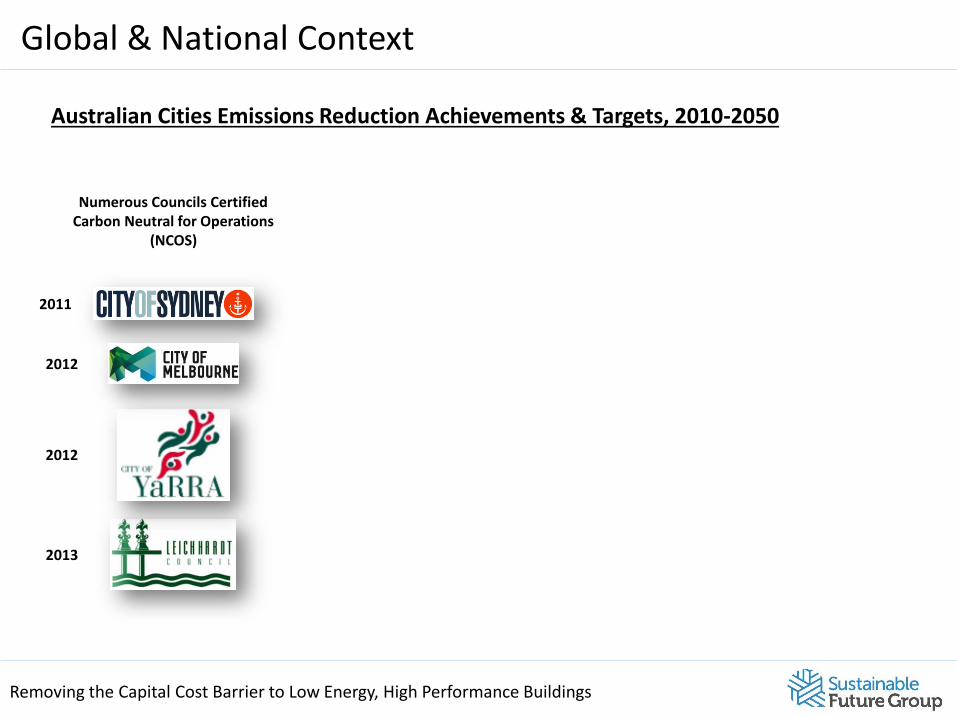
Numerous Councils Certified Carbon Neutral for Operations
(NCOS)
2011
2012
2013
2012
Australian Cities Emissions Reduction Achievements & Targets, 2010-2050
Removing the Capital Cost Barrier to Low Energy, High Performance Buildings
Global & National Context
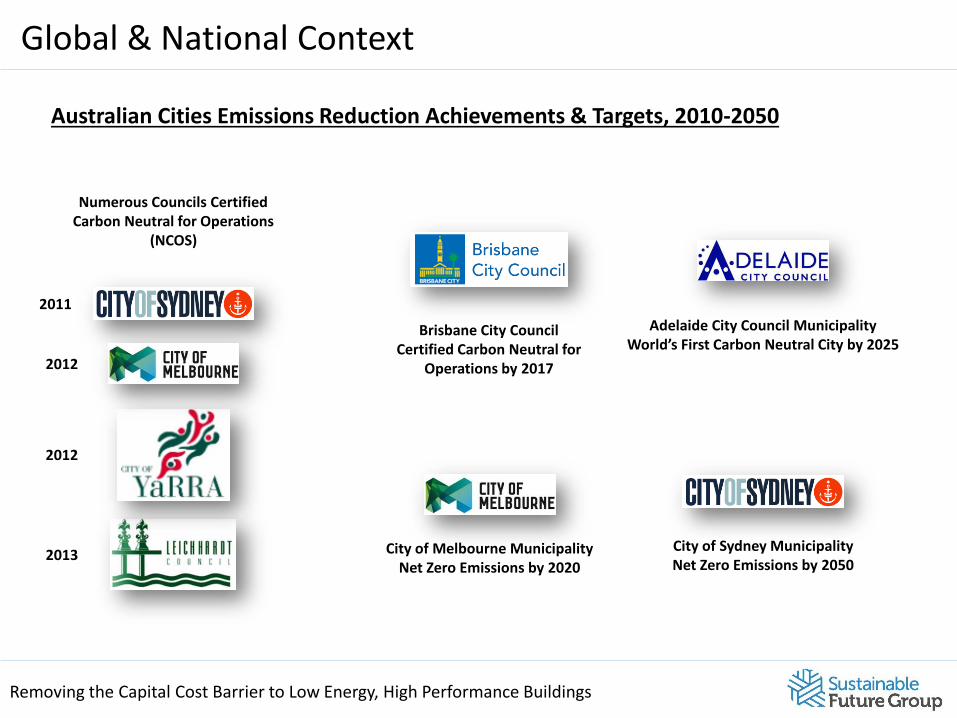
City of Sydney MunicipalityNet Zero Emissions by 2050
City of Melbourne MunicipalityNet Zero Emissions by 2020
Brisbane City Council Certified Carbon Neutral for
Operations by 2017
Numerous Councils Certified Carbon Neutral for Operations
(NCOS)
Adelaide City Council MunicipalityWorld’s First Carbon Neutral City by 2025
2011
2012
2013
2012
Australian Cities Emissions Reduction Achievements & Targets, 2010-2050
-30%
Removing the Capital Cost Barrier to Low Energy, High Performance Buildings
Global & National Context
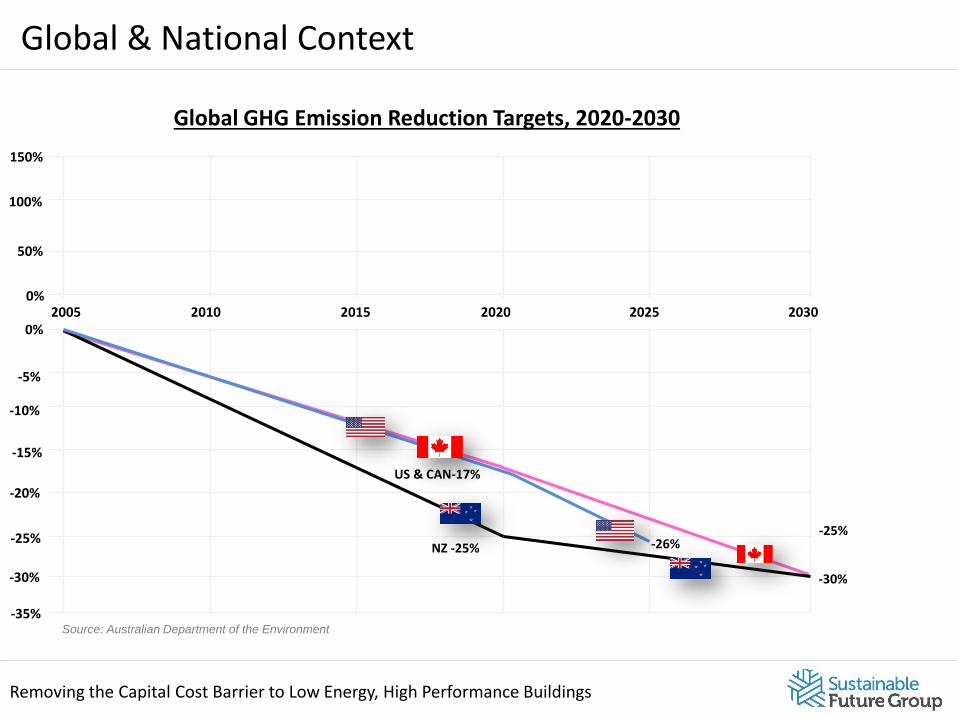
Source: Australian Department of the Environment
2005 2010 2015 2020 2025 2030
150%
100%
50%
0%
-5%
-10%
-15%
-20%
-25%
-30%
-35%
0%
US & CAN-17%
NZ -25%
-25%
Global GHG Emission Reduction Targets, 2020-2030
-26%
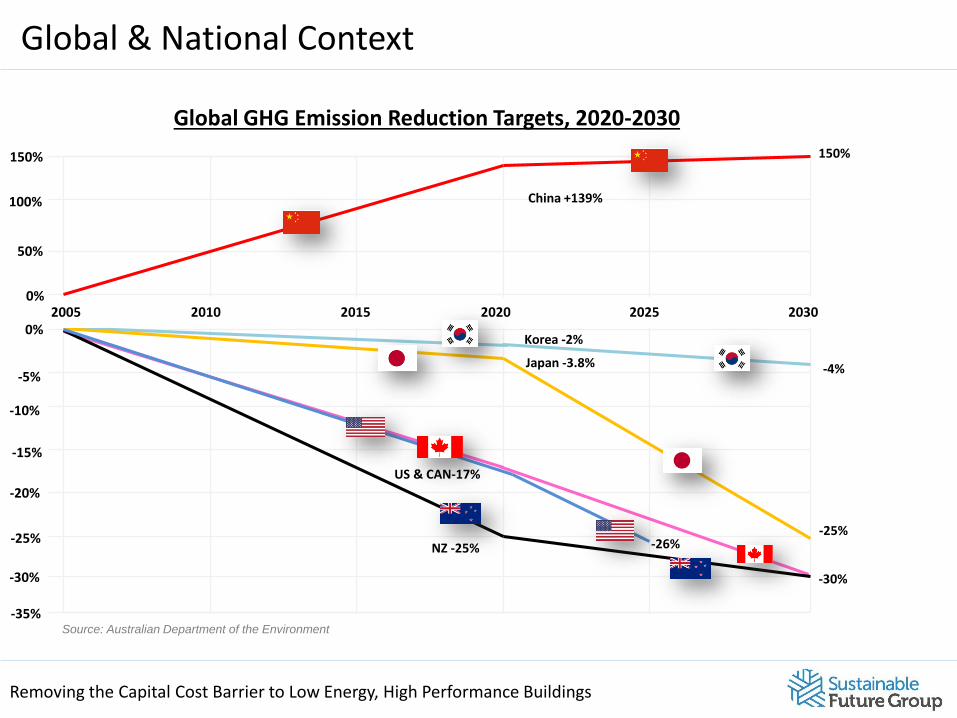
-30%
Removing the Capital Cost Barrier to Low Energy, High Performance Buildings
Global & National Context
Source: Australian Department of the Environment
2005 2010 2015 2020 2025 2030
150%
100%
50%
0%
-5%
-10%
-15%
-20%
-25%
-30%
-35%
0%
150%
Japan -3.8%
Korea -2%
US & CAN-17%
NZ -25%
China +139%
-4%
-25%-26%
Global GHG Emission Reduction Targets, 2020-2030
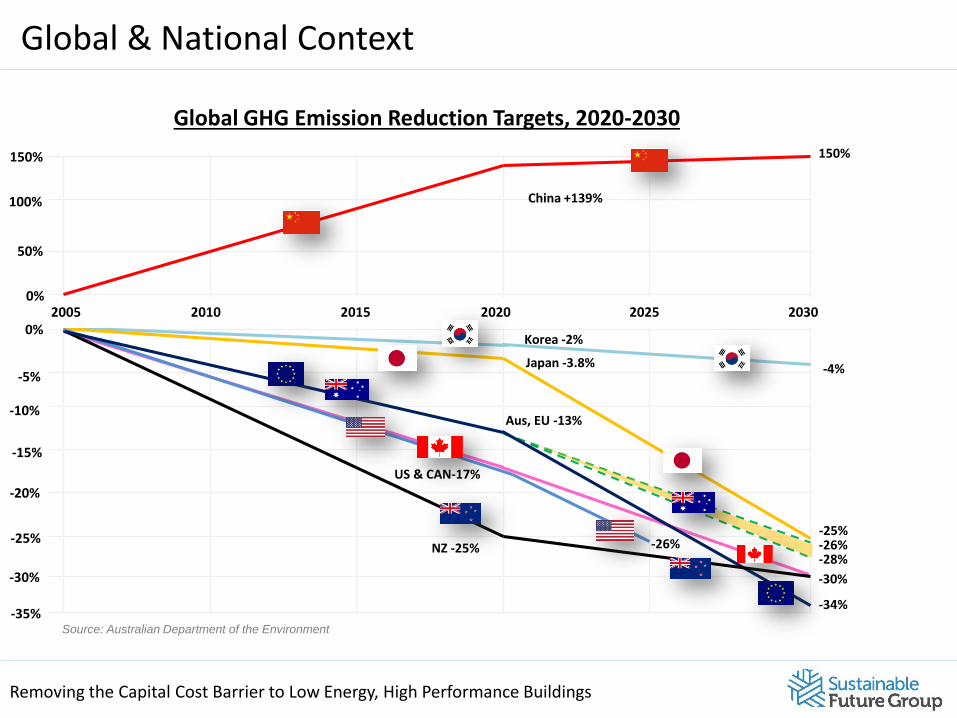
-30%
Removing the Capital Cost Barrier to Low Energy, High Performance Buildings
Global & National Context
Source: Australian Department of the Environment
2005 2010 2015 2020 2025 2030
150%
100%
50%
0%
-5%
-10%
-15%
-20%
-25%
-30%
-35%
0%
150%
Aus, EU -13%
Japan -3.8%
Korea -2%
US & CAN-17%
NZ -25%
China +139%
-4%
-25%-26%-28%
-34%
-26%
Global GHG Emission Reduction Targets, 2020-2030
Removing the Capital Cost Barrier to Low Energy, High Performance Buildings
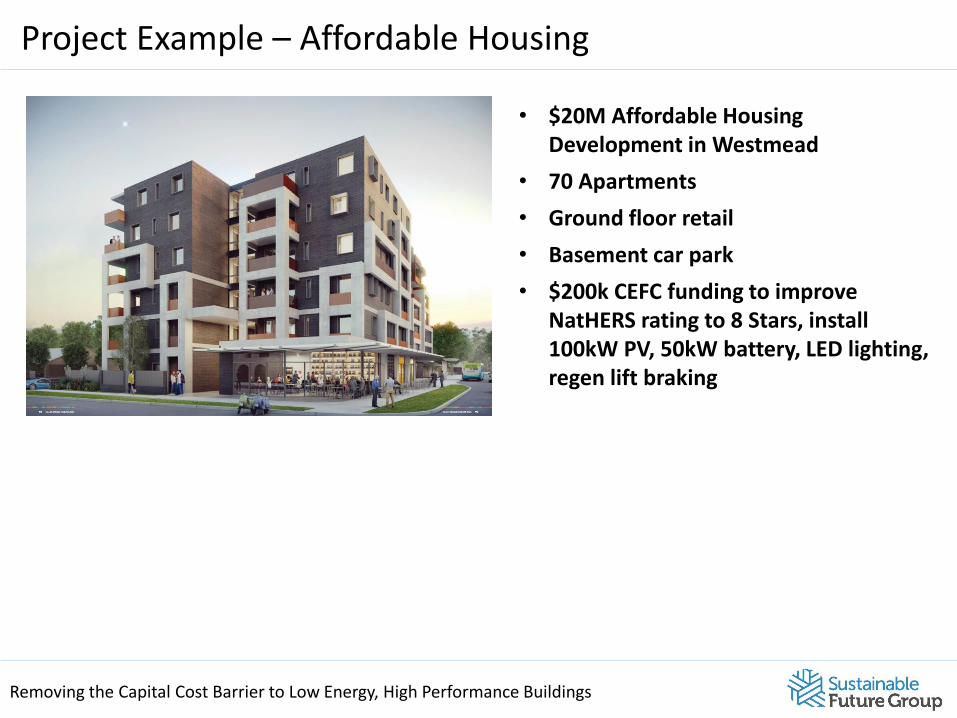
Project Example – Affordable Housing
• $20M Affordable Housing Development in Westmead
• 70 Apartments
• Ground floor retail
• Basement car park
• $200k CEFC funding to improve NatHERS rating to 8 Stars, install 100kW PV, 50kW battery, LED lighting, regen lift braking
Removing the Capital Cost Barrier to Low Energy, High Performance Buildings
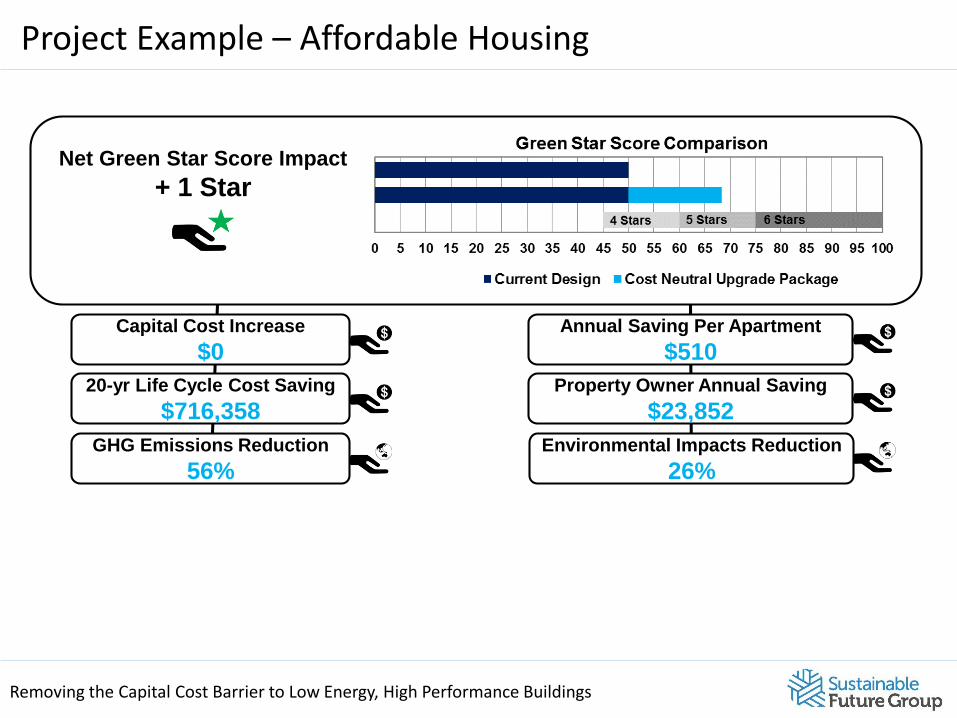
Project Example – Affordable Housing
Capital Cost Increase
$0
20-yr Life Cycle Cost Saving
$716,358
Net Green Star Score Impact
+ 1 Star
GHG Emissions Reduction
56%
Annual Saving Per Apartment
$510
Property Owner Annual Saving
$23,852
Environmental Impacts Reduction
26%
Removing the Capital Cost Barrier to Low Energy, High Performance Buildings
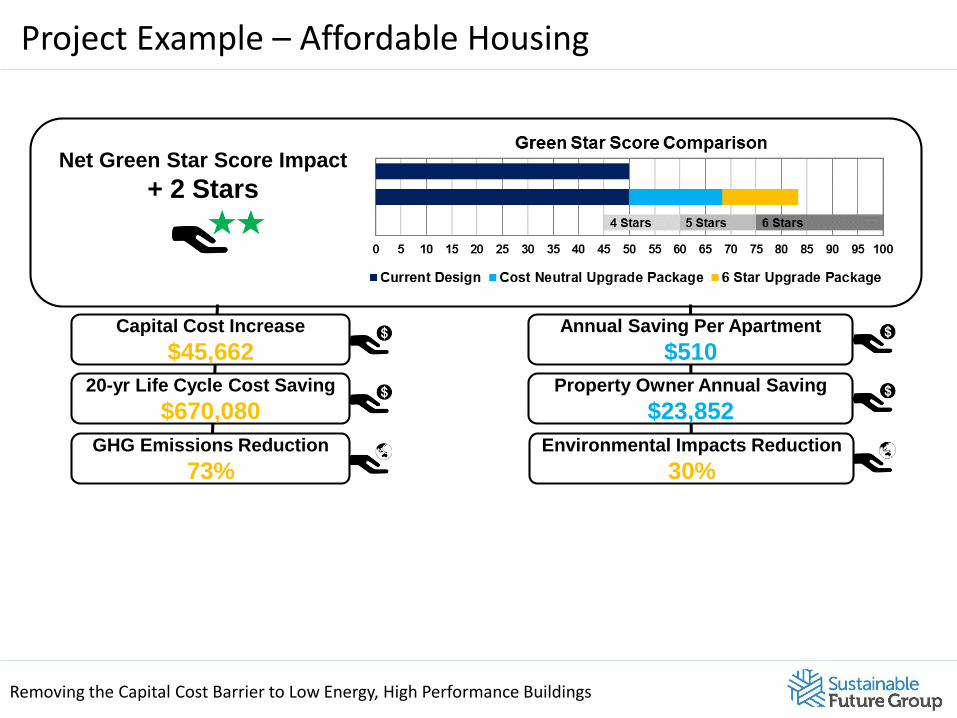
Project Example – Affordable Housing
Net Green Star Score Impact
+ 2 Stars
Capital Cost Increase
$45,662
20-yr Life Cycle Cost Saving
$670,080
GHG Emissions Reduction
73%
Annual Saving Per Apartment
$510
Property Owner Annual Saving
$23,852
Environmental Impacts Reduction
30%
Removing the Capital Cost Barrier to Low Energy, High Performance Buildings
Project Example – Remote Indigenous Community
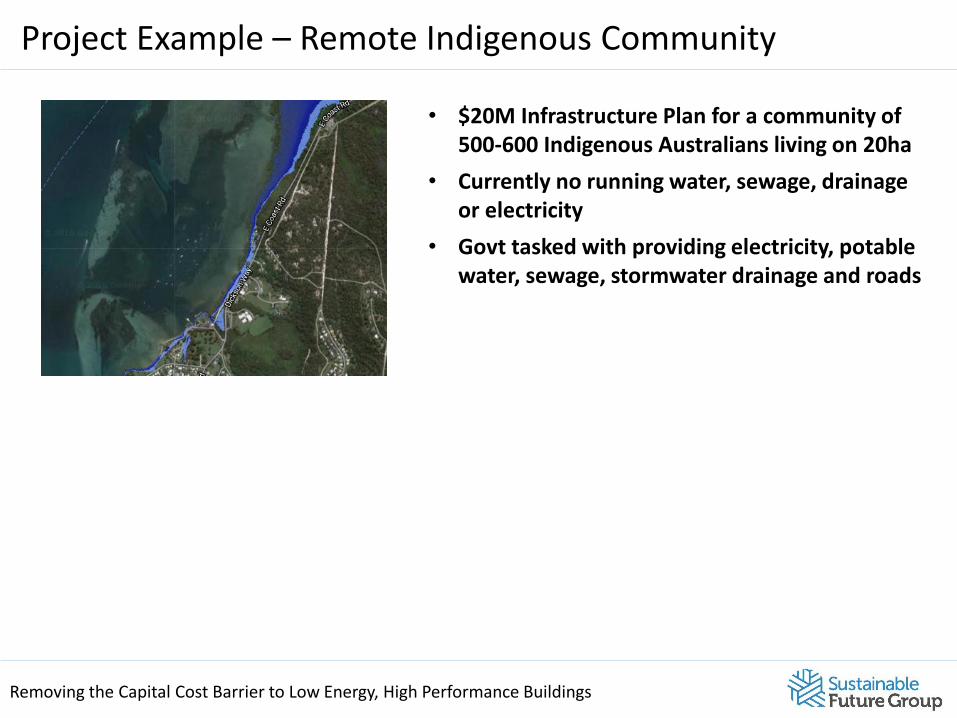
• $20M Infrastructure Plan for a community of 500-600 Indigenous Australians living on 20ha
• Currently no running water, sewage, drainage or electricity
• Govt tasked with providing electricity, potable water, sewage, stormwater drainage and roads
Removing the Capital Cost Barrier to Low Energy, High Performance Buildings
Project Example – Remote Indigenous Community
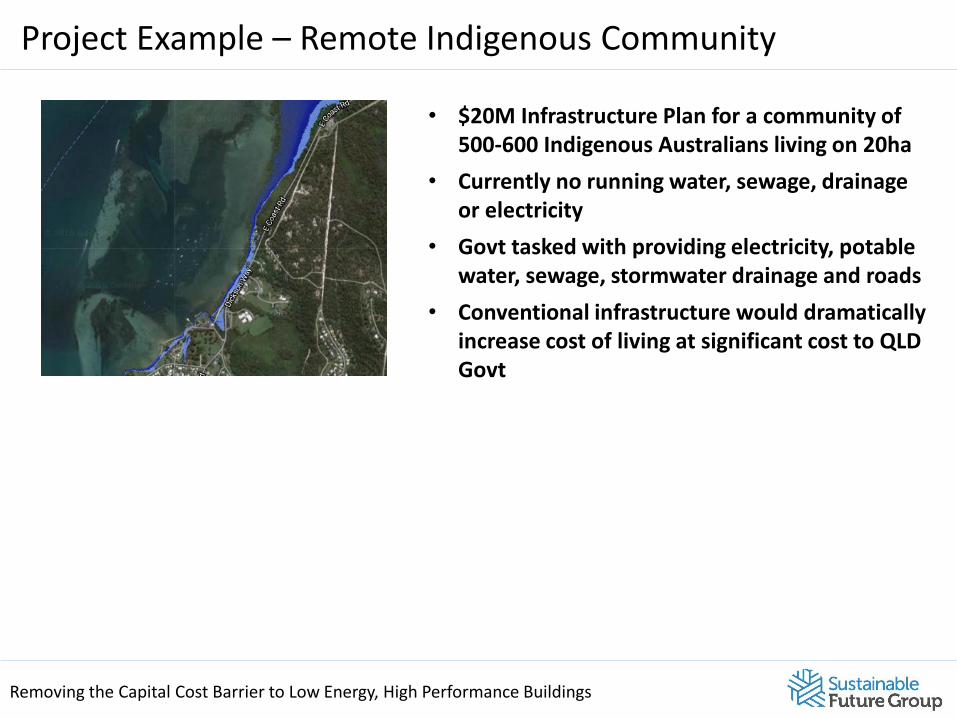
• $20M Infrastructure Plan for a community of 500-600 Indigenous Australians living on 20ha
• Currently no running water, sewage, drainage or electricity
• Govt tasked with providing electricity, potable water, sewage, stormwater drainage and roads
• Conventional infrastructure would dramatically increase cost of living at significant cost to QLD Govt
Removing the Capital Cost Barrier to Low Energy, High Performance Buildings
Project Example – Remote Indigenous Community
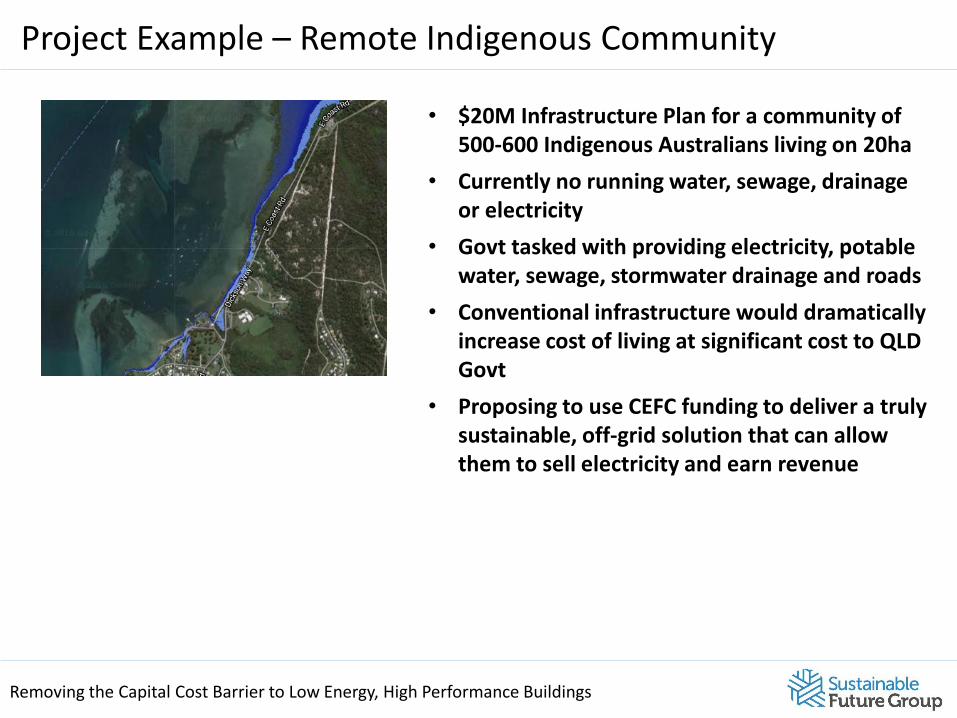
• $20M Infrastructure Plan for a community of 500-600 Indigenous Australians living on 20ha
• Currently no running water, sewage, drainage or electricity
• Govt tasked with providing electricity, potable water, sewage, stormwater drainage and roads
• Conventional infrastructure would dramatically increase cost of living at significant cost to QLD Govt
• Proposing to use CEFC funding to deliver a truly sustainable, off-grid solution that can allow them to sell electricity and earn revenue
Removing the Capital Cost Barrier to Low Energy, High Performance Buildings
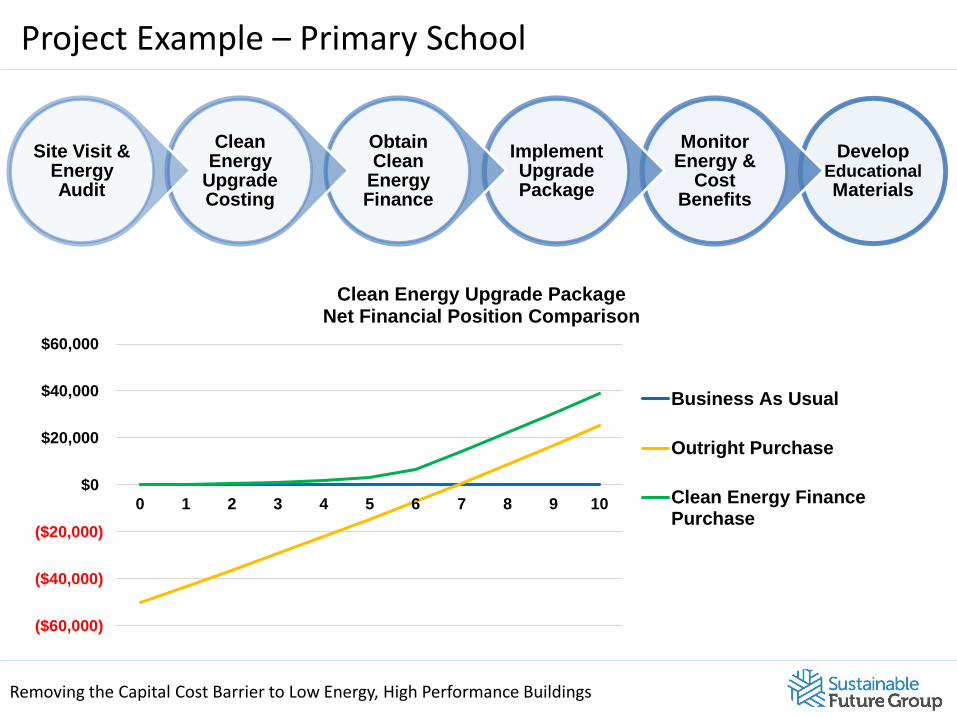
Project Example – Primary School
Develop EducationalMaterials
Monitor Energy &
Cost Benefits
Implement Upgrade Package
Obtain Clean
Energy Finance
Clean Energy
Upgrade Costing
Site Visit & Energy Audit
($60,000)
($40,000)
($20,000)
$0
$20,000
$40,000
$60,000
0 1 2 3 4 5 6 7 8 9 10
Clean Energy Upgrade PackageNet Financial Position Comparison
Business As Usual
Outright Purchase
Clean Energy FinancePurchase
Removing the Capital Cost Barrier to Low Energy, High Performance Buildings
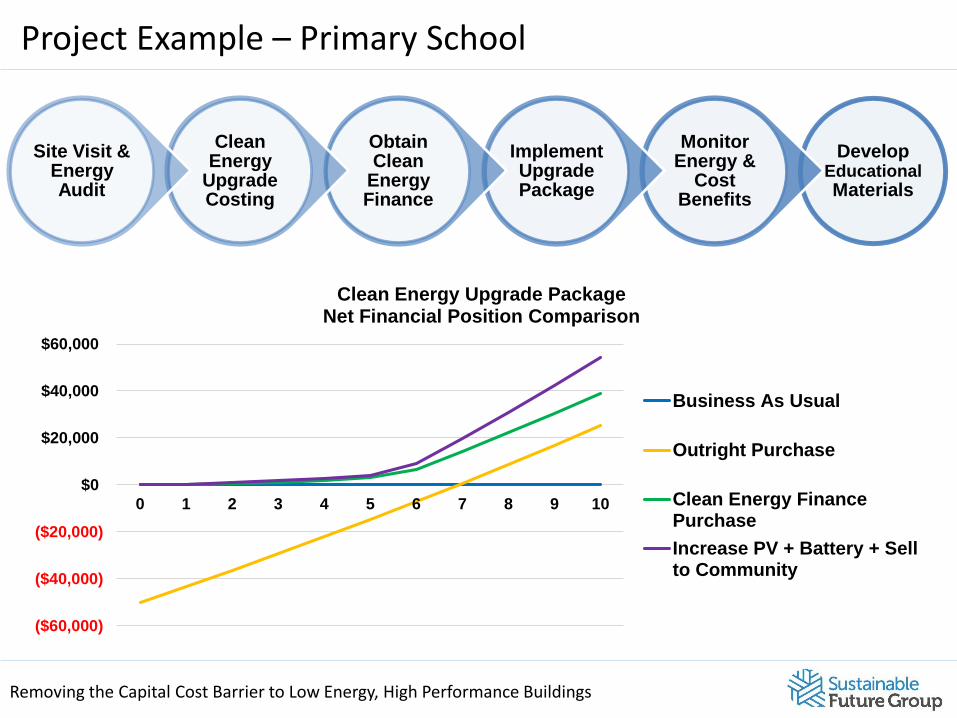
Project Example – Primary School
Develop EducationalMaterials
Monitor Energy &
Cost Benefits
Implement Upgrade Package
Obtain Clean
Energy Finance
Clean Energy
Upgrade Costing
Site Visit & Energy Audit
($60,000)
($40,000)
($20,000)
$0
$20,000
$40,000
$60,000
0 1 2 3 4 5 6 7 8 9 10
Clean Energy Upgrade PackageNet Financial Position Comparison
Business As Usual
Outright Purchase
Clean Energy FinancePurchase
Increase PV + Battery + Sellto Community
Scale of Opportunity
Removing the Capital Cost Barrier to Low Energy, High Performance Buildings
Removing the Capital Cost Barrier to Low Energy, High Performance Buildings
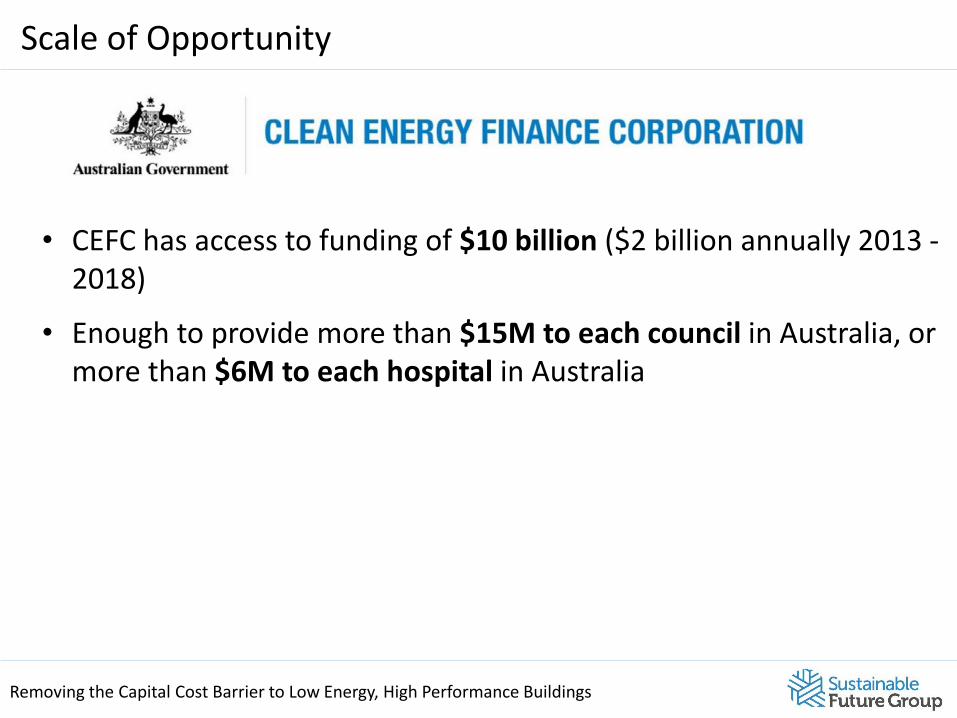
Scale of Opportunity
• CEFC has access to funding of $10 billion ($2 billion annually 2013 -2018)
• Enough to provide more than $15M to each council in Australia, or more than $6M to each hospital in Australia
Removing the Capital Cost Barrier to Low Energy, High Performance Buildings
Scale of Opportunity
• CEFC has access to funding of $10 billion ($2 billion annually 2013 -2018)
• Enough to provide more than $15M to each council in Australia, or more than $6M to each hospital in Australia
• CEFC future uncertain
• Unprecedented opportunity for buildings in the public sector to conduct a clean energy upgrade and help Australia transition to a low carbon future
Removing the Capital Cost Barrierto Low Energy, High PerformanceBuildings in the Public Sector
Marlon KobackerDirector, Sustainable Future Group
E [email protected] www.sustainablefuturegroup.com.au
Proudly sponsoring: