removing trace organic contaminants using biofiltration in...
TRANSCRIPT
Removing Trace Organic Contaminants Using Biofiltration in
Potable Reuse Systems
Marco Velarde, Mandu Inyang, Daniel Gerrity, Jacimaria Batista,
Ben Stanford, Eric Wert, Eric Dickenson

∗ WateReuse-13-10: Controlling Trace Organic Contaminants Using Alternative, Non-FAT Technology for Indirect Potable Water Reuse
∗ Principal Investigators: Benjamin Stanford and Eric Dickenson
∗ WRRF Project Manager: Kristan Cwalina
∗ Southern Nevada Water Authority Team: Douglas D. Drury, Brett Vanderford, Beck Trenholm, Oscar Quiñones, Janie Ziegler, Josephine Chu, Brianna Enright, Brittney Stipanov, Ashley Selvy, Paige Pruisner
WateReuse-13-10

■ Growing demand for scarce water supplies
■ Drawbacks in fully advanced treatment technology (FAT)
● RO membrane: Expensive, brine disposal
● AOPs: Energy-intensive
■ Potential benefits of Biofiltration (Non-FAT):
● Sustainably-sourced media
● Operations cost savings
● Post-AOP polishing step for trace organic contaminants (TOrC)
Motivation

Fres
h G
AC
Exha
uste
d G
AC
Anth
raci
te
Conventional media Alternative media vs.
Bioc
har
Tri-P
ack
Biof
ill
Floa
ting
bead
sObjective
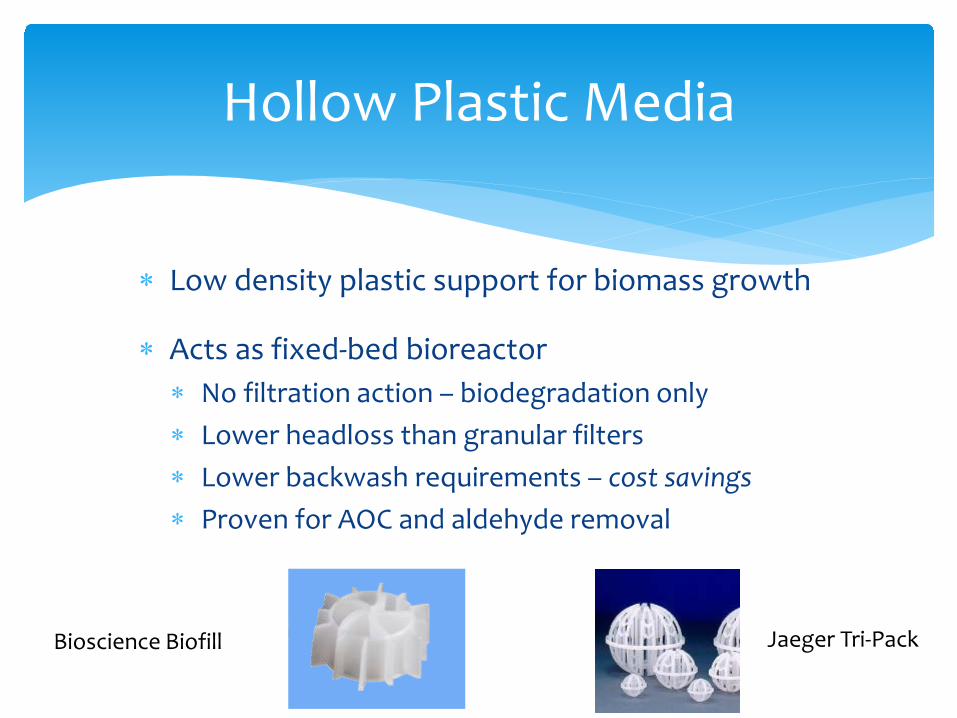
∗ Low density plastic support for biomass growth
∗ Acts as fixed-bed bioreactor ∗ No filtration action – biodegradation only∗ Lower headloss than granular filters∗ Lower backwash requirements – cost savings∗ Proven for AOC and aldehyde removal
Jaeger Tri-PackBioscience Biofill
Hollow Plastic Media
∗ Fresh or virgin GAC∗ Provides baseline for comparison with other media
∗ “Exhausted” GAC (Biologically active media)∗ Used in full-scale treatment for >10 years∗ Adsorptive capacity used up∗ Assumed that all treatment due to biodegradation
∗ Anthracite∗ Assumed that there is no adsorptive capacity∗ All treatment due to biodegradation
GAC and Anthracite
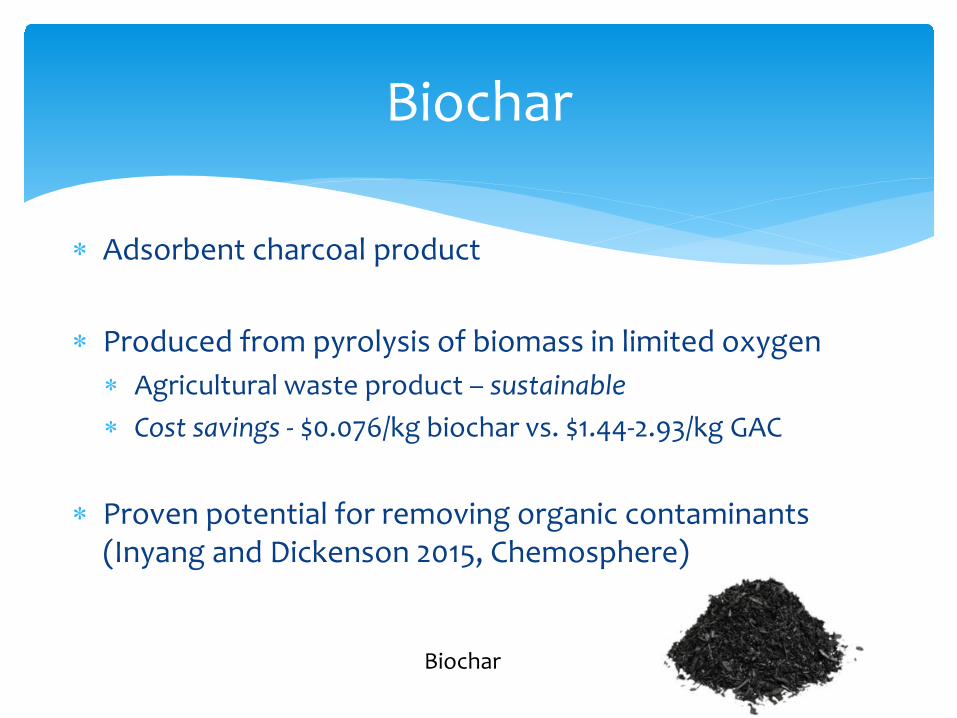
∗ Adsorbent charcoal product
∗ Produced from pyrolysis of biomass in limited oxygen∗ Agricultural waste product – sustainable∗ Cost savings - $0.076/kg biochar vs. $1.44-2.93/kg GAC
∗ Proven potential for removing organic contaminants (Inyang and Dickenson 2015, Chemosphere)
Biochar
Biochar

∗ Low density media similar to plastic media.
∗ Typically used in aquaculture for physical filtration and to achieve nitrification.
∗ Limited knowledge on use as a biofiltration media.
∗ Significant removal (70 – 90 %) of BOD reported in a recirculation system.
Floating plastic beads
Floating Beads

Full-scale tertiary treatment
SNWA Pilot-scale treatment
Secondary Treatment
Dual media filtration
Ozone treatment Biofiltration
Wastewater Treatment Train

∗ 6 Columns∗ Height – 15’∗ Diameter – 6”∗ Individual pumps∗ 7 Sampling ports spaced 10 feet∗ Hydraulic Loading Rate (HLR) – 9 GPM/ft2
∗ Empty Bed Contact Time (EBCT) – 8 min∗ Flow Rate – 1.77 GPM∗ Bed Volume – 14.16 gal∗ Bed Height – 9.6 ft
Intuitech biofiltration skid
Biofiltration Skid
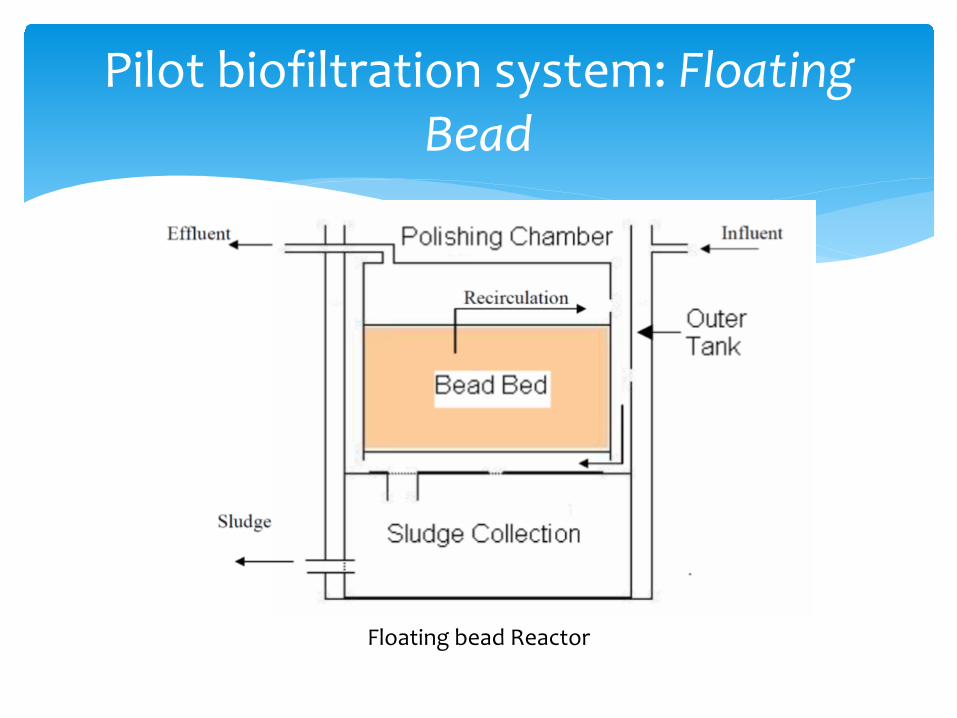
Pilot biofiltration system: Floating Bead
Floating bead Reactor
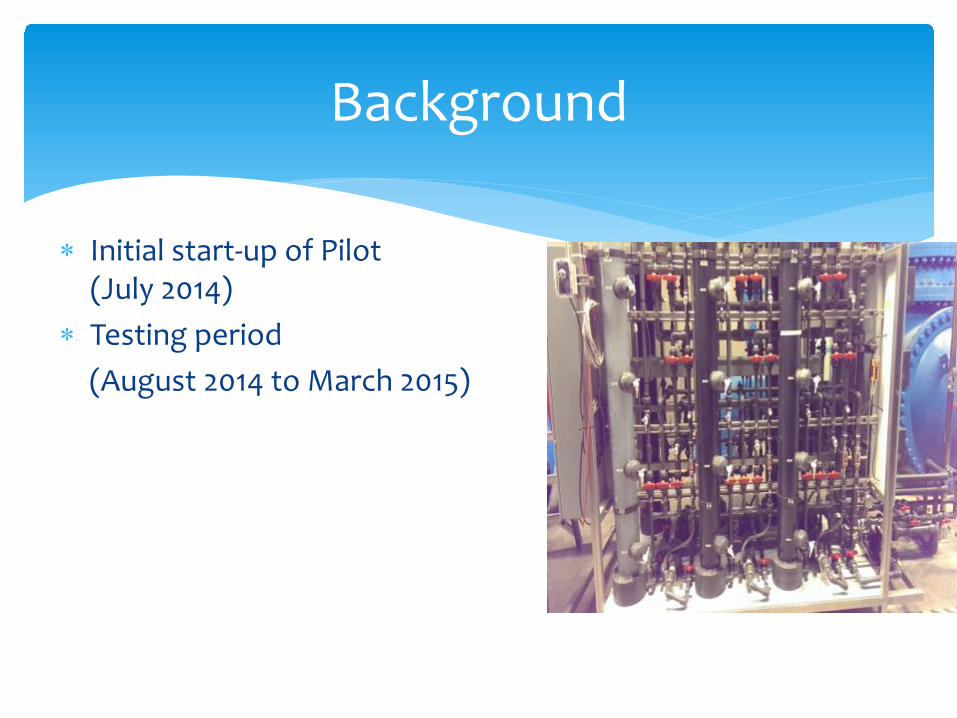
∗ Initial start-up of Pilot (July 2014)
∗ Testing period (August 2014 to March 2015)
Background
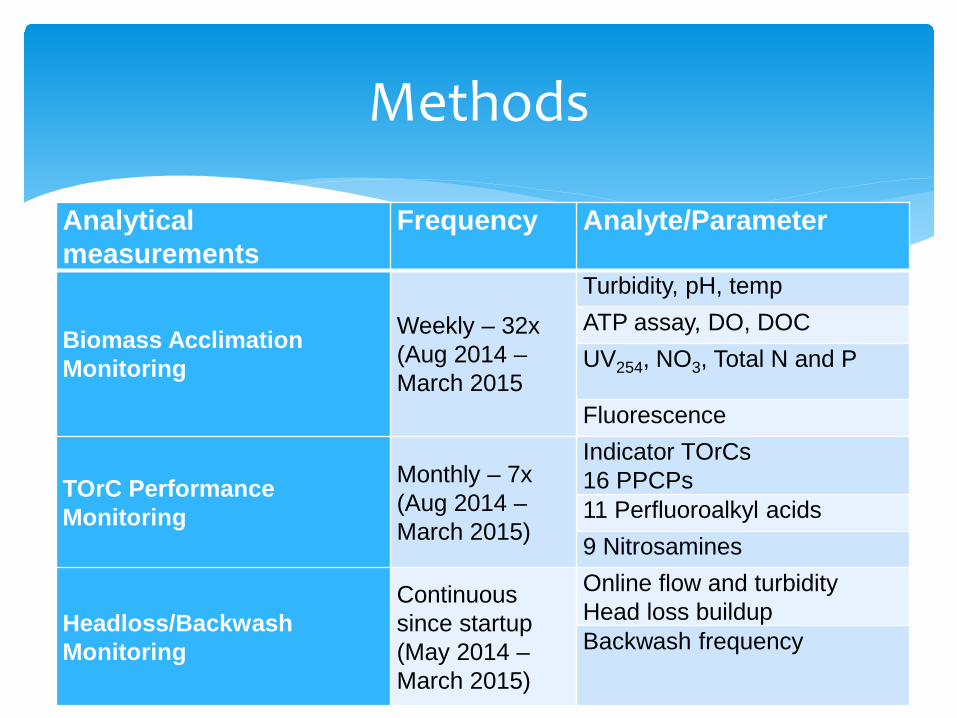
Analyticalmeasurements
Frequency Analyte/Parameter
Biomass AcclimationMonitoring
Weekly – 32x(Aug 2014 –March 2015
Turbidity, pH, tempATP assay, DO, DOCUV254, NO3, Total N and P
Fluorescence
TOrC Performance Monitoring
Monthly – 7x(Aug 2014 –March 2015)
Indicator TOrCs16 PPCPs11 Perfluoroalkyl acids9 Nitrosamines
Headloss/Backwash Monitoring
Continuous since startup (May 2014 –March 2015)
Online flow and turbidityHead loss buildupBackwash frequency
Methods

∗ Head loss used for backwash schedule control
∗ Backwash flow different for each granular media filter
∗ Plastic media systems did not require any backwash
Methods

Results – Temperature

Results – Solids ATP
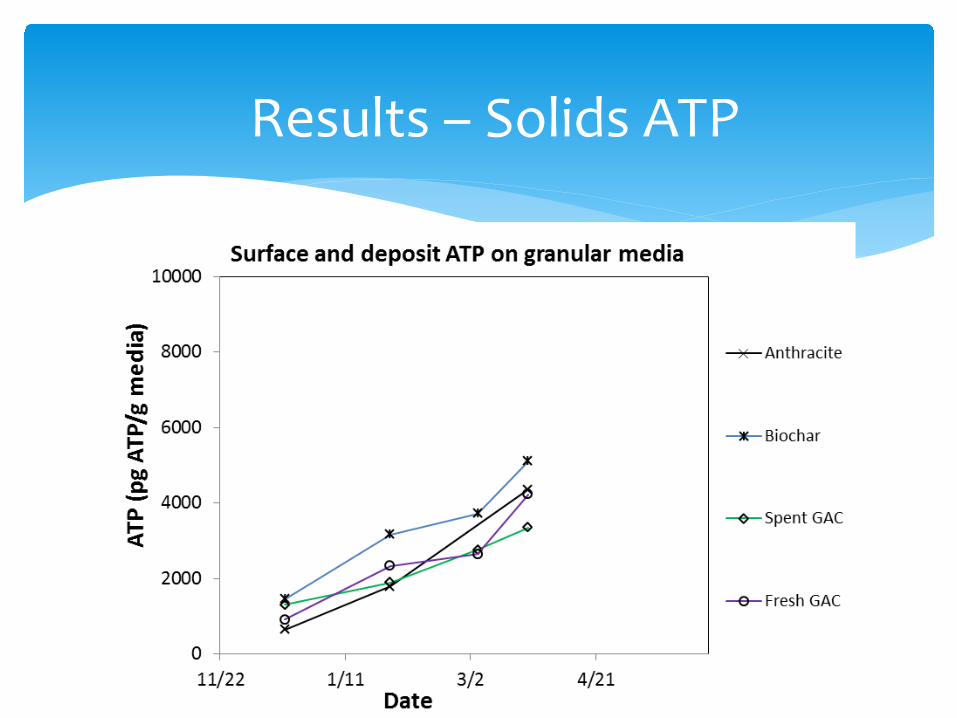
Results – Solids ATP
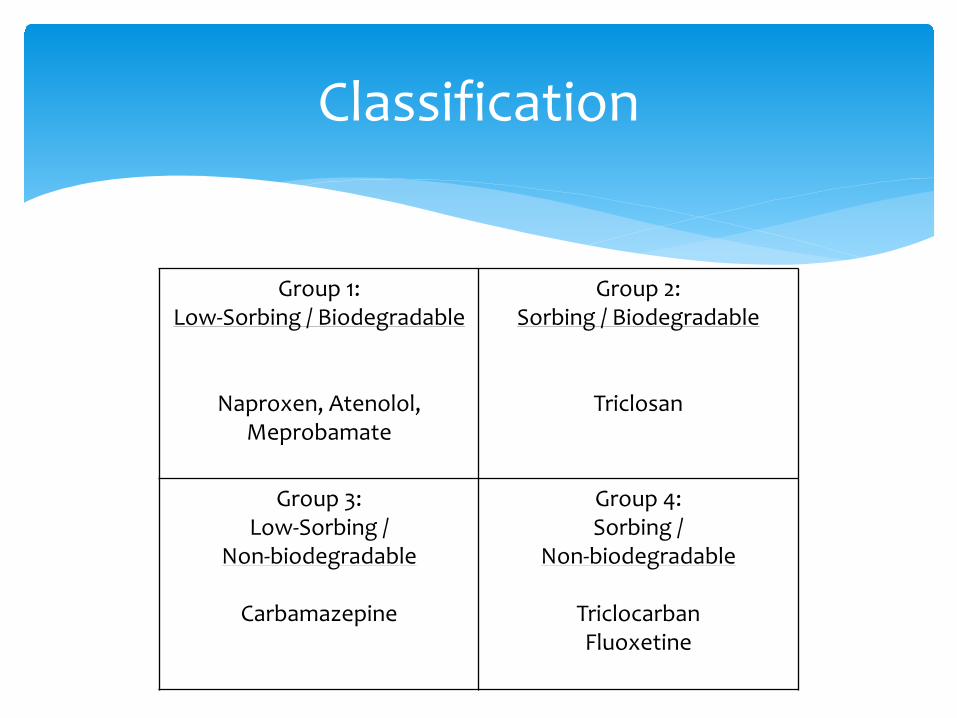
Classification
Group 1:Low-Sorbing / Biodegradable
Naproxen, Atenolol, Meprobamate
Group 2:Sorbing / Biodegradable
Triclosan
Group 3:Low-Sorbing /
Non-biodegradable
Carbamazepine
Group 4:Sorbing /
Non-biodegradable
TriclocarbanFluoxetine
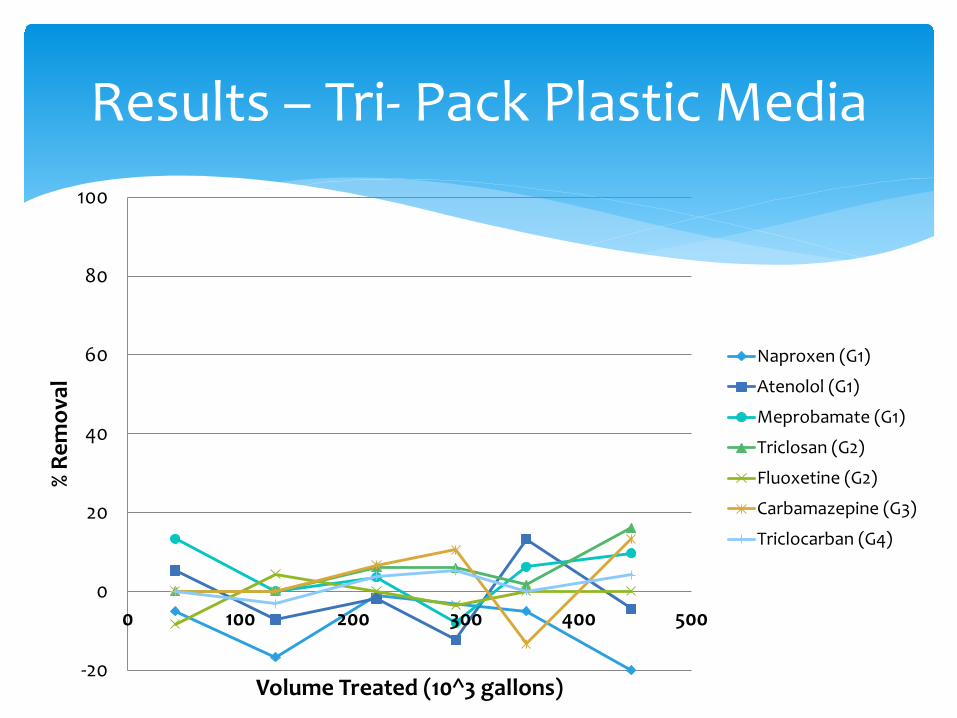
Results – Tri- Pack Plastic Media
-20
0
20
40
60
80
100
0 100 200 300 400 500
% Re
mov
al
Volume Treated (10^3 gallons)
Naproxen (G1)
Atenolol (G1)
Meprobamate (G1)
Triclosan (G2)
Fluoxetine (G2)
Carbamazepine (G3)
Triclocarban (G4)

Results – Biofill Plastic Media
-20
0
20
40
60
80
100
0 100 200 300 400
% Re
mov
al
Volume Treated (10^3 gallons)
Naproxen (G1)
Atenolol (G1)
Meprobamate (G1)
Triclosan (G2)
Fluoxetine (G2)
Carbamazepine (G3)
Triclocarban (G4)

Results – Floating Beads
-20
0
20
40
60
80
100
0 100 200 300 400 500
% Re
mov
al
Volume Treated (10^3 gallons)
Naproxen (G1)
Atenolol (G1)
Meprobamate (G1)
Triclosan (G2)
Fluoxetine (G2)
Carbamazepine (G3)
Triclocarban (G4)
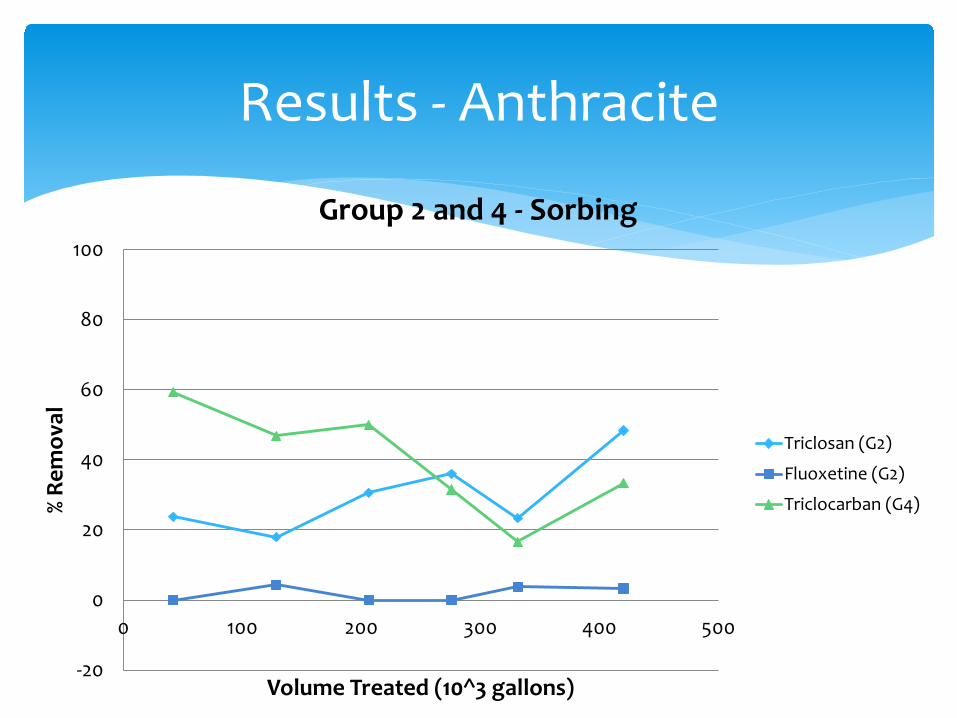
Results - Anthracite
-20
0
20
40
60
80
100
0 100 200 300 400 500
% Re
mov
al
Volume Treated (10^3 gallons)
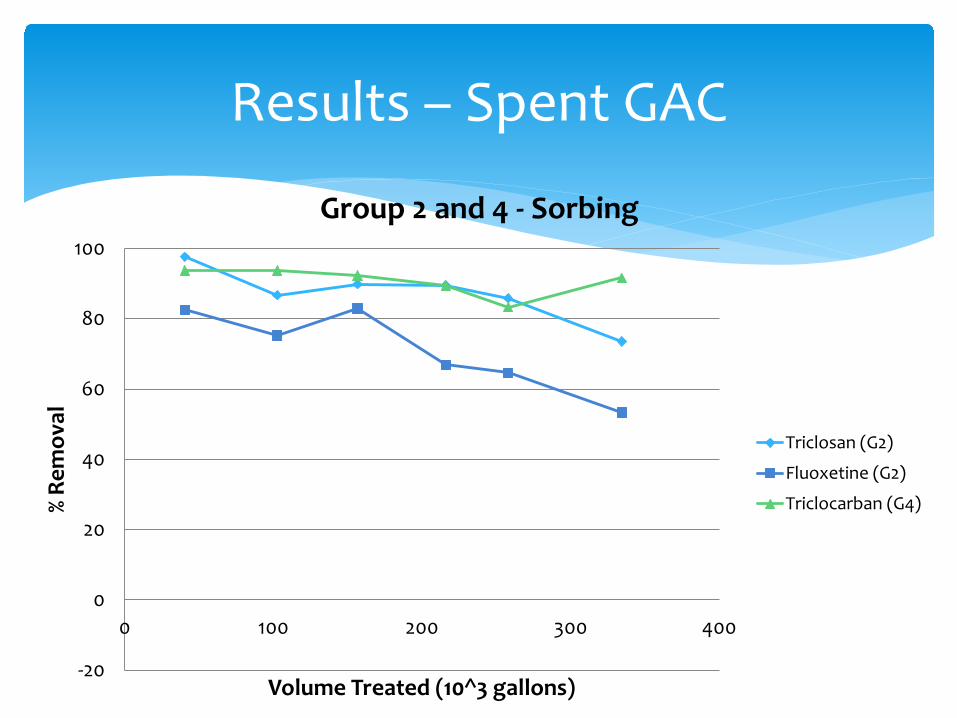
Group 2 and 4 - Sorbing
Triclosan (G2)
Fluoxetine (G2)
Triclocarban (G4)
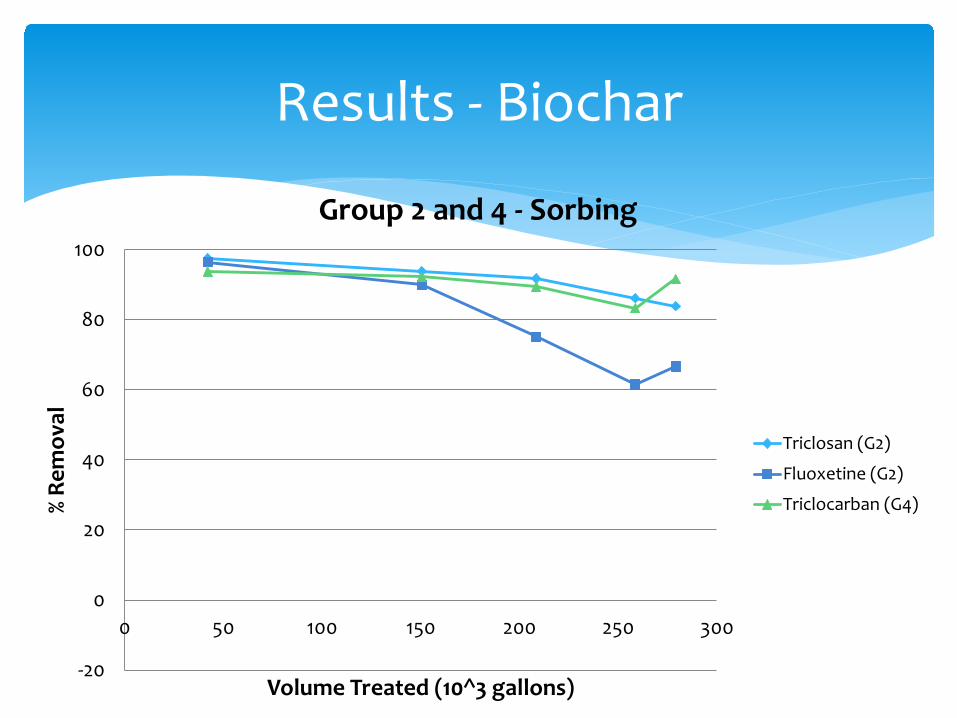
Results - Biochar
-20
0
20
40
60
80
100
0 50 100 150 200 250 300
% Re
mov
al
Volume Treated (10^3 gallons)
Group 2 and 4 - Sorbing
Triclosan (G2)
Fluoxetine (G2)
Triclocarban (G4)
Results – Spent GAC
-20
0
20
40
60
80
100
0 100 200 300 400
% Re
mov
al
Volume Treated (10^3 gallons)
Group 2 and 4 - Sorbing
Triclosan (G2)
Fluoxetine (G2)
Triclocarban (G4)

Results – Fresh GAC
-20
0
20
40
60
80
100
0 100 200 300 400
% Re
mov
al
Volume Treated (10^3 gallons)
Group 2 and 4 - Sorbing
Triclosan (G2)
Fluoxetine (G2)
Triclocarban (G4)
Results - Anthracite
-20
0
20
40
60
80
100
0 100 200 300 400 500
% Re
mov
al
Volume Treated (10^3 gallons)
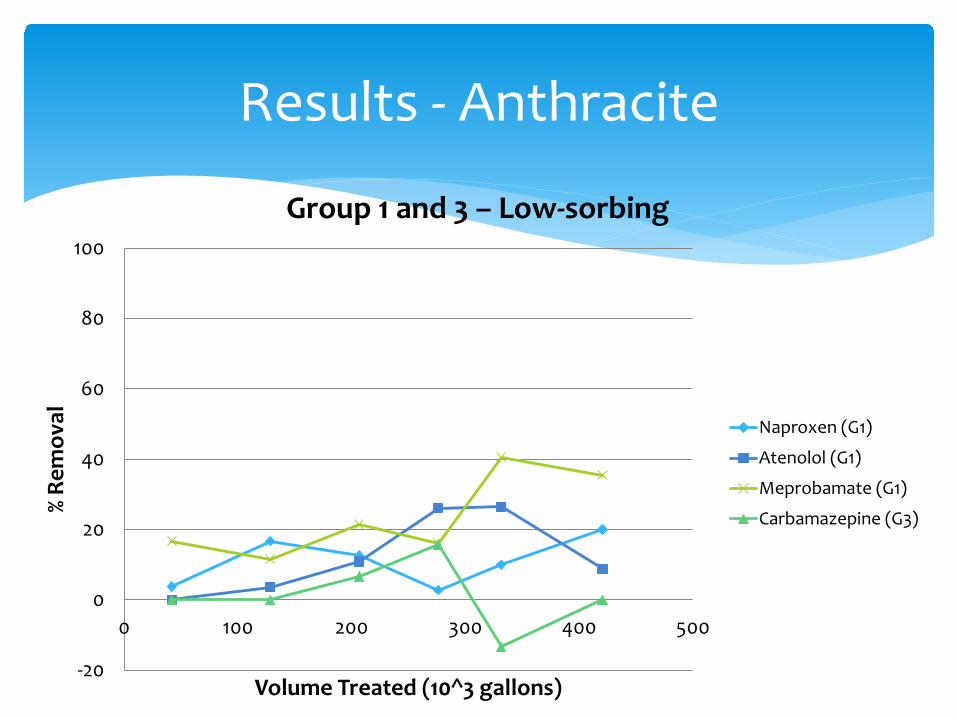
Group 1 and 3 – Low-sorbing
Naproxen (G1)
Atenolol (G1)
Meprobamate (G1)
Carbamazepine (G3)

Results - Biochar
-20
0
20
40
60
80
100
0 50 100 150 200 250 300
% Re
mov
al
Volume Treated (10^3 gallons)
Group 1 and 3 – Low-sorbing
Naproxen (G1)
Atenolol (G1)
Meprobamate (G1)
Carbamazepine (G3)
Results – Spent GAC
-20
0
20
40
60
80
100
0 100 200 300 400
% Re
mov
al
Volume Treated (10^3 gallons)
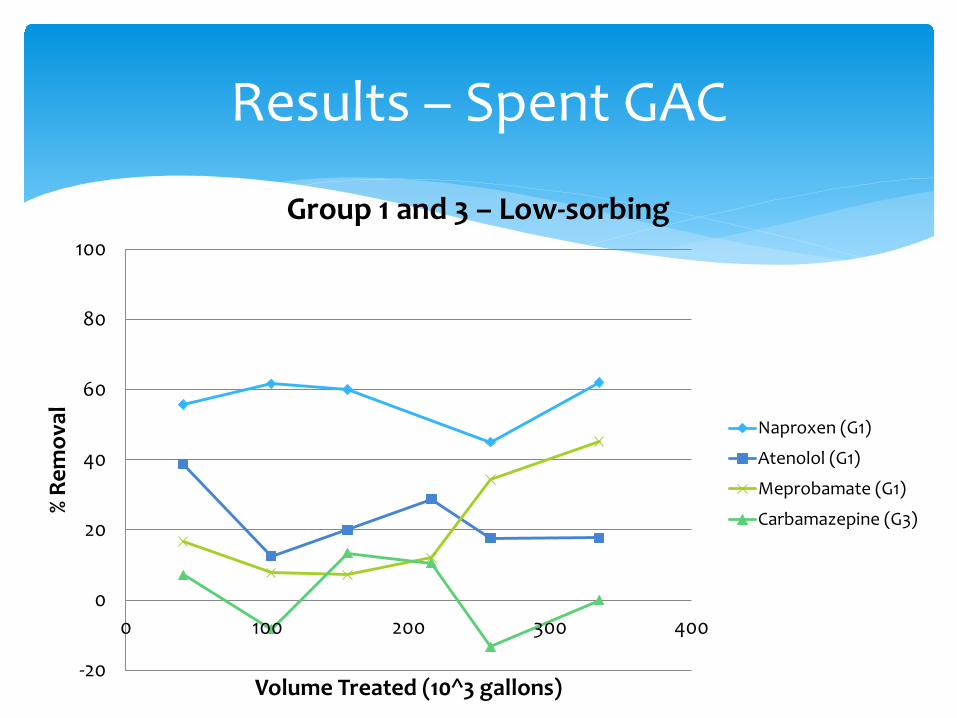
Group 1 and 3 – Low-sorbing
Naproxen (G1)
Atenolol (G1)
Meprobamate (G1)
Carbamazepine (G3)

Results – Fresh GAC
-20
0
20
40
60
80
100
0 100 200 300 400
% Re
mov
al
Volume Treated (10^3 gallons)
Group 1 and 3 – Low-sorbing
Naproxen (G1)
Atenolol (G1)
Meprobamate (G1)
Carbamazepine (G3)
∗ Non-conventional plastic media provide cost-savings, but show poor performance at reducing TOrCs, so far.
∗ Strongly “sorbing” compounds were consistently reduced in the anthracite, biochar, and spent and fresh GACcolumns.
∗ Several “low-sorbing” TOrCs were reduced across the floating beads, anthracite, biochar, and spent GAC packed media, indicating biodegradation occurrence. ∗ Increased removal versus time was observed for some TOrC !
∗ Biofiltration shows promise for reducing TOrC levels in potable reuse systems.
Conclusions
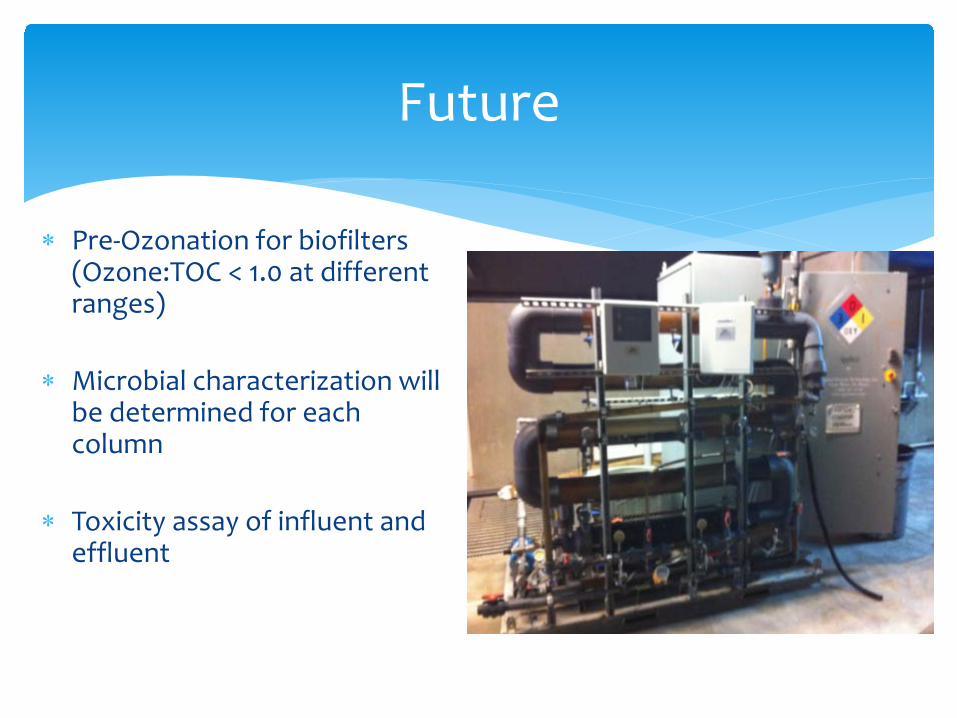
∗ Pre-Ozonation for biofilters(Ozone:TOC < 1.0 at different ranges)
∗ Microbial characterization will be determined for each column
∗ Toxicity assay of influent and effluent
Future

Preliminary Results - NDMA
-40
-20
0
20
40
60
80
100
0 20000 40000 60000 80000 100000
Rem
oval
(%)
Bed volume
NDMA
Tripack
Biofill
-40
-20
0
20
40
60
80
100
0 20000 40000 60000 80000 100000
Rem
oval
(%)
Bed volume
NDMA
Anthracite
Spent GAC
Fresh GAC

∗ Stratified samples of a column to look at TOrC removal at different contact times
∗ Stratified sampling of media to look at stratification of ATP and microorganisms
Future

Questions?
Marco VelardeGraduate Intern, Southern Nevada Water Authority
M.S. Candidate, University of Nevada Las Vegas

∗ Air scour for each granular filter at 0.75 SCFM
∗ Backwash to fluidization for each filter (flows varied from 1.0 GPM to 3.0 GPM)
∗ Backwash time ranged from 10 mins – 30 mins
∗ Pressure head below 9.0 feet determined successful backwash
∗ Each granular filter was backwashed twice a week
Methods
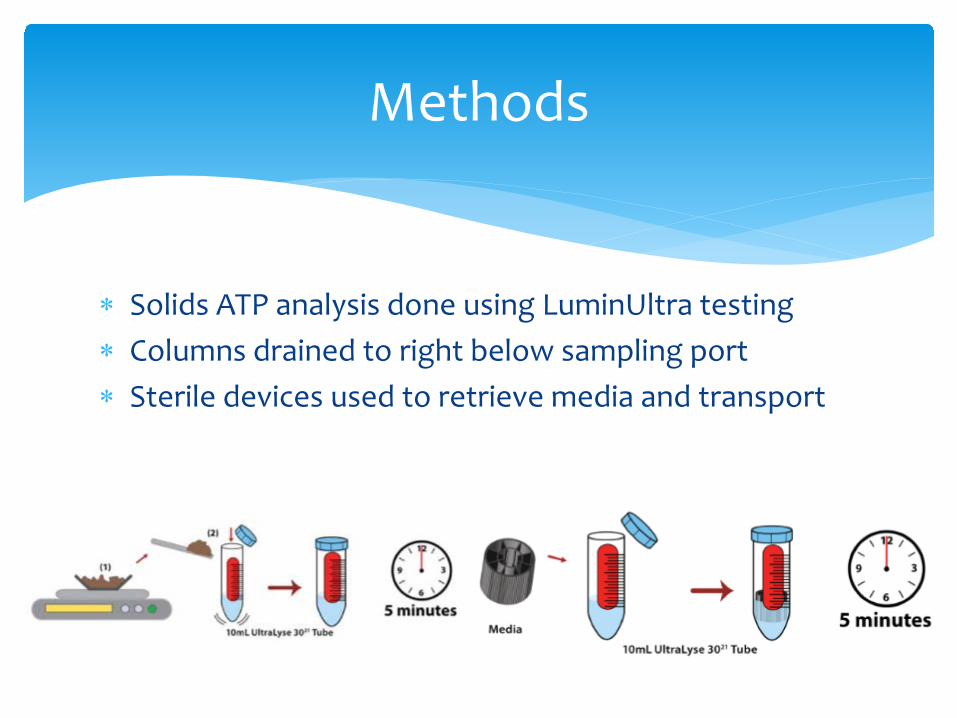
∗ Solids ATP analysis done using LuminUltra testing∗ Columns drained to right below sampling port∗ Sterile devices used to retrieve media and transport
Methods

∗ Biomass is apparent by visual inspection and ATP analysis in both plastic media filters
∗ Lower pressure head with no backwashing indicates biomass is not enough, as shown in data
Conclusions