renewable and low carbon energy resource assessment and
TRANSCRIPT

Presented to: The Councils of Stratford-On-Avon, Warwick, North Warwickshire,
Nuneaton & Bedworth, Rugby, Solihull and Warwickshire County
Author: Robert Clark, Luke Purse and Duncan Price
Date: 28 April 2010
Reference no. 002680
Version: 2
Renewable and Low Carbon Energy Resource Assessment and Feasibility Study
APPENDICES ONLY

Document type: Report
Client: The Councils of Stratford-On-Avon, Warwick, North Warwickshire, Nuneaton & Bedworth, Rugby, Solihull and Warwickshire County
Client contact: Darren Henry, Nuneaton & Bedworth Council
Other details:
File name: Warks_LCPS_FINAL RevB_ISSUED_28 April 2010 (Appendices)
Report: 2
Final: 28 April 2010
Author: Robert Clark, Luke Purse and Duncan Price
Signature
Date: 28 April 2010........................................................
QA: Duncan Price
Signature
Date: 28 April 2010........................................................
Author contact details
Email: [email protected] Telephone: 0114 2257482
Disclaimer: This report has been prepared for the above named client for the purpose agreed in Camco's terms of engagement. Whilst every effort has been made to ensure the accuracy and suitability of the information contained in this report, the results and recommendations presented should not be used as the basis of design, management or implementation of decisions unless the client has first discussed with Camco their suitability for these purposes and Camco has confirmed their suitability in writing to the client. Camco does not warrant, in any way whatsoever, the use of information contained in this report by parties other than the above named client.


Appendix I: Glossary
Below is a table explaining the main technical terms used within the document.
GLOSSARY
AD Anaerobic Digestion;
process in which organic materials are broken down in the absence of oxygen
producing biogas which can be burnt to produce electricity and/or heat
AMR Annual Monitoring Report:
One of a number of documents required to be included in the Local Development
Framework Development Plan Documents, submitted to Government via the Regional
Government office by a Local Planning Authority at the end of December each year to
assess the progress and the effectiveness of a Local Development Framework
BERR UK Department for Business, Enterprise & Regulatory Reform, superseded in June
2009 by the Department of Business, Innovation and Skills
CHP Combined Heat and Power; also known as cogeneration
Generation of both heat and power from a single heat source by recovering waste
heat from electricity generation
CHPA Combined Heat and Power Association
CSH Code for Sustainable Homes; also referred to as ‘Code’:
The Code is the national standard in England for the sustainable design and
construction of new homes. The Code aims to reduce carbon emissions and create
homes that are more sustainable by measuring the sustainability of a new home
against nine categories of sustainable design, rating the 'whole home' as a complete
package. The Code uses a one to six star rating system to communicate the overall
sustainability performance of a new home. From 1 May 2008 it is mandatory for all
new homes to be rated against the Code and include a Code or nil-rated certificate
within the Home Information Pack.
DECC Department for Energy and Climate Change:
Government department created in October 2008. It is responsible for all aspects of
UK energy policy, and for tackling global climate change on behalf of the UK.
ESCO Energy Service Company;
This is a professional business providing a broad range of comprehensive energy
solutions including designs and implementation of energy savings projects, energy
conservation, energy infrastructure outsourcing, power generation and energy supply,
and risk management. The ESCO performs an in-depth analysis of the property,
designs an energy efficient solution, installs the required elements, and maintains the
system to ensure energy savings during the payback period The savings in energy
costs is often used to pay back the capital investment of the project over a five- to
twenty-year period, or reinvested into the building to allow for capital upgrades that
may otherwise be unfeasible. If the project does not provide returns on the
investment, the ESCO is often responsible to pay the difference.
FIT Feed-in-Tariff:
A UK Government cashback scheme outlined in the Energy Act 2008 effective from 1
April 2010 guaranteeing payment to people who generate small scale low carbon
electricity.
GHG Greenhouse Gas:
Any gas that absorbs infra-red radiation in the atmosphere. The current IPCC
(Intergovernmental Panel on Climate Change) inventory includes six major

GLOSSARY
greenhouse gases. These are Carbon dioxide (CO2), Methane (CH4), Nitrous oxide
(N2O), Hydrofluorocarbons (HFCs), Perfluorocarbons (PFCs), Sulphur hexafluoride
(SF6).
GIS analysis Geographic Information System analysis;
includes data that is referenced by spatial or geographic coordinates
GSHP Ground Source Heat Pump:
A heat pump installation that uses the earth as a heat sink to store heat or as a source
of heat.
GWh Gigawatt hour – 1,000,000 kWh. A convenient unit of energy for power generation
equipment.
kW Kilowatt – unit of power. Can be expressed as thermal power (kWth) and electrical
power (kWe). The productive capacity of small scale renewable generation is usually
measured in kW
kWh kilowatt hour – unit of energy. Can be expressed as thermal energy (kWhth) and
electrical energy (kWhe). A convenient unit for consumption at the household level.
kWp kilowatt peak – maximum power output of a photovoltaic cell, occurring with intense
sunlight.
Large wind Large scale wind, for this study this is assumed as being above 1 MW in capacity (tip
height typically greater than 100 m). Where appropriate, the default size of large
scale wind turbines in 2.5 MW with a tip height of approximately 125 m.
LDF Local Development Framework
LZC Low and Zero Carbon
MLSOA Middle Layer Super Output Area;
Super Output Areas are a unit of geography used in the UK for statistical analysis.
They are developed and released by Neighbourhood Statistics.
Middle Layer SOAs have a minimum population 5000, and a mean population 7200.
Built from Lower Layer SOAs. There are 7,193 MLSOAs in England and Wales
MOD Ministry of Defence
MSW Municipal Solid Waste:
Waste type that includes predominantly household waste (domestic waste) with
sometimes the addition of commercial wastes collected by a municipality within a
given area.
MTCO2e Million Tonnes of Carbon Dioxide Equivalent
MW Megawatts. The productive capacity of electrical generation plant is often measured
in MWe.
MWe Megawatts of electrical capacity.
MWth Megawatts of thermal capacity.
MWh Megawatt-hour, equal to 1,000 kWh.
ODT Oven Dried Ton;
an amount of wood that weighs 2,000 pounds at zero percent moisture content[1][1];
common conversion unit for solid biomass fuel

GLOSSARY
PPS Planning Policy Statement
SHLAA Strategic Housing Land Allocation Assessment
SHW / STHW Solar Hot Water; also known as Solar Thermal Hot Water
Small wind Small scale wind, for this study this is assumed as being below 500 kW in capacity (tip
height typically less than 60 m)
Solar PV Solar Photovoltaic
SPV Special Purpose Vehicle; a legal entity set up for a specific purpose: to isolate
financial risk from a lead organisation.
tCO2/yr Tonnes (metric) of CO2 per year
TCPA Town and Country Planning Association

Appendix II: Notes of Consultation Workshop
Warwickshire workshop 14th January 2010
Attendees
Zahir Lazcano Camco
Ian Andrews Camco
Robert Clark Camco
Luke Purse Camco
Roger Hey Central Networks
Graham Paling Central Networks
Matthew Rhodes Encraft
David Fovargue Entec Michael O'Connell Entec
Mark Hammond Friends of the Earth
Ewan Calcott Forestry
Alex Hales Frampton
Darren Henry Nuneaton and Bedworth Borough Council
Steph Chettle Nuneaton and Bedworth Borough Council
Allison Crofts Natural England
Chris Nash North Warks Borough Council
Sue Wilson North Warks Borough Council
Tim Margerison Rugby Borough Council
Nick Freer Rugby Borough Council
Stephen Games Rugby Borough Council
Jamie Tallon Rugby Borough Council
Sarah Fisher Rugby Borough Council
Stephen Marks Rugby Borough Council
Nick Ellison Stratford upon Avon District Council
Paul Chapman Stratford upon Avon District Council
Colin Staves Stratford upon Avon District Council
David Biss Solihull Metropolitan Council
David Wigfield Solihull Metropolitan Council
Martin Fletcher Solihull Metropolitan Council
Paul Slade Waterloo Jonathan Horsfield Warwickshire County Council
Jacky Williams Warwickshire County Council
Claire Parlett Warwick District Council
Neil Gilliver Warkwickshire Rural Housing Association
Colin Morrison WSP
David Bolus WSP
Katie Elmer WSP
Bruce Hayball Hasker Architects
Jonathan Rigall Peter Brett
Andrew Hawkes Gallaghers

Notes.
The following notes were recorded for the consultation event held at Benn Hall, Rugby, on the 14th January 2010. The principal purpose of the workshop was to review the draft recommendations that had been developed. A secondary objective was to review aspects of the analysis conducted and to identify where improvements could be made, e.g. with additional local information. The workshop agenda was as follows:
10.00 Introduction to workshop
10.05 Overview of study
11.00 Discussion sessions x 3
A. Carbon standards for new development
B. Opportunities and constraints for renewable energy generation
C. Non-planning measures & financing
14:15 Session Feedback & Plenary discussion
The discussion groups were held in rotating cabaret style such that each participant was able to engage with the three topic areas and also so that comments could be refined through subsequent review of previous discussions. Participants were also invited to raise other queries following the study overview and during the plenary session.
A range of issues were raised during the workshop and through additional information being sent to the steering group and consultant team (from Hasker Architects). The notes below collate the issues raised.
A. Carbon standards for new development
In general most attendees were supportive of accelerated carbon targets for new development and could see, with additional financial support, e.g. RHI & FiT that these could be achieved. However, opposing views were also expressed. The key issues raised were as follows:
• A number of attendees raised the issue of viability. Those representing development interests suggested that accelerated standards would be difficult for the market to achieve although no specific evidence was provided. Others felt that accelerated timescales, particularly with respect to larger schemes (which inherently have longer timescales) were reasonable since scheme phasing would require higher standards in any case. It was felt this should be further reviewed with the steering group. Themes explored under this issues included:
o The need to balance carbon standards with other key housing objectives, e.g. affordable housing, educations, transport. Some stated that the market priorities are not CO2.
o The scale of study area developments were not, in themselves likely to initiate market forces to bring down costs of developments
o There was a division of opinion around whether to aim towards higher targets (accepting potential failures of achieving this , but content with an acceptable fall-back
o UK zero carbon roadmap was already seen as challenging by some o Some stated that elevated CO2 standard should only be for specific developments o Land supply could dry up if land price absorb increasing costs of CO2 abatement o Defending policy is problematic/costly - better to encourage and provide incentives
� Local Authority District Heating networks � Tax � Partnerships are key

� Planning delivery grant if above target � Public land - can tender with requirements (e.g. EP) - Private land – much less
opportunity to influence process / standards
• There should be a strong onus on the developer to prove targets could be achieved.
• Need for co-ordinated expertise across the study area to ensure good consistent delivery
• Local Authorities need to be attuned to the changing style of housing where higher carbon standards are required, e.g. modern materials, more 3-storey housing, sustainable technology Eco-ghetto house types changing within large developments
• It was important to support achievement of higher carbon standards that low carbon development issues trump other planning restrictions (e.g. E-W or N-S)
• A number of attendees suggested that developers would prefer clear targets applied to all (or most) development
B. Opportunities and constraints for renewable energy generation
These discussion groups involved detailed review of the analysis completed and the assumptions therein. There was a strong focus in these sessions on wind energy and biomass as the principal sources of low carbon generation identified. Along with discussions around the analysis a number of key issues where discussed:
• Wind energy: o The inclusion of MOD / civil aviation constraints for wind energy o Consultation of the land owners regarding future energy generation, e.g. wind,
development could help to refine available land o Will the publishing of wind potential maps have adverse impacts (e.g. land price) o Assess the potential impacts of land allocation for wind development, in a similar fashion
to that in which land is allocated for housing, mineral extraction… To reduce potential tensions and opposition from neighbouring land owners and property owners, they could be offered to participate in the development.
o Low distance from housing to wind development from 600m to 400 m – Steering group suggest this is not changed from 600m
o LA capability to carry out Landscape Assessments? Do they have the knowledge and training to do this?
o Need to consider the proximity of grid to wind sites o Some doubt was expressed by representatives of Stratford Council over land availability
due to previous discussion held with developers.
• Biomass: o Should potential resources from woodlands be better included in the analysis o The development of the market, particularly around biomass would be the key constraint
to uptake o Opportunity for wood fuel, activate supply chain (AW brought into manage etc) o Encourage processing local timber within the region, diversify farms o Flagging up opportunities for potential development with communities (i.e. CHP) o Encouraging local funds for local communities

• Other: o Phasing of certain developments might affect viability of CHP/District Heating. o Educational/awareness campaign required to meet ambitious targets, since support at
community level is essential. LA should explore the possibility of developing a community pilot project.
C. Non-planning measures & financing
A wide ranging discussion was held around this area particularly around a Carbon Investment Fund measure, the establishment of ESCO services, requiring annual carbon monitoring on specific development (and linking with a financial bond) and also Development Control to support low carbon delivery. There was good general support for a CIF mechanism but less so for an ESCO. Key issues raised were as follows:
• Carbon Investment Fund o A Carbon Investment Fund could be set up with the following advantages:
� Support locally relevant carbon reduction initiatives (not just renewables) � Present ‘least cost’ solutions for carbon reduction, rather than ‘on-site’
renewables o The concern was raised that a CIF could be inequitable to new development but this was
not widely shared o Concerns over additionality where raised, i.e. the scheme would need to be developed so
as to avoid the funding of the developments that would have happened anyway o Contrary to the UK Roadmap the suggestion was made to devolve some of the on-site
70% “compliance” carbon reduction through to the CIF mechanism, i.e. if it is the least cost way then why not do it more through this mechanism?
o Can community/social schemes be developed from the CIF investment o Accountability - will carbon saving/£ be efficient, i.e. how will developers be certain that
the public sector will deliver efficiently (compared with what they may deliver) o Is Advantage West Midlands developing some kind of CIF facility? o Strategic finance initiatives could be considered, e.g. with support from Forum for the
Future. Jonathan Horsfield (WCC) may have money to support this
• ESCO o Districts and other larger Authorities are quite different - e.g. North Warwickshire has very
little housing development planned and the therefore may have little need for the ESCO services
o Few were sure where ESCO services might support low carbon delivery
• Require performance annual monitoring (with financial bond) o Most considered that there needs to be more focus on monitoring o This was considered to be a reasonable proposition, but overwhelmingly the groups felt it
would be difficult to establish such a scheme. Concerns raised included: � Difficult to judge bond value (needs to be significant but not present burden) � Seen as “messy“ e.g. passing through compliance to new owners (from
developer) � Breach of planning conditions was an alternative – but recognised that this power
is rarely used � Mutually enforceable covenants is a further alternative
• Development Control – the discussion moved from non-planning measures towards improving practice in DC, the key issues being identified as follows:
o Toolkit will help for DC control/scheme planning o Relationships between Planning Policy and DC need to be far better at a basic level to
manage introduction of workable policy.

o Concerns that DC are simply not able to deliver existing standards let alone significantly shifted standards requiring, for example, time-intensive site visits.
o DC process needs to be delivered consistently, requiring training for staff to take on board these issues
o Communications between Building Control (monitoring delivery) and Planning o Shared working would be encouraged (to share costs and stretch expertise to where it is
needed. o Shared Services should be considered o Training is essential
ENDS.

Appendix III: CO2 emissions for the study area
The tables below illustrate CO2 emissions sources for the study area, taken from DECC’s NI186 data. The colour coding illustrates the categories which were assumed to relate to electricity, thermal, transport, and other energy sources.
Dataset name Full Local CO2 emission estimates, sector and fuel details
Year 2007
Release date
Units kt CO2 unless otherwise stated
RegionName LARegionName Year A. Industry and Commercial Electricity
B. Industry and Commercial Gas
C. Industry and Commercial Large Gas Users
D. Industry and Commercial Oil
F. Industry and Commercial Solid fuel
G. Industry and Commercial Process gases
H. Industry and Commercial Wastes and
biofuels
I. Industry and Commercial Non fuel
J. Industry Offroad
K. Diesel Railways
L. Agriculture Oil
M. Agriculture Solid fuel
N. Agriculture Non fuel
O. Domestic Electricity
P. Domestic Gas
Q. Domestic Oil
R. Domestic Solid fuel
S. Domestic House and Garden Oil
T. Domestic Products
U. A-Roads Petrol
V. A-Roads Diesel
W. Motorways Petrol
X. Motorways Diesel
Y. Minor Petrol
Z. Minor Diesel
ZA. Road Transport Other
ZB. LULUCF Emissions Soils & Deforestation
ZC. LULUCF Emissions Other
ZD. LULUCF Removals
Grand Total
Population ('000s, mid-year estimate)
Per Capita Emissions (t)
Domestic emissions fom energy
Domestic per capita emissions (t)
North Warwickshire 2007 221 70 - 23 7 0 - - 16 12 4 0 0 71 70 5 3 0 2 43 64 142 383 39 35 2 1 22 19- 1,217 62.2 19.6 149 2.39
Nuneaton and Bedworth 2007 145 41 - 13 4 9 - 0 19 4 1 - 0 125 144 1 3 1 3 30 24 12 39 68 48 1 0 6 5- 735 121.2 6.1 273 2.25
Rugby 2007 277 82 - 21 567 0 43 716 19 6 7 0 0 108 114 3 3 1 2 64 86 62 197 51 43 2 2 28 18- 2,483 91.0 27.3 228 2.50
Solihull 2007 309 149 - 27 1 - 1 0 41 8 2 0 0 227 265 6 3 1 5 58 50 75 183 144 97 3 1 18 11- 1,664 203.6 8.2 501 2.46
Stratford-on-Avon 2007 183 41 - 42 11 1 0 - 24 11 19 0 0 161 107 22 10 1 3 89 107 81 191 69 68 2 6 88 58- 1,279 117.8 10.9 300 2.55
Warwick 2007 264 55 - 19 0 1 0 0 30 13 4 0 0 150 154 6 5 1 3 87 88 65 151 63 50 2 1 28 21- 1,221 134.6 9.1 315 2.34
West Midlands Total 2007 8,886 3,516 339 984 972 276 89 1,174 1,115 246 300 1 3 5,585 6,122 346 221 35 137 2,173 2,407 1,140 3,042 2,493 1,966 53 66 1,092 784- 43,994 5,382 8.2 12,273 2.28
LARegionName Year Electrical
Thermal
Transport
LULUCF
Other
Key
North Warwickshire 2007 292 183 735 5 2 Electricity emissions source
Nuneaton and Bedworth 2007 269 216 244 1 4 Thermal emissions source*
Rugby 2007 385 840 528 12 719 Transport emissions source
Solihull 2007 536 455 659 7 7 Other emissions source
Stratford-on-Avon 2007 344 253 642 36 4
Warwick 2007 414 245 550 9 4 * Assumptions have been made as to which categores constitute a thermal energy
1,280
1,221
1,664
17/09/2009
TOTAL
1,217
735
2,483

Appendix IV: Growth projections – new development
Modelled build programme for residential developments (no. of dwellings)
Year (financial, beginning) 2006 2007 2008 2009 2010 2011 2012 2013 2014 2015 2016 2017 2018 2019 2020 2021 2022 2023 2024 2025 TOTAL
North Warwickshire 167 142 106 140 140 150 150 170 170 160 160 155 155 150 150 150 150 145 145 145 3,000
Nuneaton and Bedworth 540 540 540 540 540 540 540 540 540 540 540 540 540 540 540 540 540 540 540 540 10,800
Rugby 494 1,429 701 469 230 488 582 523 618 760 770 770 770 770 550 550 450 450 450 450 12,274
Solihull 784 606 579 731 402 526 733 549 690 690 690 690 690 690 690 690 690 690 690 690 13,190
Stratford-upon-Avon 455 394 265 264 264 264 264 264 264 264 264 264 264 264 264 264 264 264 264 264 5,602
Warwick 465 580 410 269 235 743 712 710 640 590 570 570 570 570 570 547 547 547 547 547 10,939
Modelled build programme for non-residential developments (m2 floor area)
Year (financial, beginning) 2006 2007 2008 2009 2010 2011 2012 2013 2014 2015 2016 2017 2018 2019 2020 2021 2022 2023 2024 2025 TOTAL
North Warwickshire 0 0 0 0 7,556 7,556 7,556 7,556 7,556 7,556 7,556 7,556 7,556 10,000 10,000 10,000 10,000 10,000 10,000 10,000 138,000
Nuneaton and Bedworth 0 0 0 0 8,360 8,360 8,360 19,660 19,660 19,660 7,393 7,393 7,393 7,393 7,393 7,393 7,393 7,393 7,393 7,393 157,994
Rugby 0 0 0 87,500 87,500 87,500 133,724 49,590 82,924 79,557 76,190 42,857 42,857 42,857 42,857 42,857 42,857 42,857 42,857 42,857 1,070,200
Solihull 15,870 15,870 15,870 15,870 41,853 41,853 41,853 41,853 41,853 41,853 41,853 41,853 41,853 25,447 25,447 25,447 25,447 25,447 25,447 25,447 618,287
Stratford-upon-Avon 30,667 30,667 30,667 24,800 24,800 24,800 24,800 24,800 24,800 24,800 24,800 24,800 24,800 25,714 25,714 25,714 25,714 25,714 25,714 25,714 520,000
Warwick 34,576 43,127 30,486 20,002 17,474 55,247 52,942 52,793 47,588 43,870 42,383 42,383 42,383 42,383 42,383 40,673 40,673 40,673 40,673 40,673 813,384

Appendix V: Energy projections
North Warwickshire
Year 2007 2008 2009 2010 2011 2012 2013 2014 2015 2016 2017 2018 2019 2020 2021 2022 2023 2024 2025 2026
Existing residential - thermal (GWh) 437 432 427 422 418 413 408 403 399 394 389 384 380 375 370 365 361 356 351 346
Existing residential - electrical (GWh) 132 131 130 129 128 127 126 125 124 123 122 121 120 119 118 117 116 115 114 113
Existing non-residential - thermal (GWh) 606 602 600 597 595 592 590 587 585 582 580 577 575 572 570 567 565 562 560 557
Existing non-residential - electrical (GWh) 411 410 408 406 405 403 401 399 398 396 394 393 391 389 387 386 384 382 381 379
New build residential - thermal (GWh) 0.9 1.6 2.5 3.4 4.4 5.4 6.5 7.6 8.6 9.7 10.7 11.7 12.6 13.6 14.6 15.6 16.5 17.4 18.4 18.4
New build residential - electricity (GWh) 0.6 1.0 1.5 2.1 2.7 3.3 3.9 4.6 5.2 5.8 6.5 7.1 7.7 8.2 8.8 9.4 10.0 10.6 11.1 11.1
New build non-residential - thermal (GWh) 0.0 0.0 0.0 0.0 0.8 1.7 2.5 3.4 4.2 5.1 5.9 6.8 7.6 8.7 9.9 11.0 12.1 13.2 14.3 15.5
New build non-residential - electricity (GWh) 0.0 0.0 0.0 0.0 0.5 1.1 1.6 2.1 2.6 3.2 3.7 4.2 4.8 5.5 6.2 6.9 7.6 8.3 9.0 9.7
Thermal energy (GWh/yr) 1,043 1,036 1,029 1,023 1,018 1,012 1,007 1,002 996 991 985 980 975 969 964 959 954 949 943 937
Electrical energy (GWh/yr) 544 542 540 538 536 534 533 531 530 528 527 525 523 522 521 519 518 516 515 513
Total (GWh/yr) 1,588 1,578 1,569 1,561 1,554 1,547 1,540 1,533 1,526 1,519 1,512 1,505 1,498 1,491 1,485 1,478 1,472 1,465 1,458 1,450
Nuneaton & Bedworth
Year 2007 2008 2009 2010 2011 2012 2013 2014 2015 2016 2017 2018 2019 2020 2021 2022 2023 2024 2025 2026
Existing residential - thermal (GWh) 848 838 829 820 811 801 792 783 774 765 755 746 737 728 719 709 700 691 682 673
Existing residential - electrical (GWh) 232 231 229 227 225 224 222 220 218 217 215 213 211 210 208 206 204 203 201 199
Existing non-residential - thermal (GWh) 379 377 375 374 372 371 369 368 366 364 363 361 360 358 356 355 353 352 350 349
Existing non-residential - electrical (GWh) 270 268 267 266 265 264 263 262 261 259 258 257 256 255 254 253 252 250 249 248
New build residential - thermal (GWh) 2.8 5.6 8.4 11.3 14.1 16.9 19.7 22.5 25.3 28.2 31.0 33.8 36.6 39.4 42.2 45.0 47.9 50.7 53.5 53.5
New build residential - electricity (GWh) 1.8 3.5 5.3 7.1 8.9 10.6 12.4 14.2 16.0 17.7 19.5 21.3 23.1 24.8 26.6 28.4 30.1 31.9 33.7 33.7
New build non-residential - thermal (GWh) 0.0 0.0 0.0 0.0 0.9 1.9 2.8 5.0 7.2 9.4 10.2 11.1 11.9 12.7 13.6 14.4 15.2 16.0 16.9 17.7
New build non-residential - electricity (GWh) 0.0 0.0 0.0 0.0 0.6 1.2 1.8 3.1 4.5 5.9 6.4 6.9 7.4 8.0 8.5 9.0 9.5 10.0 10.5 11.1
Thermal energy (GWh/yr) 1,230 1,221 1,213 1,205 1,198 1,191 1,184 1,178 1,172 1,167 1,159 1,152 1,145 1,138 1,131 1,124 1,117 1,109 1,102 1,092
Electrical energy (GWh/yr) 504 503 501 500 500 499 499 499 499 500 499 498 498 497 497 496 496 495 494 492
Total (GWh/yr) 1,733 1,723 1,714 1,705 1,698 1,690 1,683 1,677 1,672 1,666 1,658 1,651 1,643 1,635 1,628 1,620 1,612 1,604 1,597 1,584
Rugby
Year 2007 2008 2009 2010 2011 2012 2013 2014 2015 2016 2017 2018 2019 2020 2021 2022 2023 2024 2025 2026
Existing residential - thermal (GWh) 685 679 674 668 662 656 651 645 639 633 628 622 616 610 605 599 593 587 582 576
Existing residential - electrical (GWh) 201 200 199 198 197 196 195 194 193 192 191 190 189 188 187 186 185 184 183 182
Existing non-residential - thermal (GWh) 2,167 2,154 2,145 2,136 2,127 2,118 2,109 2,100 2,091 2,082 2,073 2,064 2,055 2,046 2,037 2,028 2,019 2,010 2,001 1,992
Existing non-residential - electrical (GWh) 516 514 512 510 508 505 503 501 499 497 495 493 490 488 486 484 482 480 478 475
New build residential - thermal (GWh) 9.8 14.6 17.9 19.5 22.8 26.8 30.4 34.7 39.9 45.2 50.5 55.8 61.1 64.9 68.6 71.7 74.8 77.9 81.0 81.0
New build residential - electricity (GWh) 5.9 8.7 10.7 11.6 13.6 16.0 18.1 20.7 23.8 27.0 30.1 33.3 36.4 38.7 41.0 42.8 44.7 46.5 48.3 48.3
New build non-residential - thermal (GWh) 0.0 0.0 0.0 9.8 19.6 29.4 44.4 49.9 59.2 68.1 76.7 81.5 86.3 91.1 95.9 100.7 105.5 110.3 115.1 119.9
New build non-residential - electricity (GWh) 0.0 0.0 0.0 6.1 12.3 18.4 27.7 31.2 37.0 42.6 47.9 50.9 53.9 56.9 59.9 62.9 65.9 68.9 71.9 74.9
Thermal energy (GWh/yr) 2,862 2,848 2,837 2,833 2,832 2,831 2,834 2,829 2,829 2,829 2,828 2,823 2,818 2,812 2,806 2,799 2,792 2,785 2,778 2,768
Electrical energy (GWh/yr) 723 722 721 725 730 736 744 747 753 758 764 767 770 772 774 776 777 779 781 781
Total (GWh/yr) 3,585 3,571 3,558 3,558 3,562 3,566 3,578 3,576 3,582 3,587 3,591 3,590 3,588 3,584 3,580 3,575 3,570 3,564 3,559 3,549

Solihull
Year 2007 2008 2009 2010 2011 2012 2013 2014 2015 2016 2017 2018 2019 2020 2021 2022 2023 2024 2025 2026
Existing residential - thermal (GWh) 1,583 1,570 1,556 1,543 1,530 1,517 1,503 1,490 1,477 1,463 1,450 1,437 1,423 1,410 1,397 1,384 1,370 1,357 1,344 1,330
Existing residential - electrical (GWh) 424 422 419 417 415 413 411 409 407 405 403 401 399 397 395 393 391 389 386 384
Existing non-residential - thermal (GWh) 1,098 1,091 1,087 1,082 1,078 1,073 1,068 1,064 1,059 1,055 1,050 1,046 1,041 1,036 1,032 1,027 1,023 1,018 1,014 1,009
Existing non-residential - electrical (GWh) 576 573 571 568 566 564 561 559 556 554 552 549 547 544 542 540 537 535 532 530
New build residential - thermal (GWh) 3.7 7.2 11.7 14.1 17.3 21.8 25.1 29.3 33.5 37.7 41.9 46.1 50.3 54.5 58.7 62.9 67.1 71.3 75.5 75.5
New build residential - electricity (GWh) 2.3 4.4 7.2 8.7 10.6 13.4 15.4 18.0 20.6 23.2 25.7 28.3 30.9 33.5 36.0 38.6 41.2 43.8 46.4 46.4
New build non-residential - thermal (GWh) 1.8 3.6 5.3 7.1 11.8 16.5 21.2 25.9 30.5 35.2 39.9 44.6 49.3 52.1 55.0 57.8 60.7 63.5 66.4 69.2
New build non-residential - electricity (GWh) 1.1 2.2 3.3 4.4 7.4 10.3 13.2 16.2 19.1 22.0 25.0 27.9 30.8 32.6 34.4 36.2 37.9 39.7 41.5 43.3
Thermal energy (GWh/yr) 2,686 2,672 2,660 2,646 2,636 2,628 2,618 2,609 2,600 2,591 2,582 2,573 2,564 2,553 2,542 2,532 2,521 2,510 2,499 2,484
Electrical energy (GWh/yr) 1,003 1,001 1,001 999 999 1,001 1,001 1,002 1,003 1,004 1,005 1,006 1,007 1,007 1,007 1,007 1,007 1,007 1,007 1,004
Total (GWh/yr) 3,689 3,673 3,661 3,645 3,636 3,628 3,619 3,611 3,603 3,595 3,587 3,579 3,571 3,561 3,550 3,539 3,528 3,517 3,506 3,488
Stratford-on-Avon
Year 2007 2008 2009 2010 2011 2012 2013 2014 2015 2016 2017 2018 2019 2020 2021 2022 2023 2024 2025 2026
Existing residential - thermal (GWh) 952 941 931 921 910 900 890 879 869 859 848 838 828 817 807 797 786 776 766 755
Existing residential - electrical (GWh) 255 253 252 250 248 246 244 242 240 238 236 234 232 230 228 227 225 223 221 219
Existing non-residential - thermal (GWh) 655 651 649 646 643 640 638 635 632 629 627 624 621 619 616 613 610 608 605 602
Existing non-residential - electrical (GWh) 361 360 358 357 355 354 352 351 349 348 346 345 343 342 340 339 337 336 334 333
New build residential - thermal (GWh) 3.5 5.8 8.1 10.4 12.7 15.0 17.4 19.7 22.0 24.3 26.6 28.9 31.3 33.6 35.9 38.2 40.5 42.8 45.2 45.2
New build residential - electricity (GWh) 1.9 3.2 4.5 5.8 7.1 8.3 9.6 10.9 12.2 13.5 14.8 16.0 17.3 18.6 19.9 21.2 22.5 23.8 25.0 25.0
New build non-residential - thermal (GWh) 3.4 6.9 10.3 13.1 15.9 18.6 21.4 24.2 27.0 29.7 32.5 35.3 38.1 41.0 43.8 46.7 49.6 52.5 55.4 58.2
New build non-residential - electricity (GWh) 2.1 4.3 6.4 8.2 9.9 11.6 13.4 15.1 16.9 18.6 20.3 22.1 23.8 25.6 27.4 29.2 31.0 32.8 34.6 36.4
Thermal energy (GWh/yr) 1,614 1,605 1,598 1,590 1,582 1,574 1,566 1,558 1,550 1,542 1,534 1,526 1,518 1,510 1,503 1,495 1,487 1,479 1,471 1,461
Electrical energy (GWh/yr) 621 621 621 620 620 619 619 619 618 618 617 617 617 616 616 616 615 615 615 613
Total (GWh/yr) 2,234 2,226 2,219 2,210 2,202 2,194 2,185 2,177 2,168 2,160 2,152 2,143 2,135 2,127 2,118 2,110 2,102 2,094 2,086 2,074
Warwick
Year 2007 2008 2009 2010 2011 2012 2013 2014 2015 2016 2017 2018 2019 2020 2021 2022 2023 2024 2025 2026
Existing residential - thermal (GWh) 933 926 918 910 902 894 886 879 871 863 855 847 839 832 824 816 808 800 792 785
Existing residential - electrical (GWh) 280 279 277 276 275 273 272 271 269 268 267 265 264 262 261 260 258 257 256 254
Existing non-residential - thermal (GWh) 484 481 479 477 475 473 471 469 467 465 463 461 459 457 455 453 451 449 447 445
Existing non-residential - electrical (GWh) 492 489 487 485 483 481 479 477 475 473 471 469 467 465 463 461 459 457 455 453
New build residential - thermal (GWh) 3.6 6.1 7.8 9.2 13.8 18.2 22.6 26.6 30.2 33.8 37.3 40.8 44.3 47.9 51.2 54.6 58.0 61.4 64.8 64.8
New build residential - electricity (GWh) 2.2 3.7 4.8 5.7 8.5 11.2 13.8 16.3 18.5 20.7 22.8 25.0 27.1 29.3 31.4 33.4 35.5 37.6 39.6 39.6
New build non-residential - thermal (GWh) 0.9 1.9 2.8 4.3 5.7 7.2 8.6 10.1 11.5 13.0 14.5 15.9 17.4 19.9 22.3 24.8 27.3 29.8 32.3 34.7
New build non-residential - electricity (GWh) 0.6 1.2 1.8 2.7 3.6 4.5 5.4 6.3 7.2 8.1 9.0 9.9 10.9 12.4 14.0 15.5 17.1 18.6 20.2 21.7
Thermal energy (GWh/yr) 1,422 1,415 1,408 1,401 1,397 1,393 1,389 1,384 1,380 1,375 1,370 1,365 1,360 1,356 1,352 1,348 1,344 1,340 1,336 1,329
Electrical energy (GWh/yr) 774 773 771 770 770 770 770 770 770 770 769 769 769 769 769 769 770 770 770 768
Total (GWh/yr) 2,196 2,188 2,179 2,170 2,167 2,163 2,159 2,155 2,150 2,144 2,139 2,134 2,129 2,125 2,121 2,118 2,114 2,110 2,106 2,097

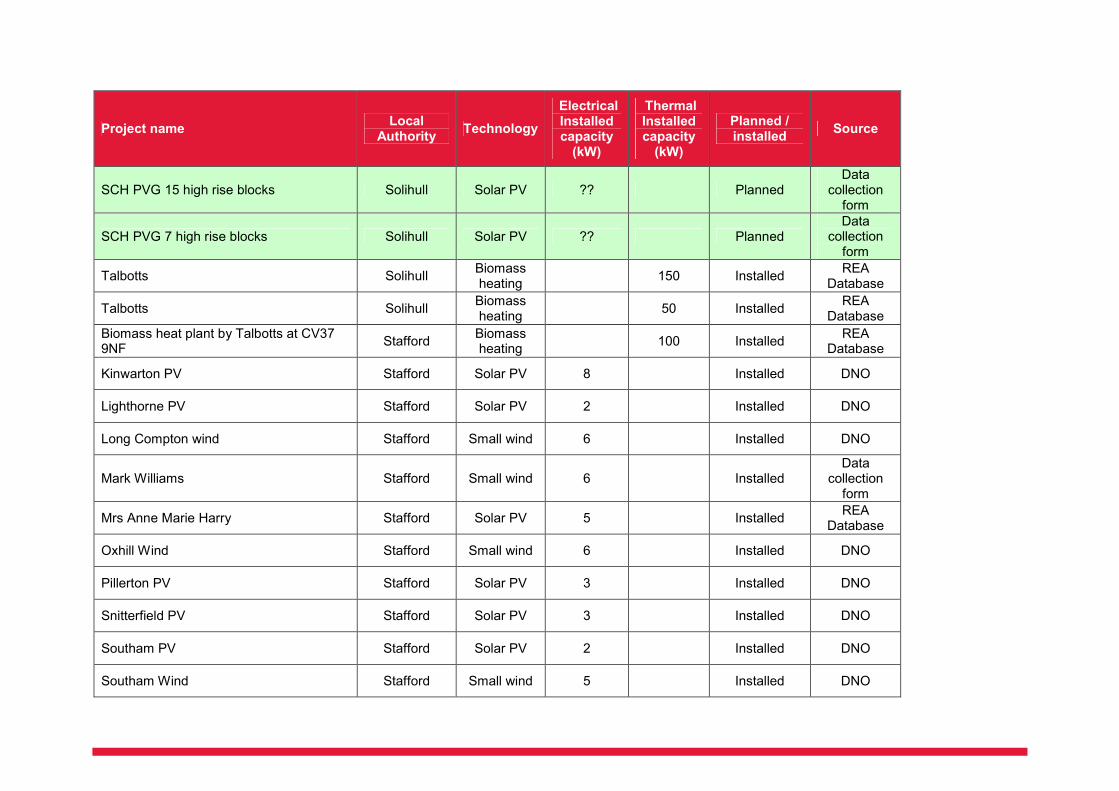
Appendix VI: Existing & planned renewables
Project name Local
Authority Technology
Electrical Installed capacity (kW)
Thermal Installed capacity (kW)
Planned / installed
Source
Atherstone Wind North
Warwickshire Small wind 2 Installed DNO
Atherstone PV North
Warwickshire Solar PV 82 Installed DNO
Mancetter Road/Grange Road North
Warwickshire Biomass heating
5,000 Planned RESTATS
Packington Generation Plant Phase 3 North
Warwickshire Landfill gas 8,470 Installed RESTATS
Pooley Country Park North
Warwickshire Small wind ?? Unknown
Data collection form
Bedworth CHP Nuneaton and Bedworth
Gas CHP 50 Installed DNO
Biomass heat plant by Talbotts Nuneaton and Bedworth
Biomass heating
150 Installed REA
Database
Chilvers Coton Nuneaton and Bedworth
Solar PV 2 Installed DNO
Eliot Park Innovation Centre / Paradise Farm
Nuneaton and Bedworth
Solar PV 105 Installed REA
Database
Hartshill Mini CHP North
Warwickshire Gas CHP 165 Installed
Data collection form
Hartshill CHP North
Warwickshire Gas CHP 2,900 Installed RESTATS
Hartshill STW North
Warwickshire Anaerobic digestion
190 Planned Data
collection form
Judkins Landfill site Nuneaton and Bedworth
Landfill gas 2,880 Installed RESTATS

Project name Local
Authority Technology
Electrical Installed capacity (kW)
Thermal Installed capacity (kW)
Planned / installed
Source
Judkins Landfill Site Phase 3 Nuneaton and Bedworth
Landfill gas 1,150 Planned RESTATS
Nuneaton CHP Nuneaton and Bedworth
Gas CHP 90 Installed DNO
NUNEATON wind Nuneaton and Bedworth
Small wind 1 Installed DNO
Ansty Rugby Biomass heating
240 Installed Data
collection form
Boughton Road Rugby Solar thermal
24 Installed Data
collection form
Boughton Road Rugby GSHP Installed Data
collection form
Cattle Market Rugby Solar thermal
20 Data
collection form
Coalpit Lane Rugby Landfill gas 950 Installed RESTATS
COTESBACH LANDFILL GAS PROJECT Rugby Landfill gas 3,600 Installed REA
Database
Dunsmore Rugby Solar PV 2 Installed DNO
KILSBY LANDFILL SITE Rugby Landfill gas 1,000 Installed Renewables
Map
Lawford Heath Landfill Gas Rugby Landfill gas 1,000 Installed Data
collection form
Long Lawford PV Rugby Solar PV 2 Installed DNO
New Bold CHP Rugby Gas CHP 190 Installed Data
collection

Project name Local
Authority Technology
Electrical Installed capacity (kW)
Thermal Installed capacity (kW)
Planned / installed
Source
form
Newton PV Rugby Solar PV 3 Installed DNO
Rugby Cement Rugby Energy from Waste
35,000 Planned RESTATS
Rugby Wind Rugby Small wind 5 Installed DNO
Ryton Pools Country Park Rugby Landfill gas 330 Installed RESTATS
Warwickshire College Rugby Small wind 15 Data
collection form
Willoughby PV Rugby Solar PV 2 Installed DNO
Barston Solihull Energy from Waste
190 Installed REA
Database
Checkley STW Solihull Energy from Waste
165 Installed REA
Database
Dutton Solar PV Solihull Solar PV 2 Installed REA
Database
Haslucks Green School Solihull Solar PV 2 Planned Data
collection form
Kingfisher School Solihull Solar thermal
3 Planned Data
collection form
Langly School Solihull Small wind 6 Planned Data
collection form
Moat Lane Depot Solihull Biomass heating
?? Planned Data
collection form
Project name Local
Authority Technology
Electrical Installed capacity (kW)
Thermal Installed capacity (kW)
Planned / installed
Source
SCH PVG 15 high rise blocks Solihull Solar PV ?? Planned Data
collection form
SCH PVG 7 high rise blocks Solihull Solar PV ?? Planned Data
collection form
Talbotts Solihull Biomass heating
150 Installed REA
Database
Talbotts Solihull Biomass heating
50 Installed REA
Database
Biomass heat plant by Talbotts at CV37 9NF
Stafford Biomass heating
100 Installed REA
Database
Kinwarton PV Stafford Solar PV 8 Installed DNO
Lighthorne PV Stafford Solar PV 2 Installed DNO
Long Compton wind Stafford Small wind 6 Installed DNO
Mark Williams Stafford Small wind 6 Installed Data
collection form
Mrs Anne Marie Harry Stafford Solar PV 5 Installed REA
Database
Oxhill Wind Stafford Small wind 6 Installed DNO
Pillerton PV Stafford Solar PV 3 Installed DNO
Snitterfield PV Stafford Solar PV 3 Installed DNO
Southam PV Stafford Solar PV 2 Installed DNO
Southam Wind Stafford Small wind 5 Installed DNO

Project name Local
Authority Technology
Electrical Installed capacity (kW)
Thermal Installed capacity (kW)
Planned / installed
Source
Southam Wind Stafford Small wind 20 Installed DNO
Stratford PV Stafford Solar PV 3 Installed DNO
Stratford PV Stafford Solar PV 5 Installed DNO
Studley Landfill Gas Stafford Landfill gas 664 Planned RESTATS
Ufton Stafford Landfill gas 1,006 Installed REA
Database
6 Thorn Stile Close Warwick Solar PV 3 Installed REA
Database
Ashton Court 1 Warwick Small wind 1 Installed Data
collection form
Ashton Court 2 Warwick Small wind 1 Installed Data
collection form
Ashton Court 3 Warwick Small wind 1 Installed Data
collection form
Bishops Tachbrook PV Warwick Solar PV 2 Installed DNO
Blackdown PV Warwick Solar PV 3 Installed DNO
BUDBROOKE wind Warwick Small wind 1 Installed DNO
Eden Court 1 Warwick Small wind 1 Installed Data
collection form
Eden Court 2 Warwick Small wind 1 Installed Data
collection form

Project name Local
Authority Technology
Electrical Installed capacity (kW)
Thermal Installed capacity (kW)
Planned / installed
Source
Eden Court 3 Warwick Small wind 1 Installed Data
collection form
Finham STW Warwick Anaerobic digestion
2,096 Installed Data
collection form
Hill Close Gardens Warwick Small wind 1 Installed Data
collection form
HillCrest Solar Warwick Solar PV 3 Installed REA
Database
Kenilworth PV 1 Warwick Solar PV 3 Installed DNO
Kenilworth PV 2 Warwick Solar PV 2 Installed DNO
Kenilworth PV 3 Warwick Solar PV 2 Installed DNO
Kenilworth Wind Warwick Small wind 1 Installed DNO
Leamingington Spa PV Warwick Solar PV 1 Installed DNO
Leamington Spa PV Warwick Solar PV 3 Installed DNO
Leamington Spa PV Warwick Solar PV 4 Installed DNO
Leamington Spa Wind Warwick Small wind 1 Installed DNO
Leamington Spa Wind 2 Warwick Small wind 1 Installed DNO
Lillington Road Warwick Small wind 1 Installed Data
collection form

Project name Local
Authority Technology
Electrical Installed capacity (kW)
Thermal Installed capacity (kW)
Planned / installed
Source
Lillington Wind Warwick Small wind 1 Installed DNO
LILLINGTON wind 2 Warwick Small wind 1 Installed DNO
Mill Lane Warwick Small wind 1 Installed Data
collection form
Rowington PV Warwick Solar PV 1 Installed DNO
Rowington PV Warwick Solar PV 2 Installed DNO
Rowington PV Warwick Solar PV 3 Installed DNO
Rowington PV Warwick Solar PV 4 Installed DNO
Southorn Ct 1 Warwick Small wind 1 Installed Data
collection form
Southorn Ct 2 Warwick Small wind 1 Installed Data
collection form
Southorn Ct 3 Warwick Small wind 1 Installed REA
Database
Sussex court PV Warwick Solar PV 2 Installed DNO
Tannery Court Warwick Small wind 1 Installed Data
collection form
Warwick PV Warwick Solar PV 1 Installed DNO
Warwick PV Warwick Solar PV 1 Installed DNO

Project name Local
Authority Technology
Electrical Installed capacity (kW)
Thermal Installed capacity (kW)
Planned / installed
Source
Warwick PV Warwick Solar PV 1 Installed DNO
Warwick PV Warwick Solar PV 1 Installed DNO
Warwick Wind Warwick Small wind 1 Installed DNO
Wasperton PV Warwick Solar PV 2 Installed DNO
Waverley Wood Farm Landfill Site Warwick Landfill gas 800 Installed RESTATS
Waverley Wood II Warwick Landfill gas 2,402 Planned RESTATS
Total 65,649 5,738

Appendix VII: Large wind
Based on the GIS constraints analysis, the district was subdivided into constrained zones, i.e. absolute constraints which would definitely prevent wind energy developments, unconstrained zones and less constrained zones, i.e. constraints which would not necessarily prevent wind energy developments, but which would rather result in consultations with the respective stakeholders.
One example for an absolute constraint would be those areas in the district covered by woodland as illustrated in the map below.
An example for a less constrained zone (i.e. one that would not necessarily prevent wind energy developments in the district, but which would rather result in consultations with the respective stakeholders) is illustrated in the GIS map below which shows those areas in the study possibly affected by radar issues.
Air safeguarding zones are ‘consultation zones’, i.e. Local Planning Authorities are required to consult the Civil Aviation Authority (CAA) upon any proposed developments with tall structures that would fall within safeguarding map-covered areas. Regarding this issue, the British Wind Energy Association’s (BWEA) ‘Wind energy and aviation guide’ points out that the aviation community has “procedures in place to assess the potential effects … and identify mitigation measures”. Furthermore, the guide states that while both wind energy and aviation are important to UK national interests, the ‘overall national context’ will be taken into account when assessing the potential impacts of a wind development upon aviation operations.
Therefore, the air safeguarding zones are only considered ‘consultation zones’ and were therefore excluded at this stage from the wind energy constraints analysis. Figure2 illustrates these consultations zones which cover the majority of the study area.
However, despite air safeguarding zones not being constraints per se, they need to be addressed by developers early in the process of wind energy site development. It is, therefore, advised for developers to start a pre planning consultation process with the relevant aviation stakeholders early in the feasibility process.

Figure1: Absolute constraint: Woodland areas in the study area

Figure2: Consultative zones: Air Safeguarding Zones in the study area

Distribution network within the district
When evaluating the feasibility of large renewable energy power generation, the distance from potential generation location sites to sections of the electricity network of suitable voltage is important. This does not account for capacity (thermal and load flow) characteristics of any particular connection point, which would need to be considered at the project level. Proximity to the electricity network (usually at the 11kV and 33kV level network) is a significant constraint to the viability of individual development sites.
Whilst in general the distance to the next grid connection point is necessary for the assessment of potential opportunities from all types of renewable energy developments that feed into the grid, such a distribution network map does not give an indication about the possible availability of connection capacity. This issue would normally only be addressed on an individual scheme basis and therefore has not be accounted for in this area-wide study.
Other aspects important with respect to grid connection for renewable energy projects include:
• Local loads
o The more similar the generator capacity is to the magnitude of local loads, the more cost effective the grid connection; this is due to the network usually being designed and sized for the local load in a certain area.
o The annual charges that the generator incurs when using the distribution system can be saved if the generation can be connected into an existing customer network.
o Using energy on-site can triple its value as this is the equivalent higher factor that suppliers charge for selling energy in comparison to purchasing energy.
• Voltage
o If the generating voltage differs from network voltages, transformers might be required which in turn, however, can increase connection costs significantly.
o Purchasing additional equipment is generally only worth it if losses on the cables are significant; if that’s not the case, connection should happen at the generator voltage.
o Determining the most suitable connection voltage for various generator capacities can be done by applying the following rule of thumb:
� Less than 3.6kW – 240V (1-phase)
� Less than 400kW – 400V (3-phase)
� Between 400kW and 8MW – 11kV
� Over 8MW – EHV connection (33kV or higher)
• Switchgear and ratings
o Extending an existing switchboard (used for isolation of electrical equipment) might be less cost effective than connecting into a cable with a ring main unit – depending on required civil works and distance from generation.
• Regulatory requirements
o When connecting renewable generation to the distribution network, there are two Electricity Networks Association guidelines, i.e. G83 and G59.
o G83 is for very small embedded generators (up to 16A per phase), whereas G59 is for medium-sized embedded generators, i.e. up to 5MW, connection up to 20kV.

• Connection applications
o Generators installed under the G59 guidelines -or multiple smaller generators-, require the submission of a generator connection application to the local distribution network operator (DNO). Within a maximum of 90 days upon receipt of the application, the DNO will assess the effect of the proposed generation on the remaining network.
o Upon successful detailed assessments, a connection offer will be made by the DNO indicating the non-contestable work and costs (to be undertaken by the DNO) and contestable work (to be undertaken by either the DNO or an accredited third party) and their respective timeframes.

Appendix VIII: Biomass – available resource & analysis assumptions
TOTAL TARGET POTENTIAL (decentralised generation + new build sites + existing buildings)
North Warwickshire
Year
Paper&card
+
wood waste
Green waste +
Food/kitchen
waste
Animal
manure -wet
Animal
manure -dryStraw
Energy
crops
Sawmill
residues
Forestry
residues
C&D + C&I
wood waste
Commercial
food wasteTotal
2010 1,097 1,552 776 21 9,714 0 0 46 2,632 104 15,942
2011 1,529 2,388 1,475 25 11,242 0 0 111 6,433 222 23,425
2012 1,973 3,229 2,174 29 12,769 0 0 176 10,235 343 30,927
2013 2,430 4,075 2,873 33 14,296 2,075 0 240 14,036 466 40,523
2014 2,899 4,925 3,571 37 15,824 4,149 0 305 17,838 590 50,139
2015 3,382 5,781 4,270 41 21,811 6,915 0 369 21,640 716 64,925
2016 4,109 6,133 4,969 41 22,606 9,681 0 480 25,441 844 74,303
2017 4,848 6,490 5,668 41 23,400 12,447 0 591 29,243 973 83,701
2018 5,600 6,852 6,367 41 24,194 15,213 0 702 33,044 1,105 93,118
2019 6,365 7,218 7,065 41 24,988 17,979 0 813 36,846 1,238 102,554
2020 7,143 7,590 7,764 41 25,783 20,745 0 924 36,846 1,373 108,207
2021 7,920 7,966 7,764 41 25,783 30,426 0 924 36,846 1,509 119,178
2022 8,710 8,347 7,764 41 25,783 40,107 0 924 36,846 1,647 130,169
2023 9,513 8,732 7,764 41 25,783 49,788 0 924 36,846 1,788 141,178
2024 10,329 9,123 7,764 41 25,783 59,469 0 924 36,846 1,929 152,207
2025 11,157 9,518 7,764 41 25,783 69,150 0 924 36,846 2,073 163,256
MSW
PRIMARY ENERGY (MWh) - NORTH WARWICKSHIRE
Agriculture

Nuneaton & Bedworth
Year
Paper&card
+
wood waste
Green waste +
Food/kitchen
waste
Animal
manure -wet
Animal
manure -dryStraw
Energy
crops
Sawmill
residues
Forestry
residues
C&D + C&I
wood waste
Commercial
food wasteTotal
2010 1,833 2,574 91 6 1,940 0 0 4 3,049 173 9,670
2011 2,553 3,940 173 7 2,215 0 0 10 7,454 372 16,723
2012 3,295 5,314 254 8 2,491 0 0 16 11,858 573 23,809
2013 4,058 6,696 336 9 2,766 567 0 22 16,263 778 31,494
2014 4,842 8,085 418 10 3,042 1,133 0 28 20,667 985 39,211
2015 5,648 9,483 500 12 4,229 1,889 0 34 25,071 1,196 48,061
2016 6,862 10,071 581 12 4,345 2,644 0 44 29,476 1,409 55,444
2017 8,097 10,668 663 12 4,462 3,400 0 54 33,880 1,626 62,860
2018 9,353 11,272 745 12 4,578 4,155 0 64 38,285 1,845 70,308
2019 10,630 11,884 827 12 4,695 4,911 0 74 42,689 2,067 77,788
2020 11,929 12,504 908 12 4,811 5,666 0 84 42,689 2,292 80,897
2021 13,228 13,132 908 12 4,811 8,310 0 84 42,689 2,520 85,695
2022 14,547 13,769 908 12 4,811 10,955 0 84 42,689 2,751 90,526
2023 15,888 14,413 908 12 4,811 13,599 0 84 42,689 2,985 95,389
2024 17,251 15,064 908 12 4,811 16,243 0 84 42,689 3,222 100,285
2025 18,634 15,724 908 12 4,811 18,887 0 84 42,689 3,462 105,212
MSW
PRIMARY ENERGY (MWh) - NUNEATON AND BEDWORTH
Agriculture

Rugby
Year
Paper&card
+
wood waste
Green waste +
Food/kitchen
waste
Animal
manure -wet
Animal
manure -dryStraw
Energy
crops
Sawmill
residues
Forestry
residues
C&D + C&I
wood waste
Commercial
food wasteTotal
2010 1,774 2,450 1,065 883 13,990 0 0 40 3,131 167 23,501
2011 2,471 3,696 2,024 1,060 16,107 0 0 96 7,654 360 33,469
2012 3,190 4,950 2,983 1,237 18,225 0 0 152 12,177 555 43,469
2013 3,928 6,212 3,942 1,413 20,343 2,484 0 208 16,699 753 55,983
2014 4,688 7,481 4,901 1,590 22,461 4,967 0 265 21,222 954 68,529
2015 5,468 8,758 5,859 1,767 31,061 8,279 0 321 25,745 1,158 88,415
2016 6,643 9,328 6,818 1,767 32,088 11,591 0 417 30,268 1,364 100,283
2017 7,838 9,905 7,777 1,767 33,115 14,902 0 513 34,790 1,574 112,182
2018 9,054 10,490 8,736 1,767 34,142 18,214 0 609 39,313 1,786 124,112
2019 10,291 11,083 9,695 1,767 35,169 21,526 0 705 43,836 2,001 136,073
2020 11,549 11,683 10,654 1,767 36,196 24,837 0 802 43,836 2,219 143,543
2021 12,806 12,292 10,654 1,767 36,196 36,428 0 802 43,836 2,440 157,219
2022 14,083 12,907 10,654 1,767 36,196 48,019 0 802 43,836 2,664 170,927
2023 15,381 13,531 10,654 1,767 36,196 59,609 0 802 43,836 2,890 184,665
2024 16,700 14,162 10,654 1,767 36,196 71,200 0 802 43,836 3,120 198,436
2025 18,040 14,801 10,654 1,767 36,196 82,791 0 802 43,836 3,352 212,237
MSW
PRIMARY ENERGY (MWh) - RUGBY
Agriculture

Solihull
Year
Paper&card
+
wood waste
Green waste +
Food/kitchen
waste
Animal
manure -wet
Animal
manure -dryStraw
Energy
crops
Sawmill
residues
Forestry
residues
C&D + C&I
wood waste
Commercial
food wasteTotal
2010 253 885 453 76 3,122 0 0 17 6,240 24 11,070
2011 352 2,026 861 91 3,545 0 0 42 15,253 51 22,221
2012 455 3,168 1,269 106 3,968 0 0 66 24,266 79 33,377
2013 560 4,311 1,677 121 4,391 656 0 90 33,279 107 45,193
2014 668 5,456 2,085 137 4,814 1,312 0 114 42,292 136 57,014
2015 779 6,601 2,493 152 6,720 2,187 0 139 51,304 165 70,540
2016 947 6,683 2,900 152 6,878 3,061 0 180 60,317 194 81,313
2017 1,117 6,765 3,308 152 7,036 3,936 0 222 69,330 224 92,091
2018 1,291 6,848 3,716 152 7,194 4,811 0 263 78,343 255 102,873
2019 1,467 6,933 4,124 152 7,353 5,686 0 305 87,356 285 113,660
2020 1,646 7,018 4,532 152 7,511 6,560 0 346 87,356 316 115,438
2021 1,825 7,105 4,532 152 7,511 9,622 0 346 87,356 348 118,797
2022 2,007 7,193 4,532 152 7,511 12,683 0 346 87,356 380 122,160
2023 2,193 7,282 4,532 152 7,511 15,745 0 346 87,356 412 125,528
2024 2,381 7,372 4,532 152 7,511 18,806 0 346 87,356 445 128,900
2025 2,571 7,463 4,532 152 7,511 21,868 0 346 87,356 478 132,277
MSW
PRIMARY ENERGY (MWh) - SOLIHULL
Agriculture

Stratford-On-Avon
Year
Paper&card
+
wood waste
Green waste +
Food/kitchen
waste
Animal
manure -wet
Animal
manure -dryStraw
Energy
crops
Sawmill
residues
Forestry
residues
C&D + C&I
wood waste
Commercial
food wasteTotal
2010 1,485 2,404 1,882 14,533 39,012 0 4,586 320 5,525 140 69,889
2011 2,069 4,083 3,576 17,440 43,981 0 5,228 769 13,507 301 90,954
2012 2,671 5,768 5,271 20,347 48,950 0 5,870 1,217 21,488 465 112,045
2013 3,289 7,460 6,965 23,253 53,919 10,814 6,512 1,665 29,469 630 143,977
2014 3,925 9,158 8,659 26,160 58,888 21,629 7,154 2,114 37,450 799 175,935
2015 4,578 10,863 10,353 29,067 82,600 36,048 7,796 2,562 45,431 969 230,267
2016 5,562 11,340 12,047 29,067 84,125 50,467 8,438 3,330 53,413 1,142 258,931
2017 6,563 11,823 13,741 29,067 85,651 64,887 9,080 4,099 61,394 1,318 287,621
2018 7,581 12,313 15,435 29,067 87,176 79,306 9,722 4,867 69,375 1,495 316,337
2019 8,617 12,809 17,129 29,067 88,701 93,725 10,363 5,636 77,356 1,676 345,079
2020 9,669 13,312 18,823 29,067 90,227 108,144 11,005 6,405 77,356 1,858 365,867
2021 10,722 13,821 18,823 29,067 90,227 158,612 11,638 6,405 77,356 2,043 418,713
2022 11,791 14,337 18,823 29,067 90,227 209,079 12,271 6,405 77,356 2,230 471,586
2023 12,878 14,859 18,823 29,067 90,227 259,546 12,904 6,405 77,356 2,420 524,485
2024 13,983 15,387 18,823 29,067 90,227 310,013 13,537 6,405 77,356 2,612 577,409
2025 15,104 15,922 18,823 29,067 90,227 360,481 14,170 6,405 77,356 2,806 630,360
MSW
PRIMARY ENERGY (MWh) - STRATFORD-ON-AVON
Agriculture

Warwick
Year
Paper&card
+
wood waste
Green waste +
Food/kitchen
waste
Animal
manure -wet
Animal
manure -dryStraw
Energy
crops
Sawmill
residues
Forestry
residues
C&D + C&I
wood waste
Commercial
food wasteTotal
2010 926 1,927 376 168 8,973 0 2,293 79 4,465 87 19,295
2011 1,290 3,743 715 201 10,200 0 2,614 190 10,915 188 30,057
2012 1,665 5,564 1,054 235 11,428 0 2,935 301 17,365 290 40,836
2013 2,051 7,388 1,393 269 12,655 2,272 3,256 411 23,814 393 53,903
2014 2,448 9,216 1,731 302 13,883 4,545 3,577 522 30,264 498 66,987
2015 2,855 11,049 2,070 336 19,361 7,575 3,898 633 36,714 604 85,095
2016 3,468 11,346 2,409 336 19,833 10,605 4,219 823 43,164 712 96,914
2017 4,092 11,648 2,748 336 20,304 13,635 4,540 1,013 49,613 822 108,750
2018 4,727 11,953 3,086 336 20,776 16,664 4,861 1,203 56,063 933 120,602
2019 5,373 12,263 3,425 336 21,248 19,694 5,182 1,393 62,513 1,045 132,471
2020 6,030 12,576 3,764 336 21,719 22,724 5,503 1,583 62,513 1,159 137,906
2021 6,686 12,894 3,764 336 21,719 33,329 5,819 1,583 62,513 1,274 149,916
2022 7,353 13,215 3,764 336 21,719 43,934 6,136 1,583 62,513 1,391 161,942
2023 8,031 13,541 3,764 336 21,719 54,538 6,452 1,583 62,513 1,509 173,985
2024 8,719 13,870 3,764 336 21,719 65,143 6,768 1,583 62,513 1,629 186,044
2025 9,419 14,204 3,764 336 21,719 75,748 7,085 1,583 62,513 1,750 198,119
MSW
PRIMARY ENERGY (MWh) - WARWICK
Agriculture

Total study area
Year
Paper&card
+
wood waste
Green waste +
Food/kitchen
waste
Animal
manure -wet
Animal
manure -dryStraw
Energy
crops
Sawmill
residues
Forestry
residues
C&D + C&I
wood waste
Commercial
food wasteTotal
2010 7,368 11,792 4,645 15,687 76,751 0 6,878 507 25,043 695 149,366
2011 10,265 19,876 8,825 18,824 87,291 0 7,841 1,217 61,215 1,494 216,849
2012 13,248 27,993 13,005 21,961 97,832 0 8,804 1,927 97,388 2,305 284,463
2013 16,316 36,142 17,185 25,099 108,372 18,868 9,767 2,637 133,560 3,128 371,074
2014 19,471 44,322 21,365 28,236 118,912 37,735 10,730 3,347 169,733 3,962 457,814
2015 22,711 52,535 25,545 31,374 165,781 62,892 11,693 4,057 205,906 4,808 587,303
2016 27,590 54,901 29,725 31,374 169,874 88,049 12,656 5,274 242,078 5,666 667,189
2017 32,555 57,299 33,905 31,374 173,968 113,206 13,619 6,492 278,251 6,536 747,205
2018 37,606 59,729 38,085 31,374 178,061 138,363 14,582 7,709 314,424 7,418 827,350
2019 42,743 62,190 42,265 31,374 182,154 163,520 15,545 8,926 350,596 8,312 907,625
2020 47,966 64,684 46,445 31,374 186,247 188,677 16,508 10,143 350,596 9,217 951,858
2021 53,186 67,210 46,445 31,374 186,247 276,727 17,457 10,143 350,596 10,134 1,049,519
2022 58,492 69,767 46,445 31,374 186,247 364,776 18,407 10,143 350,596 11,063 1,147,310
2023 63,884 72,357 46,445 31,374 186,247 452,825 19,356 10,143 350,596 12,004 1,245,231
2024 69,362 74,978 46,445 31,374 186,247 540,875 20,305 10,143 350,596 12,957 1,343,281
2025 74,926 77,631 46,445 31,374 186,247 628,924 21,254 10,143 350,596 13,921 1,441,461
MSW
PRIMARY ENERGY (MWh) - Total study area
Agriculture

BIOMASS ANALYSIS ASSUMPTIONS
Forestry residues • It is assumed that yield and ratio of residues to volume of merchantable timber for Scots pine YC10 are representative of all conifers in the region. Similar assumptions are made that Birch YC6 are representative of all broadleaves in the region. Volume of residues generated per hectare have been derived using parameters from Cannel and Dewar (1996) and Forestry Commissions Yield Tables (1981), assuming rotations of 70 for Scots pine and 60 for Birch. Total volume of residues generated from thinnings over rotation and final harvest is divided by rotation to derive annual oven-dried tonnes (ODT/year). Therefore, it is assumed that all forestry age classes are represented equally.
• Slow initial uptake is assumed, to account for machinery and labour required and incorporation of residues extraction in forest management plans: 5% by 2010; 40% by 2015; and 100% by 2020.
Energy Crops • The E4tech report models 4 case scenarios based on data from the Refuel project, all 4 scenarios consider that land available for energy crops will increase: area of arable land available for energy crops increasing from 605,000 Hectares in 2008 to 963-1334,000 Ha in 2030, and pasture area from 290,000 Ha in 2008 to 1200,000 Ha in 2030. However, for this study it has been considered appropriate to assume that land available for energy crops will remain constant over time and it is only equivalent to arable land currently out of production (i.e. no proportion in pasture land considered available), since:
o The area of arable land not in production (the equivalent of bare fallow and un-cropped set-aside land in 2007) has fallen steeply, by over 62% between 2007 and 2008, (Defra Agricultural survey, 2008)
o Defra abolished set aside land in 2008.
o Current trends of expansion of organic agriculture and farming, which will require wider areas to obtain the same production volumes.
o There are many environmental restrictions that make very unlikely the conversion of most pastures to energy crops (potentially significant loss of soil carbon, run-off and biodiversity to name a few).
• Very slow initial uptake is assumed, to account for required specialised machinery and labour, subsidy schemes, and delay of fist harvest (3 years for willow and 5 years for poplar): 10% by 2015, 30% by 2020 and 100% by 2025.
Sawmill residues • The competing uses are the panel board industry, paper and pulp, exports and fencing. Currently, 12% of co-products are sold for bio-energy (Forestry Commission statistics 20091). It is assumed that availability for bio-energy will increase up to 30% of current total resource by 2020, on the basis that:
o Softwood availability in the United Kingdom continues to increase over the next 15 years from 12 million m3 in the period 2007-2011, peaking in the period 2017-2021 at just over 14 million m3 (Forestry Commission 20062).
1 Forestry Commission statistics. 2009. http://www.forestry.gov.uk/website/forstats2009.nsf/TopContents?Open&ctx=92B74B2CCD24A56C8025731B0053FB26 2 New forecast of softwood availability (Forestry Commission 2006). http://www.forestry.gov.uk/website/ForestStats2006.nsf/byunique/ukgrown.html

o Increasing recycling rates of waste wood from the construction and other industries will supply part of panel board industry and therefore release part of the sawmill resource
• Immediate uptake achievable as soon as the resource is made available
• Output of the sawmills in the study area remain constant.
Crop residues - Straw • The availability factor of 35% for cereal straw (Wheat and Barley account for over 95% of land dedicated to cereals in the UK) is derived from the UK Biomass Strategy: "The UK cereal straw (Wheat and Barley) resource is significant (9-10 mt per annum) but much of this is recycled to livestock and much of the rest is ploughed into soil (it has a resource value as a fertiliser and organic matter supplement). It is estimated, that up to 3m tonnes could be made available in the long term without disrupting livestock use/buying costs". Supported by Biomass Energy Centre: "Most Barley straw is used for animal bedding and feed, and figures for Winter wheat straw suggest that in the UK around 40% is chopped and returned to the soil, 30% used on the farm (for animal bedding and feed), and 30% is sold". Wheat accounts for 70% of all land dedicated to cereals.
• It is assumed that up 60% of the straw available for bio-energy can be recovered from the filed. To account for technology limitations.
• Uptake assumption for cereal straw: 50% by 2010, 100% by 2015
• Uptake assumptions from DECC/E4tech for oil seed rape: 10% of this can be collected now, 20% in 2010, 50% in 2015, and 100% from 2020 in all scenarios. The uptake rate is relatively slow, as oilseed rape straw is not currently extracted in large quantities and is more difficult to handle than wheat and barley straw.
• Wheat parameters (yield, moisture and NCV) have been used for cereal straw since practically all cereal straw will come from wheat. Wheat accounts for 70% of all land dedicated to cereals.
• Area of land dedicated to cereal and rape seed oil assumed to remain constant over time.
Agricultural animal waste • 15% of theoretical resource is excluded to represent technical limitations of manure collection and handling losses.
• Extraction rates were considered to be (E4tech):
For dry poultry litter 18% now, 50% in 2010 and 100% in 2015.
For wet manures, the rate was assumed to be lower, at 1% now, 10% in 2010, 50% in 2015 and 100% in 2020
High uptake rates proposed by E4tech (especially for dry poultry litter) and no competing demands can be backed by the following facts:
o Since digestate from Anaerobic Digestion has a higher nutrient value than manure, farmers are likely to provide manure at zero cost in exchange for returned digestate – which needs to be spread to land (E4tech).
o Although much poultry litter has been spread on the land as a fertilizer, there has been evidence that when spread on land for cattle grazing or for hay or silage, this can cause botulism in cattle and the practice has been urged against by Defra. Defra advises either incineration or deep ploughing or burial.

o Animal slurry is widely used as a fertilizer and there are a number of methods to spread it on land, though recent concerns about loss of ammonia to the air means that Defra now advises against broadcast spreading3
• As implied by uptake assumptions above, use of manure as fertiliser has not been considered has a competing demand.
• Number of livestock to remain constant over time.
Waste currently land-filled • For this study, slow growth of waste arisings (0.75% annually over current levels) has been assumed. It is acknowledged by a number of sources (Waste Strategy for England 20074, ERM5 and E4Tech reports) that there is great uncertainty regarding future arisings. E4tech assumes static, waste strategy suggests four scenarios (one of them no growth, 3 of them little growth with maximum of 2% a year).
• For paper and card recycling is supplied first. Overall recycling targets in the waste strategy for household waste assumed to be applicable to individual waste components. This is supported by EU directive that sets specific recycling targets for 2020 of 50% for glass, plastic, paper and metals.
• Maximum recovery levels are set based on best performance across Europe, under the basis that if it has been achieved elsewhere in Europe, it can theoretically be achieved in the study area. These are taken from Table B1.2 of the ERM report.
• Separability of waste will increase linearly to reach maximum recovery levels in 2025/26.
• Initial recovery potential = 5% over recycling rate.
• Alternative disposal routes for kitchen waste and green waste e.g. composting are not considered as competing demand.
• The Waste Strategy for England 2007 sets actions to stimulate energy recovery of wood waste rather than recycling. Therefore, all collectable wood waste over current recycling rates assumed to be available for energy. From the waste strategy it is clear that wood has relatively low embodied energy (energy consumed in extraction) but high calorific value. Though for some kinds of wood waste re-use or recycling are better options, use as a fuel generally conveys a greater greenhouse gas benefit than recovering the material as a resource (and avoiding primary production).
Green waste currently diverted • Composting is not considered a competing demand. However, an uptake period of 5 years is assumed.
3 •Biomass energy centre http://www.biomassenergycentre.org.uk/portal/page?_pageid=75,17976&_dad=portal&_schema=PORTAL 4 Waste strategy for England 2007. http://www.defra.gov.uk/environment/waste/strategy/strategy07/index.htm 5 Carbon Balances and Energy Impacts of the Management of UK Wastes (ERM 2006). http://randd.defra.gov.uk/Document.aspx?Document=WR0602_4746_FRA.pdf

PROJECTED BIOMASS CHP FACILITY
Operational hours 8000 hours/yr
Capacity installed 2.5 MWe
Electrical efficiency 30%
Primary energy required 66,667 MWh
Feedstock used Dry clean biomass
LA
Total clean
biomass potential -
primary energy
MWh -2015
Contribution to
project
Nuneaton 18,687 3,586
North Warwickshire 39,916 7,660
Rugby 52,533 10,082
Stratford 151,721 29,117
Warwick 49,824 9,562
Solihull 34,697 6,659
Total 347,377 66,667
Proportion diverted to
proposed biogas plant 19%
PROJECTED BIOGAS PLANT
Operational hours 8000 hours/yr
Capacity installed 2 MWe
Electrical efficiency 30%
Primary energy required 53,333 MWh
LA
Total AD potential -
primary energy
MWh -2015
Nuneaton 44,077 9,098
North Warwickshire 30,773 6,352
Rugby 46,359 9,569
Stratford 58,381 12,050
Warwick 49,119 10,139
Solihull 29,678 6,126
Total 258,388 53,333
Proportion diverted to
proposed biogas plant 21%

Target - Potential Energy Generation
0
50,000
100,000
150,000
200,000
250,000
300,000
2010
2011
2012
2013
2014
2015
2016
2017
2018
2019
2020
2021
2022
2023
2024
2025
MWh
Total potent ial elect - MWhe
Potent ial elect excluding contribut ion f rom MSW components diverted to projected EfW - MWhe
Potent ial heat generat ion -MWhh
Potential energy generation - Total
Potential energy generation - excluding contribution from MSW components diverted to
projected EfW - Mwhe
Year MWhe MWhh MWhe MWhh
2010 22,953 31,286 22,953 31,286
2011 37,257 48,717 37,257 48,717
2012 51,612 66,181 51,612 66,181
2013 66,271 86,291 66,271 86,291
2014 80,980 106,434 80,980 106,434
2015 121,110 133,060 96,364 133,060
2016 129,880 149,622 105,279 149,622
2017 138,701 166,218 114,244 166,218
2018 147,572 182,847 123,260 182,847
2019 156,494 199,511 132,327 199,511
2020 161,900 207,704 137,879 207,704
2021 166,943 222,808 143,089 222,808
2022 172,036 237,945 148,350 237,945
2023 177,180 253,115 153,662 253,115
2024 182,375 268,320 159,024 268,320
2025 187,620 283,559 164,437 283,559

Appendix IX: Small wind
Small wind has not been explicitly reviewed in terms of generation potential within this study since the overall potential is limited. The following provides guidance on the key issues associated with small wind energy development. Key opportunities for small wind energy development include:
• Farms
• Public sector sites such schools
• Industrial parks and retail parks
When considering the potential for small wind energy schemes, which can include building-mounted wind turbines, the following aspects need to be taken into consideration:
• Surrounding obstacles create turbulence which a) decreases a wind turbine’s output and b) increases both the load and vibration effects on the building / site. These turbulences are obviously mostly prevailing in urban areas, making these potential sites often less suitable for small wind turbines than areas in rural regions, such as farm houses, small rurally located hamlets or villages or locations on the edge of larger settlements. The figure below illustrates the turbulences that obstacles, such as buildings or trees create which can result in much lower wind speeds for small-scale wind turbines.
Figure3: Effects of wind shadowing (Source: www.awea.com)
• Wind imposes considerable dynamic loads on a roof-mounted wind turbine and conventional buildings are not designed to deal with these, so care must be taken when planning installations.
• It is much easier to install a wind turbine on a new building instead of retrofitting it to an existing building (structural engineers must be consulted in both cases).
• Access for inspection and maintenance is important for building-mounted wind turbines.
• The electricity for small scale turbines can either link to the grid or charge batteries, the former being more cost effective.

• The availability of grants (such as through the Low Carbon Buildings Programme6) for the installation of microgeneration technologies, can increase the affordability of the development of small wind schemes for potential target groups, such as community groups, schools, supermarkets, council buildings, industrial estates or other large commercial customers.
• At present national planning legislation requires that planning permission is obtained for domestic wind turbines and similar small wind energy installations, which do not benefit from Permitted Development Rights: different conditions and limitations apply depending on whether a small-scale turbine is fixed to a house, on a wall, to the roof or whether it is a free standing turbine. The main criteria that Local Authorities would take into consideration include turbine height; location, age and impact on the host building; shadow flicker; noise; interference with electromagnetic interference; highway safety; visual impact; environmental considerations and site access7.
• With respect to potential sites for small-scale wind, the technology is particularly suitable for farms, but also for municipal buildings such as community centres or schools (above all in rural areas where the effects of wind shadowing would be smaller than in urban areas and where schools usually have more land to place the turbine on). An additional advantage of these “community” sites would support education.
• There is a significant difference in terms of electricity output based on the height and capacity of a turbine. The figure below illustrates that the energy output per MW installed grows exponentially with increasing turbine height.
Figure4: Turbine height compared to turbine output
6 http://www.lowcarbonbuildings.org.uk/home/ 7 http://www2.valeroyal.gov.uk/internet/vr.nsf/AllByUniqueIdentifier/DOCC3B2E8B8DEF3AD2380257260005AB960
Turbine height compared to turbine output
0
1000
2000
3000
4000
5000
6000
15 80 100 250 600 800 2000 3000
Turbine capacity (kW)
Max height to tip m Energy Output per MW

Appendix X: Photovoltaics (PV)
Solar photovoltaic (PV) panels are semi-conductor panels that convert light directly into electricity. This DC power is normally passed through an inverter which converts it into AC power which can be used to power the normal range of domestic appliances or be exported to the local electricity network. The amount of power that a PV panel will deliver is proportional to the amount of sunlight that falls upon it.
Solar energy can be exploited through three different means: solar photovoltaics (solar PV), active solar heating (solar thermal) and passive solar design. The least widespread of these is passive solar design: only a few thousand buildings in the UK have been designed to deliberately exploit solar energy - resulting in an estimated saving of around 10 GWh / year8.
The key advantages of photovoltaics are:
• they can be integrated into buildings so that no extra land area is required,
• they can be used in a variety of ways architecturally, ranging from the visually unobtrusive to clear expressions of the solar nature of the building,
• they are modular in nature so that any size of system can be installed and
• there are fewer transmission losses since the electricity is used ‘on site’.
Other important characteristics of photovoltaics:
• Compared to retrofitting existing buildings, it is significantly easier to integrate solar energy technologies into new buildings
• Building-integrated PVs offset some of the costs of the roof construction and save space. Some of the most promising applications include:
o New, high profile commercial office buildings
o New housing developments (preferably incorporating low energy design features)
o Schools and other educational buildings
o Other large high profile developments (such as sports stadiums)
• PV can be utilised in two ways:
o Stand-alone PV – for remote uses such as monitoring and telemetry systems, where mains electricity is too difficult or expensive to supply.
o Grid-connected PV – where the PV system is connected to and generates into the mains electricity system.
8 BERR, Digest of UK Energy Statistics 2007: http://stats.berr.gov.uk/energystats/dukes07_c5.pdf

Appendix XI: Solar thermal hot water
Solar thermal hot water (STHW) systems (sometimes referred to as solar collectors, or active solar systems) convert solar radiation into thermal energy (heat) which can be used directly for a range of applications, such as hot water provision and low temperature heat for swimming pools.
The key advantages of solar thermal are:
• they can be integrated into buildings so that no extra land area is required,
• they can be used in a variety of ways architecturally, ranging from the visually unobtrusive to clear expressions of the solar nature of the building,
• they are modular in nature so that any size of system can be installed.

Appendix XII: Ground source heat pumps
According to the Energy Saving Trust9, ground source heat pumps (GSHP) make use of the constant temperature that the earth in the UK keeps throughout the year (around 11-12 degrees a few metres below the surface). These constant temperatures are the result of the ground’s high thermal mass which stores heat during the summer. This heat is transferred by (electrically powered) ground source heat pumps from the ground to a building to provide space heating and in some cases, to pre-heat domestic hot water. A typical efficiency of GSHP is around 3-4 units of heat produced for every unit of electricity used to pump the heat.
Characteristics of GSHP include:
• Sizing of the heat pump and the ground loop depends on the heating requirements.
• GSHP can meet all of the space heating requirements of a house, but domestic hot water will usually only be pre-heated.
• GSHP can work with radiators, however, underfloor heating works at lower temperatures (30-35 degrees) and is therefore better for GSHP.
9 http://www.energysavingtrust.org.uk/uploads/documents/myhome/Groundsource%20Factsheet%205%20final.pdf

Appendix XIII: Hydro power
Study area potential
There are numerous weirs within the study area but these are assumed to have heads less than 2 metres as they were not included with a key reference report that reviewed the UK potential for small hydro in 198910. Many weirs sites were identified within the report but discounted principally because of they had a ‘head’ height of less than 2 metres. Since this report there has been improvements in Hydro technology and so many recent hydro power studies have included sites with a ‘head’ height less than 2 metres, for example a recent report for Sheffield11 used a minimum head for potential hydro developments as 1.2 metres.
The assessment of hydro energy potential sites in the study area was restricted to 3 sources of data: Volume 2 (Assessed Sites) and Volume 3 (Rejected sites) of the report above and the Small Hydro website12.
In total 12 sites were reassessed which were all located either on the River Stour or River Avon. All these sites had heads less than 2 metres and for the purpose of this study a minimum head was assumed to be 1.2 metres and a maximum head of 2 metres. River flow data for The Avon and Stour was taken from the National River Flow Archive13 and the formula below was used to generate potential capacities for each assessed site (based on basic hydro calculation14). From this hydro capacity factors were converted to annual generation (MWh).
Capacity (kW) = 1.2 x 1.32 x 0.8 x 0.70 x 9.81 m/s2
The results are summarised in the table below.
Warwickshire Potential Small Hydro Capacity (kW) and Annual MWh
Local Authority
Number of Sites
Estimated Minimum
Capacity (kW)
Estimated Maximum Capacity (kW)
Estimated Minimum
Annual (MWh)
Estimated Maximum Annual (MWh)
North Warwickshire 0 0 0 0 0
Nuneaton and Bedworth 0 0 0 0 0
Rugby 2 21 34 171 284
Solihull 0 0 0 0 0
Stratford 4 134 224 1118 1863
Warwick 6 283 472 2358 3931
TOTAL 12 438 730 3647 6079
10 Small scale hydroelectric generation potential in the UK, Vol3, Department of Energy, 1989
11Sheffield City Council Renewable Energy Scoping and Feasibility Studyhttp://www.sheffield.gov.uk/planning-and-city-development/planning-documents/background-reports/renewable-energy-study 12 http://www.small-hydro.com/
13 The National River Flow Archive http://www.ceh.ac.uk/data/nrfa/index.html
14 Renewable Energy UK: Calculation of Hydro Power http://www.reuk.co.uk/Calculation-of-Hydro-Power.htm
River Head Gravity
River Flow Installed Flow
Factor Hydro
Efficiency Factor

Hydro power background and guidance
Power has been generated from water for centuries, and there is theoretical potential for energy generation wherever there is water movement or difference in height between two bodies of water. The resource available depends upon the available head, i.e. the height through which the water falls (in metres) and flow rates, i.e. the volume of water passing per second (in m3/sec).
The figure below illustrates the concepts of head and flow graphically.
Figure5: Hydropower – Head and Flow (Source: British Hydropower Association – UK Mini Hydro Guide)
Power can be extracted by the conversion of water pressure into mechanical shaft power which, in turn, can drive a turbine to generate electricity. Power can also be extracted by allowing water to escape, for example, from a storage reservoir or dam through a pipe containing a turbine. The power available is in all cases proportional to the product of flow rate, head and the mechanical power produced by the turbine.
As for the efficiencies of hydro power schemes, these are generally in the range of 70 to over 90%. However, hydraulic efficiencies reduce with scheme size. Furthermore, schemes with a capacity of less than 100kW (micro-hydro) are generally 60 to 80% efficient.
There is a variation of different hydro energy site layout possibilities (e.g. canal and penstock; penstock only; mill leat; barrage), but, as illustrated by the figure below, a hydro energy scheme typically consists of the following components:
Figure6: Components of a hydro scheme (Source: British Hydropower Association – Guide to UK Mini-Hydro Developments)
The technology for realising the potential from hydro is well established in the UK. Most of the UK's hydropower comes from large hydro projects; these are defined as those greater than 10 MW. These days large hydro is generally discounted from consideration for new

construction due to the high environmental impact associated with constructing large dams and flooding valleys.
There are a number of benefits of hydro schemes (adapted from British Hydro Power Association (BHPA)), including:
• No direct CO2 emissions
• Small hydro schemes have a minimum visual impact on surrounding environment
• One of the most inexpensive ways to generate power
• Bigger hydro schemes can include a possibility to store energy (reservoir storage, pumped storage)
• Hydro schemes can have a useful life of over 50 years
• Hydro is the most efficient way of generating electricity, as between 70 and 90% of the energy available in the water can be converted
• Hydro schemes usually have a high capacity factor (typically > 50%)
• A high level of predictability (however, varying with annual rainfall patterns)
• Demand and output patterns correlate well, i.e. highest output is in winter
Technologies for sites with medium and high heads and flows are well established, however with some of the sites only having a low head, finding suitable technology entails having to rely on less established technologies, such as Archimedes Screw turbines or VHL turbine (which is a very low head Kaplan turbine). Generally, impulse turbines are used for high head schemes whereas reaction turbines are used for low head schemes.
In turning the technical resource of hydro energy into a practical target, the important issues to consider are:
• Getting support from the Environment Agency (EA) will be crucial to the development for hydro energy schemes in the district; the EA is responsible for aspects such as licensing e.g. the water abstraction or for ensuring that each site has a fish passage
• Securing the necessary funds (possibly through a community-owned fund) will be important for project developers
• Economics of hydro energy schemes are absolutely site-specific, critically depending on the topography, geology, and hydrology of each site, which in turn requires feasibility studies for each potential site; this is especially important since civil works can be significantly more expensive for low head hydro developments
• Possible local resistance needs to be addressed accordingly
• For mill conversions it is important to ensure that all required hydro energy equipment and potential civil works could be integrated into the existing mill structure.
• Land ownership and water rights can be complex and time-consuming issues to be resolved
• In view of the complexity of developing hydro schemes, long lead times are required, most of all for hydrological studies, environmental impact assessments and getting the required permissions (flood prevention, fishery rights)

Appendix XIV: Gas-fired Combined Heat and Power (CHP)
Gas fired combined heat and power (CHP) is a technology which uses natural gas to generate electricity in the same way that many of our power stations do, albeit on a much smaller scale. These ‘micro power stations’ do, however, offer a significant advantage in that the heat that is generated can be used by nearby consumers. By utilising the heat benefits, as well as the electricity generated, this technology offers significant carbon benefits.
CHP systems with a community heating network enable sizable carbon reductions in new developments. However, the viability and effectiveness of CHP is dependent on how much of the heat and electricity can be utilised. This tends to hinge on three factors:
1. Scale of development. As a rule of thumb, community heating systems require a
development of at least 300 dwellings, with improving economics as the scale of
development increases.
2. Density of development. The suitability of community heating increases with the
number of dwellings per hectare.
3. Mix of development. A good mix of residential, commercial and industrial
building types is beneficial. Residential peak energy demand is early morning
and evening. Commercial peaks tend to be during daytime hours. Adding the
building uses together helps to provide a more even energy demand, which suits
CHP.
The recent guide ‘Community Energy: Urban Planning for a Low Carbon Future’ produced by the Combined Heat and Power Association (CHPA) and Town and Country Planning Association (TCPA) provides a useful overview of the types of development that suit CHP and district heating and the range of issues that need to be considered in the development of CHP and district heating networks.
Biomass CHP is applied in this analysis in preference to gas CHP. This is due to the larger carbon savings available for the biomass option and that the current definition for the zero carbon homes15 would essentially require biomass CHP, where possible rather than gas-fired CHP.
15 Prior to publications of the government consultation of the definition of the ‘zero carbon’

Appendix XV: Results of acceleration net costs assessments
Test 1: Code 3 with 10% test (additional costs of the Merton only)
Site name
Flat (city
infill)
Flat
(market
town)
Flat
(urban
regenera
tion)
Mid terrace
(small
developmen
t)
Detached
(small
developme
nt)
Mid terrace
(market
town)
Detached
(market town)
Mid terrace
(urban
regeration)
Detached
(urban
regeration)
SHW + BPEE* 254£ 224£ 254£ 272£ 1,608£ 272£ 1,608£ 272£ 1,608£
PV + BPEE 492£ 492£ 492£ 862£ 1,906£ 862£ 1,906£ 862£ 1,906£
GSHP +BPEE* -£ 358£ -£ 272£ 115£ 272£ 115£ -£ -£
% Capital cost
SHW + BPEE* 0.3% 0.3% 0.3% 0.4% 1.7% 0.4% 1.7% 0.4% 1.7%
PV + BPEE 0.7% 0.7% 0.7% 1.3% 2.0% 1.3% 2.0% 1.3% 2.0%
GSHP +BPEE* 0.0% 0.5% 0.0% 0.4% 0.1% 0.4% 0.1% 0.0% 0.0%
Test 2: Code 4 with 20% test (additional cost of Merton only)
Site name
Flat (city
infill)
Flat
(market
town)
Flat
(urban
regenera
tion)
Mid terrace
(small
developmen
t)
Detached
(small
developme
nt)
Mid terrace
(market
town)
Detached
(market town)
Mid terrace
(urban
regeration)
Detached
(urban
regeration)
Gas CHP (80%) with BPEE* 1,462£ 567£ 298£ 1,936£ 3,139£ 756£ 1,148£ 232£ 551£
PV + BPEE 384£ 384£ 384£ 240£ 578£ 240£ 578£ 240£ 578£
PV + APEE 1,978£ 1,978£ 1,978£ 2,336£ 5,310£ 2,336£ 5,310£ 2,336£ 5,310£
SHW + APEE* 2,730£ 2,730£ 2,730£ 3,101£ 6,201£ 3,101£ 6,201£ 3,101£ 6,201£
Biomass heating (80%) + BPEE -£ -£ -£ -£ -£ -£ -£ -£ -£
Biomass heating (80%) + APEE -£ -£ -£ -£ -£ -£ -£ -£ -£
GSHP +APEE* 1,924£ 3,401£ 1,924£ 2,511£ 4,410£ 4,477£ 6,500£ 2,511£ 4,410£
% Capital cost
Gas CHP (80%) with BPEE* 2.0% 0.8% 0.4% 2.9% 3.3% 1.1% 1.2% 0.4% 0.6%
PV + BPEE 0.5% 0.5% 0.5% 0.4% 0.6% 0.4% 0.6% 0.4% 0.6%
PV + APEE 2.7% 2.7% 2.7% 3.5% 5.6% 3.5% 5.6% 3.5% 5.6%
SHW + APEE* 3.7% 3.7% 3.7% 4.7% 6.6% 4.7% 6.6% 4.7% 6.6%
Biomass heating (80%) + BPEE 0.0% 0.0% 0.0% 0.0% 0.0% 0.0% 0.0% 0.0% 0.0%
Biomass heating (80%) + APEE 0.0% 0.0% 0.0% 0.0% 0.0% 0.0% 0.0% 0.0% 0.0%
GSHP +APEE* 2.6% 4.6% 2.6% 3.8% 4.7% 6.8% 6.9% 3.8% 4.7%

Test 3: Code 3 with 10% vs Code 4 with 20%
Solution
Flat (city
infill)
Flat
(market
town)
Flat
(urban
regenerati
on)
Mid terrace
(small
developmen
t)
Detached
(small
developme
nt)
Mid terrace
(market
town)
Detached
(market
town)
Mid terrace
(urban
regeneration)
Detached
(urban
regeneration)
SHW + BPEE (CODE 3)* £ 3,579 £ 3,579 £ 3,579 £ 4,819 £ 6,692 £ 4,819 £ 6,692 £ 4,819 £ 6,692
PV + BPEE (CODE 3) £ 3,303 £ 3,303 £ 3,303 £ 5,118 £ 6,975 £ 5,118 £ 6,975 £ 5,118 £ 6,975
GSHP +BPEE (CODE 3)* £ 8,862 £ 8,001 £ 5,858 £ 9,388 £ 13,093 £ 9,388 £ 13,093 £ 7,255 £ 10,654
Gas CHP (80%) with BPEE (CODE 4)* £ - £ 4,324 £ 3,622 £ - £ 22,893 £ 5,749 £ 8,176 £ 4,758 £ 6,832
PV + BPEE (CODE 4) £ 4,905 £ 4,905 £ 4,905 £ 6,273 £ 8,809 £ 6,273 £ 8,809 £ 6,273 £ 8,809
PV + APEE (CODE 4) £ 9,787 £ 9,787 £ 9,787 £ 10,604 £ 16,439 £ 10,604 £ 16,439 £ 10,604 £ 16,439
SHW + APEE (CODE 4)* £ 10,846 £ 10,846 £ 10,846 £ 11,127 £ 17,638 £ 11,127 £ 17,638 £ 11,127 £ 17,638
Biomass heating (80%) + BPEE (CODE 4) £ 7,688 £ 4,550 £ 3,970 £ 10,718 £ 11,006 £ 5,847 £ 8,397 £ 5,221 £ 7,394
Biomass heating (80%) + APEE (CODE 4) £ 12,562 £ 9,426 £ 8,845 £ 14,320 £ 17,492 £ 9,449 £ 14,884 £ 8,824 £ 13,881
GSHP +APEE (CODE 4)* £ 15,399 £ - £ 12,497 £ 16,321 £ 26,282 £ 16,959 £ 25,608 £ 13,195 £ 21,273
Minimum Code 3 + 10% £ 3,303 £ 3,303 £ 3,303 £ 4,819 £ 6,692 £ 4,819 £ 6,692 £ 4,819 £ 6,692
Minimum Code 4 + 20% £ 4,905 £ 4,324 £ 3,622 £ 6,273 £ 8,809 £ 5,749 £ 8,176 £ 4,758 £ 6,832
Difference £ 1,603 £ 1,022 £ 320 £ 1,455 £ 2,117 £ 930 £ 1,485 -£ 61 £ 140
% Capex equivalent 2.2% 1.4% 0.4% 2.2% 2.2% 1.4% 1.6% -0.1% 0.1%
Maximum Code 3 + 10% £ 8,862 £ 8,001 £ 5,858 £ 9,388 £ 22,893 £ 9,388 £ 13,093 £ 7,255 £ 10,654
Maximum Code 4 + 20% £ 15,399 £ 10,846 £ 12,497 £ 16,321 £ 26,282 £ 16,959 £ 25,608 £ 13,195 £ 21,273
Difference £ 6,537 £ 2,845 £ 6,639 £ 6,933 £ 3,389 £ 7,571 £ 12,516 £ 5,940 £ 10,619
% Capex equivalent 8.9% 3.9% 9.0% 10.5% 3.6% 11.5% 13.3% 9.0% 11.3% Test 4: Code 4 with 20% vs zero carbon
Solution
Flat (city
infill)
Flat
(market
town)
Flat
(urban
regenerati
on)
Mid terrace
(small
developmen
t)
Detached
(small
developme
nt)
Mid terrace
(market
town)
Detached
(market town)
Mid terrace
(urban
regeration)
Detached
(urban
regeration)
Gas CHP (80%) with BPEE (CODE 4)* £ - £ 4,324 £ 3,622 £ - £ 22,893 £ 5,749 £ 8,176 £ 4,758 £ 6,832
PV + BPEE (CODE 4) £ 4,905 £ 4,905 £ 4,905 £ 6,273 £ 8,809 £ 6,273 £ 8,809 £ 6,273 £ 8,809
PV + APEE (CODE 4) £ 9,787 £ 9,787 £ 9,787 £ 10,604 £ 16,439 £ 10,604 £ 16,439 £ 10,604 £ 16,439
SHW + APEE (CODE 4)* £ 10,846 £ 10,846 £ 10,846 £ 11,127 £ 17,638 £ 11,127 £ 17,638 £ 11,127 £ 17,638
Biomass heating (80%) + BPEE (CODE 4) £ 7,688 £ 4,550 £ 3,970 £ 10,718 £ 11,006 £ 5,847 £ 8,397 £ 5,221 £ 7,394
Biomass heating (80%) + APEE (CODE 4) £ 12,562 £ 9,426 £ 8,845 £ 14,320 £ 17,492 £ 9,449 £ 14,884 £ 8,824 £ 13,881
GSHP +APEE (CODE 4)* £ 15,399 £ - £ 12,497 £ 16,321 £ 26,282 £ 16,959 £ 25,608 £ 13,195 £ 21,273
PV + BPEE (ZC) £ - £ - £ - £ 9,537 £ 13,366 £ 9,537 £ 13,366 £ 9,537 £ 13,366
PV + APEE (ZC) £ - £ - £ - £ 11,557 £ 16,346 £ 11,557 £ 16,346 £ 11,557 £ 16,346
GSHP + PV + BPEE (ZC) £ 13,457 £ - £ 10,651 £ 15,368 £ 22,028 £ 15,368 £ 22,028 £ 12,417 £ 18,451
Biomass heating (80%) + PV + BPEE (ZC) £ 9,249 £ 6,190 £ 5,624 £ 12,719 £ 13,283 £ 7,971 £ 10,740 £ 7,360 £ 9,763
Biomass heating (80%) + PV + APEE (ZC) £ 14,065 £ 11,006 £ 10,440 £ 16,293 £ 18,334 £ 11,544 £ 15,790 £ 10,934 £ 14,812
Biomass CHP (80%) + BPEE 9ZC) £ 7,827 £ 7,092 £ 6,723 £ - £ - £ 7,727 £ 11,900 £ 7,330 £ 11,264
Biomass CHP (80%) + APEE (ZC) £ 10,267 £ 9,633 £ 9,265 £ - £ - £ 9,710 £ 15,289 £ 9,313 £ 14,654
Gas CHP (80%)+ PV + BPEE (ZC) £ 9,027 £ 6,414 £ 5,744 £ 16,642 £ 25,128 £ 8,169 £ 11,582 £ 7,435 £ 10,417
Minimum Code 4 + 20% £ 4,905 £ 4,324 £ 3,622 £ 6,273 £ 8,809 £ 5,749 £ 8,176 £ 4,758 £ 6,832
Minimum zero carbon £ 7,827 £ 6,190 £ 5,624 £ 9,537 £ 13,283 £ 7,727 £ 10,740 £ 7,330 £ 9,763
Difference £ 2,922 £ 1,866 £ 2,002 £ 3,264 £ 4,475 £ 1,978 £ 2,564 £ 2,572 £ 2,931
% Capex equivalent 4.0% 2.5% 2.7% 5.0% 4.7% 3.0% 2.7% 3.9% 3.1%
Maximum Code 4 + 20% £ 15,399 £ 10,846 £ 12,497 £ 16,321 £ 26,282 £ 16,959 £ 25,608 £ 13,195 £ 21,273
Maximum zero carbon £ 14,065 £ 11,006 £ 10,651 £ 16,642 £ 25,128 £ 15,368 £ 22,028 £ 12,417 £ 18,451
Difference -£ 1,334 £ 160 -£ 1,845 £ 321 -£ 1,154 -£ 1,591 -£ 3,581 -£ 778 -£ 2,822
% Capex equivalent -1.8% 0.2% -2.5% 0.5% -1.2% -2.4% -3.8% -1.2% -3.0%
ENDS.

Camco Advisory Services Ltd
The Workstation, 15 Paternoster Row, Sheffield, South Yorkshire, S1 2BX
t +44 (0)114 225 7481 f +44 (0)114 225 7483