renewable energies in uruguay · • first plant installed in 2014: 486 kwp •3.4 mw of...
TRANSCRIPT

Uruguay 2015
Paula Cobas
Energy Policy Course
Tokio, 2015
IEEJ:August 2015
Content
• Uruguay: general facts • Energy Policy 2010 - 2030: guidelines, goals and
implementation
• Energy Supply and Demand
• Energy Outlook
• Challenges ahead
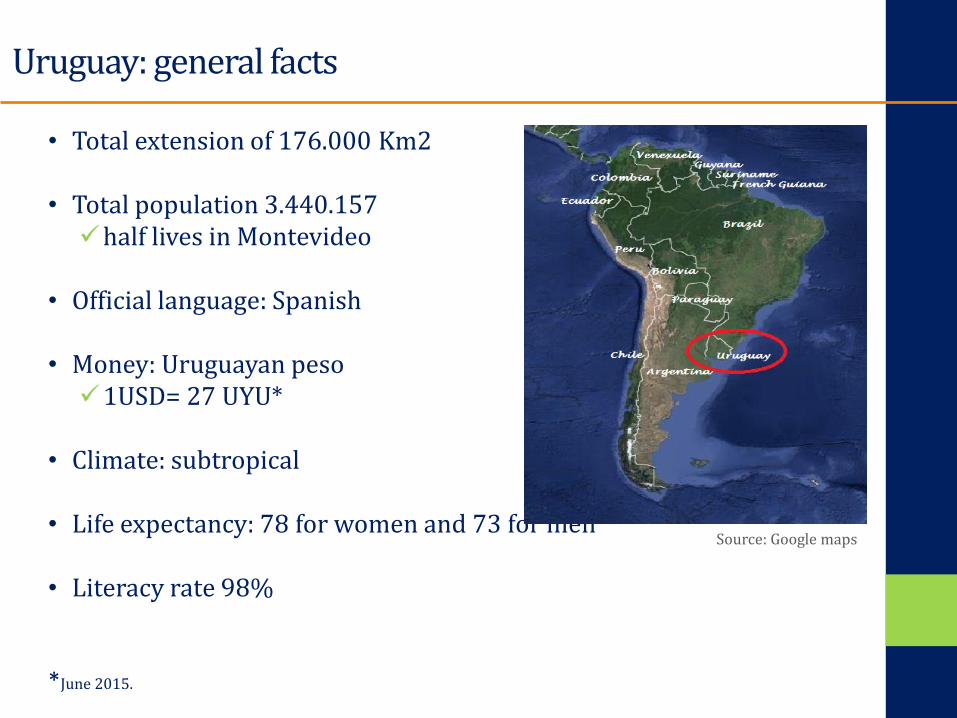
Uruguay: general facts
• Total extension of 176.000 Km2
• Total population 3.440.157 half lives in Montevideo
• Official language: Spanish
• Money: Uruguayan peso 1USD= 27 UYU*
• Climate: subtropical
• Life expectancy: 78 for women and 73 for men
• Literacy rate 98%
*June 2015.
Source: Google maps

Uruguayan economy
• Productive activities:
agriculture (soy and cereals)
cattle and related industries (meat and wool processing mainly)
forestry
dairy industry
tourism
4.2%
7.8%
5.2%
3.3%
5.1%
3.5%
2009 2010 2011 2012 2013 2014
GDP growth rate • GDP growth 3,5% in 2014 average 2004-2014: 5% GDP per capita 16.800 USD
• Unemployment: 6,5%
• Social indicators
access to electricity: 99% access to drinking water: 98%
Source: Central Bank of Uruguay

Energy background: oil and rain dependence
• Imports of oil in 2014:
1929 ktoe of oil and 615 ktoe of oil products
2054 million USD (18% of total imports)
• Oil imports varies with each year´s rainfall
41% 42% 38% 41% 41%
17% 15% 13%
17% 18%
23% 23% 23%
24% 26%
18% 19% 24%
18% 15% 1% 2%
2010 2011 2012 2013 2014
Structure of Uruguayan Imports
Other inputs Capital Consumption
Oil and oil products Electricity
• Not proven reserves of oil, natural gas or coal
• 4 Hydropower plants • Thermal generation: Imported fossil fuels : high vulnerability
Source: Central Bank of Uruguay
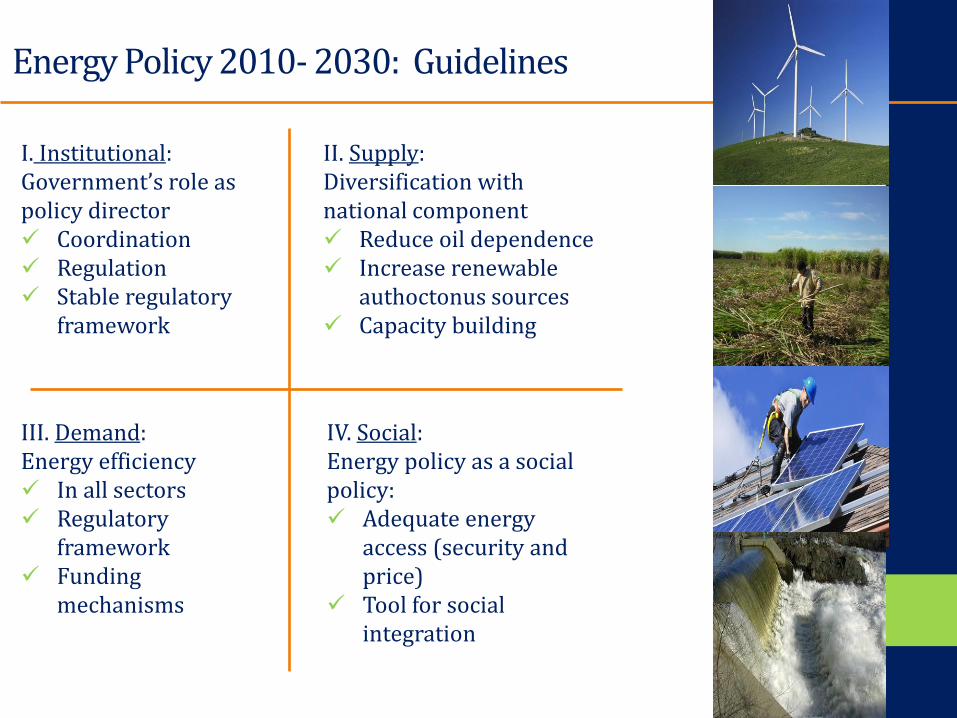
Energy Policy 2010- 2030: Guidelines
I. Institutional: Government’s role as policy director Coordination Regulation Stable regulatory
framework
II. Supply: Diversification with national component Reduce oil dependence Increase renewable
authoctonus sources Capacity building
III. Demand: Energy efficiency In all sectors Regulatory
framework Funding
mechanisms
IV. Social: Energy policy as a social policy: Adequate energy
access (security and price)
Tool for social integration
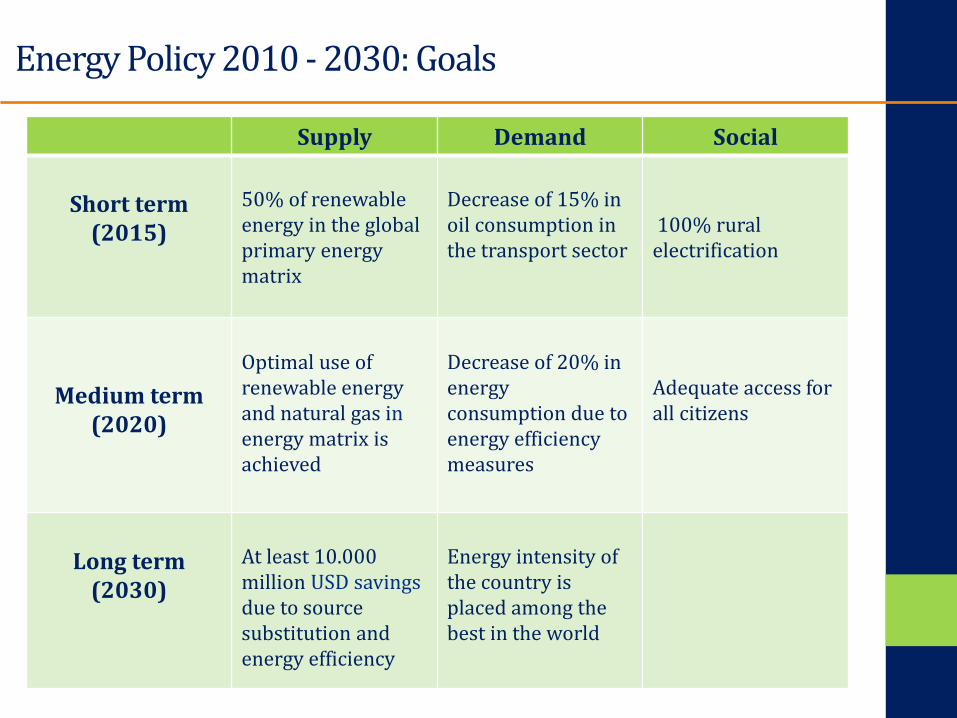
Energy Policy 2010 - 2030: Goals
Supply Demand Social
Short term (2015)
50% of renewable energy in the global primary energy matrix
Decrease of 15% in oil consumption in the transport sector
100% rural electrification
Medium term (2020)
Optimal use of renewable energy and natural gas in energy matrix is achieved
Decrease of 20% in energy consumption due to energy efficiency measures
Adequate access for all citizens
Long term (2030)
At least 10.000 million USD savings due to source substitution and energy efficiency
Energy intensity of the country is placed among the best in the world
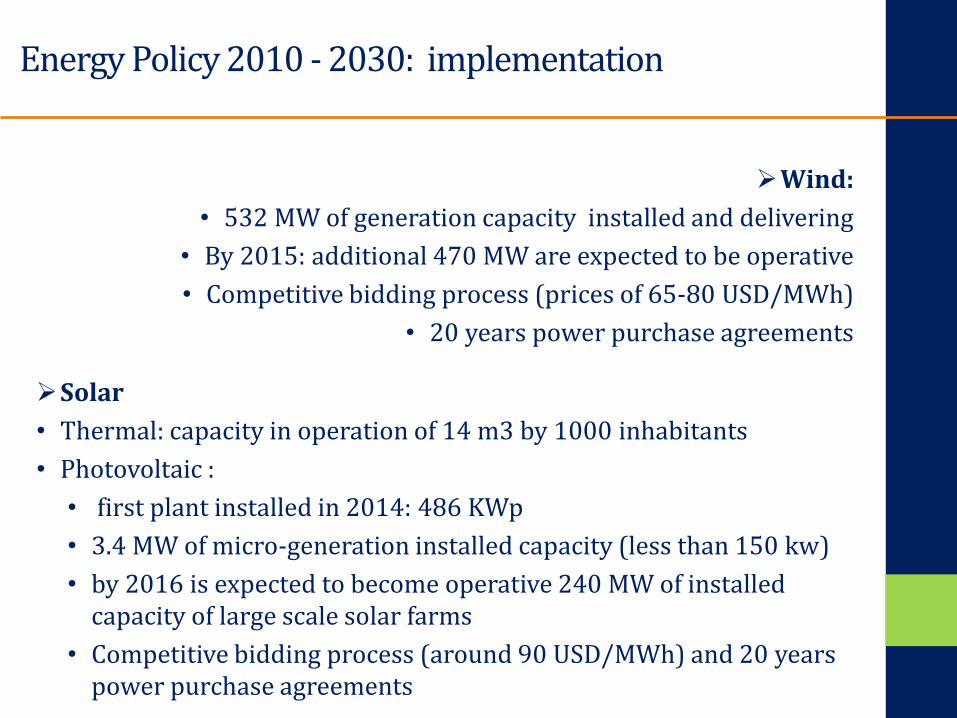
Energy Policy 2010 - 2030: implementation
Wind:
• 532 MW of generation capacity installed and delivering
• By 2015: additional 470 MW are expected to be operative
• Competitive bidding process (prices of 65-80 USD/MWh)
• 20 years power purchase agreements
Solar
• Thermal: capacity in operation of 14 m3 by 1000 inhabitants
• Photovoltaic :
• first plant installed in 2014: 486 KWp
• 3.4 MW of micro-generation installed capacity (less than 150 kw)
• by 2016 is expected to become operative 240 MW of installed capacity of large scale solar farms
• Competitive bidding process (around 90 USD/MWh) and 20 years power purchase agreements

Energy Policy 2010 - 2030: implementation
Biomass heat and power
• 33% participation in primary energy matrix (wood and forestry)
• 410 MW of installed power generation capacity by 2014
• 10 generation plants
• Feed-in-tariffs (around 110 USD/MW)
• 20 year period power purchase agreements
Biofuels
• Produced in Uruguay since 2010, mainly for transport use
• Installed capacity for ethanol is 95.000 ton/year from sugar cane
• Installed capacity for Biodiesel 90.000 ton/year, mainly from soy
• Currently
• 5% mix of ethanol in gasoline, and it is expected to increase to 10% by 2015,
• 7% mix of biodiesel in Gas Oil

Energy Policy 2010 - 2030: implementation
Energy Efficiency
• Energy efficiency law
• Tax incentives for hybrid and electric cars
• Incandescent Lighting Replacement: 2.3 million light bulbs
• Labelling program: water heaters, refrigerators and air conditioning systems
Hydrocarbons
• Exploration projects are being conducted since 2009,
both onshore and offshore
• Construction of a regasification plant is under development
• Terminal operative by 2016
• Storage capacity of 267.000 m3 of LNG
• Nominal send-out 10 Mm3/day

Energy Supply:
Electricity generation
• UTE: Natonal Utility Company
• State owned
• Monopoly of transmission and distribution
• Generation:
• 4 hydropower plants: 1538 MW
• Thermal (Fuel oil and gas): 1173 MW
• Renewable energy:
Private generators
532 MW wind
410 MW biomass
240 solar (under construction)
• International connexion: Argentina 2000 MW and Brazil 70 MW (under expansion to 500 MW)
Hydro; 49%
Wind; 2%
Biomass; 8%
Fossil 41%
Electricity matrix: installed capacity (2013)
Source: National Directorate of Energy

Energy Supply:
Hydrocarbons
• ANCAP: National Oil Company
• Monopoly of oil imports and production of oil products
• One refinery with capacity for 50.000 barrels per day
Oil products for electricity generation: imported
(large quantities required and technical characteristics)
Oil products for other uses (transport, industry, residential): refined domestically
• Since 2010, biofuels are being produced, and mixed with gasoline and gas oil, for transport use

Energy Demand:
Energy demand evolution
• Increasing trend
in line with GDP
• Last decade:
average annual
growth: 5.9%
• Expected growth
rate: 2.5%
• Elasticity electricity to
GDP of 0.8
0
2
4
6
8
10
12
0
100
200
300
400
500
600
700
GDP (1983 prices) final consumption Ratio consumption/GDP
GD
P in
dex
(1
98
3=1
00
) /
Ener
gy c
on
sum
pti
on
ind
ex
Energy /G
DP
ratop
Source: National Directorate of energy, Uruguay
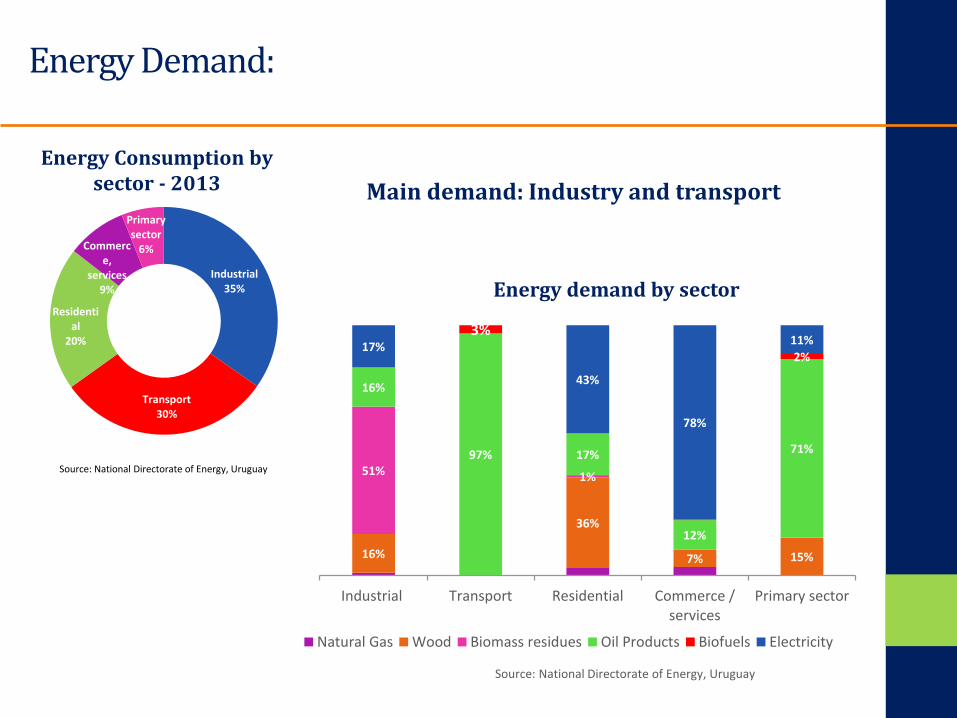
Energy Demand:
Source: National Directorate of Energy, Uruguay
16%
36%
7% 15%
51% 1%
16%
97% 17%
12%
71%
3%
2% 17%
43%
78%
11%
Industrial Transport Residential Commerce /services
Primary sector
Natural Gas Wood Biomass residues Oil Products Biofuels Electricity
Energy demand by sector Industrial
35%
Transport 30%
Residential
20%
Commerce,
services 9%
Primary sector
6%
Energy Consumption by sector - 2013
Source: National Directorate of Energy, Uruguay
Main demand: Industry and transport

Demand and Supply Outlook
• Supply
• Measures taken:
Diversification of power
generation
Currently over 90% of
power generation from
renewables
• Next steps:
Optimization of all sources,
including Natural Gas from storage
and regasification terminal
Scenario in case of confirming Hydrocarbons reserves?
17% 1% 3%
76%
82% 68%
6% 11%
17%
1% 6% 12%
2013 2014 2015
Fossil thermal Hydropower Biomass WindSource: National Directorate of Energy, Uruguay
Renewables in power mix

Demand and Supply Outlook
• Demand:
• Measures taken
Funding for households and firms to incorporate energyefficiency measures
Light bulbs replacing campaign
Labelling: water heaters, refrigerators
• Next steps:
• National Laboratories with capacity to verify and label home appliance andvehicles
• Demand management
price incentives
smart grids?

The main challenges ahead
• Transformation process aiming at diversification of energy supply: based on
incorporating significant capacity of intermittent sources such as wind and solar
• Need to be prepared: improving transmission and management
• Uruguay engaged in hydrocarbon exploration activities. In case of confirming hydrocarbons reserves in the country, issues need to be addressed:
• How exploitation is going to be carried out?
• How this new source of energy will be incorporated in the supply mix?
• What use should be given to potential economic profits?
• Measures for promoting energy efficiency have had low impact:
• Need to foster cultural change
Revising policy incentives
Educational campaigns
• Agricultural and Urban Solid Waste management: to produce biogas for heat and power
