renewable energy development in rural areas of uttar
TRANSCRIPT

Journal of Energy Systems
2021, 5 (2)
2602-2052 DOI: 10.30521/jes.816049 Review Article
92
Renewable energy development in rural areas of Uttar Pradesh:
Current status, technologies and CO2 mitigation analysis
Akanksha Sharma Amity University, Electrical & Electronics Engineering Department, India,
H.P Singh
Amity University, Electrical & Electronics Engineering Department, India, [email protected]
R.K Viral
Amity University, Electrical & Electronics Engineering Department, India, [email protected]
Naqui Anwer Teri School of Advanced Studies, New Delhi, India, [email protected]
Submitted: 26.10.2020
Accepted: 28.01.2021
Published: 30.06.2021
Abstract: The main factor having severe impact on lives of millions of people under the poverty line is energy
deficiency. For the improvement of living and standard of education, there is a need to electrify
the rural areas. India has an aim of achieving 175 GW of renewable energy capacity by 2022. The
use of Renewable Energy Technologies propounds huge benefits to rural areas. Over the past two
decades, rural electrification has been a continuous process, accelerated through various programs
and schemes. Uttar Pradesh state of India, located in the north central region of the country is the
most populous state. Energy demand is increasing steadily with the development of the state. With
respect to limited conventional energy sources and increasing environmental pollution, production
of energy based on renewable energy sources is given high priority. This paper presents the current
status of renewable energy in the state, renewable energy-based options for rural electrification
including the single technology-based systems, integrated and the hybrid energy systems
depending on availability of resources. The current scenario of power generation and requirement
is also discussed. A complete analysis of the current CO2 emission and the mitigation potential of
different RESs are presented. Based on this the cost saving potential is performed.
Keywords: CO2 emission, Renewable energy, Rural electrification
Cite this paper as:
Sharma, A., Singh, H.P., Viral, R.K., & Anwer N. Renewable energy development in rural areas of
Uttar Pradesh: Current status, technologies and CO2 mitigation analysis. Journal of Energy
Systems 2021, 5(2), 92-120, DOI: 10.30521/jes.816049
© 2021 Published by peer-reviewed open access scientific journal, JES at DergiPark (https://dergipark.org.tr/en/pub/jes)

Journal of Energy Systems
93
1. INTRODUCTION
Currently, the predominant part of the global population around the world is residing in the developing
nations which have a majority of rural un-electrified areas. The rural audiences or the customers have a
huge diversity in their economic and social status with differences in both households and rural
enterprise. These differences impact on both the demand for electricity and customer attitudes and
preferences towards the various available sources of generation [1]. With a generation of 1,497 TWh,
India is the third largest producer and third largest consumer of electricity in the world and has an
installed power capacity reaching 347.22 GW as of December 2018. The country also has the fifth
largest installed capacity in the world. India is the world's first country using LEDs for all lighting needs
by 2019, thereby saving Rs 40,000 crores on an annual basis [2]. The country has experienced a growth
of around 55.72 percent over the year FY18, with an electricity production of 1,201.543 BU which has
reached to around 849.20 BU till now in FY19 [3]. In India, Wind energy is the largest source of
renewable energy which accounts for around 35.14 GW of the total installed renewable capacity of
74.08 GW. Solar energy is the second largest source which accounts for 25.21 GW of the total installed
capacity which is targeted to increase at around 100 GW by 2022 [4]. In August 2015, Indian
Government launched the Deen Dayal Upadhayaya Gram Jyoti Yojana (DDUGJY) in order to achieve
100% electrification in villages in 1000 days. India achieved the 100 % electrification of the households
in 25 states by December 2018 [5]. Only 10.48 lakh households were left to be electrified in 4 states of
Assam, Rajasthan, Meghalaya and Chhattisgarh which were also electrified by April 2018, when
Government declared every village in India as electrified but this means that at least 10% of households
in every village were connected to the grid [5]. The electrification of different regions of India through
the conventional and RESs is shown in Fig. 1 [6] and the electrification of different states of northern
region is shown in Fig. 2 [6].
Figure 1. All installed capacity (MW) in different regions of all country as on 31.07.2019 [6].

Journal of Energy Systems
94
Figure 2. Installed capacity (MW) of northern region as on 31.07.2019 [6].
The Uttar Pradesh state of India is located in north central region of the country with a population of
approximately 19.98 crores counted as the most populated state of India [7]. The state is divided into 75
districts and Lucknow is the capital. It also has good connectivity through 48 national highways, 6
airports & rail links to all the major cities [8]. The geopolitical representation of Uttar Pradesh state is
shown in Fig. 3.
In April 1983, government of Uttar Pradesh constituted Non- Conventional Energy Development
Agency (NEDA) under the department of additional energy sources as an autonomous institution. The
institute has been renamed as "Uttar Pradesh new and renewable energy development agency
(UPNEDA)" [9]. Thermal Power contributed 18,642.21 MW to the state’s total installed power
generation capacity, followed by contribution of 3,368.63 MW by Hydropower, 289.48 MW by nuclear
power and3027.00MW are only the renewable powers [10]. The 24x7 power for all program is a joint
initiative of the Government of India (GoI) and state governments, with the objective to provide 24x7
power to households, industry, commercial, and other consuming entities, and adequate power to the
agricultural sector by 2019 [11]. The rise in the power capacity of the state through various years is
shown in Fig. 4 [10].
As per the Census 2011, there are 77.37 % of rural households in the state, out of which 76.23% are un-
electrified [12]. In Uttar Pradesh state, according to the power for all reports, there are 2.89 crore rural
households. Of these, 0.92 crore rural households already exist in distribution company’s records and
there are around 1.12 crore un-electrified households in the state [10].
To support planning for on-ground electricity access improvement in the state of Uttar Pradesh, the
Council on Energy, Environment and Water (CEEW) presented certain findings and recommendations
based on a household survey on energy access (referred to as ACCESS) conducted in collaboration with
Columbia University in 2015. In Uttar Pradesh, at least five districts of the state – Azamgarh, Bijnour,
Gorakhpur, Jhansi and Sultanpur – over 90 per cent of un-electrified households reside in electrified
habitations [13]. Since the launch of Saubhagya Yojana, 74.4 Lakh willing households have been
electrified and the state government has declared saturation of all 75 districts. According to the revised
definition in the Electricity Act - 2003, a village is said to be electrified, if the public places like schools,
Panchayat offices, health centers and 10 percent of the total households are connected to the grid i.e., it
needs only one out of 10 households to have electricity supply for a village to be considered “electrified”
[14]. District wise list of number of electrified households in Uttar Pradesh state as on January 2019 is
given in Table 1 in Appendix 1 [15].

Journal of Energy Systems
95
Figure 3. Geo-political representation of Uttar Pradesh state.

Journal of Energy Systems
96
Figure 4. Year wise total installed power capacity growth in Uttar Pradesh state [10].
The main idea of this study lies in the fact to provide the complete information about the electrification
of the Uttar Pradesh state. The main motivation behind this study is having complete knowledge about
the electrification status of a state in a single article including all the recent data and information. In this
paper, various strategies based on renewable energy are discussed for the electrification in Uttar Pradesh
state. An approach has been rooted for the rural electrification of the state. A complete analysis of the
current carbon dioxide (CO2) emission in the state has been presented and possible CO2 mitigation
potential along with the cost saving potential of various RESs available in the state has also been
analyzed. Certain limitations and obstacles are also been presented that drift the RESs usage in the rural
areas and also the possible solutions and recommendations to overcome these limitations.
2. RENEWABLE ENERGY: PAST GROWTH, STATUS AND CURRENT PRACTICES IN
UTTAR PRADESH
According to the Load Generation Balancing Report (LGBR) - 2018 by the Central Electricity Authority
(CEA), the current status shows that Uttar Pradesh is on a borderline of meeting its electricity needs on
account of annual basis. It has also been warned in the report that the state could face a shortage of about
17.5% during the current financial year [16]. The report also says that in order to meet the required
energy need, the state may arrange it from other surplus energy states. The peak demand of the state
may reach up to 21,000 MW with a shortfall of 3,650 MW about 17.4% [16].
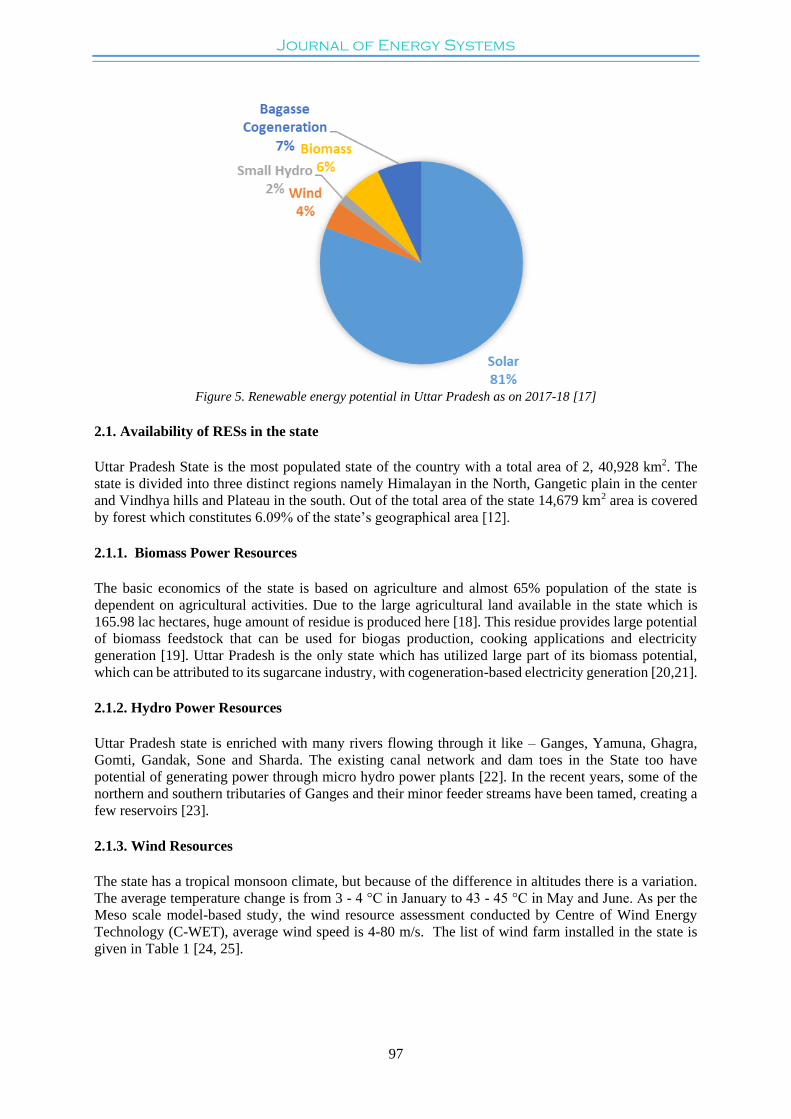
The state has a tremendous potential of increasing its biomass energy production in 97,589 villages and
also is the largest producer of sugarcane and second largest producer of rice in India, the by-product
bagasse and rice husk form abundant raw material base for power production [17]. The total amount
provided as Central financial assistance (CFA) to the state for the promotion of various renewable
energy schemes during 2018-2019 is 3432.21 lacs. The total renewable energy potential is shown in Fig.
5 [17].
Journal of Energy Systems
97
Figure 5. Renewable energy potential in Uttar Pradesh as on 2017-18 [17]
2.1. Availability of RESs in the state
Uttar Pradesh State is the most populated state of the country with a total area of 2, 40,928 km2. The
state is divided into three distinct regions namely Himalayan in the North, Gangetic plain in the center
and Vindhya hills and Plateau in the south. Out of the total area of the state 14,679 km2 area is covered
by forest which constitutes 6.09% of the state’s geographical area [12].
2.1.1. Biomass Power Resources
The basic economics of the state is based on agriculture and almost 65% population of the state is
dependent on agricultural activities. Due to the large agricultural land available in the state which is
165.98 lac hectares, huge amount of residue is produced here [18]. This residue provides large potential
of biomass feedstock that can be used for biogas production, cooking applications and electricity
generation [19]. Uttar Pradesh is the only state which has utilized large part of its biomass potential,
which can be attributed to its sugarcane industry, with cogeneration-based electricity generation [20,21].
2.1.2. Hydro Power Resources
Uttar Pradesh state is enriched with many rivers flowing through it like – Ganges, Yamuna, Ghagra,
Gomti, Gandak, Sone and Sharda. The existing canal network and dam toes in the State too have
potential of generating power through micro hydro power plants [22]. In the recent years, some of the
northern and southern tributaries of Ganges and their minor feeder streams have been tamed, creating a
few reservoirs [23].
2.1.3. Wind Resources
The state has a tropical monsoon climate, but because of the difference in altitudes there is a variation.
The average temperature change is from 3 - 4 °C in January to 43 - 45 °C in May and June. As per the
Meso scale model-based study, the wind resource assessment conducted by Centre of Wind Energy
Technology (C-WET), average wind speed is 4-80 m/s. The list of wind farm installed in the state is
given in Table 1 [24, 25].

Journal of Energy Systems
98
Table 1. List of wind farm installed in Uttar Pradesh [24, 25].
S. No Wind farm with District Site Name
1
50m
Lalitpur Pipariya Jagir Bl. Birdha
2 Mirzapur Domndganj Bl.Haliya
3 Raibarelly Indraj/Khirnahee Bl.Bachrawan
4 Farukhabad NaglaKail Bl.Nawabganj
5 Agra Patsal-Rasolpur Bl. Fatehpursikri
6 Etawah Kusauli-Khera Bl. Basrahar
7 Badaun Gharhihardopatti Bl. Kadarchowk
8 Jhansi Khatibaba Mandir Bl. Rajpur
9 Sonbhadra Vill. Gharaaura Bl. Robertsganj
1
80m
Gonda Ahiwaranpurwa
2 Balrampur Nageshwarjoth
3 Siddharthnagar Choukonia
4 Shahjahanpur Bijouria
5 Lakhimpur Lakshmanpur
2.1.4. Solar Resources
According to the reports of the solar policy 2017, Uttar Pradesh has a solar energy potential of 22300
MW capacity and the state aspires to meet the energy requirements of the State and to achieve the solar
power generation target, fixed by the ministry of new and renewable energy (MNRE), Government of
India of 10700 MW [26]. The annual average solar radiation for the state is about 4.27 kWh/m2/day
[26]. According to the reports by the Centre for Environment and Energy Development (CEED), six
cities in Uttar Pradesh state alone can generate 11.4 GW of solar energy using 11 % of their built-up
area. Among these cities, Lucknow (3187 MW) has the maximum potential, followed by Kanpur (3010
MW) and Agra (1986 MW), whereas Gorakhpur (833 MW) has the lowest solar rooftop potential,
followed by Allahabad and Meerut with 1577 MW and 900 MW, respectively [27,28].
2.2. Renewable Energy Exploitation in the State
In spite of a prodigious amount of RESs available to fulfill the electricity needs of the urban and rural
area, the main problem arises in channeling these resources which can have its own advantages along
with few disadvantages [30-32]. There seems to be negligible CO2 emissions during the use of biomass
and biogas-based system, the CO2 emissions for the biomass gasifier-based system are 0.273 kg for
1kWh electricity and for the biogas digester-based system is 0.305 kg for 1 kWh of electricity generation
[33]. Wind system requires around 267.7m2 area of land and the biogas system require around 144m2
area of land for the installation of plant of 1KW. The monthly average solar radiation in the state varies
from 3.27kWh/m2/day in December to 7.01kWh/m2/day in May [27]. Based on the various technical
aspects e.g., fuel used, size/ module (KW), electrical efficiency, overall efficiency, peak shaving,
reliability, power quality and economical aspects e.g., installed cost ($/ kW), total maintenance cost ($/
KW), the various RES technologies are compared and summarized in Table 3 given in Appendix 2 [27,
33-34] illustrating major merits & demerits of each RES technology available in the state.
3. MAJOR THRUST SECTOR (S) OF STATE: RELY UPON ENERGY
3.1. Electricity Generation in the state
The total installed power capacity in India as on April 2019 is 356,100 MW out of which Uttar Pradesh
has an installed capacity of 25,130.02 MW. The source wise installed capacity in the state is shown in
Fig. 6.

Journal of Energy Systems
99
Figure 6. Source wise electricity Generation in Uttar Pradesh [35].
3.2. Transportation
Uttar Pradesh being the country’s largest consumer base, the market of Electric Vehicles (EVs) is set to
boom in this state. The state has the country’s fourth largest economy and is among the top 5
manufacturing state with the highest number of Ministry of Micro, Small and Medium enterprises
(MSME) units with strong hold in the automobile industry [36].
The state is also known as the State of Expressways, the existing Yamuna and Agra-Lucknow
Expressway connect the NCR to the State capital. Poorvanchal Expressway and Bundelkhand. State
ranks third in number of vehicles registered in India, sharing 10.3% of total vehicles registered in India
[36]. The capital of the state - Lucknow is one of the 10-cities which are been identified for pilot project
of Multi-Modal Electric Public Transport under the Faster Adoption and Manufacturing of (Hybrid) and
Electric Vehicles (FAME) India Scheme of GoI [37].
3.3. Industry
Uttar Pradesh state has a great access to robust industrial infrastructure having about 15 industrial areas,
12 specialized parks, 4 growth centers & Industrial Infrastructure Development Centers (IIDC). The
state has also proposed 40 IT parks, 2 biotech zones and a knowledge park [38].
Bagasse based Co-Generation Projects in Sugar Mills: UPNEDA started its efforts in 1994 as a
catalyst/facilitator to set up power generation projects based on co-generation through bagasse available
in the various sugar mills of Uttar Pradesh [39].
Adani Green Energy Private Ltd.: It is one of the largest renewable companies in India, with a current
project portfolio of 5,290 MW. The company has commissioned solar power plant of capacity 50 MW
in Mahoba and Jhansi district of Uttar Pradesh, under the National Solar Mission Scheme [40].

Journal of Energy Systems
100
Figure 7. Classification of alternative options for rural electrification.
3.4. Residential and Commercial Buildings
The U.S. Green Building Council (USGBC) released the list of India’s Top 10 States for LEED
(Leadership in Energy and Environmental Design), the world’s most widely used green building rating
system and Uttar Pradesh is one of them. The state has 82 LEED- certified projects with around 4, 57,
34497 million Certified Gross Square Footage [41].
The list of Green Building projects in the state is shown in Table 2.
Table 2. Green Buildings in the state [42].
Project Name Location IGBC LEED Rating
CESE (Centre for Environmental Sciences and Engineering) Building Kanpur NA
Patni Knowledge Centre Noida LEED Gold
Fast Track Building 1 & 2 Noida LEED Gold
Spectral Services Offices Noida LEED Gold
4. BEST PRACTICES AND VARIOUS TECHNOLOGY OPTIONS AVAILABLE
Grid Extension is the main driver of rural electrification in the state and off-grid solar power is a potential
alternative to grid extension in rural electrification. Most of the rural areas in the state are completely
off-grid and for those which are connected also the electricity is erratic and unreliable causing frequent
blackouts.
Rural electrification program in India mainly focuses on the extension of the grid structure for the supply
of 6 to 8 hours of electricity for a village, whereas, the areas where this is not feasible, use of small
distributed generators and networks are used in form of mini grid [43]. Selecting the most appropriate
technology for a particular context depends on what characteristics are needed and best suited for the
particular environment [44,45]. Looking at the diversity of rural villages and households in India,
selecting an appropriate rural electrification technology depends on the specific characteristics of the
village in consideration [46]. The classification of alternate option for rural electrification are shown in
Fig. 7 and discussed in next subsection.

Journal of Energy Systems
101
4.1. Single Source Renewable Energy System
The best option for the electrification of standalone rural remote households is the single renewable
energy system. These sources include solar photovoltaic, hydro, biomass, biogas, wind etc. The detailed
elaboration of each source used for electrification is given below:
4.2. Solar Home Systems (SHSs)
The world’s largest energy source is sunlight and can be easily accessed with the use of different
technologies that evolve today. India is a tropical country and so there is plenty of sunshine all around
the country. The power generated by the SPV systems can also be stored in batteries and can be used
later after sunset, for different applications. The basic model of a SPV system is shown in Fig. 8 [47].
Solar ModuleCharge
ControllerBattery Inverter
DC Loads AC Loads
Solar Radiation
Figure 8. Typical SPV systems and components [47].
4.2.1. Solar standalone home lightning systems
Standalone photovoltaic systems which are often referred as the “Solar home systems (SHS)” are an
effective mode for supplying power to the remote households which are not connected to the grid. This
system is used to meet the basic energy demand of a household and globally, it has provided power to
thousands of households in remote locations [47]. The major benefits and contribution of SHS in the
standard of living are: Reduction of indoor air pollution and therefore, improvement in the health due to
the replacement of kerosene lamps.
4.2.2. Solar Rooftop Systems
Millions of homes and commercial buildings in India have rooftops that receive a huge amount of
sunlight. The process can be achieved by adding an inverter which converts the DC power generated by
the solar panels placed on the rooftop to AC power [48].
4.2.3. Solar powered agriculture water pump for rural areas
Solar powered agricultural water pumps along with appropriate technologies and the conservation of
water at the local level has a high potential in India and has drawn considerable amount of attention.
The farmers or the operators can benefit from the maximum amount of pump during the day. The solar
pump drive is independent from the grid and produces no pollution or noise [48]. The basic structure of
a solar water pumping system is shown in Fig. 9.

Journal of Energy Systems
102
Figure 9. Solar water pumping system [48].
4.2.4. Solar Lantern
Solar lantern is an application of SPV technology, which has found good acceptance in rural regions
where the power supply is irregular and scarce. It is made of three main components - the solar PV
panel, the storage battery and the lamp. The solar energy is converted to electrical energy by the SPV
panel and stored in a sealed maintenance-free battery for later use during the night hours. A single charge
can operate the lamp for about 4-5 hours [49].
Figure 10. Capacity and status of various solar technology applications in Uttar Pradesh [54].
4.2.5. Solar Cooker
Solar cooker is a device which uses the energy of direct sunlight to heat, cook or pasteurize drink and
other food materials. Because they use no fuel and cost to operate, many nonprofit organizations are
promoting their use worldwide in order to help reduce fuel costs and air pollution, and to slow down the
deforestation and desertification caused by gathering firewood for cooking [50].
4.2.6. Solar Street Lightning
Solar street lights are raised light sources which are powered by solar panels generally mounted on the
lighting structure or integrated into the pole itself. The solar panels charge a rechargeable battery, which

Journal of Energy Systems
103
powers a fluorescent or LED lamp during the night. Most solar lights turn on and off automatically by
sensing outdoor light using solar panel voltage. Solar streetlights are designed to work throughout the
night. Solar lights installed in windy regions are generally equipped with flat panels to better cope with
the winds [51 - 53]. The status of different technologies based on solar energy is mentioned in Fig. 10
[54].
4.3. Biomass Gasification
Biomass is a very important source of energy in India due to the benefits it offers like- its renewable
nature, wide availability, carbon- neutral and also it has the potential to provide employment to the rural
areas. Biomass power generation in the country generates more than 5000 million units of electricity
and yearly employment of more than 10 million man-days in the rural areas [55]. Off-grid power
capacity from biomass gasifier in three rice mills and other industries including flour mill for meeting
captive demand of electricity and thermal applications have been installed in the state of Uttar Pradesh
[55]. The total biomass potential of the state is and its types are shown in Fig. 11[18]. The basic
schematic process of biomass gasifier-based system in shown in Fig. 12 [56].
Figure 11. Total biomass potential in Uttar Pradesh [18].
Figure 12. Schematic process of a biomass gasifier-based system [56].

Journal of Energy Systems
104
4.4. Biogas System
Biogas production is a process of converting organic wastes into an organic fertilizer source and a clean
renewable biogas having low carbon emission. Biogas is obtained by anaerobic digestion of cattle dung
and other loose and leafy organic wastes, further used as an energy source for cooking, lighting and
other applications [57]. In a study, the potentiality of biogas production from municipal waste and
agricultural residues in a city territory of Dhaka namely Hazaribagh is shown where the potential sources
include wastes from two markets, six slaughterhouses, domestic wastes, one poultry farm and three
croplands [58].
4.5. Hydro Power (Small Hydro < 25MW)
Hydropower uses the Earth’s water cycle and kinetic energy of this water to generate the electricity and
therefore is an old and renowned RES. Water is evaporated from the Earth’s surface and clouds are
formed which precipitates back to the Earth and then flow towards the ocean [59]. There is an estimated
hydro power potential of 568 MW and from which the small hydro comprises of 167 MW capacity
which is being identified at 60 locations in the state [60, 61]. The numbers and the aggregate capacity
of SHPs up to 25 MW in the state are shown in the Fig. 13 [54]. For the rural electrification of remote
areas, micro hydro is a very good option as these isolated micro hydro plants are easy to setup and of
minimal cost for the supply of electricity [62].
Figure 13. Numbers and cumulative capacity of SHP in the state [54].
4.6. Wind Power
The total wind power generation capacity in India as on 31 March 2019 was 36.625 GW, which is fourth
largest, installed wind power capacity in the world. The various causes of wind are uneven heating of
atmosphere by the sun, variations in earth's surface and the rotation of the earth. Mountains, bodies of
water, and vegetation all influence due to wind flow patterns [63]. A typical block diagram of such
system is shown in Fig. 14 [63].

Journal of Energy Systems
105
Figure 14. Block diagram of small-scale wind turbine system [63].
4.7. Hybrid Renewable Energy System (HRES)
Mostly, for the areas which are not having suitable or sufficient amount of RESs, hybrid energy systems
(HESs) are best suited option. They are a peerless solution for the continuous supply of the load and for
a reliable operation to the areas where grid extension is not possible and the electricity is not available.
An extensive research has already been carried on HESs based on SPV regarding their performance and
output planning issues. Agarwal et al. [64] has presented a grid independent PV-Diesel based HES for
unelectrified villages of Moradabad district in Uttar Pradesh state. A simple PV-Diesel hybrid system is
shown in Fig. 15. Habib et al., [65] presented an optimization method of a PV–wind HES which is used
to satisfy the electricity requirements for a given load. Rajkumar et al., [66] presented a techno-
economical optimization of hybrid PV–wind–battery system with the use of Adaptive Neuro-Fuzzy
Inference system (ANFIS).
Figure 15. PV-Diesel based hybrid energy system [64].
4.8. Integrated Renewable Energy System (IRES)
For the electrification of isolated remote rural areas, the single technology-based systems are the best
suited option, but due to the intermittent nature of some RES may not be available in some seasons.
Also, these resources are site specific [67]. So, when the demand is increased, these single technology
systems experience high cost and low reliability. To reduce this problem, the best option is the IRES
[68]. An integrated wind, solar and micro hydro based renewable energy system is represented in Fig.16
[69]. Various planning studies on IRES have been proposed by various researchers for electrification of
remote areas [70–71].

Journal of Energy Systems
106
Figure 16. A wind-solar-micro hydro based IRES [69].
5. REGULATORY FRAMEWORK TO PROMOTE RENEWABLE RESOURCES: POLICIES,
PROGRAMS, GOVERNMENT BODIES FUNCTIONS AND STATUS IN THE STATE
The energy demand in the state has been increasing rapidly along with the development of the state. Due
to the limited conventional sources of energy and increasing environmental pollution, renewable energy
sources are being given high priority and promotion. A general Framework of the different policies and
programs in the state is shown in Fig. 17.
Figure 17. Framework for Sustainable Environment in Uttar Pradesh.
Journal of Energy Systems
107
5.1. Regulating Agencies / Government Bodies / Policies
5.1.1. UPNEDA
With the increasing development of the state, energy demand has been increasing steadily. Due to the
limited conventional energy sources and increasing pollution, emphasis has been done in promoting
RESs. UPNEDA has been functioning since 1983, as a nodal agency for the implementation of various
schemes promoting the RES development in the state [9]. The basic objectives of this agency are:
Formulation and implementation of projects, standardize the designs of renewable energy systems and
provide consultancy services and a technical knowhow to the users, promoters and manufacturers of
various systems and devices of RESs and energy conservation.
5.1.2. Uttar Pradesh Solar Energy Policy 2017
The State has a solar energy potential of about 22300 MW capacities, which it intends to harness to meet
the energy requirements of the state to achieve the solar power generation target which is fixed by
MNRE, GoI of 10700 MW [72,73]. The basic objectives of this policy are: Providing environment
friendly and power for all. Promotion of research & development skill development and innovation.
5.1.3. Mini Grid Policy
This policy was implemented by UPNEDA in 2016 to provide electricity to remote areas of the state
and provide them with the basic necessities of electrification [74]. The basic objectives of this policy
are: Promoting the decentralized generation of clean & green power by harnessing renewable energy.
Providing an ensured power supply to nearly 02 crore households in the State to meet the minimum
household needs of power.
5.1.4. Policy Framework for State
The Electricity Act 2003 mandates the State Electricity Regulatory Commission (SERC) to set the tariffs
for renewable energy as well as to issue regulations pertaining to RPO, and set the charges for wheeling,
transmission and distribution of electricity. The National Tariff Policy (NTP) 2006 requires the SERCs
to fix a minimum percentage of RPO from such sources taking into account availability of such resources
in the region and its impact on retail tariffs and procurement by distribution companies at preferential
tariffs determined by the SERCs [75].
5.2. Different Program implemented in State
5.2.1. Solar City Program
The solar city program was implemented by the MNRE, GoI in some cities of the country for the
reduction of about 10% power consumption with the use of RESs. The main objectives of this program
are the empowerment of urban local bodies for facing the energy challenges, assessing the current energy
situation and spreading awareness about energy among all sections of society. Major cities like - Agra,
Moradabad and Allahabad are being identified as the solar cities and besides this Solar City program,
GoI is also implementing a Green Campus Scheme for specific urban areas with a population of up to 5
lacs [76].
5.2.2. Smart City Program
The Smart Cities Mission (SCM) is a holistic city programme to build 100 cities in India. The objective
of this mission is to promote cities that provide core infrastructure and give a decent quality of life to its

Journal of Energy Systems
108
citizens, a clean and sustainable environment or to provide better basic facilities to the citizens of the
country. Agra, Allahabad, Aligarh, Bareilly, Jhansi, Kanpur, Lucknow, Moradabad, Rampur,
Saharanpur and Varanasi are among the selected cities for this program [77].
5.2.3. National Biogas Fertilizer Management Program
This programme was introduced by UPNEDA for the installation of biogas plants of family size of about
2-6 cubic meters efficiency. This one biogas plant could be used for cooking food for around 5 persons
in morning and evening and also lightening of 4 to 5 hours a day with 1 lamp. The plant can also provide
an equivalent energy of around 18 LPG cylinders per year [78,79].
5.2.5. Energy Efficiency and Energy Saving Development Program
Energy saving and Energy Efficiency are an important measure in favour of clean energy. Demand Side
Management (DSM) and Energy Efficiency measures in the state in various sectors like – buildings,
domestic, industries, agriculture, municipalities etc., a significant amount of electricity is saved.
According to the reports of the National Productivity Council, a scope of 13% to 15% reduction in
electricity usage through demand side measures is there which translates into 15,000 MU of annual
energy savings and in turn results in reduction of around 1,500 MW of avoidable capacity in Uttar
Pradesh [11].
6. CO2 MITIGATION POTENTIAL ASSESSMENT AND ANALYSIS OF RESS IN UTTAR
PRADESH STATE
In India, the increasing degradation of the environment is due to various factors like the rapid growth in
population, poverty, urbanization, industrialization and various other related factors. The main
environmental problems in the country are basically related to the air and water pollution mostly in the
metro cities and in industrial areas. The various technologies related to RESs have been discussed in
previous sections and according to that now the available resources are used to analyze the CO2 emission
and the methods to reduce them.
The Indian Government has agreed to reduce the emissions intensity of its gross domestic product (GDP)
by an amount of 20–25 percent from 2005 levels by 2020. The Clean Development Mechanism (CDM)
under the Kyoto Protocol to United Nations Framework Convention on Climate Change (UNFCCC)
provides an opportunity for the Indian power sector to earn revenue through the reduction of GHG,
particularly CO2 [80]. CEA accordingly took up to compile a database for all grid-connected power
stations in India. The purpose of the database is to establish authentic and consistent quantification of
the CO2 emission baseline, which can be readily used by CDM project developers in the Indian power
sector [80].
In this section, the CO2 mitigation potential for Uttar Pradesh state has been calculated based on the
emission factors described by the CEA database for CDM, CO2 emission reduction based on RES and
the estimated cost saving which can be achieved. This potential has been calculated based on the
different emission factors approved by the CDM executive board.
6.1. Emission Factors used for Analysis
In Indian context, there are four basic estimation factors [80]:
Weighted Average: This factor describes the average CO2 emitted per unit of electricity generated in
the grid. It is calculated by dividing the absolute CO2 emissions of all power stations by the total net
generation.

Journal of Energy Systems
109
Simple Operating Margin: The operating margin describes the average CO2 intensity of the existing
stations in the grid which are most likely to reduce their output if a CDM project supplies electricity to
the grid.
Build Margin: The build margin is used to reflect the average CO2 intensity of the newly built power
stations that replaced by a CDM project.
Combined Margin: The combined margin is a weighted average of the simple operating margin and
the build margin.
6.2. Data Extraction and Assessment
The Annual Data of the database provides the net generation of the station in GWh, the absolute carbon
dioxide emissions in metric tonnes, and the specific carbon dioxide emissions in tCO2/MWh. CEA has
compiled the CO2 Database depending upon the generation, fuel consumption and fuel gross calorific
value (GCV) data.
Assumptions at Station Level: For the hydro stations, only the gross generation is available, but not the
net generation data. Therefore, the CEA standard value for auxiliary power consumption in hydro units
(0.5%) is applied to derive the net generation from the gross generation data reported by the stations
[80]. Assumptions at Unit Level: For some of the stations, the gross generation data is not available at
unit level. Therefore, the plant load factor of the respective station is used to derive the gross generation
of the units.
In case the fuel consumption and the GCV are not reported at unit level by thermal stations, the specific
CO2 emissions of the units coming in the build margin could usually be assumed to be equal to the
values of the respective station [80]. Mathematical Model: CO2 emissions of the thermal stations of the
state were calculated using the formula below [80]:
𝐶𝑂2 𝑠𝑡𝑎𝑡𝑖𝑜𝑛𝑥 = ∑ 𝐹𝑢𝑒𝑙 𝐶𝑜𝑛𝑠𝑢𝑚𝑒𝑑𝑖,𝑋 𝐺𝐶𝑉𝑖,𝑥
2
𝑖=
𝐸𝐹𝑖 𝑂𝑥𝑖𝑑𝑎𝑡𝑖𝑜𝑛 𝐹𝑎𝑐𝑡𝑜𝑟𝑖 (1)
Where, CO2, x= Absolute CO2 emission of the station in the given fiscal year ‘x’. Fuel Con i,y= Amount
of fuel of type i consumed in the fiscal year ‘x’. GCVi,x= Gross calorific value of the fuel i in the fiscal
year ‘x’. EFi= CO2 emission factor of the fuel i based on GCV. Oxidation factor i = Oxidation factor of
the fuel i.
The emission and the oxidation factors used are taken from the CO2 database provided by the CEA [82].
The emission factors for Indian coal is based on the values provided in India’s Initial National
Communication under the UNFCCC, supported by the results of an analysis of approx. 120 coal samples
collected from different Indian coal fields. The values in the National Communication are based on the
NCV (Net Calorific Value) and are converted to GCV basis using a formula given by the National
Communication.
The specific CO2 emissions are calculated by dividing the absolute emissions to the net generation for
the particular station [80].
𝑆𝑝𝑒𝑐𝑖𝑓𝑖𝑐 𝐶𝑂2 (𝑠𝑡𝑎𝑡𝑖𝑜𝑛)𝑥 =𝐴𝑏𝑠𝑜𝑙𝑢𝑡𝑒 𝐶𝑂2 (𝑠𝑡𝑎𝑡𝑖𝑜𝑛)𝑥
𝑁𝑒𝑡 𝐺𝑒𝑛𝑒𝑟𝑎𝑡𝑖𝑜𝑛 (𝑠𝑡𝑎𝑡𝑖𝑜𝑛)𝑥 (2)
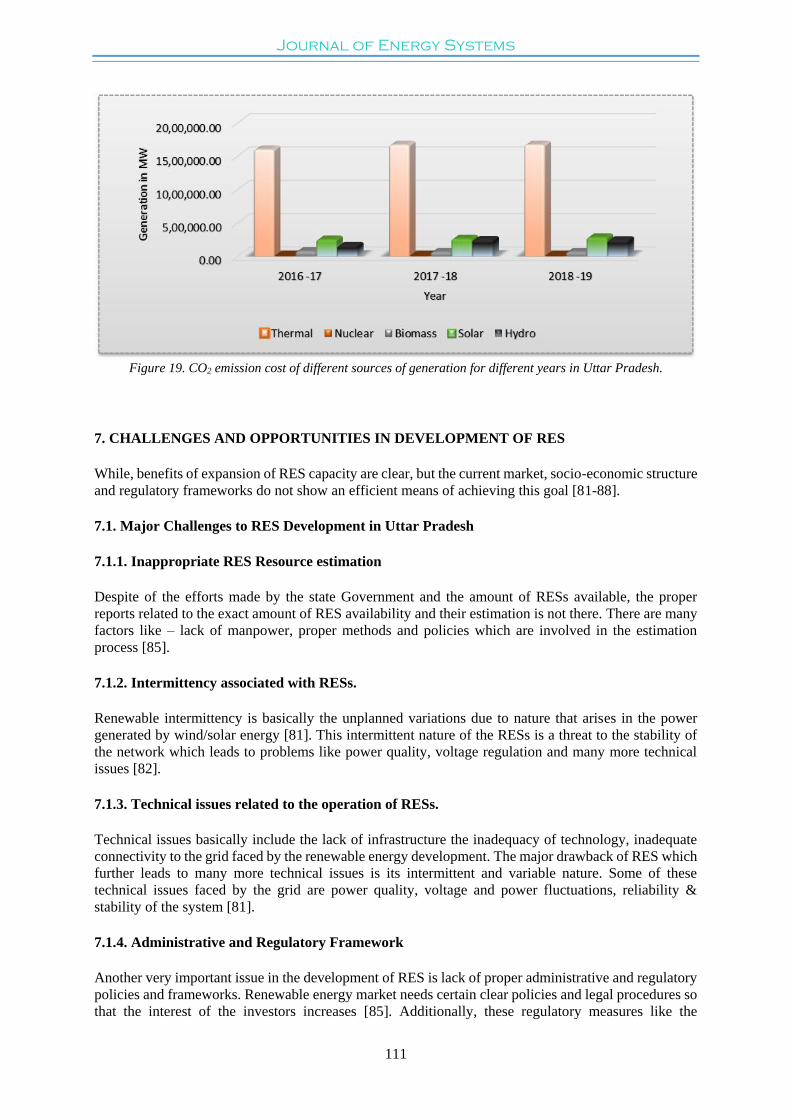
The calculations have been done using the above equations and considering the emission factors
described by the CEA in their database for CO2 calculations. Table 3 shows the total generation of Uttar
Pradesh state by different sources including coal, gas, nuclear, biomass, cogeneration, hydro, solar and

Journal of Energy Systems
110
Wind. As wind energy generation in the state is not very prominent, we have not considered it. The total
generation have been shown for three financial years and for each of the year the total CO2 emission has
been calculated considering the respective emission factors for the source. The total generation have
been kept same so that a proper analysis can been done. It can be easily seen that by using the renewable
energy source, there is a reduction in CO2 emission and also the related cost. The percentage cost saving
has also been estimated. The graphical representations of this analysis have been shown in Fig. 18 &
19. From the above analysis, we can say that by replacing the conventional fuel with the renewable
energy sources, a high capital cost can be saved and also can lead to clean and green environment.
Table 3. Total source wise generation, CO2 emissions and the cost of respective sources of generation in Uttar
Pradesh state [10, 16, 35, 54]. Source Generation Capacity (MW) CO2 Emissions (Tonnes) Cost ($)
2016 -17 2017-18 2018-19 2016 - 17 2017 -18 2018 -19 2016 - 17 2017 – 18 2018 - 19
Coal 17292.5
8
18073.7
2
18092.9
9
17984.28 18796.66 18816.7
0
1,546,648.0
8
1616512.7
6
1618236.2
0
Gas 549.49 549.49 549.49 598.94 598.94 598.94 51,508.84 51,508.84 51,508.84
Nuclear 289.48 289.48 289.48 0.955 0.955 0.955 82.13 82.13 82.13
Biomass
Power
1617 1957.50 1957.50 565.95 685.12 685.12 48,671.70 58,920.75 58,920.75
Baggasse
Cogeneratio
n
1250 160.01 158.01 283.75 36.32 35.86 24,402.50 3,123.52 3,083.96
Large Hydro 2168.30 3421.03 3368.63 1778 2805.24 2762.27 152,908 241,250.64 237,555.22
Small Hydro 25.5 25.01 25.01 20.91 20.58 20.58 1798.26 1769.88 1769.88
Solar PV 850.10 891.01 960.10 2890.34M
t
3029.43M
t
3264Mt 248,540 260,530.98 280,704
Wind NA NA NA NA NA NA NA NA NA
Table 4. Estimated cost saving achieved by using solar power in the state [10, 16, 35, 54]. Year Generation (MW) Estimated CO2 Emission
Reductions (million t CO2 per year)
Estimated Cost Savings ($) % cost saving
2016-17 17292.58 58,794 5,056,284.00 69.4
2017-18 18073.72 61,450.64 4,833,498.93 66.5
2018-19 18092.99 61,516.16 4,838,652.14 66.5
Table 5: Estimated cost saving achieved by using hydro power in the state [10, 16, 35, 54]. Year Generation (MW) Estimated CO2 Emission
Reductions ( t CO2 per year)
Estimated Cost Savings ($) % cost saving
2016-17 17292.58 14,179.91 1,219,472.26 26.8
2017-18 18073.72 14,820.45 1,274,558.70 26.8
2018-19 18092.99 14,836.25 1,275,917.50 26.8
Figure 18. Total generation and CO2 emission for three different years for all the available sources in Uttar
Pradesh.
Journal of Energy Systems
111
Figure 19. CO2 emission cost of different sources of generation for different years in Uttar Pradesh.
7. CHALLENGES AND OPPORTUNITIES IN DEVELOPMENT OF RES
While, benefits of expansion of RES capacity are clear, but the current market, socio-economic structure
and regulatory frameworks do not show an efficient means of achieving this goal [81-88].
7.1. Major Challenges to RES Development in Uttar Pradesh
7.1.1. Inappropriate RES Resource estimation
Despite of the efforts made by the state Government and the amount of RESs available, the proper
reports related to the exact amount of RES availability and their estimation is not there. There are many
factors like – lack of manpower, proper methods and policies which are involved in the estimation
process [85].
7.1.2. Intermittency associated with RESs.
Renewable intermittency is basically the unplanned variations due to nature that arises in the power
generated by wind/solar energy [81]. This intermittent nature of the RESs is a threat to the stability of
the network which leads to problems like power quality, voltage regulation and many more technical
issues [82].
7.1.3. Technical issues related to the operation of RESs.
Technical issues basically include the lack of infrastructure the inadequacy of technology, inadequate
connectivity to the grid faced by the renewable energy development. The major drawback of RES which
further leads to many more technical issues is its intermittent and variable nature. Some of these
technical issues faced by the grid are power quality, voltage and power fluctuations, reliability &
stability of the system [81].
7.1.4. Administrative and Regulatory Framework
Another very important issue in the development of RES is lack of proper administrative and regulatory
policies and frameworks. Renewable energy market needs certain clear policies and legal procedures so
that the interest of the investors increases [85]. Additionally, these regulatory measures like the

Journal of Energy Systems
112
standardization and coding would enhance the use of renewable energy technologies by minimization
of regulatory and technological risk attached with the investments of these RES projects.
7.1.5. Lack of Technical Abilities
In developing countries like India, the technical abilities and manpower required for the proper
functioning of the RES technologies is less and which a major hindrance in its development [90]. There
are very few training programs with respect to these technologies due to which very few technical
experts are associated with them [85].
7.2. Opportunities to Develop RESs in the State
There are various areas or sectors in the state which can provide opportunities for the development of
RESs [85]. The most common sectors are discussed below and are shown in Fig. 20.
Figure 20. Opportunities for RESs development in Uttar Pradesh.
7.2.1. Energy Access to Remote Areas
The state is in its developing stage with electrification reaching to almost every household in the urban
areas. The remote areas specially the rural areas have limited access to electricity and the use of RES
makes sure that the energy is available to all since these sources are globally distributed around the
world. Now, the transition to RES from the conventional fuels in the state has led to many initiatives to
improve the energy access in remote areas.
7.2.2. Energy Security
Energy security refers to a secured supply of energy without any disruption. The main emphasis in this
case should be on the availability of the RESs. Locally available RES can yield energy security by the
reduction in the dependency on fossil fuels and increase in different types of supply options. RES is
readily available as compared to fossil fuels and less traded in the market. This may also lead to an
increase in reliability especially in areas that have insufficient grid connection [86].

Journal of Energy Systems
113
7.2.3. Socio –Economic Development of State
The energy sector of any state is directly related to the economic development and growth of the state.
Per capita income is correlated to the per capita energy use and to the human development. Clean and
reliable energy is a prerequisite for human development which can contribute to income generation,
increase the health and education quality and decrease poverty level [87, 88].
7.2.4. Climate Change Mitigation
The most important benefit of using RESs is that it helps in reduction of greenhouse gas emissions. This
reduction helps in mitigating the climate change and reduces the various impacts incorporated by these
harmful gases associated with fossil fuel generation. The result of the rapidly increasing global
temperature is devastating for the environment and necessary actions are taken in the state to mitigate
these emissions [88].
7.2.5. Reduction in Environmental and Health Impacts
The main three consequences of the climate change – rising sea level, rising temperatures and increased
precipitation have the greatest impact on human health. So, the use of RESs will help the mitigation of
this climate change and reduction in the severe health impacts on human beings. This will lead to create
opportunities to develop more and more clean energy and a green environment [87].
8. CONCLUSION
In the present study, firstly an attempt has been made to review the basic concept, growth and current
status of renewable energy sources in the country and also in the state. The electrification status of the
rural area in Uttar Pradesh state is also presented. An overview of the potential and installed capacity of
these resources has been presented. The advantages and disadvantages associated with the production
and consumption of different renewable energy sources in the state has been presented.
Different studies and data presented shows that Uttar Pradesh state is rich in biomass and solar potential
the most. Uttar Pradesh being one of the largest states of the country has a huge agricultural land and
where most of the population depends on agriculture activities and hence large amount of biomass
residue is produced. The state is also rich in solar energy, receiving a sufficient amount of solar radiation
almost throughout the year. The growth rate of renewable energy production in the state has been
increasing rapidly and various policies and schemes have also been introduced for renewable energy
technology development. Different technology options available in the state depending upon the rural
needs have been presented like- single source energy systems, hybrid energy systems and also the
integrated energy system.
To provide electrification to remote rural areas, the best possible solution is to use them as hybrid energy
sources and integrated energy sources. An assessment on the CO2 emissions in the state has been
presented. Based on this assessment, the related CO2 cost is also calculated. Mitigation potential of
various Renewable energy sources available in the state like – solar PV, Hydro, Biomass etc. has been
presented and based on this potential the total cost saving for the energy generation for three years is
calculated. The respective analysis shows that there is huge amount of cost saving almost 27 – 67 % and
also huge amount of reduction in CO2 emissions by the use of renewable energy sources which leads to
reduction in environmental and health impacts. Various kind of issues and challenges associated with
the development of RES are been discussed and some solutions and recommendations related to these
barriers are also presented.

Journal of Energy Systems
114
New promotional programs and schemes should be on a high priority and different subsidies and
incentives should be provided to the rural and un-electrified population. Technical constraints like -
power quality, stability, voltage and power fluctuations should be considered properly due to the
complexity of the system. International market drivers should also be involved in this sector so that more
and more knowledge sharing is involved. Various optimization techniques like – ANFIS, ANN, GA, FL
should be used to find an optimal solution to the complexity involved with the process. It is more suitable
to use the combination of one or more optimization techniques in order to overcome the demerits of
individual techniques.
REFERENCES
[1] Rural Electrification in India - Customer Behavior and Demand. An Initiative by Rockefeller Foundation,
Smart Power India and Initiative for sustainable Energy Policy. Feb. 2019.
[2] Internet Web-Site: https://www.bp.com/content/dam/bp/business-sites/en/global/corporate/pdfs/energy-
economicsstatistical-review/bp-stats-review-2018-full-report.pdf, BP Statistical Review. World Energy 2018
[3] BP Statistical Review. Ministry of Power, Aranca Research.
[4] Renewable 2018. Global Status Report (REN21). Central Electricity Authority.
[5] Internet Web-Site: www.forbes.com/sites/suparnadutt/2018/05/07, Forbes Magazine, Accessed on October
2019.
[6] Executive Summary on Power Sector, Central Authority of India, Monthly reports, July 2019.
[7] Internet Web-Site: https://en.wikipedia.org/wiki/Uttar_Pradesh, Wikipedia, Uttar Pradesh, Accessed on
October 2019.
[8] Department of Infrastructure and Industrial Development, Directorate of Economics & Statistics of Uttar
Pradesh, Central Statistics Office, Census 2011.
[9] Internet Web-Site: http://upneda.org.in/AboutUs.aspx, Uttar Pradesh New & Renewable Development
Agency, UPNEDA, Accessed on October 2019.
[10] Central Electricity Authority (CEA), State Budget 2018-19.
[11] 24*7 Power for All, Uttar Pradesh. Joint initiative by Government of India and Government of Uttar Pradesh.
[12] Internet Web-Site: https://www.census2011.co.in/census/state/uttar+pradesh.html, CENSUS 2011, Accessed
on October 2019.
[13] 24x7 Power for All in Uttar Pradesh Strategies for on-ground action based on ACCESS 2015
[14] Press Information Bureau Government of India. MNRE, 30 April, 2018, PIB Delhi.
[15] Internet Web-Site: http://www.ddugjy.gov.in/portal, Deen Dayal Upadhayaya Gram Jyotii Yojana, Accessed
on October 2019.
[16] Central Electricity Authority, Load Balance Report 2018. http://cea.nic.in/reports/annual/lgbr/lgbr-2018.pdf.
Accessed on October 2019.
[17] Uttar Pradesh Investor Summit 2018. MNRE. Annual Report 2017-18.
[18] Internet Web-Site: https://biomasspower.gov.in/uttar-pradesh.php, MNRE. Biomass Portal, Accessed on
October 2019.
[19] Internet Web-Site: http://upagripardarshi.gov.in, Department of Agriculture. Uttar Pradesh. Accessed on
October 2019.
[20] Anil Kumar, Nitin Kumar, Prashant Baredar, Ashish Shukla. A review on biomass energy resources, potential,
conversion and policy in India. Renewable and Sustainable Energy Reviews 2015; 45:530–539.
[21] MNRE. https://mnre.gov.in/physical-progress-achievements. Accessed on October 2019.
[22] Internet Web-Site: http://upneda.org.in/micro-hydel.aspx, UPNEDA, Accessed on October 2019.
[23] Internet Web-Site: http://www.upjvn.org, Uttar Pradesh Jal Vidyut Nigam Limited, Accessed on October
2019.
[24] Internet Web-Site: http://upneda.org.in/wind-energy.aspx, UPNEDA, Accessed on October 2019.
[25] Internet Web-Site: http://upneda.org.in/MediaGallery/wind-energy-list-eng%20new.pdf, UPNEDA,
Accessed on October 2019.
[26] Uttar Pradesh Solar Energy Policy-2017. IEA/IRENA Renewables Policies Database.
[27] Internet Web-Site: http://www.synergyenviron.com/, Synergy Enviro Engineers, Accessed on October 2019.
[28] Hoogersmm Gregor. Fuel Cell Technology Handbook. 2003.
[29] E. Taibi, D. Gielen, M. Bazilian. The potential for renewable energy in industrial applications. Renew.
Sustain. Energy Rev. 2012; 16: 735–744.
[30] Hydrogen: A Renewable Energy Perspective. A report prepared for the 2nd Hydrogen Energy Ministerial
Meeting. International Renewable Energy Agency. September 2019.

Journal of Energy Systems
115
[31] MNRE. Report on Fuel Cell Development in India. 2019.
[32] Internet Web-Site: www.isolaralliance.org, SGF Final Report on Energy Storage System Roadmap for India
(2019-2032).
[33] Internet Web-Site: https://www.iea.org/weo2018/, International Energy agency 2018, Accessed on October
2019.
[34] Şen Zekâi. Innovative methodologies in renewable energy: A review. International Journal of Energy
Research 2019:1-38.
[35] Internet Web-Site: State-wise installed capacity of Grid Interactive Renewable Power, MNRE, Accessed on
31.12.2018.
[36] Internet Web-Site: https://electricvehicles.in/wp-content/uploads/2019/08/Uttar-Pradesh-Electric-Vehicle-
Policy-2019.pdf, Uttar Pradesh Electric vehicle Policy, Accessed on November 2019.
[37] Internet Web-Site: https://mercomindia.com/uttar-pradesh-electric-buses/, Mercom India, Accessed on
November 2019.
[38] Internet Web-Site: https://msme.gov.in/, Ministry of Micro, Small and Medium Enterprises. 2019
[39] Internet Web-Site: Bio Energy Program. http://upneda.org.in/bio-energy-program.aspx, UPNEDA
[40] Internet Web-Site: www.adanipower.com, Adani Power, Accessed on November 2019.
[41] Internet Web-Site: https://gbci.org/us-green-building-council-releases-annual-top-10-states-leed-india,
Green Business Certification Inc., Accessed on November 2019.
[42] Internet Web-Site: http://greenbuildinglocator.in.saint-gobain-glass.com/, Saint Gobain Glass, Accessed on
November 2019.
[43] Comello Stephen, D, Reichelstein Stefan, J, Sahoo Anshuman, Tobias S. Schmid. Enabling Mini-Grid
Development in Rural India. World Development. 2017.
[44] Kamalapur, GD, Udaykumar, RY. Rural electrification in India and feasibility of Photovoltaic Solar Home
Systems. Electrical Power and Energy Systems 2011; 33: 594–599.
[45] A Report on Rural Energy Alternatives in India: Opportunities in Financing and Community Engagement for
Renewable Energy Microgrid Projects. Woodgrow Wilson School of Public and International Affairs. 2017.
[46] Oda and Tsujita. The determinants of rural electrification: The case of Bihar in India. Energy Policy. 2011;
39(6):3086-3095. [47] Ghafoor Abdul and Munir Anjum. Design and economics analysis of an off-grid PV system for household
electrification. Renewable and sustainable energy reviews 2015; 42: 496-502.
[48] Internet Web-Site :www.pumpsandsystems.com/pumps/julyaugust-2015-solar-paneled-drives-power-water-
pumps-rural-farmers, Pumps and systems, Accessed on October 2019.
[49] Internet Web-Site: Wikipedia. https://en.wikipedia.org/wiki/Solar_lamp
[50] Internet Web-Site: Wikipedia. https://en.wikipedia.org/wiki/Solar_cooker.
[51] Internet Web-Site: Wikipedia. https://en.wikipedia.org/wiki/Solar_rickshaw
[52] Internet Web-Site: Wikipedia. https://en.wikipedia.org/wiki/Solar_streetlightning
[53] Internet Web-Site: Wikipedia. https://en.wikipedia.org/wiki/Solar_dryer
[54] Ministry of New and Renewable Energy (MNRE). Annual Report 2018-2019.
[55] Internet Web-Site: https://mnre.gov.in/biomass-powercogen, MNRE, Accessed on October 2019.
[56] Palit Debajit, Malhotra Ramit, Kumar Atul. Sustainable model for financial viability of decentralized biomass
gasifier-based power projects. Energy Pol. 2011;39: 4893-901.
[57] Sodha MS, Ram S, Bansal PK. Effect of PVC greenhouse in increasing the biogas production in temperature
cold climate conditions. Energy Conversion Management 1987; 27: 83-90.
[58] Hasan A.S.M Monjurul, Ammenberg Jonas. Biogas potential from municipal and agricultural residual
biomass for power generation in Hazaribagh, Bangladesh – A strategy to improve the energy system.
Renewable Energy Focus 2019; 29: 14-23.
[59] Internet Web-Site: http://www.eai.in/ref/ae/hyd/hyd.html, Energy Alternatives India (EAI), Accessed on
October 2019.
[60] Internet Web-Site:. http://cea.nic.in/, Central Electricity Authority, Accessed on October 2019.
[61] Proceedings of International training course on small hydropower Development. Alternate hydro energy
Centre, Indian Institute Of Technology. Roorkee India. Feb 05-16, 2013.
[62] Rojanamon P, Chaisomphob T, Bureekul T. Application of geographical information system to site selection
of small run-of-river hydropower project by considering engineering/economic/environmental criteria and
social impact. Renewable sustainable Energy Reviews 2009; 13: 2336-2348.
[63] Internet Web-Site: http://www.alternative-energy-news.info/wind-power/. Accessed on October 2019.
[64] Agarwal N, Kumar A, Varun. Optimization of grid independent hybrid PV-diesel-battery system for power
generation in remote villages of Uttar Pradesh, India. Energy Sustainable Development. 2013; 17:210-9.
[65] Habib MA, Said SAM, El-Hadidy MA, Al-Zaharna I. Optimization procedure of a hybrid photovoltaic wind
energy system. Energy, 1999; 24 (11): 919–1029.

Journal of Energy Systems
116
[66] Rajkumar RK, Rama Chandaramurthy VK, Yong BL, Chia DB. Techno-economical optimization of hybrid
pv/wind/battery system using Neuro-Fuzzy. Energy. 2011; 36(8):5148–53.
[67] Akshay Urja Magazine by MNRE, Government of India. 12(5) • April 2019.
[68] Ramakumar R. Integrated renewable energy systems: power engineering review.IEEE. 1995;15(2):10–3.
[69] Chauhan A, Saini R.P. A review on Integrated Renewable Energy System based power generation for stand-
alone applications: Configurations, storage options, sizing methodologies and control. Renewable and
Sustainable Energy Reviews. 2014;38: 99–120.
[70] Kanase Patil A.B, Saini R.P, Sharma M.P. Integrated renewable energy systems for off grid rural
electrification of remote area. Renew Energy. 2013; 5:1342–9.
[71] Ashenayi K, Ramakumar R. IRES a program to design integrated renewable energy systems. Energy. 1990;
15:1143–52.
[72] Internet Web-Site: https://mnre.gov.in/file-manager/UserFiles/state-power-policies/UP-Solar-Power-
Policy.pdf, MNRE. Solar Power Policy
[73] Internet Web-Site: www.isolaralliance.org/docs/UP-solar-policy-2017.pdf, isolar alliance. Uttar Pradesh
Solar Policy.
[74] Internet Web-Site:
http://www.cbip.org/Policies2019/PD_07_Dec_2018_Policies/UttarPradesh/Minigrid/SummaryUPMiniGrid
Policy-2016.pdf, Central Board of Irrigation and Power.
[75] Internet Web-Site: https://mnre.gov.in/renewable-energy-regulatory-framework, MNRE.
[76] Internet Web-Site: http://upneda.org.in/programmes-under-grid-solar.aspx, UPNEDA, Accessed on Nov.
2019.
[77] Ministry of Housing and Urban Affairs. www.mohua.gov.in
[78] Internet Web-Site: http://upneda.org.in/national-biogas-fertilizer.aspx, UPNEDA, Accessed on Nov. 2019.
[79] Internet Web-Site: http://upneda.org.in/biogas-based-power.aspx, UPNEDA, Accessed on Nov. 2019.
[80] CO2 Baseline Database for the Indian Power Sector. Government of India. Ministry of Power Central
Electricity Authority. 2019.
[81] Bollen Math, Hassan Fainan. Integration of Distributed Generation in the Power System. A John Wiley &
Sons Publication. 2011.
[82] Chanhome Anuwat, Phichaisawat Sotdhipong, Surachai Chaitusaney. Minimization of voltage fluctuation by
considering uncertainty from Renewable Energy resources. 10th International Conference on Electrical
Engineering/Electronics, Computer, Telecommunications and Information Technology. 2013.
[83] Kappagantu Ramakrishna, Daniel S. Arul. Challenges and issues of smart grid implementation: A case of
Indian scenario. Journal of Electrical Systems and Information Technology 2018;5: 453-467.
[84] Report on Advances Metering Infrastructure and customer systems. Smart grid Investment Grant Program.
2016.
[85] Sen Souvik, Ganguly Saurav. Opportunities, barriers and issues with renewable energy development – A
discussion. Renewable and Sustainable Energy Reviews. 2017; 69: 1170 -1181.
[86] Owusu Phebe Asantewaa, Sarkodie Samuel Asumadu. A review of renewable energy sources, sustainability
issues and climate change mitigation. Journal of Cogent Engineering. 2016; 3.
[87] Kaygusuz K. Energy for sustainable development: key issues and challenges. Energy Sources 2007; 2:73–83.
[88] UNDP. Human Development Report 2007, United Nations Development Programme, New York, NY, USA;
2007.

Journal of Energy Systems
117
APPENDICES
APPENDIX 1
Table 1. District wise list of number of households electrified in Uttar Pradesh [15].
District Total
Households
Electrified
Households as
on 10th
Oct,2017
Balance Un-
electrified
Households as on
10th Oct, 2017
Progress from
10th Oct, 2017
to 31st Jan,
2019
Additional
Households
progress from 1st
Feb 2019 till date
Jaunpur 543636 354532 189104 189000 10244
Azamgarh 531617 359052 172565 172218 7108
Gorakhpur 529442 322489 206953 206866 12516
Fatehpur 460894 335410 125484 126642 13755
Saharanpur 438644 325543 113101 109238 2980
Kushinagar 431458 267645 163813 163255 6620
Pratapgarh 414151 297359 116792 116794 13594
Mahrajganj 404085 265174 138911 135986 5684
Allahabad 401526 235639 165887 178461 11061
Kheri 392121 271124 120997 125952 15160
Ghazipur 379482 238271 141211 137298 2542
Siddharthnagar 371093 251805 119288 119288 6624
Rae Bareli 370175 296088 74087 75469 13635
Sitapur 369627 180497 189130 187312 12173
Bahraich 368221 194359 173862 180341 33998
Bijnor 360706 253562 107144 107695 6039
Aligarh 359534 251634 107900 107900 6654
Unnao 359117 167432 191685 198903 22255
Sultanpur 349470 234170 115300 108929 3210
Bulandshahar 349166 229524 119642 120118 14999
Agra 347573 291686 55887 55887 8068
Muzzafarnagar 347306 285892 61414 61605 4631
Basti 345441 219879 125562 124839 5518
Hardoi 340980 145411 195569 201991 11274
Varanasi 332187 212270 119917 122277 3071
Ballia 329423 193773 135650 132605 2977
Chandauli 326476 248354 78122 78155 2777
Barabanki 301600 182417 119183 113696 5738
Meerut 299230 247464 51766 51925 3468
Moradabad 290410 174970 115440 115968 12348
Sonbhadra 283956 110863 173093 167297 668
Faizabad 274882 174465 100417 95972 5324
Gonda 268418 135113 133305 132031 26513
Shahjahanpur 267342 130989 136353 134247 9859
Mirzapur 266858 145182 121676 120833 10575
Bareilly 262046 158446 103600 115564 6718
Balrampur 255313 177023 78290 73900 9872
Ambedkar
Nagar
255268 198238 57030 55705 1696
Lucknow 254665 165697 88968 89969 1114
Mau 240346 155025 85321 85297 1535
Pilibhit 236024 165315 70709 69350 5761
Mathura 228287 151564 76723 76723 4664
Mahamaya
Nagar
223574 172465 51109 51109 2654
Amethi 220961 153205 67756 61415 2632
Jyotiba Phule
Nagar
217374 140576 76798 75747 6498
Rampur 216354 113653 102701 103012 6039
Baghpat 211114 190371 20743 20947 3192
Firozabad 210786 136637 74149 74149 2514

Journal of Energy Systems
118
Sambhal 206047 114210 91837 92869 8179
Sant Kabir
Nagar
195987 105047 90940 91014 3899
Banda 189438 82811 106627 106627 669
Auraiya 188849 114727 74122 74122 2061
Farrukhabad 187254 98945 88309 88703 3675
Budaun 185888 101969 83919 84208 11393
Mainpuri 184592 110738 73854 73854 8559
Kanpur Nagar 178464 111725 66739 66739 6641
Kanpur Dehat 174969 90634 84335 84335 5694
Shamli 168080 141489 26591 26966 1575
Kannauj 166063 86504 79559 79559 6365
Jalaun 165318 78646 86672 86672 4250
Sant Ravidas
Nagar
162082 96086 65996 67817 2002
Shrawasti 148867 90149 58718 52811 1686
Chitrakoot 143290 53895 89395 89395 233
Kaushambi 137842 78200 59642 59649 4275
Etah 137503 77044 60459 60459 7624
Jhansi 135325 84071 51254 51254 2939
Hamirpur 135171 74241 60930 60544 3199
Etawah 134965 83508 51457 52063 1344
Lalitpur 123567 63228 60339 59725 3395
Mahoba 120085 81457 38628 38628 3731
Ghaziabad 118498 102253 16245 16305 1951
Hapur 114949 84113 30836 31255 2105
Kanshiram
Nagar
112821 66206 46615 46615 8191
Gautam Buddha
Nagar
85544 65872 19672 20276 3332
Total 2,05,54,140 1,32,07,298 73,46,842 73,45,170 5,00,930

Journal of Energy Systems
119
APPENDIX 2
Table 3: Various RES technology options available in the state.
S.N
o.
Ty
pe
of
RE
S
Tec
hn
olo
gy
Fu
el U
sed
&
avai
labil
ity
in
sta
te
Siz
e/ M
odu
le (
KW
)
Ele
ctri
cal
Eff
icie
ncy
(%
)
Over
all
Eff
icie
ncy
(%)
Inst
alle
d C
ost
($
/
KW
)
Pea
k S
hav
ing
Rel
iabil
ity
Pow
er Q
ual
ity
Gre
en P
ow
er
Lan
d U
se
Mer
its
Dem
erit
s
1
Photo-
voltaic
system [2, 9,
11, 14,26,
35, 44, 49 -
53, 57, 64]
Sunlight,
(4.27
kWh/m2/day
– 5.2
kWh/m2/day)
0.02 –
1000+
15 -
17
%
40 –
45
%
4500 -
6000 No No No Yes
100
sq.ft.
– 4
acres
Remote
standalones
electrification
possible
Readily
available
Negligible
operation
Suitable for
small – large
applications
Reduce
greenhouse
gas emission
High capital
cost
Weather
dependent
Intermittent
nature
Additional
component
required
Large area of
land required
2
Wind
[2, 4, 21, 24
-25, 33, 54,
59, 69]
Wind, (1.5
m/s – 4.1 m/s)
0.1 –
3000 +
50 -
80
%
3000 –
4
million
No No No Yes
0.375
acres
–
2.25
acres
Readily
available
Environment
friendly
Reduce fossil
fuel
consumption
Small land
footprint
Suitable for
remote area
electrification
Low
maintenance
and running
costs
Intermittent
nature
High
installation cost
Threat to
wildlife
Weather
dependent
3
Biomass
Gasification
[1-2, 8, 15,
18, 20, 44,
46, 55,58, 78
-80]
Fuel wood,
crops residue,
agro industrial
residue,
1765 MW
5 –
20,000
15 –
25
%
60 –
75
%
1500 –
3000 No No No Yes NA
Address waste
needs as well
as energy
needs
Generated
from local
sources
Include
variety of
organic
sources
Reduce fossil
fuel
consumption
Cause health
hazards
Deforestation
Source of
emission and
air pollution
Unpredictability
&
seasonability
Land use
4
Biogas [1-2,
8, 15, 18, 20,
44, 46, 55,
57 -58, 78 -
80]
Methane,
Carbon
Dioxide
3- 250
KV
30-
40
%
40-
90%
15000-
11.35
cr.
No No No Yes NA
Eco friendly
Reduce soil
and water
pollution
Produce
organic
fertilizer
Simple and
low cost
Healthy
cooking
alternative
Contains
impurities
Temperature
dependent
5
Small Hydro
Power
[9, 21-23,
33, 44, 61-
62, 69-70,
90]
Water 5 –
25,000
90 –
98
%
10,000
–
13,000
No Yes Yes Yes NA
Helps fight
climate
changes
Uses other
renewable
sources
Improves the
air we breathe
Uses water
which is not
subjected to
market
fluctuations
Effect land use
Depends on
precipitation
level
Alter the water
temperature and
river flow

Journal of Energy Systems
120
6
Solar-
Thermal [2,
9, 11, 14, 15,
26, 35, 44,
49 -53, 57,
64, 72]
Sunlight 1000 –
80,000
30 –
40
%
50 –
75
%
No No No Yes NA
No fuel cost
Predictable
Pollution free
Use existing
industrial base
High cost
Water issue
Ecological and
cultural issues
Limited
locations and
size
120imitations
7
Battery
Storage
[29, 36, 44,
47, 64, 69-
70]
NA 100 –
5000 NA
70 –
75
%
100 –
200 Yes Yes Yes Yes NA
High energy
density
Low
maintenance
Variety of
types
available
Protection
required
Ageing
Cost
Transportation
8 Fuel cell
[28, 30-31] Hydrogen
0.1 –
2MW
40-
60%
80-
85% 60-500 Yes Yes Yes Yes NA
High power
density
High
efficiency
conversion
Quiet
operation
High cost
Fuel required
9
Electric
Vehicle
[35-37,
85,86]
Battery or
Fuel Cell NA
70-
75%
350-
10,000 Yes Yes Yes Yes NA
No gas
required
No emission
Safe to drive
Savings
Low
maintenance
Short driving
range
and speed
Long recharge
time
Recharge points
required