renewable energy eia application mapping report version 1
TRANSCRIPT
Renewable Energy EIA Application Mapping Report Version 1
July 2013
Mr J Reinecke
Mr A Ntisana
Ms SNL Poni
Commissioned by CSIR on behalf of the Department of Environmental Affairs

R e n e w a b l e E n e r g y E I A A p p l i c a t i o n M a p p i n g R e p o r t V e r s i o n 1 M a y 2 0 1 3
Executive Summary
This project was undertaken by the Centre for Renewable and Sustainable Energy Studies (CRSES)
and commissioned by the Council for Scientific and Industrial Research (CSIR), acting on behalf of the
national Department of Environmental Affairs (DEA). The objective of the project is to produce a
Geographical Information Systems (GIS) layer containing all renewable energy Environmental Impact
Assessment (EIA) applications received by the DEA before December 2012. This project was
undertaken as a sub-project of the DEA National Wind and Solar PV Strategic Environmental
Assessments (SEAs) and produced the development of the first Renewable Energy EIA Applications
Map for South Africa.
A single shapefile containing 470 renewable energy EIA applications comprising 2 433 land portion
entries was developed. As of 15 March 2013, 86 land portion entries were outstanding; 19 of which
were placed on hold; 41 had incorrect or no environmental practitioners’ details; and 26 were awaiting
response form the relevant environmental practitioners (NOTE: these numbers refer to individual land
portions, not entire projects).
This report discusses the data conditioning, verification and joining processes and goes on to describe
the challenges experienced and how they were resolved. It also describes other measures taken to
decrease data uncertainty.
In conclusion, recommendations for future EIA data submission and capturing are provided in order to
simplify the maintenance and future updating of the Renewable Energy EIA Application Map of South
Africa.

R e n e w a b l e E n e r g y E I A A p p l i c a t i o n M a p p i n g R e p o r t V e r s i o n 1 M a y 2 0 1 3
Acknowledgements
This project would not have been possible without the support of all the relevant EIA practitioners assisting with
verifying and providing lacking or incomplete information. We would also like to extend our gratitude for the
cooperative spirit shown by the DEA’s GIS Department as well as our colleagues at the CSIR EMS Group,
assisting in making this project a success.
Data Summary
Data Title DEA_Dec2012_RE_EIA_Portions_V1_July2013 DEA_Dec2012_RE_EIA_Projects_V1_July2013
Data Custodian National Department of Environmental Affairs National Department of Environmental Affairs
Release Data July 2013 July 2013
Version Version 1 Version 1
Data Extent Republic of South Africa Republic of South Africa
Data Type Spatial extents of all land portions subject to any
renewable energy EIA application.
Spatial extents of all renewable energy EIA
applications.
Time Representation EIA applications received before December 2012 EIA applications received before December 2012
Coordinate System CGS_Hartebees_1994 CGS_Hartebees_1994
GIS Data Format Shapefile Shapefile
R e n e w a b l e E n e r g y E I A A p p l i c a t i o n M a p p i n g R e p o r t V e r s i o n 1 M a y 2 0 1 3
Table of Contents
Executive Summary .....................................................................................................................................ii
Acknowledgements .................................................................................................................................... iii
Data Summary ........................................................................................................................................... iii
Table of Contents ....................................................................................................................................... iv
List of Figures ............................................................................................................................................. v
1. Introduction ........................................................................................................................................ 1
2. Objectives and Scope of Work ............................................................................................................. 1
3. Methodology ...................................................................................................................................... 2
3.1. Data Conditioning and Verification ............................................................................................... 3
3.2. Joining Process .......................................................................................................................... 6
4. Findings........................................................................................................................................... 11
5. Conclusions and Recommendations................................................................................................... 17
Appendix A: Flagging colours .................................................................................................................... 19
Appendix B: Discrepancies in DEA reference numbers ................................................................................ 20
Appendix C: Joining process chart ............................................................................................................. 22
Appendix D: Challenges and problems experienced .................................................................................... 23
Appendix E: Chart indicating the number of mapped and unmapped projects ................................................. 25
Appendix F: Comparison between DEA R1 shapefile and CRSES R1 shapefile ............................................. 26
R e n e w a b l e E n e r g y E I A A p p l i c a t i o n M a p p i n g R e p o r t V e r s i o n 1 M a y 2 0 1 3
List of Figures
Figure 1: A multi-portioned farm with one portion identified for EIA...................................................................... 3
Figure 2: A farm name search in cadastral data layer returning several results in South Africa. ............................ 5
Figure 3: Farm portion that has multiple polygons but has the same SG code ..................................................... 8
Figure 4: Preferred bidders R2 layers of Amakhala Emoyeni WEF farms with (blue) and without (green) names. . 9
Figure 5: Preferred bidders R2 merged layers of Amakhala Emoyeni WEF ......................................................... 9
Figure 6: Completed EIA projects in South Africa ............................................................................................. 10
Figure 7: Renewable Energy EIA Application map. ........................................................................................... 13
Figure 8: Renewable energy EIA application map with the Eskom national transmission grid ............................. 14
Figure 9: Renewable energy map showing locations for proposed solar PV and onshore wind plants ................ 15
Figure 10: Proposed solar PV and onshore wind EIA applications .................................................................... 16
Figure B1: Difference in location between New Kalkbult and Van der Lindes Kraal farms in the NC ................... 20
Figure B2: Showing the distance between New Kalkbult and Van der Linde's Kraal ........................................... 21
Figure C1: Joining process chart ...................................................................................................................... 22
Figure E1: Chart showing mapped and unmapped projects .............................................................................. 25
Figure F1: SAHRA map of Herbert PV Power Station location .......................................................................... 26
Figure F2: Comparison of CRSES R1 (purple with light green border) and DEA R1 (light green) Herbert PV
Power Station polygons ................................................................................................................................... 27
R e n e w a b l e E n e r g y E I A A p p l i c a t i o n M a p p i n g R e p o r t V e r s i o n 1 M a y 2 0 1 3
List of abbreviations/acronyms
COM_POLY Completed projects for polygons
CRSES Centre for Renewable and Sustainable Energy Studies
CSIR Council for Scientific and Industrial Research
DEA Department of Environmental Affairs
EAPs Environmental Assessment Practitioner
EIA Environmental Impact Assessment
GIS Geographic Information Systems
IPP Independent Power Producer
NC Northern Cape
NEAS National Environmental Authorisation System
PREFR1 Preferred Bidders Round 1
PREFR2 Preferred Bidders Round 2
PV Photovoltaic
R1 Round 1
R2 Round 2
REIPPPP Renewable Energy Independent Power Producer Procurement Programme
RFP Request for Proposal
SEA Strategic Environmental Assessment
SG Surveyor General
WEF Wind Energy Facility
1 | P a g e R e n e w a b l e E n e r g y E I A A p p l i c a t i o n M a p p i n g R e p o r t
V e r s i o n 1 M a y 2 0 1 3
1. Introduction
The rollout of the Renewable Energy Independent Power Producer Procurement Programme
(REIPPPP) has seen South Africa attract significant local and international interest in its renewable
energy sector. This resulted in the national Department of Environmental Affairs (DEA) receiving
numerous Environmental Impact Assessment (EIA) applications for renewable energy projects scattered
across the country. To the knowledge of the authors no map of renewable energy EIA applications has
been produced at national scale prior to this project.
The Council for Scientific and Industrial Research (CSIR), on behalf of the Department of Environmental
Affairs (DEA), hereafter referred to as the ‘client’, approached the Centre for Renewable and
Sustainable Energy Studies (CRSES), hereafter referred to as the ‘Centre’, to conduct a verification and
mapping exercise of land parcels of approximately five hundred renewable energy environmental impact
assessment (EIA) applications received by the DEA before December 2012.
2. Objectives and Scope of Work
This report describes the procedures followed in order to verify and plot site location information of
renewable energy EIA applications as provided by the client. It also describes the challenges that were
experienced, the reasons therefore, how they were resolved, and how similar challenges can be
avoided in future.
The approach was largely determined by the quality and type of site location information received from
the client.
The Centre had to adhere to the terms of reference provided by the client. These terms included the
following: plotting the EIA application locations on high resolution cadastral data and creating a clear
distinction between applications in process, already approved and those that were withdrawn/lapsed.
Furthermore, the data had to comply with the DEA’s metadata standards.
The site location information that was received from the client was of poor quality; 20% of the site
locations were lacking and only 5% of the co-ordinate information was available. The rest of the site
location information was in terms of farm names, farm numbers and farm portions. Up-to-date South
2 | P a g e R e n e w a b l e E n e r g y E I A A p p l i c a t i o n M a p p i n g R e p o r t
V e r s i o n 1 M a y 2 0 1 3
African cadastral data would thus be required to verify the data. For this purpose, the 2013 South
African AfriGIS cadastral data layer in shapefile format was provided by the client and used to verify the
data. However, in some cases, it was observed that farm names and numbers were absent or
interchangeable.
Approximately 470 EIA renewable energy applications were validated. Owing to the quality of the
information received from the client the worksheets had to be conditioned into a format compatible with
GIS software. More than 1000 single land portion entries needed to be processed.
Environmental assessment practitioners were contacted in cases where the information was either
lacking or could not be verified. They were requested to provide the correct co-ordinates or the Surveyor
General (SG) code for the proposed land portions. This process continued until, or close to, the final
submission date of this project. The delay in, or inability to obtain the necessary information from
environmental assessment practitioners was due to the fact that the information was regarded by some
practitioners to be highly sensitive and confidential. In such cases a formal letter of request for the
information from the DEA’s Director General’s Office was sent to the practitioner.
3. Methodology
The mapping methodology described in this report is based on preparing and importing a fully verified
and conditioned MS Excel spreadsheet into the ArcMap GIS software. The ArcGIS ‘Join’ tool was
subsequently used to combine the renewable energy EIA applications data with the South African
cadastral data.
The methodology was largely dependent on the accuracy and type (co-ordinates, farm names) of site
location information of the EIA applications that were in the MS Excel list received from the client. Some
of the land portion entries in the EIA application list only contained farm names, farm numbers and
portion numbers.
Data received from the client were firstly conditioned and verified before being imported into ArcMap.
During the verification process, when the raw site location information was verified against a cadastral
data layer in ArcMap, it was discovered that 18% of the data did not correspond with the latest cadastral
data.

3 | P a g e R e n e w a b l e E n e r g y E I A A p p l i c a t i o n M a p p i n g R e p o r t
V e r s i o n 1 M a y 2 0 1 3
3.1. Data Conditioning and Verification
For the EIA applications data to be compatible with the ArcMap GIS software conditioning the data of
each application entry into an acceptable Excel spreadsheet format was necessary. The verification
process was carried out in parallel with the conditioning process. Data were validated against the 2013
South African AfriGIS cadastral data as well as by contacting environmental assessment practitioners
where necessary.
The conditioning of the site location information was initially based on three fields, namely: farm name;
farm number; and farm portion. These fields were common for both the cadastral data and the EIA
applications list. Based on this the two datasets could be combined into a single layer in ArcMap once
conditioning and validation was completed.
Solar and wind energy facilities usually span a number of farms or different farm portions. In order to
achieve accurate representation and positions of the site locations, it was opted to use portion numbers
in conjunction with the farm numbers and farm names, rather than only use farm names or farm
numbers. It may be possible for different portions of the same farm to be subject to different EIA
processes for different renewable energy projects. Figure 1 depicts a farm (outlined in blue) for which
only one portion (highlighted in yellow) was subject to an EIA for renewable energy.
Figure 1: A multi-portioned farm with one portion identified for EIA
For each EIA project with its individual DEA reference number, project name, etc., every farm portion
was recorded as an individual entry in an MS Excel spread sheet. The farm names, numbers and
portion numbers were then validated using the 2013 South African AfriGIS cadastral data layer in
ArcMap.

4 | P a g e R e n e w a b l e E n e r g y E I A A p p l i c a t i o n M a p p i n g R e p o r t
V e r s i o n 1 M a y 2 0 1 3
A simple method called “flagging” was used to identify farm portions, numbers and names that
corresponded with, and those that did not correspond with, the cadastral data layer. All farm portions,
farm numbers and farm names were individually validated. This method was based on highlighting
(“flagging”) rows in MS Excel using different colours. Entries with location information corresponding
with the cadastral data layer were simply highlighted green, while those that did not correspond were
highlighted in various different colours. See Appendix A for further information.
Reasons for entries not corresponding with the cadastral data layer include:
Incorrect spelling of farm names;
Farm portions not represented in the cadastral data layer;
Farm name and number combinations not corresponding with cadastral data layer;
Site location information being vague. With a project location, for example, listed as in the
“Peddie area” as opposed to a specific land portion.
In order to verify a farm portion, its farm name together with its farm number was searched on the
cadastral layer in ArcMap. The attribute table of the layer was opened and “select by attributes” was
invoked. This feature in ArcMap returned the exact farm number and farm name that was typed in the
“select by attributes” field. If an application’s farm number and farm name were not found or the search
returned empty, either the farm number or the farm name was known to be incorrect. In most cases it
was discovered that the farm names were misspelt.
To determine whether the farm number is the variable that was incorrect, the farm number would be
searched together with a field titled “AREA_TABLE”. The latter contains the area or province in which a
certain portion is situated. Since the area information was provided in the provided data it could be used
to narrow down the search to only the applicable area. The farm name closest to the name that was
listed in the applications list was then selected and highlighted. Since several farm portions usually form
part of the same EIA application it was assumed that if the selected farm portion is adjacent to other
portions falling under the same EIA application, it was the correct portion.
In the cadastral layer it was only possible to search for one area or province at a time in which the
‘unknown’ land parcels could be located. This created problems when applying the aforementioned
verification process for project applications situated near the borders of provinces as a project might be
situated on provincial borders, but have only one province listed. This was especially true for entries
with no farm name or where the farm name was provided as only a farm number. A search for the farm

5 | P a g e R e n e w a b l e E n e r g y E I A A p p l i c a t i o n M a p p i n g R e p o r t
V e r s i o n 1 M a y 2 0 1 3
number in the “AREA_TABLE” for the province the application was listed in return empty. It is however
known that for wind EIA applications, if the above mentioned problem occurs, there are probably two
provincial borders near which a farm or portion could be located. These are the Eastern Cape/Western
Cape, and Northern Cape/Western Cape borders.
Some of the site locations for the farm portions received from the environmental consultants could not
be represented in the cadastral data. It was decided that the co-ordinates of those points would be
recorded and that the entry would be entered in as a point in ArcMap, rather than as a polygon
describing a land parcel/erf. Co-ordinates were also recorded in other cases, namely, where the EIA
was conducted in highly built-up areas (e.g. in industrial development zones).
In the case where the EIA application entries only had farm portions and farm numbers, or only farm
names, the validation of those farms was problematic. When these details were searched in the
cadastral data, there would be several farms in South Africa with exactly the same farm numbers and
farm portions, or the same farm names. In cases where it was impossible to identify the correct site
locations, these types of entries were “flagged”. Figure 2 illustrates this how a search for a single farm
name results returns with several farms in South Africa.
Figure 2: A farm name search in cadastral data layer returning several results in South Africa.
A few discrepancies were also found when it came to the allocation of the DEA reference numbers. For
instance in the case where amendments were made to the EIA application, or to the authorisation

6 | P a g e R e n e w a b l e E n e r g y E I A A p p l i c a t i o n M a p p i n g R e p o r t
V e r s i o n 1 M a y 2 0 1 3
documentation, new reference numbers were assigned to the projects. See Appendix B for more
information.
A new field, “MAJOR_REGION”, was created in the EIA applications projects list. This field was used to
narrow down location of entries with missing information and also used to combine the information from
the 2013 South African AfriGIS cadastral layer and the conditioned and verified EIA application MS
spreadsheet.
For all entries that were flagged as ‘missing data’ the environmental consultants that undertook these
EIAs were contacted. The environmental consultants were provided with an MS Excel spreadsheet
containing the DEA reference number and project title and were asked to provide details or co-ordinates
to the exact location of each farm portion under that specific project title.
3.2. Joining Process
The joining process constituted the second phase of the project. Here the various EIA application land
parcels were fully integrated with the cadastral data information in ArcGIS. This meant that all the
recorded information in the Excel sheets needed to be joined to the correct land parcels as contained in
the cadastral GIS layer. One way of doing this was to export the validated and conditioned MS Excel
sheet into ArcGIS and thereafter use the “Join” tool to combine the two tables. The results of this
process however proved cumbersome and a new method of pre-joining the data in Excel and then
importing it into the cadastral layer in ArcGIS was selected.
The validated and conditioned MS Excel sheet and cadastral layer data were exported to Excel and
joined based on coincident labels (farm name, farm number, portion number and major region). Once
the data sheets were joined using this method the newly created joined Excel data was imported back
into the cadastral layer which now contained not only the cadastral layer data, but also the associated
EIA application data in the attributes.
7 | P a g e R e n e w a b l e E n e r g y E I A A p p l i c a t i o n M a p p i n g R e p o r t
V e r s i o n 1 M a y 2 0 1 3
3.2.1. The Joining Method and Discrepancies
The above mentioned method was the simplest available way of combining the cadastral data with the
DEA EIA applications data. A verification of the accuracy of the joining process was still needed. A
commercial Excel add-in ‘DigDB’ was used to join the two Excel data sets and also check the validity of
the join. This initially entailed working with small quantities of data to check and refine the add-in
algorithm before applying the method to the complete datasets.
For optimal accuracy of the tool, it was important to separate the farm portions into those that had farm
names, those that did not have farm names and those that had only co-ordinates. In the add-in tool, a
merge application was used to combine the Excel sheets and the merge was based on three fields. For
those entries that had a farm name these fields were: farm name; farm number; and farm portion. For
those entries that had a major region and no farm name these fields were farm number and farm
portion. The farm portions that had only co-ordinates were added into directly ArcMap as point data.
It was found that the order in which the merge fields were listed in DigDB affected the efficiency of the
tool in merging the two data sheets. The first entry would be the first condition that the merge would be
based on and the second entry the second condition, and so forth. The strategy was to use farm
number and farm portion as the first and second fields, respectively, as these were regarded as the
project ‘finger prints’.
It was observed that in the cadastral data a land parcel would have more than one polygon (all polygons
associated with that land parcel had the same “SG_CODE” but different “AG_CAD_ID”), meaning that a
single entry would be associated with more than one polygons in ArcGIS. This was observed in cases
where land portions have been subdivided for the registration of servitudes, and all resulting portions
retained the original portion number. In some instances more than one farm portion shared the same
farm name, farm number and farm portion number but had different geographical locations.
When the two tables were joined with the Excel add-in tool, DigDB, the tool listed the number of
matches for each entry. In cases where an entry had more than two matches, those were individually
assessed and validated.
Figure 3 illustrates three land potions with the same information due to servitudes subdividing its original
extent.

8 | P a g e R e n e w a b l e E n e r g y E I A A p p l i c a t i o n M a p p i n g R e p o r t
V e r s i o n 1 M a y 2 0 1 3
Figure 3: Farm portion that has multiple polygons but has the same SG code
3.2.2. Results and Validation
For the purpose of presenting the mapping results, the Preferred Bidders from Round 2 dataset will be
discussed. The same process was also followed for the rest of the data (i.e. Preferred Bidders Round 1,
Pending, Completed, etc.).
As mentioned before, two merge processes, one based on farm name and the other on major region,
resulted in 2 Excel sheets with the combined information. These datasets were subsequently imported
into ArcGIS.
The new tables imported into ArcGIS were joined to the cadastral data layer, resulting in two new layers.
The join was based on the “AG_CAD_ID” common to both the exported tables and the cadastral layer.
In order to produce one shapefile from the Preferred Bidders R2 dataset, the two abovementioned
layers were merged. Figure 4 illustrates two layers for the Amakhala Emoyeni wind energy facility
(WEF) prior to being joined and Figure 5 shows the two layers after being joined in ArcGIS.

9 | P a g e R e n e w a b l e E n e r g y E I A A p p l i c a t i o n M a p p i n g R e p o r t
V e r s i o n 1 M a y 2 0 1 3
Figure 4: Preferred bidders R2 layers of Amakhala Emoyeni WEF farms with (blue) and without (green) names.
Figure 5: Preferred bidders R2 merged layers of Amakhala Emoyeni WEF

10 | P a g e R e n e w a b l e E n e r g y E I A A p p l i c a t i o n M a p p i n g R e p o r t
V e r s i o n 1 M a y 2 0 1 3
The joining procedure was used for all other category layers and successfully completed. Figure 6
shows the farm portions for the completed EIA project portions for the whole of South Africa.
Figure 6: Completed EIA projects in South Africa
It is important to note that some of the received and mapped Renewable Energy EIA applications
include land portions on which only power lines are proposed. In order to avoid adding columns or
irrelevant information to the data and to adhere to the DEA data standard, the amount of power that is
listed in the “MEGA_WATT” field when the “PROJECT_TYPE” is listed as a power line is treated not as
an output power in megawatts (MW) but as the voltage carried by the power lines in kilovolts (kV).
All listed EIA application project statuses were mapped, including the shape files for “Pending”,
“Completed”, “Preferred Bidders R1 and R2” and the “Withdrawn or Lapsed” statuses. Using the built in
‘Join’ tool in ArcGIS. A single layer was produced comprising all the EIA applications that could be
found in the AfriGIS cadastral data and those that were obtained from the respective environmental
consultants.

11 | P a g e R e n e w a b l e E n e r g y E I A A p p l i c a t i o n M a p p i n g R e p o r t
V e r s i o n 1 M a y 2 0 1 3
4. Findings
By unpacking and processing 705 project titles and their respective project reference numbers as
received from DEA, 1 789 individual farm portion entries were successfully verified. A resulting 2 344
polygons were mapped. The reason for so many more polygons being mapped than land portions
identified is a result of the split of land portions due to a river or servitude passing through. All split
polygons of the same farm portions have the same particulars except for the “AG_CAD_ID”, which is
used to identify an individual polygon.
Although 705 reference numbers were received from DEA (including projects that could not be
mapped), a single shapefile layer of 469 renewable energy projects was produced.
The difference between the quantity of reference numbers received and projects mapped is due to
various issues that were encountered throughout the EIA application mapping process and include:
Some of the projects were discontinued by their respective developers but were not listed as
such in the DEA EIA Applications List. This information was difficult to obtain and therefore not
mapped. These amounted to 19 projects;
It was impossible to verify some projects in time as information was still outstanding from the
relevant environmental practitioners. Other environmental practitioners could not be contacted
for verification of site location information. See Appendix D for further information; and
A major contributor to this difference (705 versus 470) was the number of projects for which the
authorisations were amended. Each time a project was amended it was allocated a new project
reference number; usually the original number would be appended with a forward slash and a
number indicating iteration of the amendment.
It was decided that amended projects be excluded from the application mapping process as they would
cause confusion and duplication. Only the latest project reference number (the one ending with a
forward slash and the highest number) was thus used. The overall number of amendments in the
applications list that was provided by the DEA was 160. See Appendices D and E for further information.
The foregoing paragraphs describe the care that was taken in order to provide an accurate Renewable
Energy EIA Applications Map of South Africa. It was very important to apply and establish a high degree
of certainty when it came to the input data (EIA Applications Project List) as any inaccuracy in it would
affect the resulting map, thus rendering some aspects of the map inaccurate.
12 | P a g e R e n e w a b l e E n e r g y E I A A p p l i c a t i o n M a p p i n g R e p o r t
V e r s i o n 1 M a y 2 0 1 3
Although this was the first project of its kind to be concluded at a national scale, it was very important to
measure the accuracy of the newly developed map against some form of reference map.
A map showing the spatial locations of all Round 1 Preferred Bidders developed in-house by the DEA’s
GIS department was used to this end. It was found that there were some discrepancies between the
map produced by the Centre and map produced by DEA. Differences were mainly around the exclusion
of certain land portions but the locations of the projects were consistent (Please see Appendix F for
further information). Inaccuracies were also found between the two datasets in the field “MEGA_WATT”.
For some projects in the DEA dataset power outputs were not recorded and others were incorrectly
recorded.
A thorough analysis was undertaken in order to evaluate which farm portions were satisfactorily
accurate between the two layers. It was found that the layers developed by the Centre were sufficiently
accurate.
It is concluded that the project not only resulted in developing the first Renewable Energy EIA
Applications Map for South Africa, but also led to the development of fairly accurate and simple
methodologies for future implementation.
The newly developed Renewable Energy EIA Applications Map for South Africa and a map that is
integrated with the national grid are shown in Figures 8 through to 11.

13 | P a g e R e n e w a b l e E n e r g y E I A A p p l i c a t i o n M a p p i n g R e p o r t
V e r s i o n 1 M a y 2 0 1 3
Figure 7: Renewable Energy EIA Application map.

14 | P a g e R e n e w a b l e E n e r g y E I A A p p l i c a t i o n M a p p i n g R e p o r t
V e r s i o n 1 M a y 2 0 1 3
Figure 8: Renewable energy EIA application map with the Eskom national transmission grid
15 | P a g e R e n e w a b l e E n e r g y E I A A p p l i c a t i o n M a p p i n g R e p o r t
V e r s i o n 1 M a y 2 0 1 3
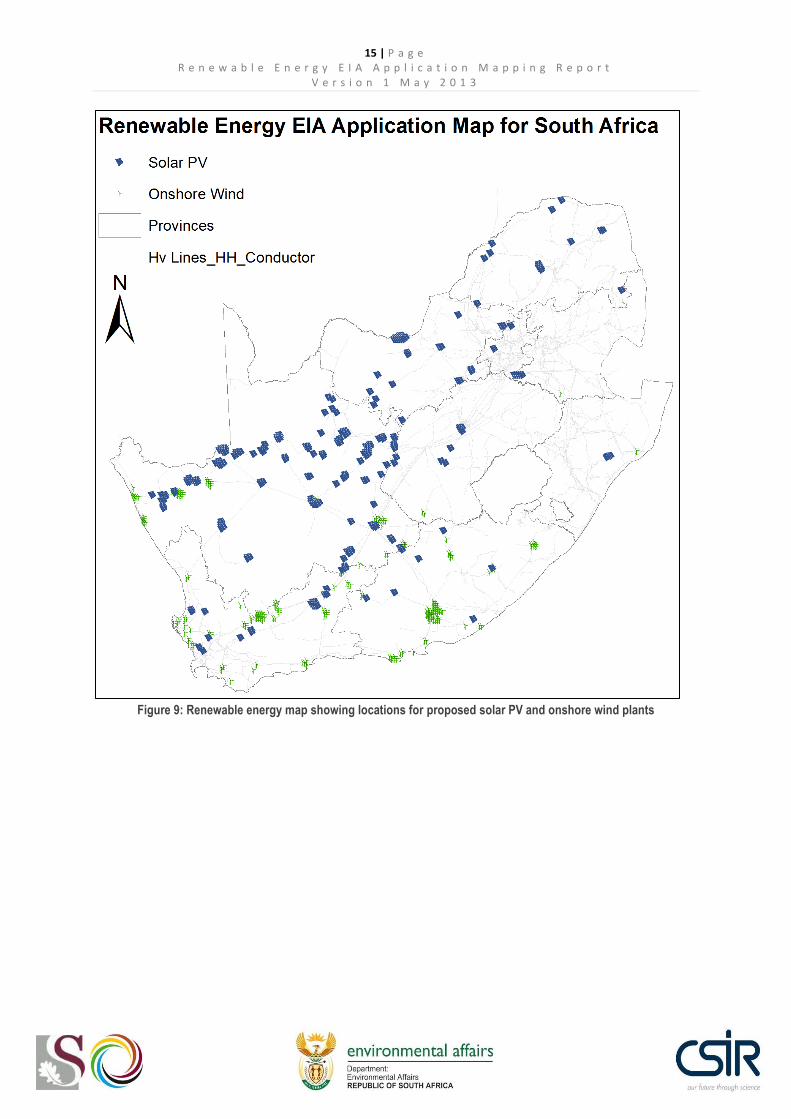
Figure 9: Renewable energy map showing locations for proposed solar PV and onshore wind plants

16 | P a g e R e n e w a b l e E n e r g y E I A A p p l i c a t i o n M a p p i n g R e p o r t
V e r s i o n 1 M a y 2 0 1 3
Figure 10: Proposed solar PV and onshore wind EIA applications

17 | P a g e R e n e w a b l e E n e r g y E I A A p p l i c a t i o n M a p p i n g R e p o r t
V e r s i o n 1 M a y 2 0 1 3
5. Conclusions and Recommendations
A total of 1 789 farm portion entries was processed and a map resulting of 2 433 entries and 470 EIA
applications was developed. As of 15 March 2013, 86 entries of farm portions were outstanding, 19 of
which were placed on hold, 41 had incorrect or no environmental practitioners’ details and 26 were
awaiting response. (NOTE: the above numbers refer to individual farm portions, not individual projects.)
Only the latest versions of projects that were amended were mapped.
All renewable energy EIA application projects were mapped to one shapefile, where each of the
different renewable energy technologies can be isolated and analysed.
For this and future versions of the Renewable Energy EIA applications map of South Africa to be
satisfactorily accurate, it must be ensured that EIA application data is provided and captured accurately
and in terms of the latest available cadastral information. To this end the following recommendations are
made:
The same cadastral information used to capture, verify and map EIA applications has to be
available to developers and consultants when completing the EIA application form.
The following data fields should be requested in the EIA application form and captured by the
EIA case officers onto NEAS:
Project Name
Proponent (with contact details)
Environmental Assessment Practitioner (EAP) (with contact details)
Land Owner (with contact details)
DEA Case Officer (with contact details)
Project Reference Number (DEA Reference Number and NEAS Reference Number)
Technology (Preferred and Alternatives)
Installed Capacity
Province
District Municipality
Local Municipality
Town
Farm Name
Farm Number
18 | P a g e R e n e w a b l e E n e r g y E I A A p p l i c a t i o n M a p p i n g R e p o r t
V e r s i o n 1 M a y 2 0 1 3
Portion Number
SG Code
An online platform from which a standard map including cadastral information should be
accessible to all EAPs on the internet. From this platform a map with a predefined resolution
should be exported by EAPs and submitted to the competent authority with the EIA application
form;
Data capturing by case officers should be based on the same cadastral data as mentioned
above and verified by an automatically generated map with detailed cadastral information of the
entered data compared to the map submitted with the EIA application;
It is recommended that the competent authority case officer undertakes to update the EIA
Applications List database as soon as any changes are reported or observed for a specific
application, especially when it involves project reference numbers, change in case officer,
change in project status, etc.
The simple and straightforward methodologies devised are recommended for any other type of
mapping application of this nature that may be conducted. The simplicity of these methods
makes it easy to amend or update the developed map whenever needed, without having to
carry out laborious tasks.

19 | P a g e R e n e w a b l e E n e r g y E I A A p p l i c a t i o n M a p p i n g R e p o r t
V e r s i o n 1 M a y 2 0 1 3
Appendix A: Flagging colours
GREEN Good
ORANGE Does not correspond (farm name missing, number incorrect)
BLUE Able to find but portion not as indicated i.e. (the AfriGIS and SG layers differ in
farm number, but the location and polygon is the same)
RED No location data
YELLOW Change/condensing of portions only
LIGHT PURPLE Portion number changed
ITALICS Farm name spelling corrected
BOLD ITALICS Farm name not given / farm number not given
PINK Farm portions not associated with any polygon
20 | P a g e R e n e w a b l e E n e r g y E I A A p p l i c a t i o n M a p p i n g R e p o r t
V e r s i o n 1 M a y 2 0 1 3
Appendix B: Discrepancies in DEA reference numbers
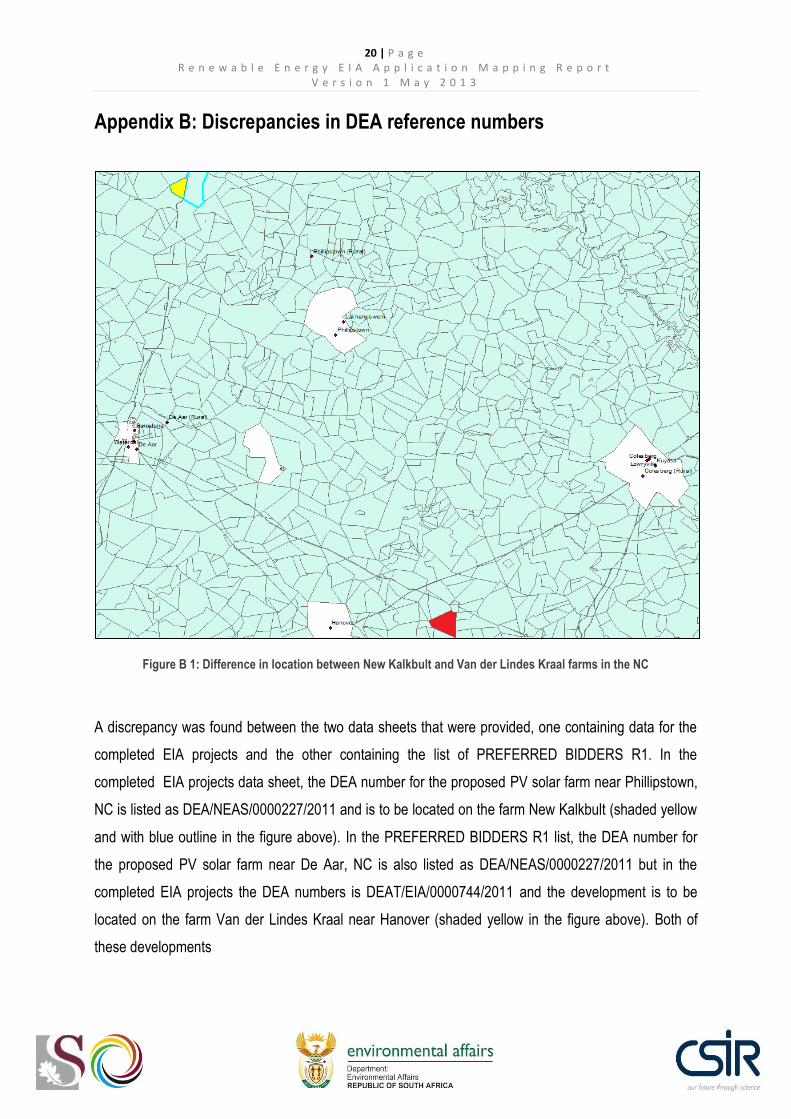
Figure B 1: Difference in location between New Kalkbult and Van der Lindes Kraal farms in the NC
A discrepancy was found between the two data sheets that were provided, one containing data for the
completed EIA projects and the other containing the list of PREFERRED BIDDERS R1. In the
completed EIA projects data sheet, the DEA number for the proposed PV solar farm near Phillipstown,
NC is listed as DEA/NEAS/0000227/2011 and is to be located on the farm New Kalkbult (shaded yellow
and with blue outline in the figure above). In the PREFERRED BIDDERS R1 list, the DEA number for
the proposed PV solar farm near De Aar, NC is also listed as DEA/NEAS/0000227/2011 but in the
completed EIA projects the DEA numbers is DEAT/EIA/0000744/2011 and the development is to be
located on the farm Van der Lindes Kraal near Hanover (shaded yellow in the figure above). Both of
these developments

21 | P a g e R e n e w a b l e E n e r g y E I A A p p l i c a t i o n M a p p i n g R e p o r t
V e r s i o n 1 M a y 2 0 1 3
were proposed by Scatec Solar. The distance between the two farms portions where the developments
are proposed is about 114 km SSW from New Kalkbult (yellow) to Van der Lindes Kraal (red). It is wise
to believe that it is not possible for solar farm developments to have the same DEA number as they are
very far apart, as can be seen on the image above.
Figure B2: Showing the distance between New Kalkbult and Van der Linde's Kraal

22 | P a g e R e n e w a b l e E n e r g y E I A A p p l i c a t i o n M a p p i n g R e p o r t
V e r s i o n 1 M a y 2 0 1 3
Appendix C: Joining process chart
Figure C1: Joining process chart

23 | P a g e R e n e w a b l e E n e r g y E I A A p p l i c a t i o n M a p p i n g R e p o r t
V e r s i o n 1 M a y 2 0 1 3
Appendix D: Challenges and problems experienced
Challenges experienced while conducting the validation process for the EIA applications list
One of the major issues discovered in the early stages of the project was that some of the site
locations that were provided by the DEA had farm names that were misspelt. Farm names from
one province or project would be confused with others due to similarities in their names, for
example, a farm name of Riet Fontein would be confused with a farm name of Rietfontein, or
names would be outright incorrectly spelled, farm numbers were not as indicated and these
resulted in lack of proof that the information was correct, in which case the responsible
environmental practitioners were contacted;
Some of the farm portions, especially those that were part of projects that were situated near
the provincial borders of South Africa, were assigned to an incorrect province. A wind project
near Sutherland would have multiple portions even in the Western Cape but would be
designated “NC” not, say, NC and WC or NC/WC;
It was also discovered that after making amendments, projects were, in some cases, awarded
new project reference numbers. These new numbers were however not updated to the DEA
EIA Applications Database nor to their applications list dated 12/2012. The environmental
practitioners would concede that the DEA reference had changed or initially they would not
recognise it at all until they search their records;
In projects that underwent several amendments, only the records of the last amendment were
taken as definitive, in order to avoid duplication or capturing outdated information;
Sometimes a project title would be in conflict with the project. The project title of SOLAR PV
would have a project type for WIND;
There was no clear distinction what was meant by portion RE (remaining extent). This was
assumed to be the remaining extent of the farm, therefore taken to be portion zero, as all other
portions would be subdivisions of this;
In total, 1789 entries of farm portions were processed and nearly 40% (699) of these entries
were missing (site location was not accurate or not supplied); and
As of 15 March 2013, 86 entries of farm portions were outstanding, 19 of which were placed on
hold, 41 had incorrect or no environmental practitioners’ details and 26 were awaiting response.
(NOTE: the above numbers refer to individual farm portions, not individual projects.)
Problems encountered when information was sourced from the environmental practitioners
Some companies refused to verify or provide any information without an official verification
letter from the Department of Environmental Affairs validating the Centre’s involvement in the
project;
Contact details of some of the practitioners were not provided at all. It was therefore not
possible to verify the information provided or to request omitted information.
24 | P a g e R e n e w a b l e E n e r g y E I A A p p l i c a t i o n M a p p i n g R e p o r t
V e r s i o n 1 M a y 2 0 1 3
The contact details provided for some of the environmental assessment practitioners were
incorrect;
Some of the environmental assessment practitioners who were said to have conducted some of
the EIAs did not recognise the projects. In the case of Enviro Dynamics Environmental
Consultants, the environmental assessment practitioner indicated in the original spreadsheet
said that not only does he not recognise the project, but the company is based in the USA and
does not have any projects in South Africa;
In one case, the contact details provided were for a library software company and not for an
environmental assessment company. This again made it impossible to obtain the required
information;
It was found from the environmental practitioners that some of the projects were placed on hold
or withdrawn. These project have however not been accordingly updated in the DEA EIA
Applications Database; and
Further discrepancies were caused by selecting a completely wrong farm portion. A thorough
analysis was carried out at the Centre in order to determine whether the correct portion was
chosen.
There were a few discrepancies that were found between the DEA EIA applications for the first round
and the Centre’s Application Map for the first round. Some of the farms in the CRSES’ map were not
mapped yet as response from the environmental practitioners is still awaited. This might cause some of
the discrepancies, as the polygons do not overlay each other.
25 | P a g e R e n e w a b l e E n e r g y E I A A p p l i c a t i o n M a p p i n g R e p o r t
V e r s i o n 1 M a y 2 0 1 3
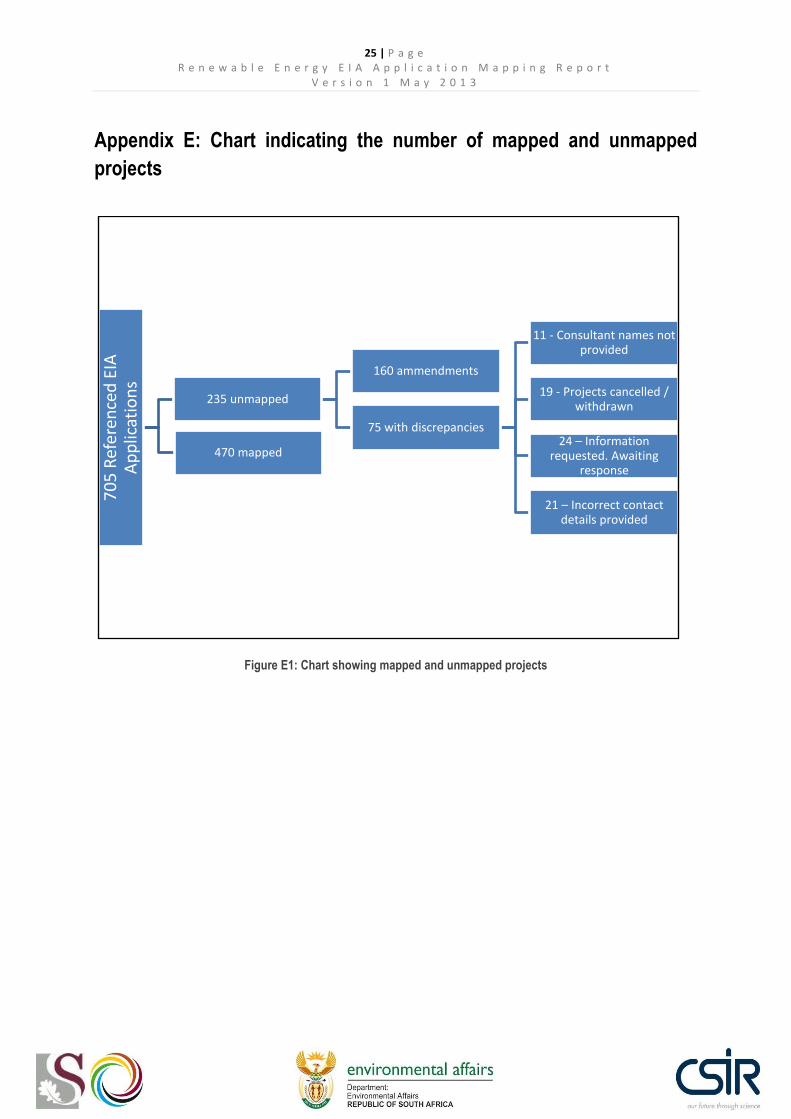
Appendix E: Chart indicating the number of mapped and unmapped
projects
Figure E1: Chart showing mapped and unmapped projects
70
5 R
efer
ence
d E
IA
Ap
plic
atio
ns
235 unmapped
160 ammendments
75 with discrepancies
11 - Consultant names not provided
19 - Projects cancelled / withdrawn
24 – Information requested. Awaiting
response
21 – Incorrect contact details provided
470 mapped

26 | P a g e R e n e w a b l e E n e r g y E I A A p p l i c a t i o n M a p p i n g R e p o r t
V e r s i o n 1 M a y 2 0 1 3
Appendix F: Comparison between DEA R1 shapefile and CRSES
R1 shapefile
Figure F1: SAHRA map of Herbert PV Power Station location
Figure F1 is taken from the SAHRA Paleontological Heritage Statement Report which shows the exact location of
the proposed Herbert PV Power Station near Douglas, in the Northern Cape. This map location was then
compared to the two layers developed by the Centre (purple) and the DEA (light green) as shown in Figure F1,
for the same project.
When the Figure F1 and Figure F2 were compared it was established that the purple (Centre) layer was more
accurate to determining the location of the Herbert PV Power Station which is indicated by a light blue outline in
Figure F2.

27 | P a g e R e n e w a b l e E n e r g y E I A A p p l i c a t i o n M a p p i n g R e p o r t
V e r s i o n 1 M a y 2 0 1 3
Figure F2: Comparison of CRSES R1 (purple with light green border) and DEA R1 (light green) Herbert PV Power Station polygons