renewable energy in india: from the margins to mainstream
TRANSCRIPT

Renewable Energy in India:
From the Margins To
Mainstream
Rangan Banerjee Forbes Marshall Chair Professor
Department of Energy Science and Engineering IIT Bombay
Lecture at Loughborough University - May 22, 2015
2
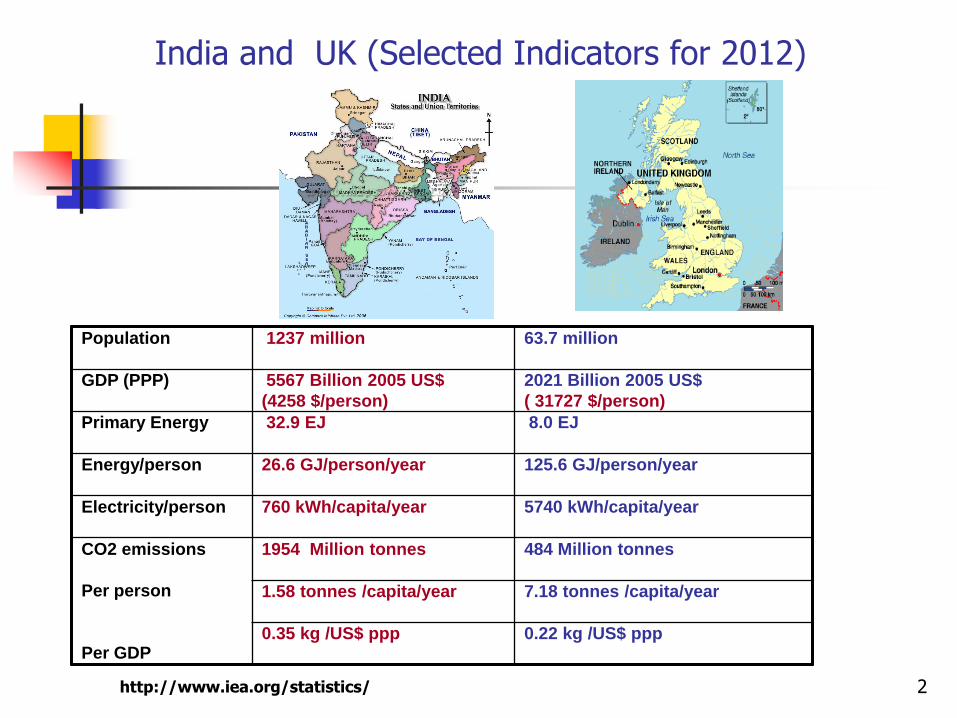
India and UK (Selected Indicators for 2012)
Population 1237 million 63.7 million
GDP (PPP) 5567 Billion 2005 US$
(4258 $/person)
2021 Billion 2005 US$
( 31727 $/person)
Primary Energy 32.9 EJ
8.0 EJ
Energy/person 26.6 GJ/person/year 125.6 GJ/person/year
Electricity/person 760 kWh/capita/year
5740 kWh/capita/year
CO2 emissions
Per person
Per GDP
1954 Million tonnes 484 Million tonnes
1.58 tonnes /capita/year
7.18 tonnes /capita/year
0.35 kg /US$ ppp
0.22 kg /US$ ppp
http://www.iea.org/statistics/

Energy End Uses
Boiler, Geyser Fluid heated Heating
Fans,AC, refrig Space Cooled Cooling
motors Shaft work Motive Power
Cycle, car, train,
motorcycle, bus
Distance
travelled
Transport
Incandescent
Fluorescent, CFL
Illumination Lighting
Chullah, stove Food Cooked Cooking
Device Energy Service End Use

Carbon Dioxide Emissions
Kaya identity: Total CO2 Emissions
= (CO2/E)(E/GDP)(GDP/Pop)Pop
CO2/E – Carbon Intensity
E/GDP- Energy Intensity of Economy
Mitigation – increase sinks, reduce sources- aforestation, fuel mix,energy efficiency, renewables,nuclear, carbon sequestration
Adaptation

Source: IPCC, 2011 5

Renewables – Increasing ?
What is the share of renewables in India’s supply mix?
How has this changed over the last 25 years?
What will be the renewables share after 20 years?
6
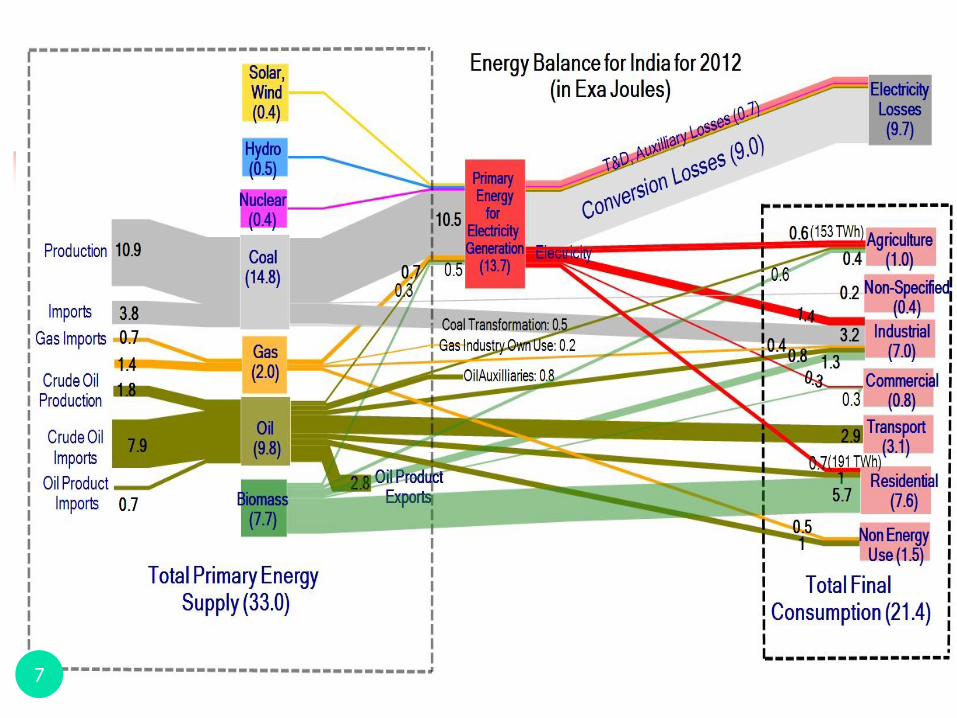
7

Installed Capacity - India
2,67,637 MW total installed capacity
Source: Ministry of Power and MNRE, Govt. of India
8
Wind power, 23444
Small Hydro power, 4055
Biomass, 1410
Bagasse, 3008
Waste to Power, 115
Solar Power , 3744
35777 MW total installed capacity
2015 (as on 31.03.15)
Coal, 164636.0
Nuclear, 5780
Natural Gas, 23062
Hydro (Res.), 41267
Diesel, 1200
Renewables, 31692

Coal Production in India
0
50
100
150
200
250
300
350
400
450
500
1870 1890 1910 1930 1950 1970 1990 2010
Year
Annual P
roduction(
Million T
onnes)
Production

Coal Reserves (India)
0.00
500.00
1000.00
1500.00
2000.00
2500.00
3000.00
3500.00
4000.00
4500.00
1930 2030 2130
Pro
du
cti
on
(m
t)
Year
267210 mt
105820 mt
61000 mt
30000 mt
Actual production mt

Power Plant capacity additions
0
50000
100000
150000
200000
250000
30000019
51
1953
1955
1957
1959
1961
1963
1965
1967
1969
1971
1973
1975
1977
1979
1981
1983
1985
1987
1989
1991
1993
1995
1997
1999
2001
2003
2005
2007
2009
2011
MW
Target (MW) Achieved (MW)8th Plan - 11th Plan
10% 13%15%
13%4%
4%
4%
8%
9%
10%
5%
15%
Coumpund annual Growth Rate of Actual Installed Capacity,every 5 Year Plan

Power Generation – Supply mix
12
Thermal
Nuclear
Renewables (incl Hydro)
40%
60%
80%
20%
100%
0 100%
0
TIFAC, 2013

Primary Energy Mix
13
Renewables and Nuclear
Coal
Oil and Gas
20%
40%
60%
80%
100%
TIFAC, 2013

14
Renewable installed capacity and generation
* as on 28.02.2015 MNRE website: www.mnre.gov.in
Installed
Capacity*
Estimated
Capacity factor
Estimated
Generation
(GWh) (MW)
Wind 22645 14% 27771
Biomass Power 1365 70% 8371
Bagasse 2818 60% 14813
Cogeneration
Small Hydro 4025 40% 14105
Waste to Energy 115 50% 504
Solar PV 3383 19% 5630
Total 34351 25% 71195

Nuclear Plants in India
Source:NPCIL

Renewable Share in Power
0
2
4
6
8
10
12
14
2001 2002 2003 2004 2005 2006 2007 2008 2009 2010 2011 2012 2013
Year
Sh
are
of
tota
l %
Renewable Installed Capacity
Renewable Generation
Nuclear generation Nuclear Installed Capacity
16

Historical Household Electrification Rates
GEA, Chapter 19
17

Energy and Peak Deficit
18 Source: CEA, 2011

Share of Energy Imports - India
19
0.0
5.0
10.0
15.0
20.0
25.0
30.0
1970
1972
1974
1976
1978
1980
1982
1984
1986
1988
1990
1992
1994
1996
1998
2000
2002
2004
2006
2008
2010
Import Share (INDIA)

India Abatement Curve
Source: McKinsey

Need for Alternatives
Fossil fuel reserves limited
India - 17% of World population, 5% of primary energy
Present pattern – predominantly fossil based (87% comm, 64% total)
More than 40 % households unelectrified
Linkage between energy services and quality of life

Rx for Energy Sector
Paradigm shift – focus on energy services
‘Shortage of supply’ to ‘longage of demand’
Present energy systems unsustainable- resources, climate change, environmental impact
Transition to renewables, clean coal, nuclear, efficiency

Goals for the Energy sector
#1 Provide Access to “convenient” energy services, affordable
#2 Make new technologies attractive to investors
#3 Develop sustainable energy systems – Climate, local emissions, land, water

Renewable Energy Options
Wind
Solar Small
Hydro Biomass
Tidal
Energy
Wave Energy
Ocean Thermal
Energy
Solar Thermal
Solar
Photovoltaic
Geothermal*

25
End-uses
Cooking Transport Electricity Heating Cooling
Cooling Motive
Power Lighting Heating

26
Renewable installed capacity and generation
*as on 28.02.2015 MNRE website: www.mnre.gov.in
Installed
Capacity*
Estimated
Capacity factor
Estimated
Generation
(GWh) (MW)
Wind 22645 14% 27771
Biomass Power 1365 70% 8371
Bagasse 2818 60% 14813
Cogeneration
Small Hydro 4025 40% 14105
Waste to Energy 115 50% 504
Solar PV 3383 19% 5630
Total 34351 25% 71195

Solar Power : Potential and Cost
Solar Insolation and area required = 2500 sq.km
= 625 sq.km
Source: World Energy Outlook – 2008, International Energy Agency

28

Wind Power
22600 MW installed
Single machine upto 2.1 MW
Average capacity factor 14%
Capital cost Rs 60 million/MW, Rs 5-6/kWh (cost effective if site CF >20%)
India 103000 MW (potential estimated )
Growth rate 30% per year
Satara, Maharashtra
29

Small Hydro Power
Classification - Capacity
-Micro less than 100 kW
Mini 100 kW - 3 MW Small 3 MW - 15 MW
Micro and Mini - usually isolated,
Small grid connected
Heads as low as 3 m viable
Capital Cost Rs 50-60 millions/MW ,
Rs 3.50-4.50/kWh
Growth rate 7%/year
200 kW Chizami village, Nagaland
Aleo (3MW) Himachal Pradesh

Geothermal/OTEC/Tidal/Wave
World Cost Estimates
Geothermal COMMERCIAL 8240 MW 4c/kWh
$2000/kW
No Indian experience
50 MW plant J & K planned
Tidal PROTOTYPE 240 MW
FRANCE
LF 20%
No Indian experience (3.6MW planned Sunderbans)
OTEC PROTOTYPE 50 kW
210 kW
NELHA
India 1MW gross plant under construction
Wave Energy
PROTOTYPE < 1MW
Grid Connected
India 150kW plant Thiruvananthpuram
31

32
Map of India showing the geothermal provinces

OTEC plant schematic
33

Mooring Arrangement
34

BIOMASS
THERMOCHEMICAL BIOCHEMICAL
COMBUSTION GASIFICATION PYROLYSIS
RANKINE CYCLE
PRODUCER GAS
ATMOSPHERIC PRESSURISED
FERMENTATION DIGESTION
BIOGAS ETHANOL
Duel Fuel SIPGE Gas Turbines
Biomass Conversion Routes
35

Biomass Gasifier
Solar PV + Battery
65,000 1,25,000
90,000 1,55,000
1,15,000 1,90,000
Cost of Electricity Generation
Capital cost Rs/kW

Biomass Power
Higher Capacity factors than other renewables
Fuelwood, agricultural residues, animal waste
Atmospheric gasification with dual fuel engine -
1 MW gasifier - largest installation
Combustion – 5-18 MW
Rs 5-6/kWh
Kaganti Power Ltd. Raichur Distt. A.P. 7.5 MW
100 kWe Pfutseromi village, Nagaland
37

Biomass Gasifier Example
Arashi HiTech Biopower, Coimbatore
1 MW grid connected
100% producer gas engines
Two gasifiers – coconut shells, modified to include other biomass
Chilling producer gas with VARS operated on waste heat 38

Biogas
45-70% CH4 rest CO2
Calorific value 16-25MJ/m3
Digestor- well containing animal waste slurry
Dome - floats on slurry- acts as gas holder
Spent Slurry -sludge- fertiliser
Anaerobic Digestion- bacterial action
Family size plants 2m3/day
Community Size plants 12- 150 m3/day
Rs 12-14000 for a 2m3 unit
Cooking, Electricity, running engine Pura, Karnataka 39

0.5T/hr
Feed water
Process
Process
2 ata
~
STEAM
TURBINE
2.5 MW
6 ata
BAGASSE
58 T/hr 22 ata
330o C
4.5T/hr 27T/hr
26T/hr
Schematic of typical 2500 tcd Sugar factory
Flashed
Condensate
PRDS
PRDS
MILLING
0.5T/hr
FEED
WATER
BOILER
40

Feed water
Con
dens
er
2 ata
PROCESS
75 TPH, 65
ata, 480O
C
Process
Process
4.5 TPH
~
6 ata
BAGASSE (Alternate fuel)
2 ata
BFP
13 MW
BOILER
1.0 MW
Mill
drives
9.5 MW
Power export
2.5 MW
Captive
load
PROCESS
PROPOSED PLANT CONFIGURATION: OPTION 2
STEAM
TURBINE
CONDENSER
ESS
41

#PV system
Grid connected 3 MW PV plant in Karnataka http://optimal-power-solutions.com
42

Solar Mission- JNSM Targets
S.No. Application segment Target for Phase I
(2010-13)
Target for Phase
II (2013-17)
Target for Phase
III (2017-22)
1. Solar collectors 7 million sq
meters
15 million sq
meters
20 million sq
meters
2. Off grid solar
applications
200 MW 1000 MW 2000 MW
3. Utility grid power,
including roof top
1000-2000 MW 4000-10000 MW 20000 MW
43

Megawatt size grid solar power plants – India Project Developer
Project site
Capacity (MW)
PV Technology
Operation in Days
Generation in MWh
WBGEDCL* Jamuria, Asansol, West Bengal
1
Crystalline Silicon Sept.09 - Aug. 10
614 (365)
1879.9 12.29%
Azure Power
Awan, Amritsar, Punjab
1 Crystalline Silicon Dec.09 to Nov.10
577 (365)
3312 16.92%
Mahagenco
Chandrapur, Maharashtra
1 a-Si Thin Films May 10 to Apr.11
448 (365)
1654.2 15.39%
Reliance Industries
Nagaur, Rajasthan
5 Crystalline Silicon, Thin Films, CPV
352 July 10 to June 11
7473.3 18.8%
Saphhire Industrial
Sivaganga, Tamil Nadu
5 a-Si Thin Films
190 4271.3
Sri Power
Chittoor, Andhra Pradesh
2 Crystalline Silicon CdTe Thin Film
92 901.9
Source: 32/54/2011-12/PVSE, MNRE 44
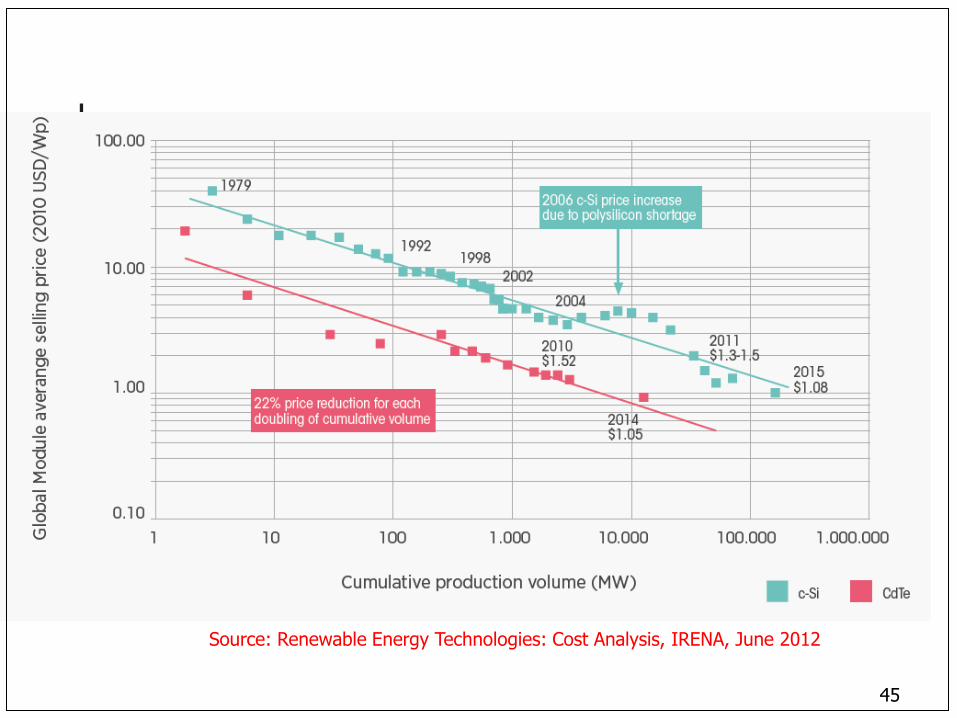
Source: Renewable Energy Technologies: Cost Analysis, IRENA, June 2012
45

Solar Tower E-Solar – Acme partnership First grid connected plant in India 2011 2.5 MW out of 10 MW installed Bikaner Rajasthan Double-axis software-mirror tracking system Lightweight, small size 1 m2 flat mirrors Plant output not stabilised – insolation, auxiliary consumption http://acme.in/solar/thermal.html 46
Non- operational?

Nokh (Godawari): 50 MW
Dhursar 125 MW Reliance/ Areva Megha, AP, 50 MW
47

Strategy
48
0% 100 %
Completely
Indigenous
Import Complete plant
Prototype
50 %
National Test Facility
National Testing facility – Facilitate technology development

Objectives
National Test Facility (for solar thermal applications) • Development of facility for component testing and characterization.
• Scope of experimentation for the continuous development of technologies.
1MW Solar Thermal Power Plant • Design & Development of a 1 MW plant.
• Generation of Electricity for supply to the grid.
• Development of technologies for component and system cost reduction.
Development of Simulation Package • Simulation software for scale-up and testing.
• Compatibility for various solar applications.
49
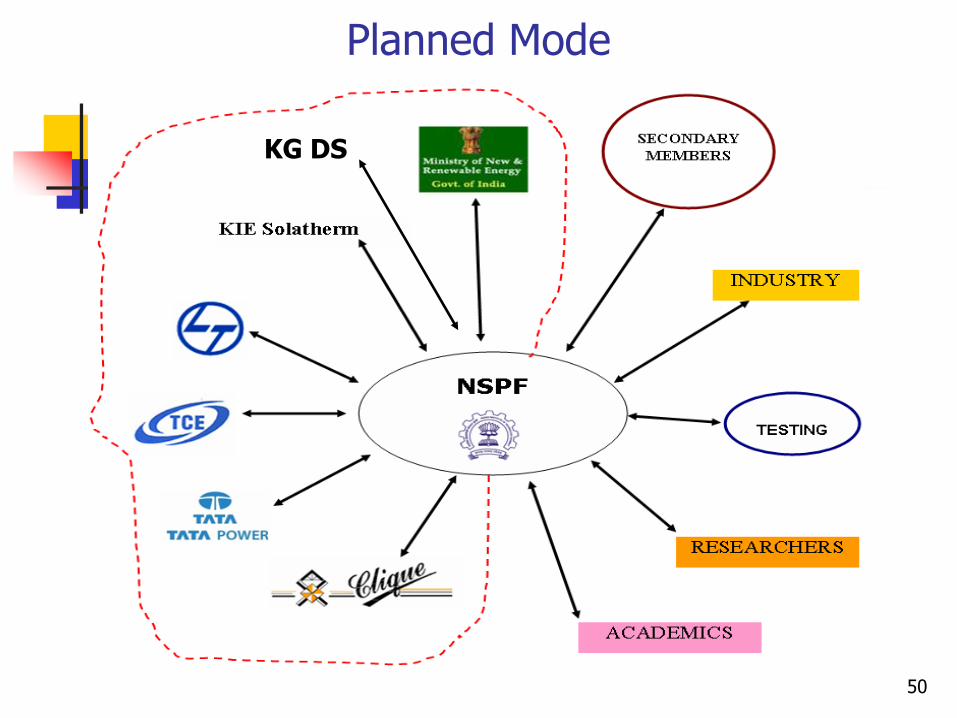
KG DS
Planned Mode
50
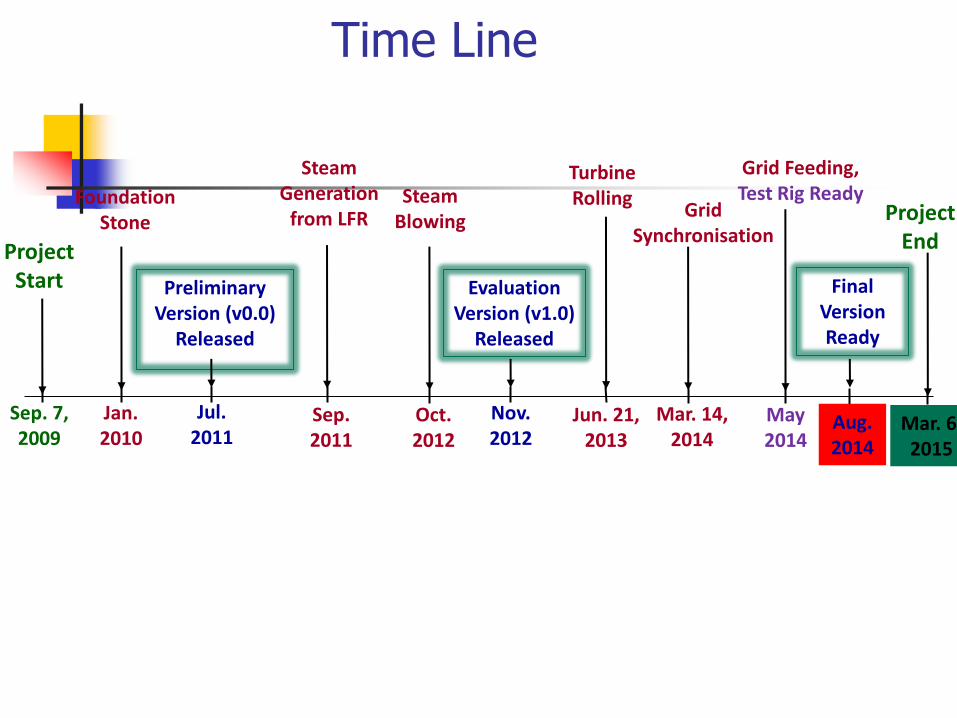
Time Line
Jan. 2010
Nov. 2012
Evaluation Version (v1.0)
Released
Foundation Stone
Preliminary Version (v0.0)
Released
Sep. 2011
Final Version Ready
Aug. 2014
Sep. 7, 2009
Project Start
Jul. 2011
Steam Generation
from LFR
Oct. 2012
Jun. 21, 2013
Mar. 14, 2014
Steam Blowing
Turbine Rolling
Grid Synchronisation
Grid Feeding, Test Rig Ready
May 2014
Mar. 6, 2015
Project End

52
Test Rig
Test Building
Dish Concentrator

User Interface: Main Window

Generation of user defined PFD using Simulator
Typical 50 MWe Solar Thermal Power Plant
Direct Steam Generation Process Heat Application

Simplified Process Flow Diagram
Cooling Water 45 bar, 105°C 1.09 kg/s
0.1 bar, 45.5°C 1.78 kg/s
42 bar, 350°C 1.93 kg/s
46.3 bar, 171°C 2.22 kg/s
Steam Separator
44 bar, 256.1°C 0.84 kg/s (Sat. Steam)
Pump-I
Preheater
Steam Generator
Pump-II
High Temperature Vessel
Low Temperature Vessel
17.5 bar, 232°C 8.53 kg/s
13 bar, 393°C 8.53 kg/s
PTC Field (8175m2)
Superheater
Pump-III
Deareator Pump-V
Pump-IV
Turbine
1 MWe
LFR Field (7020m2)
Pump-VI
Source: ISES, 2013
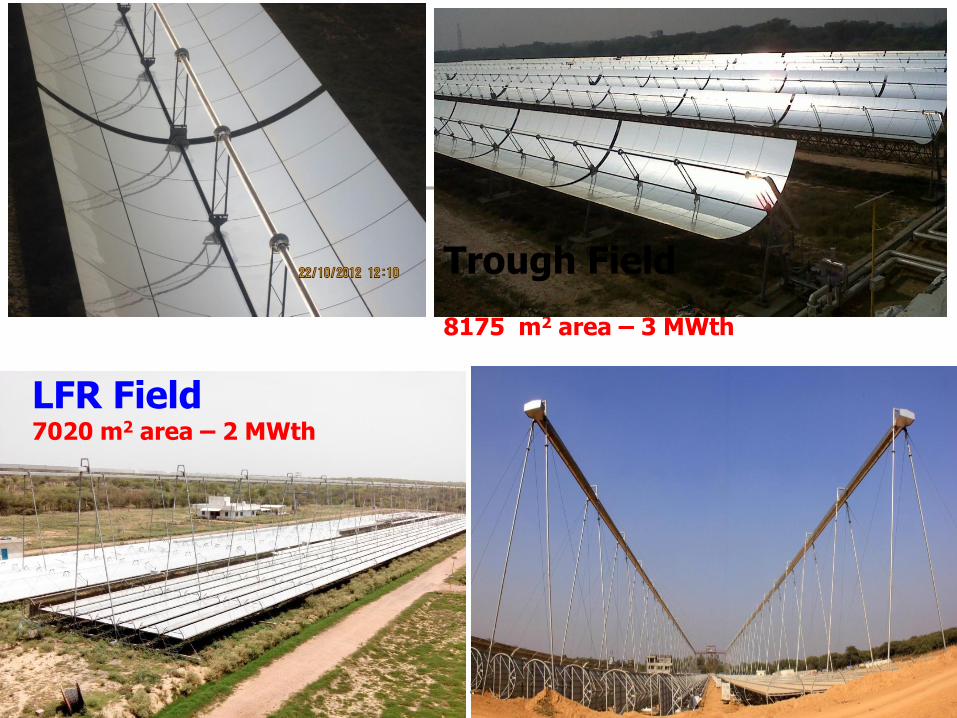
8175 m2 area – 3 MWth
Trough Field
LFR Field 7020 m2 area – 2 MWth
56

Arial view of 1 MWe Solar Thermal Power Plant and Test Facility by IIT Bombay

58
Alternative Vehicles
http://beta.thehindu.com/
Reva: Electric vehicle
Hydrogen bikes - BHU
Jatropha plant
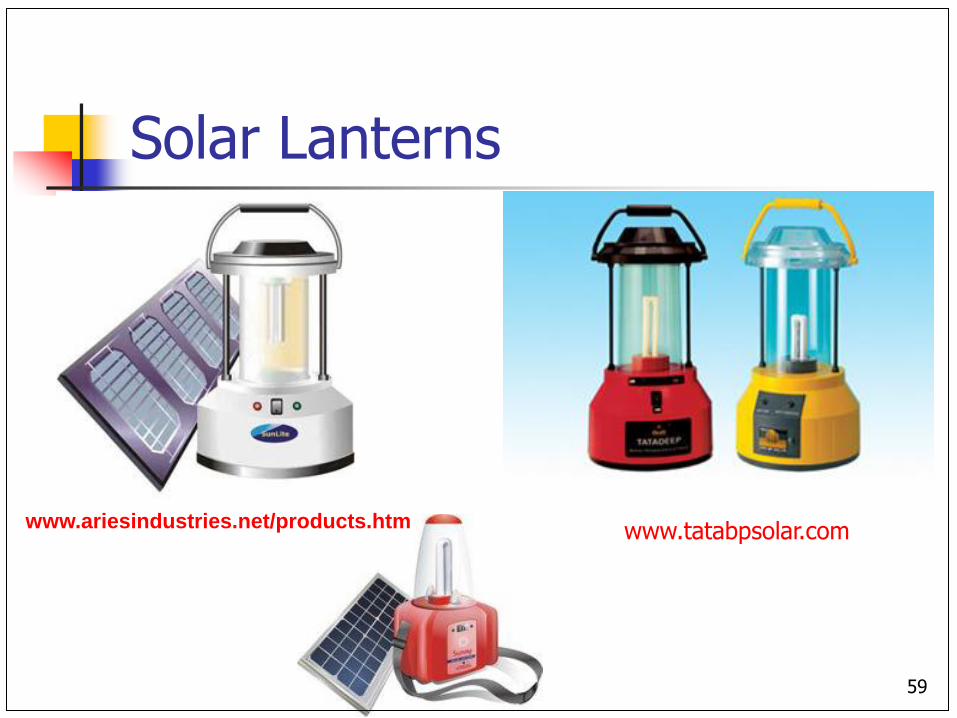
Solar Lanterns
www.ariesindustries.net/products.htm www.tatabpsolar.com
59

Solar Home Lighting
Solar Home Lighting
www.tatabpsolar.com
Solar Power Supply
60

Gasifier Cook stove Designs
61 Source: Anderson, 2012

Rice Husk gasifier Cookstoves
62 Source: Anderson, 2012


Biolite Stove
64
Source: GEA Chapter 10 http://www.biolitestove.com

Sampada Biomass Gasifier Stove
65
Source: www.arti-india.org/

Compact Biomass Gasifier
66
Source: www.arti-india.org/
1 m3 – digestor – 2 kg kitchen waste
0.5 m3 – digestor –1 kg kitchen waste

Frozen Efficiency Scenarios for 2035
2010
2035
5%
(Low)
6.4%
(Moderate)
8%
(High)
Population (in billions) 1.15 1.52 1.52 1.52
GDP (in US 2005 Billion PPP) 3763 12743 17745 25771
GDP/ capita 3272 8383 11674 16954
Primary Energy (in EJ) 29 96 134 195
Primary Energy per capita (in GJ) 25 63 88 128
67

Business as Usual Scenarios for 2035
2010
2035
5%
(Low)
6.4%
(Moderate)
8%
(High)
Population (in billions) 1.15 1.52 1.52 1.52
GDP (in US 2005 Billion PPP) 3763 12743 17745 25771
GDP/ capita 3272 8383 11674 16954
Primary Energy (in EJ) 29 58 81 118
Primary Energy per capita (in
GJ) 25 38 53 77
Electricity Supply (in billion
units) 811 2746 3824 5554
Electricity Supply (in units/
capita) 705 1807 2516 3654
68

Supply Scenarios for 2035 (BAU- Moderate) - Electricity- High Coal (A)
Supply Scenario (BAU)
Projections for 2035 Coal
Natural
Gas Diesel Nuclear Hydro
Renewa
bles Total
% Electricity Supply
Share 66% 12% 2% 3% 11% 6% 100%
Electricity Supply/
year (in billion kWh) 2524 459 76 115 421 229 3824
Average Load Factor 70% 70% 16% 70% 38% 26%
Installed Capacity
(in GW) 412 75 55 19 126 101 787
69

Supply Scenarios for 2035 (BAU- Moderate)- Electricity- High Renewables (B)
Supply Scenario
Green (Coal Low,
Renewables High)
Projections for
2035 Coal
Natural
Gas Diesel
Nuclea
r
Hydr
o
Renewa
bles Total
% Electricity
Supply Share 50% 12% 2% 3% 11% 22% 100%
Electricity Supply/
year (in billion
kWh) 1912 459 76 115 421 841 3824
Average Load
Factor 70% 70% 16% 70% 38% 26%
Installed Capacity
(in GW) 312 75 55 19 126 369 956
70
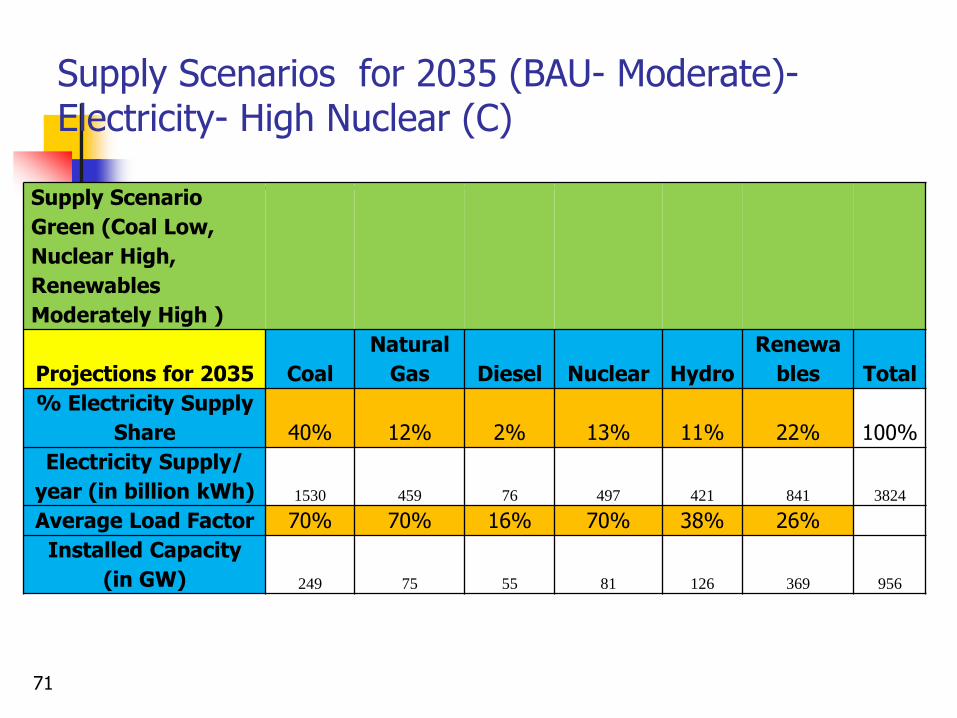
Supply Scenarios for 2035 (BAU- Moderate)- Electricity- High Nuclear (C)
Supply Scenario
Green (Coal Low,
Nuclear High,
Renewables
Moderately High )
Projections for 2035 Coal
Natural
Gas Diesel Nuclear Hydro
Renewa
bles Total
% Electricity Supply
Share 40% 12% 2% 13% 11% 22% 100%
Electricity Supply/
year (in billion kWh) 1530 459 76 497 421 841 3824
Average Load Factor 70% 70% 16% 70% 38% 26%
Installed Capacity
(in GW) 249 75 55 81 126 369 956
71

Power Generation – Supply mix
72
Thermal
Nuclear
Renewables (incl Hydro)
40%
60%
80%
20%
0
100%
A- 2035
B- 2035
C- 2035

73
Renewable installed capacity and generation 2022
Installed
Capacity*
Estimated
Capacity factor
Estimated
Generation
(GWh) (MW)
Wind 60000 14% 73584 Biomass Power 5000 70% 30660 Bagasse
5000 60%
26280 Cogeneration
Small Hydro 10000 40% 35040 Waste to Energy 500 50% 2190 Solar PV 100000 19% 175200 Total 180500 25% 342954

74
0
10000
20000
30000
40000
50000
60000
70000
80000
90000
100000
110000
120000
130000
140000
150000
1990 1995 2000 2005 2010 2015 2020 2025 2030 2035
Ins
tall
ed
Ca
pa
cit
y (
MW
)
Year
Diffusion Curves for wind energy
Diffusion curve
Upper limit of uncertainity
Lower limit of uncertainity
Potential = 103000MW

PV Installed Capacity Growth
75
0
500
1000
1500
2000
2500
3000
3500
4000
2008 2009 2010 2011 2012 2013 2014 2015
Inst
alle
d C
apaci
ty(M
W)

PV Installed Capacity Projections
76
0
20000
40000
60000
80000
100000
2009 2011 2013 2015 2017 2019 2021
Inst
alle
d C
apaci
ty(M
W)

Plan Layout
77

78
A portion of the ELU map of Ward A of MCGM
Corresponding Satellite Imagery for the area from Google Earth
Analyzed in QGIS 1.8.0 To determine -Building Footprint Ratios - Usable PV Areas For Sample Buildings

79
0
0.5
1
1.5
2
2.5
0:0
1-
1:0
0
1:0
1-
2:0
0
2:0
1-
3:0
0
3:0
1-
4:0
0
4:0
1-
5:0
0
5:0
1-
6:0
0
6:0
1-
7:0
0
7:0
1-
8:0
0
8:0
1-
9:0
0
9:0
1-1
0:0
0
10:0
1-1
1:0
0
11:0
1-1
2:0
0
12:0
1-1
3:0
0
13:0
1-1
4:0
0
14:0
1-1
5:0
0
15:0
1-1
6:0
0
16:0
1-1
7:0
0
17:0
1-1
8:0
0
18:0
1-1
9:0
0
19:0
1-2
0:0
0
20:0
1-2
1:0
0
21:0
1-2
2:0
0
22:0
1-2
3:0
0
23:0
1-2
4:0
0
MU
s
Jan, 2014 Typical Load Profile vs PV Generation
1-Axis
Tracking @
Highest eff.
1-Axix
Tracking @
Median eff.
19 deg. Fixed Tilt @ Highest
eff.
19 deg. Fixed
Tilt @ Median
eff.
0.115
0.125
0.135
0.145
0.155
0.165
0.175
0.185
Jan Feb Mar Apr May Jun Jul Aug Sep Oct Nov Dec
Capacity Factor for Mumbai
1-Axis Tracking
Fixed Tilt @ 19
deg.
Annual Average with 1-Axis
Tracking

80 Source: A. Sarkar, ETV 2035

Large Scale Storage Options
81 Source: GEA, 2012

Cost of Electricity ($/MWh)
82
3 R
s./k
Wh
6 R
s./k
Wh
9 R
s./k
Wh
Bloomberg, 2014

TEAM SHUNYA SOLAR DECATHLON EUROPE 2014
83

House in Versailles – 26th June, 2014
Team Shunya
70 students 13 disciplines 12 faculty

85
5 kWp Solar PV power plant at Rajmachi Village, Maharashtra
No. of house holds: 29
Connected load : 1.4 kW
Source: Manoj and Banerjee, 2010

Measurements
86
0
200
400
600
800
1000
1200
0:00 2:24 4:48 7:12 9:36 12:00 14:24 16:48 19:12 21:36 0:00
Time (hrs)
Pow
er(
Watt
s)
and V
oltage (
Volts)
VOLTAGE POWER

Selco Case study
87
For profit company – Solar Home systems – started 1996 – sold about 100,000 SHS
90% of products – credit schemes
Partnership with 9 banks – interest rates between 12-17%
Financing Institutions pay 85% of the amount- monthly payments of Rs 300- 400 over a period of 5 years
Financing/ repayment options – tailormade to end users – paddy farmers – repayment schedule based on crop cycle, street vendors – daily payments – Rs 10
Funding from REEP – meet margin amount for poor customers, reduce interest rate
Source: SELCO, 2011

DESI Power
88
Biomass based power solutions – Bihar- 25 kW to 100 kW Local distributors – decide pricing Registered under CDM and sold CERs to Swiss buyer MNRE funds, Promoters Equity, ICICI Loan Monthly rate based on no of bulbs / loads, Circuit breaker to
limit consumption Irrigation pump users Rs 50/ hour, Household Rs 120- 150 per
month Underground trunk wiring-distribution Enabling micro-enterprises –battery charging station, flour
mill, workshop etc Tie up with Telecom towers – increasing capacity factor

Husk Power
89
Initial funding – prize money 30-100 kW – biomass gasifiers- based on
rice husk Energy audit of households Focus on household demand for lighting Lower production, operating costs – use of
bamboo, asbestos Overhead pole wiring Directly reach end user

5000
5500
6000
6500
7000
7500
8000
8500
9000
9500
0 4 8 12 16 20 24
Jan-07
june
july
august
sept
0
200
400
600
800
1000
1200
1400
1600
1800
2000
0 4 8 12 16 20 24
hours
Po
we
r g
en
era
ted
in
MW
january
June
July
August
September
Wind Generation
Total Generation
Tamil Nadu 2006-7
90

91
0
500
1000
1500
2000
2500
0 4 8 12 16 20 24
Hours
Po
wer
gen
era
ted
in
MW January
June
September
Mean value
0
200
400
600
800
1000
1200
JAN FEB MAR APR MAY JUN JUL AUG SEP OCT NOV DEC
MonthsW
ind
en
erg
y g
en
era
ted
(M
U)
Hourly variation of wind power
Monthly variation of wind energy generated

Impacts on LDC
92

HDI and Electricity use
Source: Pasternak, 2000 93

Summary Renewables – from margins to mainstream
Significant potential – almost cost –effective in niches
Competition among renewables -Wind, Small hydro, Biomass, Solar PV, Solar Thermal
Reductions in Capital cost
Intermittency, Variability – better forecasting, modelling, Intelligence
Efficiency and Renewables
Decentralised vs Centralised
Need for Hybridisation, Storage, Demand Response
Innovation, Technology Development , R&D
Materials, Land , Water

References
GEA, 2012: Global Energy Assessment - Toward a Sustainable Future, Cambridge University
TIFAC Energy Technology Vision 2035– draft in progress J.M. Cullen and J.M. Allwood: The efficient use of energy: Tracing the global
flow of energy from fuel to service,Energy Policy 38 (2010) Integrated Energy Policy Report, Planning Commission, 2006 www.mnre.nic.in Tejal and Banerjee, 2011: Power Sector Planning in India, Journal of Economic
Policy and Research, 7(1), 1-23, October, 2011. R.Singh and R.Banerjee, Solar Energy, 2015 Wiel S. (2001): Energy Efficiency Labels and Standards, S. Wiel and J.E.
McMahon, eds. (Washington, D.C., Collaborative Labelling and Appliance Standards Programme (CLASP).
P.Enkvist,T.Naucler, J.Rosander, A cost curve for GHG reduction, Mckinsey Quarterly,2007, no1, p 35-45
Taylor et al, Financing Energy Efficiency, Lessons from Brazil, China, India and Beyond, World Bank, Washington D.C., USA, 2008
Rockstrom et al, Ecology and Society 14(2): 32, 2009 www.ipcc.ch www.oilnrgy.com Thank you