renewable energy in nunavut scoping …...itp/a0313 – september 2019 iii renewable energy in...
TRANSCRIPT

RENEWABLE ENERGY IN NUNAVUT SCOPING ANALYSIS
Final Report
September 2019
ii ITP/A0313 – September 2019
Renewable Energy in Nunavut Scoping Analysis
About IT Power
The IT Power Group, formed in 1981, is a specialist renewable energy, energy efficiency and
carbon markets consulting company. The group has offices and projects throughout the world.
IT Power (Australia) was established in 2003 and has undertaken a wide range of projects,
including designing grid-connected renewable power systems, providing advice for government
policy, feasibility studies for large, off-grid power systems, developing micro-finance models for
community-owned power systems in developing countries and modelling large-scale power
systems for industrial use.
The staff at IT Power (Australia) have backgrounds in renewable energy and energy efficiency,
research, development and implementation, managing and reviewing government incentive
programs, high level policy analysis and research, including carbon markets, engineering design
and project management.
About this report
This report summarises a pre-feasibility study conducted for renewable energy integration in 25
communities in Nunavut, Canada. The study was conducted using the techno-economic power
system modelling tool HOMER PRO.
This report was commissioned by World Wildlife Fund (WWF) Canada.

ITP/A0313 – September 2019 iii
Renewable Energy in Nunavut Scoping Analysis
Report Control Record
Document prepared by:
ITP Renewables
Level 1, 19-23 Moore Street, Turner, ACT, 2612, Australia
PO Box 6127, O’Connor, ACT, 2602, Australia
Tel. +61 2 6257 3511
Fax. +61 2 6257 3611
E-mail: [email protected]
http://www.itpau.com.au
IT Power (Australia) Pty Limited (ABN 42 107351 673)
Document Control
Report title RE in Nunavut: Scoping Analysis – Interim Report
Client Contract No. C-0319-798-00-D ITP Project Number A0313
File path G:Work\0Projects\A0313 WWF Arctic RE Pre-Feasibility
Client WWF Canada Client Contact Martha Lenio
Rev Date Status Author/s Project Manager Approved
1 15th March 2019 Draft James Hazelton, Susan Dedman, Nicholas Logan, Joshua Jordan
James Hazelton Philippe McCracken
2 29th March 2019 Final James Hazelton, Susan Dedman, Nicholas Logan, Joshua Jordan
James Hazelton Joshua Jordan
3 27th August 2019 Final James Hazelton, Susan Dedman, Nicholas Logan, Joshua Jordan
James Hazelton Joshua Jordan
4 11th September 2019
Final James Hazelton, Susan Dedman, Nicholas Logan, Joshua Jordan
James Hazelton Joshua Jordan
A person or organisation choosing to use documents prepared by IT Power (Australia) Pty Ltd accepts the following: a) Conclusions and figures presented in draft documents are subject to change. IT Power (Australia) Pty Ltd accepts no
responsibility for their use outside of the original report. b) The document is only to be used for purposes explicitly agreed to by IT Power (Australia) Pty Ltd. c) All responsibility and risks associated with the use of this report lie with the person or organisation who chooses to use it.

iv ITP/A0313 – September 2019
Renewable Energy in Nunavut Scoping Analysis
EXECUTIVE SUMMARY
Canada’s Arctic territory of Nunavut depends on fossil fuels for the entirety of its electricity and
heat generation. As well as facing high prices and environmental risk from fossil fuel use and
transportation through the territory, the extreme isolation and limited access year-round has
meant that supply disruption and global price hikes pose a significant risk to the region’s energy
security. The consequence of this risk has been highlighted when regular shipments have been
disrupted and vital fuel has instead been flown in via small aircraft to maintain services [1].
Previous studies have shown the potential to integrate renewable energy (RE) generation and
storage as a pathway to reduce costs, and improve energy security and community resilience.
ITP Renewables was engaged by WWF Canada to undertake an expanded and updated RE pre-
feasibility study encompassing all 25 communities serviced by the territory’s utility, Qulliq Energy
Corporation. This report is the updated pre-feasibility study, and includes assessment of the
renewable energy resources, technical pre-feasibility, and economic analysis of three minimum
RE scenarios (20%, 40% and 60% annual RE contribution) and the diesel-only base case.
The investigation finds that with an analysis period of 15 years, a discount rate of 8% (nominal),
and relatively low diesel prices compared to historical volatility, two communities (Rankin Inlet and
Iqaluit) appear to have an immediate case to move to higher RE contributions, while nine other
communities have RE cases within $2m of breakeven. This suggests that, where grant funding is
available to these communities, RE may be attractive and further study would be warranted.
At a 4% discount rate, Baker Lake and Coral Harbour join Rankin Inlet and Iqaluit as having an
immediate case for RE integration. This suggests that, where concessional debt financing is
available to these communities, and/or investment risk can be lowered, RE may be attractive and
further study would be warranted.
At Rankin Inlet, it was found that the installation of a single 2.3MW wind turbine coupled with
1.6MW/3.36MWh battery pack gave an Internal Rate of Return (IRR) of 9.2% and a simple
payback of 9.6 years. This could achieve around 49% RE, saving 2.4 ML of diesel fuel per year,
6.2 Mt of CO2e emissions, and potentially up to 21 kL of avoided heating oil consumption by using
excess renewable electricity for heating.
At Iqaluit, the integration of 5MW of PV (no storage) was found to have an IRR of 8.9% and
simple payback of 9.4 years. This system would achieve an annual RE contribution of 10%.
In general, RE was more attractive where the wind resource data available showed higher and
more consistent wind speeds, and where the community’s electricity demand was larger (as this
allowed for larger RE plant and the associated economies-of-scale). RE was also more attractive
when the lower discount rate was assumed, as the discount rate is a proxy for the cost of capital,
and RE investments are generally capital-intensive.
ITP/A0313 – September 2019 v
Renewable Energy in Nunavut Scoping Analysis
Sensitivity analysis was undertaken for three communities to investigate the influence that
discount rate and diesel price has on the optimal RE capacity and return on investment. The
analyses show that sensitivity to these variables is highly dependent on the community, with
some communities being close to economic feasibility and others remaining a long way off.
Based on the lifecycle costs of RE scenarios relative to the diesel-only base case, the apparent
strength of local wind resources, and the potential for cost-effective reductions in GHG emissions,
Rankin Inlet, Iqaluit, Baker Lake, Coral Harbour, Chesterfield Inlet and Sanikuaq are suggested
as priorities for further study.
In all cases, falling renewable energy and storage costs will improve the financial case for
renewable energy investment in the medium term, and similarly for increasing diesel prices and/or
a price on carbon.

vi ITP/A0313 – September 2019
Renewable Energy in Nunavut Scoping Analysis
LIST OF ABBREVIATIONS
BESS Battery Energy Storage System
CAD Canadian Dollars
CO2-e Carbon Dioxide Equivalent, a unit of GHG emission
GHG Greenhouse Gas
HOMER Hybrid Optimisation of Multiple Energy Resources
IPP Independent Power Producer
IRR Internal Rate of Return
ITP IT Power (Australia) Pty Ltd
kW Kilowatt, unit of power
kWh Kilowatt-hour, unit of energy (1 kW generated/used for 1 hour)
kWp Kilowatt-peak, unit of power for PV panels tested at STC
NPC Net Present Cost
PP2 Tesla Powerpack 2hr (charge/discharge rate allows full charge or discharge in 2 hours)
PP4 Tesla Powerpack 4hr (charge/discharge rate allows full charge or discharge in 4
hours)
PPD Petroleum Products Division
PV Photovoltaic
QEC Qulliq Energy Corporation
RE Renewable Energy
STC Standard Test Conditions for PV panels (1,000 W/m2 irradiance, 25 °C cell temperature, Atmospheric Mass 1.5)
WISE Waterloo Institute for Sustainable Energy
WWF World Wildlife Fund Canada
AUD Australian Dollar
ITP IT Power (Australia) Pty Ltd
kW Kilowatt, unit of power
kWh Kilowatt-hour, unit of energy (1 kW generated/used for 1 hour)
kWp Kilowatt-peak, unit of power for PV panels tested at STC
PV Photovoltaic
STC Standard Test Conditions for PV panels (1,000 W/m2 irradiance, 25 °C cell temperature, Atmospheric Mass 1.5)

ITP/A0313 – September 2019 vii
Renewable Energy in Nunavut Scoping Analysis
CONTENTS
EXECUTIVE SUMMARY ................................................................................................... 4
1. INTRODUCTION ......................................................................................................... 9
1.1. Background ........................................................................................................... 9
1.2. Objectives ............................................................................................................. 9
1.3. Previous Studies ................................................................................................. 10
1.4. Communities & Diesel Usage ............................................................................. 11
2. DATA AND ANALYSIS ............................................................................................. 13
2.1. Existing Assets ................................................................................................... 13
2.2. Community Electrical Loads ............................................................................... 13
2.3. Resource Data .................................................................................................... 16
3. MODELLING ............................................................................................................. 17
3.1. HOMER .............................................................................................................. 17
3.2. Assumptions ....................................................................................................... 17
4. RESULTS & ANALYSIS ........................................................................................... 25
4.1. Sensitivity Results ............................................................................................... 29
4.2. Discussion .......................................................................................................... 35
4.3. Conclusions ........................................................................................................ 36
REFERENCES ................................................................................................................ 37
APPENDIX A. NUNAVUT COMMUNITIES, FUEL USE & GENERATOR FLEET ....... 38
APPENDIX B. HOMER MODEL PARAMETERS ......................................................... 45
B.1. System Dispatch and Operation ......................................................................... 45
B.2. System Components ........................................................................................... 45
APPENDIX C. DETAILED RESULTS ........................................................................... 49
C.1. Results ................................................................................................................ 49
C.2. Site Commentary ................................................................................................ 54
APPENDIX D. RESOURCE DATA ............................................................................... 58


ITP/A0313 – September 2019 9
Renewable Energy in Nunavut Scoping Analysis
1. INTRODUCTION
1.1. Background
The northern Arctic territory of Nunavut has the highest cost of electricity in Canada, primarily due
to a low population density and a dependence on imported fossil fuels for generation. Using
diesel fuel for electricity generation contributes to climate change through the emission of
greenhouse gases, and its transportation and use across the territory presents spill risk in
Nunavut’s unique natural environment. Pressingly, dependency on a single energy source
presents risks to energy security, due to supply interruption and future price exposures, as was
recently the case in the Northwest Territories when fuel and supplies had to be airlifted into
Paulatuk [1]. These factors have led to the identification of local renewable energy resources,
such as wind and solar, as important assets to make these remote communities more
independent, sustainable and reduce electricity costs.
Qulliq Energy Corporation (QEC) is the generator and distributor of electrical energy for retail
supply in Nunavut and has approximately 15,000 electrical customers across the territory. The
Corporation generates and distributes electricity to Nunavummiut through the operation of stand-
alone diesel plants in 25 communities meeting community peak demands ranging from
approximately 200 kW at Grise Fiord to 10 MW at Iqaluit [2]. For the 2018/19 financial year,
electricity generation is forecast to require 51,355,000 L of fuel at a cost of CAD $48 million.
Previous studies have investigated the potential integration of renewable energy and storage
systems, and found systems with renewable energy could provide an attractive alternative to
reduce fuel use for QEC. Both wind and solar have continued to become increasingly cost
effective, as has battery storage technology [3], which historically has been a limiting factor in
achieving higher renewable energy penetrations.
1.2. Objectives
The objective of the investigation is to perform a pre-feasibility study for integration of PV and
wind for the 25 communities serviced by QEC. A number of scenarios are to be explored. Firstly,
the baseline case which represents business as usual with diesel only, then three further
increasing renewable energy contributions - 20%, 40% and 60%.
For each community, the study describes:
• the solar and wind resource based on best available data
• the existing diesel infrastructure
• current diesel consumption for both electricity and heating

10 ITP/A0313 – September 2019
Renewable Energy in Nunavut Scoping Analysis
• the decrease in diesel use and CO2-e emissions as well as savings to energy generation
and maintenance costs.
The report expands on earlier analysis [4] which considered a subset of 13 communities and
provides updated analysis, including cost and technology changes (e.g. lithium-ion batteries are
now preferable to lead-acid batteries due to significant cost reductions in the past three years)
and quantification of surplus electrical energy that could be utilised by thermal loads in each
community.
1.3. Previous Studies
1.3.1. Renewable Energy Deployment in Canadian Arctic - Phase 1: Pre-Feasibility Studies and Community Engagement for Nunavut 2016 [4]
The Waterloo Institute for Sustainable Energy (WISE) analysed the potential for solar PV and
wind energy integration into the 25 Nunavut communities receiving power from QEC. The
investigation conducted a two-step selection process to identify the communities for which
renewable energy would prove most feasible. The initial 25 communities were passed through
and assessed on the basis of their renewable energy resources, the transportation costs, the
community size, greenhouse gas (GHG) emissions and the electricity rate. Taking the top results
from each region, 13 communities were selected for further analysis. HOMER models were
developed for each of these communities and used to assess the feasibility of renewable energy
deployment based on 2015 load data. Ranking of the results was performed based on a number
of criteria, including potential O&M savings (Sanikiluaq), lowest Cost of Electricity (COE) in a
hypothetical no diesel case (Sanikiluaq), and offset generator capacity (Rankin Inlet), among
others. The report then identifies the five communities recommended for more detailed feasibility
studies: Sanikiluaq, Iqaluit, Rankin Inlet, Baker Lake and Arviat.
1.3.2. Rankin Inlet Energy Assessment Report – March 2018 [5]
The Alaska Centre for Energy and Power (ACEP) and WWF conducted extensive consultations
with the community of Rankin Inlet in 2017 as a request from the community to identify solutions
to reduce energy costs and improve resilience. The report explores in detail the potential for wind
energy in the community and potential siting, and finds Rankin Inlet to be a highly promising site.
The report identifies eight roadmap options for the community to consider over the short and long
term. The detailed wind resource information provided by this report is included in our updated
investigation.
1.3.3. Potential for Wind Energy in Nunavut Communities 2016 [6]
JP Pinard Consulting was engaged by QEC to the assess the wind resource in 25 communities,
determine which of the sites have the potential for economic wind operation and identify next
ITP/A0313 – September 2019 11
Renewable Energy in Nunavut Scoping Analysis
steps. Using RETScreen to conduct the analysis in the first instance and then HOMER to
subsequently model operational aspects, the study found the top five communities to be the same
as the above WISE report. The authors note that QEC is justified in moving forward in considering
wind energy developments with both large and small turbines. The cost assumptions provided in
the 2016 report, while noting their own considerable uncertainties, were considered to be suitable
for our study as a pre-feasibility estimate and used in the proceeding analysis to develop cost
curves for small- and large-scale wind.
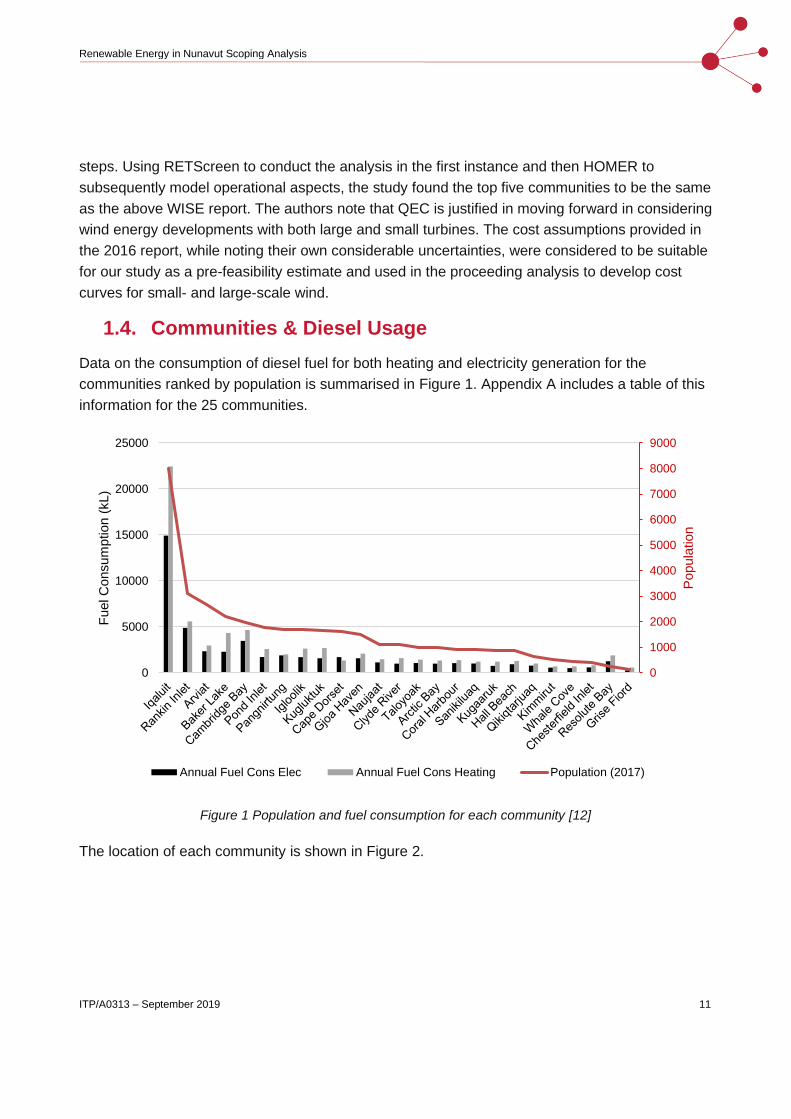
1.4. Communities & Diesel Usage
Data on the consumption of diesel fuel for both heating and electricity generation for the
communities ranked by population is summarised in Figure 1. Appendix A includes a table of this
information for the 25 communities.
Figure 1 Population and fuel consumption for each community [12]
The location of each community is shown in Figure 2.
0
1000
2000
3000
4000
5000
6000
7000
8000
9000
0
5000
10000
15000
20000
25000
Popula
tion
Fuel C
onsum
ption (
kL)
Annual Fuel Cons Elec Annual Fuel Cons Heating Population (2017)

12 ITP/A0313 – September 2019
Renewable Energy in Nunavut Scoping Analysis
Figure 2: Location of communities analysed [7]
ITP/A0313 – September 2019 13
Renewable Energy in Nunavut Scoping Analysis
2. DATA AND ANALYSIS
This section of the report summarises the operational and resource data obtained for the
investigation as well as the methods and analysis undertaken to develop the inputs for the
models.
Obtaining even limited data sets has proved challenging, with many unavailable, or only available
for one site. Best endeavours have been made to supplement existing data sets with information
from previous reports, and where necessary, assumptions and methods of derivation have been
stated for transparency.
2.1. Existing Assets
QEC provided updated information on the diesel fleet as at December 2018, which is summarised
for all communities in Appendix A. Information on updated run-hours for these generators was not
available so has not been considered in the analysis to date.
2.2. Community Electrical Loads
2.2.1. Annual Electrical Demand and Forecasts
The annual electricity generation for all power stations was available from the QEC Rate
Application Report (2017). The report consisted of actuals for FY15/16/17 and forecasts for FY18
and FY19. Additionally, a demand forecast for the year 2025 was provided by QEC separately.
This information is summarised in Figure 3. The annual electrical energy demand growth for
Nunavut is 1.1% p.a., which varies between communities with the maximum being at Naujaat
(2.0% p.a.) and the minimum being negative growth at Grise Ford (-1.8% p.a.).

14 ITP/A0313 – September 2019
Renewable Energy in Nunavut Scoping Analysis
Figure 3: Historical & Forecasted (FC) annual electricity demand for each of the 25 communities
2.2.2. Load Profiles – Rankin Inlet
Time-series data for Rankin Inlet was provided in daily CSV files, covering an incomplete period
ranging from June 2016 to July 2017. Sampling rate was nominally 10 seconds with the data
fields including individual generator output and total station load. The data was cleaned, merged
and indexed1 for further analysis. 7 of the 13 months were found to have close to 100% of their
expected records intact, but the remainder had very limited samples available.
For the hours in which at least one data point was available, the total station load was averaged
to prepare the summary information for both weekdays and weekends. The load profile is shown
in Figure 4 below, with the seasonal difference shown.
1 “0” and “Null” values were removed from the data set, and further date and time conversions were used to develop necessary fields for further analysis.

ITP/A0313 – September 2019 15
Renewable Energy in Nunavut Scoping Analysis
Figure 4: Recorded Rankin Inlet load profile from 2016 and 2017 data
QEC estimates Rankin Inlet’s load in 2025 will be 2,140 kW. Using the 2016 and 2017 data as a
basis of seasonality, the load profile was scaled to reflect this, as per Figure 5.
Figure 5: Generated Monthly Load Profile for Rankin Inlet in 2025
2.2.3. Load Profiles – Other Sites
Times-series data was not available for other sites, so the hourly and seasonal variations were
traced from Rankin Inlet data and scaled based on the 2025 demand forecasts provided by QEC
(shown earlier in Figure 3). Hour-by-hour and daily variability was altered in the simulation
software to match forecasted peak loads.
0
500
1000
1500
2000
2500
3000
0 1 2 3 4 5 6 7 8 9 10 11 12 13 14 15 16 17 18 19 20 21 22 23
Avg.
Pow
er
Gen (
kW
)
Hour of Day
Winter Weekday
Winter Weekend
Summer Weekday
Summer Weekend

16 ITP/A0313 – September 2019
Renewable Energy in Nunavut Scoping Analysis
As this is a pre-feasibility study, we consider this approach acceptable but note that it is of limited
accuracy. Larger communities, such as Rankin Inlet, have a larger number of consumers and
therefore are likely to have more commercial or industrial activity, which will result in a more
daytime-biased consumption pattern and a lower diversity factor. Other communities are
expected to have different load profiles and higher or lower diversity factors, which would impact
key parameters of design, such as the sizing of generating equipment. This would require further
data and analysis on a site-by-site basis.
2.3. Resource Data
The approach taken for resource data inputs was to use measured data wherever possible and
defer to models if measured data was not available. As solar and wind data proved difficult to
obtain for each site,2 ground measurements from neighbouring airport data were used where
available (source RETScreen [8]). In the communities that did not have an airport meteorological
station, NASA satellite data was used and downloaded through HOMER.
Previous studies have detailed the importance of measured data compared to satellite-derived
data, especially with respect to wind data. There can be significant differences between ground
measurement and the NASA satellite data, so results from sites using satellite data should be
treated with appropriate uncertainty. The resource data source for each site is listed in Appendix
D.
2Resource data for Rankin Inlet was provided by Northern Energy Capital. The data covers approximately four months, which was insufficient to provide insight on seasonal variation.

ITP/A0313 – September 2019 17
Renewable Energy in Nunavut Scoping Analysis
3. MODELLING
3.1. HOMER Pro
HOMER - the name derived from Hybrid Optimisation of Multiple
Energy Resources – is a software package initially developed by
the US National Renewable Energy Laboratory (NREL) under the
Village Power Program in the 1990s. The software itself simulates
power system operation, allowing optimisation and study of
energy balance and system economics.
There are three main tasks that can be performed by HOMER: simulation, optimization and
sensitivity analysis. In the simulation process, the program models a system, determines its
technical feasibility in meeting the load, and calculates life cycle costs. In the optimization
process, the program performs simulations on different system configurations within a user-
defined range to come up with the optimal design. In the sensitivity analysis process, the program
performs multiple optimizations under a range of inputs, allowing for uncertainty in model inputs to
be accounted for.
HOMER can simulate a large variety of componentry, from PV, wind and thermal plant to fly
wheels, batteries and the conventional grid. HOMER has the second highest user base of design
tools used for integration of renewables (on grid and off grid), second only to RETScreen. The
package is extensively used by financiers, micro-grid designers and academics throughout the
world. The software package is typically used at the pre-feasibility and detailed feasibility stage,
as it allows easy scaling and sensitivity analysis.
3.2. Assumptions
This section describes the key assumptions that were used in the HOMER models. More detailed
information on model parameters can be found in Appendix B.
3.2.1. Financial & Economic Assumptions
Economic inputs entered into the HOMER model were:
• Discount rate of 8% nominal
• Inflation rate of 2%, per the Bank of Canada’s target inflation rate
• Analysis period of 15 years
• No carbon tax applied to electricity generation
18 ITP/A0313 – September 2019
Renewable Energy in Nunavut Scoping Analysis
Discount Rate: The discount rate is used to calculate the net present value of all future cash flows
in the project. While the financing structure of any project is unknown at pre-feasibility stage, 8%
was chosen in this report to reflect the expected weighted average cost of capital (WACC) that an
Independent Power Producer (IPP) would pay to debt and equity financiers. A utility, such as
QEC, would likely use a lower rate when assessing projects, and concessional loans may also be
available. To reflect the possibility of a lower cost of capital, a 4% discount rate scenario was also
studied.
Inflation: The rate at which the price of goods increases over time. The Bank of Canada aims to
keep inflation between 1 – 3%. The inflation rate used in the modelling was 2%.
Analysis Period: A 15-year analysis period was chosen to assess projects from the perspective of
an external investor or IPP. However, projects undertaken by QEC, Inuit Orgs, or Community
Cooperatives may be comfortable with longer project timelines and payback periods on
investments.
Carbon Tax: Currently electricity generation in Nunavut is excluded from the Canadian Carbon
Tax. However, the Carbon Tax does apply to heating fuel and a number of transportation fuels.
As this report accounts for savings achieved by off-setting heating fuel, the saving on the Carbon
Tax is applied to these calculations, and accounted for in the increase in transportation of goods
over time.
3.2.2. Technical Assumptions
System Dispatch and Operation
The following operating settings were assumed:
• A maximum allowable annual generation capacity shortage (unmet load) of 0.1% (~9
hours)
• Operating reserve (spinning diesel generator capacity and/or battery capacity) of:
▪ 10% of the annual peak load
▪ 80% of solar power output
▪ 50% of wind power output
Allowable Capacity Shortage: Ideally this value is 0%, however this can cause high cost
increases in HOMER, the modelling program used, and so this value was set at 0.1%, or 9 hours
per annum, of potentially unmet load in system designs.
Operating Reserve: Also called spinning reserve, this is the “buffer” between demand for energy
and the amount being generated. All diesel generators undergo a short start-up sequence – or
“warm-up” period - before they can connect to the power station bus and become loaded. In a

ITP/A0313 – September 2019 19
Renewable Energy in Nunavut Scoping Analysis
situation where load increased beyond the capacity of already loaded generators and without any
Operating Reserve, the time-delay to start an additional generator may result in overloading of
generators or a system trip. Operating Reserve therefore ensures that there is sufficient capacity
online, or “spinning”, to pick up any rapid increases in load.
When integrating renewable energy into a system, the potential for solar or wind energy to
suddenly drop off needs to be taken into account as well. For a wind turbine, this means that
when it’s operating, the grid needs to be able to make up for ~50% of what the wind turbine
produces if it was suddenly to disappear. For solar, the grid needs to be prepared to take up
~80% of what the solar panels were generating. This can be done through fast-ramping diesel
generation, battery storage, load management, or other control mechanisms.
Electrical Load
The average daily electrical load profile for each month for Rankin Inlet was used as the base
profile for each site, with the total annual load scaled to equal the forecast 2025 load for each site
[9].
Diesel Generators
Data on the quantity, capacity and lifetime of diesel generators at each site was retrieved from the
2016 WISE report [4].
Minimum Load Ratio: Diesel generators can operate at different percentages of their rated
capacity. In order to operate as cleanly and efficiently as possible, however, they should be
carrying a minimum load whenever they’re running. 40% is the minimum that is assumed based
on QEC’s past wind energy study.
PV
Large, Tier 1 manufacturers such as Canadian Solar, Trina, Jinko, and JA Solar, produce roughly
equivalent modules. Characteristics typical for these modules were assumed.
Other PV assumptions were:
• Ground reflectance (albedo) of 60% - this is an average, year-round number. Albedo off
snow can be as high as 90%.
Wind
Two different wind turbines were modelled:
1. Northern Power NPS100-21 ARCTIC (formerly known as North Wind 100) with 25m
hydraulic tilt towers (100 kW)

20 ITP/A0313 – September 2019
Renewable Energy in Nunavut Scoping Analysis
2. Enercon E70 57m towers (2.3 MW)
Battery Energy Storage System (BESS)
ITP has assumed that any batteries installed in Nunavut will be lithium-ion. Tesla Powerpack’s
have been installed in a number of large-scale systems in remote locations. They contain
industry-leading thermal management systems, making them suited to the low temperatures that
may be encountered. Two Tesla BESS products were modelled in HOMER:
• Tesla Powerpack 2 4hr (maximum charge/discharge rate allows for a full charge or
discharge in a minimum of 4 hours)
• Tesla Powerpack 2 2hr (maximum charge/discharge rate allows for a full charge or
discharge in a minimum of 2 hours)
Thermal Load
A simplified approach to thermal modelling was developed by quantifying the spilled electricity in
kWh, and then converting this to the equivalent litres of fuel that would be displaced, assuming an
electric boiler efficiency of 85%. This provided a figure of 1L of Arctic Heating Oil displaced per
11.4 kWh of electrical energy spilled.
For example, if there are times when a wind turbine is producing more electricity than is needed
in the community, that extra electricity can instead be used to offset heating loads. The value of
offsetting the carbon tax on the heating fuel is included in these calculations.
3.2.3. Cost Assumptions
Diesel Fuel
The forecast diesel fuel prices for each community in 2018/19 were retrieved from the latest QEC
rate application [2]. The 2024/25 price was calculated assuming an annual increase of 1.5%,
based on information that fuel prices were anticipated to increase by 3% from 2017 to 2019. With
inflation rates at 2% this means the price of fuel is dropping in real terms. The resulting assumed
diesel fuel prices are shown in Table 1.
Carbon Tax and Arctic Heating Oil
While fuel use for electricity generation is exempt from the carbon tax, fuel for heating purposes is
not. A carbon tax of $50/tonne was used in calculating the value of spilled electricity in scenarios
with renewable generation, assuming that excess electricity could be used for heating [10] [11].
Within HOMER, this approach could not be modelled directly. Instead, the excess electricity in
each result was converted into the equivalent avoided heating fuel consumption.

ITP/A0313 – September 2019 21
Renewable Energy in Nunavut Scoping Analysis
The avoided greenhouse gas emissions were determined based on greenhouse gas and fuel use
figures previously published by QEC, which indicate CO2 emissions of 2.82 kg/L of Arctic Heating
Oil combusted.
The value of the avoided heating fuel use was based on 2017/18 average Arctic Heating Oil
prices sourced from fuel sale data provided by the government’s Petroleum and Products Division
[12] for each community. These prices were scaled up to 2024/25 assuming an annual increase
of 1.5%. The resulting assumed Arctic Heating Oil prices are shown in Table 1.
Table 1: Diesel fuel and Arctic Heating Oil prices (2025)
Community Diesel fuel price ($/L)
Arctic Heating Oil price ($/L)
Arctic Bay $1.02 $1.13
Arviat $0.98 $1.09
Baker Lake $1.03 $1.10
Cambridge Bay $1.04 $1.19
Cape Dorset $1.03 $1.13
Chesterfield Inlet $1.03 $1.09
Clyde River $0.98 $1.13
Coral Harbour $1.03 $1.09
Gjoa Haven $1.09 $1.19
Grise Fiord $1.02 $1.13
Hall Beach $1.02 $1.13
Igloolik $1.02 $1.13
Iqaluit $1.02 $0.95
Kimmirut $1.03 $1.13
Kugaaruk $1.09 $1.19
Kugluktuk $1.05 $1.19
Naujaat $1.02 $1.13
Pangnirtung $1.02 $1.13
Pond Inlet $1.02 $1.13
Qikiqtarjuaq $1.02 $1.10
Rankin Inlet $0.98 $1.10
Resolute Bay $1.02 $1.13
Sanikiluaq $1.03 $1.09
Taloyoak $1.09 $1.19
Whale Cove $1.03 $1.09

22 ITP/A0313 – September 2019
Renewable Energy in Nunavut Scoping Analysis
Diesel Generators
The capital costs of diesel generators installed/replaced in Nunavut from 2014-2018 were
retrieved from the latest QEC rate application [2].
A linear regression was applied to create a cost curve that was entered into HOMER for diesel
generator replacement costs. The regression line is shown in Figure 6.
Figure 6: Diesel replacement costs with best fit line
Diesel generator O&M was assumed to be $35/MWcapacity/run-hour, matched to assumptions
found in the QEC-commissioned Wind Prefeasibility Study [6].
Battery Energy Storage System (BESS)
The cost curves for Tesla Powerpack battery systems were based on ITP’s industry knowledge
and project experience. The Tesla Powerpack system includes bi-directional inverters (i.e.
inverters that can both charge and discharge the battery).
$-
$500,000
$1,000,000
$1,500,000
$2,000,000
$2,500,000
$3,000,000
$3,500,000
- 200 400 600 800 1,000 1,200 1,400 1,600
Capital C
ost
Generator Rating (kWp)

ITP/A0313 – September 2019 23
Renewable Energy in Nunavut Scoping Analysis
PV
A cost curve for PV was developed based on ITP’s experience with remote projects, adjusted for
the increased shipping and labour costs in the Arctic, as well as greater risk margins for
contractors. The indicative cost curve developed for Rankin Inlet, for example, was $4.37/W for a
50kW and $3.33/W for a 2MW system. The model assumes all shipping via sea freight, and
scaling as per the methodology mentioned in the Shipping section below. The resulting cost curve
was checked against national data and found to be between approximately 1.5 - 2.0x higher than
‘near future’ installation costs, reflecting the higher costs of remote installation [13].
Wind
The capital costs for 1, 2, 3, 6 and 10 Northern Power turbines from [6] were used to create a cost
curve which was used across all communities. This is shown in Figure 7 below.
Figure 7: Northern Power NPS100C-21 100 kW turbine cost curve
Capital costs for Enercon turbines in Iqaluit, Arviat, Baker Lake, and Rankin Inlet were also set
per [6]. Of these sites, Iqaluit comprised the most data points, with capital costs listed for 2, 3, 4
and 5 turbines. The resulting cost curve (Figure 8) was therefore used as the base data for the
remaining sites, with scaling applied to differentiate between communities.
$-
$10,000
$20,000
$30,000
$40,000
$50,000
$60,000
- 200 400 600 800 1,000 1,200
Capital C
ost
($/k
W)
Installed Capacity (kW)

24 ITP/A0313 – September 2019
Renewable Energy in Nunavut Scoping Analysis
Figure 8: Enercon E-70 2.3M W turbine cost curve Iqaluit
Shipping
All equipment cost curves were approximated to be from Rankin Inlet in the first instance. To
represent the differences in project costs for more remote or accessible communities, a scaling
factor was applied to all component costs (including capital costs, replacement costs, and O&M
costs) indicative of the additional or reduced transport costs incurred. The scaling factors are
listed in Table 9 in Appendix B.2.7.
0
1000
2000
3000
4000
5000
6000
7000
- 2,000 4,000 6,000 8,000 10,000 12,000 14,000
Capital C
ost
($/k
W)
Installed Capacity (kW)

ITP/A0313 – September 2019 25
Renewable Energy in Nunavut Scoping Analysis
4. RESULTS & ANALYSIS
A summary of results from all sites is given in Table 2 and Table 3 below. The first column
indicates the Net Present Cost (NPC) of the base case (i.e. business-as-usual, diesel only
scenario for each community). Net Present Cost accounts for all system costs over the 15-year
lifetime of the system, converted to present terms via the discount rate.
For each scenario of minimum RE contribution (20%, 40% and 60%) the optimal3 configuration is
presented in terms of the Net Present Value (NPV). The NPV represents the difference in NPC
when compared to the base case. A positive NPV indicates a scenario that is financially attractive
(based on the assumptions made), while a negative NPV indicates a scenario is unattractive. Also
presented are the estimated emission reductions; the achieved renewable energy contribution,
and a simplified indication of what technology was involved.
Highlighted in green text is the one case for each community that is considered to be financially
optimal4. Yellow NPV results are those that are negative but greater than -$2m. Red NPV results
are less than -$2m.
In some instances, the RE% achieved exceeds the minimum requirement. This indicates that a
higher RE penetration is preferable over a lower RE penetration (e.g. Chesterfield with 29%
penetration). Similarly, in some cases, a single optimised result fulfils both the 20% and 40%
minimum RE requirement (eg. Rankin Inlet).
Further detail on each result, including the sizing of components, the OPEX impacts, fuel savings,
and the potential value of spilled electricity is included in Appendix C.
3 HOMER optimises in terms of lowest Net Present Cost. 4 The value of spilt electricity has been excluded from this summary analysis but is included and discussed in the appendix.

26 ITP/A0313 – September 2019
Renewable Energy in Nunavut Scoping Analysis
Table 2: Summary of HOMER Pro modelling results – 8% discount rate scenario
5
5 The optimal case for Iqaluit achieves 10% RE with a solar array and no wind or BESS. It has an NPV = $0.6M and reduces CO2-e emissions by 4.1 kt/yr.
Elec
(GWh)
Fuel
(ML)Tech RE (%)
CO2-e
red
(kt/yr)
NPV
($M)
NPV w
Heat
offset
($M)
Tech RE (%)
CO2-e
red
(kt/yr)
NPV
($M)
NPV w
Heat
offset
($M)
Tech RE (%)
CO2-e
red
(kt/yr)
NPV ($M)
NPV w
Heat
offset
($M)
Arctic Bay 3.66 1.34 20 0.54 -2.08 -2.04 40 1.13 -5.05 -4.63 60 1.69 -15.99 -15.76
Arviat 10.30 2.98 20 1.37 -3.36 -3.15 40 2.81 -8.19 -7.58 60 4.24 -17.54 -15.40
Baker Lake 9.22 4.33 20 1.22 -2.13 -1.98 67 4.23 -4.27 -1.90 67 4.23 -4.27 -1.90
Cambridge Bay 13.80 4.66 20 1.94 -6.93 -6.93 40 3.72 -11.85 -11.80 60 5.65 -17.08 -15.98
Cape Dorset 6.09 1.33 20 0.88 -2.84 -2.76 40 1.83 -6.24 -5.83 60 2.78 -14.47 -12.18
Chesterfield Inlet 2.17 0.82 29 0.45 -0.81 -0.79 40 0.64 -1.03 -0.97 60 0.98 -2.01 -1.81
Clyde River 4.32 1.59 20 0.58 -2.76 -2.72 40 1.19 -6.49 -6.14 60 1.79 -16.56 -15.79
Coral Harbour 3.92 1.38 20 0.58 -0.51 -0.43 40 1.20 -0.98 -0.79 60 1.82 -3.19 -2.60
Gjoa Haven 6.64 2.08 20 0.88 -3.68 -3.45 40 1.81 -8.40 -7.97 60 2.74 -23.35 -20.07
Grise Fiord 1.07 0.57 20 0.15 -1.13 -1.12 40 0.32 -2.22 -2.10 60 0.47 -6.68 -6.61
Hall Beach 3.83 1.29 20 0.51 -1.25 -1.23 40 1.05 -2.89 -2.69 60 1.56 -5.46 -5.29
Igloolik 7.76 2.62 20 1.03 -2.90 -2.78 40 2.11 -7.31 -6.82 60 3.19 -21.74 -17.78
Iqaluit 65.90 22.40 20 8.73 -4.06 -3.31 40 17.61 -10.78 -8.88 60 26.76 -25.74 -19.50
Kimmirut 1.99 0.70 21 0.29 -0.89 -0.89 40 0.59 -1.47 -1.33 60 0.90 -3.06 -2.60
Kugaaruk 3.33 1.21 20 0.45 -1.92 -1.89 40 0.92 -4.25 -3.97 60 1.39 -10.95 -9.23
Kugluktuk 6.32 2.69 20 0.84 -4.28 -4.21 40 1.72 -9.90 -9.44 60 2.60 -24.17 -21.07
Naujaat 5.01 1.47 20 0.69 -1.88 -1.87 40 1.40 -4.20 -3.83 60 2.12 -10.90 -9.08
Pangnirtung 6.72 2.00 20 0.97 -2.42 -2.38 40 2.02 -5.75 -5.21 60 3.07 -14.36 -11.97
Pond Inlet 7.17 2.58 20 0.96 -4.23 -4.17 40 1.95 -10.42 -9.86 60 2.95 -36.24 -30.46
Qikiqtarjuaq 3.03 1.01 20 0.46 -2.04 -1.99 40 0.89 -4.54 -4.33 60 1.31 -9.81 -8.83
Rankin Inlet 18.70 5.60 49 6.20 1.74 1.96 49 6.20 1.74 1.96 74 9.46 1.25 7.24
Resolute Bay 4.42 1.90 20 0.59 -2.12 -2.11 45 1.34 -5.02 -4.94 61 1.83 -6.20 -5.72
Sanikiluaq 4.11 1.22 20 0.55 -1.18 -1.13 40 1.13 -2.53 -2.31 62 1.76 -3.81 -3.51
Taloyoak 4.48 1.42 20 0.60 -2.72 -2.71 40 1.22 -6.28 -5.98 60 1.85 -17.21 -14.77
Whale Cove 2.15 0.69 20 0.29 -0.82 -0.79 40 0.59 -1.47 -1.36 60 0.89 -3.26 -2.83
Minimum 60% RE scenario
Community
Annual
Consumption Minimum 20% RE Scenario Minimum 40% RE scenario

ITP/A0313 – September 2019 27
Renewable Energy in Nunavut Scoping Analysis
Table 3. Summary of HOMER Pro modelling results – 4 % Discount Rate
Elec
(GWh)
Fuel
(ML)Tech RE (%)
CO2-e
red
(kt/yr)
NPV
($M)
NPV w
Heat
Offset
($M)
Tech RE (%)
CO2-e
red
(kt/yr)
NPV
($M)
NPV w
Heat
Offset
($M)
Tech RE (%)
CO2-e
red
(kt/yr)
NPV
($M)
NPV w
Heat
Offset
($M)
Arctic Bay 3.66 1.34 20.0 0.54 -1.36 -1.30 40.0 1.12 -3.30 -2.86 60.0 1.69 -13.73 -13.43
Arviat 10.3 2.98 20.0 1.37 -1.81 -1.54 40.0 2.81 -4.73 -3.93 60.0 4.24 -12.33 -9.52
Baker Lake 9.22 4.33 68.5 4.32 1.41 4.32 68.5 4.32 1.41 4.32 68.5 4.32 1.41 4.32
Cambridge Bay 13.8 4.66 25.4 2.41 -4.19 -4.17 40.1 3.79 -6.87 -5.68 60.0 5.63 -10.12 -8.77
Cape Dorset 6.09 1.33 20.0 0.88 -1.92 -1.81 40.0 1.83 -4.11 -3.50 60.0 2.78 -11.30 -8.28
Chesterfield Inlet 2.17 0.82 40.0 0.64 -0.18 -0.10 40.1 0.64 -0.18 -0.10 60.1 0.98 -0.65 -0.38
Clyde River 4.32 1.59 20.0 0.58 -2.06 -2.00 40.0 1.19 -4.88 -4.42 60.4 1.79 -14.25 -13.22
Coral Harbour 3.92 1.38 38.0 1.14 0.87 1.05 40.0 1.20 0.85 1.09 60.0 1.82 -0.37 0.41
Gjoa Haven 6.64 2.08 20.1 0.89 -2.53 -2.47 40.0 1.81 -5.83 -5.09 60.0 2.74 -19.51 -14.86
Grise Fiord 1.07 0.57 20.0 0.15 -0.95 -0.92 40.0 0.32 -1.75 -1.60 60.1 0.47 -6.01 -5.92
Hall Beach 3.83 1.29 20.5 0.52 -0.67 -0.63 40.0 1.05 -1.52 -1.25 60.1 1.57 -3.38 -3.20
Igloolik 7.76 2.62 20.0 1.03 -1.67 -1.41 40.0 2.11 -4.54 -3.89 60.0 3.19 -17.78 -12.23
Iqaluit
Kimmirut 1.99 0.7 25.4 0.36 -0.49 -0.42 40.1 0.59 -0.66 -0.47 60.0 0.90 -1.76 -1.15
Kugaaruk 3.33 1.21 20.3 0.46 -1.08 -1.05 40.0 0.92 -2.49 -2.12 60.0 1.38 -10.11 -9.46
Kugluktuk 6.32 2.69 20.0 0.84 -3.27 -3.18 40.0 1.72 -7.59 -7.00 60.0 2.57 -16.43 -15.87
Naujaat 5.01 1.47 21.3 0.74 -0.94 -0.90 40.0 1.40 -2.21 -1.70 60.0 2.12 -7.93 -5.38
Pangnirtung 6.72 2 20.5 1.00 -1.34 -1.26 40.0 2.02 -3.28 -2.56 60.0 3.07 -10.69 -7.52
Pond Inlet 7.17 2.58 20.0 0.96 -3.08 -3.00 40.0 1.95 -7.92 -7.10 60.0 2.95 -32.94 -24.90
Qikiqtarjuaq 3.03 1.01 20.0 0.46 -1.41 -1.32 40.0 0.89 -3.23 -2.85 60.0 1.31 -7.89 -6.40
Rankin Inlet
Resolute 4.42 1.9 20.7 0.61 -1.36 -1.35 51.2 1.53 -2.96 -2.93 62.4 1.87 -3.33 -3.27
Sanikiluaq 4.11 1.22 20.0 0.55 -0.46 -0.39 40.0 1.13 -0.91 -0.69 62.1 1.76 -1.15 -0.75
Taloyoak 4.48 1.42 20.0 0.63 -1.62 -0.69 40.0 1.22 -4.41 -4.02 60.0 1.85 -14.48 -11.25
Whale Cove 2.15 0.69 20.0 0.30 -0.35 -0.03 40.0 0.59 -0.59 -0.44 60.0 0.89 -1.83 -1.27
Achieved viability with 8% Discount Results above
Achieved viability with 8% Discount Results above
Annual
ConsumptionMinimum 20% RE Scenario Minimum 40% RE Scenario Minimum 60% RE Scenario
Community

28 ITP/A0313 – September 2019
Renewable Energy in Nunavut Scoping Analysis
In Table 2, where an 8% discount rate was assumed, RE appears immediately attractive only for
Rankin Inlet and Iqaluit (highlighted in green). However, nine other communities have RE cases
within $2m of breakeven (highlighted in yellow). This suggests that, where grant funding is
available, RE may be attractive in these communities and further study would be warranted.
In Table 3, a 4% discount rate is assumed, and Baker Lake and Coral Harbour joins Rankin Inlet
and Iqaluit as having a case for immediate implementation of large amounts of renewable energy.
This suggests that, where concessional debt financing is available, and/or investment risk can be
perceived to be low, RE may be attractive in these communities and further study would be
warranted.
In general, the discount rate chosen (a proxy for the cost of capital) has a significant impact on
the financial viability of renewable energy projects as lifecycle costs for wind, solar PV, and
battery storage technologies are predominately capital costs.
Also apparent is that, when higher RE% must be met, the optimal scenarios tend to involve a
single technology type (wind or PV). Technology diversity is only optimal at higher RE fractions in
a small number of sites (e.g. Cambridge Bay, Iqaluit).
Overall, Rankin Inlet stands out as the most convincing instance where renewables are
immediately attractive –49% RE gives an NPV of $1.8M, an IRR of 9.2%, and simple payback of
9.6 years, leading to 6.2 kt/yr of CO2-e abatement, and 2.4 ML of avoided fuel usage each year.
This scenario utilised a single Enercon E-70 turbine with a 1.6 MW / 3.36 MWh Tesla Powerpack.
This result comes most notably due to the strong wind resource and the larger size of the
community. With such a high renewable energy penetration, additional value could be realised by
offsetting up to 21 kL of heating fuel each year with the spilt electricity.
The optimal result for Iqaluit falls halfway between the base case and the minimum 20% RE
scenario. In this case, a 10% RE scenario gives an NPV of $0.6M and leads to 4.1 kt/yr of CO2-e
abatement. This scenario has a 5.36 MW solar array, no wind and no BESS. Previous reports
have indicated a promising wind resource for Iqaluit, but based on the ground measurements
from the RETScreen data sets this has not been found during this study. The effect of uncertainty
with respect to the available wind resource is explored in detail in the sensitivity analysis in the
next section.
The most cost-effective GHG reductions (on the basis of net present cost) occur for lower RE
fractions (where storage requirements, and therefore costs, are lower) and in larger communities
(where RE is larger and therefore cheaper per unit). The top five sites for cost-effective emissions
reduction are Rankin Inlet, Iqaluit, Coral Harbour, Baker Lake, and Chesterfield Inlet (Table 4).
Note that a negative cost indicates that the scenario has a positive net present value (ie. is cost-
effective even without consideration of GHG abatement).

ITP/A0313 – September 2019 29
Renewable Energy in Nunavut Scoping Analysis
Table 4. GHG abatement (net present) cost for five most cost-effective communities
CO2 Abatement. ($'000/t/yr)
Community 20% RE 40% RE 60% RE
Rankin Inlet -0.29 -0.29 -0.14
Iqaluit 0.47 0.61 0.96
Coral Harbour 0.86 0.83 1.76
Baker Lake 1.71 1.02 1.02
Chesterfield Inlet 1.96 1.72 2.04
Sanikiluaq 2.18 2.21 2.16
4.1. Sensitivity Results
The modelling has been undertaken using the best available information and transparent
assumptions – however as with all models, establishment and usage involves uncertainty.
Sensitivity analysis is a useful tool to give a better understanding of the impact of such
uncertainty, and HOMER Pro facilitates such analysis on almost all variables within the model. In
consultation with WWF, Rankin Inlet, Kugluktuk and Sanikiluaq were selected for further analysis,
each representing one of the three regions of Nunavut.
Firstly, two variables were considered most important for this analysis and to inform the audience
– discount rate and diesel price. A project’s discount rate will vary depending on the perspective
of the investor(s). Typically, a public utility will have a lower discount rate than a private
Independent Power Producer (IPP). Discount rate was therefore varied across this spectrum
between 4% and 14% (varying with 2% step changes).
Diesel prices have also historically been volatile on global markets, and geopolitical
developments are likely to continue this trend. The diesel fuel price was therefore varied between
$0.70/L and $2.20/L (varying with $0.30 step changes).
Modelling across both sensitivities (6 x 6) means that there will be a total of 36 optimised results
for each community. The results for Rankin Inlet are plotted in Figure 9.

30 ITP/A0313 – September 2019
Renewable Energy in Nunavut Scoping Analysis
Figure 9: Sensitivity results for Rankin Inlet
The 36 markers represent each modelled case, and for each of these the resulting levelized cost
of energy generation (in $/kWh) is printed.6 The iso-lines on the graph represent the levelized
cost of energy generation. The background colour (or “heatmap”) in this chart represents the
RE% that HOMER found to be optimal for the sensitivity variables on the x and y axes, as per the
legend provided.
As could be expected, the optimal RE fraction has a strong dependence on both the diesel fuel
price and the discount rate. Moving first vertically from bottom of the chart to the top, a higher
diesel price will evidently penalise the configurations that use more diesel. Moving left to right,
higher discount rates will favour technical configurations with a lower initial capex, as is evident in
the 0% RE (diesel only) scenarios in blue becoming increasingly favourable. There is also a
6 It can be noted that the levelized cost of energy generation is substantially lower than the stated Cost of Supply (COS) in the QEC General Rate Application (e.g. 78.16c/kWh for domestic non-government) and the tariff rate born by consumers. This is because HOMER does not account for transmission/distribution costs, transmission/distribution losses, or administrative costs.

ITP/A0313 – September 2019 31
Renewable Energy in Nunavut Scoping Analysis
dramatic step change in which the optimal result changes from low to high renewable energy
mostly due to the optimal componentry being a relatively large step change from zero, one and
then two x 2.3 MW wind turbines.
The reader should note that the results are also heavily site dependent. High RE fractions were
feasible in Rankin Inlet under a much broader range of conditions than both of the other sites.
This is because of the strong wind resource and the larger electricity demand, which allows for
larger turbines and the associated economies-of-scale.
For Kugluktuk and Sanikiluaq, the results are shown in Figure 10 and Figure 11 respectively. For
Kugluktuk, renewable energy scenarios are quite a long way from being economically feasible
and really only optimal in the top left quadrant, with feasibility requiring a discount rate below 6%
and a diesel price increase of around 50%. As solar is most economical given the poor wind
resource, the flexibility in its sizing capacity means the move from high to low RE% is a much
more gradual change.

32 ITP/A0313 – September 2019
Renewable Energy in Nunavut Scoping Analysis
Figure 10: Sensitivity results for Kugluktuk
ITP/A0313 – September 2019 33
Renewable Energy in Nunavut Scoping Analysis
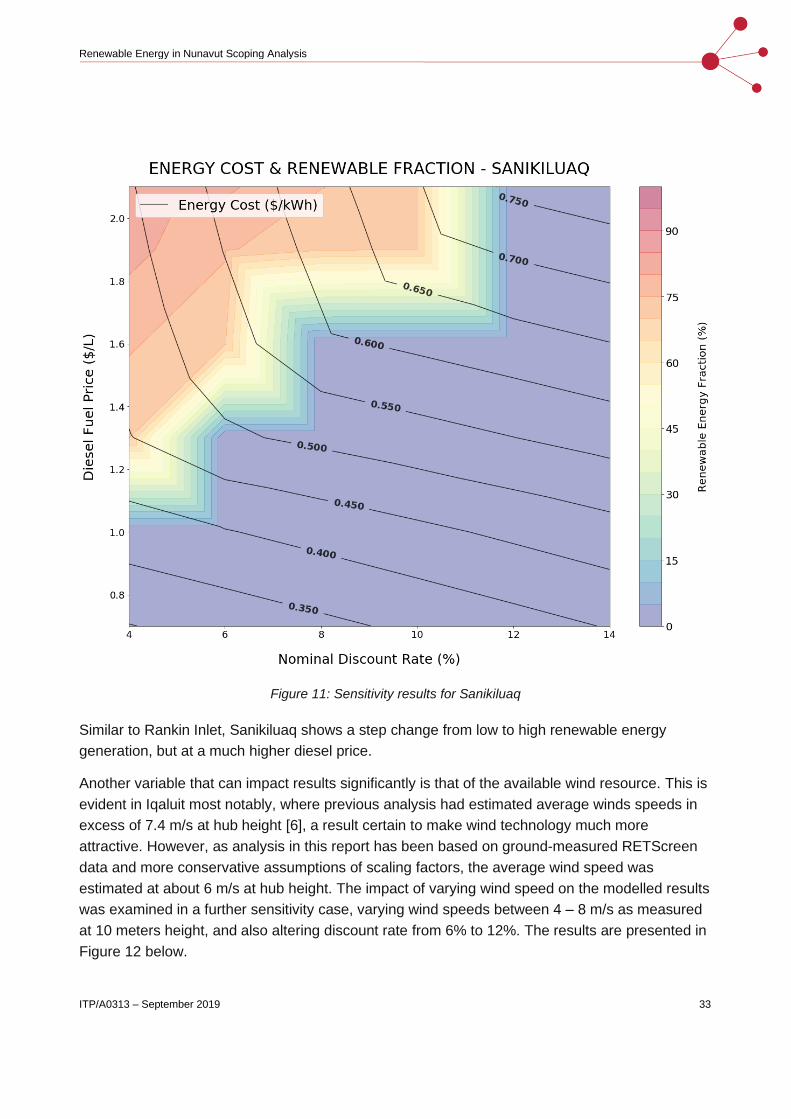
Figure 11: Sensitivity results for Sanikiluaq
Similar to Rankin Inlet, Sanikiluaq shows a step change from low to high renewable energy
generation, but at a much higher diesel price.
Another variable that can impact results significantly is that of the available wind resource. This is
evident in Iqaluit most notably, where previous analysis had estimated average winds speeds in
excess of 7.4 m/s at hub height [6], a result certain to make wind technology much more
attractive. However, as analysis in this report has been based on ground-measured RETScreen
data and more conservative assumptions of scaling factors, the average wind speed was
estimated at about 6 m/s at hub height. The impact of varying wind speed on the modelled results
was examined in a further sensitivity case, varying wind speeds between 4 – 8 m/s as measured
at 10 meters height, and also altering discount rate from 6% to 12%. The results are presented in
Figure 12 below.

34 ITP/A0313 – September 2019
Renewable Energy in Nunavut Scoping Analysis
Figure 12: Wind speed and discount rate sensitivity results for Iqaluit
As can be seen by comparing the vertical results for the 10% discount case, a difference of 1 m/s
average wind speed at ground level can be the difference between an optimal result of no RE vs
an optimal result of approximately 50% RE. The limitations of scaling wind data from such low
hub heights are well known, and this underlines the importance of obtaining reliable wind data at
intended hub heights for communities such as Iqaluit.
ITP/A0313 – September 2019 35
Renewable Energy in Nunavut Scoping Analysis
4.2. Discussion
In comparison to previous reports, it is noteworthy that optimised scenarios have generally
involved a single technology type (wind or PV) instead of a diversity of technologies. This is
expected to be reflective of the steep initial cost curves and also the reduced costs of storage
compared to previous analysis. As storage costs fall, the value of resource diversity is reduced
(e.g. solar complementing periods of low wind, and vice versa).
Data collection proved difficult, both in terms of determining community electrical and thermal
load profiles and also the wind and solar resource, which is often typical at pre-feasibility but are
fundamental inputs for design. Rankin Inlet was the site for which there was the most certainty in
these aspects, with good detail on the load profile that was used to complement information
available for other sites. Meteorological station data was provided by a developer, however the
short duration of the data (4 months) meant that the data could only be used to validate that
average values aligned with those from RETScreen. While this was found to be the case, larger
wind projects would typically need at least 2 years of measured resource before becoming
financeable.
Diesel generator costs were developed based on published information from QEC, but ITP notes
that these are much higher than expected, even for remote locations. We suggest further
clarification with QEC to understand what specifically drives such high costs, and the practicalities
of offsetting this investment with high penetration renewables.
Conservative RE construction costs have been assumed. A large degree of uncertainty remains
about the actual RE costs in these communities, and that implies feasibility of a pilot project in the
largest population towns (either Iqaluit or Rankin Inlet) would be the most suitable pathway
forward.
Given the assumption of an 8% discount rate, only Rankin Inlet and Iqaluit were found to present
an immediate case for RE. However, a 4% discount rate makes RE attractive at Baker Lake and
Coral Harbour also. This highlights the need for access to capital at low interest rates, which
could be improved by better data availability (load and resource data), or even concessional
financing.
Importantly, all HOMER PRO models have been provided to WWF for their future use. In the
short term, these may be updated if and when more detailed data becomes available. Over the
medium to long term, a number of foreseeable developments will also change this analysis. This
includes:
• Increase in diesel fuel prices (the implications of which are shown quite evidently in the
sensitivity analysis).
• Declining costs of energy storage.
36 ITP/A0313 – September 2019
Renewable Energy in Nunavut Scoping Analysis
• Declining cost of solar PV and wind.
• Electricity generation potentially being included in the carbon price.
4.3. Conclusions
This investigation has completed a high-level assessment of the feasibility of renewable energy
integration at 25 sites in Nunavut, across increasing stages of renewable energy penetration.
While available data on renewable energy resource, energy use and diesel generation were
found to be limited in most communities, the intended purpose of the pre-feasibility study is to
identify the sites and technologies for detailed investigation. At the current price of diesel and
renewable energy, both Rankin Inlet and Iqaluit are expected to be promising sites for future RE
development. If concessional financing is available, then Baker Lake and Coral Harbour also
appear suitable for RE integration.
For the remaining sites, renewable energy may not be an attractive proposition in the short-term,
but analysis shows that high renewable energy contributions can be achieved at a small premium
to the current scenario, and this premium may be reduced by a number of factors, such as falling
technology costs or thermal load offsets. Moreover, decreased reliance on diesel fuel would
reduce negative environmental impacts and improve energy reliability and security.
Recommended next steps are:
• reduce uncertainty in wind and solar resource data by installing ground-mounted
monitoring systems;
• reduce uncertainty in wind and solar PV cost estimates by informally approaching the
market (eg. via a Request for Information process);
• conduct feasibility studies for the most prospective sites that consider:
▪ potential RE sites
▪ the condition of the existing generation and distribution infrastructure
▪ the control logic of the existing generation
▪ the impact of RE on the existing distribution network (including protection systems)
▪ investment plans for generation and distribution infrastructure
▪ sources of grant and debt funding, and the expected terms of such funding
▪ community support/opposition for RE developments

ITP/A0313 – September 2019 37
Renewable Energy in Nunavut Scoping Analysis
REFERENCES
[1] Leyland Cecco, “Canada: sea ice prevents crucial supply deliveries to isolated communities | World news | The Guardian.” [Online]. Available: https://www.theguardian.com/world/2018/oct/05/canada-paulatuk-kugluktuk-cambridge-bay-sea-ice-supplies. [Accessed: 11-Mar-2019].
[2] QEC, “QEC 2018/19 General Rate Application,” 2017.
[3] Logan Goldie-Scot, “A Behind the Scenes Take on Lithium-ion Battery Prices | Bloomberg NEF,” Bloomberg New Energy Finance, 2019. [Online]. Available: https://about.bnef.com/blog/behind-scenes-take-lithium-ion-battery-prices/. [Accessed: 14-Mar-2019].
[4] I. Das and C. Canizares, “Renewable Energy Deployment in Canadian Arctic - Phase 1: Pre-Feasibility Studies and Community Engagement for Nunavut,” 2016.
[5] ACEP, “Community Energy Report: Rankin Inlet,” 2017.
[6] J. Pinard, “Potential for Wind Energy in Nunavut Communities Qulliq Energy Corporation,” pp. 1–43, 2016.
[7] “Map of Nunavut.” [Online]. Available: https://www.nrcan.gc.ca/earth-sciences/geography/atlas-canada. [Accessed: 15-Jan-2019].
[8] Government of Canada, “RETScreen - Natural Resources Canada,” Government of Canada and Natural Resources Canada, 2016. .
[9] QEC, “Asset List & Plant Data 14/12/2018.” pp. 1–16, 2018.
[10] D. of F. Government of Canada, “Backgrounder: Fuel Charge Rates in Listed Provinces and Territories.” [Online]. Available: https://www.fin.gc.ca/n18/data/18-097_1-eng.asp. [Accessed: 21-Mar-2019].
[11] Government of Canada, “Nunavut and pollution pricing - Canada.ca.” [Online]. Available: https://www.canada.ca/en/environment-climate-change/services/climate-change/pricing-pollution-how-it-will-work/nunavut.html. [Accessed: 21-Mar-2019].
[12] Government of Nunavut - Petroleum Products Division, “Fuel Sale Data 2017-18.” 2018.
[13] National Energy Board, “The Economics of Solar Power in Canada.” [Online]. Available: https://www.neb-one.gc.ca/nrg/sttstc/lctrct/rprt/cnmcsfslrpwr/rslts-eng.html. [Accessed: 21-Mar-2019].
[14] “Sealift rates for the 2018 season Nunavut Arctic Resupply of Dry Cargo.”
[15] J. Pinard, “Wind Measurements in Sanikiluaq,” 2018.

38 ITP/A0313 – September 2019
Renewable Energy in Nunavut Scoping Analysis
APPENDIX A. NUNAVUT COMMUNITIES, FUEL USE & GENERATOR FLEET
Table 5: Population and fuel consumption for each community
Region Community Population (2017) Annual Fuel Cons
Elec ('000 L)
Annual Fuel Cons Heating (‘000 L)
Qikiqtaaluk Iqaluit 8,011 14,915 22,446
Kivalliq Rankin Inlet 3,106 4,884 5,598
Kivalliq Arviat 2,687 2,353 2,975
Kivalliq Baker Lake 2,197 2,299 4,332
Kitikmeot Cambridge Bay 1,985 3,473 4,662
Qikiqtaaluk Pond Inlet 1,790 1,717 2,580
Qikiqtaaluk Pangnirtung 1,678 1,900 2,001
Qikiqtaaluk Igloolik 1,677 1,696 2,620
Kitikmeot Kugluktuk 1,664 1,575 2,690
Qikiqtaaluk Cape Dorset 1,623 1,704 1,330
Kitikmeot Gjoa Haven 1,484 1,577 2,080
Kivalliq Naujaat 1,099 1,123 1,474
Qikiqtaaluk Clyde River 1,088 992 1,593
Kitikmeot Taloyoak 989 1,068 1,416
Qikiqtaaluk Arctic Bay 973 992 1,339
Kivalliq Coral Harbour 915 1,045 1,380
Qikiqtaaluk Sanikiluaq 914 1,009 1,217
Kitikmeot Kugaaruk 860 754 1,214
Qikiqtaaluk Hall Beach 855 919 1,290
Qikiqtaaluk Qikiqtarjuaq 631 787 1,008
Qikiqtaaluk Kimmirut 514 562 699
Kivalliq Whale Cove 454 512 688
Kivalliq Chesterfield Inlet 395 584 820
Qikiqtaaluk Resolute Bay 247 1,248 1,902
Qikiqtaaluk Grise Fiord 142 374 569
ITP/A0313 – September 2019 39
Renewable Energy in Nunavut Scoping Analysis
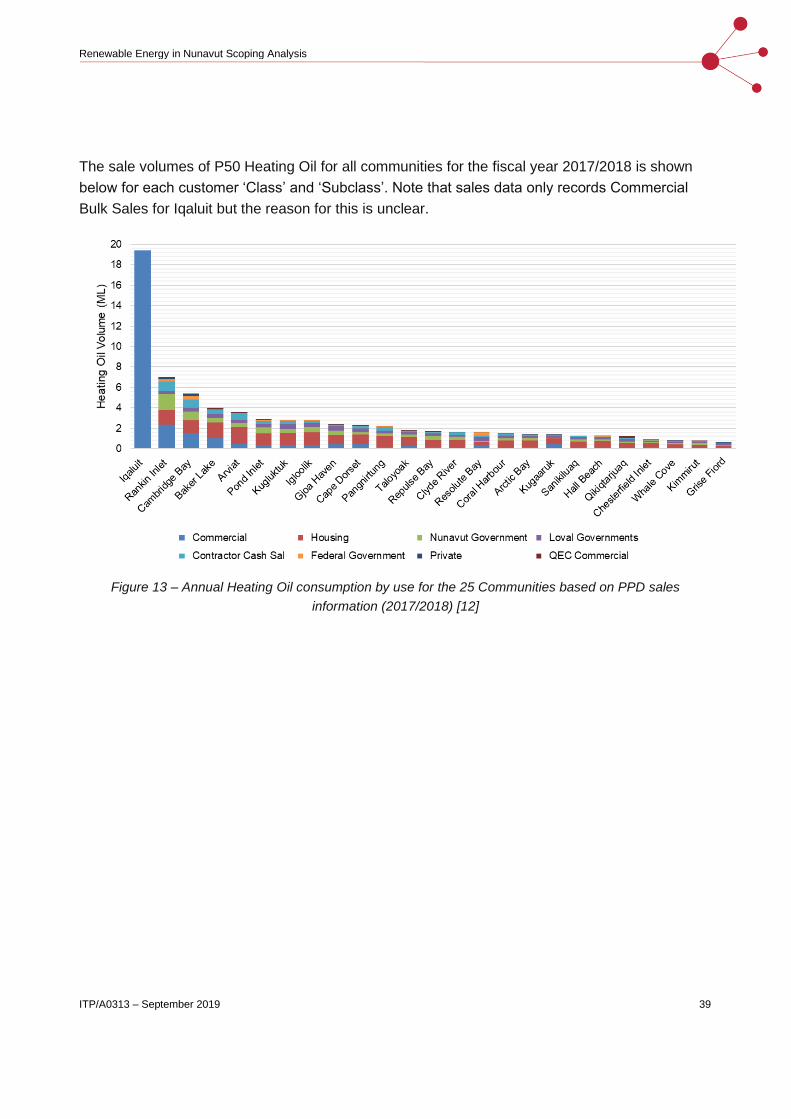
The sale volumes of P50 Heating Oil for all communities for the fiscal year 2017/2018 is shown
below for each customer ‘Class’ and ‘Subclass’. Note that sales data only records Commercial
Bulk Sales for Iqaluit but the reason for this is unclear.
Figure 13 – Annual Heating Oil consumption by use for the 25 Communities based on PPD sales
information (2017/2018) [12]

40 ITP/A0313 – September 2019
Renewable Energy in Nunavut Scoping Analysis
From the sales data, WWF identified a few select categories of end users that could be seen as
potential off takers for excess renewable electricity to be used for heating purposes. The recorded
fuel sale volumes for these users in 2017/2018 is recorded in Table 6 below.
Table 6: Recorded fuel sale volumes based on PPD sales information (2017/2018) [12]
Community User Type P50 Fuel Volume (L)
Rankin Inlet Nunavut Government 1,557,869 Housing 1,465,425
Cambridge Bay Housing 1,231,514 Nunavut Government 854,889 Local Governments 392,029
Baker Lake Housing 1,584,784 Local Governments 441,971 Nunavut Government 421,886
Arviat Housing 1,638,775 Nunavut Government 422,709 Local Governments 316,526
Igloolik Housing 1,268,767 Nunavut Government 525,632 Local Governments 383,419
Pond Inlet Housing 1,220,180 Nunavut Government 560,158 Local Governments 330,112
Kugluktuk Housing 1,183,982 Local Governments 455,144 Nunavut Government 370,191
Gjoa Haven Housing 940,473 Nunavut Government 422,761 Local Governments 404,582
Pangnirtung Housing 1,067,789 Nunavut Government 285,710 Local Governments 272,011
Cape Dorset Housing 964,470 Local Governments 400,445 Nunavut Government 207,586
Repulse Bay Housing 667,480 Nunavut Government 381,965 Local Governments 261,541
Clyde River Housing 782,136 Nunavut Government 275,320 Local Governments 202,216
Coral Harbour Housing 663,433 Local Governments 282,034 Nunavut Government 215,295
Taloyoak Housing 838,221 Nunavut Government 295,318
Arctic Bay Housing 670,263 Nunavut Government 268,880 Local Governments 143,117
Hall Beach Housing 630,325

ITP/A0313 – September 2019 41
Renewable Energy in Nunavut Scoping Analysis
Local Governments 227,910 Nunavut Government 137,940
Sanikiluaq Housing 581,927 Nunavut Government 225,973 Local Governments 171,829
Qikiqtarjuaq Housing 456,754 Local Governments 225,032 Nunavut Government 173,733
Kugaaruk Housing 566,639 Local Governments 205,071 Nunavut Government 72,457
Resolute Bay Local Governments 363,003 Housing 264,108 Nunavut Government 120,975
Whale Cove Housing 353,448 Local Governments 169,913 Nunavut Government 104,246
Kimmirut Housing 305,358 Local Governments 150,564 Nunavut Government 143,600
Chesterfield Inlet Housing 345,648 Nunavut Government 127,261 Local Governments 100,098
Grise Fiord Local Governments 216,643 Housing 173,670 Nunavut Government 56,695

42 ITP/A0313 – September 2019
Renewable Energy in Nunavut Scoping Analysis
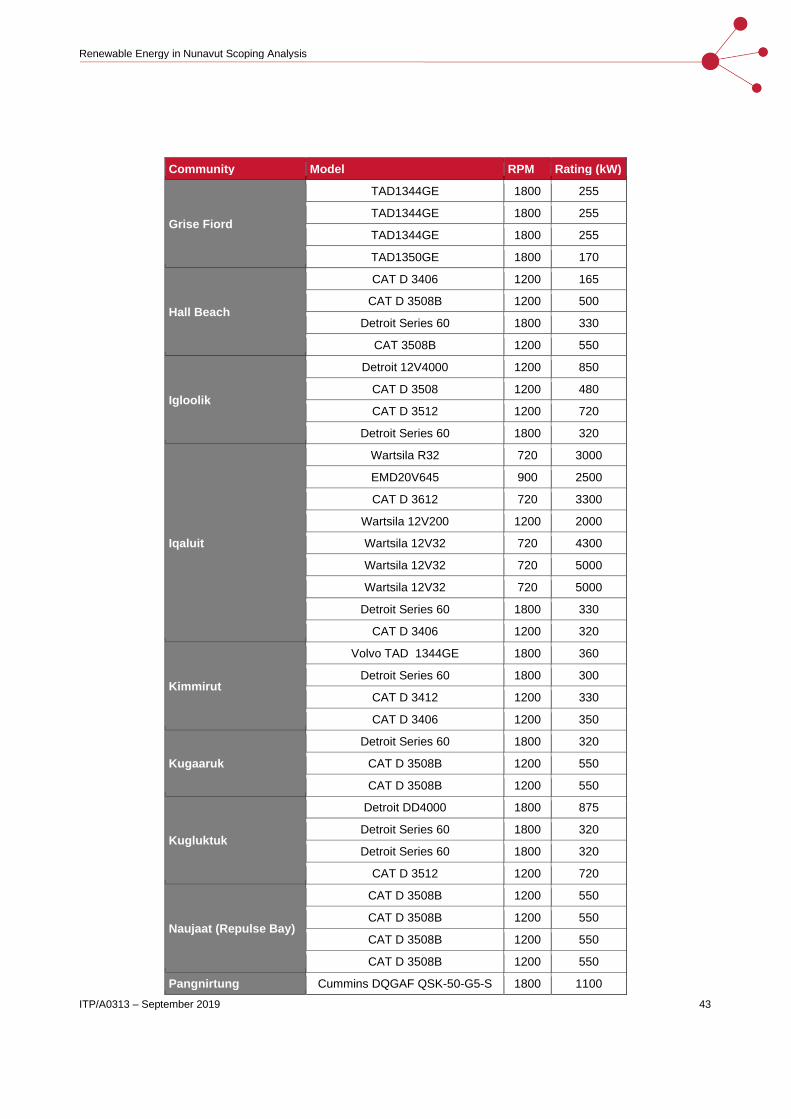
Table 7 Existing generator fleets [9]
Community Model RPM Rating (kW)
Arctic Bay
CAT D 3508 1200 480
CAT D 3406 1200 290
Detroit Series 60 1800 330
Detroit Series 60 1800 320
Arviat
CAT D 3512B 1200 850
CAT D 3508B 1200 550
CAT D 3516B 1200 1100
CAT D 3512B 1200 800
Baker Lake
CAT D 3516B 1200 1100
CAT D 3512B 1200 850
CAT D 3516B 1200 1050
CAT D 3508B 1200 550
Cambridge Bay
Detroit 16V4000 1200 1100
CAT D 3508B 1200 550
CAT D 3512B 1200 1100
Detroit 16V4000 1200 1100
Detroit 16V4000 1200 1100
Cape Dorset
16V4000 G73 MTU 1200 1100
16V4000 G73 MTU 1200 1100
8V4000 M63 MT 1200 525
12V4000 G73 MT 1200 830
Chesterfield Inlet
Detroit Series 60 1800 320
Detroit Series 60 1800 320
CAT D 379 1200 400
Clyde River
CAT 3508B 1200 480
CAT D 3508B 1200 550
Detroit Series 60 1800 330
CAT D 3508B 1800 550
Coral Harbour
CAT D 3508 1200 480
CAT D 3508 1200 420
CAT D 3508 1200 420
Gjoa Haven
CAT D 3512 1200 720
MTU 8V4000 M63 1200 500
Gauscor SF360TA 1200 550
CAT 3508B 1200 550
ITP/A0313 – September 2019 43
Renewable Energy in Nunavut Scoping Analysis
Community Model RPM Rating (kW)
Grise Fiord
TAD1344GE 1800 255
TAD1344GE 1800 255
TAD1344GE 1800 255
TAD1350GE 1800 170
Hall Beach
CAT D 3406 1200 165
CAT D 3508B 1200 500
Detroit Series 60 1800 330
CAT 3508B 1200 550
Igloolik
Detroit 12V4000 1200 850
CAT D 3508 1200 480
CAT D 3512 1200 720
Detroit Series 60 1800 320
Iqaluit
Wartsila R32 720 3000
EMD20V645 900 2500
CAT D 3612 720 3300
Wartsila 12V200 1200 2000
Wartsila 12V32 720 4300
Wartsila 12V32 720 5000
Wartsila 12V32 720 5000
Detroit Series 60 1800 330
CAT D 3406 1200 320
Kimmirut
Volvo TAD 1344GE 1800 360
Detroit Series 60 1800 300
CAT D 3412 1200 330
CAT D 3406 1200 350
Kugaaruk
Detroit Series 60 1800 320
CAT D 3508B 1200 550
CAT D 3508B 1200 550
Kugluktuk
Detroit DD4000 1800 875
Detroit Series 60 1800 320
Detroit Series 60 1800 320
CAT D 3512 1200 720
Naujaat (Repulse Bay)
CAT D 3508B 1200 550
CAT D 3508B 1200 550
CAT D 3508B 1200 550
CAT D 3508B 1200 550
Pangnirtung Cummins DQGAF QSK-50-G5-S 1800 1100

44 ITP/A0313 – September 2019
Renewable Energy in Nunavut Scoping Analysis
Community Model RPM Rating (kW)
Cummins DQGAF QSK-50-G5-S 1800 1100
Cummins DQGAA QST=30-G5 1800 680
C27 Caterpillar MJE03777 1800 550
Pond Inlet
CAT D 3512 1200 720
Detroit12V4000 1200 850
Gauscor SF360TA 1200 550
Gauscor SF360TA 1200 550
Qikiqtarjuaq
MTU 8V1600 B3OS 1800 300
CAT D 3508B 1200 550
CAT D 3508B 1200 550
CAT C15 1800 370
Rankin Inlet
CAT D 3516 1200 950
CAT D 3606 900 1500
EMD 8V710 900 1450
EMD L12V710 900 2150
Detroit 12V4000 1200 820
Resolute Bay
Detroit Series 60 1800 320
F2895 Waukesha 1200 350
Detroit 8V400 1200 500
CAT D 3406E 1200 320
CAT D 3406E 1200 320
Sanikiluaq
Detroit Series 60 1800 330
CAT D 3508B 1200 550
CAT D 3508B 1200 550
Taloyoak
CAT C15 1800 370
CAT 3508B 1200 550
CAT 3508B 1200 550
CAT C15 1800 370
Whale Cove
CAT D 3412 1200 300
CAT D 3412 1200 300
CAT D 3406 1200 150
Detroit Series 60 1800 320

ITP/A0313 – September 2019 45
Renewable Energy in Nunavut Scoping Analysis
APPENDIX B. HOMER MODEL PARAMETERS
B.1. System Dispatch and Operation
The following operating settings were assumed:
• Load-following dispatch strategy
• Allow system with multiple generators
• Allow systems with two types of wind turbines
• Allow generators to operate simultaneously
• Allow system with generator capacities less than peak load
• Allow diesel-off operation.
B.2. System Components
B.2.1. Electrical Load
The day-to-day variability and timestep variability for each site were set so that the resulting peak
annual load in HOMER was close (within ±2%) to the forecast 2025 peak load.
B.2.2. Diesel Generators
Generic HOMER diesel generator models were used, as the HOMER library contains only a
limited selection of specific generator models. Within each site, the same generic model was used
for all generators, including fuel curve and cost curve, with only the capacity adjusted.
B.2.3. PV
All PV was assumed to be south-facing. The optimal tilt angle for each site was determined to
within 5° by modelling a range of angles in HOMER. These are shown in Table 8.
Table 8 Optimised PV array tilt angles
Community Tilt Angle
Arctic Bay 70°
Arviat 55°
Baker Lake 60°
Cambridge Bay 60°
Cape Dorset 60°
Chesterfield Inlet 60°
Clyde River 60°

46 ITP/A0313 – September 2019
Renewable Energy in Nunavut Scoping Analysis
Community Tilt Angle
Coral Harbour 60°
Gjoa Haven 60°
Grise Fiord 70°
Hall Beach 60°
Igloolik 60°
Iqaluit 60°
Kimmirut 55°
Kugaaruk 60°
Kugluktuk 60°
Naujaat (Repulse Bay) 60°
Pangnirtung 60°
Pond Inlet 70°
Qikiqtarjuaq 60°
Rankin Inlet 55°
Resolute Bay 70°
Sanikiluaq 50°
Taloyoak 60°
Whale Cove 55°
PV parameters entered were:
• Efficiency at STC of 16%
• Temperature coefficient of -0.4%/°C
• Derating factor of 80%. The derating factor is a scaling factor used to represent overall
efficiency of the system, taking into account real-world operating conditions. It accounts
for factors such as soiling of the panels, wiring losses, shading, module aging, etc. Since
the inverter was not explicitly modelled as a separate component (see below), it also
accounts for the inverter efficiency.
The PV component was modelled on the AC bus in HOMER. The inverter was not explicitly
modelled as a separate component. This means that the inverter is automatically sized to match
the PV. Modelling and sizing of particular inverter models is recommended at the feasibility
stage, but would have negligible impact on results at the pre-feasibility stage.
B.2.4. Wind
The 2016 wind report [6] discussed modelling of two different wind turbine models in Nunavut.
ITP has chosen to use the same wind turbines due to the cost data available in the report for
these models.

ITP/A0313 – September 2019 47
Renewable Energy in Nunavut Scoping Analysis
The Enercon E70 and Northern Power NPS100C-21 are both available as pre-built models within
HOMER. The hub heights were chosen as 57m and 25m respectively to match the specifications
in the report.
B.2.5. BESS
The Tesla Powerpack 4hr was available as a pre-built model within HOMER. The Tesla
Powerpack 2hr model was created by copying the 4hr model and changing the relevant
parameters.
Tesla Powerpacks do not require a separate inverter, as the inverter technology is built-in to
create an all-in-one solution. However, HOMER requires a separate Converter component. To
model this, a generic, large capacity Converter component was added to the model, with cost set
to zero and efficiency set to 100%. The efficiency of the Powerpack as a whole unit, including the
inverter component, is taken into account in the Battery component round-trip efficiency.
B.2.6. Component Lifetimes
HOMER applies a salvage value to all components which are not at the end of their life at the end
of the project analysis period (15 years, in this case), which is counted as positive cashflow. For
most components, it is in fact unlikely that any value will be able to realised from the assets at this
point. Batteries are an exception (e.g. batteries can be expected to retain value depending on
their age and usage, and could be sold by an IPP to QEC at the end of the project period).
Therefore, in order to avoid an unrealistic salvage value at the end of the modelled project
lifetime, where possible the component lifetime for the other components was set to either the
project analysis period (zero salvage value), or a factor of the project analysis period (to minimise
the total salvage value).
• PV (and inverter): 15 years
• Wind turbines: 15 years
• Batteries: 10 years or 3,500 cycles
• Generators: The expected lifetime (in run hours) was based on the 2016 WISE report. We
note that this will result in a salvage value for the generators at the end of the project;
however, the effect on results is minor.

48 ITP/A0313 – September 2019
Renewable Energy in Nunavut Scoping Analysis
B.2.7. Shipping
Table 9 Shipping cost scaling factors
Community Scaling factor
Arctic Bay 1.07
Arviat 1.00
Baker Lake 1.00
Cambridge Bay 1.25
Cape Dorset 0.93
Chesterfield Inlet 1.00
Clyde River 1.07
Coral Harbour 1.00
Gjoa Haven 1.25
Grise Fiord 1.07
Hall Beach 1.01
Igloolik 1.01
Iqaluit 0.82
Kimmirut 0.93
Kugaaruk 1.07
Kugluktuk 1.25
Naujaat (Repulse Bay) 1.01
Pangnirtung 0.93
Pond Inlet 1.07
Qikiqtarjuaq 1.07
Rankin Inlet 1.00
Resolute Bay 1.07
Sanikiluaq 1.04
Taloyoak 1.25
Whale Cove 1.00

ITP/A0313 – September 2019 49
Renewable Energy in Nunavut Scoping Analysis
APPENDIX C. DETAILED RESULTS
C.1. Results
The results for each community are displayed in tables below. The first row in each table presents the base case, which can be
considered ‘business as usual’ – i.e. no renewable energy and no capital costs. The proceeding rows are the category winners for
each of the minimum RE% constraints considered in this analysis (20%, 40%, 60%). The table summarises the scenarios that
achieve the lowest Net Present Cost (NPC) while still meeting the RE% constraint. The NPC of each base case is presented, and
the Net Present Values (NPV) of RE scenarios (relative to the base case) are presented in the same column, such that positive
NPV’s indicate a financially attractive project. For these cases, the Nominal Internal Rate of Return (Nom. IRR) has been calculated.
Lines that have been presented in grey text are repeats of lower RE% constraint results that continue to win the NPC optimisation
for higher RE% values.
Solar Wind BESS Results Compared to
Base Case
Without Heating Offset With Heating Offset
Community
Minimum RE%
constraint RE%
achieved PV
(kW) E-70
2.3MW NPS100 100kW
PP2 2hr
PP2 4hr
NPCBC/NPV ($M)
COE ($/kWh)
CAPEX ($M)
OPEX ($M/yr)
Fuel Elec
(ML/Yr) Spilt Elec (MWh/yr)
Spilt Elec (Eq. kL)
NPCBC/NPV ($M)
Nom IRR (%)
Reduction CO2-e (t/yr)
Arctic Bay
Base case 0 0 0 0 0 0 18.1 0.49 6.3 1.2 1.1 0 0 18.1 - -
20% 20 812 0 0 5 0 -2.1 0.55 10.3 1.0 0.9 30 4 -2.0 543
40% 40 1942 0 0 0 18 -5.1 0.63 15.6 0.8 0.7 328 40 -4.6 1133
60% 60 1842 0 6 0 40 -16.0 0.93 27.8 0.6 0.4 176 21 -15.8 1687
Arviat
Base case 0 0 0 0 0 0 37.3 0.37 8.1 3.0 2.7 0 0 37.3 - -
20% 20 2036 0 0 7 0 -3.4 0.40 16.1 2.5 2.2 164 20 -3.2 1372
40% 40 4303 0 0 0 37 -8.2 0.45 26.2 2.0 1.6 479 58 -7.6 2808
60% 60 7421 0 0 0 78 -17.5 0.54 40.2 1.5 1.1 1694 206 -15.4 4244
Baker Lake Base case 0 0 0 0 0 0 35.3 0.39 8.4 2.7 2.4 0 0 35.3 - -
20% 20 1570 0 0 7 0 -2.1 0.41 14.9 2.3 2.0 118 14 -2.0 1225
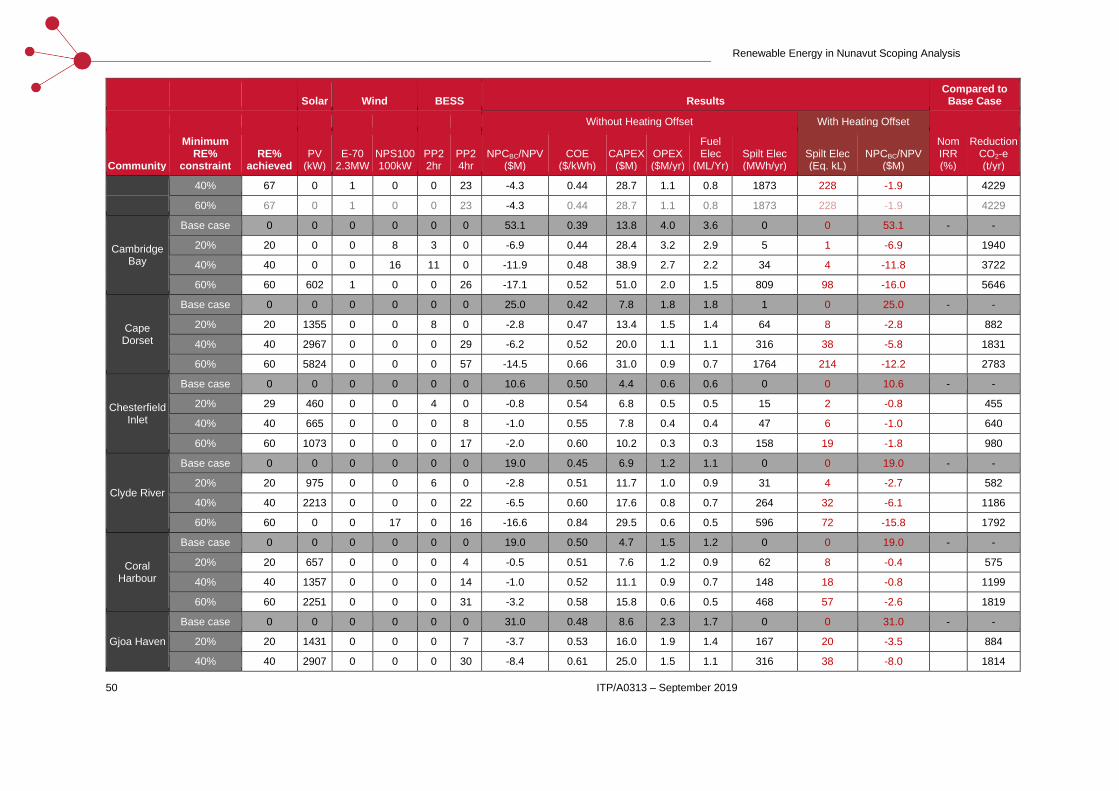
50 ITP/A0313 – September 2019
Renewable Energy in Nunavut Scoping Analysis
Solar Wind BESS Results Compared to
Base Case
Without Heating Offset With Heating Offset
Community
Minimum RE%
constraint RE%
achieved PV
(kW) E-70
2.3MW NPS100 100kW
PP2 2hr
PP2 4hr
NPCBC/NPV ($M)
COE ($/kWh)
CAPEX ($M)
OPEX ($M/yr)
Fuel Elec
(ML/Yr) Spilt Elec (MWh/yr)
Spilt Elec (Eq. kL)
NPCBC/NPV ($M)
Nom IRR (%)
Reduction CO2-e (t/yr)
40% 67 0 1 0 0 23 -4.3 0.44 28.7 1.1 0.8 1873 228 -1.9 4229
60% 67 0 1 0 0 23 -4.3 0.44 28.7 1.1 0.8 1873 228 -1.9 4229
Cambridge Bay
Base case 0 0 0 0 0 0 53.1 0.39 13.8 4.0 3.6 0 0 53.1 - -
20% 20 0 0 8 3 0 -6.9 0.44 28.4 3.2 2.9 5 1 -6.9 1940
40% 40 0 0 16 11 0 -11.9 0.48 38.9 2.7 2.2 34 4 -11.8 3722
60% 60 602 1 0 0 26 -17.1 0.52 51.0 2.0 1.5 809 98 -16.0 5646
Cape Dorset
Base case 0 0 0 0 0 0 25.0 0.42 7.8 1.8 1.8 1 0 25.0 - -
20% 20 1355 0 0 8 0 -2.8 0.47 13.4 1.5 1.4 64 8 -2.8 882
40% 40 2967 0 0 0 29 -6.2 0.52 20.0 1.1 1.1 316 38 -5.8 1831
60% 60 5824 0 0 0 57 -14.5 0.66 31.0 0.9 0.7 1764 214 -12.2 2783
Chesterfield Inlet
Base case 0 0 0 0 0 0 10.6 0.50 4.4 0.6 0.6 0 0 10.6 - -
20% 29 460 0 0 4 0 -0.8 0.54 6.8 0.5 0.5 15 2 -0.8 455
40% 40 665 0 0 0 8 -1.0 0.55 7.8 0.4 0.4 47 6 -1.0 640
60% 60 1073 0 0 0 17 -2.0 0.60 10.2 0.3 0.3 158 19 -1.8 980
Clyde River
Base case 0 0 0 0 0 0 19.0 0.45 6.9 1.2 1.1 0 0 19.0 - -
20% 20 975 0 0 6 0 -2.8 0.51 11.7 1.0 0.9 31 4 -2.7 582
40% 40 2213 0 0 0 22 -6.5 0.60 17.6 0.8 0.7 264 32 -6.1 1186
60% 60 0 0 17 0 16 -16.6 0.84 29.5 0.6 0.5 596 72 -15.8 1792
Coral Harbour
Base case 0 0 0 0 0 0 19.0 0.50 4.7 1.5 1.2 0 0 19.0 - -
20% 20 657 0 0 0 4 -0.5 0.51 7.6 1.2 0.9 62 8 -0.4 575
40% 40 1357 0 0 0 14 -1.0 0.52 11.1 0.9 0.7 148 18 -0.8 1199
60% 60 2251 0 0 0 31 -3.2 0.58 15.8 0.6 0.5 468 57 -2.6 1819
Gjoa Haven
Base case 0 0 0 0 0 0 31.0 0.48 8.6 2.3 1.7 0 0 31.0 - -
20% 20 1431 0 0 0 7 -3.7 0.53 16.0 1.9 1.4 167 20 -3.5 884
40% 40 2907 0 0 0 30 -8.4 0.61 25.0 1.5 1.1 316 38 -8.0 1814

ITP/A0313 – September 2019 51
Renewable Energy in Nunavut Scoping Analysis
Solar Wind BESS Results Compared to
Base Case
Without Heating Offset With Heating Offset
Community
Minimum RE%
constraint RE%
achieved PV
(kW) E-70
2.3MW NPS100 100kW
PP2 2hr
PP2 4hr
NPCBC/NPV ($M)
COE ($/kWh)
CAPEX ($M)
OPEX ($M/yr)
Fuel Elec
(ML/Yr) Spilt Elec (MWh/yr)
Spilt Elec (Eq. kL)
NPCBC/NPV ($M)
Nom IRR (%)
Reduction CO2-e (t/yr)
60% 60 6218 0 0 0 67 -23.3 0.84 42.7 1.2 0.7 2411 293 -20.1 2741
Grise Fiord
Base case 0 0 0 0 0 0 8.2 0.78 5.6 0.3 0.3 0 0 8.2 - -
20% 20 301 0 0 2 0 -1.1 0.89 7.3 0.2 0.3 14 2 -1.1 154
40% 40 690 0 0 0 7 -2.2 1.00 9.3 0.1 0.2 89 11 -2.1 322
60% 60 257 0 3 0 4 -6.7 1.42 14.3 0.1 0.1 49 6 -6.6 473
Hall Beach
Base case 0 0 0 0 0 0 16.7 0.45 6.1 1.1 1.0 0 0 16.7 - -
20% 20 655 0 0 4 0 -1.2 0.48 9.2 0.9 0.8 15 2 -1.2 512
40% 40 1446 0 0 0 16 -2.9 0.52 13.0 0.7 0.6 156 19 -2.7 1047
60% 60 339 0 6 0 8 -5.5 0.59 17.8 0.5 0.4 136 16 -5.3 1564
Igloolik
Base case 0 0 0 0 0 0 29.7 0.39 7.0 2.3 2.0 0 0 29.7 - -
20% 20 1541 0 0 7 0 -2.9 0.43 13.6 1.9 1.6 94 11 -2.8 1033
40% 40 3333 0 0 0 34 -7.3 0.49 22.0 1.5 1.2 377 46 -6.8 2110
60% 60 7328 0 0 0 79 -21.7 0.68 39.3 1.2 0.8 3047 370 -17.8 3189
Iqaluit
Base case 0 0 0 0 0 0 216.2 0.34 32.7 18.7 17.2 0 0 216.2 - -
10%7 10 5360 0 0 0 0 0.7 0.33 46.7 17.3 15.6 31 4 0.7 8.9% 4104
20% 20 11811 0 0 46 0 -4.1 0.34 68.2 15.5 13.8 671 82 -3.3 8730
40% 40 7899 4 0 48 0 -10.8 0.35 102.2 12.8 10.5 1710 208 -8.9 17608
60% 60 14887 6 0 0 175 -25.7 0.38 148.4 9.6 7.0 5600 681 -19.5 26757
Kimmirut
Base case 0 0 0 0 0 0 11.0 0.57 5.3 0.6 0.6 0 0 11.0 - -
20% 21 394 0 0 3 0 -0.9 0.61 7.3 0.5 0.5 3 0 -0.9 291
40% 40 878 0 0 0 8 -1.5 0.64 9.2 0.3 0.4 110 13 -1.3 588
60% 60 1510 0 0 0 17 -3.1 0.72 12.1 0.2 0.2 359 44 -2.6 899
Kugaaruk Base case 0 0 0 0 0 0 15.6 0.48 5.1 1.1 0.9 0 0 15.6 - -
7 This is the only case where a system with <20% RE has a positive NPV. It is included because it is the optimal case for Iqaluit.

52 ITP/A0313 – September 2019
Renewable Energy in Nunavut Scoping Analysis
Solar Wind BESS Results Compared to
Base Case
Without Heating Offset With Heating Offset
Community
Minimum RE%
constraint RE%
achieved PV
(kW) E-70
2.3MW NPS100 100kW
PP2 2hr
PP2 4hr
NPCBC/NPV ($M)
COE ($/kWh)
CAPEX ($M)
OPEX ($M/yr)
Fuel Elec
(ML/Yr) Spilt Elec (MWh/yr)
Spilt Elec (Eq. kL)
NPCBC/NPV ($M)
Nom IRR (%)
Reduction CO2-e (t/yr)
20% 20 709 0 0 5 0 -1.9 0.54 8.8 0.9 0.7 17 2 -1.9 451
40% 40 1617 0 0 0 16 -4.2 0.61 13.1 0.7 0.5 200 24 -4.0 920
60% 60 3424 0 0 0 34 -10.9 0.82 21.3 0.5 0.4 1268 154 -9.2 1390
Kugluktuk
Base case 0 0 0 0 0 0 27.3 0.44 8.5 1.9 1.7 0 0 27.3 - -
20% 20 1312 0 0 7 0 -4.3 0.51 15.7 1.6 1.3 50 6 -4.2 841
40% 40 2913 0 0 0 28 -9.9 0.60 24.6 1.3 1.0 332 40 -9.4 1717
60% 60 6160 0 0 0 59 -24.2 0.83 41.3 1.0 0.7 2286 278 -21.1 2596
Naujaat
Base case 0 0 0 0 0 0 22.6 0.46 6.8 1.6 1.3 0 0 22.6 - -
20% 20 972 0 0 7 0 -1.9 0.50 11.5 1.3 1.1 10 1 -1.9 692
40% 40 2235 0 0 0 21 -4.2 0.55 16.9 1.0 0.8 296 36 -3.8 1403
60% 60 4311 0 0 0 45 -10.9 0.68 26.1 0.8 0.5 1438 175 -9.1 2119
Pangnirtung
Base case 0 0 0 0 0 0 28.5 0.43 7.7 2.1 2.0 0 0 28.5 - -
20% 20 1411 0 0 9 0 -2.4 0.47 13.5 1.8 1.6 32 4 -2.4 972
40% 40 3246 0 0 0 30 -5.8 0.52 20.8 1.4 1.2 420 51 -5.2 2020
60% 60 6132 0 0 0 66 -14.4 0.65 32.7 1.0 0.8 1840 224 -12.0 3073
Pond Inlet
Base case 0 0 0 0 0 0 29.3 0.42 7.8 2.2 1.9 0 0 29.3 - -
20% 20 1629 0 0 10 0 -4.2 0.48 15.5 1.8 1.5 47 6 -4.2 959
40% 40 3701 0 0 0 38 -10.4 0.57 25.4 1.5 1.1 433 53 -9.9 1955
60% 60 9669 0 0 0 103 -36.2 0.93 52.5 1.3 0.8 4456 542 -30.5 2954
Qikiqtarjuaq
Base case 0 0 0 0 0 0 15.2 0.51 6.7 0.9 0.8 71 9 15.1 - -
20% 20 766 0 0 4 0 -2.0 0.58 10.4 0.7 0.6 98 12 -2.0 460
40% 40 1588 0 0 0 16 -4.5 0.67 14.6 0.5 0.5 228 28 -4.3 886
60% 60 2899 0 0 0 34 -9.8 0.84 21.2 0.4 0.3 816 99 -8.8 1312
Rankin Inlet Base case 0 0 0 0 0 0 65.2 0.36 13.4 5.3 4.9 0 0 65.2 - -
20% 49 0 1 0 16 0 1.7 0.35 34.5 3.0 2.5 171 21 2.0 9.2 6196
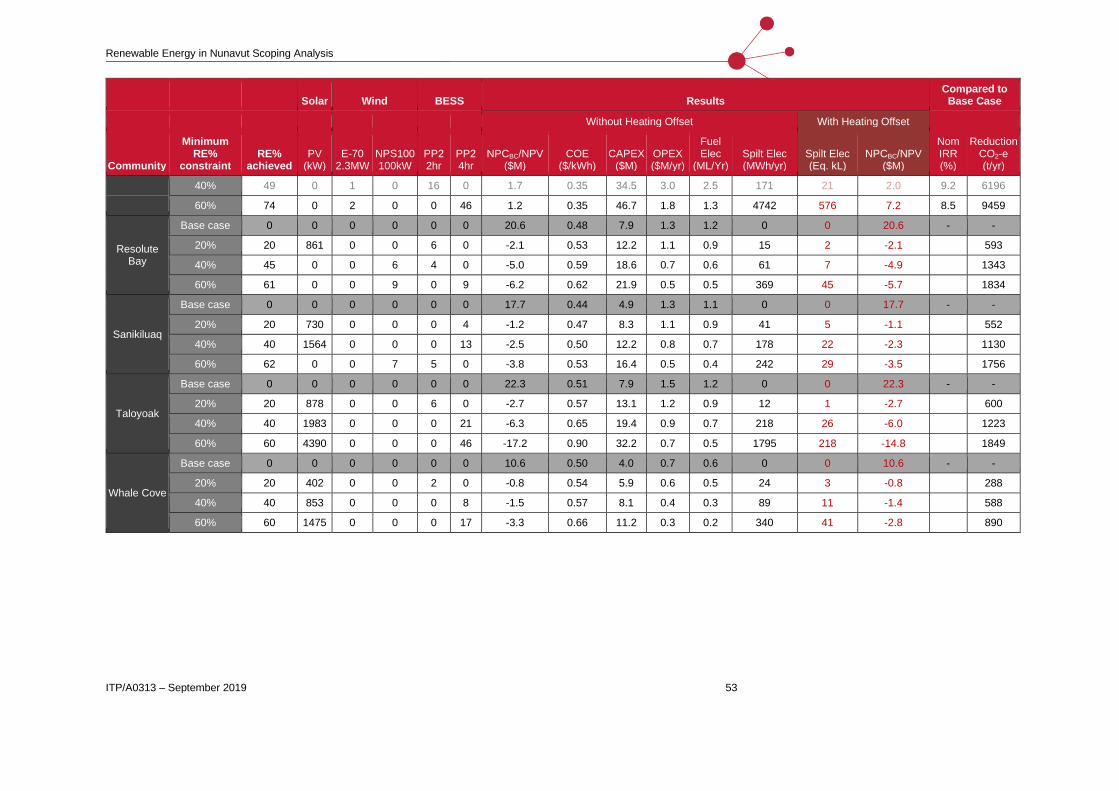
ITP/A0313 – September 2019 53
Renewable Energy in Nunavut Scoping Analysis
Solar Wind BESS Results Compared to
Base Case
Without Heating Offset With Heating Offset
Community
Minimum RE%
constraint RE%
achieved PV
(kW) E-70
2.3MW NPS100 100kW
PP2 2hr
PP2 4hr
NPCBC/NPV ($M)
COE ($/kWh)
CAPEX ($M)
OPEX ($M/yr)
Fuel Elec
(ML/Yr) Spilt Elec (MWh/yr)
Spilt Elec (Eq. kL)
NPCBC/NPV ($M)
Nom IRR (%)
Reduction CO2-e (t/yr)
40% 49 0 1 0 16 0 1.7 0.35 34.5 3.0 2.5 171 21 2.0 9.2 6196
60% 74 0 2 0 0 46 1.2 0.35 46.7 1.8 1.3 4742 576 7.2 8.5 9459
Resolute Bay
Base case 0 0 0 0 0 0 20.6 0.48 7.9 1.3 1.2 0 0 20.6 - -
20% 20 861 0 0 6 0 -2.1 0.53 12.2 1.1 0.9 15 2 -2.1 593
40% 45 0 0 6 4 0 -5.0 0.59 18.6 0.7 0.6 61 7 -4.9 1343
60% 61 0 0 9 0 9 -6.2 0.62 21.9 0.5 0.5 369 45 -5.7 1834
Sanikiluaq
Base case 0 0 0 0 0 0 17.7 0.44 4.9 1.3 1.1 0 0 17.7 - -
20% 20 730 0 0 0 4 -1.2 0.47 8.3 1.1 0.9 41 5 -1.1 552
40% 40 1564 0 0 0 13 -2.5 0.50 12.2 0.8 0.7 178 22 -2.3 1130
60% 62 0 0 7 5 0 -3.8 0.53 16.4 0.5 0.4 242 29 -3.5 1756
Taloyoak
Base case 0 0 0 0 0 0 22.3 0.51 7.9 1.5 1.2 0 0 22.3 - -
20% 20 878 0 0 6 0 -2.7 0.57 13.1 1.2 0.9 12 1 -2.7 600
40% 40 1983 0 0 0 21 -6.3 0.65 19.4 0.9 0.7 218 26 -6.0 1223
60% 60 4390 0 0 0 46 -17.2 0.90 32.2 0.7 0.5 1795 218 -14.8 1849
Whale Cove
Base case 0 0 0 0 0 0 10.6 0.50 4.0 0.7 0.6 0 0 10.6 - -
20% 20 402 0 0 2 0 -0.8 0.54 5.9 0.6 0.5 24 3 -0.8 288
40% 40 853 0 0 0 8 -1.5 0.57 8.1 0.4 0.3 89 11 -1.4 588
60% 60 1475 0 0 0 17 -3.3 0.66 11.2 0.3 0.2 340 41 -2.8 890

54 ITP/A0313 – September 2019
Renewable Energy in Nunavut Scoping Analysis
C.2. Site Commentary
Commentary for each of the sites is provided below, summarising the results and highlighting any
interesting aspects of the scenario. It is not an exhaustive discussion.
• Arctic Bay: $2M of grant funding could make 20% RE financially attractive. This represents
about a 12% increase on the base case NPC based on our initial assumptions and currently
available wind and solar data. There were no ground measurements available, so further data
collection on the wind and solar resource should be conducted.
• Arviat: No immediate financial case for RE is apparent, however there were data gaps for this
community. PV was favoured over wind in all the optimised scenarios. There were no ground
measurements for wind and solar data available. Further investigation is needed, and it is
acknowledged that the data being collected at NRStor’s met tower may be supplying better
information on the viability of renewable energy projects for Arviat.
• Baker Lake: Baker Lake is a community that warrants further study. Based on currently
available data, there is no immediate financial case for RE, but around $2M of grant funding
could make 20% RE financially viable. This represents about a 6% increase on the base case
NPC. The optimisation favoured PV for the 20% RE case and wind for the higher % RE
cases. Ground measurements were available for both solar and wind resources. Top-five
community for cost-effective CO2 reduction and highest average solar resource. The
consumption of heating oil is high relative to consumption for generation, which suggests that
offsetting heating with RE is worth further investigation. If the heating potential of the spilt
electricity can be realised, 67% RE would be financially viable with around $2M in grant
funding. This is a borderline case that warrants further investigation, particularly the potential
for offsetting heating with RE. In addition, the financial sensitivity analysis revealed that Baker
Lake is significantly affected by the rate at which they can access capital for projects. A 4%
discount rate showed that 68.5% renewable energy penetration becomes immediately
attractive for the community, so effort spent on securing favourable financing terms would be
worthwhile.
• Cambridge Bay: No immediate financial case for RE is apparent. Wind power was favoured
in the optimisation, with a small amount of PV included to achieve 60% RE. Top five
community for highest average wind resource. Ground measurements were available for both
solar and wind.
• Cape Dorset: No immediate financial case for RE is apparent, however there were significant
data gaps for this community. Solar power was favoured in the optimisation for all scenarios.
No ground measurements of the wind or solar resources were available.
ITP/A0313 – September 2019 55
Renewable Energy in Nunavut Scoping Analysis
• Chesterfield Inlet: A case can be made for renewable energy in this community with only a
modest increase in price, and reducing the discount to 4% made significant changes to the
attractiveness of renewable energy and warrants further study. The optimisation favoured PV
over wind in all cases. Top five community for most cost-effective CO2 reduction, highest
average solar and wind resources. Ground measurements were available for both solar and
wind resources.
• Clyde River: No immediate financial case for RE is apparent. Wind power was favoured in
the 60% RE scenario, while PV was favoured for the lower RE cases. Ground measurements
were available for wind speeds, but not the solar resource.
• Coral Harbour: Coral Harbour is a community that warrants further study. RE was found to
be financially viable at a 4% discount rate, while ~$1M in grant funding could make 40% RE
financially viable at an 8% discount rate. This represents about a 5% increase on the base
case NPC. In all optimised scenarios, PV was favoured over wind. Top five community for
most cost-effective CO2 reduction and highest average solar resource. Ground measurements
were available for both the solar and wind resources.
• Gjoa Haven: No immediate financial case for RE apparent, however there are some
significant data gaps for this community. In all optimised scenarios, PV was favoured over
wind. No ground measurements were available for either the wind or solar resources. Further
data collection on the wind and solar resource should be conducted.
• Grise Fiord: Around $2.2M grant funding could make 40% RE financially viable. This
represents about a 27% increase on the base case NPC. Grant funding of $1.1M could enable
20% RE, representing a 13% increase on the base case NPC. PV was favoured in the 20 and
40% RE cases, while a mix of PV and wind was favoured in the 60% RE case. The
consumption of heating oil is high relative to the population, which suggests that offsetting
heating with RE is worth further investigation as it may improve the viability of RE. No ground
measurements were available for either the wind or solar resources, so further data collection
on the wind and solar resource should be conducted.
• Hall Beach: Around $1.2M grant funding could make 20% RE financially viable. This
represents about a 7% increase on the base case NPC. PV was favoured in the 20 and 40%
RE cases, while a mix of PV and wind was favoured in the 60% RE case. Ground
measurements were available for solar and wind resources.
• Igloolik: No immediate financial case for RE is apparent. The optimisation favoured PV in all
three scenarios. As ground measurements were not available, further data collection on the
wind and solar resource should be conducted.
• Iqaluit: There is an immediate financial case for 5.4 MW of PV, achieving 10% RE. Around
$4M grant funding could make 20% RE financially viable, representing a 2% increase in the

56 ITP/A0313 – September 2019
Renewable Energy in Nunavut Scoping Analysis
base case NPC. This scenario has the most cost-effective CO2 reductions at 2.15t/yr per
$1000 invested. A mix of PV and wind was favoured in the 40 and 60% RE cases, but only PV
was favoured in the 20% RE case. Top five community for most cost-effective CO2 reduction.
Ground measurements were available for solar and wind resources.
• Kimmirut: $1.5M in grant funding could make 40% RE financially viable. This represents
about a 14% increase on the base case NPC. In all optimised scenarios, PV was favoured
over wind. Top five community for highest average wind resource. No measured resource
data was available, so further data collection on the wind and solar resource should be
conducted.
• Kugaaruk: Less than $2M grant funding could make 40% RE financially viable. This
represents about a 12% increase on the base case NPC. In all optimised scenarios, PV was
favoured over wind. No measured resource data was available, so further data collection on
the wind and solar resource should be conducted.
• Kugluktuk: No immediate financial case for RE is apparent, though data gaps were found for
this community. In all optimised scenarios, PV was favoured over wind. Sensitivity analysis
showed that 5-10% RE became optimal for a discount rate of 4% and a diesel price of $1.60/L
(about a 50% increase in diesel price). These are significant changes from the current
situation. The consumption of heating oil is high relative to consumption for generation and
population, which suggests that offsetting heating with RE is worth further investigation.
Ground measurements were available for the wind resource but not for solar.
• Naujaat: Around $1.9M grant funding could make 20% RE financially viable. This represents
about an 8% increase on the base case NPC. In all optimised scenarios, PV was favoured
over wind. No measured resource data was available, so further data collection on the wind
and solar resource should be conducted.
• Pangnirtung: No immediate financial case for RE is apparent. The optimisation favoured PV
in all scenarios. No ground measurements were available for either wind or solar resources,
so further data collection should be conducted.
• Pond Inlet: No immediate financial case for RE is apparent. The optimisation favoured PV in
all scenarios. Ground measurements were available for wind but not the solar resource.
• Qikiqtarjuaq: Around $2M grant funding could make 20% RE financially viable. This
represents about a 13% increase on the base case NPC. In all optimised scenarios, PV was
favoured over wind. Ground measurements were available for wind resource but not solar.
• Rankin Inlet: There is an immediate financial case for installing 1 x Enercon E-70 2.3MW
wind turbine and 16 Tesla PP2 2hr batteries. This achieves 49% RE. If the full heating
potential of spilt electricity can be realised, there is a financial case for 2 x E-70 turbines and

ITP/A0313 – September 2019 57
Renewable Energy in Nunavut Scoping Analysis
46 x 4hr Tesla Powerpack’s, achieving 74% RE. Top five community for most cost-effective
CO2 reduction. Sensitivity analysis showed that either a lower discount rate or higher diesel
price slightly increases the optimal amount of RE. For a higher diesel price (20% increase),
the scenario modelled here is still viable at a discount rate as high as 12%. Top five
community for cost-effective CO2 reduction, highest average solar and wind resources. Very
low heating oil consumption relative to fuel for electricity. Ground measurements were
available for wind resource but not solar.
• Resolute Bay: Around $2.1M grant funding could make 20% RE financially viable. This
represents about a 10% increase on the base case NPC. PV was favoured in the 20% RE
case, while wind was favoured in the 40 and 60% RE cases. The consumption of heating oil is
high relative to consumption for generation and population, which suggests that offsetting
heating with RE is worth further investigation as it may improve the financial case. Ground
measurements were available for solar and wind resources.
• Sanikiluaq: Less than $2M grant funding could make 20% RE financially viable. This
represents about a 14% increase on the base case NPC. This could be reduced if the full
heating potential of the spilt electricity is realised. PV was favoured in the 20 and 40% RE
cases, while wind was favoured in the 60% RE case. Sensitivity analysis showed that a
moderate increase in the diesel price and moderate drop in the discount rate makes RE much
more attractive. For a discount rate of 6% and diesel fuel price of $1.50/L (45% increase), a
high level of RE penetration becomes viable. Highest average solar and wind resources.
Ground measurements were available for wind resource but not solar.
• Taloyoak: No immediate financial case for RE is apparent, however there are still significant
data gaps for this community. The optimisation favoured PV in all scenarios. No ground
measurements were available for either wind or solar resources, so further data collection is
warranted.
• Whale Cove: There is no immediate financial case for RE, however there are significant data
gaps for this community. Around $1.5M grant funding could make 40% RE financially viable.
This represents about a 15% increase on the base case NPC. In all optimised scenarios, PV
was favoured over wind. No ground-measured renewable resource data was available, and it
is recommended this data be collected and shared in order to better assess the financial
viability of RE projects here.

58 ITP/A0313 – September 2019
Renewable Energy in Nunavut Scoping Analysis
APPENDIX D. RESOURCE DATA
Wind Speed Solar Irradiation
Arc
tic
Ba
y
Source: NASA Average: 4.9 m/s
Source: NASA Average: 2.3 kWh/m2/day
Arv
iat
Source: NASA Average: 5.2 m/s
Source: NASA Average: 2.7 kWh/m2/day
Bak
er
La
ke
Source: Ground (RETScreen) Average: 5.82 m/s
Source: Ground (RETScreen) Average: 2.81 kWh/m2/day
Cam
bri
dg
e B
ay
Source: Ground (RETScreen) Average: 5.95 m/s
Source: Ground (RETScreen) Average: 2.53 kWh/m2/day
Cap
e D
ors
et
Source: NASA Average: 5.9 m/s
Source: NASA Average: 2.4 kWh/m2/day

ITP/A0313 – September 2019 59
Renewable Energy in Nunavut Scoping Analysis
Wind Speed Solar Irradiation
Ch
es
terf
ield
In
let
Source: Ground (RETScreen) Average: 6.07 m/s
Source: Ground (RETScreen) Average: 3.00 kWh/m2/day
Cly
de
Riv
er
Source: Ground (RETScreen) Average: 4.38 m/s
Source: NASA Average: 2.2 kWh/m2/day
Co
ral
Ha
rbo
ur
Source: Ground (RETScreen) Average: 5.46 m/s
Source: Ground (RETScreen) Average: 2.90 kWh/m2/day
Gjo
a H
av
en
Source: NASA Average: 4.9 m/s
Source: NASA Average: 2.5 kWh/m2/day
Gri
se
Fio
rd
Source: NASA Average: 5.6 m/s
Source: NASA Average: 1.9 kWh/m2/day

60 ITP/A0313 – September 2019
Renewable Energy in Nunavut Scoping Analysis
Wind Speed Solar Irradiation
Ha
ll B
ea
ch
Source: Ground (RETScreen) Average: 5.88 m/s
Source: Ground (RETScreen) Average: 2.64 kWh/m2/day
Iglo
oli
k
Source: NASA Average: 4.9 m/s
Source: NASA Average: 2.5 kWh/m2/day
Iqa
luit
Source: Ground (RETScreen) Average: 4.44 m/s
Source: Ground (RETScreen) Average: 2.53 kWh/m2/day
Kim
mir
ut
Source: NASA Average: 6.5 m/s
Source: NASA Average: 2.6 kWh/m2/day
Ku
ga
aru
k
Source: NASA Average: 5.4 m/s
Source: NASA Average: 2.3 kWh/m2/day

ITP/A0313 – September 2019 61
Renewable Energy in Nunavut Scoping Analysis
Wind Speed Solar Irradiation
Ku
glu
ktu
k
Source: Ground (RETScreen) Average: 4.42 m/s
Source: NASA Average: 2.4 kWh/m2/day
Nau
jaa
t (R
ep
uls
e B
ay
) Source: NASA Average: 5.3 m/s
Source: NASA Average: 2.5 kWh/m2/day
Pa
ng
nir
tun
g
Source: NASA Average: 2.3 m/s
Source: NASA Average: 5.5 kWh/m2/day
Po
nd
In
let
Source: Ground (RETScreen) Average: 2.58 m/s
Source: NASA Average: 2.2 kWh/m2/day
Qik
iqta
rju
aq
Source: Ground (RETScreen) Average: 4.24 m/s
Source: NASA Average: 2.2 kWh/m2/day
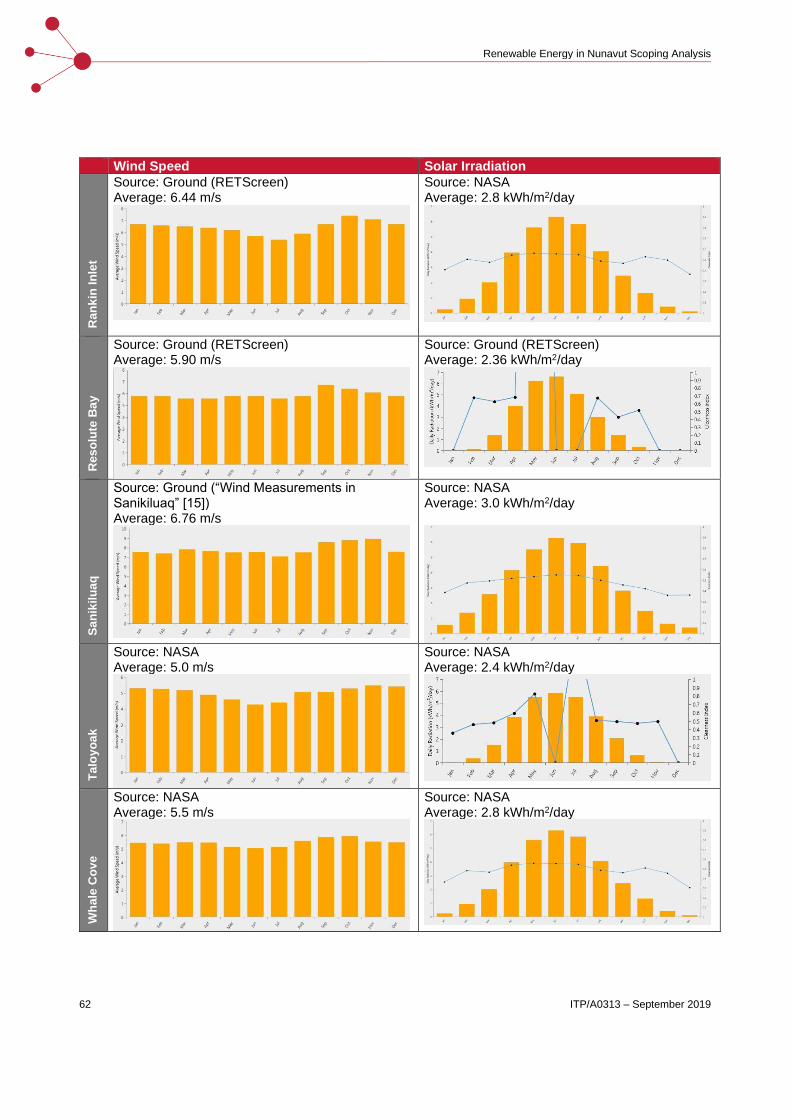
62 ITP/A0313 – September 2019
Renewable Energy in Nunavut Scoping Analysis
Wind Speed Solar Irradiation
Ra
nk
in I
nle
t
Source: Ground (RETScreen) Average: 6.44 m/s
Source: NASA Average: 2.8 kWh/m2/day
Res
olu
te B
ay
Source: Ground (RETScreen) Average: 5.90 m/s
Source: Ground (RETScreen) Average: 2.36 kWh/m2/day
Sa
nik
ilu
aq
Source: Ground (“Wind Measurements in Sanikiluaq” [15]) Average: 6.76 m/s
Source: NASA Average: 3.0 kWh/m2/day
Ta
loy
oa
k
Source: NASA Average: 5.0 m/s
Source: NASA Average: 2.4 kWh/m2/day
Wh
ale
Co
ve
Source: NASA Average: 5.5 m/s
Source: NASA Average: 2.8 kWh/m2/day


Title