renewable energy why wouldn’t you? · renewable energy view 2016 clean, green, renewable, low...
TRANSCRIPT

RE
NE
WA
BL
E E
NE
RG
Y V
IEW
20
16
RE
NE
WA
BL
E E
NE
RG
Y V
IEW
20
16
Clean, green, renewable, low carbon energy makes both economic and environmental sense. What’s not to like?
Work with us as we champion the production and use of renewable energy in the UK.
Growing the renewable energy economy
Renewable EnergyWhy wouldn’t you?
www.r-e-a.net
RE
NE
WA
BL
E E
NE
RG
Y V
IEW
20
16
70215 Renewable Energy Cover NEW.indd 1 25/05/2016 12:13

4 Foreword
6 Executive Summary
9 Policy Overview
10 REA Focus Feature: Moving on from the Bon� re of the Policies The second half of 2015 was the most challenging time the nascent renewable energy industry has ever faced.
13 Policy Changes Impacting Renewable Energy 14 REA Focus Feature: UK - EU Energy Union Despite appearances, the UK energy market is not an island, but connected to neighbouring countries and shaped by European and international policy.
16 Anaerobic Digestion (Biogas) (Power, Transport, Biomethane Injection, CHP)
18 REA Focus Feature: Biomethane-to-Grid is Heating Up The Biomethane-to-grid sector had a signi� cant expansion in Europe over the past few years, reaching 282 plants across Europe with a total annual production of 1.3bn m3 of renewable gas in 2013, according to the latest report published by the European Biogas Association.
20 Liquid Biofuels (Transport)
22 Biomass Boilers (Heat)
24 Biomass Power (Power)
26 Biomass CHP (Heat & Power)
27 Deep Geothermal (Heat & Power)
28 Heat Pumps (Air, Water and Ground-Source Heat)
30 Hydropower (Power)
32 Mixed Energy from Waste (Combustion, Pyrolysis, Gasi� cation, Land� ll Gas - CHP, Heat & Power)
34 REA Focus Feature: To be centralised or DECENTRALised: ‘that is the question…’ (For a cost e� ective, low carbon future energy market!)
36 Solar Photovoltaics (Power)
38 Solar Thermal (Heat)
40 REA Focus Feature: Exciting Times for Energy Storage in the UK? We take a look at the current UK market position and how it could develop in the coming year.
42 REA Focus Feature: Electric Vehicles are on the Move The REA recently added electric vehicles (EVs) to the portfolio of products and services it represents.
44 O� shore Wind (Power)
46 Onshore Wind (Power)
48 Wave and Tidal (Power)
50 Investment Feature: Renewable Energy Investments: a year of transition This KPMG report reviews the key developments in 2015/16 impacting the investment landscape for UK renewables.
59 REA Focus Feature: All Party Parliamentary Groups bring together Parliamentarians, businesses, NGOs and industry experts
60 Taking a look at 2014/15 Numbers: Employment, Companies and Turnover
61 Renewable Energy: Made in Britain
62 REA Focus Feature: #FoodWasteCounts Current UK recycling rates are stalled at 45% with the 50% target for 2020 seeming more distant than ever, so the REA is pushing for mandatory biowaste (including food waste) collection in the UK.
64 REA Focus Feature: Ten years of the Renewable Energy Consumer Code (RECC)
68 Methodology
Renewable Energy Association25 Eccleston Place, Victoria
London, SW1W 9NF Tel: +44 (0)20 7925 3570Fax: +44 (0)20 7925 2715
Email: [email protected]
Contents
www.r-e-a.net REview Renewable Energy View 2016 3
RENEWABLE ENERGY VIEW 2016

Renewable energy continues to grow to be a major player in the energy sector here in the UK. Despite last year’s political uncertainty both leading up to the 2015 General Election and following, it remains a business opportunity for the UK. Clean energy is one of the fastest growing industries in the world, and significant work is needed to upgrade our energy infrastructure for the challenges of the 21st century.
The 2016 Renewable Energy View (REview) builds on our 2015 report. In order to cover all the important aspects when describing an economy, we have teamed up with Innovas to produce robust employment data, broken down by technology and region. We’ve also collated official deployment figures recently published by Government Departments and compared them again to their 2020 projections - a key milestone. We look into each renewable energy technology and also new for this edition... the impact of energy storage and the potential of electric vehicles (EVs). Both will impact the future of low carbon transport and the wider energy infrastructure. We are pleased to have KPMG join us to share their insights on historic and projected investment trends - vital to giving a clue to future growth. We have worked with them to produce leading reports and their insight here is valuable.
Once again the feedback we have received on the value of this report to the industry is that it is THE most complete assessment to date of the UK renewable energy market.
So what has changed since the last report?
We’ve found that the private sector has invested almost £15 billion in renewable electricity, heating and transport fuels, growing the industry to around 117,000
jobs and supplying the UK with 22.3% of its power in 2015, 4.6% of its heat in 2014 and 3.2% of its transport fuels in 2015. This is extraordinary progress for renewable electricity, but there’s a long way to go to meet the overall 2020 targets and tackle climate change.
The necessary expansion of clean energy is both possible and affordable, as we have seen with the dramatic decreases in the cost of solar and with on-shore wind and biomass conversion some of the cheapest forms of energy even compared to new build combined cycle gas turbines (CCGTs). The previous
coalition government had laid a path for renewable energy deployment with the Electricity Market Reform (EMR) seeing its first set of auctions for both Contracts for Difference (CfDs) and the Capacity Market. The anticipated uncertainty around having a new government revisit the UK energy strategy, was prolonged until the end of 2015 following the Government’s revelations in its emergency budget that the Levy Control Framework (LCF) was at risk of being over spent and that this must be addressed immediately. After restating the importance of having to balance the now famous trilemma, the Government tipped the balance in favour of keeping consumer energy bills low and tackling energy security. This saw almost every support mechanism for renewable energy revisited, reviewed, inevitably reduced or even removed - even an exemption mechanism to reward low carbon generation was canned that wasn’t even in the LCF or contributing to energy bills - see our article “Bonfire of the Policies”.
By the end of 2015, many businesses in renewables were left reeling following the Feed in Tariff review. Many are seriously considering their future or have even chosen to wind up their enterprises. This is at considerable cost to the UK economy via lost jobs and lost reputation with international investors viewing the UK as much less attractive to invest in with so much uncertainty.
With that said there are glimmers of positive support from the Government. There is finally a recognition of how important heat and transport are to meeting the overall renewable energy challenge and positive steps must be taken. The Renewable Heat Incentive (RHI) receiving further support was a highlight for the start of 2016. However,
RENEWABLE ENERGY VIEW 2016
Foreword Dr Nina Skorupska CBEChief Executive, REA
Forging a new energy future and the important role for renewables
REview Renewable Energy View 2016 4 www.r-e-a.net
Supplying the UK with 22.3% of its power in 2015, 4.6% of its heat in 2014 and 3.2% of its transport fuels in 2015

Dr Nina Skorupska CBE
Chief Executive, REA
clouds are quickly forming when the detail of what the Government favours, and why, prove difficult to understand when there is so much to be done. Transport must be a focus for 2016. The concern that this ambition falls across so many government departments and therefore lacks any clear direction must be resolved.
The real opportunity for the UK lies in acknowledging renewable energy, along with smarter markets, grids, cities, homes, and the game changing technologies such as energy storage and demand side management, as being the way to deliver all three aspects of the trilemma in a balanced way. We are now on the cusp of having forms of technologies such as solar and on-shore wind subsidy-free. We hope in 2016 the Government is open to debate about how to manage the transition, considering both the costs and the (often overlooked) benefits of renewables, including the new jobs being created. As we say every year, these jobs are not just a new generation of highly skilled engineers, but farmers, architects, scientists, the legal and financial service providers and the installers and construction workers across the whole of Britain.
At the close of 2015 we applauded the long awaited commitments of COP21 with the hope that this will be world changing and a true call to action. Both the world and Europe needs the UK to play its part. Whilst the UK should benefit from increased interconnectivity with Europe and benefit from the renewable energy generated there, we are blessed with excellent renewable resources such as wind, water, sunshine, underground hot rocks and energy from waste. Then there are sustainable bio-based fuels, which offer flexible heat, power and transport fuel when and where we need them. We can grow some of these ourselves and also buy them from trusted trade partners in the USA and Europe. Renewable energy puts us firmly in control of our energy security.
In summary, the UK currently looks to be on track for its 2020 renewable electricity ambitions and its renewable heat policies have the chance to be truly pioneering. The lack of support for renewable transport must be reversed in 2016 - this
sector cannot be allowed to continue to stagnate. Where there has been uncertainty or drastic changes in policy, the results have been hugely damaging.
The message remains clear: supportive, stable policies are vital. The stronger the policies, the greater the growth, and the faster the costs come down - as we’re seeing right now with onshore wind and solar power.
Several other technologies are progressing too, but still need work to unlock their full potential. So whilst there continue to be challenges ahead and outstanding issues to tackle, we will face these head on with the support of REA members.
The opportunities outweigh the challenges by far. Investment in UK renewable energy is the clearest way to building the UK economy. This investment pays back in so many ways: creates jobs, brings down costs, improves our energy security and helps us preserve a safe environment.
Growing the renewable energy economy
REview Renewable Energy View 2016 5 www.r-e-a.net

RENEWABLE ENERGY VIEW 2016
Executive Summary
www.r-e-a.net REview Renewable Energy View 2016 6
Overall the UK has made considerable progress towards meeting its renewable objectives. Potentially, the UK is on track to meet the Renewable Energy Directive (RED) target of 15% of energy being renewable by 2020. The estimated trajectory for the UK to remain on track averaged across 2015-2016, needs to be 7.47% of energy generated from renewables; to date the UK achieved 7% in 2014, as reported in our latest progress report to the EU. According to the most up to date estimates, the UK was supplied with 22.3% of its power in 2015, 4.6% of its heat in 2014 and 3.2% of transport fuels in 2015 from renewable sources.
Nevertheless, the growth rate over the next five years is very steep - and remains one of the highest for any EU Member State. The overall figures mask stark differences between sectors and individual technologies. Renewable electricity generation (supported by the Renewables Obligation, Feed-in Tariff
and latterly Contracts for Difference) continues to grow at an average rate close to 25% year-on-year between 2009 and 2015. Though this average rate has come down in the last year (now 24.2%) given the growth from 2014 to 2015 this sector has the strongest claim to being on track for 2020.
However, with the Renewables Obligation closed to onshore wind and solar and closed for new entrants for other eligible technologies from 2017 major uncertainties remain. The first Contracts for Difference are still yet to have an impact on renewable energy capacity levels and there is uncertainty about how many further rounds of auctions there will be and which technologies will be allowed to participate in them.
Renewable heat generation has also grown steadily, increasing on average by 25.4% year-on-year between 2009 and 2014 (the last full year for which data
are available). Although only a small portion of the whole heat generation, the Renewable Heat Incentive has driven renewable heat generation to grow rapidly since it was launched. The non-domestic policy is dominated by biomass boilers and biomethane injection to the grid, while the domestic policy has seen 7,106 installations spread more evenly across biomass boilers, heat pumps and solar thermal. Despite this growth, the renewable heat sector is a long way short of the estimated contribution required for 2020.
Biofuel consumption has increased on average by 0.47% between 2009 and 2015, showing a tremendous slowdown in this last year (-19.7% consumption in 2015 compared to the volume in 2014!).
Jobs and market value continue to grow albeit at a slower pace than hoped and unevenly across the sectors
Continued strong renewable energy growth threatened by policy changes
0
20,000
40,000
60,000
80,000
100,000
120,000
2005 2006 2007 2008 2009 2010 2011 2012 2013 2014 2015 2016 2017 2018 2019 2020
GEN
ERAT
ION
(GW
h)
RENEWABLE ELECTRICITY GENERATION - ACHIEVED TO 2015 AND PROJECTED BY DECC TO 2020
Geothermal
Energy from Waste
Biomass
Anaerobic Digestion
Marine
Hydropower
Solar PV
Offshore Wind
Onshore Wind
Achieved to date
Projected by DECC2016 - 2020 (UEP)

From data provided by Innovas, 117,000 people were employed across the UK renewable energy value chain in 2014/15, an increase of 4.2% on the previous year.
The number of companies working in the sector has decreased, from just over 6810 to less than 6790, a change of -0.4%. The sector with the largest number of companies participating in it remains solar PV with over 2000. However, this sector saw the largest reduction of organisations from 2013/14 to 2014/15, shrinking by 4%, with further reductions anticipated through 2016 as recent changes to Feed-in Tariff policy adversely impact job prospects in the sector.
The industry’s market value has increased over that time by 6.8% to £15.91bn. Assuming significant progress continues to be made towards the 2020 target, then the analysis forecasts this increasing to £22bn by 2019/20. If employment numbers increase at a similar rate to market value over that time, this would imply an additional 45,500 people employed, bringing new skills, capabilities and opportunities to the UK employment market to rival other energy technologies.
Investment in renewables grew in 2015, but significantly more is needed.
In last year’s REview, PwC reported that £10bn was invested in UK renewables in 2014 with a further £42bn required to 2020. KPMG, referencing Bloomberg New Energy Finance data, reported that in 2015, close to £15bn was invested into clean technologies, beating 2014’s exceptional outcome by close to 50%, the fourth in the leading top 10 investing countries in the world. Most of this investment was into electricity and heat with little investment in renewable transport other than growing sparks of interest from pioneering players in green gas for transport. By simple mathematics, the UK needs to attract a further £30bn, continuing to make the UK a potentially attractive market with its need to meet the 2020 RED target.
www.r-e-a.net REview Renewable Energy View 2016
0
5,000
10,000
15,000
20,000
25,000
30,000
35,000
40,000
45,000
2005 2006 2007 2008 2009 2010 2011 2012 2013 2014 2015 2016 2017 2018 2019 2020EMR
2020NREAP
2020UEP
Inst
alle
d ca
paci
ty (M
W)
Renewable electricity deployed capacity - achieved to date and projected for 2020
Geothermal
Energy from Waste
Biomass
Anaerobic Digestion
Marine
Hydropower
Solar PV
Offshore wind
Onshore Wind
0
10,000
20,000
30,000
40,000
50,000
60,000
70,000
80,000
2005 2006 2007 2008 2009 2010 2011 2012 2013 2014 2015 2016 2017 2018 2019 2020NREAP
Gen
erat
ion
(GW
h)
Renewable heat production - achieved to 2014, recent growth extrapolated to 2016 and NREAP projection by DECC for 2020
Geothermal
Heat pumps
Solar Thermal
Anaerobic Digestion
Landfill and sewage gas
Animal Biomass
Biodegradable EfW
Plant Biomass
Wood combustion - industrial
Wood combustion - domestic
Recent growth trend continued
7

Conclusions
This is the first year since REview was first published in 2014 that we have not provided a growth forecast for the technologies covered in the publication. The sections in this report from KPMG and REA contain a detailed analysis of the history of UK Government interventions in the individual sectors. The REA conclude that because of the number and frequency of interventions there is high levels of uncertainty of how and indeed whether the RED target will be achieved.
Commenting briefly here, the recent Policy changes for the Feed-in Tariff (FiT) and Renewables Obligation (RO) and the lack of clarity as to Government’s intentions on future Contracts for Difference (CfD) auctions all affect businesses operating in the renewable power sector. The renewable heat sector has also not escaped uncertainty. At the time of writing a consultation is underway into the Renewable Heat Incentive (RHI) which proposes radical changes to the support the scheme provides. The biofuels sector is also in a state of flux as it awaits a consultation
which will decide whether the sector’s potential will be realised or not. Providing a reliable forecast with this degree of policy change, either enacted or proposed, at a time when the industry is still digesting their implications is not possible.
That is not to say it is all bad news for the renewable energy sector. Continued delays in delivering nuclear and a lack of investors willing to come forward to fund new large gas generating plant could provide opportunities for a range of renewable energy technologies to be deployed at scale if policy is supportive. This will particularly be the case for technologies such as solar and wind, whose costs continue to fall, such that as the end of decade approaches renewable energy plant gets built through investor choice rather
than Government policy. The arrival of competitive energy storage solutions and the continued uptake of EVs, which also work at their best when deployed with renewable energy, will be a catalyst for accelerated deployment.
Over the coming months a clearer picture will emerge on the short term impact on revenues and thus the ability of the industry to ride out the impact of these significant policy changes. The REA will continue to monitor the situation carefully and will provide updates over the course of the year.
RENEWABLE ENERGY VIEW 2016
Executive Summary
REview Renewable Energy View 2016 8 www.r-e-a.net

Renewables Obligation (RO)
The RO is the oldest of the current UK renewable financial incentives, having started in 2002. It obliges electricity suppliers to source a proportion of their electricity from renewable sources. Renewables Obligation Certificates (ROCs) are awarded to renewable generators, who then sell them to suppliers. Support lasts for 20 years, but the actual value of ROCs depends on the outcome of commercial negotiations rather than being fixed by the policy.
When introduced, all renewable electricity received the same level of subsidy, regardless of the technology used. This changed in 2009, when ‘banding’ was introduced - meaning that support varies depending on the cost of the technology.
The RO is due to close to new participants in 2017, with support for new solar and on-shore wind ending a year earlier in April 2016.
Contracts for Difference (CfDs)
Contracts for Difference is the mechanism replacing the RO - although they are also available for nuclear and carbon capture and storage projects.
Unlike ROCs, CfDs set a figure for the total income for a project - i.e. both the renewables support and the value of the electricity. This total figure is called the ‘strike price’. Government takes a market index for the power price, known as the ‘reference price’. Rather than being a fixed price, the subsidy paid to the generator is the difference between the strike price and the reference price. In theory, this gives the best of both worlds, as the generator has certainty over total income and the subsidy - and therefore the impact on consumers - is no higher than necessary.
CfDs are split into three ‘pots’: Pot 1-established technologies such as solar and onshore wind, Pot 2 for less established technologies, such as offshore wind, marine technology and advanced waste to energy technologies. Pot 3 is for biomass conversion, which has had no budget allocated to it in the
previous round.
Following the Government’s Energy Reset speech in November last year, there are plans for three further Pot 2 auctions this parliament, if cost reductions are met for offshore wind. There is uncertainty over Pots 1 and 3, with no public plans for any allocation in these pots at time of writing.
Feed-in Tariff (FiT)
The FiT started in April 2010. It supports anaerobic digestion, onshore wind, hydro and solar PV up to 5MW, as well as small scale fossil CHP up to 10,000 units.
The FiT pays a fixed income on all generation with no need to enter into complex commercial negotiations and is comprised of a generation tariff and an export tariff. The generation tariff is paid by energy suppliers at a set rate for each kWh of electricity you generate, with the export tariff an additional rate for units exported to the electricity grid. For systems with an installed capacity of 30kW or less this is deemed at 50%, but this may change with the introduction of smart meters.
The Government introduced significant changes to the FiT scheme at the end of 2015, with considerable tariff reductions, strict quarterly deployment caps and changes to the degression triggers.
Renewable Heat Incentive (RHI)
The RHI builds on a similar approach to the FiT, although is available at all scales. Unlike electricity, excess heat generation cannot simply be exported onto a grid, so the policy aims to ensure that only useful heat is supported. It is also funded by general taxation, rather than through consumer bills.
The RHI opened for non-domestic installations in November 2011, initially only for ground-source heat pumps, biomass, solar thermal, small-scale biogas and the injection of biomethane to the gas grid.
The scheme was opened up to domestic consumers in 2014 and included solar thermal, biomass boilers and air and ground-source heat pumps.
The Government launched a consultation on significant changes to the RHI in March 2016, which proposed large cuts in tariff rates for small scale biomass, the removal of all support for solar thermal, the introduction of heat demand limits, new degression triggers and limiting support for crop-based feedstock in AD. The final results of the consultation are not known at the time of writing.
Renewable Transport Fuel Obligation (RTFO)
The RTFO was introduced in April 2008. It is similar in principle to the RO, in that it obliges fuel suppliers to replace a proportion of supply with renewable fuels.
Targets were scaled back in 2009. The Government has yet to set out a trajectory to meeting the binding 2020 transport target contained in the Renewable Energy Directive, having made this conditional on EU-level resolution of controversy over sustainability. Although a resolution was reached in 2015, consequential changes to the RTFO will not be introduced until 2017. This protracted delay has undermined confidence in the sector - not only has future investment been scaled back but recent data show that even the reduced targets are not being met. This is particularly frustrating as UK-produced fuels have an excellent sustainability record, significantly exceeding expectations in environmental protection and greenhouse gas savings.
RENEWABLE ENERGY VIEW 2016
The Government introduced significant changes to the FiT scheme at the end of 2015
Policy Overview
REview Renewable Energy View 2016 9 www.r-e-a.net

For over a decade we have seen growth, and in some cases such as solar PV, an explosion, in deployment. At the REA we have grown with the industry. Set up in 2001, the evolution of ‘alternative energy’ through to the mainstream is in our DNA. From a cottage industry spoken about in fantastical terms to standing on the precipice of delivering energy cheaper than fossil fuels. The economic direction is clear, 2015 saw the tipping point of renewables attracting more investment than traditional fuels worldwide.
The renewables industry should be a point of national pride, an area of real success, showcasing British ingenuity and innovation. We made ground-breaking strides forward in wind turbines during the eighties, we have the intellectual jump on the rest of the world in terms of marine energy. The cost reductions seen in solar are only in small part due to cheaper panels (the EU has a protectionist trade barrier for PVs). The British solar industry has driven down costs in the same way the British cycling team has revolutionised their sport, through the “aggregation of marginal gains”, a thousand minute improvements that are the difference between winning and losing. At a time when nuclear is going up in cost, coupled with doubts over deliverability, solar costs are still dropping and can be deployed quickly, cleanly and sustainably.
The cost of new renewables may now in fact be cheaper than those for new fossil
fuel generation. We say “in fact” because there is no way of knowing. No new gas station has been commissioned in the last 4 years, and the last plant to open, in 2012, started construction in 2008.
The nearest viable new gas generation we have is Trafford, who quote they need £72 MWh to be built. The current wholesale price is around £40 MWh, leaving a £32 gap that needs to be plugged if the UK is going to get our new capacity from fossils. For reference, in the last round of renewable contracts, solar and wind both came in at around £79. However, as that was in February 2015 the costs will certainly have reduced further. But in a twist of events, it looks as though 2016 will see new gas subsidised, the nuclear deal still supported by energy consumers at £92.50 MWh and even more bizarrely, diesel receiving subsidy, yet arguably the cheapest of all new generation options, wind and solar, will be blocked from having access to some markets. To summarise, government policy now subsidies diesel, but blocks the cleaner, more cost effective choice.
How did we get here?
It is undoubtedly exacerbated by low gas prices, making new capacity unattractive for energy companies, in addition to subsidies costing more due to the drop in the wholesale price. But whilst the low wholesale price is out of the government’s hands, the assault on
renewables is not. In fact, the blame is pointed squarely at the government unshackled from coalition.
Many trade bodies and green groups condemned the Conservative Manifesto before the election. The REA was alone in giving, albeit trepidatious, support. Our belief was based on the rhetoric around cost effectiveness, coupled with a record of delivery from Conservative Ministers such as Greg Barker. It was also a case of better the devil you know, and with the REA representing biofuels, which although practical, cost effective and sustainable, have also on occasion drawn the ire of some on the greenish left, with the perfect standing in the way of the good.
Moving on from the Bonfire of the PoliciesThe second half of 2015 was the most challenging time the nascent renewables energy industry has ever faced.
REA FOCUS FEATURE
Renewable Energy Policy & Politics
www.r-e-a.net REview Renewable Energy View 2016 10

REA FOCUS FEATURE
In any case, we had assumed, along with the many others, that a Conservative Manifesto would be tempered by the Lib Dems, with the commitment to the scrapping of onshore wind so obviously a token to be traded away in coalition negotiations. Well, we got quite a few things wrong as it turns out.
Fast forward to the day before Parliament rose for their Christmas break. The solar, anaerobic digestion, hydro and wind sectors were waiting for the inevitable mass dumping of government news, which would contain the final levels of subsidy following the initial consultations slashing of 87%. In the end it was a mere 60% cut in subsidy with an overall cap of £100million for the entire
microgeneration and domestic sector. And with that, the 13th negative (green) policy announcement in 6 months was complete, unluckily for us.
Part of the shock was the optimism there was in the industry heading into 2015. Last year’s REview showed another record breaking year in terms of investment, coupled with a strong jobs sector with 112,000 directly employed in renewables.
Those facts were coupled with the knowledge that we were close to cost parity with fossil fuels, the so called ‘glide path to grid parity’ was clear and the main industry ask was policy certainty from Government.
And with that, the 13th negative (green) policy announcement in 6 months was complete,
www.r-e-a.net REview Renewable Energy View 2016 11

Policy certainty that would insure finance industry confidence to create the robust business models needed to base a sustainable industry; free of subsidy and further government interference by the next decade.
If that was our hope this time last year, where do we go from here?
Firstly, the industry has to move on from last year and to come to terms with the new government agenda. This is painful to do and many well run, credible companies have departed the scene. But the overall direction of renewables is clear and is an unstoppable global movement. Whilst we may have to spend a couple of envious years looking towards our partners in other countries longingly, wishing for their apparent ease, we need to get back to doing what we have already shown we are capable of, namely of innovation and finding UK solutions to UK problems.
Whilst the era of subsidies is coming to a premature and abrupt end, renewables and new technologies can still find a use in some of the biggest policy problems we face in one of the oldest and most complex energy markets in the world.
Some of these problems are merely of an aging infrastructure. In September, the then Chief Executive of the National Grid, Steve Holliday, summed up the shift in thinking that is going to have to happen. “The idea of baseload power is already outdated. I think you should look at this the other way around. From a consumer’s point of view, baseload is what I am producing myself. The solar on my rooftop, my heat pump – that’s the baseload. Those are the electrons that are free at the margin. The point is: this is an industry that was based on meeting demand. An extraordinary amount of capital was tied up for an unusual set of circumstances: to ensure supply at any moment. This is now turned on its head. The future will be much more driven by availability of supply: by demand side response and management which will enable the market to balance price of supply and of demand. It’s how we balance these things that will determine the future shape of our business.”
This is a business case for renewables that doesn’t rely on targets or subsidies, but on economic and consumer terms.
There is a very real problem with the old way of thinking that is no longer suited to modern realities, and renewables offer part of that practical solution in a more decentralised grid.
The second is the financial environment we inherit. The old model of ‘big pieces of kit’ is increasingly unrealistic. In a nationalised system it would still perhaps be practicable to fund power generation in the billions for a single project, but as demonstrated with Hinkley Point C, it is proving near impossible to raise capital and underwrite the risk. Building smaller gas plant is also proving difficult, with policy uncertainty playing its part and the low wholesale price too. But large energy companies are also sitting on reduced reserves with little incentive to risk hundreds of millions in a new asset.
Smaller, easier to fund projects are looking much more attractive and can have much lower financing costs.
Thirdly, the inherent problem of renewables variability is soon to be turned into a positive when coupled with energy storage. With energy storage, the instant dispatchability is in stark contrast to the unresponsive and inflexible nature of fossil baseload. For many, energy storage is a green pipedream still decades away. This is now demonstrably wrong, with companies around the world already operating energy storage plants. Even better, they’re operating energy storage projects without subsidy. California is undoubtedly leading the way but the UK is looking to catch up quickly. Kilroot in Northern Ireland is a 10MW plant recently opened, with plans to extend to 100MW. National Grid has announced a tender for 200MW of enhanced frequency response capacity which resulted in 68 project submissions totalling 1.4 GW.
This is why the REA is launching the Decentralised Energy Forum and recently published a KPMG report on decentralised energy. It showed the cost reductions for energy storage, underlining the grid benefits for a less centralised system and the move to demand side and balancing systems.
2015 was a chastening experience for anyone in the industry but it should not dampen our optimism for the future prospects of the industry. 2016 will see new business models evolve and new opportunities for REA members as the market for energy evolves.
REA FOCUS FEATURE
Renewable Energy Policy & Politics
2016 will see new business models evolve and new opportunities for REA members
REview Renewable Energy View 2016 12 www.r-e-a.net

RENEWABLE ENERGY VIEW 2016
REview Renewable Energy View 2016 13www.r-e-a.net
Orderannounced
Policy changes affecting renewable energy directly Applies from Applies to
1 Removal of Levy Exemption Certificates (‘LECs’) for all renewable power generation. Some projects will lose circa 5% of revenue.
01 August 2015(< 4 weeks notice)
Power: All existing & new renewable electricity projects
2 Watered down low carbon car incentives. Following the first year, all cars will pay the same vehicle excise duty, previously this varied based on emissions.
01 April 2017 Transport: Households paying Vehicle Excise Duty on cars
3 No new subsidies for onshore wind. This was implemented by removing onshore wind from the main government support scheme, the Renewable Obligation. This still requires Royal Assent which is expected to be implemented summer 2016. It has also been proposed to ban them from Contracts for Difference, although no new auctions for established technologies have yet been scheduled.
Varied Wind: New onshore wind projects
4 Zero-Carbon Homes delayed. Initial 2016 target date scrapped. Some action will be required by 2019 (non-domestic) and 2020 (domestic) to meet European targets.
01 July 2015 Energy Efficiency: Developers of new build homes
5 Sub-5 MW solar subsidies withdrawn from Renewables Obligation (RO), and grandfathering rights removed.
01 April 2016 Solar: New solar PV projects from 22 June 2015
6 Ending ‘grandfathering rights’ for coal power stations converting to biomass in the RO. This is a key part of investor protection that will be withdrawn, impacting wider confidence in UK investments.
12 December 2014 Biomass: Existing and new RO projects
7 Contracts for Difference auction delayed. Planned auction for large scale power for October 2015 delayed, now will not take place till end of 2016.
01 October 2015 Power: New renewable electricity projects, mostly large scale
8 Green Deal energy efficiency scheme scrapped. Funding not renewed for Green Deal finance company, meaning no new applications can be accepted.
Immediate Energy Efficiency: New applicants to scheme
9 Green tax target scrapped. Government will no longer increase green taxes as a proportion of overall revenues, for example fuel duty.
Immediate Wind, solar, transport, biomass
10 Cuts to Feed-in Tariff support rates and quarterly deployment caps. Significant cuts to generation tariffs and small quarterly deployment limits for FiT technologies. FiT scheme closure to new generation tariff projects by April 2019.
08 February 2016 Power: Solar PV, hydro, onshore wind, anaerobic digestion projects <5MW. Domestic and business renewable installations
11 Changes to tax incentives for energy schemes - following the removal of EIS, SEIS and SITR relief for Community projects, all other energy schemes had support withdrawn from 6 April 2016.
06 April 2016 All energy generation technologies
12 Proposed increase in VAT for solar, wind and hydro technologies. End of reduced 5% VAT rate for these technologies. EU mandated but interpreted in an anti-renewables manner by UK Government.
01 August 2016 All solar, wind, hydro projects. All energy efficiency projects unless exempted
13 EU mandated 10% levy on Chinese solar panels due to EU-China trade dispute. Adds 10% to every solar project’s cost, likely to remain in place until end-2016 at least.
Immediate All solar panels imported from China
14 Proposed Reform to the Renewable Heat Incentive. Significant cuts to the RHI tariff for biomass boilers, one of the most cost effective renewable heat systems. Also introduction of a budget cap and restrictions to support for crop-based biomethane production, along with steep degression triggers.
Expected 2017 All heat technologies including: Biomass boilers, large-scale biomass power, waste to energy plants, anaerobic digestion, heat pumps
15 Proposed Review of Embedded Benefits. Capacity Market Consultation March 2016 confirmed proposal to review ‘embedded benefits’ which could put up grid costs for the majority of renewable power generators.
Expected 2016/2017 All distribution connected generators
Government policy changes impacting renewables since May 2015

Global agreements on climate change, EU Energy Union legislation and bilateral gas and electricity grid connections have a huge impact on how British energy companies, installers and suppliers operate and the price British consumers pay for their energy.
In December 2015, we saw the majority of world leaders stand together and agree on a global agreement for tackling climate change and keeping global temperatures less than 2⁰C above pre-industrial times and even aim for 1.5⁰C. At the very heart of the agreement stands the transformation of our energy supply to low-carbon sources. The UK government, with its EU partners, worked hard to achieve this agreement, but have since rejected the need of any further UK specific policy changes as they believe the Climate Change Act to be sufficient.
Few international policies have been as influential for the British renewable energy market as the EU Renewable Energy Directive (RED) that the UK signed up to in 2009, which has encouraged Member States to adopt policies to enable and support the huge deployment of renewable energy we have seen over the past few years. The Directive was agreed amongst member states and enshrined in legislation, to outline a European regulatory framework for renewables up to 2020, including binding national targets for renewables. To summarise, the UK committed to delivering 15% renewable energy
which was made up of 30% renewable electricity, 12% renewable heat, and 10% renewable transport fuels.
Whilst all member states were enthusiastic to support renewable electricity, the EU RED has in particular driven British Governments to promote renewable heating, previously largely overlooked, by introducing the Renewable Heat Incentive (RHI). It has similarly proven to be a safeguard against various Governments reduced ambitions for the deployment of renewables, although was unable to protect against the policy changes for renewable transport fuels.
2030 targets
As we move into the second half of this decade, the emphasis of the debate in Europe has shifted to the EU’s 2030 targets. Certain member states have
argued that the focus should be on overall Greenhouse Gas (GHG) savings with a target of a 40% reduction based on 1990 levels and a significantly lower focus on renewables with a sub-target of 27% for renewables. The change to only having GHG reductions as targets was in many ways led by the previous UK Government, which thought a GHG target would be sufficient to drive change in the energy market, and that binding renewable targets would distort the market. This position is also maintained by the current government. Although this argument carries some weight, the current government is driven by the Climate Change Act with its GHG target and is showing a preference for supporting new nuclear and looking to finance new CCGT plants. It is therefore clear from the UK example that a GHG target in itself is not sufficient to support the uptake of renewables.
In early 2016 the EU Commission consulted on the new Renewable Energy Directive for 2030. There are significant concerns that an EU wide renewables target without specific national targets will be less likely to be met.
EU wide targets could encourage ‘free-riding’ behaviour, where member states could lower their ambitions, hoping other member states’ actions will be sufficient to meet the overall 2030 EU wide targets. This removes the incentive for any single member state to invest in low-carbon renewable energy
UK-EU Energy Union
Despite appearances, the UK energy market is not an island, but connected to neighbouring countries and shaped by European and international policy.
REA FOCUS FEATURE
Energy Union
www.r-e-a.net REview Renewable Energy View 2016 14
December 2015 - global agreement for tackling climate change and keeping global temperatures less than 2⁰C above pre-industrial times

infrastructure.
To avoid this predicament, the European Commission must ensure that the sum of the member states’ carbon reduction and renewable energy plans meet the overall EU wide targets. In the case that they are not met, an iteration of pledges or separate financing mechanism to compensate for shortcomings should be available. We await the outcome of the consultation to understand the Governance behind the targets.
EU Energy Union
For the European Commission, 2016 is “a year of delivery” for the Energy Union, which is a package of legislation aimed at coordinating and integrating national energy markets. The Energy Union strategy is made up of 5 dimensions:
• Security of supply (regarding gas purchases),
• an integrated internal energy market (removing trade and technical barriers from cross border energy trade),
• energy efficiency measures,
• emission reduction (reform of EU emission trading system),
• and supporting research and innovation in low-carbon technologies.
The EU commission has declared to the European Parliament that “the goal of a resilient Energy Union with an ambitious climate policy at its core is to give EU consumers - households and businesses - secure, sustainable, competitive and affordable energy. Achieving this goal
will require a fundamental transformation of Europe’s energy system.” In 2016, we expect to see the Commission launch work on the EU Renewable Energy Directive II, Bioenergy Sustainability Criteria, Heating and Cooling Strategy, Energy Efficiency, and Energy Market Design, which will all impact the UK energy market. The REA will be following all of these developments closely and looking to influence the outcome by working closely with the European Renewable Energy Federation of which the REA is a member and other European renewable technology specific groups. It is shaping up to be an important year for action on EU energy policy.
www.r-e-a.net REview Renewable Energy View 2016 15

ANAEROBIC DIGESTION CONTEXT
RENEWABLE ENERGY VIEW 2016
Anaerobic Digestion (AD) (Biogas)(Power, Transport, Biomethane Injection and CHP)
Development of AD has come a long way over the past few years in the UK, with over 260 plants now operational, and a total installed electrical capacity of 252MWe (NNFCC, December 2015). Although growth has been good, recent market intelligence suggests that we are now seeing a drop in the number of projects in the pipeline, which reflects the policy situation. It is a very critical time for the AD sector, as the Feed-in Tariff, the main support mechanism for biogas CHP plants, has seen dramatic reductions and the new cap system under FiTs is significantly restricting the AD capacity that can be deployed. As stated in the recent RHI consultation, the Department of Energy and Climate Change (DECC) sees biogas and biomethane as a strategic technology to decarbonise the gas grid, as well as the waste and agricultural sectors. However, there is uncertainty that DECC’s ambition is realistic, given the drastic cuts to the FiT, the upcoming closure of the RO scheme and other constraints such as availability of waste feedstocks and the Government’s plans to restrict use of energy crops in AD.
Can use food waste, animal manures and slurries, residues from food processing and agriculture and crops.
Unique in that eligible for all the financial incentives for power, heat and transport fuel.
Biogas can also be cleaned up and injected into the gas grid as ‘biomethane’. Green Gas Certification Scheme tracks sales of the gas to support green claims by end users.
www.r-e-a.net REview Renewable Energy View 2016 16
Feed-in Tariff is seeing dramatic reductions in support, particularly hurting smaller-scale developers.
Implementation of RHI reform, currently under consultation, may see restrictions on the use of energy crops for anaerobic digestion.
Solid and liquid outputs (‘digestate’) can replace mineral fertiliser, providing nutrients and improving soil fertility. Biofertiliser Certification Scheme certifies digestate so farmers can be confident in quality and safety.
GROWTH FORECAST The 2015 edition of REview forecast a further £1.9bn could be invested in the sector up to 2020. However with the recent changes in the Feed-in Tariff policy, in particular the reduction in tariffs and imposition of caps for AD, much of this investment is unlikely to be realised. The industry awaits a separate consultation focusing on AD slated to be issued later this year. It may be possible for some plants to continue by using the heat and claiming benefit under the RHI; modelling continues on the viability of this approach. However, the industry is currently asking for a ban to landfill for food waste, as has been introduced in Scotland, which if adopted in England could improve the sector’s outlook. The prospects for biomethane plants under the RHI remain promising.

JOBS IN ANAEROBIC DIGESTION
MANUFACTURINGDesign engineer; Electrical systems designer; Environmental engineer; Environmental consultant; Power generation engineer; Electrical engineer; Welder; Metal worker; Machinist; Skilled assembler; Materials engineer; Mechanical engineer; Biochemist; Biologist.
CONSTRUCTION AND INSTALLATIONPlanning and environmental consultant; Project manager; Construction worker; Electrical engineer; Mechanical engineer; Laboratory technician specialising in digestion and digestates; CHP technician.
PLANT OPERATIONWaste collector; Farmer; Feedstock loader; Truck driver; Plant operator; Maintenance technician; Laboratory services; Quality assurance.
BIOGAS APPLICATIONSVehicle design and manufacture; Pump attendant at fuelling stations; Biomethane-injection plant construction and operation; CHP construction and operation; Digestate packaging and distribution.
www.r-e-a.net REview Renewable Energy View 2016 17
For full explanation of terms, methodology and growth projections see pages 68-70
SIZE OF THE UK ANAEROBIC DIGESTION SECTOR 2011-2012 2012-2013 2013-2014 2014-2015 Sector Turnover (£’millions) 340 358 340 347
No. of people employed across UK supply chain 2,650 2,635 2,828 2,865
No. of UK companies across supply chain 140 141 148 148
0
100
200
300
400
500
600
2009 2010 2011 2012 2013 2014 2015 2016 2017 2018 2019 2020EMR
2020NREAP
2020UEP
502
12 30
70
119
164
216
259 259 259
66
148387
INST
ALL
ED C
APA
CIT
Y (M
W)
UK ANAEROBIC DIGESTION INSTALLED CAPACITY AND PROJECTED GROWTH TREND
LATEST DECC 2020 PROJECTION (EMR) INSTALLED CAPACITY
RECENT GROWTH TREND CONTINUED DECC UEP 2020 PROJECTION
NREAP includes and is dominatedby LFG so is not shown here
325
408
0
500
1,000
1,500
2,000
2,500
3,000
3,500
2009 2010 2011 2012 2013 2014 2015 2016 2017 2018 2019 2020
2,231
2,674
2,9723,067 3,121
43 111273
501
722
1,009
1,339
ANN
UAL
GEN
ERAT
ION
(GW
h)
ANAEROBIC DIGESTION ELECTRICITY GENERATION TO DATE AND PROJECTED BY DECC
DECC 2013 UEP PROJECTIONS ANNUAL ELECTRICITY GENERATION
0
500
1,000
1,500
2,000
2,500
3,000
3,500
4,000
2009 2010 2011 2012 2013 2014 2015 2016 2017 2018 2019 202023 55 113 169 217
500628
1,000
1,337
1,768
2,698
3,512
AN
NU
AL
GEN
ERAT
ION
(GW
h)
ANAEROBIC DIGESTION HEAT GENERATIONTO DATE AND PROJECTED BY DECC
ANNUAL HEAT GENERATION NREAP HEAT PROJECTIONS

There are currently over 100 biomethane projects operating in Germany, and very active markets in both the Netherlands and France.
In the UK, the Renewable Heat Incentive (RHI), introduced in 2011, is the primary policy which supports biomethane projects. The innovative nature of this technology supported by an attractive RHI tariff has helped kick-start the market for biomethane to ’gas’ grid (BGG).
Before the introduction of the RHI there were no full scale biomethane plants in operation in the UK. However, the latest data indicates that 50 projects were completed by end of 2015, injecting approximately 2.5 TWh/year of biomethane into the gas grid, enough to meet the heating and cooking needs of around 100,000 homes. In 2015 the UK was the fastest growing biomethane market in the world.
Another 15 plants are expected to be completed in 2016, which will bring annual biomethane - or green gas - production in the UK to 3.5 TWh/year - representing around 240,000 tonnes of LNG that the country won’t need to import from the Middle East or four 60,000-tonne LNG tankers not needing to dock at domestic ports.
Gas is critical for the UK, without gas central heating it would be harder for 60 million people to live on a cold island in NW Europe. There are no easy alternatives to the gas grid and central heating, reflected in the fact that in the
recent consultation on the RHI reform, released in March 2016, the Department for Energy and Climate Change (DECC) has proposed to increase funding for biomethane which can be injected into the gas grid, whilst reducing support for other technologies that are seen as less strategic such as small scale biomass and solar thermal. There have been some attempts at introducing heat pumps into the market but they have been generally unsuccessful due to a lack of very well insulated off-gas grid properties and the current low price of oil. Given the lack of alternatives it’s no surprise that DECC are on record as saying “Biomethane-to-Grid is a key renewable technology that has the potential to make a significant contribution to the UK’s 2020 renewable energy commitments.”
A number of AD plants had been built in the UK prior to 2010, mostly on sewage treatment works. These plants produced biogas used to generate electricity for which they had a government subsidy as one was available for renewable electricity. However, the absence of use for waste heat from electricity generation created the business case for biomethane injection into the gas grid. In
2010, the REA was successful in lobbying for the RHI for biomethane, which gave investors the confidence to commit to producing biomethane for injection.
Another piece of the jigsaw was overcoming technical challenges presented by cleaning (removing H2S) and upgrading biogas (removing 45% CO2) in order to safely inject it into the gas grid. The co-operation and support of the gas distribution networks was also critical in allowing this industry to develop.
National Grid’s 2015 Future Energy Scenarios[1] report highlights the potential for a 10-fold increase in the number of green gas connections to the grid over the next decade, indicating a possible 416 connections by 2025 and 700 connections by 2035.
This equates to approximately 40 TWh/year of green gas from AD injected to the grid by 2035, around 5% of the total UK gas demand and around 10% of the UK domestic gas demand. Additionally, as UK gas demand continues to decrease, this proportion could become much higher.
One way to get higher volumes of renewable methane is for the development of Bio-SNG (Synthetic Natural Gas) technology. National Grid is working with Advanced Plasma Power (APP) in a project with £11 million in Government funding to develop and build the first-ever plant of its kind to produce renewable methane from
Biomethane-to-Grid is Heating UpThe biomethane-to-grid sector had a significant expansion in Europe over the past few years, reaching 282 plants across Europe with a total annual production of 1.3bn m3 of renewable gas in 2013, according to the latest report published by European Biogas Association.
REA FOCUS FEATURE
Biomethane
www.r-e-a.net REview Renewable Energy View 2016 18
In 2015 the UK was the fasted growing biomethane market in the world

waste that is not suitable for anaerobic digestion. APP’s new plant in Swindon will take residual waste - the UK’s largest sustainable source of biomass - and convert it into biomethane, using APP’s pioneering Gasplasma® technology.
Together, biomethane and Bio-SNG have potential for 150 - 200 TWh/annum of renewable gas, a significant proportion of the domestic customer gas demand of 300 TWh/annum. Having our own domestic gas supply also delivers energy security, reducing reliance on relatively high GHG LNG (Liquefied Natural Gas) from the Middle East.
To say the success of BtG is dependent on the scale and scope of the country’s grid, seems an obvious point, and a cold country like the UK with an extensive gas grid and 20 million central heating systems has much to gain by developing biomethane.
Biomethane could play an important role in the transport sector, where it can deliver significant carbon savings and reductions in NOx and particulate emissions to help decarbonise transport fuel as well as help improve air. The REA has been asked to lead on supporting the development of Advanced Fuels/Renewable Gases policy with the Department for Transport (DfT) and are working closely with all stakeholders to ensure that the role biomethane can play in the transport sector - in particular in displacing the use of diesel in HGVs and buses - is fully recognised, and that the right policy framework is put in place to support the greater deployment of biomethane. The REA has published a
report on the ‘Use of Gaseous Fuels in Transport’ which argues that the supply of renewable gases in the sector has been underestimated and that the UK needs a clear and long-term strategy for the use of renewable biomethane in transport, as well as support for the development of appropriate vehicle technology.
In the UK there is 6,000 km of high pressure gas grid known as the Local Transmission System (LTS) and this is a highly attractive asset when it comes to fuelling trucks on compressed natural gas (CNG). There are no gas leaks from the LTS and the compression plant only requires 10% of the electricity that it would need to compress from a 200 mbar gas grid. The combination of biomethane injected into the grid and CNG from the LTS is encouraging the use of biomethane in transport.
CNG Fuels has opened a filling station in Leyland, Lancashire, allowing vehicles to fill up on bio-CNG directly from the LTS. The new facility is the first of its kind in the UK and can fuel up to 500 vehicles a day. Waitrose have 35 trucks using this station, with the gas made from food waste at biomethane plants and delivered to Leyland via the gas grid using the REAL Green Gas Certification Scheme to link the source of gas to
Leyland. In effect, fuelling trucks on food waste.
Scania now make a 340 bhp truck that runs on 100% CNG and so there is no diesel consumption at all, with significant benefits in terms of lower fuel cost, lower emissions of NOx and particulates and reduced noise.
So, having established biomethane is a great solution for decarbonising our gas grid, new challenges are ahead. The growth of biomethane has triggered automatic tariff degressions with financial support for biomethane falling to around 5 p/kWh from 1st April this year. DECC are consulting in relation to the allocation of £200 million of new biomethane funding till 2020 - one key issue relates to the use of energy crops. The industry is arguing that some crops should be used as part of an overall balanced approach to feedstock that encourage wastes as far as possible but in a way that proves an economic option for farmers.
Of the 60 or so projects that are currently (April 2016) injecting gas, a company called Barrow Green Gas has purchased the gas from 28 projects. This gas shipper, established in 2012 to focus on biomethane now has around 1 TWh/annum of gas contracted with focus on supplying the likes of the CNG Fuels filling station at Leyland. One important new development is growing interest from large energy users who want to reduce their carbon footprint but they often have no practical alternative to natural gas. The purchase of Green Gas Certificates from Barrow Green Gas is providing an option for such consumers to secure reductions in greenhouse gas.
1 EBA Biomethane and Biogas report 2015. Annual statistical report of the European Biogas Association on the European anaerobic digestion industry and markets - http://european-biogas.eu. [1] Future Energy Scenarios 2015, National Grid, July 2015
2 Currently available to REA Members at www.r-e-a.net. The report was published on UK Biomethane Day 2016 - 20th April 2016.
www.r-e-a.net REview Renewable Energy View 2016 19
60 projects are injecting into the UK gas grid (April 2016)
LIQUID BIOFUELS CONTEXT
RENEWABLE ENERGY VIEW 2016
Liquid Biofuels(Transport)
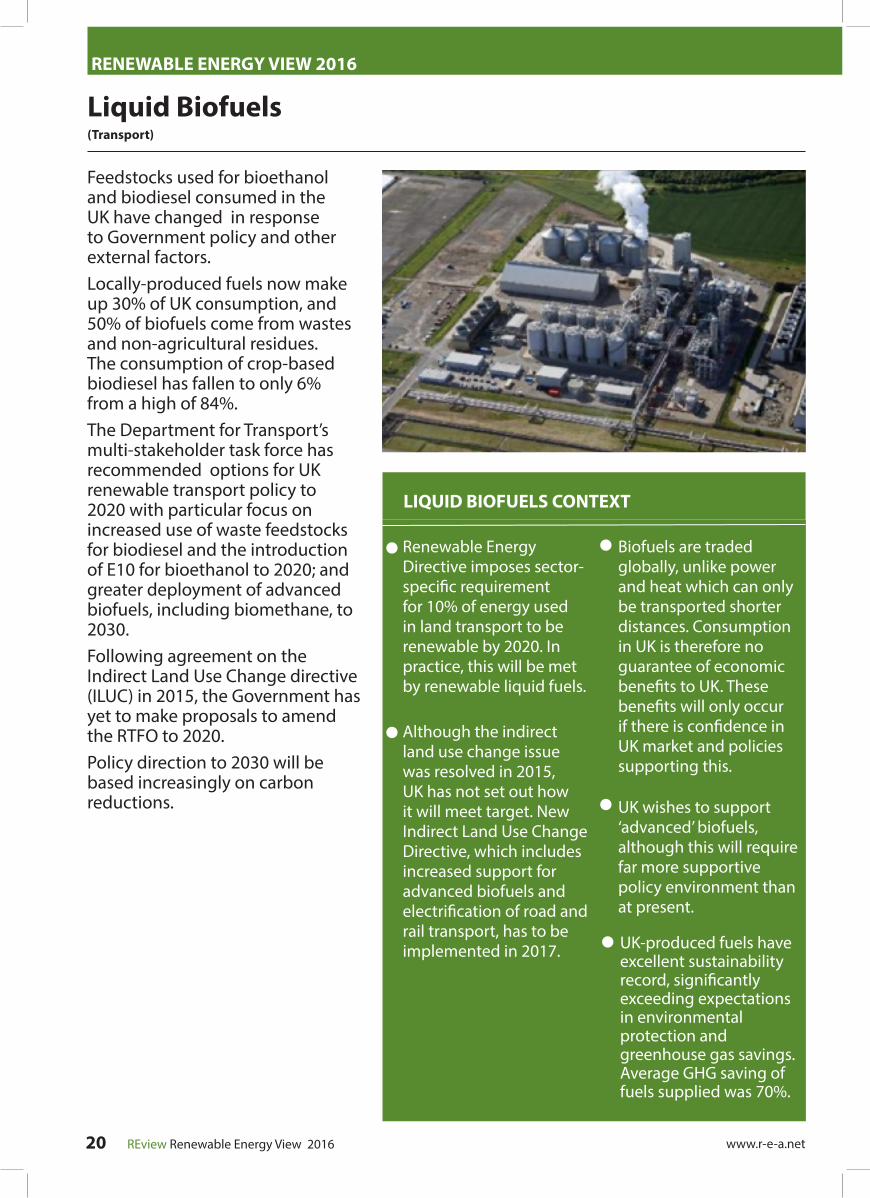
Feedstocks used for bioethanol and biodiesel consumed in the UK have changed in response to Government policy and other external factors. Locally-produced fuels now make up 30% of UK consumption, and 50% of biofuels come from wastes and non-agricultural residues. The consumption of crop-based biodiesel has fallen to only 6% from a high of 84%. The Department for Transport’s multi-stakeholder task force has recommended options for UK renewable transport policy to 2020 with particular focus on increased use of waste feedstocks for biodiesel and the introduction of E10 for bioethanol to 2020; and greater deployment of advanced biofuels, including biomethane, to 2030. Following agreement on the Indirect Land Use Change directive (ILUC) in 2015, the Government has yet to make proposals to amend the RTFO to 2020. Policy direction to 2030 will be based increasingly on carbon reductions.
www.r-e-a.net REview Renewable Energy View 2016 20
Renewable Energy Directive imposes sector-specific requirement for 10% of energy used in land transport to be renewable by 2020. In practice, this will be met by renewable liquid fuels.
Although the indirect land use change issue was resolved in 2015, UK has not set out how it will meet target. New Indirect Land Use Change Directive, which includes increased support for advanced biofuels and electrification of road and rail transport, has to be implemented in 2017.
Biofuels are traded globally, unlike power and heat which can only be transported shorter distances. Consumption in UK is therefore no guarantee of economic benefits to UK. These benefits will only occur if there is confidence in UK market and policies supporting this.
UK-produced fuels have excellent sustainability record, significantly exceeding expectations in environmental protection and greenhouse gas savings. Average GHG saving of fuels supplied was 70%.
UK wishes to support ‘advanced’ biofuels, although this will require far more supportive policy environment than at present.

www.r-e-a.net REview Renewable Energy View 2016 21
For full explanation of terms, methodology and growth projections see pages 68-70
SIZE OF THE UK LIQUID BIOFUELS SECTOR 2011-2012 2012-2013 2013-2014 2014-2015
Sector Turnover (£’millions) 340 358 340 347
No. of people employed across UK supply chain 3,500 3,509 3,829 3,914
No. of UK companies across supply chain 200 200 211 211
JOBS IN LIQUID BIOFUELS
DESIGN AND DEVELOPMENTDesign engineer; Project manager; Economist; Electrical systems designer; Environmental engineer; Biotechnologist; Chemist; Agriculturalist; Environmental consultant; Feed-stock handling systems designer.
MANUFACTURINGDesign engineer; Project manager; Welder; Sheet metal worker; Chemist; Agricultural specialist; Microbiologist; Biochemist; Electrical engineer; Mechanical engineer.
CONSTRUCTION AND INSTALLATIONPlanning consultant; Environmental consultant; Project management and construction workers; Electrical engineer; Power generation engineer; Project manager; Health and safety manager; Pipefitter; Welder; Electrician; Service engineer.
FEED-STOCK PRODUCTIONFarmer; Agricultural operative; Waste operative; Civil engineer; Water engineer; Irrigation engineer; Process engineer; Chemical engineer; Electrical engineer; Field technician; Tanker driver; Warehouse manager.
OPERATIONS AND MAINTENANCEChemist; QC Laboratory staff; Electrical engineer; Power generation engineer; Energy trader; Boiler engineer; Pipefitter; Welder; Electrician; Service engineer; Construction worker; Electrical/electronic technician; Plant operator; Mechanic; Project manager, Fuel and ash supervisor; Labourer; Maintenance manager.
DISTRIBUTIONDistribution manager; Tanker driver; Blend operative; Forecourt operative.
GROWTH FORECAST With current legislation there is unlikely to be any significant growth in the sector in the period up to 2020. It should be noted Government is preparing to consult later this year on legislative changes to the Renewable Transport Fuel Obligation (RTFO). When the proposals are known their effects, if carried through into legislation, will be able to be modelled. For example an increase in the bioethanol content from 5% to 10% would be particularly helpful and would stimulate growth in the sector.
0
500
1,000
1,500
2,000
2,500
3,000
3,500
4,000
4,500
2005 2006 2007 2008 2009 2010 2011 2012 2013 2014 2015 2016 2017 2018 2019 2020
2,462
1,743
960 923
26 134 276
728858 859
760521 629
785550
4853
86
116180
355 368437
462458
448
BIO
FUEL
S C
ONS
UMPT
ION
(kto
e)
UK BIOETHANOL AND BIODIESEL CONSUMPTION AND PROJECTED GROWTH
NREAP PROJECTION - BIODIESEL NREAP PROJECTION - BIOETHANOLOVERALL TRENDS CONTINUED 2016-2017 BIODIESEL CONSUMPTIONBIOETHANOL CONSUMPTION
4,205
9981,242
1,091958
1,1281,2141,038
845
362188
74
0
500
1000
1500
2000
2500
3000
3500
4000
4500
2005 2006 2007 2008 2009 2010 2011 2012 2013 2014 2015 2016 2017 2018 2019 2020
1,952 2,0842,213
2,3392,462
909
1,121
1,331
1,538
1,743
26 134 276
728858 859
760521 629
785550
4853
86
116180 355 368
437462
458448
ANN
UAL
CO
NSUM
PTIO
N (
ktoe
)
UK BIOETHANOL AND BIODIESEL CONSUMPTION PROJECTED GROWTH TREND
NREAP PROJECTION - BIODIESEL NREAP PROJECTION - BIOETHANOLBIODIESEL CONSUMPTION BIOETHANOL CONSUMPTION
74188
362
8451,038
1,2141,128 958 1,091
1,242998
2,861
3,205
3,544
3,877
4,205

BIOMASS BOILERS CONTEXT
RENEWABLE ENERGY VIEW 2016
Biomass Boilers & Wood Stoves(Heat)
The biomass heating industry was a niche market prior to the Renewable Heat Incentive. The sector has since experienced a boom and bust growth cycle, the latter caused by the RHI degressions. The 200kWth-1MWth market is slowly growing after the sub-200kWth market has collapsed. This is already a highly cost effective technology, with further cost reductions possible as the UK supply chain matures, but this depends on policy support.
Sustainability criteria introduced October 2015 and life-cycle analysis of fuels show over 87% GHG saving compared to 60% Government requirement.
Government proposal to refocus market toward large biomass, by reducing tariff for sub-1MW boilers.
Previously very strong take up in Renewable Heat Incentive, particularly in the sub 200kWth market and domestic market, but aggressive degression has halted market.
Wood stoves already popular without subsidy, particularly off gas grid.
www.r-e-a.net REview Renewable Energy View 2016 22
GROWTH FORECASTThe introduction of the Renewable Heat Incentive (RHI) led to significant growth in the biomass heat sector. However, the RHI consultation currently in progress proposes significant cuts to biomass tariffs from April 2017 which if enacted will reduce the number of biomass boilers installed in 2017. Once the outcome of the RHI consultation is known it will then be possible to provide an accurate forecast on the impact of any changes on deployment levels.

JOBS IN BIOMASS BOILERS
MANUFACTURINGDesign engineer; Boiler maker; Welder; Electrical engineer; Chemist; Agricultural specialist; Microbiologist; Biochemist; Building services engineer; Electrical engineer; Mechanical engineer; Quality assurance.
INSTALLATION AND MAINTENANCEProject manager; Electrical engineer; Boiler engineer; Pipefitter; Welder; Electrician; Heating engineer; Service engineer; Construction worker; Electrical/electronic technician; Plant operator; Mechanic; Project manager; Technical sales manager; Service engineer; Chimney sweep.
GROWING AND PRODUCTIONFarmer; Forester; Wood recycler; Wood chipper operative; Drivers; Mechanical engineer; Plant operator; Agricultural specialist; Biologist; Chemist; Microbiologist.
www.r-e-a.net REview Renewable Energy View 2016 23
For full explanation of terms, methodology and growth projections see pages 68-70
0
5,000
10,000
15,000
20,000
25,000
30,000
35,000
40,000
45,000
2009 2010 2011 2012 2013 2014 2015 2016 2017 2018 2019 2020NREAP
42,008
10,216
21,54520,202
23,488
27,558 28,433 28,433 28,4332,041
4,229
ENER
GY
GEN
ERAT
ION
(GW
h)
BIOMASS AND SOLID WASTE BOILERS HEAT GENERATION AND PROJECTED GROWTH TREND
UK NREAP PROJECTION FOR 2020 ENERGY GENERATION RECENT GROWTH TREND CONTINUED
30,473
32,661
0
5,000
10,000
15,000
20,000
25,000
30,000
35,000
40,000
45,000
2005 2006 2007 2008 2009 2010 2011 2012 2013 2014 2015 2016 2017 2018 2019 2020
10,514
13,502
18,003
23,865
32,157
42,008
1,075 1,198 1,313 2,256 2,645 3,149 3,368 3,217 3,965 4,3393,089 3,475 3,8613,809 4,160
14,630 12,75516,192
18,918 18,077
1,083 1,128 1,1772,562 2,599
2,9743,278
3,367
3,988 5,343
ANNU
AL G
ENER
ATIO
N (G
Wh)
BIOMASS AND SOLID WASTE BOILERS HEAT GENERATION TO DATE AND PROJECTED BY DECC (NREAP)
NREAP SOLID BIOMASS HEAT PROJECTIONS PLANT BIOMASS
WOOD COMBUSTION - DOMESTIC WOOD COMBUSTION - INDUSTRIAL
27,760
5,247 5,8016,351
8,626 9,403
20,753 19,401
22,776
26,871
SIZE OF THE UK BIOMASS BOILER SECTOR 2011-2012 2012-2013 2013-2014 2014-2015
Sector Turnover (£’millions) 540 600 684 735
No. of people employed across UK supply chain 4,530 4,510 5,379 5,650
No. of UK companies across supply chain 210 210 244 246

BIOMASS POWER CONTEXT
RENEWABLE ENERGY VIEW 2016
Biomass Power(Power)
Biomass power usually involves a small number of relatively large projects, so projecting future deployment from historic patterns is less meaningful. Significant expansion beyond conversion of existing coal powered stations is unlikely in the current policy environment. This is likely to be a significant missed opportunity for 2020 targets and longer-term carbon reductions as it is highly cost-effective. Given high load factors for bioenergy technologies, the actual generation is far higher than for an equivalent amount of installed capacity from wind or solar PV.
Coal conversions not currently funded by CfD pot 3. Government not supporting stand-alone new projects with deployment capped in the Renewables Obligation and not included at all in Contracts for Difference. Deployment likely to be far below potential in medium term.
Wide range of applications from small scale to conversions of existing coal-fired power stations.
Cost-effective compared to other options. Like other bioenergy technologies, provides power that can be delivered when needed – complementing technologies such as wind and solar.
Sustainability regulations introduced in October 2015. Should provide independent assurance to the public.
www.r-e-a.net REview Renewable Energy View 2016 24
GROWTH FORECASTFollowing the 400MW cap on the RO for new biomass in 2013, growth has slowed, with only three contracts awarded in the early CfD contracts. There remains a Pot 3 for biomass within the CfD structure, but it has not been allocated any funds.

JOBS IN BIOMASS POWER
DESIGN AND DEVELOPMENTDesign engineer; Project manager; Materials engineer; Electrical systems designer; Mechanical engineer; Environmental engineer; Environmental consultant; Fuel handling systems designer.
MANUFACTURINGDesign engineer; Project manager; Welder; Labourer; Sheet metal worker; Chemist; Electrical engineer; Mechanical engineer.
CONSTRUCTION AND INSTALLATIONPlanning consultant; Rigger; Environmental consultant; Project management and construction workers; Electrical engineer; Power generation engineer; Health and safety manager; Pipefitter; Welder; Electrician.
OPERATIONS AND MAINTENANCEAgricultural specialist; Microbiologist; Biochemist; Fuel sourcing manager and negotiator; Electrical engineer; Power generation engineer; Energy trader; Boiler engineer; Welder; Electrician; Service engineer; Electrical/electronic technician; Plant operator; Mechanic; Fuel and ash supervisor; Labourer; Maintenance manager.
www.r-e-a.net REview Renewable Energy View 2016 25
For full explanation of terms, methodology and growth projections see pages 68-70
SIZE OF THE UK BIOMASS POWER SECTOR 2011-2012 2012-2013 2013-2014 2014-2015
Sector Turnover (£’millions) 450 498 546 586
No. of people employed across UK supply chain 3,330 3,320 3,830 3,999
No. of UK companies across supply chain 170 166 187 189
0
500
1,000
1,500
2,000
2,500
3,000
3,500
4,000
4,500
2009 2010 2011 2012 2013 2014 2015 2016 2017 2018 2019 2020EMR
2020NREAP
2020UEP
3,366
3,140
2,505
493 582
1,4871,374
1,9912,260
2,628 2,628 2,628
634
1,421
INST
ALLE
D C
APAC
ITY
(MW
)
BIOMASS POWER INSTALLED CAPACITY AND PROJECTED GROWTH TREND
DECC UEP 2020 PROJECTION UK NREAP PROJECTION FOR 2020LATEST DECC 2020 PROJECTION (EMR) INSTALLED CAPACITYRECENT GROWTH TREND CONTINUED
Note that the projections for 2016and 2017 are based on averagegrowth from 2013 to 2015
Note that NREAP does not differentiate between biomass and Energy from Waste
4,050
3,262
0
5,000
10,000
15,000
20,000
25,000
2009 2010 2011 2012 2013 2014 2015 2016 2017 2018 2019 2020
18,538
21,65522,676 22,780 22,826
3,0043,925
4,7135,866
9,238
13,238
18,982
ANN
UAL
GEN
ERAT
ION
(GW
h)
BIOMASS ELECTRICITY GENERATIONTO DATE AND PROJECTED BY DECC
DECC 2013 UEP PROJECTIONS ANNUAL ELECTRICITY GENERATION

BIOMASS CHP CONTEXT
RENEWABLE ENERGY VIEW 2016
Biomass CHP(Heat & Power)
Combined heat and power (CHP) projects have generally been seen as electricity-led. They are therefore sensitive to the policy environment on power-only projects and tend to be more challenging to develop. As well as the straightforward costs, there is the added need to ensure a long-term heat customer - both for direct income and to guarantee enhanced levels of Government support. The Renewable Heat Incentive has introduced a special tariff for CHP, which may be effective if there is sufficient policy stability.
Financial support linked to demonstrating those savings, which can often be very complex.
Combined Heat and Power can have significant energy savings compared to generating heat and power separately.
Tariff for Renewable Heat Incentive may prove effective.
Finding a customer for the heat is a big challenge - not just initially but for the lifetime of the project. Although eligible for Contracts for Difference, deployment unlikely to occur until this issue is addressed.
www.r-e-a.net REview Renewable Energy View 2016 26
JOBS IN BIOMASS CHP
DESIGN AND DEVELOPMENTDesign engineer; Project manager; Materials engineer; Electrical systems designer; Mechanical engineer; Environmental engineer; Environmental consultant; Fuel handling systems designer; Heat network design engineer.
MANUFACTURINGDesign engineer; Project manager; Welder; Labourer; Sheet metal worker; Chemist; Electrical engineer; Mechanical Engineer.
CONSTRUCTION AND INSTALLATIONPlanning consultant; Rigger; Environmental consultant; Project management and construction workers; Electrical engineer; Power generation engineer; Heat network specialists; Health and Safety manager; Pipefitter; Welder; Electrician.
OPERATIONS AND MAINTENANCEAgricultural specialist; Microbiologist; Biochemist; Fuel sourcing manager and negotiator; Electrical engineer; Power generation engineer; Heating engineer; Energy trader; Boiler engineer; Welder; Electrician; Service engineer; Electrical/ electronic technician; Plant operator; Mechanic; Fuel and ash supervisor; Labourer; Maintenance manager.
For full explanation of terms, methodology and growth projections see pages 68-70
SIZE OF THE UK BIOMASS CHP SECTOR 2011-2012 2012-2013 2013-2014 2014-2015
Sector Turnover (£’millions) 450 498 546 586
No. of people employed across UK supply chain 3,330 3,320 3,830 3,999
No. of UK companies across supply chain 170 166 187 189
GROWTH FORECASTGrowth in this area is limited, but biomass CHP remains an option in the CFD Pot 2, with three future auctions expected by 2020. However, details of timing, allocation and strike prices have yet to be announced.

DEEP GEOTHERMAL CONTEXT
Deep Geothermal(Heat & Power)
Despite significant UK potential, commercial deployment for power is unlikely in the current policy environment. There are opportunities in the medium term for heat. These are dependent on relatively large heat loads such as industrial users or district heating schemes. The latter is particularly relevant, as both district heating and deep geothermal have high upfront costs but last a long time once built. There remains inconsistency in the planning system between deep geothermal and hydraulic fracturing which needs to be resolved. Supportive changes to the planning system that were promised by the previous Conservative-led coalition Government are needed. These are exactly the same changes that were put in place for shale gas fracking, apparently as a priority.
May be caught up with fracking in public and political perceptions.
Very limited experience in UK, although more widely used elsewhere in Europe.
Easier to deploy for heat only as electricity generation requires higher grade heat. Several projects being developed for heat, but deployment for power generation will be more challenging.
JOBS IN DEEP GEOTHERMAL
MANUFACTUREDesign engineer; Electrical engineer; Welder; Metal worker; Machinist; Skilled assembler; Test technician; Chemical engineer; Materials engineer; Mechanical engineer.
SCHEME DESIGN AND DEVELOPMENTProject manager; Planner; Lawyer; Financial planner; Economist; Electrical systems designer; Physical engineer; Reservoir specialists; Geologist; Environmental engineer; Environmental consultant; Drilling engineer; Pump designer; Programmer; Modeller; Communications; Academic staff.
CONSTRUCTION AND INSTALLATIONProject manager; Construction workers; Drilling manager; Geologist; Drilling crew; Hydro geologist; Electrical engineer; Geophysicist; Power generation engineer; Drilling services manager; Drilling services staff; Generator engineer; Pump installer; Health and safety manager.
OPERATIONS AND MAINTENANCEHeat and electrical engineer; Power generation engineer; Geologist; Hydro geologist; Academic staff; Service engineer.
www.r-e-a.net REview Renewable Energy View 2016 27
For full explanation of terms, methodology and growth projections see pages 68-70
SIZE OF THE UK DEEP GEOTHERMAL SECTOR 2011-2012 2012-2013 2013-2014 2014-2015
Sector Turnover (£’millions) 10 10 10 10
No. of people employed across UK supply chain 200 200 200 200
No. of UK companies across supply chain <25 <25 <25 <25
GROWTH FORECAST
Work is ongoing to get the UK’s first deep geothermal heat plant since the 80s built. Whilst much progress has been made in removing regulatory barriers, a few remain that need Government’s urgent attention. It remains the Government’s aspiration and the sector’s aim to have at least one deep geothermal plant built per year to 2020.

HEAT PUMPS CONTEXT
RENEWABLE ENERGY VIEW 2016
Heat Pumps(Air, Water and Ground-Source Heat)
Not all the output from heat pumps is counted as renewable. Since they require electricity to operate, the Renewable Energy Directive essentially nets off this input electricity - this explains the reference to ‘renewable heat’ in the accompanying graphs and that these do not match the gross output figures used in the Renewable Heat Incentive (RHI). There has been significant growth in the domestic market, as heat pumps now account for 60% of all domestic RHI accreditations, although still behind that originally envisaged for 2020, which were overly ambitious. The proposed increase in tariff under the domestic RHI may further increase deployment.
Installation requires sophisticated understanding of heat demands of building and existing heating systems. Without this, consumer electricity bills and GHG emissions will be far higher than expected.
Heat pump deployment has risen under the Renewable Heat Incentive with the number of ASHPs deployed now exceeding GSHPs.
Renewable Energy Consumer Code and Microgeneration Certification Scheme working to ensure good practice in installers and equipment. Critical to long-term reputation.
www.r-e-a.net REview Renewable Energy View 2016 28
GROWTH FORECASTThe tariffs for heat pumps are currently being consulted upon under the Government’s Renewable Heat Incentive (RHI) recently released consultation. The proposals for heat pumps, if enacted, may help improve the uptake of heat pump and move the sector forward, although the most significant boost to heat pumps would be positive changes in the new build sector. The 2015 edition of REview forecast that over £2bn could be invested in the sector up to 2020, and the proposals set out in the RHI could enable some or all of this investment to be realised.
DECC has recently consulted on changes to the RHI that if enacted could see a rise in ASHP deployment, but conversely could see the introduction of heat demand caps that could adversely impact the deployment of GSHPs.

JOBS IN HEAT PUMPS
MANUFACTURE AND DESIGNDesign engineer; Heat pump engineer; Electrical engineer; Skilled and semi-skilled assembler; Welder; Machinist; Metal worker; Hydro geologist; Geologist; Mechanical engineer.
INSTALLATION AND MAINTENANCEProject manager; Construction worker; Electrical engineer; Pipefitter; Electrician; Heating engineer; Electrical/electronic technician; Plant operator; Plumber; Drilling engineer; Drill rig operative; Operations maintenance engineer; Heating engineer; Pipefitter; Service engineer.
www.r-e-a.net REview Renewable Energy View 2016 29
For full explanation of terms, methodology and growth projections see pages 68-70
0
5,000
10,000
15,000
20,000
25,000
30,000
2009 2010 2011 2012 2013 2014 2015 2016 2017 2018 2019 2020NREAP
26,214
155 355 565 795 1,026 1,252 1,252 1,252319 719
HEAT
PUM
PS: R
ENEW
ABLE
HEA
T PR
OD
UCTI
ON
(GW
h)
HEAT PUMPS: RENEWABLE HEAT PRODUCTION AND PROJECTED GROWTH TREND
UK NREAP PROJECTION FOR 2020 RENEWABLE HEAT PRODUCTIONRECENT GROWTH TREND CONTINUED
0
5,000
10,000
15,000
20,000
25,000
30,000
2005 2006 2007 2008 2009 2010 2011 2012 2013 2014 2015 2016 2017 2018 2019 2020
4,1175,036
6,7228,909 8,490
11,083
2,256
3,977
5,303
7,025
11,583
15,131
37 155 355 565 795 1,026 1,252
ANNU
AL G
ENER
ATIO
N (G
Wh)
HEAT PUMPS GENERATION TO DATE AND PROJECTED BY DECC (NREAP)
NREAP GSHP HEAT PROJECTIONS NREAP ASHP HEAT PROJECTIONSHEAT PUMP RENEWABLE HEAT
26,214
6,373
9,013
12,025
15,933
20,073
SIZE OF THE UK HEAT PUMP SECTOR 2011-2012 2012-2013 2013-2014 2014-2015
Sector Turnover (£’millions) 935 1,058 1,097 1,158
No. of people employed across UK supply chain 7,320 7,345 8,315 8,611
No. of UK companies across supply chain 380 381 417 421

HYDROPOWER CONTEXT
RENEWABLE ENERGY VIEW 2016
Hydropower(Power)
As the graphs show, there is a substantial contribution from historic plant but recent growth rates have been low. Activity is focusing on smaller-scale schemes and the overall picture looks unlikely to change significantly to 2020.
Limit to cost reductions that can be achieved as no two installations are identical.
Significant contribution from historic installations. New deployment mostly small-scale.
www.r-e-a.net REview Renewable Energy View 2016 30
GROWTH FORECAST Reintroduction of pre-accreditation for hydropower was helpful to the sector, whilst the reduction in Feed-in Tariff (FiT), particularly for the <100KW schemes, was not. It is too early to see whether the introduction of pre-accreditation mitigates the reduction in tariffs. It should be noted that like other FiT eligible technologies, quarterly caps have been introduced that will limit deployment if it exceeds the Government target for the technology.
Well established, reliable and proven technology.
Hydro has a 50+ years life.
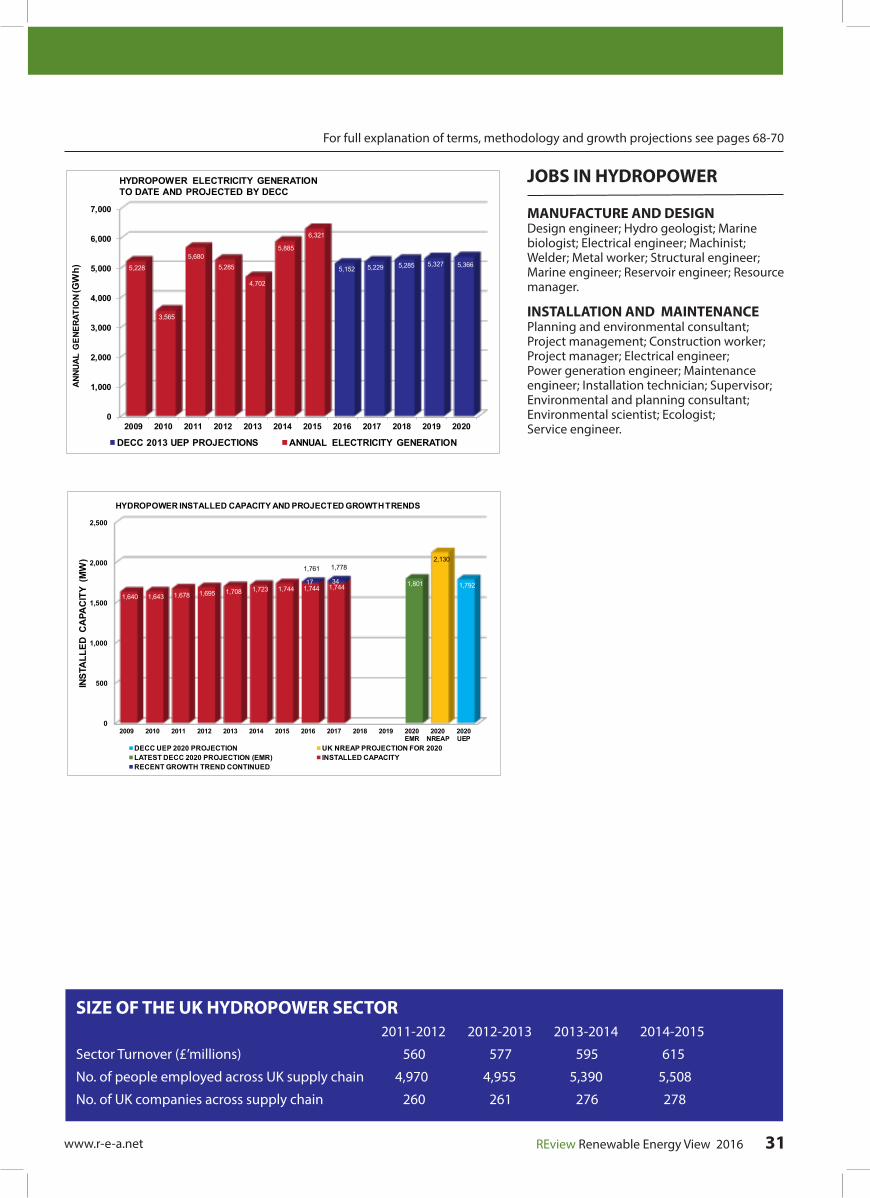
JOBS IN HYDROPOWER
MANUFACTURE AND DESIGN Design engineer; Hydro geologist; Marine biologist; Electrical engineer; Machinist; Welder; Metal worker; Structural engineer; Marine engineer; Reservoir engineer; Resource manager.
INSTALLATION AND MAINTENANCEPlanning and environmental consultant; Project management; Construction worker; Project manager; Electrical engineer;Power generation engineer; Maintenance engineer; Installation technician; Supervisor; Environmental and planning consultant; Environmental scientist; Ecologist;Service engineer.
www.r-e-a.net REview Renewable Energy View 2016 31
For full explanation of terms, methodology and growth projections see pages 68-70
SIZE OF THE UK HYDROPOWER SECTOR 2011-2012 2012-2013 2013-2014 2014-2015
Sector Turnover (£’millions) 560 577 595 615
No. of people employed across UK supply chain 4,970 4,955 5,390 5,508
No. of UK companies across supply chain 260 261 276 278
0
1,000
2,000
3,000
4,000
5,000
6,000
7,000
2009 2010 2011 2012 2013 2014 2015 2016 2017 2018 2019 2020
5,152 5,229 5,285 5,327 5,3665,228
3,565
5,6805,285
4,702
5,885
6,321
ANNU
AL G
ENER
ATIO
N (G
Wh)
HYDROPOWER ELECTRICITY GENERATION TO DATE AND PROJECTED BY DECC
DECC 2013 UEP PROJECTIONS ANNUAL ELECTRICITY GENERATION
0
500
1,000
1,500
2,000
2,500
2009 2010 2011 2012 2013 2014 2015 2016 2017 2018 2019 2020EMR
2020NREAP
2020UEP
1,792
2,130
1,801
1,640 1,643 1,678 1,695 1,708 1,723 1,744 1,744 1,74417 34
INST
ALL
ED C
APA
CIT
Y (M
W)
HYDROPOWER INSTALLED CAPACITY AND PROJECTED GROWTH TRENDS
DECC UEP 2020 PROJECTION UK NREAP PROJECTION FOR 2020LATEST DECC 2020 PROJECTION (EMR) INSTALLED CAPACITYRECENT GROWTH TREND CONTINUED
1,761 1,778
MIXED ENERGY FROM WASTE CONTEXT
RENEWABLE ENERGY VIEW 2016
Mixed Energy from Waste(Combustion, Pyrolysis, Gasification, Landfill Gas - CHP, Heat & Power)
Energy from waste includes a range of different technologies and feedstocks, with differing potential for deployment. The picture is further complicated as the technologies are, to some extent, in competition for the same raw material; much of which continues to be exported rather than used within the UK. Landfill gas continues to make a substantial contribution to renewable electricity generation, but is likely to decline rather than grow as policy has moved away from supporting new projects, and existing sites produce less gas over time. These technologies offer a range of benefits beyond electricity generation, including enhanced greenhouse gas savings from avoided methane emissions from not landfilling waste.
Planning issues remain a significant barrier.
Includes landfill and sewage gas, conventional incineration and advanced treatments such as gasification.
Availability of feedstock an issue, with concerns over impact of exports of UK waste to Europe.
Financial incentives for renewables pay on the renewable content of waste. Difficult to demonstrate for solid waste without being overly burdensome.
www.r-e-a.net REview Renewable Energy View 2016 32
GROWTH FORECAST The 2015 edition of REview estimated that over £4bn could be invested in the sector to 2020. Whilst deployment has been held up over lack of clarity over CfDs, there are over 50 advanced (ACT) treatment projects waiting for financial close and hoping to deploy under future CfD auctions or which have an extension under the RO. The grace period in the RO and increasing focus on the circular economy from the EU should further stimulate growth in this sector.

JOBS IN ENERGY FROM WASTE
MANUFACTURINGDesign engineer; Boiler engineer; Welder; Electrical engineer; Metal worker; Quality assurance; Chemist.
INSTALLATION AND MAINTENANCEPlanning consultant; Environmental consultant; Project manager; Construction worker; Electrical engineer; Boiler engineer; Pipefitter; Welder; Electrician; Heating engineer; Electrical/electronic technician; Plant operator; Mechanic; Waste collection operative; Ash supervisor; Site supervisor.
www.r-e-a.net REview Renewable Energy View 2016 33
For full explanation of terms, methodology and growth projections see pages 68-70
0
2,000
4,000
6,000
8,000
10,000
12,000
14,000
16,000
2009 2010 2011 2012 2013 2014 2015 2016 2017 2018 2019 2020
10,060
11,478
12,297
13,59014,189
4,918 5,031 5,085 5,145 5,160 5,045 4,772
603 697 764 719 761 846 871
1,5091,530 1,503 1,774 1,649 1,950 2,399637 627 615 643 628 614 649
ANN
UAL
GEN
ERAT
ION
(GW
h)
ENERGY FROM WASTE ELECTRICITY GENERATION TO DATE AND PROJECTED BY DECC
DECC 2013 UEP PROJECTIONS LANDFILL GAS SEWAGE SLUDGE DIGESTIONENERGY FROM WASTE ANIMAL BIOMASS
6,180 6,375 6,945 7,137 7,666 7,8847,967
0
500
1,000
1,500
2,000
2,500
3,000
2009 2010 2011 2012 2013 2014 2015 2016 2017 2018 2019 2020EMR
2020NREAP
2,507
1,6161,737
1,866 1,870 1,901
2,066
2,280 2,280 2,280
156322
INST
ALL
ED C
APA
CIT
Y (M
W)
ENERGY FROM WASTE INSTALLED POWER CAPACITY AND PROJECTED GROWTH TREND
LATEST DECC 2020 PROJECTION (EMR) INSTALLED CAPACITY RECENT GROWTH TREND CONTINUED
NREAP does not distinguishbetween biomass electricity andEfW, so is not shown
2,4362,603
SIZE OF THE UK ENERGY FROM WASTE SECTOR 2011-2012 2012-2013 2013-2014 2014-2015
Sector Turnover (£’millions) 809 832 866 895
No. of people employed across UK supply chain 6,020 6,545 7,109 7,316
No. of UK companies across supply chain 330 341 363 366
Taking a helicopter view of the UK’s energy system, you can see that it is changing dramatically: on the positive, low carbon side, we now have more than 1 million rooftops with solar and renewables hit dizzying heights of 24.7% of electricity in the last quarter of 2015 and a future expectation to wean the UK off centralised coal-fired generation by 2025. On the negative side, the Capacity Market, established to ensure secure electricity supplies as we move through these changes, has subsidised new higher carbon diesel generation, with no sign of the Government’s favoured “low carbon” CCGT fleet. What is happening here? This time last year the REA and OFGEM were posing the question of whether the UK energy market “status quo” needed to change - even more so than changes now enshrined in the Electricity Market Reform (EMR) itself. The EMR had hardly begun when many more voices joined the “call” that there must be a different way to deliver cost effective, low carbon energy solutions. The “break with tradition” we discussed last year must happen quickly or the UK may find itself locking in market structures that can only be satisfied by committing to large, expensive centralised generation assets.
Whilst support for the renewables sector has been seriously curtailed and the support that remains is even more opaque, the REA has shone a light on emerging technologies. Especially in the case of energy storage which
compliments and supports the roll-out of renewables, both variable and baseload, and supported debates regarding possible new market models. At the end of 2015 the Department of Energy and Climate Change (DECC) produced a report “Towards a Smart Energy System”1
echoing the views of the REA and OFGEM and laid out its stall for the studies and consultations to come in 2016. It’s worth a read as it summarises how the Government views the system challenges for energy demand and supply through to 2050. It spells out how smart solutions encompassing a decentralised energy world could help the UK to realise significant benefits by 2050. These benefits are based on estimates from studies conducted before 2014, the key areas being:
• Deferring or avoiding investment in network reinforcement: up to £12 billion saving by 2050
• Reducing the need for conventional generation (including peaking plant!): £0.5-5 billion lower in
2050, cumulative benefits in the magnitude of tens of billions
• Meeting binding targets with lower “absolute” renewable capacity: £0.5-5 billion
• Maximising the use of existing low carbon generation
• Optimising balancing of the system on a minute-by-minute basis: £1 billion per annum savings
From anyone’s perspective, this is serious money.
As we progressed through the first quarter of 2016, a further stream of heartening reports, events and announcements have highlighted how the energy industry is ready to move forward with the development of a low carbon, decentralised future, despite the Government’s confused messages regarding energy policy. March saw the launch of two separate reports; one by the Carbon Trust with Imperial College2 and even more notably, a report by the National Infrastructure Commission (NIC)3. Both sent DECC the unequivocal message that a secure, cost effective low carbon energy system is both possible and best achieved through the creation of a decentralised flexible energy system. The NIC has estimated that greater interconnection, storage, and demand flexibility could save the UK £8bn a year by 2030. The graphic above from their report reveals how this influential body sees the power system developing.
To be centralised or DECENTRALised: ‘that is the question…’. . . for a cost effective, low carbon, future energy market!
REA FOCUS FEATURE
Decentralised Energy
www.r-e-a.net REview Renewable Energy View 2016 34
The NIC has estimated that greater interconnection, storage, and demand flexibility could save the UK £8bn a year by 2030.

www.r-e-a.net
If we needed even more evidence that things are changing, then you only have to look at the extraordinary response to the System Operator, National Grid’s Enhanced Frequency Response tender for energy storage. They received 68 offers and 1.4GW of capacity for their 200 MW tender, and this is just the beginning. Both the DECC and NIC reports still may not be truly representing the scale of the opportunities that a future decentralised energy system can deliver. The KPMG report4 commissioned by the REA’s members, published in January 2016, examined decentralised energy and the role for energy storage, looking at certain assumptions and focussing on the barriers in policy and the regulatory
changes that need to happen to enable supportive yet disruptive technology to the system. The Carbon Trust Imperial College report2 “Can storage help reduce the cost of a future UK electricity system?” also had similar conclusions to previous reports. The truth is many organisations, at all levels of the value chain, are modelling furiously to understand what this could mean for the industry; for some of them to justify not making changes and for others using the models to understand the pace of change and to prepare for it. Some of the traditional utilities are reinventing themselves to embrace and potentially lead on delivering services to support a decentralised business model. The major
retail energy trade association, Energy UK, finally acknowledged that centralised energy models are being challenged and the future closure of coal5.
The one area that none of these recent reports address is the take up of electric vehicles and how it will influence the energy models (see page 42). This will be an important influencing factor not only on demand but in supporting smart energy management for homes and businesses. With all this said, the REA wishes to work with all stakeholders in a decentralised energy world. It would be remiss as a trade association not to be involved in these developments and to that end REA has created the Decentralised Energy Forum to ensure renewables, energy storage and electric vehicles are factored in and contribute to this game changing shift.
Speaking of scenarios, it will be interesting to see what the next set of National Grid “Future Energy Scenarios” will show. Will the “gone green” scenario be morphed to represent a ‘Green Prosumer’ living in a decentralised energy future or will current models prevail?
1 https://www.gov.uk/government/uploads/ system/uploads/attachment_data file/486362/Towards_a smart_energy_ system.pdf2 The Carbon Trust Imperial College report, https://www.carbontrust.com/ media/129310/energy-storage-systems-role- value-strategic-assessment.pdf3 https://www.gov.uk/government/ uploads/system/uploads/attachment_data/ file/505218/IC_Energy_Report_web.pdf4 Development of decentralised energy and storage systems in the UK, January 2016, REA/KPMG http://www.r-e-a.net/upload/ rea_storage_report-web_accessible.pdf5 Pathways for the GB Electricity Sector to 2030, February 2016,Energy UK https://www. energy-uk.org.uk/publicationhtml?task=file. download&id=5722
Infographic reproduced with permission from the National Infrastructure Commission - Smart Power report 2016
REview Renewable Energy View 2016 35

SOLAR PV CONTEXT
RENEWABLE ENERGY VIEW 2016
Solar Photovoltaics(Power)
Of all the technologies featured, solar PV’s track record for exceeding expectations in terms of cost reduction and deployment is second to none. Much of the recent growth has been driven by larger-scale projects but we have also seen significant growth in rooftop installations. Government has responded to this by making significant cuts to the FiT and closing the RO to all solar PV projects from April 2016. There are also serious concerns about whether solar PV will be included in Contracts for Difference auctions, at least in the medium term. In order for solar PV to become attractive without subsidies there is a need to unlock deployment on buildings in the commercial sector and also for solar to continue to reduce its installed costs. For comparison purposes, it is always worth looking at the generation figures rather than installed capacity, as load factors for solar PV are lower than for other technologies, such as wind.
EU has imposed additional duties on Chinese panels on grounds of unfair competition – pushing up the cost of modules. The European commission is holding a review into the measures which is expected to run until 2017, the measures will remain in place during this time.
Solar PV deployment was boosted dramatically by the introduction of the FiT, especially for rooftop systems. Meanwhile large ground-mounted projects benefitted from the Renewables Obligation (RO) scheme.Dramatic cost reductions have occurred over the last 5 years. Efficiencies and innovative business models mean that some forms of solar PV could be attractive without subsidies earlier than expected and some zero-subsidy projects could happen towards the end of 2016.
Popular on buildings as low maintenance, but ‘solar farms’ considered controversial by Government. Industry has developed codes of practice, community engagement and biodiversity guides to reduce negative coverage of solar PV.
Due to the number of systems already deployed, Solar PV is the renewable energy technology most likely to benefit from the anticipated rise of behind the meter energy storage.
www.r-e-a.net REview Renewable Energy View 2016 36

JOBS IN SOLAR PV
MANUFACTURING AND DESIGNDesign engineer; Systems engineer; Production manager; Production supervisor; Electrical engineer; Laboratory technician; Quality assurance; Assembler line personnel; Chemist; Surveyor; Materials scientist; Warehousing/logistics personnel.
INSTALLATION AND MAINTENANCEPlanning and environmental consultant (ground mounted schemes); Roofer; Electrician; Instrumentation engineer; Controls and electrical systems technician; Installation engineers; Installation supervisor; Scaffolder; Service engineers; Panel cleaners; Security.
GENERAL MANAGEMENT, SALES AND ADMINSales/purchase administrators; Sales and business development team; Logistics - drivers, packers, warehouse staff; Marketing team.
www.r-e-a.net REview Renewable Energy View 2016 37
For full explanation of terms, methodology and growth projections see pages 68-70
0
5,000
10,000
15,000
20,000
25,000
30,000
2009 2010 2011 2012 2013 2014 2015 2016 2017 2018 2019 2020EMR
2020NREAP
2020UEP
9,884
2,680
8,389
2,700
27 96995 1,756
2,851
5,378
8,915 8,915 8,915
6,850
18,963
INST
ALL
ED C
APA
CIT
Y (M
W)
SOLAR PV INSTALLED CAPACITY AND PROJECTED GROWTH TRENDS
DECC UEP 2020 PROJECTION UK NREAP PROJECTION FOR 2020EMR 2020 PROJECTION: SMALL-SCALE (<5MW) EMR 2020 PROJECTION: LARGE-SCALEINSTALLED CAPACITY RECENT GROWTH TREND CONTINUED
Projections for 2015 and 2016 are based on average growth rates since 2013
15,765
27,878
11,089
0
1,000
2,000
3,000
4,000
5,000
6,000
7,000
8,000
9,000
10,000
2009 2010 2011 2012 2013 2014 2015 2016 2017 2018 2019 2020
6,738
8,001
8,7639,243
9,904
20 41244
1,352
1,989
4,050
7,556
ANN
UAL
GEN
ERAT
ION
(GW
h)
SOLAR PV ELECTRICITY GENERATION - TO DATE AND PROJECTED BY DECC
DECC 2013 UEP PROJECTIONS ANNUAL ELECTRICITY GENERATION
SIZE OF THE UK SOLAR PV SECTOR 2011-2012 2012-2013 2013-2014 2014-2015
Sector Turnover (£’millions) 2,027 2,166 2,307 2,477
No. of people employed across UK supply chain 15,650 15,620 16,103 16,880
No. of UK companies across supply chain 2,200 2,178 2,088 2,005
GROWTH FORECAST The significant reduction in tariffs and the introduction of deployment caps set out in the Government response to the review of the Feed-in Tariffs (FiT) scheme consultation in August 2015, coupled with the early closure of the Renewables Obligation (RO), and uncertainty if solar will be eligible to bid into further Contracts for Difference (CfD) auctions makes providing an accurate growth and revenue forecast difficult. There is consensus within the sector that deployment will be down significantly compared with 2015, particularly in the short term, as assuming the quarterly deployment caps are reached only 1.2GW of solar can be deployed under the FiT up to Q1 2019. This compares with just over 923MW deployed under the FiT in 2015. It is clear that new installations are continuing albeit at much lower levels than previously seen.
Looking forward, as we approach 2020 solar costs continue to fall. This coupled with the emergence of competitive energy storage solutions and solar volumes increasing, means that revenues could recover in the longer term.

SOLAR THERMAL CONTEXT
RENEWABLE ENERGY VIEW 2016
Solar Thermal(Heat)
Solar thermal provides another check to over-confidence in the reliability of modelling projections. Analysis for the Renewable Heat Incentive has consistently predicted minimal deployment, yet moderate deployment has continued. However, the Government is now proposing to remove the technology from the RHI, which would significantly lower its deployment potential.
Main UK market likely to be domestic, but has been used in other countries at larger scale and in district heating.
Deployed in the UK for many years but was overtaken in terms of deployment by Solar PV, which benefitted from the FiT.
www.r-e-a.net REview Renewable Energy View 2016 38
GROWTH FORECASTAt the time of writing the Renewable Heat Incentive (RHI) consultation proposes to completely remove eligibility for new installations from April 2017. It will have a major impact on the sector if enacted by significantly reducing the number of domestic and non-domestic installations carried out annually. The new-build sector and those who would install solar thermal for reasons other than tariff income will continue, most likely at levels prior to the introduction of grants and tariffs.
Current Government proposal to exclude the technology from Renewable Heat Incentive.
The cancellation of the next phase of the Zero Carbon Homes policy has further adversely impacted solar thermal’s prospects.
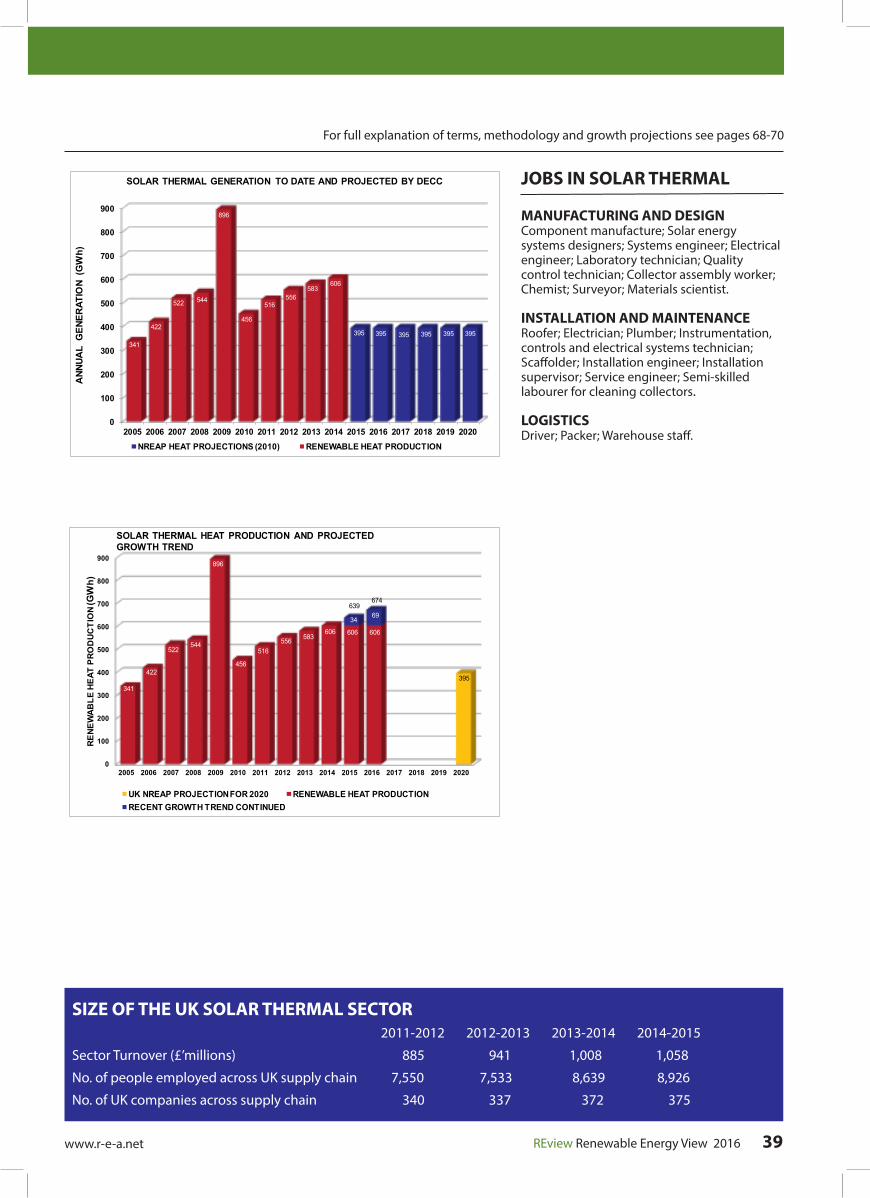
JOBS IN SOLAR THERMAL
MANUFACTURING AND DESIGNComponent manufacture; Solar energy systems designers; Systems engineer; Electrical engineer; Laboratory technician; Quality control technician; Collector assembly worker; Chemist; Surveyor; Materials scientist.
INSTALLATION AND MAINTENANCERoofer; Electrician; Plumber; Instrumentation, controls and electrical systems technician; Scaffolder; Installation engineer; Installation supervisor; Service engineer; Semi-skilled labourer for cleaning collectors.
LOGISTICSDriver; Packer; Warehouse staff.
www.r-e-a.net REview Renewable Energy View 2016 39
For full explanation of terms, methodology and growth projections see pages 68-70
SIZE OF THE UK SOLAR THERMAL SECTOR 2011-2012 2012-2013 2013-2014 2014-2015
Sector Turnover (£’millions) 885 941 1,008 1,058
No. of people employed across UK supply chain 7,550 7,533 8,639 8,926
No. of UK companies across supply chain 340 337 372 375
0
100
200
300
400
500
600
700
800
900
2005 2006 2007 2008 2009 2010 2011 2012 2013 2014 2015 2016 2017 2018 2019 2020
395 395 395 395 395 395341
422
522 544
896
456
516556
583606
ANN
UAL
GEN
ERAT
ION
(GW
h)
SOLAR THERMAL GENERATION TO DATE AND PROJECTED BY DECC
NREAP HEAT PROJECTIONS (2010) RENEWABLE HEAT PRODUCTION
0
100
200
300
400
500
600
700
800
900
2005 2006 2007 2008 2009 2010 2011 2012 2013 2014 2015 2016 2017 2018 2019 2020
395341
422
522544
896
456
516556 583
606 606 606
3469
RE
NE
WA
BLE
HE
AT P
RO
DU
CT
ION
(GW
h)
SOLAR THERMAL HEAT PRODUCTION AND PROJECTED GROWTH TREND
UK NREAP PROJECTION FOR 2020 RENEWABLE HEAT PRODUCTIONRECENT GROWTH TREND CONTINUED
639674

There have been two words frequently on many peoples lips in the power industry over the past six months - no, not expletives about Government policy, but ‘Energy Storage’. The prospect of being able to store excess energy (not just electricity!) at times of low system demand and higher supply, and release this at times of higher demand and low supply, has excited many as it helps solve several of the criticisms the renewable energy industry has persistently faced. These range from charges for generating at the ‘wrong time’, to exorbitant grid connection offers in areas of constrained grid capacity.
More than this however, storage represents a great opportunity in its own right, to shift to a low-carbon energy system and save the consumer money in system integration and operational costs. Government-commissioned reports have illustrated this repeatedly in the last few months and the REA’s reports have also highlighted this.
Government support has been warm to date, in terms of rhetoric in any case. There have been some notable successes, such as AES’s battery development at Kilroot in Northern Ireland, RES’s plans for alleviating grid constraints in the south-west and Sunamp’s 1,000 domestic thermal energy storage installations. National Grid’s tender for grid services aimed at batteries led to applications for over six times the 200MW originally tendered for, and applications on the
distribution networks will probably have reached double digit GWs by the time you read this.
Meanwhile, on the domestic scale, Tesla’s market entry has led to a surge of interest from the media and public alike in a way that rarely happens in the energy sector, while other companies, including Sonnen, have exciting business models that will be closely followed by industry. Sunamp, Ecotricity, Powervault and others represent genuinely innovative British companies.
Amidst all of this a note of caution must be given - Germany is Europe’s largest storage market, but still only amounts to around 30,000 installed behind the meter units (one-third attributable to a single company), and that is with a Government grant in place. Italy is a fast growing market but still only a fraction of this size.
So storage may not deliver at scale in the next few years behind the meter, while regulatory legislative changes could be required for it to take off at the grid level in a significant way.
DECC have been positive so far in engaging with industry and deserve credit for this. However, the pace of change may well overwhelm them, as it did with the solar industry. The REA has been attempting to pre-empt many of the problems the new industry could encounter which could hamper development. The Association has led the development of installation standards with the IET, pointed out easy to implement improvements to the Capacity Market that would benefit
Exciting Times for Energy Storage in the UK? We take a look at the current UK market position and how it could develop in the coming year.
REA FOCUS FEATURE
Energy Storage
www.r-e-a.net REview Renewable Energy View 2016 40
National Grid’s tender for grid services aimed at batteries led to applications for over six times the 200MW originally tendered for,

storage, kicked off discussions on battery sustainability and fire guidance, and published two reports on the barriers in the market and likely cost trajectories. RECC have led the way with the first consumer protection information for the sector.
Industry is showing that we can work together to address and pre-empt future problems. DECC can aid this by making the necessary changes to the existing framework, there’s no need to reinvent the wheel, doing so as quickly as possible. There are no widespread calls for a ‘subsidy’ (one reason why ministers have been receptive). Many countries are lining up to develop and deploy storage technologies and the UK has a real opportunity to lead the field.
Clearly a great deal more needs to happen, energy storage is not a panacea for all the criticisms levelled at renewables and to approach it as such risks overplaying the opportunity and leading to disappointment further down the line. But storage, alongside other flexible technologies and approaches can address a number of these and provide huge benefits to the system. Now what we need is a clear regulatory and policy framework to deliver these.
www.r-e-a.net REview Renewable Energy View 2016 41
Storage - technology is accelerating at a remarkable speed. The UK could become a world leader in making use of these technologies, not through subsidies, but by ensuring that better regulationcreates a level playing field between generation and storage.National Infrastructure Commission report | Smart Power | March 2016

There are many synergies between EVs and the sector-leading work REA is already doing in the field of energy storage and renewable energy. EVs are also an important component in delivering a decentralised energy future for the UK which the REA is striving to see powered largely by renewable energy.
Here the REA’s EV expert, Tanya Sinclair, charts the development of the UK EV market and the challenges it faces.
Mass-produced, mass-market EVs have only been available for six years, but the generous media and policy attention they are afforded tells two conflicting stories about whether they are here to stay.
While sales are growing by some 150 per cent year on year, our urban air quality is the worst it has ever been. The UK is one of Europe’s leading EV markets, but only 1.3% of new vehicle registrations are electric. UK consumers can access generous subsidies, but sales are not meeting manufacturers’ expectations.
2010 - 12
As the first company to stake significant investment on an EV programme, Nissan is synonymous with the mass-market EV. The Nissan LEAF was launched in 2010 with bold claims about changing the world with millions of sales.
LEAF asked a lot from drivers. Instead of travelling for 300 miles on a tank and refuelling in minutes, drivers were asked to accept an expensive car with a 90 mile range, only re-chargeable over a period of hours. The UK reacted coolly.
However, in what is now regarded as a demonstration of clarity and foresight, the Government took a risk by being
an early EV champion, establishing the Office for Low Emission Vehicles (OLEV) in 2010, a well-resourced cross-departmental unit offering a package of incentives designed to accelerate market growth.
From 2010, EV buyers could claim up to £5000 off the cost of a new EV and access several other grants, tax-breaks and benefits.
2012 - 15
Despite the combined forces of Government support and manufacturer marketing, sales remained low. EVs were seen as a compromise in space, quality and range, and expensive even with grant support.
The keen but small community of early adopters - basing their purchase on a desire to minimise their carbon footprint - also began to ask questions about how clean their investment really was.
Concerns grew that plugging in a foreign-built car to a chargepoint which drew electricity from fossil fuels served only to displace emissions not reduce them. Although it had expertise from DfT, DECC and BIS, OLEV did not consider it within scope to consider how to reduce emissions beyond the tailpipe. However, what has never been in doubt is that EV’s can play a major role in improving air quality in urban areas.
The real low-carbon impact of EVs is still debated, although those who make and sell them are adamant that they are facilitating progress towards cleaner transport, and that energy generation and supply is neither their specialism nor responsibility.
2015 - present
Early adopters gathered in online forums to share these concerns, as well as real life expertise on the realities of driving an EV.
So while barriers to purchase like range anxiety and operability of chargers dissuaded some, online communities offered unprecedented access to independent, first-hand reviews, allowing undecided drivers to get informed on their purchase.
As online knowledge empowered consumers and the choice of credible, affordable EVs began to grow, sales increased. A second generation of EVs with bigger batteries and longer ranges helped accelerate sales further.
From early 2015 there was real choice in the market for the first time. For almost every conventional car there was an EV alternative in the same segment. EVs that were once seen as a compromise were now being sought out for their superior technology and quality.
Manufacturers like Jaguar Land Rover and Aston Martin, whose reputation was built on the combustion engine, announced EV programmes. And, the Nissan LEAF has now extended its range from 90 miles to 155 miles.
Electric Vehicles are on the Move in the UKThe REA recently added electric vehicles (EVs) to the portfolio of products and services it represents.
REA FOCUS FEATURE
Electric Vehicles
www.r-e-a.net REview Renewable Energy View 2016
Q1 2016: a new electric vehicle is registered every 13 minutes in the UK
www.GoUltraLow.com
42

Flagship brands like Tesla exploded onto the scene and drew EVs from the motoring pages into the mainstream. Growing concerns about air quality and the ‘dieselgate’ emissions scandal made EVs a transport policy priority.
However, it was at this time that the Government support the industry enjoyed became unsustainable. Although OLEV was clear from the outset that their support was in place to kick-start the early market, the sudden uplift in sales meant that incentives would, in consultation with industry, need to be phased out.
Industry firmly believes the Government to be pulling the plug or designing a cliff-edge which will distort the market before EVs have become mainstream. There is
no agreement of what is mainstream or when we might reach it. Yet, according to Go Ultra Low, the joint Government and industry campaign aiming to increase purchase consideration of electric vehicles, more EVs were registered in 2015 than in the past 5 years put together. In the first 3 months of 2016 10,496 EVs took to the road in the UK.
Looking to the future
Governments of all persuasions have consistently supported EVs, whether to encourage clean manufacturing, improve air quality or to position the UK as a globally competitive technology pioneer.
Their support has paid dividends; despite the mixed press and relatively low awareness, the UK has the second largest EV fleet in Europe, after Norway. However, Government subsidies must and will eventually be replaced by softer benefits such as low-emission zones and discounted parking.
But it’s a sound place for the Government to position the UK as a technology leader, as EVs are advancing at a great pace, spurred on by UK innovation. The Nissan LEAF and its batteries are built here and the investment in R&D from other manufacturers is growing.
EVs are no longer just cars - they are vans, taxis and bikes. They are being powered by ever-more efficient
batteries, with new battery chemistries decreasing weight and increasing range. As our homes and businesses become increasingly smart in the way that they use, and in many cases generate, electricity will enable EVs to become an integral part of that mix.
Indeed and EVs batteries could be used to store electricity for the home as well as used for propulsion.
UK companies are developing faster ways of charging EVs using stored energy and wireless technology that can charge vehicles without cables.
We are also home to some of the most disruptive new ways of owning and driving cars. UK start-ups are challenging established models of how we buy EVs, how we drive and park them, whether we share journeys or offer them to others, or whether we own them at all.
In 2010 the Government declared its aspiration for all cars in the UK to be zero emissions by 2050. It had such confidence in its commitment that it re-stated it at COP21.
Whether the UK will meet this target depends on market and industry factors. Whether meeting this target means our consumption of electricity will be cleaner depends on how we can decarbonise supply.
www.r-e-a.net REview Renewable Energy View 2016 43
Tesla takes 400,000 preorders (in only 3 weeks) for its new Model 3 sedan due for release end 2017 Launched April 2016

OFFSHORE WIND CONTEXT
RENEWABLE ENERGY VIEW 2016
Offshore Wind(Power)
There is strong recent growth, which is likely to continue in light of the recent CfD announcement.Continued support is dependent on further cost reductions being achieved, with a number of government/industry initiatives to remove barriers and drive improvements across the supply chain. It may be significant that the Government’s more recent projections scale back anticipated deployment compared to the original 2020 National Renewable Energy Action Plan.
Requires far higher subsidy than many other options. Industry committed to significant cost reductions in medium term.
Strategic industrial priority, given opportunity to build UK leadership.
Contracts for Difference mechanism vital to delivering intended deployment and cost reductions.
REview Renewable Energy View 2016 44 www.r-e-a.net
GROWTH FORECAST
At the time of writing, the budget for the next three CfD rounds had been published, but the exact timings were still to be confirmed. Once the detail is known, particularly how much will be available in the auctions, it will then be possible to say whether £12bn+ forecast investment reported in the 2015 edition of REview will be realised.
Clear, supportive policy beyond 2020 is essential.
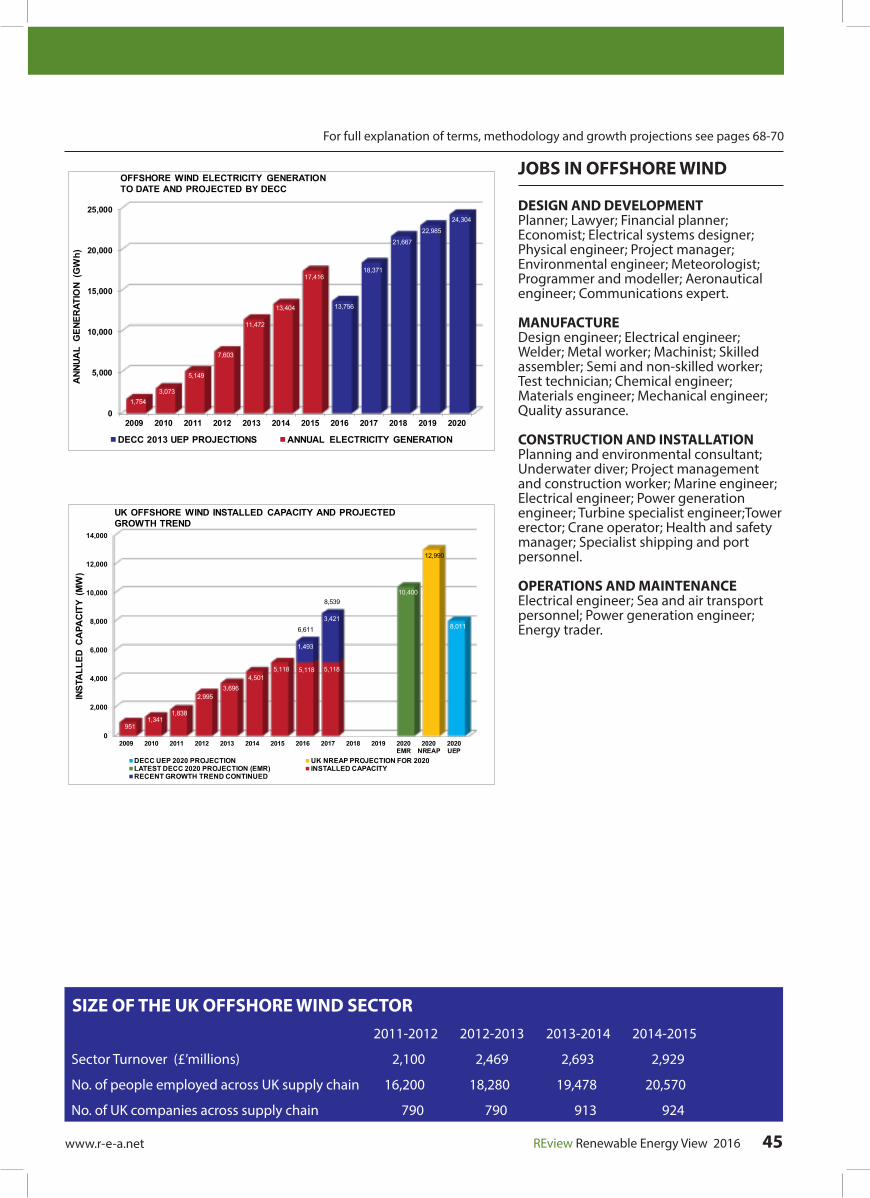
JOBS IN OFFSHORE WIND
DESIGN AND DEVELOPMENTPlanner; Lawyer; Financial planner; Economist; Electrical systems designer; Physical engineer; Project manager; Environmental engineer; Meteorologist; Programmer and modeller; Aeronautical engineer; Communications expert.
MANUFACTUREDesign engineer; Electrical engineer; Welder; Metal worker; Machinist; Skilled assembler; Semi and non-skilled worker; Test technician; Chemical engineer; Materials engineer; Mechanical engineer; Quality assurance.
CONSTRUCTION AND INSTALLATIONPlanning and environmental consultant; Underwater diver; Project management and construction worker; Marine engineer; Electrical engineer; Power generation engineer; Turbine specialist engineer;Tower erector; Crane operator; Health and safety manager; Specialist shipping and port personnel.
OPERATIONS AND MAINTENANCEElectrical engineer; Sea and air transport personnel; Power generation engineer; Energy trader.
www.r-e-a.net REview Renewable Energy View 2016 45
For full explanation of terms, methodology and growth projections see pages 68-70
SIZE OF THE UK OFFSHORE WIND SECTOR 2011-2012 2012-2013 2013-2014 2014-2015
Sector Turnover (£’millions) 2,100 2,469 2,693 2,929
No. of people employed across UK supply chain 16,200 18,280 19,478 20,570
No. of UK companies across supply chain 790 790 913 924
0
2,000
4,000
6,000
8,000
10,000
12,000
14,000
2009 2010 2011 2012 2013 2014 2015 2016 2017 2018 2019 2020EMR
2020NREAP
2020UEP
8,011
12,990
10,400
9511,341
1,838
2,9953,696
4,5015,118 5,118 5,118
1,493
3,421
INST
ALL
ED C
APA
CIT
Y (M
W)
UK OFFSHORE WIND INSTALLED CAPACITY AND PROJECTEDGROWTH TREND
DECC UEP 2020 PROJECTION UK NREAP PROJECTION FOR 2020LATEST DECC 2020 PROJECTION (EMR) INSTALLED CAPACITYRECENT GROWTH TREND CONTINUED
8,539
6,611
0
5,000
10,000
15,000
20,000
25,000
2009 2010 2011 2012 2013 2014 2015 2016 2017 2018 2019 2020
13,756
18,371
21,667
22,985
24,304
1,7543,073
5,149
7,603
11,472
13,404
17,416
ANN
UAL
GEN
ERAT
ION
(GW
h)
OFFSHORE WIND ELECTRICITY GENERATIONTO DATE AND PROJECTED BY DECC
DECC 2013 UEP PROJECTIONS ANNUAL ELECTRICITY GENERATION

ONSHORE WIND CONTEXT
RENEWABLE ENERGY VIEW 2016
Onshore Wind(Power)
Onshore wind has grown well over several years. The geographical spread is not even, with a strong concentration in Scotland. If recent trends were continued, it would be well on course for the 2020 deployment anticipated by Government. However, growth has slowed recently: rates of planning consent have fallen significantly and the full impact of increased requirements on community engagement - including increased payments to local residents - has yet to be seen. Recent changes to the RO and CfDs following the election will have a significant effect on further deployment. Onshore wind is one of the cheapest technologies for generating renewable electricity, so the implication of attempts to reduce future deployment is that other, more expensive, technologies will be needed to meet renewable and climate change targets.
www.r-e-a.net REview Renewable Energy View 2016 46
Cost-effective technology, should continue to play key role with policy focussed on value for money.
Significant contributor to Renewables Obligation, but now barred from mechanism. Also supported in Feed in Tariff and potentially in Contracts for Difference Pot 1.
Politically controversial. Focus of sustained criticism in media and Parliament. Industry seeking to address through community engagement, sharing economic benefits of developments and attempting subsidy free projects.
GROWTH FORECAST
Despite being one of the cheapest forms of renewable energy, deployment has been curtailed by changes to the planning system put in place by the Conservative Government in 2015 and proposals to end subsidies for onshore wind through early closure of the Renewables Obligation (RO) to Onshore Wind as of May 2016. These changes make it difficult to see how all of the £11bn of investment forecast in the 2015 edition of REview will be realised.

www.r-e-a.net REview Renewable Energy View 2016 47
For full explanation of terms, methodology and growth projections see pages 68-70
0
5,000
10,000
15,000
20,000
25,000
30,000
2009 2010 2011 2012 2013 2014 2015 2016 2017 2018 2019 2020
22,95324,108
25,38426,627
28,036
7,527 7,181
10,50312,232
16,950
18,611
23,026
ANN
UAL
GEN
ERAT
ION
(GW
h)
ONSHORE WIND ELECTRICITY GENERATIONTO DATE AND PROJECTED BY DECC
DECC 2013 UEP PROJECTIONS ANNUAL ELECTRICITY GENERATION
0
2,000
4,000
6,000
8,000
10,000
12,000
14,000
16,000
2009 2010 2011 2012 2013 2014 2015 2016 2017 2018 2019 2020EMR
2020NREAP
2020UEP
14,890
11,681
13,915
3,4714,060
4,629
5,904
7,519
8,4869,073 9,073 9,073
1,662
3,629
ONS
HOR
E W
IND
INST
ALL
ED C
APA
CIT
Y (M
W)
UK ONSHORE WIND INSTALLED CAPACITY AND PROJECTED GROWTH TREND
UK NREAP PROJECTION FOR 2020 DECC UEP 2020 PROJECTIONLATEST DECC 2020 PROJECTION (EMR) INSTALLED CAPACITYRECENT GROWTH TREND CONTINUED
10,736
12,702
SIZE OF THE UK ONSHORE WIND SECTOR 2011-2012 2012-2013 2013-2014 2014-2015
Sector Turnover (£’millions) 2,110 2,278 2,493 2,712
No. of people employed across UK supply chain 15,200 17,071 18,191 19,210
No. of UK companies across supply chain 730 726 844 863
JOBS IN ONSHORE WIND
DESIGN AND DEVELOPMENTDesign engineer; Lawyer; Project manager;Financial planner; Economists; Electricalsystems designer; Physics engineer; Environmental engineer; Environmental consultant; Meteorologist; Programmers and modellers; Aeronautical engineer; Communications expert.
MANUFACTUREElectrical engineer; Welder; Metal worker; Machinist; Skilled assembler; Test technician; Quality controller; Chemical engineer; Materials engineer; Mechanical engineer; Semi and non skilled workers.
CONSTRUCTION AND INSTALLATIONPlanning and environmental consultants; Project management and construction workers; Electrical engineer; Power generation engineer; Project manager; Turbine specialist engineer; Tower erector - crane operator; Health and safety manager.
OPERATIONS AND MAINTENANCEElectrical engineer; Power generation engineer; Energy traders.
DISTRIBUTIONDistribution manager; Tanker driver; Blend operative; Forecourt operative.

WAVE & TIDAL CONTEXT
RENEWABLE ENERGY VIEW 2016
Wave and Tidal(Power)
The industry is moving from technology development to on the ground deployment. Much of the Government’s support has been directed at funding innovation, with progress in commercial-scale deployment not being as rapid as Government anticipated. Although there has been some high profile investment, some major players have reduced their involvement or stepped away from the industry altogether and it is clear that a new policy impetus is needed if this sector is to achieve its potential. In February this year Government announced an independent review into the feasibility and practicality of tidal lagoon energy in the UK. This review will also look at matters such as cost effectiveness, role in the UK’s energy mix and scale of opportunity in the UK and internationally. It may well impact the Swansea Bay Tidal Lagoon project which Government is still considering having initially given it the green light. It remains to be seen whether projects such as tidal lagoons offer better value for money than smaller wave and tidal flow schemes.
Relatively high levels of support in Renewables Obligation and Contracts for Difference, but needs clear policy beyond 2020.
Still at an early stage of deployment.
Major challenges in creating Government policy that enables the industry to deploy at scale.
www.r-e-a.net REview Renewable Energy View 2016 48
GROWTH FORECAST
Recent business closures are testament to the challenges and the lack of deployment in this sector. However, some projects are in progress and if they can demonstrate success, investment into the sector in line with the 2015 REview forecast of 0.5bn to 2020 may still be possible. Swansea Bay Tidal Lagoon project has an overall cost of about £1bn to achieve construction and connection to the grid.

JOBS IN WAVE AND TIDAL
PLANNING AND DEVELOPMENTEnvironmental and planning consultant; Marine biologist; Marine surveyor; Subsea engineer.
DESIGN AND MANUFACTURE (INCLUDING TECHNOLOGY R&D)Design engineer; Electrical systems designer; Project manager; Environmental engineer; Environmental consultant; Oceanographer; Programmer and modeller; Fluid dynamics specialist; Communications and control engineer; Electrical engineer; Power generation engineer; Marine engineer; Electrical engineer; Welder; Metal worker; Machinist; Skilled assembler; Test technician; Materials engineer; Mechanical engineer.
CONSTRUCTION AND INSTALLATIONPlanning and environmental consultants; Project management and construction workers; Marine engineer; Electrical engineer; Power generation engineer; Quantity surveyor; Turbine specialist engineer; Health and safety manager; Specialist shipping and port personnel; Divers; Controls engineer; Project manager; Marine installation crew; Health and safety manager.
SUPPORT SERVICES AND OTHERDevice maintenance crew; Electrical engineer; Marine engineer; Power generation engineer; Energy sales people; Divers.
www.r-e-a.net REview Renewable Energy View 2016 49
For full explanation of terms, methodology and growth projections see pages 68-70
0
50
100
150
200
250
300
350
400
450
2009 2010 2011 2012 2013 2014 2015 2016 2017 2018 2019 2020
97
128
267 267
403
1 2 1 3 6 2 2
ANN
UAL
GEN
ERAT
ION
(GW
h)
WAVE AND TIDAL ELECTRICITY GENERATION TO DATE AND PROJECTED BY DECC
DECC 2013 UEP PROJECTIONS ANNUAL ELECTRICITY GENERATION
0
200
400
600
800
1,000
1,200
1,400
2009 2010 2011 2012 2013 2014 2015 2016 2017 2018 2019 2020EMR
2020NREAP
2020UEP
149
1,300
1402 3 3 7 7 8.7 8.9 9 9
3 6
INST
ALL
ED C
APA
CIT
Y (M
W)
UK WAVE AND TIDAL STREAM INSTALLED CAPACITY AND PROJECTED GROWTH TREND
DECC UEP 2020 PROJECTION UK NREAP PROJECTION FOR 2020LATEST DECC 2020 PROJECTION (EMR) INSTALLED CAPACITYRECENT GROWTH TREND CONTINUED
12 15
SIZE OF THE UK WAVE & TIDAL SECTOR 2011-2012 2012-2013 2013-2014 2014-2015
Sector Turnover (£’millions) 91 397 103 109
No. of people employed across UK supply chain 570 570 635 660
No. of UK companies across supply chain 33 30 36 40

1. Summary
This report reviews the key developments in 2015/16 impacting the investment landscape for UK renewables. It looks back at renewables deployment across electricity, heat and transport and looks forward to future deployment and the associated investment requirements. Key industry trends are also highlighted, including the emergence of decentralised renewable energy and storage solutions.
The EU Renewable Energy Directive requires 15% of Britain’s final energy consumption to be produced by renewable energy sources by 2020. The Government has proposed to achieve this across the electricity, heat and transport sectors by ensuring that at least 30% of electricity, 12% of heat and 10% of transport demand are met by renewable sources.1 In 2015, renewable electricity generation (TWh) has increased to 24.7%, up from 19.1% in 2014, progressing strongly towards the target of 30%.2 However, attaining the heat and transport targets by 2020 remains challenging.
The last year has been a turbulent one for the UK renewables industry. The new Conservative Government explicitly stated that affordability and security of supply were their priorities in managing the energy policy “trilemma”. The new Government reviewed decarbonisation policy costs and decided to make significant cuts, starting with the early closure of the RO to some technologies, like onshore wind, and the postponement of the Autumn 2015 Contracts for Difference (CfD) auction. The Autumn “Reset” speech by the Secretary of State on renewable subsidies confirmed the Government’s thinking on energy policy. However,
later in the year, the global agreement forged at COP21 in Paris maintained strong international commitments to decarbonisation and renewables around the globe.
While significant cuts were made to future UK subsidies, in most cases existing subsidies were left unchanged (although some of the tax changes made, like the removal of Levy Exemption Certificates for renewable energy, did affect existing investments). A key feature of the year was an acceleration of existing developments to access the remaining subsidy schemes, but also the cancellation of projects that were not able to install in time.
The investment landscape is in transition, but with attractive opportunities emerging that do not necessarily rely on subsidy incentives. Major cost reductions in technologies such as solar and storage, allied with new business models to exploit the benefits they can provide to energy and balancing markets, offer promising investment prospects for the future both in the UK and internationally.
These new opportunities sit alongside a significant pipeline of investments that remains in place under the electricity Contracts for Difference (CfD) subsidy regime, especially for offshore wind. A further CfD auction is planned in 2016.
2. What’s happened to investment over the last year
Incentive cuts
The Conservative Government has placed a greater focus on controlling overall spending and security of supply than the former Coalition Government. One of the first things that the Conservatives did in July 2015 was
to publish the forecast spending on renewables subsidies under the Levy Control Framework (LCF) in the July 2015 ‘Summer’ Budget, highlighting the costs that consumers would be paying. Key contributory factors to these higher than expected numbers was rapid rates of deployment of solar and wind, and increased CfD costs as a result of the falling wholesale electricity prices.
Deep cuts in the Feed-in-Tariff (FIT) for solar were consulted on at the end of August and confirmed later in the year. The Government also announced:
• Confirmation that grandfathering will no longer be available to biomass conversions and co-firing, a measure which DECC estimated could save £500m pa;
• Early closure from 1 April 2016 (rather than April 2017) of the Renewable Obligation (RO) to solar projects of less than 5MW;
• Ending of the grandfathering policy for solar projects <5MW under the RO with immediate effect;
• Temporary abolition of pre-accreditation rules under the Feed-in-Tariff scheme, which means developers will only know the tariff they will get once a project seeks full accreditation;
• The early closure of the RO for onshore wind, but with some grace period provisions.
These announcements led to rapid deployments of existing projects already under development before subsidies were cut, and also the cancellation of projects that would miss these deadlines. A key feature of these developments was
INVESTMENT FEATURE
KPMG
Renewable EnergyInvestments: a year of transition
REview Renewable Energy View 2016 50 www.r-e-a.net

the major expansion of distributed solar energy installations in the south of England, placing significant pressure on distribution network connections and network capacity. The rapid decline of subsidies led to project installers and their supply chains facing a ‘cliff edge’ of deployment with consequent impacts on investment and jobs.
It’s not all doom and gloom
Although it’s been a very turbulent period in terms of policy changes, there is reason to be optimistic about the future.
1) Firstly, there has been limited retrospective action on existing subsidies which is critical for future investment confidence and the delivery of existing investments.
2) Secondly, the COP21 Paris conference at the end of 2015 confirmed the global direction of travel remains towards decarbonisation. This was the first time such an international agreement was struck, including commitments from China and the United States. However, the agreement also has weaknesses, particularly around how the agreement on keeping global warming to ‘less than’ 2 degrees C will be enforced.
3) Major new international markets are emerging. For example, the Indian Government has set out a plan to deliver 100GW of solar deployment by 20203, whilst the Chinese are targeting 100GW of Solar, 200GW of Wind and 350GW of hydropower by 20204. In the US, Presidential candidate Hillary Clinton, has set out the Clean Power Plan, a Decentralised Energy strategy that will
deliver 140GW of Solar by 20205. This international rapid deployment/ scaling will continue to drive down costs, which will directly benefit UK based investments as fewer subsidies will be required to break even.
Budget 2016: Some good news for offshore wind developers
In March 2016, the Government announced a budget of £290m for the CfD auction due to take place later this year. This could enable up to two large offshore wind farms to secure contracts. Further, the Government set out that, in total, £730m of new subsidy, enabling up to 4GW of offshore wind to be deployed, would be made available during this Parliament6.
The Government also announced the trajectory for the ‘strike price’ caps, which set the cost reduction profile expected for offshore wind. The cap will be £105/MWh (in 2011-12 prices) for delivery in 2021/22 to £85/MWh for delivery in 2025/26. At £85/MWh, the Government is expecting offshore wind to be below the strike price agreed for the new nuclear power station, Hinkley Point C. Despite this steep price reduction trajectory, a highly competitive second auction is expected with a number of projects bidding for the available budget.
3. Renewable Investment and Deployment forecasts
In 2020, the UK is required to have 15% of its energy from renewable sources. Although the UK has (to date) met its interim targets, current projections suggest that we will fall well short of the 15% overall renewable energy target by
2020.
The Government has proposed to achieve 15% renewable energy from across the electricity, heat and transport sectors by planning for at least 30% of electricity, 12% of heat and 10% of transport demand to be met by renewable sources.7 The UK is broadly on track to meet 30% renewables from electricity, but will need much more investment to meet 10% in transport and 12% in heat by 2020.
This section reviews the progress made by 2015 to meet the individual renewable deployment targets for electricity, heat, and transport, and looks forward to 2020.
4. Electricity
On track to meet renewable electricity targets
The chart in Figure 1 sets out DECC’s analysis of renewable electricity generation in GWh achieved to end of 2015. It shows that the UK is well on the way to achieving 30% of its electricity generation coming from renewable sources by 2020.
In 2015, 35% of renewables generation was from bioenergy, 28% from onshore wind, 21% from offshore wind, 7.6% from hydro and solar PV accounted for 9.1%.9
A more detailed breakdown is shown in the Figure 2 chart, which sets out the projected deployments by technology as forecast by DECC between 2016 and 2020.
The UK has made great strides in increasing its penetration of renewable electricity. Ten years ago, we barely had 5% of our electricity coming from renewable sources but in 2015, the calendar average was 25%.11 Figure 2 exemplifies a pipeline which should take the market share to 30% or more, and achieving the target for electricity.
This is in line with the aims of the original Renewable Energy Strategy published in 2008. The future pipeline comes mainly from RO projects and offshore wind deployment under the CfD.
REview Renewable Energy View 2016 51www.r-e-a.net
Figure 1 - Renewable share of electricity generation8

INVESTMENT FEATURE
REview Renewable Energy View 2016 52 www.r-e-a.net
But LCF costs are higher than expected
The latest OBR forecasts show spending on low carbon generation under the Levy Control Framework at around £8.8bn (2011-12 prices) in 2020/21.12
This represents a reduction from £9.1bn forecast by the OBR last July. This reflects the cuts in subsidies announced since the July Budget, including for onshore wind, solar, and biomass, to bring spending back towards the LCF limit. The Government also cancelled
the CCS competition, which (according to Budget 2016) had £500m (nominal) allocated to it under the LCF. However, despite these cuts, this new forecast is still higher than the LCF limit for 2020/21 set under the Coalition Government of £7.6bn (2011-12 prices).
Whilst Government has set out the allocation under this Parliament for CfD auction ‘Pot 2’ of £730m, it has not said whether there will be any allocation for the established technologies in ‘Pot 1’. Nor is it yet clear what the overall LCF limits in the period 2021-2025 will be.
Growth in renewable generation is set to continue
In the future, the UK’s electricity generation capacity mix will change significantly, as renewables replace ageing coal and gas power stations. The following figure 4 sets out DECC’s November 2015 forecast for new capacity investments between 2015 and 2035, showing significant increases in renewables but also interconnectors, natural gas and nuclear installations. Appropriate market mechanisms, that provide the necessary incentives for investment, will be critical to ensure future security of supply and affordability, as well as meeting future decarbonisation targets.
By 2035, the mix of fuels used for electricity generation is expected to be very different from today. The charts in Figures 4 and 5 show DECC’s forecast as of November 2015, highlighting the decline of coal and continued growth in renewable capacity. Again, if this is to be realised, the appropriate market mechanisms will need to be in place to allow renewable capacity to compete effectively against coal and gas plant with sunk costs and the ability to gain revenues from other services such as system reserve and dynamic response services.
Figure 210 – Renewable electricity generation – achieved to 2014 and projected by DECC to 2020
Figure 313 – Levy Control Expenditure forecast and impact on Energy Bills
£2.68
£4.54 £5.30
£6.37
£7.47 £8.19
£8.80 £9.02 £9.17 £9.32 £9.46
£10.81
£-
£2.00
£4.00
£6.00
£8.00
£10.00
£12.00
£0.00
£2.00
£4.00
£6.00
£8.00
£10.00
£12.00
2014/15 2015/16 2016/17 2017/18 2018/19 2019/20 2020/21 2021/22 2022/23 2023/24 2024/25 2025/26
LCF
(£00
0m)
Possible Levy Control Framework future trajectory
Small Scale FiTs Assumed Renewables Obligation AssumedContracts for Dif ference Assumed Swansea Bay tidal lagoonHinkley Point C KPMG assumed LCF
0
20,000
40,000
60,000
80,000
100,000
120,000
2005 2006 2007 2008 2009 2010 2011 2012 2013 2014 2015 2016 2017 2018 2019 2020
GEN
ERAT
ION
(GW
h)
RENEWABLE ELECTRICITY GENERATION - ACHIEVED TO 2015 AND PROJECTED BY DECC TO 2020
Geothermal
Energy from Waste
Biomass
Anaerobic Digestion
Marine
Hydropower
Solar PV
Offshore wind
Onshore Wind
Achieved to date
Projected by DECC2016 - 2020 (UEP)

0
10
20
30
40
50
60
70
80
90
100
2015 2016 2017 2018 2019 2020 2021 2022 2023 2024 2025 2026 2027 2028 2029 2030 2031 2032 2033 2034 2035
Coal Coal and natural gas CCS Oil Natural gas Nuclear Other Thermal Renewables Interconnectors Storage
GW
5. Heat
Less progress than electricity, but subsidies and opportunities in place.The positive story of deployment of renewable electricity is contrasted by heat. Whilst we have seen growth in renewable heat (see figure 6), it is only a very small part of the heat sector,
which is still dominated by natural gas. The European Commission has highlighted that the UK is well behind on the deployment of renewable heat and renewable transport fuels and therefore likely to miss the current target of having 15% of total energy coming from renewable sources by 2020.
The chart overleaf shows progress in renewable heat deployment in terms of GWh per annum. Renewable heat deployment had reached 4.9%16 of total heat demand in 2014, a 0.7% increase on 2013, running below the likely profile needed to reach a 12% target for 2020.
REview Renewable Energy View 2016 53www.r-e-a.net
Figure 414 - DECC projections for new electricity capacity
0
10
20
30
40
50
60
2015 2016 2017 2018 2019 2020 2021 2022 2023 2024 2025 2026 2027 2028 2029 2030 2031 2032 2033 2034 2035
GW
Coal Coal and natural gas CCS Oil
Natural gas Nuclear Other Thermal
Renewables Interconnectors Storage
Figure 515 - Capacity by fuel: all power producers (DECC):

INVESTMENT FEATURE
REview Renewable Energy View 2016 54 www.r-e-a.net
Figure 617 - Renewable Heat Production to 2014 and projection to 2016
Renewable Heat Incentive (RHI)
In November 2015, the UK Government committed to supporting the transition to low carbon heating in the UK, by announcing its intention for spending on the Renewable Heat Incentive schemes to rise from £430 million in 2015/16 to £1.15 billion in 2020/21. RHI reforms
The RHI reforms / consultation suggested the phase out of subsidies for bioenergy, solar thermal and deployment caps, making the 2020 targets even more unlikely. However, the establishment of heat networks could be a key driver of new heat generating installations.
While renewable heat has made less progress towards targets than electricity, subsidy incentives under the RHI scheme have been used to encourage this sector of the renewables industry, primarily through deployment of biomass installations. However, DECC is consulting on proposals for significant reductions in financial incentives provided through the RHI scheme, leading to major falls in both domestic and non-domestic biomass boiler deployment.
6. Transport
Biofuels
The amount of biofuels in the transportation system is increasing very slowly and it is still a low percentage (around 3% in 2014)18 of the total transportation mix – 96% of the mix is still petroleum products. Achievement of a 10% target for 2020 appears very challenging. The following chart sets out the profile of UK biofuels consumption over recent years, highlighting slow growth in this sector.
The strategy to reach 10% by 2020 has not been set out in the Renewable Transport Fuels Obligation, so there is a lack of clarity on the future policy framework for biofuels.
Electric vehicles (EVs)
Electric vehicles (and other non-petroleum based technologies) have the potential to make a significant contribution to decarbonisation. To date, deployment of EVs in GB has been highly dependent on the availability of support packages. Last year saw an increase in the number of electric vehicles, but from an extremely low base.
Since the launch of the Plug-In Car Grant in January 2011, there have been 58,186 (March 2016) eligible cars registered, with rapid increases more recently e.g. 17% growth just from January to March 2016.20
0
200
400
600
800
1000
1200
1400
2002 2003 2004 2005 2006 2007 2008 2009 2010 2011 2012 2013 2014
ktoe
0
5,000
10,000
15,000
20,000
25,000
30,000
35,000
40,000
45,000
2005 2006 2007 2008 2009 2010 2011 2012 2013 2014 2015 2016
Renewable heat production to 2014 and projection to 2016if recent growth trend continues
Recent growth trend continued
Geothermal
Heat pumps
Solar Thermal
Anaerobic Digestion
Landfill and sewage gas
Biodegradable EfW
Animal Biomass
Plant Biomass
Wood combustion - industrial
Wood combustion - domestic
Figure 719 : UK Biofuels Consumption (Bioethanol and Biodiesel)

Number plate changes in March and September always increase car sales/ registrations in the UK and this was no different in March 2015 for new ultra-low emissions vehicles, which was over 400% higher than the previous March. This rapid growth is likely to continue, with spikes in March and September. Mitsubishi Motors (UK) stated that its Outlander PHEV accounted for 55% of these plug-in car sales in March 2015.23
Three key technological constraints for the uptake of Electric Vehicles (EVs) are the lack of supporting infrastructure such as charging points, the limited range of most vehicles, and the cost of EV batteries relative to fuel prices. Innovation and development is taking place to address these issues including, for example, the introduction of rapid charging facilities and high performance batteries.
7. Investment performance
Major investment achieved in 2015
Investment in renewable electricity has meant the UK has been one of the most attractive countries in the world for green investment growth in recent years, with over £37bn invested between 2010 and 2015.24
Although it’s been a very turbulent year in terms of policy changes which has impacted upon investment attractiveness more recently, there is reason to be optimistic about the future. There has been limited retrospective action on existing subsidies which is critical for future investment confidence and the delivery of existing investments. Additionally, rapid international deployment/ scaling will continue to drive down costs, which will directly benefit UK based investments as fewer subsidies will be required to break even.
The figure opposite illustrates the major growth in UK wind and solar investment over recent years.
Recently there has been a strong expansion of investment in UK clean energy, growing 24% between 2014 and 2015. At the end of 2015, this investment
has now created a renewable energy capacity of 30 GW, a 22% increase on a year earlier.
Wind received by far the most investment in 2015, helping to increase generation from offshore wind by 30% over the year.26 The UK has 5.5GW offshore wind installed or under construction, and is on track to deliver over 10GW by 2020. This represents the largest expansion in any class of renewable energy technology in the UK.27 Solar investment fell from 2014, but it may continue to attract capital as it becomes attractive without subsidy.
Although there are significant opportunities, we believe we are unlikely to see renewable investment quite as high as the 2015 peak in the coming years, unless additional policy support becomes available. However, there is an abundance of capital chasing stable returns and this has bolstered the UK
from really feeling the brunt of the regulatory uncertainty initiated.
The recently published National Infrastructure Plan indicates an expected renewable investment pipeline of nearly £20 billion between 2016 and 2020, predominantly in wind generation. The National Infrastructure Plan captures the larger expected investments and this will be supplemented by investment in renewable heat and storage in particular.28
Appetite for investment in renewables still appears strong but investors will seek stable returns in a well-defined and settled policy framework. Regulatory uncertainty will reduce investor confidence and increase costs and reduce availability of investment capital.
REview Renewable Energy View 2016 55www.r-e-a.net
Figure 925 – Renewable energy investment to 2020
Figure 821 – UK Registrations of new ultra-low emissions vehicles22

INVESTMENT FEATURE
REview Renewable Energy View 2016 56 www.r-e-a.net
8. Emerging trends
Many energy companies see renewable and decentralised energy as their future
While this year has been turbulent as Government policy towards renewable subsidies has changed and with forecast low power prices, a number of key trends are emerging which offer promise for the renewables industry in future years. Rapid declines in the costs of solar and storage technologies may offer the opportunity for these technologies to participate in energy markets without subsidy in a few years, allied with the emergence of new business models using decentralised energy solutions.
Decentralised energy solutions involve local energy production which is situated close to the source of demand and integrated with some, or all, of local storage, demand response, heating, energy efficiency and energy management systems to optimise local energy use and costs. In particular, the rapidly falling costs of solar and emerging storage technologies with steep cost reduction potential are beginning to make this an economic proposition for consumers, businesses and communities, particularly if they are also able to access additional revenues from energy markets and system balancing services.
This year, many of the big energy companies have announced new strategies that focus on decentralised and renewable energy. For example, E.ON and RWE have restructured and refocused their businesses, and Centrica announced a new strategy in the UK, where they are seeking to build their energy services and decentralised energy on the back of their British Gas brand.
Solar developers are responding to the challenge of removal of subsidies by looking at alternative business models. Demand side response (DSR) providers are looking to develop new demand side products to respond to the capacity mechanisms and balancing reserve. Aggregators are growing their role in the
market across a range of services such as capacity aggregating for the Capacity Market.
A “battle behind the meter” is beginning to commence between many different players in the market - from the big utilities to smaller companies and new entrants. These new energy services could include solar, heat pumps, storage, electric hot water, linking smart meters with appliances. New business models are being created and it is clear that the sector thinks that this is a key opportunity to focus on in the future. KPMG has completed two leading reports in this area for the REA. These are summarised below:
UK Solar Beyond Subsidy - The Transition29
The key conclusions of the report were as follows:
• PV is becoming the most competitive new build renewable technology with levelised costs projected to fall by a further 35% out to 2020;
• PV will become the first renewable technology to achieve ‘grid parity’. Figure 10 shows the profile to grid parity for domestic customers as solar costs fall;
• A transition plan for phasing out subsidies is required to avoid a ‘cliff edge’ in deployment with resulting losses of jobs and industry consolidation;
• The role of PV will be maximised if
it operates in synergy with other innovative technologies such as energy storage and electric vehicles.
Development of decentralised energy and storage systems in the UK31
The key conclusions of the report were as follows:
• The cost of decentralised energy technologies is falling rapidly. The greatest cost reduction has been experienced by solar, and some forms of energy storage are expected to follow a similar cost reduction path.
• When solar photovoltaic (PV), storage and energy demand management are combined into decentralised energy systems, they offer the potential for greater benefits to be realised. Decentralised energy solutions are likely to have an increasingly important role to play in the national energy landscape, especially if they become more commercially attractive to consumers and businesses than their current energy services.
• The continued growth of decentralised energy solutions may potentially transform the GB energy industry from a national energy market administered by government, regulator and utilities, to where this encompasses a new market where local integrated energy solutions are determined by consumers, businesses and communities.
Figure 1030 – Domestic PV LCOE versus electricity tariff comparators
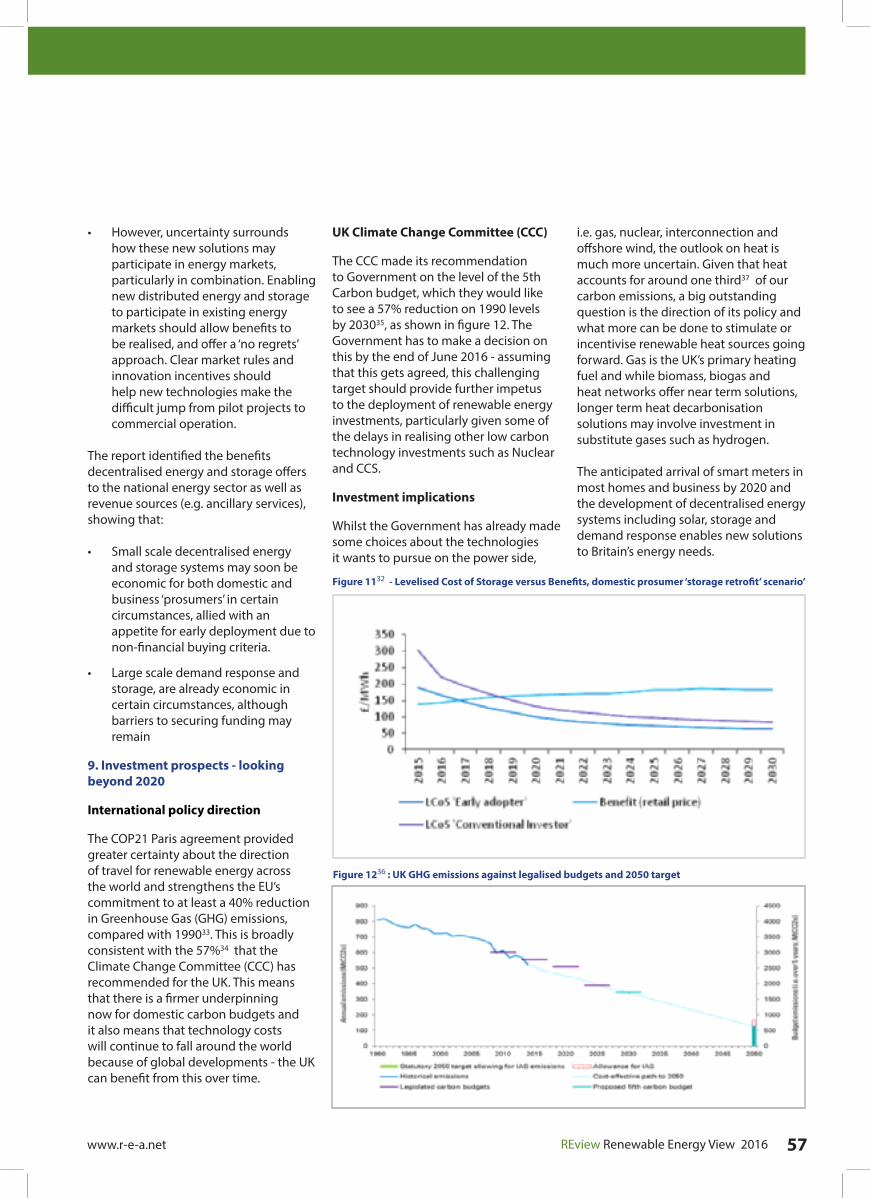
REview Renewable Energy View 2016 57www.r-e-a.net
• However, uncertainty surrounds how these new solutions may participate in energy markets, particularly in combination. Enabling new distributed energy and storage to participate in existing energy markets should allow benefits to be realised, and offer a ‘no regrets’ approach. Clear market rules and innovation incentives should help new technologies make the difficult jump from pilot projects to commercial operation.
The report identified the benefits decentralised energy and storage offers to the national energy sector as well as revenue sources (e.g. ancillary services), showing that:
• Small scale decentralised energy and storage systems may soon be economic for both domestic and business ‘prosumers’ in certain circumstances, allied with an appetite for early deployment due to non-financial buying criteria.
• Large scale demand response and storage, are already economic in certain circumstances, although barriers to securing funding may remain
9. Investment prospects - looking beyond 2020
International policy direction
The COP21 Paris agreement provided greater certainty about the direction of travel for renewable energy across the world and strengthens the EU’s commitment to at least a 40% reduction in Greenhouse Gas (GHG) emissions, compared with 199033. This is broadly consistent with the 57%34 that the Climate Change Committee (CCC) has recommended for the UK. This means that there is a firmer underpinning now for domestic carbon budgets and it also means that technology costs will continue to fall around the world because of global developments - the UK can benefit from this over time.
UK Climate Change Committee (CCC)
The CCC made its recommendation to Government on the level of the 5th Carbon budget, which they would like to see a 57% reduction on 1990 levels by 203035, as shown in figure 12. The Government has to make a decision on this by the end of June 2016 - assuming that this gets agreed, this challenging target should provide further impetus to the deployment of renewable energy investments, particularly given some of the delays in realising other low carbon technology investments such as Nuclear and CCS.
Investment implications
Whilst the Government has already made some choices about the technologies it wants to pursue on the power side,
i.e. gas, nuclear, interconnection and offshore wind, the outlook on heat is much more uncertain. Given that heat accounts for around one third37 of our carbon emissions, a big outstanding question is the direction of its policy and what more can be done to stimulate or incentivise renewable heat sources going forward. Gas is the UK’s primary heating fuel and while biomass, biogas and heat networks offer near term solutions, longer term heat decarbonisation solutions may involve investment in substitute gases such as hydrogen.
The anticipated arrival of smart meters in most homes and business by 2020 and the development of decentralised energy systems including solar, storage and demand response enables new solutions to Britain’s energy needs.
Figure 1132 - Levelised Cost of Storage versus Benefits, domestic prosumer ‘storage retrofit’ scenario’
Figure 1236 : UK GHG emissions against legalised budgets and 2050 target

REview Renewable Energy View 2016 58 www.r-e-a.net
This includes managing demand more effectively, growing the demand side of Britain’s energy system and making the system and consumers more proactive in using local renewable energy resources. Investment opportunities are expected to emerge in these decentralised energy solutions.
On transport, decarbonisation is expected to increase through a switch to alternative technologies such as electric and hydrogen fuel cell vehicles. Vehicle manufacturers are actively developing these technologies and manufacturers are seeking to develop more affordable electric cars. For example, the Tesla Model 3 promises to cost £24,423 – its lowest cost vehicle to date. Chief Executive Elon Musk said his goal was to produce about 500,000 vehicles, once production is at full speed.38 That trend will continue as new products become more affordable and competitive with
fossil-fuel based cars.
It appears unlikely that the UK will reach its obligations for 2020 of 15% of final energy consumption to be produced by renewable energy sources, unless there are rapid new technology or policy developments. Policy, investment and innovation initiatives must also look well beyond 2020 to hit future targets. The use of a market based structure demands that innovation should be rewarded through market based incentives.
The UK renewable investment landscape is in transition, with a significant pipeline of CfD-backed investments accompanied by the emergence of some exciting new energy solutions, such as storage and decentralised energy that require investment to drive scale and deployment in the UK’s energy markets. In the longer term, these new business models offer the potential for customers
and businesses to participate in future energy solutions that increasingly integrate electricity, heat, and transport as well.
Overall, many billions of ongoing investment is still needed in the renewable sector if future targets are going to be met. Major continuing investment in electricity decarbonisation will be required, alongside major investment in renewable heat and renewable transport technologies. A clear policy and regulatory framework will be needed to attract this investment.
1 UK Parliament - http://tinyurl.com/2020-UK-Parliament 2 DECC - https://www.gov.uk/government/uploads/system/uploads/attachment_data/file/511939/Renewables.pdf3 Indian Government - http://www.pvtech.org/news/india_government_reveals_progress_to_100gw_solar_modi_focuses_on_solar_park4 Chinese Government - http://pv.energytrend.com/news/20141014-7578.html5 Hillary Clinton - http://www.theguardian.com/environment/2015/jul/28/is-hillary-clintons-ambitious-solar-energy-goal-for-the-us-workable6 KPMG Budget report - https://assets.kpmg.com/content/dam/kpmg/pdf/2016/03/budget-2016-power-utilities-commentary.pdf7 UK Parliament - http://tinyurl.com/2020-UK-Parliament8 KPMG analysis – Source DECC9 Gov.uk - https://www.gov.uk/government/uploads/system/uploads/attachment_data/file/511939/Renewables.pdf 10 REA analysis, DECC11 DECC12 https://assets.kpmg.com/content/dam/kpmg/pdf/2016/03/budget-2016-power-utilities-commentary.pdf 13 KPMG analysis14 DECC15 DECC16 REA – http://www.r-e-a.net/news/committed-to-heat-renewables-industry-supports-sos-on-heat-strategy 17 REA analysis, ? source18 DECC – Bioethanol and Biodiesel together – ktoe - (458+785)/39, 961). 3.9% regularly quoted includes non-transport fuels e.g. cooking oils19 DECC- Department of Energy and Climate Change - Digest of UK Energy Statistics Annex20 Society of Motor Manufacturers21 DfT (2015), https://www.gov.uk/government/publications/number-of-newly-registered-ultra-low-emissions-vehicles 22 Ultra Low Emission Vehicles (ULEVs) are vehicles with fully electric powertrains and cars and vans with tail pipe emissions below 75 g/km. The ULEV figures are for Great Britain in 2010 and for the United Kingdom from January 2011 onwards.23 Mitsubishi: https://www.google.co.uk/url?sa=t&rct=j&q=&esrc=s&source=web&cd=4&cad=rja&uact=8&ved=0ahUKEwjKnNTP_o3MAhWCyRoKHdmNC4EQFgguM AM&url=http%3A%2F%2Fwww.mitsubishi-media.co.uk%2Fdoc%2F1358%2FFULLY-CHARGED-CELEBRATIONS-AS-MITSUBISHI-MOTORS--UK--REVEAL-STRONGEST-MARCH-SALES- PERFORMANCE-EVER.doc&usg=AFQjCNFqNsZ10uk9waestVtrjTqrVS7pBg&sig2=4WTauS4dWmG_zBdJgedksg 24 https://www.gov.uk/government/uploads/system/uploads/attachment_data/file/419024/DECC_LowCarbonEnergyReport.pdf )25 Source: Bloomberg New Energy Finance (BNEF,2016) annual clean energy investment report. 26 Gov.uk - https://www.gov.uk/government/uploads/system/uploads/attachment_data/file/511939/Renewables.pdf 27 UK Trade and Investment - http://www.renewableuk.com/download.cfm/docid/0FA64066-4BD3-49BB-BD65A6B628AE23FF 28 https://www.gov.uk/government/publications/national-infrastructure-pipeline-201629 http://tinyurl.com/UK-solar-beyond-subsidy 30 KPMG/ REA analysis31 http://tinyurl.com/KPMG-decentralised-report32 KPMG/ REA analysis33 EC - http://ec.europa.eu/clima/citizens/eu/index_en.htm 34 The CCC - https://www.theccc.org.uk/2015/11/26/next-step-towards-low-carbon-economy-requires-57-emissions-reduction-by-2030/ 35 The CCC - https://www.theccc.org.uk/2015/11/26/next-step-towards-low-carbon-economy-requires-57-emissions-reduction-by-2030/36 UK Climate Change Committee (CCC)37 https://www.gov.uk/government/uploads/system/uploads/attachment_data/file/505972/The_Renewable_Heat_Incentive_-_A_reformed_and_refocussed_scheme.pdf38 BBC http://www.bbc.co.uk/news/technology-35940302

The APPGs on Biomass and Energy Storage have proven to be effective and influential new forums for the REA to discuss cutting edge ideas, technologies, and policies with industry, civil servants, and parliamentarians.
These ‘bite-sized’ events held on the Parliamentary Estate typically last one to two hours and feature a panel of industry and civil society experts. Following short presentations from the panel, the event opens to questions from the floor - anyone in attendance can ask a question and speak about the topic at hand.
These two APPGs are parliamentary bodies open to MPs and Peers from all parties, and are chaired by an MP. Their secretariats however, are provided by the REA, which organises the behind-the-scenes work of arranging speakers, inviting guests and booking rooms.
All Party Parliamentary Group (APPG) on Biomass
The APPG on Biomass has taken off in the past year as the group has met to discuss issues both in the biomass heat and power industries.
The group has welcomed speakers such as Bob Malmsheimer, a leading forestry academic from the State University of New York, Matthew Rivers, Director of Group Sustainability and Chairman, Drax Biomass Inc., and George Day, Head of Economic Strategy at the Energy Technologies institute.
2015/16 has been a critical year for biomass heat and power, with the governments in Westminster and Brussels taking a number of key decisions on issues such as; sustainability, state
aid, the Renewable Heat Incentive, and future auctions under the CfD mechanism.
All Party Parliamentary Group (APPG) on Energy Storage
Be it driven by excitement from the idea of producing and storing one’s own electricity, concern about the variability of some existing renewables, or the opportunity to create a new industry, skills base, and supply chain in the UK, we have experienced huge interest in the brand new APPG on Energy Storage.
The role of the APPG is to provide a link for industry to Parliament, which is capturing the imagination of politicians, industry, and the public alike. As anticipation mounts and expectations rise there needs to be a calm and credible body that discusses the potential of storage of all forms (such as pumped hydro, compressed air, battery, & heat), highlighting the opportunities, but also associated issues and barriers to growth. So far the group has convened to discuss the global industry, grid-scale storage, and behind-the-meter storage.
This group flourished in 2015/16 under the guidance of the Chair Peter Aldous MP (Con). We have had to turn people away from events as interest has been so strong, and the constructive work of companies such as Good Energy, AES UK & Ireland, and DNV GL Energy has been highlighted to an array of decision makers. Our events line-up in 2016 is brimming with fresh ideas and collaborations.
For further details, or if interested in sponsoring an event, email [email protected] or [email protected].
APPGs bring together Parliamentarians, businesses, NGOs and industry experts The REA’s New Frontier: A snapshot of All Party Parliamentary Group (APPG) activities
REA FOCUS FEATURE
Campaigns & Communications
www.r-e-a.net REview Renewable Energy View 2016 59

RENEWABLE ENERGY VIEW 2016
REview Renewable Energy View 2016 60 www.r-e-a.net
The change in employment numbers has settled down to a slightly lower growth than that seen in market values. Companies were more confident in the general economy and recruitment was conducted at a more normal rate seen when there is consistent steady growth in the overall economy.
It is a trait of the renewable energy sector that in times of recession or low growth in the overall economy that employment growth is normally well below that of market value growth, but when the economy is performing well and confidence is therefore naturally higher, that employment growth is more in line with that of market value.
When there is a potential change in the Government and therefore potential change in policy, employment growth tends to slow to below market value growth. With general elections being set at specific intervals, companies in the sector have advanced warning of potential changes in the higher level political scene, and would appear to be showing a degree of caution as to employing people until they are certain of the support landscape for the next 5 years. This caution has proven to be sensible as yet again the UK Government has changed its focus and sub sectors such as solar PV and onshore wind energy have seen far reaching changes which have negatively impacted on them. The renewable energy sector is heavily impacted by Government policy and changes can see investment increase or decrease rapidly with subsequent changes in confidence for the industry and financiers.
Headline changes:• The highest levels of employment growth are seen in the onshore and offshore wind energy
sub sectors. • Solar PV saw an increase of 4.8% as the sub sector adjusted to focusing more on the larger
scale deployments of solar farms with a decrease in emphasis on small scale domestic installations.
• Biomass boilers saw an increase in growth of employment of 5.0%.• The overall increase in employment across the sector was 4,760 people.
There were 116,788 employed in the sector in 2014/15.
Employment numbers include direct and indirect employees.
The overall number of companies in the sector has decreased slightly driven by the decrease in small installation companies in the solar PV sub sector.
Every other sub sector saw a modest increase in the number of companies though not on the scale of the previous year. The impending general election appears to have made the sector more cautious.
There were 6,786 companies in the sector in 2014/15.
The overall market value has increased by £982 million which is an increase of 6.6% and slightly higher than the 6.1% seen from 2012/13 to 2013/14 - but in general economy terms this is still a strong growth compared to the rest of the UK economy which was about 2.5%
The wind energy, biomass boiler, biomass dedicated power, solar PV and solar thermal sectors have all seen growth above 30% over the past four years. It is highly likely this was largely led by the wish to deploy projects prior to key policy changes in support mechanisms, initially such as FiTs and ROCs and more recently RHI and CfDs.
Total sector market value 2014/15, £15,913 million.
Taking a look at 2014/15 Numbers:Employment, Companies and Turnover
Employment
Companies
Turnover
Data amd comment by Innovas
Innovas

www.r-e-a.net REview Renewable Energy View 2016 61

Green shoots
The issue of food waste, be it produced in processing facilities, in supermarkets, in restaurants, or in the home, has recently been thrust into the national spotlight. The War on Waste campaign championed by celebrity chef, Hugh Fearnley-Whittingstall and others has galvanised public attention with coverage on the BBC, ITV, and Channel 4, and national newspaper coverage in The Guardian, The Daily Mail and The Times.
While the brunt of the national food waste conversation focuses on waste minimisation and what can be saved and used before it goes off, there is also an emerging debate around energy and what happens to the waste if it is sent to landfill or incineration. The REA has long championed the biogas, biomethane, and composting industries. Food waste in the national spotlight has created a new opportunity to support these sectors as the government scales back key policies such as the RHI and FiT.
The REA couldn’t agree more about the necessity to reduce food waste - this needs to be the primary action taken by all. However, even if there was a 30% reduction in food waste, there would still be far too much being disposed of inappropriately. Action across the country has been taken on the issue as it clearly represents an opportunity to be pragmatic about our resources and limit our harmful greenhouse gas emissions
from landfill. Whereas action has taken place in Wales, Scotland, and as of 1st
April, in Northern Ireland (to an extent), Westminster still refuses to mandate local authorities to collect food waste separately and boost the production of green gas and jobs further.
Waning recycling rates
Recent recycling rates data (classed as ‘provisional’ - 12 months to June 2015) show a 0.7% fall in the volume of waste that’s managed by local authorities. The first time the rate has dropped (although it has been static for some time) in the last five years. This fall was in no small part due to the reduction in organics recycled, which has fallen by 5.7%. We are concerned that this is driven by very tight local authority budgets, the decision by some to charge for organics (green waste) disposal, or the decision to not collect it at all. There is also evidence to show that a number of food waste
collection schemes have been scrapped due to the perceived higher cost of collecting this material. All these actions are retrograde both environmentally and economically.
Growing campaign momentum
The REA is acting to reverse this trend. We have and will continue to push Government for a similar approach to be adopted in England as the rest of the UK: the mandatory collection of both domestic and commercial food waste.
If this was to be adopted, the improvement in recycling rates would be substantial whilst also supporting new investment in sector infrastructure and the subsequent job creation. We’ve launched a national campaign, and presently are supported by a number of organisations, including Olleco, APSE Energy, Veolia, and the National Farmers’ Union.
There has also been a decline across the EU, as the recent Circular Economy Consultation response from the European Commission supported separate collection of bio-waste (February 2016). Action to support the industry needs to take place now, and frustratingly the EC’s date of implementation spans a much longer time frame than we require if we are to implement change and reverse the current trends in biowaste collection and treatment.
#FoodWasteCounts
Current UK recycling rates are stalled at 45% with the 50% target for 2020 seeming more distant than ever, so the REA is pushing for mandatory biowaste (including food waste) collection in the UK.
REA FOCUS FEATURE
Campaigns & Communications
www.r-e-a.net REview Renewable Energy View 2016 62
#FoodWasteCounts, the REA campaign for mandatory nationwide separate food waste collections

New food waste economics
As broad support for the policy across the waste, agricultural, and renewable energy sectors became clear over the past year, the REA, sponsored by the national food waste collection company Olleco, commissioned a new report into the economics of food waste collections.
Written and independently researched by Eunomia Consulting, the report launched at a parliamentary reception in May 2016. It contains a clear message to national and local policymakers: in most instances, the collection of food waste separately by local authorities that currently only collect their residual waste weekly, saves money. This is largely due to the fewer residual waste collections that would be needed, and the expensive nature of landfill gate fees compared to that of AD and composting sites.
This is significant news, particularly in relation to Government whose mantra is efficiency and devolution. Minister of State for Environment Food and Rural Affairs, Rory Stewart, has also indicated tentative support for this movement. Responding to questions in mid-March in Parliament Mark Pawsey MP said that “working with councils in Britain to make sure they all move towards separate food waste collections” was “absolutely central.” REA take this as a positive signal.
Forward looking
Emerging research shows that there may be benefits of food waste beyond
the production of energy and organic fertiliser. A 2015 Guardian article, “Turning our mountains of food waste into graphene” outlined emerging uses of food wastes. City University of Hong Kong is developing technology to turn used coffee grounds and stale buns into a solution that can be used to manufacture plastic. The Colorado School of Mines is looking at turning certain wasted food products into glass components. Supporting separate collections now may make it easier for these new resource efficient, waste derived industries to emerge more quickly than in other countries.
Introducing regulation to ensure separate food waste collections, or at
least issuing guidance to local
authorities, would support our energy production and employment rates. Pragmatic, responsible action is within the Government’s reach, and we can make it happen. For more details or to support us, see www.foodwastecounts.co.uk
Follow the REA’s work on twitter at;
@REAssociation or #FoodWasteCounts
www.r-e-a.net REview Renewable Energy View 2016 63
The graph clearly shows that growth in English food waste collections has flattened out whereas the growth in Scotland and Northern Ireland continues to accelerate. The growth in Wales has flattened out because coverage has almost reached 100%.
Graph - Source: (WRAP) 2016

This year the Renewable Energy Consumer Code, usually known by its acronym RECC, is celebrating its first ten years! We’ve all come a long way since we started the Code in one room in the offices of our parent company, Renewable Energy Association (REA), in January 2006. The Code was the brainchild of Philip Wolfe, then running REA. He realised that high consumer protection standards would be essential to the reputation of the growing small-scale renewables sector in the long run.
RECC’s members
The chart to the right shows how RECC’s membership grew dramatically following those early days: in 2006 we had just 30 members. With the introduction of the Feed-In Tariff (FIT)scheme in April 2010, code membership became a condition of MCS installer certification, in turn a condition for FIT eligibility. Our membership rose to a peak of 5,500 in 2012, just before the 50% cut in the FIT rate in March of that year.
Since 2012, membership has gradually decreased in line with the consolidation and fall-out in the solar PV sector, offset to an extent by the introduction of the domestic Renewable Heat Incentive in April 2014.
Right from the start RECC worked closely with Office of Fair Trading, gaining approval under its Consumer Codes Approval Scheme (CCAS) in 2007 and 2011. In 2013 CCAS was passed over to Certified Trading Standards Institute, now our approval body. CCAS sets out a series of core criteria with which all approved consumer codes must comply. The aim is to set the bar high so that approved codes go slightly beyond the law in some respects. As such, CCAS- approved codes offer consumers a genuinely high level of consumer protection.
External experts
As well as our in-house team RECC has a range of external experts who assist us in carrying out our wide range of activities. We have 16 auditors based around the country who carry out audit site visits of our members. We also have 7 dispute resolution case workers who work remotely to supplement our three in-house case workers and we have a pool of 13 independent panel members who we can call upon to make up the independent applications, non-compliance and appeals panels.
RECC’s activities
RECC’s in-house team reflects our priority activities: servicing our members, monitoring and enforcing compliance with the code and resolving consumer disputes with our members.
Monitoring our members
RECC’s monitoring takes the form of:
• carrying out in-depth monitoring of all applicants,
• carrying out audit site visits to assess compliance,
• carrying out desk-based compliance checks,
• carrying out mystery shopping,• monitoring consumer satisfaction
through online and hard copy feedback.
In 2015 RECC considered 950 membership applications. Following comprehensive due diligence checks 179 of these were selected for more in-depth checks. Following these in-depth checks 27 were referred to the independent applications panel and, of these, 16 were rejected on the grounds that the applicants posed a risk to the reputation of the Code.
In 2015 RECC allocated 283 members for audit site visits. Members were selected in line with the agreed procedure taking account of a number of factors. Following screening, RECC auditors carried out 159 audit site visits. Members’ were given the results and a timeframe to respond to any outstanding matters if appropriate. The status of these audit site visits at the end of 2015 is shown in the chart overleaf.
RECC
Ten Years of the Renewable Energy Consumer Code
0
1000
2000
3000
4000
5000
6000
2006 2007 2008 2009 2010 2011 2012 2013 2014 2015 2016 (as of Apr 2016)
RECC membership by year
RENEWABLE ENERGY VIEW 2016
www.r-e-a.net REview Renewable Energy View 2016 64
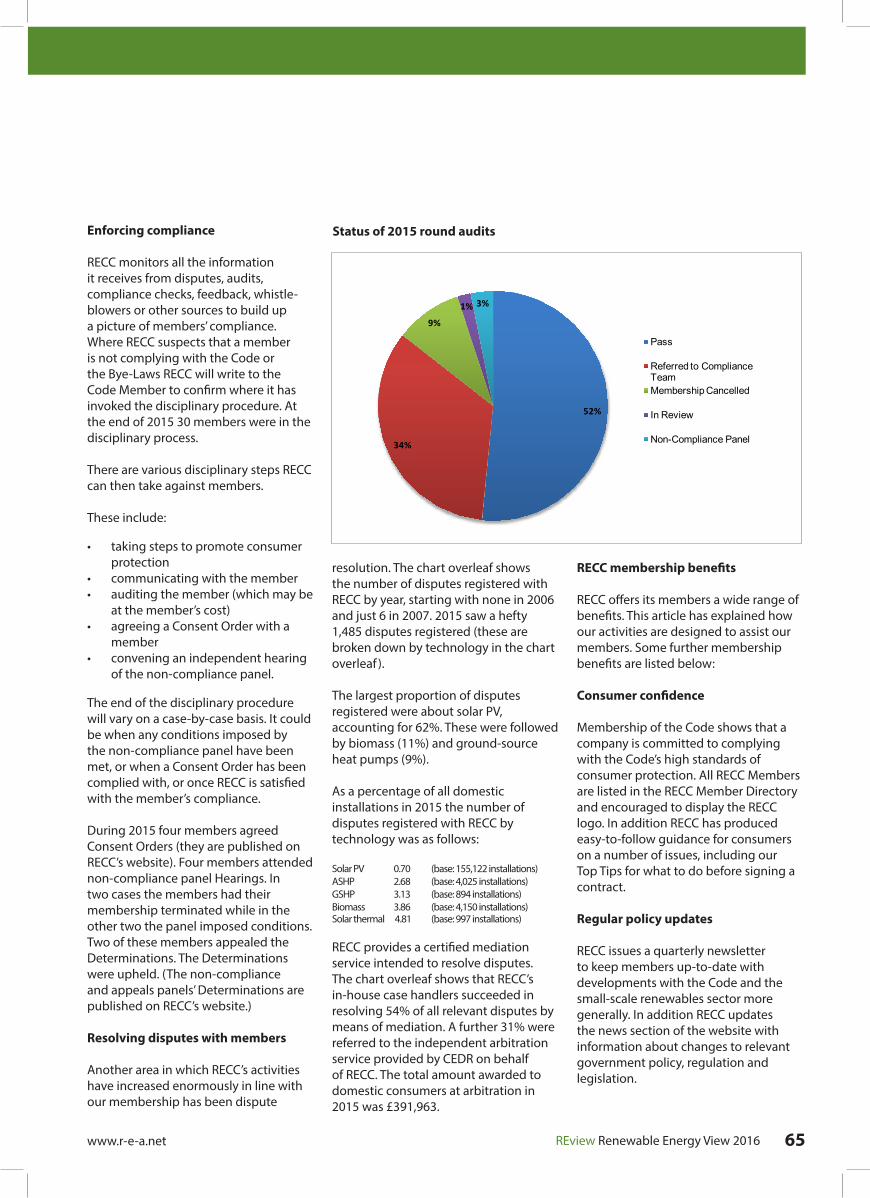
Enforcing compliance
RECC monitors all the information it receives from disputes, audits, compliance checks, feedback, whistle-blowers or other sources to build up a picture of members’ compliance. Where RECC suspects that a member is not complying with the Code or the Bye-Laws RECC will write to the Code Member to confirm where it has invoked the disciplinary procedure. At the end of 2015 30 members were in the disciplinary process.
There are various disciplinary steps RECC can then take against members.
These include:
• taking steps to promote consumer protection
• communicating with the member• auditing the member (which may be
at the member’s cost)• agreeing a Consent Order with a
member• convening an independent hearing
of the non-compliance panel.
The end of the disciplinary procedure will vary on a case-by-case basis. It could be when any conditions imposed by the non-compliance panel have been met, or when a Consent Order has been complied with, or once RECC is satisfied with the member’s compliance.
During 2015 four members agreed Consent Orders (they are published on RECC’s website). Four members attended non-compliance panel Hearings. In two cases the members had their membership terminated while in the other two the panel imposed conditions. Two of these members appealed the Determinations. The Determinations were upheld. (The non-compliance and appeals panels’ Determinations are published on RECC’s website.)
Resolving disputes with members
Another area in which RECC’s activities have increased enormously in line with our membership has been dispute
resolution. The chart overleaf shows the number of disputes registered with RECC by year, starting with none in 2006 and just 6 in 2007. 2015 saw a hefty 1,485 disputes registered (these are broken down by technology in the chart overleaf ). The largest proportion of disputes registered were about solar PV, accounting for 62%. These were followed by biomass (11%) and ground-source heat pumps (9%). As a percentage of all domestic installations in 2015 the number of disputes registered with RECC by technology was as follows:
Solar PV 0.70 (base: 155,122 installations)ASHP 2.68 (base: 4,025 installations)GSHP 3.13 (base: 894 installations)Biomass 3.86 (base: 4,150 installations) Solar thermal 4.81 (base: 997 installations)
RECC provides a certified mediation service intended to resolve disputes. The chart overleaf shows that RECC’s in-house case handlers succeeded in resolving 54% of all relevant disputes by means of mediation. A further 31% were referred to the independent arbitration service provided by CEDR on behalf of RECC. The total amount awarded to domestic consumers at arbitration in 2015 was £391,963.
RECC membership benefits
RECC offers its members a wide range of benefits. This article has explained how our activities are designed to assist our members. Some further membership benefits are listed below:
Consumer confidence
Membership of the Code shows that a company is committed to complying with the Code’s high standards of consumer protection. All RECC Members are listed in the RECC Member Directory and encouraged to display the RECC logo. In addition RECC has produced easy-to-follow guidance for consumers on a number of issues, including our Top Tips for what to do before signing a contract.
Regular policy updates
RECC issues a quarterly newsletter to keep members up-to-date with developments with the Code and the small-scale renewables sector more generally. In addition RECC updates the news section of the website with information about changes to relevant government policy, regulation and legislation.
Status of 2015 round audits
52%
34%
9%
1% 3%
Pass
Referred to Compliance TeamMembership Cancelled
In Review
Non-Compliance Panel
www.r-e-a.net REview Renewable Energy View 2016 65

Chartered Trading Standards Institute member directory
Members of CTSI-approved Codes are listed on a CCAS directory accessible through the websites of: CTSI, Citizens Advice and My Local Services. RECC members are shown under a distinct RECC and CTSI banner.
Model documents
To assist Members RECC has prepared a range of model documents including proposals, performance estimates and
quotations for each different technology, model contract terms, installer warranty and cancellation forms (for companies who do and do not sell in the home). MS Word versions of these documents are available through the members’ area of the website.
Guidance
To assist members further, RECC has developed user-friendly guidance on relevant consumer legislation (such as the Consumer Contracts Regulations 2013, Alternative Dispute Resolution Regulations 2015 and the Consumer
Rights Act 2015). A sample audit questionnaire, to help guide members through a RECC audit, is also available in the members’ area of the website.
Consumer protection trainingTo assist members and their staff RECC has put together a substantial online training resource. This explains with plenty of real-life examples how to comply with the Code and the consumer protection legislation in force. It covers all areas of business, from advertising and marketing through to sales, pre-contractual information, contract terms, guarantees and warranties. The online resource is available in the members’ area of the RECC website.
Webinar training
Our current webinar training series is well underway and we have received great feedback from members. Topics have centred on the customer journey from marketing and sales, performance estimates, fair and unfair contract terms through to after sales care. Other sessions have focussed around new legislation which has directly impacted members (such as the Consumer Contracts Regulations 2013 and the Consumer Rights Act 2015), as well as the recent FIT reforms. We have one planned on battery storage and solar PV. Recorded versions are available in the members’ area of the website.
6 21 43 76
607
12241301
1186
1485
0
200
400
600
800
1000
1200
1400
1600
2007 2008 2009 2010 2011 2012 2013 2014 2015
Num
ber o
f dis
pute
s
Year
Disputes registered with RECC by year
15%
54%
31% Between the company and the consumer
RECC Mediation
Arbitration
Disputes by resolution 2015
8%
11%
2% 0%3%
62%
3%2% 9%
Air Source Heat Pump
Biomass
Ground Source Heat Pump
Micro CHP
Other (non-MCS technologies)
Solar PV
Solar thermal
Wind turbine
Unknown
Disputes by technology 2015
RENEWABLE ENERGY VIEW 2016
www.r-e-a.net REview Renewable Energy View 2016 66

Which? Trusted Trader discount
RECC has teamed up with Which? Trusted Trader to bring RECC members an exclusive offer of 25% off the Which? Trusted Trader scheme subscription until 2020. Which? is known for testing a broad range of products, and they assess traders too. You can find full details and terms in the members’ area of the RECC website.
Further information
You can find much more information about RECC and the services we offer our members on our website: www.recc.org.uk.
You can also contact us directly at: [email protected].
RECC launched its consumer video last year. It gives helpful tips for consumers thinking of purchasing a small-scale renewable energy system. Access the video from www.recc.org.uk/consumers
Top tips for consumers
RECC’s team
RECC has a dedicated in-house team of 12 who work from our offices in central London to, provide advice and assistance for members and consumers, ensure our members comply with the Code and Bye-Laws, and to resolve consumer disputes against members.
Virginia Graham - Chief ExecutiveMark Cutler - Head of Operations ComplianceSam Bourn - Monitoring ManagerLorraine Haskell - Panels ManagerRebecca Robbins - Compliance ManagerAndreea Miu - Compliance Analyst
MembershipAida Razgunaite - Membership ManagerGeorgia Phetmanh - Membership Administrator
Dispute ResolutionSarah Rubinson - Dispute Resolution ManagerAbena Simpey - Dispute Resolution Case WorkerBoris Eremin - Dispute Resolution Case WorkerCaroline Thomson - Dispute Resolution Case Worker
www.r-e-a.net REview Renewable Energy View 2016 67

METHODOLOGY - INNOVAS (JOBS DATA)Standard Industrialisation Codes (SIC) are used to classify businesses according to the type of their economic activity. New sectors such as renewables are not currently covered by the SIC categorisation in detail and this has led to a lack of robust data on jobs associated with the sector. Headline data on the low carbon sector has been produced by Innovas for Government, however a detailed breakdown of the renewables sector by technology or geographical area has not been published until now.
The REA produces an annual update of this analysis and data, although ideally ONS would be providing this information. We would welcome any feedback and comments on the data in this report. Please email any feedback to; [email protected]
Definition of sectorThe research undertaken by Innovas is based upon a data methodology developed by Knowledge Matrix Ltd and used widely in the UK. This methodology uses a broader definition of the renewable sector than other studies, because it includes the contribution from supply and value chain companies. It relies on ‘bottom up’ data based on what companies actually do, rather than what they are classified as doing under the SIC system. Innovas’s definitions are consistent with (but not limited by) SIC and NAICS codes and extend down to eight-digit code classifications which specify activities.
Innovas’s final data levels go beyond SIC code definitions.
Data sourcesThe study draws from over 700 sources. It includes activities undertaken by companies across the renewable supply chain including related network activity, commercial R&D1 only, through manufacturing into distribution, retail, installation, and maintenance services. Companies are included in the supply chain where 20% of their turnover is supplied into the sector, but only the sales activity relating to the renewable sector is included in the analysis. In order to limit the risk and error the numbers are informed by multiple sources. Innovas carry out a sensitivity analysis with the aim to provide a confidence level of 80% within a range of +/- 20%.
ModelThe full sector analysis model is a bottom up, multi-staged model that uses econometric techniques, sources and methods (such as data triangulation2) to verify and enrich
source data drawn from multiple sources.
The approach uses data from actual, live and accumulated business cases and computes confidence levels for final reported numbers, based upon a rigorous assessment of the source data. The model also measures activity in the supply chain for each sub-sector, totals are aggregated from 2,300 discrete individual product group lines for the whole low carbon and environmental goods and services sector.
Each of these lines uses specific data sources and can be analysed individually, unlike traditional studies which often group together data sources.
The methodology mitigates against double counting risks by checking and comparing the numbers over a period of years, with multiple validated and verified data sources.
‘Key facts’Employment is a measure of the estimated employment numbers across all aspects of the supply chain – these are direct full time equivalent jobs. national, regional and other economic data sources have been used to estimate current employment levels. Where employment information is scarce, or where Innovas are estimating employment for a proportion of a company’s sales, they rely on comprehensive case study materials to provide sensible industry-specific ratios and benchmarks, or for some technologies REA’s sector groups have contributed data (these are set out in additional adjustments).Number of companies is a measure of the total number of companies in the region that match (or fit within) the activity headings for renewables sector. Due to the limitations of using SIC codes the methodology uses a unique analytical process to allocate companies to the renewables activity headings. The total number of companies in this report has been arrived at by a bottom-up analysis of company stock within the country/region using such sources as: Companies House, European credit agencies, British Telecom, institutional listings and UK credit agencies.Sector turnover estimates are based upon where economic activity takes placei.e. the location of the business rather than the location of the income earner. In the calculation of turnover value Innovas consider: turnover by sub sector within postcode sets; capital asset adjustment bysub-sector within postcode sets; ONS GDP calculations; supply chain procurement value sub-sector by sub-sector by postcode sets; sub-sector specific sales reporting where available.
Global market value uses the same methodology as above for each of the main country markets with the largest 50 markets by market value being analysed to the same level of detail i.e. 2,300 discrete lines.Regional data methodology: Having identified the total company stock in the region, product and service outputs have been identified and verified by accessing further databases that include: institutionaldata sets,Yellow Pages, proprietary databases, Euromonitor, Dun and Bradstreet and Thompson. The methodology measures where the economic activity actually occurs and is reported, rather than just at the headquarters or main facilities.Consultation with stakeholders: The analysis and data were then sense checked with industry participants, these included some REA sector groups, REA sector heads, developers of certain technologies, and expert members.Sector adjustments: The adjustments to the data following consultation with stakeholders, or where the Innovas methodology was not used were:Deep geothermal: The REA’s deep geothermal sector group provided the data for this technology using current industry knowledge.Marine issues: The global definition used by Innovas includes schemes the industry would themselves classify as large hydro. The consequence is that the figure for the global share of the market would be much lower than existing estimates. The Innovas methodology only includes commercially funded R&D, however industry feel that publically funded R&D is very relevant forthis sector. This study therefore now uses an alternative study for these estimates.Solar power: There has been an acceleration in the growth of solar since the introduction of the small scale Feed-in Tariff in 2010. Changes to the FiT and RO policy in 2015 has lead to a surge in deployment. Due to the lag in official figures reflecting this activity, actual deployment might be higher than is stated in this edition of REview. Woodburning stoves: An area of concern for the industry is a lack of reliable data for the wood burning stove industry. It was not possible to separate the technologies data from the wider boilers data, but there is anecdotal evidence of strong growth in this sector, which is taking place outside the UK policy framework.
RENEWABLE ENERGY VIEW 2016
Methodology
www.r-e-a.net REview Renewable Energy View 2016 68

RENEWABLE ENERGY VIEW 2016
Onshore and offshore wind data: The supply chains in these two sectors are very closely linked and it is very difficult to separate the two. Innovas have provided their best estimate for 3 Key data lines.
1 Government and European funded R&D is not included.2 The gathering of data through several sampling strategies in order to enhance confidence in results.
METHODOLOGY - REA (DEPLOYMENT DATA & GROWTH PROJECTIONS)The intention of this report is to present both historic data and forward projections for renewable energy capacity and generation from authoritative sources, so that the reader can judge progress to date as well as the government’s view of the contribution that might be made in 2020, the year by which the Renewable Energy Directive (RED) requires the UK to have achieved a 15% contribution to energy consumption from renewables. The RED also has a subtarget for all Member States to achieve a 10% renewable energy contribution in the transport sector.We have therefore chosen to draw on official government sources for the graphs in each technology section. The one exception to this is where the average annual capacity growth rate achieved since 20091 has been used to extrapolate what further growth would be achieved in the following two years if this average growth rate were to be maintained: a “trends continued” projection.It must be stressed that this extrapolation is for indicative purposes only - there is no suggestion that future performance will follow that of the recent past, but the purpose is to show what could be achieved if recent trends were to continue and to further allow comparison with DECC’s various projections for 2020.
The Renewable Electricity SectorRenewable electricity deployment statistics are published by DECC quarterly in EnergyTrends and annually in its Digest of UKEnergy Statistics (DUKES)2. The first full data for 2015 were published in Energy Trends on 31st March 2016 and were used to produce the graphs for historical capacity and generation from 2009, as shown below. For capacity deployment in 2016 and 2017 we have shown the 2015 deployment plus the additional capacity that would be deployed if the average annual growth rate over the period 2009 to 2015 was maintained.
In order to compare past performance with projections for 2020, we have drawn on three DECC sources, the first of which we consider to be the most authoritative:1. As part of its Electricity Market ReformDelivery Plan, DECC published National
Grid’s EMR Analytical Report in December20133. The report provides modelled capacity and generation projections for 2020 for a number of scenarios - we have used the reference scenario (described as ‘Scenario 1’). In order to present UK data by technology we undertook the following calculations: a) Data for Great Britain were combined with those reported separately for Northern Ireland to produce UK totals for 2020; b) We obtained from DECC a breakdown of the data classified as “Other renewables” and were therefore able to distribute the capacity and generation by technology. We consider these to be the most authoritative projections as they form the basis of forward planning under EMR.2. Under the RED, each Member State was required to publish a National RenewableEnergy Action Plan and the UK’s was published by DECC in 20104. Although somewhat dated now, it provides theGovernment’s official statement of how it plans to fulfil the UK’s obligations under the Directive. In particular Tables 10 - 12 provide year-by-year indicative projections of deployment, broken down by technology, from 2010 to 2020 for electricity, heat and transport.3. Finally, every year DECC publishes Updated Energy Projections (UEPs), analysing and projecting future energy use and greenhouse gas emissions in the UK, based on assumptions of future economic growth, fossil fuel prices, electricity generation costs, UK population and other key variables. Renewables are only one part of the UEP, indeed the technology breakdown for renewables was only published in November 2013 following a special request, two months after the initial publication5. We have included the UEP projections for comparative purposes. As for the EMR projections, a significant share of deployment is classified as ‘Other renewables’ and this has been broken down by technology using the same split as used for the EMR data. DECC is keen to emphasise that none of its projections constitute targets and they should not be viewed as such. Nevertheless, particularly the most recent ones provide a useful view of how DECC envisages each technology contributing to deployment in 2020 and a benchmark against which to judge progress to date. It must be remembered that the 2020 renewables target is expressed as a percentage share of energy consumption, so the amount of renewable energy required in 2020 will vary according to changes in energy demand; at present DECC is projecting demand to fall between now and 2020.
The Renewable Heat Sector
Renewable heat consumption statistics are only published annually in DUKES (in July) so the latest year for which data exist is 20146. There are no data currently published for capacity however these could be inferred by using average load factors. With the advent of the Renewable Heat Incentive (RHI) DECC has started to publish monthly data on the capacity of accredited installations, however this still forms a small share of the UK’s total renewable heat capacity. Future annual updates of this report will continue to monitor progress of deployment under the RHI, as this will be the Government’s main measure in support of achieving its ambitious goal of achieving around 72 TWh renewable heat in 2020 (up from 31 TWh in 2014). As renewable heat consumption data are only available to 2014, the two year ‘trends continued’ extrapolations only cover the years 2015 and 2016. We will need to wait until the data for 2015 are published in late July 2016 to see whether the RHI has had a noticeable impact on growth. However, it must be noted that renewable heat consumption is, like heat consumption generally, strongly dependent on seasonal and annual temperature variations. Annual fluctuations in demand will therefore be superimposed on any growth in uptake of renewable heat technologies.
In order to compare past performance with projections for 2020 there is only one source to draw on: the National Renewable Energy Action Plan published in 2010.The NREAP’s heat projections to 2020 (Table 11) however, do not correlate well with the original DUKES data for NREAP’s year of publication (6.0 TWh in NREAP versus 13.6 TWh in DUKES for 2010)and there is no clear explanation given for the discrepancy. Equally, the renewable heat production in NREAP does rise to 72 TWh in 2020, equivalent to the 12% figure set out in the 2009 UK Renewable Energy Strategy. For the latest year (2014) DUKES suggests that with 31 TWh achieved, the UK is well ahead of the NREAP trajectory (9 TWh) but this comparison needs to be treated with great caution. We will continue to engage with DECC in the hope that an updated trajectory for renewable heat to 2020 can be provided.
www.r-e-a.net REview Renewable Energy View 2016 69

The Renewable Transport Sector Statistics on the UK consumption of liquid biofuels for transport are published quarterly by DECC as part of Energy Trends, drawing on HMRC’s Hydrocarbon Oils Bulletin7. The data in Table 6.2 of Energy Trends published on 31st March 2016 include annual consumption data for bioethanol and biodiesel from 2005 to 2015. The Department for Transport in turn publishes quarterly reports under the Renewable Transport Fuel Obligation, including the national origin of the biofuels supplied under the Obligation8, from which it can be seen that UK sourced biofuels have varied between 8% and 22% of the total supply since 2008.
Projections for 2020 again rely on the National Renewable Energy Action Plan published in 2010 (Table 12). Projected growth is based on achieving the RED’s sub-target of a 10% renewable contribution to transport by 2020 and includes a small but growing contribution from renewable electricity.
1 2009 was the year that the Renewable Energy Directive was implemented and the UK’s Renewable Energy Strategy published.2 Energy Trends can be accessed at http://bit.ly/1Tx13CP and DUKES at http://bit.ly/1NQzR2s. Data in this report were taken from Table 6_1 of Energy Trends, published 31st
March 2016. Data for the Biomass Power chapter are the sum of ‘Plant Biomass’ and ‘Co-firing’. Data for the Mixed Waste to Energy chapter are the sum of ‘Landfill gas’, ‘Sewage sludge digestion’, ‘Energy from waste’ and ‘Animal Biomass (non-AD)’. 3 National Grid’s report and other documents relating to the EMR Delivery Plan are available at http://bit.ly/19nj6pn4 The UK’s National Renewable Energy Action Plan is located at: http://bit.ly/1m6i9bd5 DECC’s main 2013 UEP page is http://bit.ly/1LhtFLp and the renewable energy breakdown is published at: http://bit.ly/1VVKDXZ6 DUKES is located at http://bit.ly/1kJJj4W. Data in this report were taken from Table 6.6, published 31 July 2015. Data for the Biomass Boilers chapter are the sum of ‘Wood combustion - domestic’, ‘Wood combustion - industrial’ and ‘Plant biomass’. Data for the Mixed Waste to Energy chapter are the sum of ‘Landfill gas’, ‘Sewage sludge digestion’, ‘Animal Biomass’ and ‘Biodegradable energy from waste’.7 The Bulletin is available at http://bit.ly/1weoBBn8 RTFO statistics are at http://bit.ly/1NAzp8K
IMAGE ACKNOWLEDGEMENT / CREDITS
• GOC Weston-Bygrave 103 Bygrave Lodge anaerobic digestion plant - anemoneprojectors (Flickr)
• Ensus• E.ON• Heliex Power Ltd• CTC• CNG Services - Leyland, first CNG station
connected to high pressure gas grid• Good Energy - Buttercups at Rook Wood
• Geothermal exploration, Newcastle upon Tyne - Bryn Pinzgauer (Flickr)
• Drax - Ecostore Project• BMW• Nissan• AES• Schneider Electric• isoenergy• Taz (Flickr)
REview Copyright © 2014 - 2016 Renewable Energy Association.
All rights reserved. The content of this publication may be reproduced provided reference is made to the REview 2016 report by the REA as the source.
The information, views or opinions carried in this publication do not necessarily represent those of all REA members.
While every effort has been made to ensure the accuracy of the contents of this publication, the Renewable Energy Association cannot be held responsible for any errors or omissions or opinions expressed or for any loss or damage, consequential or otherwise, suffered as a result of any material published in this publication. You must not rely on the information contained in this publication and you are advised to take independent advice from an appropriately qualified professional in relation to any matters or questions which you may have in relation to the contents of this publication including the use of any data contained in this publication.
RENEWABLE ENERGY VIEW 2016
Methodology
www.r-e-a.net REview Renewable Energy View 2016 70

70215 Renewable Energy Cover NEW.indd 2 25/05/2016 12:13