renewable fuels for cross border transportationc3p3 biogas or natural gas c3p4 pipelines and wide...
TRANSCRIPT

Renewable Fuels for Cross Border Transportation
ANNEX 3: Module sheets for fuel distribution
Overview:
Tank Lorry and Trains (road and rail) (T)Methanol C3T1 Ethanol or ETBEC3T2
Biodiesel/RME C3T3 Methane gases (high press. or fluid)C3T4
HydrogenC3T5 Petrol, Diesel, Synfuels
C3T6
Tank Lorry and Trains (road and rail) (T)Methanol C3T1 Ethanol or ETBEC3T2Methanol C3T1 Ethanol or ETBEC3T2
Biodiesel/RME C3T3 Methane gases (high press. or fluid)C3T4Biodiesel/RME C3T3 Methane gases (high press. or fluid)C3T4
HydrogenC3T5 Petrol, Diesel, SynfuelsHydrogenC3T5 Petrol, Diesel, Synfuels
C3T6
Pipelines and Wide Range Transport (P)
GH2 in pipelinesC3P1 LH2 in pipelines or tankersC3P2
Petrol or diesel in pipelinesC3P3 Biogas or
natural GasC3P4
Pipelines and Wide Range Transport (P)
GH2 in pipelinesC3P1 LH2 in pipelines or tankersC3P2
Petrol or diesel in pipelinesC3P3 Biogas or
natural GasC3P4
Methanol..................................................................................................................... 2 Ethanol or ETBE......................................................................................................... 5 Biodiesel (RME).......................................................................................................... 8 Methane Containing Gases ...................................................................................... 11 Hydrogen.................................................................................................................. 12 Petrol, Diesel or Synfuel ........................................................................................... 14 GH2 in Pipelines ....................................................................................................... 17 LH2 in Pipelines or Tankers ...................................................................................... 20 Petrol or Diesel in Pipelines...................................................................................... 23 Biogas or Natural Gas in Pipelines ........................................................................... 25
ANNEX 3: Page 1

No.: C3-T1 Methanol
class 3 input from: Module C2T1
category Tank Lorry and Trains output to: Modules C4R3, C4R13, C4T7, C4S7
General description of the process Methanol can move to market in much the same way as petrol and diesel. As liquid fuel, it requires no extraordinary handling precautions except corrosion-resistant materials and prevention of water con-tamination. Actually, its distribution uses 1.5 to 5 times as much energy as petrol distribution, for two reasons. First, it has less energy content. Second, it probably has to travel longer distances — from natural gas recovery sites if they are its source or, for methanol from biomass, from a limited number of production sites to a limited number of refuelling stations.
As regards safety, methanol has a larger range of ignitable air-fuel mixtures than petrol or diesel. At ambient temperatures, it can easily form an explosive vapour above the fuel in the tanks. In accidents, however, methanol presents less danger than petrol because their low evaporation speed keeps alcohol concentration in the air low and not explosive. Methanol is toxic when consumed or inhaled.
Regional specifications in the EU Regional specifications for transportation technologies for methanol are not relevant.
Foreseeable intermediate (5-10 years) and long-term (25-30 years) development As for other fuels, getting methanol to market closely resembles petrol distribution, with the most im-portant change involving installation of alcohol-resistant materials along the fuel chain. Newer refuel-ling stations are already fitted. Regarding infrastructure for methanol there are no essential barriers expected for the short term and the long term.
For considering a LCA for the long term future, it is assumed that the number of production sites and the number of filling stations will correspond to the grid today.
Internal and external resources (1) INTERNATIONAL ENERGY AGENCY (IEA); AFIS: Automotive Fuels Survey. Part 2: Distribution
and use, 1996
(2) INTERNATIONAL ENERGY AGENCY (IEA); AFIS: Automotive Fuels for the Future, 1999
(3) FRISCHKNECHT, R.; HOFSTETTER, P.; KNOEPFEL, I.; DONES, R.; ZOLLINGER, E.: Ökoinventare für Energiesysteme. 3. Ed., Zürich, 1996
Information from web pages:
(4) MINERALÖLWIRTSCHAFTSVERBAND: „Preise-Margen-1998.xls“ (Excel-sheet with economic data from 1998 till 2002, personal data communication)
(5) DEUTSCHES VERKEHRSFORUM: Wettbewerbsbedingungen im Straßengüterverkehr der EU: Bestandsaufnahme und Handlungsbedarf, 2001 (www.verkehrsforum.de/aktiv/pospapstraguevk.pdf)
(6) INTERNATIONAL ENERGY AGENCY (IEA) (http://www.iea.org/techno/renew/index.htm)
ANNEX 3: Page 2
Description of the calculation to obtain the quantitative figures
Economy figure:
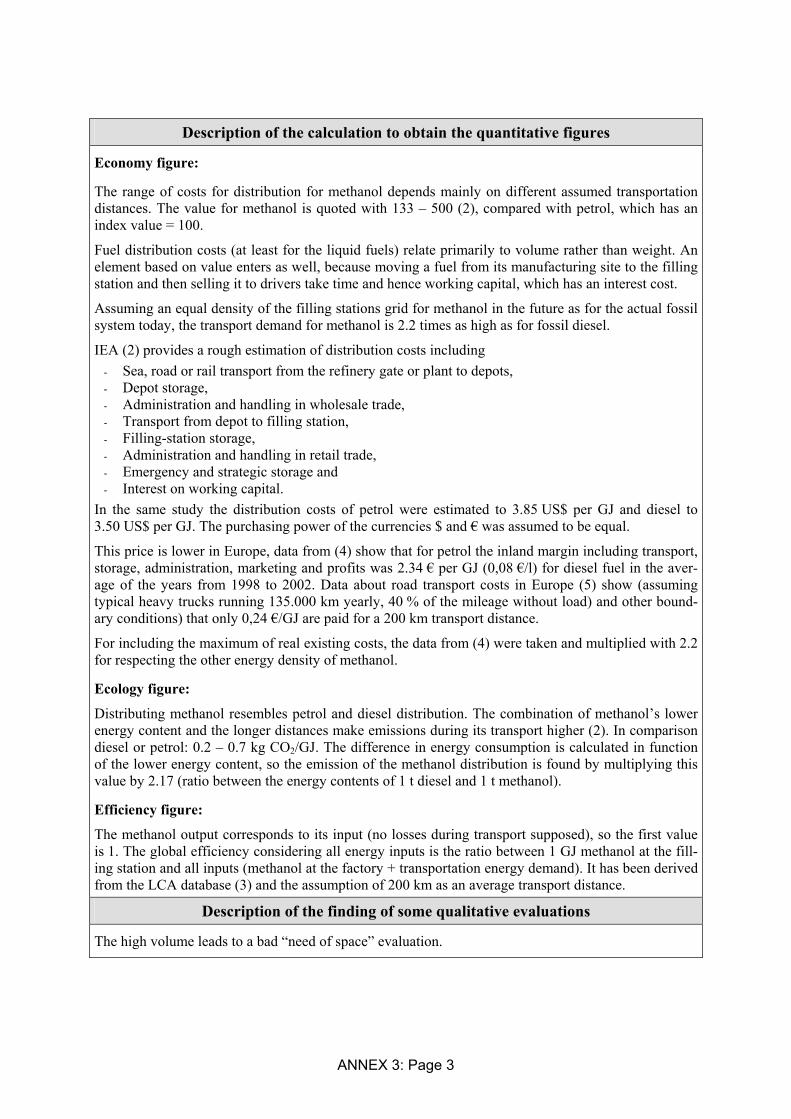
The range of costs for distribution for methanol depends mainly on different assumed transportation distances. The value for methanol is quoted with 133 – 500 (2), compared with petrol, which has an index value = 100.
Fuel distribution costs (at least for the liquid fuels) relate primarily to volume rather than weight. An element based on value enters as well, because moving a fuel from its manufacturing site to the filling station and then selling it to drivers take time and hence working capital, which has an interest cost.
Assuming an equal density of the filling stations grid for methanol in the future as for the actual fossil system today, the transport demand for methanol is 2.2 times as high as for fossil diesel.
IEA (2) provides a rough estimation of distribution costs including - Sea, road or rail transport from the refinery gate or plant to depots, - Depot storage, - Administration and handling in wholesale trade, - Transport from depot to filling station, - Filling-station storage, - Administration and handling in retail trade, - Emergency and strategic storage and - Interest on working capital.
In the same study the distribution costs of petrol were estimated to 3.85 US$ per GJ and diesel to 3.50 US$ per GJ. The purchasing power of the currencies $ and € was assumed to be equal.
This price is lower in Europe, data from (4) show that for petrol the inland margin including transport, storage, administration, marketing and profits was 2.34 € per GJ (0,08 €/l) for diesel fuel in the aver-age of the years from 1998 to 2002. Data about road transport costs in Europe (5) show (assuming typical heavy trucks running 135.000 km yearly, 40 % of the mileage without load) and other bound-ary conditions) that only 0,24 €/GJ are paid for a 200 km transport distance.
For including the maximum of real existing costs, the data from (4) were taken and multiplied with 2.2 for respecting the other energy density of methanol.
Ecology figure:
Distributing methanol resembles petrol and diesel distribution. The combination of methanol’s lower energy content and the longer distances make emissions during its transport higher (2). In comparison diesel or petrol: 0.2 – 0.7 kg CO2/GJ. The difference in energy consumption is calculated in function of the lower energy content, so the emission of the methanol distribution is found by multiplying this value by 2.17 (ratio between the energy contents of 1 t diesel and 1 t methanol).
Efficiency figure:
The methanol output corresponds to its input (no losses during transport supposed), so the first value is 1. The global efficiency considering all energy inputs is the ratio between 1 GJ methanol at the fill-ing station and all inputs (methanol at the factory + transportation energy demand). It has been derived from the LCA database (3) and the assumption of 200 km as an average transport distance.
Description of the finding of some qualitative evaluations
The high volume leads to a bad “need of space” evaluation.
ANNEX 3: Page 3

Quantitative assessment of the module for the present state Output unit: GJ
Economy: costs (€) per output unit 5.16
Ecology: emission of CO2 (kg) per output unit 0.9 – 1.7
Efficiency: GJ output energy per GJ input energy carrier 1 GJ output energy per GJ of all input energies 0.975
Qualitative assessment of the module for the present state very bad bad medium good very good
Ecology
need of space x
Availability
readiness for market
Other indicators
hazardousness (health risk)
complexity of technique
output standardisation
ANNEX 3: Page 4

No.: C3-T2 Ethanol or ETBE
class 3 input from: Modules C2F1, C2F2, C2F3, C2F4, C2F5, C2F6
category Tank Lorry and Trains output to: Modules C4R4
General description of the process
Ethanol can move to market in much the same way as petrol and diesel oil. A liquid fuel, it requires no extraordinary handling precautions except corrosion-resistant materials and prevention of water con-tamination. Its distribution uses more energy as petrol distribution, for two reasons. First, it has less energy content, but it is higher than that of methanol. Second, it probably has to travel longer distances — from natural gas recovery sites if they are its source or, for ethanol from biomass, from a limited number of production sites to a limited number of refuelling stations.
As regards safety, both methanol and ethanol have a larger range of ignitable air-fuel mixtures than petrol or diesel. At ambient temperatures, alcohols can easily form an explosive vapour above the fuel in the tanks. In accidents, however, alcohols present less danger than petrol because their low evapora-tion speed keeps alcohol concentration in the air low and not explosive (2).
The range of costs for distribution (compared with Petrol, which has an index value = 100) for ethanol depends mainly on different assumed transportation distances. The value for ethanol is quoted with 67 – 400 (2).
Regional specifications in the EU
Regional specifications for transportation technologies for methanol are not relevant.
Foreseeable intermediate (5-10 years) and long-term (25-30 years) development As for other fuels, getting methanol to market closely resembles petrol distribution, with the most im-portant change involving installation of alcohol-resistant materials along the fuel chain. Newer refuel-ling stations are already fitted. Regarding infrastructure for methanol there are no essential barriers expected for the short term and the long term.
Internal and external resources (1) INTERNATIONAL ENERGY AGENCY (IEA); AFIS: Automotive Fuels Survey. Part 2: Distribution
and use, 1996
(2) INTERNATIONAL ENERGY AGENCY (IEA); AFIS: Automotive Fuels for the Future, 1999
(3) FRISCHKNECHT, R., HOFSTETTER, P.; KNOEPFEL, I.; DONES, R.; ZOLLINGER, E.: Ökoinventare für Energiesysteme. 3. Ed., Zürich, 1996
(4) ASSOCIATION OF THE GERMAN PETROLEUM INDUSTRY: Preise-Margen-1998.xls (Excel-sheet with economic data from 1998 until 2002, personal data communication)
(5) THE GERMAN TRANSPORT FORUM: Wettbewerbsbedingungen im Straßengüterverkehr der EU: Bestandsaufnahme und Handlungsbedarf, 2001 (www.verkehrsforum.de/aktiv/pospapstraguevk.pdf)
(6) INTERNATIONAL ENERGY AGENCY (IEA) (http://www.iea.org/techno/renew/index.htm)
ANNEX 3: Page 5
Description of the calculation to obtain the quantitative figures
Economy figure:
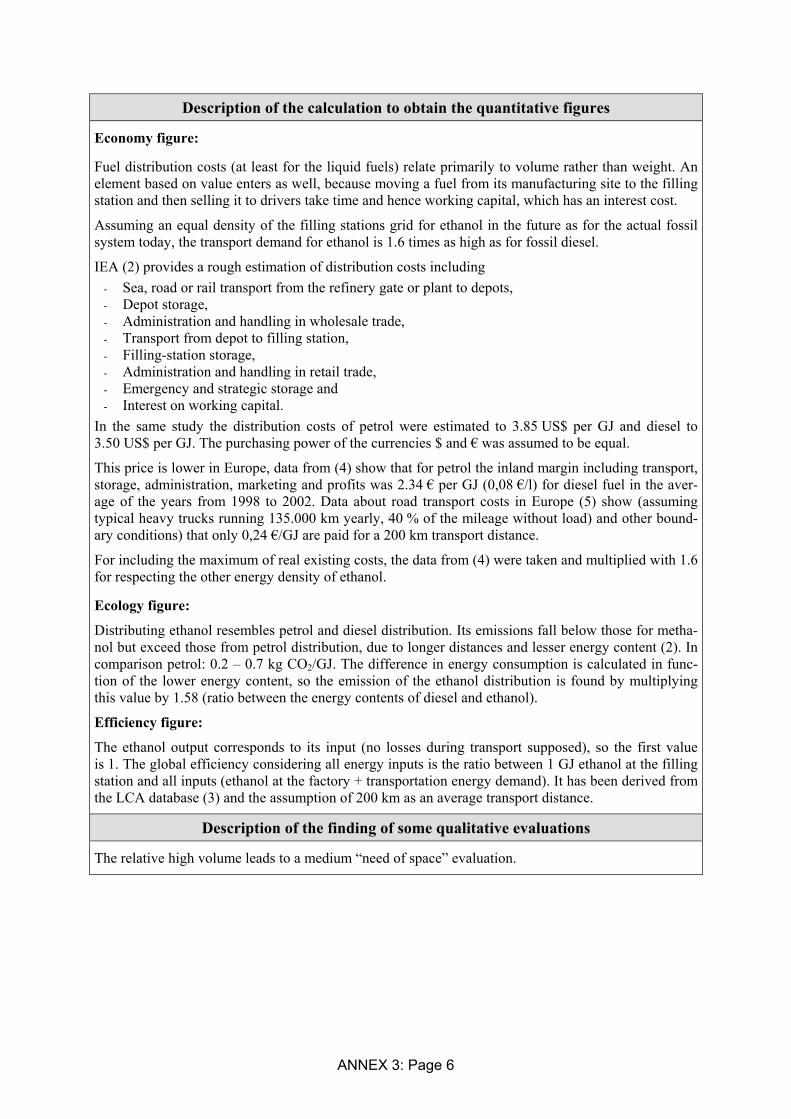
Fuel distribution costs (at least for the liquid fuels) relate primarily to volume rather than weight. An element based on value enters as well, because moving a fuel from its manufacturing site to the filling station and then selling it to drivers take time and hence working capital, which has an interest cost.
Assuming an equal density of the filling stations grid for ethanol in the future as for the actual fossil system today, the transport demand for ethanol is 1.6 times as high as for fossil diesel.
IEA (2) provides a rough estimation of distribution costs including - Sea, road or rail transport from the refinery gate or plant to depots, - Depot storage, - Administration and handling in wholesale trade, - Transport from depot to filling station, - Filling-station storage, - Administration and handling in retail trade, - Emergency and strategic storage and - Interest on working capital.
In the same study the distribution costs of petrol were estimated to 3.85 US$ per GJ and diesel to 3.50 US$ per GJ. The purchasing power of the currencies $ and € was assumed to be equal.
This price is lower in Europe, data from (4) show that for petrol the inland margin including transport, storage, administration, marketing and profits was 2.34 € per GJ (0,08 €/l) for diesel fuel in the aver-age of the years from 1998 to 2002. Data about road transport costs in Europe (5) show (assuming typical heavy trucks running 135.000 km yearly, 40 % of the mileage without load) and other bound-ary conditions) that only 0,24 €/GJ are paid for a 200 km transport distance.
For including the maximum of real existing costs, the data from (4) were taken and multiplied with 1.6 for respecting the other energy density of ethanol.
Ecology figure:
Distributing ethanol resembles petrol and diesel distribution. Its emissions fall below those for metha-nol but exceed those from petrol distribution, due to longer distances and lesser energy content (2). In comparison petrol: 0.2 – 0.7 kg CO2/GJ. The difference in energy consumption is calculated in func-tion of the lower energy content, so the emission of the ethanol distribution is found by multiplying this value by 1.58 (ratio between the energy contents of diesel and ethanol).
Efficiency figure:
The ethanol output corresponds to its input (no losses during transport supposed), so the first value is 1. The global efficiency considering all energy inputs is the ratio between 1 GJ ethanol at the filling station and all inputs (ethanol at the factory + transportation energy demand). It has been derived from the LCA database (3) and the assumption of 200 km as an average transport distance.
Description of the finding of some qualitative evaluations
The relative high volume leads to a medium “need of space” evaluation.
ANNEX 3: Page 6
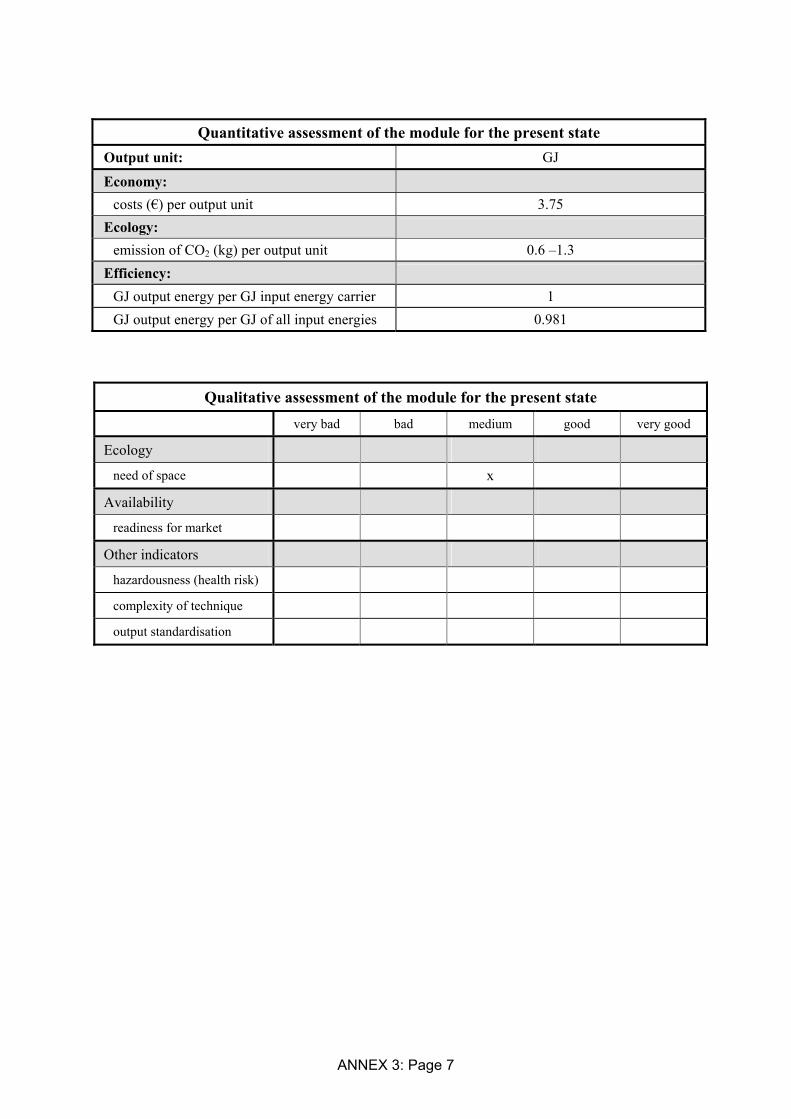
Quantitative assessment of the module for the present state Output unit: GJ
Economy: costs (€) per output unit 3.75
Ecology: emission of CO2 (kg) per output unit 0.6 –1.3
Efficiency: GJ output energy per GJ input energy carrier 1 GJ output energy per GJ of all input energies 0.981
Qualitative assessment of the module for the present state very bad bad medium good very good
Ecology
need of space x
Availability
readiness for market
Other indicators
hazardousness (health risk)
complexity of technique
output standardisation
ANNEX 3: Page 7

No.: C3-T3 Biodiesel (RME)
class 3 input from: Modules C2S1, C2S2 (S2O1, C2O2, C2O3, C2O4)
category Tank Lorry and Trains output to: Modules C4R2, C4T2, C4S2
General description of the process
Biodiesel distribution is about the same as for diesel oil, perhaps taking slightly more energy because of the fuel’s somewhat lower volumetric energy content and because road tankers may have to travel greater distances from a less-developed network of production sites and terminals (2).
However, there are some issues concerning distribution, storage and refuelling which require extra attention (1):
- Low stability of vegetable oils and their esters implicate that care has to be taken when storing these fuels for extended periods
- Water ingress should be avoided - Store dark and cool, isolated from oxygen - Limited compatibility with construction materials - Lower volumetric energy density > for same amount of energy, up to 9% more litres of fuel must
be stored - Higher viscosity at low temperatures - Incompatibility with a number of coatings and paints - Rapeseed methyl ester softens and dissolves asphalt - The lower volumetric heat of combustion results in a larger fuel volume to be transferred
Although the refuelling procedures and facilities will be similar as those for diesel fuel, due to higher viscosity and the material incompatibility it is not likely that the same facilities can be used as are used today for diesel fuel. The usage of vegetable oil fuels will need the development of and investment in a new or additional refuelling infrastructure.
Regional specifications in the EU
In France and Italy, Biodiesel is transported as blended fuels within the fossil distribution system, in Germany and Austria, Biodiesel is transported and sold separately.
Foreseeable intermediate (5-10 years) and long-term (25-30 years) development
Biodiesel offers no more difficulty than diesel fuel.
Internal and external resources Legislation and standards: Biodiesels and blends of biodiesel and ordinary diesel fuel are generally considered to comply with the same regulations regarding emissions and safety as conventional diesel fuel (1). (1) INTERNATIONAL ENERGY AGENCY (IEA); AFIS: Automotive Fuels Survey. Part 2: Distribution
and use, 1996
(2) INTERNATIONAL ENERGY AGENCY (IEA); AFIS: Automotive Fuels for the Future, 1999
(3) FRISCHKNECHT, R., HOFSTETTER, P.; KNOEPFEL, I.; DONES, R.; ZOLLINGER, E.: Ökoinventare für Energiesysteme. 3. Ed., Zürich, 1996
ANNEX 3: Page 8

Information from web pages:
INTERNATIONAL ENERGY AGENCY (IEA) (http://www.iea.org/techno/renew/index.htm)
OELMÜHLE LEER CONNEMANN GMBH & CO (http://www.biodiesel.de)
AUSTRIAN BIOFUELS INSTITUTE (http://www.biodiesel.at)
ALTERNATIVE FUEL VEHICLE GROUP (http://www.altfuels.com)
Description of the calculation to obtain the quantitative figures
Economy figure:
Fuel distribution costs were assumed to be equal to those of conventional diesel because volume, weight and energy content don’t differ significantly.
Ecology figure:
(2); In comparison petrol: 0.2 – 0.7 kg CO2/GJ Efficiency figure:
The assumption for the input / output ratio was that no losses occur, so all the RME is transported and will be completely available at the filling station.
The global efficiency considering all energy inputs is the ratio between 1 GJ ethanol at the filling sta-tion and all inputs (biodiesel at the factory + transportation energy demand). It has been derived from the LCA database (3) and the assumption of 200 km as an average transport distance.
Description of the finding of some qualitative evaluations Hazardousness is estimated better because biodiesel is biodegradable, readiness for marketing is dif-ferent in different EU member countries, it is low in the accession countries.
The output standardisation is not yet completed.
ANNEX 3: Page 9

Quantitative assessment of the module for the present state Output unit: GJ
Economy: costs (€) per output unit 2.34
Ecology: emission of CO2 (kg) per output unit 0.5 – 0.8
Efficiency: GJ output energy per GJ input energy carrier 1 GJ output energy per GJ of all input energies 0.986
Qualitative assessment of the module for the present state very bad bad medium good very good
Ecology
need of space
Availability
readiness for market x
Other indicators
hazardousness (health risk) x
complexity of technique
output standardisation x
ANNEX 3: Page 10

No.: C3-T4 Methane Containing Gases
class 3 input from: C2F7, C2F8
category Tank Lorry and Trains output to: C4R5, C4T3, C4S3
General description of the process
The transport of methane containing gases such as natural gas on vehicles (road or rail) is restricted to those areas that are not connected to the natural gas grid. The containers or bottles lead to a high load for a small energy content and are not effective compared with pipeline systems.
Regional specifications in the EU
Foreseeable intermediate (5-10 years) and long-term (25-30 years) development
Internal and external resources
ANNEX 3: Page 11
No.: C3T5 Hydrogen
Class 3 Input from: C2H1-C2H3
Category Tank Lorry and Trains Output to: C4R6, C4R11, C4R12, C4T5, C4S4, C4S6, C4A2
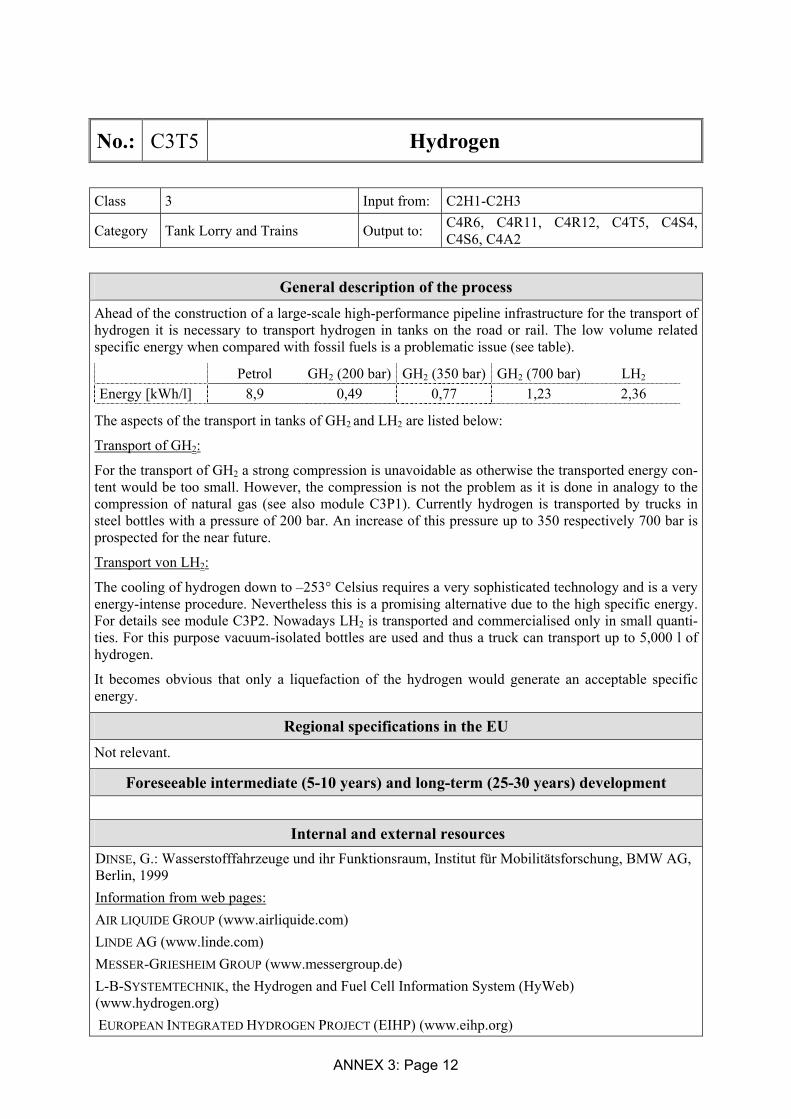
General description of the process Ahead of the construction of a large-scale high-performance pipeline infrastructure for the transport of hydrogen it is necessary to transport hydrogen in tanks on the road or rail. The low volume related specific energy when compared with fossil fuels is a problematic issue (see table).
Petrol GH2 (200 bar) GH2 (350 bar) GH2 (700 bar) LH2 Energy [kWh/l] 8,9 0,49 0,77 1,23 2,36
The aspects of the transport in tanks of GH2 and LH2 are listed below:
Transport of GH2:
For the transport of GH2 a strong compression is unavoidable as otherwise the transported energy con-tent would be too small. However, the compression is not the problem as it is done in analogy to the compression of natural gas (see also module C3P1). Currently hydrogen is transported by trucks in steel bottles with a pressure of 200 bar. An increase of this pressure up to 350 respectively 700 bar is prospected for the near future.
Transport von LH2:
The cooling of hydrogen down to –253° Celsius requires a very sophisticated technology and is a very energy-intense procedure. Nevertheless this is a promising alternative due to the high specific energy. For details see module C3P2. Nowadays LH2 is transported and commercialised only in small quanti-ties. For this purpose vacuum-isolated bottles are used and thus a truck can transport up to 5,000 l of hydrogen.
It becomes obvious that only a liquefaction of the hydrogen would generate an acceptable specific energy.
Regional specifications in the EU Not relevant.
Foreseeable intermediate (5-10 years) and long-term (25-30 years) development
Internal and external resources
DINSE, G.: Wasserstofffahrzeuge und ihr Funktionsraum, Institut für Mobilitätsforschung, BMW AG, Berlin, 1999 Information from web pages: AIR LIQUIDE GROUP (www.airliquide.com) LINDE AG (www.linde.com) MESSER-GRIESHEIM GROUP (www.messergroup.de) L-B-SYSTEMTECHNIK, the Hydrogen and Fuel Cell Information System (HyWeb) (www.hydrogen.org) EUROPEAN INTEGRATED HYDROGEN PROJECT (EIHP) (www.eihp.org)
ANNEX 3: Page 12
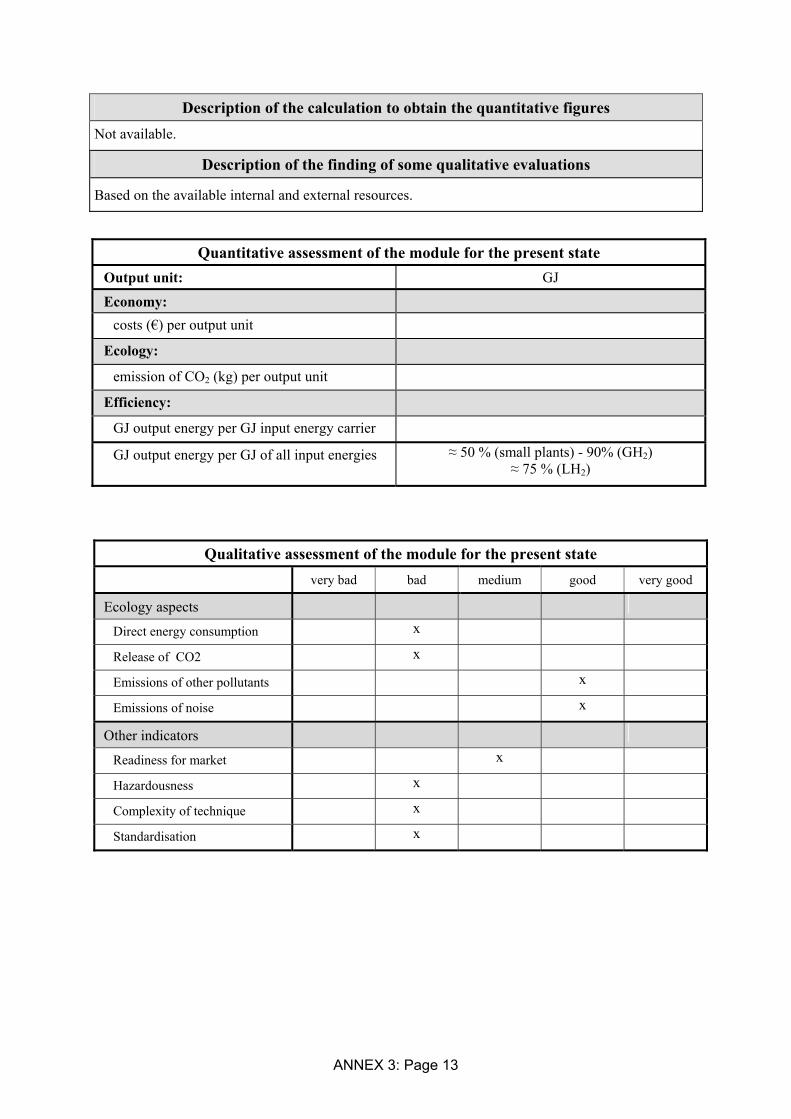
Description of the calculation to obtain the quantitative figures
Not available.
Description of the finding of some qualitative evaluations
Based on the available internal and external resources.
Quantitative assessment of the module for the present state Output unit: GJ
Economy: costs (€) per output unit
Ecology:
emission of CO2 (kg) per output unit
Efficiency:
GJ output energy per GJ input energy carrier
GJ output energy per GJ of all input energies ≈ 50 % (small plants) - 90% (GH2) ≈ 75 % (LH2)
Qualitative assessment of the module for the present state very bad bad medium good very good
Ecology aspects
Direct energy consumption x
Release of CO2 x
Emissions of other pollutants x
Emissions of noise x
Other indicators
Readiness for market x
Hazardousness x
Complexity of technique x
Standardisation x
ANNEX 3: Page 13

No.: C3-T6 Petrol, Diesel or Synfuel
class 3 input from: C2R1
category Tank Lorry and Trains output to: C4R1, C4R14, C4T1, C4S1, C4A1
General description of the process
For all conventional fuels as well as for synfuel that corresponds in its properties to the conventional fuel, there are several typical transport ways (besides the pipelines, described in the module C3-P3).
In general, for long distance, mineral oil products are transported from the refineries in goods trains or by inland waterway shipping to large central stocks from where tankers (special lorries) start for dis-tributing it to the filling stations.
For calculating the typical energy demand (and thus the typical CO2-emission), the data of an 200 km transport in tanker lorries was assumed.
In fact, this corresponds approximately to the energy demand of 300 km in trains and 100 km in tanker lorries because the energy efficiency of goods transport in railways is about three times as high as for the transport in lorries.
Regional specifications in the EU The distances for the transport and the importance of different transport modes differ according to regional specifications but the basic data are equal. A lack of harmonisation is still found in the taxa-tion of lorry transport (4).
Foreseeable intermediate (5-10 years) and long-term (25-30 years) development Market concentration will reduce the number of filling stations in most Western European countries, whereas in accession countries the growing demand is assumed to converge to the EU 15.
Important technological changes in the distribution system are not expected.
Internal and external resources (1) IEA (INTERNATIONAL ENERGY AGENCY); AFIS: Automotive Fuels for the Future, 1999
(2) FRISCHKNECHT, R.; HOFSTETTER, P.; KNOEPFEL, I.; DONES, R.; ZOLLINGER, E.: Ökoinventare für Energiesysteme. 3. Ed.. Zürich, 1996
(3) ASSOCIATION OF THE GERMAN PETROLEUM INDUSTRY: Preise-Margen-1998.xls (Excel-sheet with economic data from 1998 till 2002, personal data communication)
(4) DEUTSCHES VERKEHRSFORUM: Wettbewerbsbedingungen im Straßengüterverkehr der EU: Bestandsaufnahme und Handlungsbedarf, 2001 (www.verkehrsforum.de/aktiv/pospapstraguevk.pdf)
(5) INTERNATIONAL ENERGY AGENCY (IEA) (http://www.iea.org/techno/renew/index.htm)
ANNEX 3: Page 14
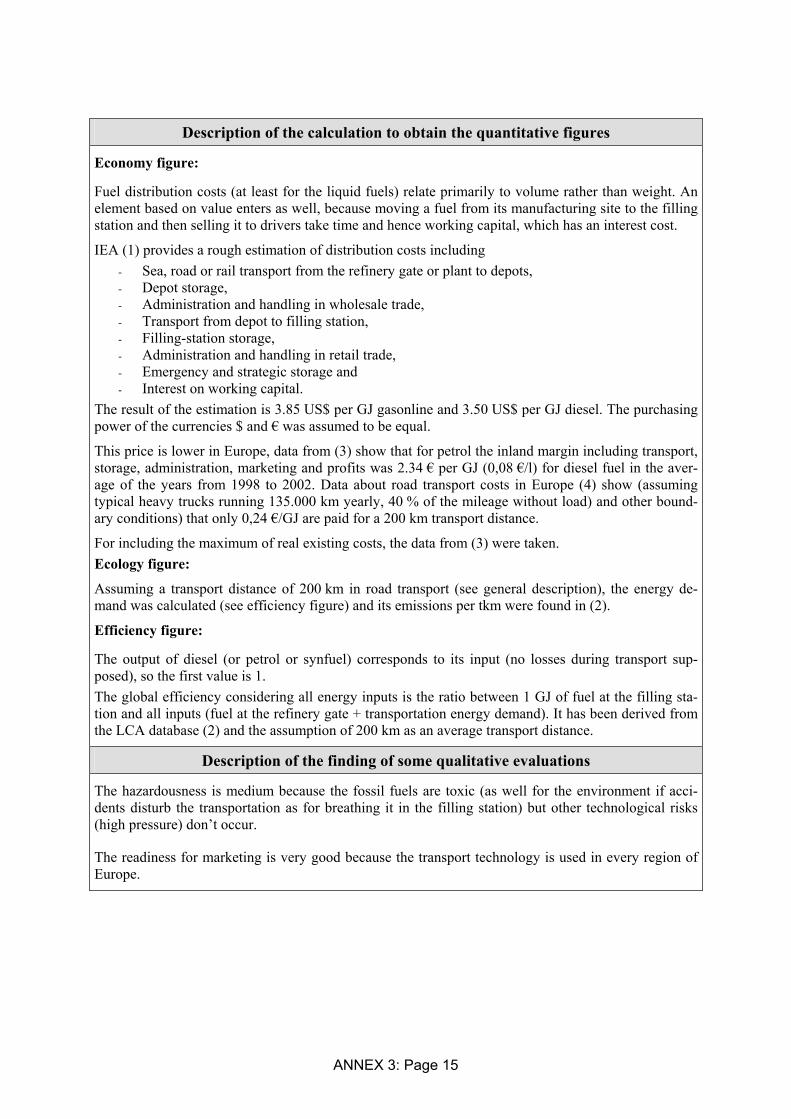
Description of the calculation to obtain the quantitative figures
Economy figure:
Fuel distribution costs (at least for the liquid fuels) relate primarily to volume rather than weight. An element based on value enters as well, because moving a fuel from its manufacturing site to the filling station and then selling it to drivers take time and hence working capital, which has an interest cost.
IEA (1) provides a rough estimation of distribution costs including - Sea, road or rail transport from the refinery gate or plant to depots, - Depot storage, - Administration and handling in wholesale trade, - Transport from depot to filling station, - Filling-station storage, - Administration and handling in retail trade, - Emergency and strategic storage and - Interest on working capital.
The result of the estimation is 3.85 US$ per GJ gasonline and 3.50 US$ per GJ diesel. The purchasing power of the currencies $ and € was assumed to be equal.
This price is lower in Europe, data from (3) show that for petrol the inland margin including transport, storage, administration, marketing and profits was 2.34 € per GJ (0,08 €/l) for diesel fuel in the aver-age of the years from 1998 to 2002. Data about road transport costs in Europe (4) show (assuming typical heavy trucks running 135.000 km yearly, 40 % of the mileage without load) and other bound-ary conditions) that only 0,24 €/GJ are paid for a 200 km transport distance.
For including the maximum of real existing costs, the data from (3) were taken. Ecology figure:
Assuming a transport distance of 200 km in road transport (see general description), the energy de-mand was calculated (see efficiency figure) and its emissions per tkm were found in (2).
Efficiency figure:
The output of diesel (or petrol or synfuel) corresponds to its input (no losses during transport sup-posed), so the first value is 1. The global efficiency considering all energy inputs is the ratio between 1 GJ of fuel at the filling sta-tion and all inputs (fuel at the refinery gate + transportation energy demand). It has been derived from the LCA database (2) and the assumption of 200 km as an average transport distance.
Description of the finding of some qualitative evaluations
The hazardousness is medium because the fossil fuels are toxic (as well for the environment if acci-dents disturb the transportation as for breathing it in the filling station) but other technological risks (high pressure) don’t occur.
The readiness for marketing is very good because the transport technology is used in every region of Europe.
ANNEX 3: Page 15

Quantitative assessment of the module for the present state Output unit: GJ
Economy: costs (€) per output unit 2.34
Ecology: emission of CO2 (kg) per output unit 0.67
Efficiency: GJ output energy per GJ input energy carrier 1
GJ output energy per GJ of all input energies 0.988
Qualitative assessment of the module for the present state very bad bad medium good very good
Ecology
need of space
Availability
readiness for market x
Other indicators
hazardousness (health risk) x
complexity of technique x
output standardisation x
ANNEX 3: Page 16

No.: C3P1 GH2 in Pipelines
Class 3 Input from: C2H1-C2H3
Category Pipelines and Wide Range Transport
Output to: C4R6, C4R11, C4T5, C4S4, C4S6, C4A2
General description of the process
Compression
Due to the very low specific energy of gaseous hydrogen it has to surpass a compression to allow for transportation and storage of high quantities of energy in tanks of acceptable sizes. The compression is done in analogy to the compression of natural gas. By adjustment of the natural gas seals they can also be used for the compression of hydrogen. The compression of hydrogen requires a certain expenditure of energy that is only logarithmically connected the pressure ratio achieved. This means that for the compression of 1 bar to 10 bars the same amount of energy is necessary as for the compression from 10 to 100 bar. Thus a further increase of the pressure would only mean a very small increase of the amount of energy necessary for the procedure. This way the only limit to the pressure achieved is given by the technology of the pressure tank.
Storage
The stationary storage of gaseous hydrogen can be done in high (250 – 300 bar) and low (10–50 bar) pressure tanks. The final pressure is produced only in dependence of the pressure necessary for the fuelling at the station. A further possibility to store hydrogen is to do it in subterranean pore stores or salt caverns. For volumes beyond several million cubic meters this type of storage is very cost-efficient.
Transport
Hydrogen under pressure can be transported via pipelines in high quantities. In the meantime there exist sufficient data on the handling of hydrogen and therefore such a network of pipelines can operate safely. For 30 years now in Germany two hydrogen pipeline networks have been operating for indus-trial purposes. They operate at a pressure of 20 bar.
Fuelling procedure for vehicles
The fuelling procedure adopted for gaseous hydrogen is the same as the one for natural gas. There exist 2 different possibilities: The hydrogen can be taken directly from a pipeline with a compressor or from a low-pressure tank or it can be stored at high pressure at the stations (minimum 250 bar) to be filled into the vehicle. The procedure of compression has an efficiency rate of 85 %. The first possibil-ity requires low investment costs but very long filling periods, the second possibility is more expen-sive but the filling periods correspond to the filling periods needed by conventional fuels. At present trained service personnel at the stations is in charge of the filling. The first public filling stations are under construction at present. In Hamburg the first filling stations for hydrogen under pressure for private cars was built in 1999. The filling period for a light-utility vehicle lasts 5 minutes.
Regional specifications in the EU
The pressures for the filling of gaseous hydrogen have to be standardized (200, 350 or 700 bar). In dependence of the standard the filling stations have to be equipped accordingly.
ANNEX 3: Page 17

Foreseeable intermediate (5-10 years) and long-term (25-30 years) development The development of the hydrogen infrastructure depends to a great extent on the demand and on the corresponding research and development projects. There don’t exist any insuperable technological barriers to the usage of gaseous hydrogen. With respect to the technology gaseous hydrogen offers a series of advantages as the extreme requirements to the cooling down to –253° Celsius are obsolete.
The application of high pressure can be realized more easily and the problem of energy losses is avoided. However there are still some problems to be solved with respect to the 700-bar-technology. The disadvantage of liquid hydrogen lies in its low specific energy. It can be assumed that a infrastruc-ture for gaseous hydrogen can be built up more easily (and therefore it could possibly be an alternative for the intermediate and long-term scenario).
Internal and external resources (1) AIR LIQUIDE (www.airliquide.com) (2) LINDE AG (www.linde.com) (3) L-B-SYSTEMTECHNIK, the Hydrogen and Fuel Cell Information System (HyWeb)
(www.hydrogen.org) (4) SCHMIDTCHEN, U.; BEHREND, E.: Auf dem Weg zur Wasserstoffenergie – wie kommen wir
weiter? Tagungsbericht der Bundesanstalt für Materialprüfung und –forschung, Berlin, 1997 (5) DINSE, G.: Wasserstofffahrzeuge und ihr Funktionsraum, Institut für Mobilitätsforschung, BMW
AG, Berlin, 1999 (6) L- B- SYSTEMTECHNIK (ED.): Kraftstoffe aus Erneuerbaren Energien im Vergleich: Effizienzen,
Emissionen und Potenziale, Jörg Schindler, Werner Weindorf; Weltforum Erneuerbare Energien: Politik und Strategien; Sitzung 5: Die Ablösung fossiler Treibstoffe durch Erneuerbare Energien, Berlin, June 15 2002, Ottobrunn, 2002
(7) L-B-SYSTEMTECHNIK (ED.): Wasserstoff-Erzeugung in offshore Windparks, (writer: ALTMANN, M.; STILLER, C.), Ottobrunn, 2001
Description of the calculation to obtain the quantitative figures
Not available.
Description of the finding of some qualitative evaluations
The qualitative assessment is based on the “General description of the process”. Because there are no insuperable barriers in implementing an infrastructure based on GH2-pipelines nearly all items are considered to be “good”. Especially on the item “hazardousness” there are still some concerns, there-fore it is stated to “bad”.
ANNEX 3: Page 18

Quantitative assessment of the module for the present state Output unit: GJ
Economy: costs (€) per output unit
Ecology: emission of CO2 (kg) per output unit dep. on life cycle assessment
Efficiency: GJ output energy per GJ input energy carrier
GJ output energy per GJ of all input energies ≈ 50 % (small plants) - 85 % (industrial)
Qualitative assessment of the module for the present state very bad bad medium good very good
Ecology aspects Direct energy consumption x
Release of CO2 x
Emissions of other pollutants x
Emissions of noise x
Other indicators Readiness for market x
Hazardousness x
Complexity of technique x
Standardisation x
ANNEX 3: Page 19

No.: C3P2 LH2 in Pipelines or Tankers
Class 3 Input from: C2H1-C2H3
Category Pipelines and Wide Range Transport
Output to: C4R6, C4R11, C4R12, C4T5, C4S4, C4S6, C4A2
General description of the process
Liquefaction:
By means of the liquefaction of hydrogen the highest volume related energy content of hydrogen can be achieved. However this process is the most sophisticated and costly procedure. Along six heat exchanger steps the hydrogen is cooled down from room temperature to 21° Kelvin. Several intermediate steps work by using liquid nitrogen cooling. A reduction of the consumption of electricity can be achieved by using high-pressure hydrogen. For research purposes today several small-size liquefactors with output of approximately 200 kg per day are in operation. Further 10 facili-ties for the large-scale technological production (up to 60 tons per day ) are in operation worldwide.
Storage:
The technological problems connected to the storage of liquid hydrogen have been solved due to the extensive research on the application of liquid hydrogen in space travel. The storage is done in tanks with pearlite-vacuum isolation. Numerous tanks of this type are located in the USA, the biggest is to be found at Cape Canaveral at the NASA with a storage volume of 270 t LH2. Due to the good heat isolation the evaporation rates of these storage systems amount to only 0.03 % per day. That means that theoretically the hydrogen could be stored over a period of some years. In contradiction to the pressure tanks high quantities of hydrogen can be stored cost-efficiently due to the small construction volume. The sizes for the tanks have been standardized as follows: small (100 l), medium (1,500 l) and big (up to 75,000 l).
Transport:
As currently liquid hydrogen is commercialised only in small quantities there don’t exist any data about a large-scale infrastructure. The USA have several pipelines with a length of up to 40 kilometres for the transportation of liquid hydrogen for industrial purposes. The most plausible option for the intercontinental hydrogen transport is the transport on ships. Big size ships and harbours invested with the corresponding tanks and facilities are already in the phase of planning. The realization of these plan will be started only after a certain demand hade been made out.
Fuelling procedure for vehicles:
The fuelling with liquid hydrogen requires the installation of fuelling robots. For reasons of safety engineering and extremely low temperatures (-253° Celsius) this installation is necessary. The filling period corresponds to that one of conventional fuels (for instance 3 minutes for 130 l liquid hydrogen). The first public filling station worldwide invested with a filling robot was opened at the Munich air-port for test purposes. Cars and busses operating in the movement area use this filling station.
Regional specifications in the EU
Standardization of technology with respect to cross-border transport in pipelines (for instance pressure and purity of the gas) is required.
ANNEX 3: Page 20

foreseeable intermediate (5-10 y.) and long-term (25-30 y.) development
The development of the hydrogen infrastructure depends to a great extent on the demand and on the corresponding research and development projects. Today it can be stated that there don’t exist any insuperable technological barriers. Furthermore the liquid hydrogen offers a series of advantages in handling due to the high specific energy. All in all liquid hydrogen is a very complex system requiring serious efforts for a area-wide implementation of a corresponding infrastructure. This process will therefore be of interest only for the long-term scenario (30 years).
Internal and external resources (1) AIR LIQUIDE (www.airliquide.com) (2) LINDE AG (www.linde.com) (3) MESSER-GRIESHEIM GROUP (www.messergroup.de) (4) L-B-SYSTEMTECHNIK, the Hydrogen and Fuel Cell Information System (HyWeb)
(www.hydrogen.org) (5) SCHMIDTCHEN U.; BEHREND, E.: Auf dem Weg zur Wasserstoffenergie – wie kommen wir
weiter? Tagungsbericht der Bundesanstalt für Materialprüfung und –forschung, Berlin, 1997 (6) Dinse, G.: Wasserstofffahrzeuge und ihr Funktionsraum, Institut für Mobilitätsforschung, BMW
AG, Berlin, 1999 (7) L- B- SYSTEMTECHNIK GMBH (ED.): Kraftstoffe aus Erneuerbaren Energien im Vergleich: Ef-
fizienzen, Emissionen und Potenziale, Jörg Schindler, Werner Weindorf; Weltforum Erneuerbare Energien: Politik und Strategien; Sitzung 5: Die Ablösung fossiler Treibstoffe durch Erneuerbare Energien; Berlin, June 15 2002, , Ottobrunn, 2002
(8) CHOREN INDUSTRIES (ED.): Erneuerbare Kraftstoffe, Freiburg, 2001
Description of the calculation to obtain the quantitative figures
Economy figure:
The costs for a large-scale liquefaction facility with an output of 5 t/d lie at about 15 million € (costs for investments). The operation costs include considerable amounts of energy, water and nitrogen.
Efficiency figure:
The process of liquefaction, transport and storage is altogether an energy intensive process (in particu-lar electric energy is needed) therefore limiting the maximum possible efficiency. It is possible that in the long-term view there will be improvements by the implementation of large scale system for mass transport of liquefied hydrogen (thus leading according to the economy of scale to a better efficiency figure).
Ecology figure:
The ecology figure is directly depending on the efficiency figure. The process of liquefaction, trans-port and storage doesn’t produce any emissions as electric energy is used. Therefore the emissions are calculated by the life cycle assessment of the energy used.
Description of the finding of some qualitative evaluations
The qualitative assessment is based on the “General description of the process”. Because of the con-siderable technical and economical difficulties the qualitative assessment of the module concerning the items “direct energy consumption”, “readiness for market” and “complexity of technique” is assessed to “very bad”.
ANNEX 3: Page 21

Quantitative assessment of the module for the present state Output unit: GJ
Economy: costs (€) per output unit
Ecology:
emission of CO2 (kg) per output unit dep. on life cycle assessment
Efficiency:
GJ output energy per GJ input energy carrier 99 %
GJ output energy per GJ of all input energies ≈ 57 % (including liquefication, excluding elec-trolysis)
Qualitative assessment of the module for the present state very bad bad medium good very good
Ecology aspects
Direct energy consumption x
Release of CO2 x
Emissions of other pollutants x
Emissions of noise x
Other indicators
Readiness for market x
Hazardousness x
Complexity of technique x
Standardisation x
ANNEX 3: Page 22

No.: C3-P3 Petrol or Diesel in Pipelines
class 3 input from: Module C2R1
category Pipelines and Wide Range Transport
output to: Modules C4R1, C4R14, C4T1, C4S1, C4A1
General description of the process
Pipelines are used to transport mineral oil from exploitation sites or from sea ports to the refineries but also for transporting the refinery products to large customers (chemical industry, distribution centres for petrol or diesel in agglomerations etc.).
Regional specifications in the EU
For evaluating the technical data, regional specifications are not relevant.
Foreseeable intermediate (5-10 years) and long-term (25-30 years) development
Internal and external resources
(1) REICHMUTH, M.: Statistische Erfassung des motorisierten Verkehrs in Deutschland, Heidelberg, 1993
Description of the calculation to obtain the quantitative figures
Economy figure:
Price data for pipeline transports were not available, most of the pipelines are owned (directly or indi-rectly) by mineral oil companies which consider these data as internal.
Ecology figure:
The energy input for transporting fuels in pipelines is electricity for the pumps. So the CO2 output of the final energy demand (0,0245 MJ/tkm) can be calculated with the European power mix.
Efficiency figure:
The output of diesel (or petrol) corresponds to its input (no losses during transport supposed), so the first value is 1. The global efficiency considering all energy inputs is the ratio between 1 GJ of fuel at the pipeline end and all inputs (fuel at the beginning of the pipeline + transportation energy demand).
The specific primary energy demand for the transport of mineral oil in pipelines per tkm was calcu-lated in (1). It depends on various frame conditions and local conditions and can differ a lot from this average value. The value can also be used for mineral oil derived fuels such as diesel or petrol. Com-pared with tanker lorry, ships and trains, it is the most economic transportation (0,102 MJ/tkm).
Description of the finding of some qualitative evaluations
Qualitative evaluations have not been carried out.
ANNEX 3: Page 23
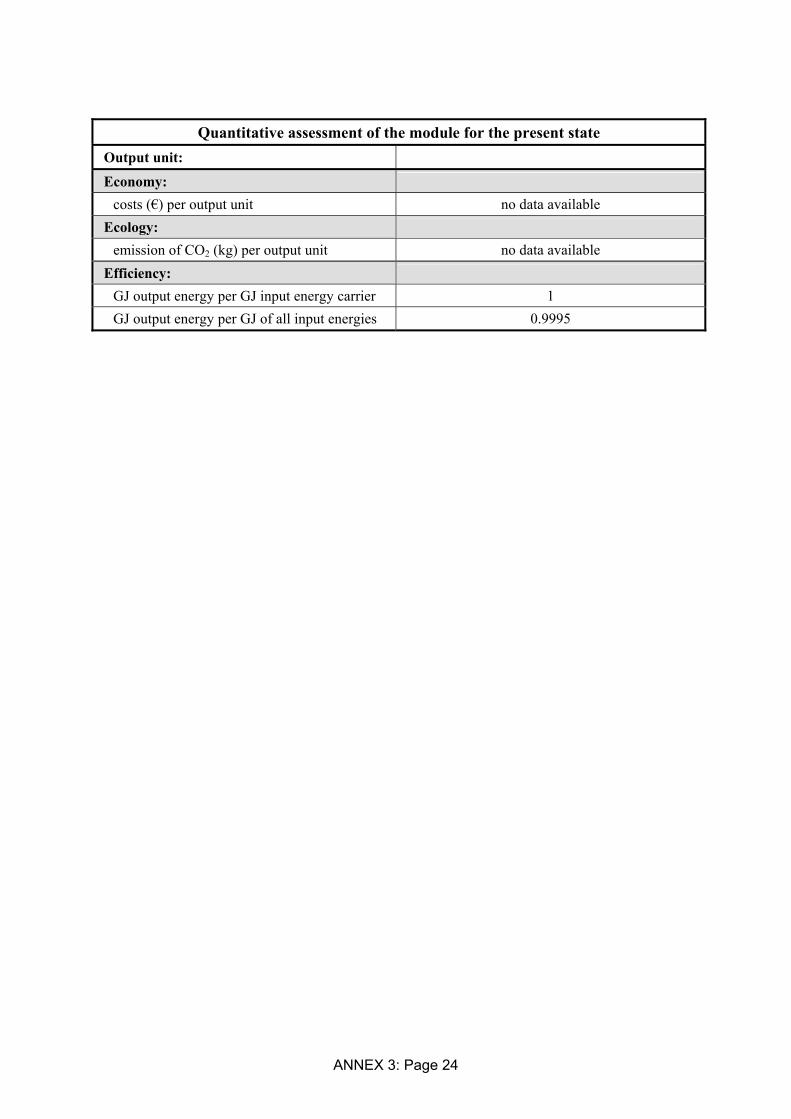
Quantitative assessment of the module for the present state Output unit:
Economy: costs (€) per output unit no data available
Ecology: emission of CO2 (kg) per output unit no data available
Efficiency: GJ output energy per GJ input energy carrier 1 GJ output energy per GJ of all input energies 0.9995
ANNEX 3: Page 24

No.: C3-P4 Biogas or Natural Gas in Pipelines
class 3 input from: Modules C1F2, C2S3
category Pipelines and Wide Range Transport
output to: Modules C4R5, C4R7, C4T3, C4S3
General description of the process
Today, natural gas is generally transported in pipelines, these pipelines form a dense grid within Europe. The gas must have a standardised quality for the end user. The propulsion of the gas is done by pumps which branch off a little share of the transported gas for their gas motors. These motors are not only necessary for the propulsion but also for the compression (at the start and at intermediate stations).
There is a also need for intermediate storage for balancing the supply and the demand side. The stor-age is also mostly done by compression.
If biogas corresponds in its properties (methane content etc.) to the natural gas standards, then it can be put into the gas pipeline grid. Normally it will be blended with natural gas there.
Regional specifications in the EU For evaluating the technical data, regional specifications are not relevant.
Foreseeable intermediate (5-10 years) and long-term (25-30 years) development The large pipeline grid corresponds to the large European natural gas consumption. If natural gas will be depleted, the grid will be to large for the biogas quantities that may be transported.
For transporting hydrogen, the density of the pipeline grid is not high enough.
So the existing system will not be able to overtake the transport of gaseous renewable fuels.
Internal and external resources (1) Reichmuth, M.: Statistische Erfassung des motorisierten Verkehrs in Deutschland, Heidelberg 1993
Description of the calculation to obtain the quantitative figures
Ecology figure:
The CO2-emissions of the gas motors needed for compression and propulsion can be calculated, but for the greenhouse effect, the methane losses during the transport are by far more important.
Efficiency figure:
The first figure should consider the losses during the transport. A typical value was not found.
The second figure reflects the losses as well as the energy demand of the pumps. The latter was calcu-lated in (1): 0,447 MJ/tkm primary energy demand.
ANNEX 3: Page 25