renewable jet fuel - university of queensland€¦ · web viewthe ngers report covers the ... lab...
TRANSCRIPT

Virgin AustraliaOur greenhouse gas emissions are by far our airline’s most significant environmental impact. 98% of our emissions footprint is the result of aircraft fuel burn.
We are committed to reducing our emissions and our impact on the environment as much as possible through combined approach of fuel efficiency, sustainable aviation biofuel development and carbon offsetting.
o Fuel efficiency is critical to managing our carbon footprint in the short to medium term. Virgin Australia is already ahead of many of our industry peers in this regard as we already operate a young and fuel efficient fleet, with an average age of just 4.9 years. However, this also means that achieving substantial improvements in fuel efficiency represents a greater challenge. To ensure our fleet remains fuel efficient we have an extensive fleet renewal program.
o Sustainable aviation biofuel is arguably the greatest opportunity for airlines to mitigate their impact on the environment. Read more about Virgin Australia’s leading role in developing a commercial sustainable aviation biofuel industry in Australia.
o Carbon offsetting remains a key part of our overall sustainability strategy. Virgin Australia has been a leader in this field and in 2007 we launched the world’s first government certified airline offset program. Read more about our carbon offset program.Virgin Australia is also a member of the Aviation Global Deal Group, a coalition of airlines, aviation industry companies and The Climate Group committed to supporting international efforts to develop an environmentally and economically sustainable global policy framework for reducing carbon emissions from the aviation sector. More information on the AGD proposals can be found at www.agdgroup.org.
Minimising the environmental impacts of our ground-based operations is also an important part of our sustainability program. We are currently assessing options to reduce emissions, resource consumption and waste. Our current performance and initiatives can be found in our latest Annual Report and we will continue to report to stakeholders annually on our progress.
We also recognise the impact aircraft noise can have on sections of the community. We aim to minimise noise from our operations by maintaining a modern technically advanced fleet of aircraft that are complaint with the ICAO Chapter 4 noise standards. We work closely with air service providers to design approach and departure paths which allow aircraft to utilise onboard equipment to fly high precision tracks that help to minimise the noise footprint over noise sensitive areas. We are also directly engaging with community groups affected by aircraft noise through the Community Aviation Consultation Groups and other forums at major Australian airports. Each group is independently chaired and provides an open discussion of airport operations and their impacts on nearby communities.

Virgin Australia Annual Report 2013-Extract
At Virgin Australia, there is astrong emphasis on reducingthe impact of our operationson the environment.Greenhouse gas emissions are ourlargest environmental impact. Due tothe airline’s growth, total emissionsincreased to 3,104,963 tonnes ofCO2-e during in the 2012 financialyear, an increase of 3.8 per centon the previous year. Despite thisgrowth, our emissions intensity of0.93kg CO2-e per Revenue TonneKilometre (RTK) fell 2.1 per centover the previous year and is wellbelow the global industry averageof approximately 1.01 kg CO2-e/RTK1.Per kilometre flown, our fleet usesmore than 8 per cent less fuel thanthe global average.Over 99 per cent of our totalemissions are produced from
aircraft fuel burn. Therefore, ourstrategic approach towards climatechange is focused on fuel efficiencyand sustainable aviation fueldevelopment.Over the past two years, we haveinvested in a fleet program toensure we operate a young andfuel efficient fleet. The averageage of our aircraft is just 4.2 years,down from 4.9 at the end of the2011 financial year. This is 10 yearsyounger than the global average and7 years younger than the average inAsia-Pacific2.To further improve efficiency theairline has instituted a programto evaluate fuel reductionopportunities. Effective fuelmanagement requires a crossdivisional approach as all operationalareas have an impact on the waythat aircraft consume fuel. A cross
divisional team has been establishedled by the General Manager of FlightOperations that focusses on a coreset of fuel management principlesincluding: Optimising Fuel Policyand Flight Planning: ReducingAircraft Weight; Operational ProcessExcellence, and working proactivelywith air navigation service providersto find efficiency opportunities in theair traffic control system.To support our target of sourcing5 per cent of our aircraft fuelrequirements from renewable jetfuel by 2020, we have two keypartnerships with advanced biofuelcompanies in place. We believerenewable jet fuel will play animportant role in enabling us to
reduce our emissions in the future.
Virgin Fly Carbon Neutral Program
The “Fly Carbon Neutral” offset program allows guests flying with the airline to offset thegreenhouse gas emissions “attributed” to the seat on their flight. Emissions are predominantlydue to flight fuel burn with lesser amounts arising from ground energy use and waste disposal.The emission values used in the offsetting program for the current year (FY10/11) arecalculated from the previous year’s data set. The greenhouse gas emissions are calculated percity pair (sector) flown in the previous twelve months within the network. Virgin Australia has astandardised fleet of 89 Boeing 737-NG, 777-300ER, Airbus A330-200 and Embraer E-Jetaircraft. Utilising a twelve month data set provides normalisation of these variations due todiffering operational parameters.The emission figure is divided by the number of persons that travelled on these city pairs during that time and adjusted to account for freight. The number of persons that travelled on these city pairs during that time includes paying guests, duty staff travel, leisure staff travel,

and flight crew. The resulting average emission figures expressed per passenger are used in the online calculator.
When booking a flight the guest can use this calculator to determine the greenhouse gascontribution due to their “seat” on the flight. These figures also allow the airline to calculate the proportion of the total emissions due to aircrew, duty passengers etc. Guest emissions to be offset are banked and periodically acquitted against certified abatement.Greenhouse gas emissions attributed to airline staff travel (aircrew and duty) are not included in the paying guest’s “seat” emissions total. The airline’s Carbon Offset Program covers all flights on the Virgin Australia, Pacific Blue, Polynesian Blue and V Australia airlines (the Virgin Australia group) irrespective of whether the flights originate in Australia or not.
Virgin Australia Group of Airlines Sustainability PolicyThe Virgin Australia group constantly strives to deliver our customers great products andservices. As a responsible corporate citizen, we aim to maximise the social, environmentaland economic benefits and minimise the potential impacts of our products and services onthe planet and to the communities within which we operate.We are committed to working towards a position of sustainability leadership in the aviationindustry. We regularly review our sustainability risks and opportunities to focus oursustainability initiatives on the issues that really matter to our business and to our customers.We are taking practical steps to continually improve our sustainability performance:
Governance: Considering the long-term sustainability implications of our majorbusiness decisions.
Leadership: Behaving with integrity and honesty in all our business activities.
People: Supporting our people to reach their full potential, treating everyonewith respect, building a diverse workforce and making health andsafety a top priority.
Community: Making a measurable contribution through supporting communityinitiatives and sustainability programs.
Customers: Providing a superior and sustainable product offering.
Supply chain: Partnering with our key suppliers and market partners to share ideasand enhance sustainability performance across our entire supplychain.
Climate Change: Providing innovative fuel management solutions and encouraging thedevelopment of sustainable aviation biofuels to reduce our carbonfootprint.
Resources: Reducing consumption and implementing recycling programs.
Communication: Sharing our sustainability aspirations, challenges and achievementswith our stakeholders.At the Virgin Australia group, it is everyone's responsibility to achieve our sustainabilitytargets. The Board of Directors sets our vision and policy, the Sustainability Steering Groupsets targets annually and our sustainability performance is reviewed periodically by theExecutive Committee and the Board. Our progress and achievements will be independentlyassured where appropriate. We will review this policy at least every two years and updateas required.

Renewable Jet FuelRenewable jet fuels derived from biomass (plants, trees, algae, waste and other organic matter bio-oils) offer the largest single opportunity to reduce emissions while ensuring long term fuel security for the sector. The airline sector is committed to reducing its greenhouse gas emissions and have set a target of carbon neutral growth from 2020. The use of these fuels will significantly contribute towards achieving that target. It will also reduce our dependence on oil imports which are expected to continue to rise in cost and will ease the pressure on Australia’s aging refineries which are currently operating at capacity. Importantly, it will promote Australian innovation and support local economies where much of the anticipated biofuel feed stocks will be produced.
Renewable jet fuel will be produced from a number of biomass feedstock types utilising a number of refining pathways depending on location, infrastructure and climate. Australia is ideally suited to producing this fuel. A number of barriers exist to commercial deployment of renewable jet fuels including biomass production, economics and the establishment of a new value chain. Virgin Australia is committed to working with all relevant stakeholders to encourage the establishment of this new industry.To be acceptable for commercial use by Virgin Australia, renewable jet fuel must: be competitively priced compared to fossil based Jet-A and be available in significant quantities; be a 'drop-in' replacement that meets the same technical standards as conventional fossil-derived jet fuel; and fulfill internationally recognised sustainability criteria that ensures land, water resources and biodiversity are not adversely affected

during production including reducing overall carbon emissions over the fuel's lifecycle.Virgin Australia is supporting the development of these fuels through a number of avenues including: engaging and supporting promising biofuel projects; working with the government to encourage funding of essential research and address scale-up issues; supporting and working with the aviation industry and biofuel supply chain on shared issues; and supporting the development of a robust biofuel sustainability standard for our region.We have continued to lead industry efforts towards establishing a renewable jet fuel industry in Australia through our role as a founding partner of the Australian chapter of the Sustainable Aviation Fuel Users Group (ASAFUG). In 2010 ASAFUG commissioned the CSIRO to lead a “Roadmap” study to help accelerate the commercialisation of a renewable jet fuel industry in Australia and New Zealand. The Roadmap was launched in May 2011 and it found that by 2020 a 5 per cent bio-derived jet fuel share could be possible in Australia and New Zealand, expanding to 40 per cent by 2050.To help accelerate the development and commercialisation of renewable jet fuel in Australia we are a partner in a number of biofuel projects that simultaneously foster the environment, Australian innovation and regional economies, including:
o A University of Queensland led project to undertake a detailed analysis of a potential Queensland-based renewable jet fuel industry from three distinct biomass sources – sugar cane, pongamia, and algae.
o A Memorandum of Understanding with Renewable Oil Corporation, GE and the Future Farm Industries CRC to work together develop a sustainable supply of high quality, cost competitive, renewable jet fuel derived from native mallee trees grown in the West Australian wheat belt to help control dryland salinity. This represents a significant step towards the development of a commercial jet fuel industry in Australia and one that also provides multiple social and environmental co-benefits. Read Media Release
o A Memorandum of Understanding (MoU) with Australian-based biofuel company Licella, who has been working hard over the past three and a half years to develop a potentially breakthrough technology called CAT-HTR that converts waste into renewable jet biofuel. We know it sounds complicated, but it is surprisingly straightforward. Unlike current methods that require several processes, Licella’s CAT-HTR involves just one-step. By using a unique, new water technology, CAT-HTR converts woody waste into high quality bio-crude oil in one, continuous flow. What’s more, by using water, CAT-HTR is a much cleaner and cost-effective alternative to current methods. Read Media Release.

University of QueenslandCarbon Strategy
Carbon ObjectivesObjective 1 Align energy and carbon mitigation programs with UQ’s core business objectives of Learning,
Discovery & Engagement.
Objective 2 Comply with Government carbon legislation.
Objective 3 Minimise the consumption and cost of energy and carbon.
Objective 4 Position UQ on energy, carbon & sustainability with both internal and external stakeholders.
Carbon Targets and Action PlanTo measure its carbon management achievements, UQ is currently developing a Climate Action Plan (CAP) outlining UQ's carbon reduction targets and the actions necessary to meet it. The CAP is being developed for endorsement by the Sustainability Steering Committee, ensuring that our carbon reduction target and actions are meaningful and achievable. UQ endeavours to reduce carbon emissions by 25% of 2008/2009 baseline levels by 2020.
The University of Queensland's Carbon FootprintTo develop a response climate change, UQ must first understand its carbon footprint.
UQ has over 40,000 students and almost 6000 staff occupying well over 600 buildings in its four campuses and over 50 teaching and research sites throughout Queensland.
UQ generated over 138 kilotonnes of CO2-e emissions in 2010/2011. 97% of our reportable footprint (Scope 1 and 2) is attributed to the consumption of approximately 151,000MWh of electricity (Scope2). The remaining emissions (Scope 1) result from natural gas consumption, liquified petroleum gas (LPG) consumption, unleaded petrol and diesel consumed in UQ's fleet vehicles, vessels and generators, in-house incineration and wastewater treatment and sulphur hexafluoride leakages from electrical infrastructure and scientific equipment.
Scope 3 emissions which are currently not reportable to the federal government's Department of Climate Change and Energy Efficiency (DCCEE) result from commuting and business travel, paper consumption, offsite waste disposal/treatment and offsite wastewater treatment.
Managing UQ's Carbon FootprintHaving identified and quantified elements of UQ's operations that contribute to the carbon footprint, strategies can be developed to manage these greenhouse gas emissions.
It is UQ’s aim to minimise its carbon footprint by 25% of baseline 2008/2009 levels by 2020. To achieve this, the elements that contribute to the carbon footprint will be minimised and those that reduce the footprint expanded. The following carbon management model presents those elements of UQ’s operations that can be managed to minimise the carbon footprint. The elements are grouped under the Greenhouse Gas Protocol Emission Scope (1, 2 or 3) to which they relate (see page 21 of the World Business Council for Sustainable Development – The Greenhouse Gas Protocol a corporate accounting and reporting standard for explanation of the scopes].

Carbon Compliance and LegislationIn recent years, the Federal Government has introduced new legislation to conserve energy and greenhouse gas emissions.
The National Greenhouse and Energy Reporting Act 2007 (the NGER Act) establishes a national reporting framework for large corporations to report on Scopes 1 and 2 greenhouse gas emissions and energy consumption and production from 1 July 2008. UQ produced its first report in October 2009, covering over 20 sites and numerous emission sources. Comprehensive monitoring of the University's emissions is an ongoing requirement and UQ will submit a report to the DCCEE annually.The Energy Efficiency Opportunities Act 2006 (the EEO Act) mandates Australia's biggest companies to undertake comprehensive energy assessments using a whole of business approach and identify energy saving opportunities. Companies are required to report on the outcomes of energy assessments and the business response to opportunities identified. UQ met the 0.5 petajoule threshold in 2008/09 and developed its EEO strategy in 2010. Numerous energy efficiency opportunities have been identified and implemented. UQ has published its first EEO report which can be found on the UQ Sustainability Website, and will report annually as an ongoing requirement.

Emission ControlBased on 2008/2009 figures, UQ’s P&F Fleet Services has reduced its hire fleet’s greenhouse gas emissions by 25 per cent – quite a remarkable achievement given that the University has grown significantly in both area and population over the past four years.
Mark Kranz, UQ Manager Transport Systems, Property and Facilities (P&F), said the reduction had been achieved in several ways.
“We have replaced older vehicles when they’re due for retirement with fit-for-purpose hybrid or electric models, including our new zero emissions vehicles (ZEVs) that replaced many traditional internal combustion motorcycles and vans damaged in the 2011 Brisbane floods,” he said.
The ZEVs have their own specially built recharge stations located on the St Lucia campus in multi-level car park 2 and are powered on electricity generated by the solar photovoltaic array located on the roof of the same building.
P&F Deputy Director Geoff Dennis said the achievement is further evidence of how serious the University is in addressing its carbon footprint.
“Environmental sustainability is an integral part of our academic curriculum and we are actively embedding sustainability across all campus operations,” he said.
UQ has developed a Climate Action Plan that sets out proposed actions to reduce its carbon footprint by 2020, and reducing car fleet emissions is just one of many sustainable initiatives.
“We are focusing on all areas where the University emits greenhouse gas, from energy to transport, waste and the built environment,” Mr Dennis said.
“For example, two new buildings currently being constructed, the Advanced Engineering Building and the Global Change Institute, are both designed to meet strict environmental objectives and will both receive the national green star tick of approval from the Green Building Council of Australia,” he said.
UQ has already installed Australia’s largest solar photovoltaic array and continues to work on revitalising campus biodiversity.
ENERGY EFFICIENCY OPPORTUNITIES REPORT-EXTRACTThe main campus of The University of Queensland (UQ) is located on a large bend in the Brisbane River at St Lucia about 10 km from the CBD. StLucia Campus has over 33 major buildings, that is, buildings with GFA greater than 5000m2. It has over 60 smaller buildings. A wide range ofteaching, research, recreational and cultural activities is conducted on this campus.During 2010/11 consultants conducted Level 1 energy audits on nine buildings at St Lucia and a Level 2 energy audit on one building, J D StoryBuilding. The audits resulted in a large number of recommendations to improve energy use. Most covered lighting. In two of these buildings, the
One of UQ's hybrid vehicles

Queensland Biosciences Precinct and the Queensland Brian Institute, facility management personnel are exclusively assigned to the buildings andtherefore they had sufficient local knowledge to start the process of retrofitting new lighting.To facilitate implementation of the recommendations for the other audited buildings, detailed lighting surveys were carried out. This enabled theexact location of opportunities to be identified and scopes of work or retrofit specifications to be drawn up. Trials were conducted of different typesof lighting improvements ranging from installation of occupancy sensors to control lights through to retrofitting fluorescent tubes with more efficienttechnology. A full scale trial retrofit of one building, the JD Story Building was carried out. Scopes of work were prepared for the lighting retrofits ofthe other audited buildings. Retrofit of these buildings is planned for 2011/12.Having proven the system of lighting surveys, identification of specific opportunities and then carrying out implementation, a further 16 buildings onthe St Lucia Campus were surveyed in 2010/11. Some of these are scheduled for retrofit projects in 2011/12.Air conditioning at St Lucia is provided using chilled water produced in central chiller stations. St Lucia has 12 chiller stations serving multiplebuilding precincts and two stand alone installations – chillers that serve just a single building. Presently the largest chilled water precinct, the CentralPrecinct, has 12 buildings (soon to be 14) served by a single chiller station. Understanding the production, distribution and use of chilled water at StLucia, while challenging is essential to identifying efficiency opportunities.A building control company was commissioned to audit the performance of three of the largest chiller stations. This exercise led to a number ofrecommendations which are being considered. It also provided an energy and performance baseline for future work. As a result of the audits adecision was taken to install permanent electrical and chilled water metering on each chiller in the three chiller stations (eight chillers in total) andcreate a network to monitor real time performance.Following on from the chiller station audits, the University worked collaboratively with a consulting company and the local electricity distributioncompany, Energex, to explore opportunities for peak load reduction, or load shifting, on the Central Precinct.The most promising energy efficiency opportunity was the retrofit of high efficiency motors on the pumps that move chilled water through theCentral Precinct (see Figure 1 below). Over 95% of the lifecycle cost of a water pump is electricity supply. High efficiency motors can save so muchelectricity that it can make sense to swap out old motors (and recycle their components) even if they still have plenty of life left in them. Replacingold motors is scheduled for 2011/12. Thermal energy storage (TES) using chilled water was also during the study considered, but found to be verycostly. The use of phase change materials (other than water ice) to store energy is however, under ‐active consideration.The space heating component of air conditioning at St Lucia is provided by way of electric duct heating. There are innumerable ducts heatersdispersed throughout buildings. Their number and location means that electricity consumption is not metered and consequently it is hard to put thisform of electricity use in perspective and develop strategies for improvement. To deal with this issue the University worked with its building

management control provider to develop a way of using information in the Building Management System (BMS) to deduce electrical consumptionindirectly. A software template was developed and trialled in a building that had around 30 duct heaters. The results will be reviewed in 2011/12with a view to rolling out this approach across the campus.Finally, during 2010/11 the University commissioned an energy and comfort audit of the UQ Centre. The UQ Centre is the main graduation venue forthe University. Students, their parents, relatives and friends, senior academic staff and dignitaries attend graduations and this provides anopportunity to showcase the University. For a number of years parts of the UQ Centre have, however, been uncomfortably hot at times duringsummer. The consultants recommended a multipronged strategy to reduce heat loads and improve comfort: improved lighting to reduce internalheat loads; window film for the eastern windows to block out solar heat gain; and better maintenance of the air conditioning systems to enhanceenergy efficiency and service delivery. This work was successfully completed in 2011/12.

Toyota Energy and Greenhouse Gas EmissionsToyota Australia uses natural gas and electricity at its production site at Altona and at non production sites around Australia. The company monitors and reports on its energy use, looking for opportunities to improve efficiencies.It is a member of the Energy Efficiency Opportunities Program (EEO), a Federal Government program that requires large energy users to identify, evaluate and report publicly on cost effective energy savings opportunities. The EEO works on a five year cycle and Toyota Australia completed its first assessment cycle in 2011.Toyota Australia's two biggest sources of greenhouse emissions are gas and electricity. The company reports its greenhouse emissions in two ways.It reports greenhouse emissions associated with gas and electricity used at its production and non production sites for the Toyota Australia's financial year (1 April to 31 March). This information is used to measure performance against set targets.The company also reports its total greenhouse emissions as required by the Federal Government's National Energy and Greenhouse Reporting Scheme (NGERS). The NGERS report covers the period 1 July to 30 June.For the NGERS reporting period 1 June 2011 to 31 July 2012, total greenhouse emissions for Toyota Australia were 147,071t CO2-e. This was made up of 34,728t CO2-e scope one greenhouse emissions and 112,343t CO2-e scope two greenhouse emissions.The following section of the report details greenhouse emissions associated with gas and electricity at production and non production sites for 1 April 2011 to 31 March 2012. It also provides commentary about greenhouse emissions associated with the logistics of moving vehicles and parts around Australia and with business related air travel. Logistics are outsourced to specialised logistics providers, but greenhouse emissions are still monitored as part of Toyota Australia's commitment to reducing environmental impacts in the supply chain.
Production Energy and Greenhouse Gas EmissionsProduction greenhouse emissions are those associated with energy use at the manufacturing plant in Altona. The two key sources are electricity and gas.In 2011/2012, production greenhouse gas emissions (from electricity and gas) were 126,897 tonnes of carbon dioxide equivalent (t CO2-e) compared with 145,469t CO2-e for 2010/ 2011. Greenhouse from gas was 25,730t CO2-e and from electricity 101,167 t CO2-e.Corporate Affairs, Strategy and Environment is focused on whole of company sustainability and environment policy, carbon strategy, supporting government relations, the Environmental Management System, and dealer and supplier programs.Toyota Australia sets production CO2-e emission targets based on CO2-e produced per number of vehicles manufactured at the Altona plant. In 2011/2012 CO2-e per vehicle was 1.36 CO2-e compared with 1.28 CO2-e in 2010/2011.During 2011/ 2012 the total gas usage at the manufacturing plant was 502,540 gigajoules (GJ) and total electricity usage was 82,923.85 megawatt hours (MWh). This was a slight increase on 2010/ 2011 energy consumption and equated to 5.40 GJ of gas per vehicle manufactured and 891 kilowatt hours (kWh) of electricity per vehicle manufactured.The increase of CO2-e, electricity and gas per vehicle, when compared with the previous year, can be attributed to lower vehicle production output during the reporting period.

Toyota Australia continued to implement opportunities to reduce energy consumption and lower the manufacturing carbon footprint during 2011/2012.There was a continued focus on reducing Sunday energy consumption at the Altona plant. While Sundays are traditionally a non-manufacturing day, a number of operating activities still take place within the plant. The program focusses on shutting down equipment while it is not in use and utilising equipment appropriately, such as running one boiler instead of two. There has been a 46.20 per cent reduction in energy from 2006 to 2011 from 164 MWh in 2006 to 88.23 MWh in 2011 as a result of the program
As a result of raised awareness from the Sunday energy program, Toyota Australia has also been able to save energy during other non-operational days and times such as Saturdays, public holidays, shutdowns and Monday mornings prior to start up.There was also a focus on ensuring the correct equipment shut downs had occurred between 3am and 6am when production has stopped.In 2011/2012, the utility maintenance team continued to monitor and plot energy use focusing on gas consumption of boilers, electrical consumption of compressors and water consumption of the cooling towers and sludge pool. Trends and upper limits were established. Any abnormal data was further investigated leading to repairs and corrections that reduced usage.A new type of air conditioner was also installed in the new engine manufacturing plant. The air conditioner uses a gas combustion engine rather than electricity and is more energy efficient compared with a conventional type of air conditioner. This was initially trialed in the new weld shop office at the Altona manufacturing plant.
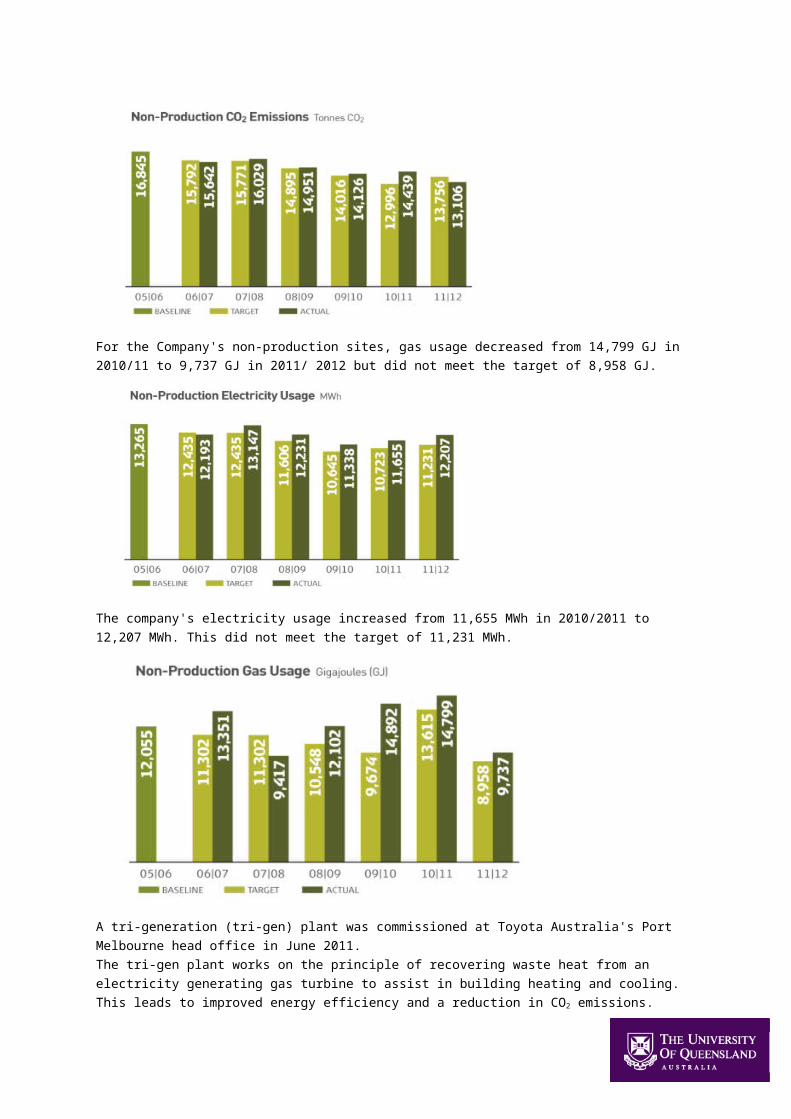
Non-Production Energy and Greenhouse Gas EmissionsToyota Australia reports greenhouse emissions from electricity and natural gas used at non-production locations (nine across Australia).Toyota Australia performed better than target for non production emissions in 2011/2012. Emissions were 13,106t CO2-e against a target of 13,756t CO2-e.This is an improvement on 2010/2011 results when 14,439t CO2-e was produced. In the previous sustainability report, 2010/2011 emissions were reported as 14,461 CO2 rather than 14,439, a slight change of 22 CO2.
For the Company's non-production sites, gas usage decreased from 14,799 GJ in 2010/11 to 9,737 GJ in 2011/ 2012 but did not meet the target of 8,958 GJ.

The company's electricity usage increased from 11,655 MWh in 2010/2011 to 12,207 MWh. This did not meet the target of 11,231 MWh.
A tri-generation (tri-gen) plant was commissioned at Toyota Australia's Port Melbourne head office in June 2011.The tri-gen plant works on the principle of recovering waste heat from an electricity generating gas turbine to assist in building heating and cooling. This leads to improved energy efficiency and a reduction in CO2 emissions.In the period June 2011 to March 2012 it resulted in a savings of 488.24t CO2-e.The project represents the conclusion of the $1.5 million energy improvement project at corporate headquarters which started in 2009 following $500,000 funding support from the Federal Government through the Green Building Fund.As well as the tri-gen plant, the project also included:
An upgrade of lighting in public and utility areas, replacing more than 400 light fittings from incandescent downlights to LED's.
An upgrade of the building management system to allow for better control of the heating and cooling systems.
Installation of energy sub metering to allow the building services and support team to quickly identify problems and areas of high use.
Vehicle and Parts LogisticsToyota Australia engages specialist logistics companies to transport vehicles and parts around Australia. While greenhouse emissions associated with these activities are scope three emissions for Toyota Australia, the company is committed to improving emissions associated with these aspects of the supply chain.Toyota Australia vehicle logistics continue to target greenhouse emissions through initiatives with key service providers. During the 2011/2012 period this included:
eliminating the need for fuel burn during loading and unloading by utilising power from a rechargeable cell continued focus on eco-driver practices investigation into better reporting and data capture
During the reporting period senior managers from different divisions within Toyota Australia, but all with responsibility for aspects of logistics, held an internal forum to determine possible benchmarking for environmental activities. Following the forum Toyota Australia engaged with one of its third party logistics providers to see if any of its practices could be implemented at Toyota Australia. Another initiative from the forum was the implementation of an internal web portal for sharing information and activities.

Business Air TravelToyota Australia monitors greenhouse emissions associated with business air travel. The company continued to promote alternatives to air travel, such as video conferencing, to support long term behavior changes that cut costs and CO2 emissions associated with travel.
Other emissions
National Pollutant InventoryToyota Australia prepares an annual report for the National Pollutant Inventory. The report details a range of emissions including sulphur dioxide emissions (298kg/year for 2011/2012), nitrogen oxide emissions (20,681kg/year for 2011/2012) and volatile organic compounds (446,912kg/year).
Volatile Organic CompoundsVolatile organic compounds (VOCs) are one of the key contributors to air pollution in the automotive industry. In vehicle manufacturing, VOCs are produced in processes that use solvents, paints, sealers or hydrocarbon-based chemicals. The largest source of VOC emissions for Toyota Australia is at its paint shop in Altona.Toyota Australia decreased its production paint VOC emissions for the last three years. In 2011/2012 emissions were 24.50 g/m2 compared with 26.31 g/m2 in 2010/11.The decrease in VOC emissions in the paint shop was due to an upgrade to the primer booth solvent collection system, enhanced data monitoring to track abnormalities, and maintaining the solvent recovery system and cleaning regime.
To monitor VOCs throughout the manufacturing process, Toyota Australia also set targets for VOCs in its bumper bar painting facilities. During the 2011/2012 year, bumper bar painting VOCs totalled 260.75g/m2 down from 312g/m2 in 2010/2011.Toyota Australia includes greenhouse emissions associated with VOCs in its annual NGERS report.

The Body Shop 2009/10 Greenhouse Gas Emissions Report
The Body Shop Australia's total Scope 1 & 2 C02-e emissions for FY 2009/10 was 3,225 tonnes or 3.2 kilo tonnes.
This covers our Retail, Online and At Home Party Plan channels in our Australian* offices, stores and warehouse. The graph below shows where our emissions come from.
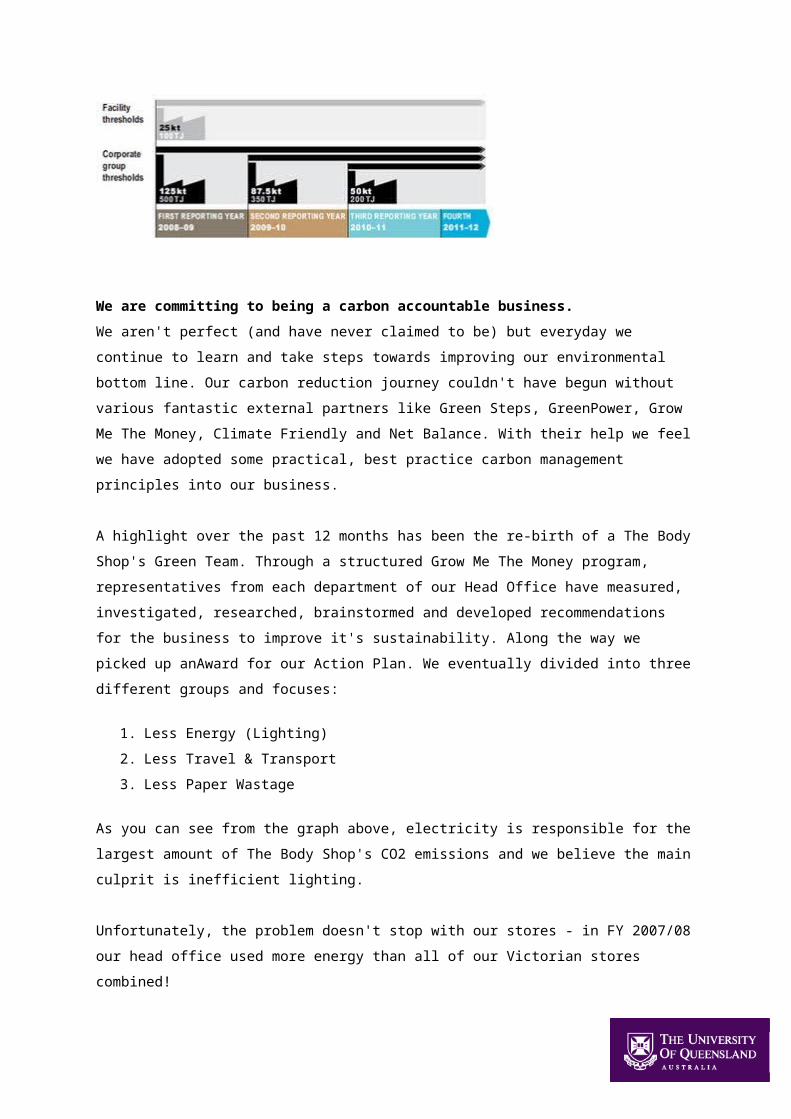
Our total emissions puts us well under the Federal Government's mandatory reporting threshold of 87.5 kilo tonnes (see below diagram of Government Thresholds)
Despite being under the legal reporting requirement, The Body Shop is committed to our core value to PROTECT OUR PLANET so we have decided to pursue strong voluntary actions to reduce our carbon footprint.
We are committing to being a carbon accountable business. We aren't perfect (and have never claimed to be) but everyday we continue to learn and take steps towards improving our environmental bottom line. Our carbon reduction journey couldn't have begun without various fantastic external partners like Green Steps, GreenPower, Grow Me The Money, Climate Friendly and Net Balance. With their help we feel we have adopted some practical, best practice carbon management principles into our business.
A highlight over the past 12 months has been the re-birth of a The Body Shop's Green Team. Through a structured Grow Me The Money program, representatives from each department of our Head Office have measured, investigated, researched, brainstormed and developed recommendations for the business to improve it's sustainability. Along the way we picked up anAward for our Action Plan. We eventually divided into three different groups and focuses:
1. Less Energy (Lighting)2. Less Travel & Transport3. Less Paper Wastage
As you can see from the graph above, electricity is responsible for the largest amount of The Body Shop's CO2 emissions and we believe the main culprit is inefficient lighting.
Unfortunately, the problem doesn't stop with our stores - in FY 2007/08 our head office used more energy than all of our Victorian stores combined!
So reducing electricity usage is clearly our biggest carbon problem but also our biggest opportunity. We are genuinely excited about the challenge in front of us to reduce.

Another problem we discovered along the way is that we currently don't recycle any of our lighting - this is a major concern as spent lighting products are the largest source of mercury contamination in municipal landfills. Did you know Australia dumps more than 2000 kg of waste Mercury annually and it's estimated to increase. Government, if you're reading this, we desperately need legislation here as only 1% of fluros are recycled responsibly!
Approved Green Team Recommendations for Action!
Review and overhaul lighting procurement & maintenance procedures for stores and offices.
Recycle all fluorescent lights used by The Body Shop Australia to avoid Mercury going to landfill.
Replace metal halide lights in Warehouse with low emission fluorescent globes.
Phase out all incandescent and energy inefficient lighting at Head Office Trial "the mock shop" and upcoming new store fit-outs with new generation
fluorescent or LED Lighting .
2. Less Travel & Transport

Transport and Air Travel are the second largest contributors to The Body Shop’s CO2 emissions. We're particularly keen to work out ways to reduce the number of flights and our Green Team have come up with the following ideas
Approved Green Team Recommendations for Action!
Fuel Efficient Car Purchase and Hire policy. (Already purchased 3 Toyota Priuses)
Design & implement a car pooling program at Head Office Review and update Travel Request form to include “Reasons for Travel” Carbon emissions included in quarterly air travel report (department based) Roll into the “Computers in Store” Feasibility Project Feb 2011 – proposal to
trial video conferencing to possibly reduce number of flights needed. Continue to work with freight & postage suppliers to better understand our
carbon footprint in relation to product transport. Work out a sustainable percentage of C02 emissions from flights we can
afford to offset annually.
3. Less Paper Wastage

Sadly, our Head Office uses a lot of paper.
This is due to:
paper intensive business practices, stores not having computers (making most comms paper based) and paper towels in our bathrooms!
Not sure how this compares with other businesses out there, but we used approx 110 trees worth of paper on FY2009/10.
The advent of new generation hand dryers is an exciting discovery and like most environmental improvements they have good economic advantages as well. We calculated that installing brand new hand dryers, costs the equivalent to a year's supply of paper towels... not to mention we'll be saving 2.25 C02-e tonnes a year.
It's funny how once you start digging you find out easy-to-fix problems which can reduce your scope 3 (supplier's) C02 emissions, through wiser business purchasing choices. For example we discovered our current model of paper towel comes from Canadian forests and are pulped in China!
Approved Green Team Recommendations for Action!
Replace / install new generation hand dryers and remove paper towels from all bathrooms.
Switch to a model of Caprice paper towel for the kitchenette, training etc to one grown & pulped in Australia for a reduced carbon footprint.
Appoint Green Team member as our first official Chief Office Paper Cutter – she will conduct workshops and empower teams to create their own paper reduction plans in the coming months. Rewards for team who reduce their paper usage the most.
“Computers in Store” Feasibility Project group commences Feb 2011.
OffsettingSince 2007 we've been offsetting our electricity with 100% GreenPower accredited renewable wind energy projects. In 2010 we will be extending our offsets to cover our Scope 1 and 2 C02-e emissions and switch to using 100% Gold Standard renewable energy offsets - which are considered world's best standard. Stay tuned for more on that!So the great news is that for FY2009/10 we are/ were what they consider to be "carbon neutral". However we know the job is never done and we want future Green Teams to continue to identify ways of avoiding and reducing all of The Body Shop Australia's C02 emissions including those in Scope 3.
* The Body Shop Australia's carbon accounting begins when The Body Shop International products arrive
in Australia by ship or air. We believe the sourcing the ingredients, manufacture of products, packaging
and transportation to Australia are covered by The Body Shop International.

Microsoft
Becoming Carbon NeutralAt Microsoft, we believe that we have a responsibility to minimize our impact on the environment, and so we have made a commitment to become carbon neutral1 beginning in our fiscal year (FY) 20132 for our data centers, software development labs, offices, and employee air travel. The measures that we will put in place to achieve carbon neutrality are intended to lessen our environmental footprint while also helping us to manage risk, increase efficiency, and support the growth of our business.
Strategic pillar #1: Be lean

Being efficient in our operations is foundational to our environmental sustainability approach. Our “be lean” strategy pillar is about using technology to increase energy efficiency and decrease our reliance on air travel. Driving energy efficiencies in our facilities The use of electricity is the primary source of carbon emissions from our internal operations. Microsoft has a number of initiatives to help reduce energy consumption in our data centers, software development labs, and offices.
Data centers Key metrics: We are evolving our targets for power usage effectiveness (PUE), carbon usage effectiveness (CUE), water usage effectiveness (WUE), and server utilization rates. Our average power usage effectiveness (PUE, a measure of energy efficiency) in 2011 was 1.40 across all of our cloud infrastructure properties, compared with an estimated industry average of 2.0 (the theoretical best achievable PUE is 1.0). Our goal by the end of 2012 is to construct new data centers that average 1.125 PUE and use 30–50 percent less energy than traditional industry data centers. Some examples of how we are improving the efficiency of our existing and new data centers include: Increasing the efficiency of our cooling systems. For example: Our Dublin, Ireland, Des Moines, Iowa, and Boydton, Virginia, facilities use outside air and airside economizers for cooling. The Dublin data center maintains a PUE of 1.25 while also improving energy efficiency by approximately 50 percent and using only 1 percent of the annual water consumption of a traditional industry data center. Our Chicago, Illinois, data center uses water-side economizers, which enable us to cool the facility without requiring the high levels of electricity typically needed to power large chillers. Operating our servers at higher temperatures—within the range specified by the manufacturer but higher than is typical—so that we can use free air cooling instead of extensive air conditioning. Retrofitting our existing data centers with more efficient systems, such as custom LED lighting, economizers, compressor energy reduction, and HVAC (heating, ventilation, and air conditioning) containment and airflow reduction systems.
Software Development Labs Key metric: We are evaluating energy efficiency targets for our labs. In 2010, we completed a highly efficient, centrally managed facility called Redmond Ridge 1 that uses 27 percent less energy and creates 27 percent less carbon than our decentralized labs. Over 26,000 servers were moved to this facility from less efficient labs in office buildings. With a hot aisle containment design, 48 airside economizers, and a focus on server virtualization, the facility has reduced the carbon footprint from our Puget Sound, Washington, lab infrastructure by 4.4 percent while using 90 percent less water than a similarly sized facility using air conditioning. It has a PUE of 1.16. Our carbon neutral commitment and carbon fee model will provide an incentive for product groups to increase their use of this more efficient facility (versus their own labs in office buildings). As an additional financial incentive, to encourage software development teams to consider the energy implications of their work, last year we also implemented a program in Puget Sound to charge energy costs back to the product groups based on their actual energy usage. This program will help encourage product groups to take advantage of the efficiency afforded by Redmond Ridge 1 and the reduced energy consumption of virtual machines. By combining this with a carbon fee, we expect to accelerate our efficiency gains.
Offices Key metric: We are evaluating a target based on emissions per housed employee per square foot. “Housed employee” reflects both employees and contractors assigned a physical office location. Managing our use of energy within our office buildings starts with being efficient at detecting and diagnosing faults and responding to alarms. Being able to identify when

critical equipment will or has failed helps us keep systems running efficiently and makes our energy use more predictable. In 2011, Microsoft initiated an energy-smart building management system pilot on our Redmond, Washington, campus. Currently, this campus represents 15 million square feet of space across 118 buildings and includes 35,000 pieces of mechanical equipment generating 500 million data points daily. The pilot aimed to tie our buildings together with a single software-based solution that required no physical retrofit of building equipment and no disruption to building occupants. This same system is being used to feed real-time data to our enterprise performance management system. Based on the results of this pilot, we expect an additional 6–10 percent energy savings across the campus on top of the savings that we have already achieved through physical infrastructure renovations. We have begun implementing building energy management technology in additional locations around the world. To learn more about our pilot and energy-smart buildings, download our Energy-Smart Buildings white paper. In addition to energy-smart building management, we also continually look for opportunities to reduce energy use in our offices. For example: In FY2011, we reduced energy consumption for our Puget Sound, Washington, facilities by 3.8 percent through our Energy Conservation Measures (ECM) program, which includes initiatives to retrofit buildings with more efficient lighting and mechanical equipment. Individual subsidiaries run their own programs as well. Our subsidiary in Ireland recently reduced emissions from its operations by over 50 percent, earning it the Microsoft FY11 Global Environmental Action Award, and our subsidiary in The Netherlands has reduced carbon emissions by 30 percent per employee in the last year.
We are also implementing policies and solutions that will reduce the energy consumption of the IT systems that our employees use every day. For example, we are using a life-cycle management approach to ensure that employee PCs and peripherals: Are designed for efficiency (meet ENERGY STAR, Climate Savers, and EPEAT requirements) Operate efficiently and consume power only when needed Are disposed of responsibly
In addition, using the power-saving capabilities built into Windows 7 and the ability to manage the Windows desktop using Microsoft System Center, we reduced our PC energy consumption by more than 32 percent in FY2011—an annual savings of $956,000 and 10.62 million kilowatt hours (kWh) in energy—with little to no impact on users. The carbon reduction from this is equivalent to removing about 2,000 passenger vehicles from the road for one year.
Reducing air travel Key metric: We are evaluating a target based on air travel miles per employee. We are increasing our use of Microsoft collaboration technology as an alternative to traveling for meetings. Using the unified communications capabilities in Microsoft Lync with the collaboration capabilities built into Microsoft Office and Microsoft SharePoint helps us reduce our use of air travel, particularly for internal meetings and conferences. Our policy is that air travel should be considered a last option for meetings with colleagues and partners. The corporate travel policy provides the following guidance to employees: Microsoft expects employees and managers to carefully evaluate the business benefit of traveling before incurring travel expenses. Microsoft expects employees and managers to consider the impact on the environment before booking travel. The average business trip generates more than 2,200 pounds (or more than 1 metric ton) of carbon. Employees are encouraged to examine low-cost alternatives, such as using Lync. For a richer and more lifelike virtual meeting experience, Microsoft has also invested in Telepresence rooms in major business hubs such as Seattle, Reading, Beijing, and

Hyderabad. These rooms can provide the feel of a face-to-face meeting without the cost and time lost due to travel. There is no cost to the business user to use Telepresence rooms.
Since 2007, increased use of our collaboration products and operational control measures have helped us reduce our carbon footprint from air travel by more than 30,000 metric tons.
Strategic pillar #2: Be green Microsoft is committed to increasing our purchase of renewable energy and reducing waste and water use.
Investing in renewable energy and offset projects Emissions associated with electricity consumption represent a significant portion of our greenhouse gas (GHG) emissions. Furthermore, although our cloud services should reduce the net energy consumption and emissions associated with the use of our technology globally, as we absorb computational workloads from less efficient sources, Microsoft will become an increasingly energy-intensive company. It is essential that we take measures to reduce the emissions impact of this energy intensity. We recognize that we will need to look to industry expertise and research to ensure that we are using the best technology and strategies available. While the first step is to reduce our consumption through energy conservation and efficiency improvements, another important factor is the source of the energy that we purchase. We have purchased renewable energy certificates (RECs) and carbon offsets, and we are expanding our scope where possible into the regions in which we have data centers, labs, and offices. For the purchase of renewable energy, we prioritize: Credibility―Is the project well managed and funded? Verifiability―Does the project offer certified and independent verification for claims and retirement? For example, does a renewable energy project conform to the GHG Protocol Power Accounting Guidelines? Additionality―Will the project lead to net-new emissions reductions? Will it reduce global GHG emissions?
As we transition away from non-renewable energy, we are considering a portfolio of approaches, including: Signing long-term renewable power purchase agreements—We are investigating options for signing long-term, fixed-price renewable power purchase agreements to both support renewable energy projects and provide a hedge against rising energy prices. Investing capital in new renewable energy projects—We are evaluating investments to support the supply of new renewable energy within the right environment. For example, we are considering investing in wind farm and methane-capture projects. Connecting data centers directly to innovative energy sources—We are considering a pilot for on-site renewable energy generation, such as methane-powered fuel cells. By consuming the zero-emissions output from these alternative energy sources, we can directly reduce the amount of electricity that we purchase from the commercial electrical grid.
We are engaging in discussions with some of the top global power generation companies to help us identify and execute low-carbon energy projects. In addition, as we seek to identify the most promising technology for use in the data center environment (for example, distributed generation, battery storage), we are also partnering with research institutions and the venture capital community, with the goal of providing both capital and an environment for prototyping new technology.

Establishing reduction goals for waste and water We have a number of initiatives across our company to reduce our waste and water use. For example: Each month we recycle an average of 673,360 pounds (or 305 metric tons) of material at our Puget Sound campus, including glass, plastic, aluminum, electronics, cardboard, paper, organic waste, wood pallets, and copper wire. In FY2011, we increased our total waste diversion rate from 63 percent to more than 80 percent overall and 95 percent within our dining facilities, helping us to win the 2012 Washington State Recyclers Association (WSRA) Recycler of the Year award. We have a goal to reach zero cafeteria waste at our corporate headquarters by 2015. In the second half of 2011, we recycled or reused the equivalent of over 3 million pounds (or 1,480 metric tons) of technology hardware in the United States. To cover the costs of recycling the electronic hardware used in our operations, we are implementing a recycling fee that will be charged to our business groups at the time of future equipment purchases. We have a zero landfill policy for retired technology hardware in the United States, and we are expanding our technology recycling program to other large sites outside of the United States, starting with Canada, Ireland, The Netherlands, and the United Kingdom. So far, our PC recycling program has removed 394,000 pounds (or 179 metric tons) of e-waste from the solid waste stream, equal to the waste from 123 US households in a year. To better manage these efforts, we are currently implementing a centrally managed IT asset disposition (ITAD) program that will consolidate the many hardware recycling programs in place at Microsoft locations around the world. We are working continuously to reduce the impact of our data centers. With our latest designs, our new data centers use only 1 percent of the water used by traditional data centers in the industry. In FY2011, we added water use to our corporate inventory and reporting system and will be setting reduction goals to more effectively manage our water consumption.
We track our progress against our waste and water use reduction goals on a quarterly basis.
Strategic pillar #3: Be accountable Our first two strategic pillars address the need to increase our efficiency and make our operations more “green.” Our third strategic pillar focuses on the critical element of accountability across the business. Setting a price signal to internalize the external impact of our operations Internally at Microsoft, we have established a price for carbon—reflecting true cost accounting—that will provide a new perspective on the cost of emissions. For instance, with this model, the internal cost for electricity use includes not only the price we pay the utility for electricity, but also the price we pay to offset the carbon emissions associated with our electricity use. For air travel, the cost includes not only the price we pay the airline for the airplane ticket, but also the price we pay to offset the carbon emissions associated with the flight. By embedding the cost of carbon in our financial systems, we have a direct way to measure and drive behavior change in a company-wide, systems-based way. When a potential emissions reduction project costs less than the fee for the carbon that would otherwise be emitted, it encourages responsible―and sustainable―business decisions.

IKEA
http://www.ikea.com/ms/en_AU/pdf/sustainability_report/group_approach_sustainability_fy11.pdf
http://www.ikea.com/ms/en_AU/about_ikea/our_responsibility/climate_change/
IKEA Goes RenewableIKEA aims to improve overall energy efficiency by 25 percent compared to 2005, in all IKEA stores, distribution centres, factories and offices. What’s more, our long-term direction is that all IKEA units will run entirely on renewable energy instead of fossil fuels.
We have decided to install photovoltaic (solar) panels to turn sunshine into electricity in around 150 stores and distribution centres over the next few years. The panels will provide these buildings with 10-25 percent of their electricity need.
Efficient transport of productsGoods transport by road, rail and sea between suppliers, distribution centres and stores account for a large portion of carbon dioxide emissions from IKEA operations. So it’s important to pack every container and every truck as full as possible so that we transport only a minimum amount of air.
Another important factor is to use transport service providers that meet our environmental criteria. This is why they must use modern vehicles, have concrete emission targets and measure their CO2 emissions.
Efficient transport of peopleIKEA wants to make it easier for customers and co-workers to leave their cars at home and use public transport to travel to and from our stores. When we plan a new IKEA store, good public transport is an important consideration, and in many cities we offer free shuttle buses between the city centre and the store. Some stores offer environmentally friendly home delivery of goods purchased.
IKEA also cooperates with WWF to develop more climate-friendly people transport solutions in the future.
Energy efficiency at IKEA suppliersIKEA is developing tools for increased energy efficiency at suppliers. We believe we can help suppliers reduce their energy consumption and their energy costs, which in turn will make them more competitive.
In addition, IKEA and WWF run joint pilot projects with suppliers in Poland, Sweden and China to support energy efficiency and encourage the use of renewable energy to reduce CO2 emissions.
A more sustainable life at homeIKEA strives to offer products and know-how that enable our customers to live a
more sustainable life at home by saving energy and water and minimising household waste – simple measures that also saves on household expenses.
Together with our customers, we can make a difference and reduce our overall climate impact. Working in partnership with WWF, our initial focus is on solutions for kitchens, waste management and lighting.
Climate projects with WWFIKEA cooperates with WWF on a number of projects to tackle climate change. The ambition is to identify and act on opportunities in the entire value chain, from raw material extraction to recycling IKEA products at the end of their life-cycle, and to help our customers become more climate smart.
IKEA Reduces CO2 Emissions by 5%http://www.environmentalleader.com/2010/05/19/ikea-reduces-co2-emissions-by-5/
IKEA has reduced its total CO2 emissions by 5 percent and CO2 emissions from goods transport by 10 percent in fiscal year 2009 compared to the previous year, according to the company’s 2009 Sustainability Report. Ninety-five percent of the home furnishing retailer’s CO2 emissions is attributed to material extraction, suppliers, customer transportation and the use of products.In 2010, IKEA will participate in the Greenhouse Gas Protocol by road testing a new global framework for measuring greenhouse gas (GHG) emissions.
IKEA also is committed to reducing emissions in its supply chain. A pilot program is in place to help suppliers reduce their energy use by 30 percent or more by 2011, focusing on the largest suppliers with the highest energy consumption. As an example, in China, two glass suppliers have already reduced their carbon footprint and energy consumption by more than 40 percent.
IKEA also is expanding its effort with four new climate change projects with WWF. These projects will focus on measuring supply chain emissions, helping customers address climate change through transport initiatives, reducing emissions from IKEA food product transport, and improving the reuse and recycling of used products.
IKEA and WWF are also partnering on sustainable cotton projects. In 2008, IKEA and WWF projects generated 34,000 tonnes of cotton grown in a more sustainable manner, and IKEA suppliers bought 12,500 tonnes for use in IKEA products. In 2009, the total available volume was 150,000 tonnes and IKEA suppliers bought 23,000 tonnes (the target was 50,000 tonnes).
The retailer also has partnered with American Forests to plant more than 1.3 million trees in U.S. parks and forest.

During FY09, only IKEA distribution centers reached their recycling goal of 90 percent. Swedwood, the industrial unit of the retailer, and IKEA stores recycled, reclaimed or used 74 percent and 86 percent of their waste, respectively.
The amount of renewable materials used in IKEA products remained relatively stable at 71 percent, missing its goal to reach 75 percent in FY09. However, the company has separate targets for two key raw materials — wood and cotton.
Swedwood has all of its forest leases certified and is close to having implemented chain-of-custody certification in all its industrial units, which has increased IKEA’s share of FSC-certified wood from 7 percent to 16 percent. However, IKEA did not reach the target of 30 percent of solid wood from verified responsibly managed forests by FY09. The new goal is to reach a 35 percent share of wood from forests certified as responsibly managed by 2012.During the year, IKEA used about 21 percent less solid wood compared with FY08, which is attributed to the company’s increased use of board material instead of solid wood.
The retailer’s approved wood supply chain audits have increased from 80 percent to 92 percent with almost all wood suppliers now complying with the retailers’ minimum requirements.
The company is also implementing measures to reduce water consumption during manufacturing. As an example, IKEA is implementing a printing technique called Soft Pigment Printing (SPP) that reduces water consumption by 60 percent compared to traditional printing techniques. Today, 40 percent of its printed textile products are produced with techniques that require less water.
To help meet its long-term goal of powering all IKEA buildings with 100 percent renewable energy, the company has plans for several solar panel projects in eight countries over the next four years. The solar panels for up to 150 stores and distribution centers are expected to provide about 10 percent of their electricity need. For distribution centers, it may be as high as 25 percent since they use less electricity, says IKEA.
Today, only nine IKEA buildings have solar panels installed with the plan to reach 30 to 40 buildings by the end of FY11.
IKEA recently announced the addition of solar panels to its retail store in Tempe, Arizona, that will generate about one million kWh of electricity.The company is also working to use alternative energy sources for heating such as ground source heat pumps, air heat pumps, biomass boilers and solar panels, and is progressing on its alternative fuel project for transport service providers.

Reducing emissions throughout the value chainIKEA wants to reduce carbon dioxide emissions from all aspects ofour operations, including raw material extraction, product manufacturing,transportation, energy usage in IKEA buildings, how peopleare transported to our stores, the use of our products in customers’homes, and finally at the end of a product’s life-cycle. This is a greatchallenge, but IKEA is making progress.
Reducing emissions from our own buildingsOur long-term goal is that all IKEA buildings shall be powered using100 percent renewable energy. We also work to improve our overallenergy efficiency.IKEA defines renewable energy as energy derived from resourcesthat are regenerated naturally or cannot be depleted. IKEA has decidednot to pay premium prices for grid electricity from renewable sources.This is one of the reasons why IKEA invests in alternative solutions, suchas solar panel systems and wind turbines, to supply its buildings withrenewable electricity. Investments in more sustainable energy solutionsoften represent significant cost savings and relatively short pay-backperiods.Each IKEA market is responsible for reducing carbon dioxide emissionsfrom its buildings and for increasing its use of renewableenergy. National management teams are supported by experts andfacilitators, as well as coordinators at each local unit. Many marketsalso cooperate with WWF, and with retailers in the European Retail Round Table (ERRT) to improve energy efficiency and reduce emissions.IKEA has standards for the most important building components ofstores, and specifies a range of energy efficient measures for newIKEA buildings. Space and water heating for new-builds come frommore sustainable sources whenever possible. This is done usingground source heat pumps, air heat pumps, biomass boilers and solarpanels.Cooperating with suppliers to reduce energy use and emissionsAll IKEA suppliers must have plans in place to reduce the environmentalimpacts from their production and operations. They must workto reduce their energy consumption and prevent pollution.IKEA and key suppliers work together in energy projects with thegoal of reducing consumption and carbon dioxide emissions, whilealso saving costs and increasing competitiveness.
Striving for more efficient goods transportIKEA has strived for innovative and efficient transport solutions forour products ever since the early 1950s. Effective distribution in theentire goods flow from supplier to customer is an important aspect ofachieving a low price, and to minimise the environmental impact fromtransport.IKEA products are purchased both globally and regionally to securelow prices and high quality while also trying to avoid unnecessarytransport. We use direct deliveries from suppliers to stores to a largeextent, and try to minimise goods going into intermediate storage indistribution centres.We choose rail transport where possible, and where this is themore environmentally adapted option. Truck and container loads areoptimised to maximise fill rates and minimise the number of transports,

and we work actively with transport service providers to reducetheir environmental footprint.Smart packaging is the most effective way to reduce the environmentalimpact from goods transport. Already at the drawing table,designers and product developers include considerations to packagingsolutions as part of their assignment. Product packaging is optimisedto increase filling rates.IKEA works to increase the awareness along the value chain. EachIKEA trading area has a filling rate coordinator, and analysis tools andtraining packages are available for all.
Helping co-workers meet and travel with less emissionsThere has been a substantial shift from business travel to virtualmeetings via video, web and phone over the past few years. Regulartraining and information sessions are being held in all locations toencourage use and make sure participants get the best possibleexperience from virtual meetings.When business travel is needed, IKEA co-workers can makeinformed choices of local travel alternatives to and from IKEA units.When searching for information on the IKEA Intranet on how to getto a specific location, the CO2 footprint for the various alternativessuch as cars, trains and buses are listed.In close cooperation with our travel agencies, the work to improvethe CO2 reporting and information on air travel is on-going, both on acorporate and individual trip level.
Energy use at suppliersThis project focuses on Poland and China. The aim is to identify specific barriers and develop relevant strategies to remove barriers preventingus from proceeding faster to a low carbon supply chain as wellas to develop and run specific actions. We explore what needs to happenat IKEA and what needs to happen externally, for example whenit comes to infrastructure and legislation, and develop an innovationplatform on how to improve energy efficiency.
Sustainable life at homeThis project aims at identifying smart products and services that IKEAcan offer to help our customers live a more sustainable life at home,and at increasing customer and co-worker awareness of how theirbehaviour can help to reduce climate impact.
Climate perspective on food productsThis project aims at finding ways of adapting the IKEA food range tobe more sustainable, with a special focus on the climate. The initialgoal is to identify short-term greenhouse gas reduction potentials.The next step is to initiate and implement actions to reduce the climateimpact from all food-related operations and outline a strategyfor long-term adaptation of the IKEA food business. A research projecthas been commissioned, working with independent experts, to identifya potential food range for 2020 that has a more low carbon, sustainablefocus.
Closing the loops

This project investigates the opportunities for full recyclability of different materials used in IKEA products, and how cyclic systems can save scarce natural resources and minimise CO2 emissions. It explores howto close material loops, with specific focus on recyclable products and use of recycled materials in new products. We hope to find new and innovative ways to handle materials, and investigate aspects of fullrecyclability and how cyclic systems can save natural resources, minimise CO2 emissions and optimally have a positive impact on the environment.
David JonesCommitment to Environmental Sustainability
The next evolution of our Environment Strategy aims to engage our shareholders, customers,
employees and suppliers to ensure that our business model is environmentally sustainable by
July 2016.
At the heart of this strategy is a commitment to continually improve environmental outcomes by
reducing greenhouse gas emissions, protecting and conserving natural resources, and
optimising water use.
The strategy also aims to improve the level of engagement and reporting. We recognise the need
to disclose our environmental performance to the community and the role that our various
stakeholders will play in realising our goals.
IMPROVING ENVIRONMENTAL OUTCOMES
Reducing Greenhouse Gas Emissions
David Jones has already reduced greenhouse gas emissions by 24% and will continue to invest
in energy savings projects and encourage behavioural change to eliminate unnecessary use of
electricity. We will also continue to monitor and reduce emissions from our fleet of shuttle trucks
and refrigerant gases used in air conditioning and refrigeration.
Protecting and Conserving Natural Resources
David Jones has reduced the amount of waste sent to landfill more than 50% and plans to deliver
further reductions by improving our existing recycling programs and working with suppliers to
influence packaging design. We are also looking at how we use paper in our business and
considering alternatives to single-use carry bags. Customers can help by understanding how and

where they can recycle packaging, including our plastic bags, by downloading this Information
Sheet.
Optimising Water Use
In comparison to other retailers, David Jones is a relatively small consumer of water. While we
plan to continue investing in water saving technology, our short-term aim is to actively track and
repair any leaks from our 1,000 taps and toilets, and 50 cooling towers.
ENGAGING OUR STAKEHOLDERS
Engaging Our Employees
We recognise the value that employees place on working for an environmentally responsible
organisation. Our new “rethink” campaign aims to increase awareness of our environmental
programs but also motivate behavioural change to ensure that 9,000 employees integrate
sustainability into decision-making.
Engaging Our Customers
Our customers expect David Jones to be environmentally responsible and to demonstrate our
commitment to the environment in actions, not words. We plan to engage our customers by
involving them in a number of key campaigns, to help demonstrate what we are doing, rather
than what we plan to do.
Engaging Our Suppliers
Our suppliers will play a key role in working towards an environmentally sustainable business
model. We have already implemented new “green” procurement principles for our business
purchases, and plan to engage our merchandise suppliers on a range of sustainability
challenges as we continue discussions in relation to the Australian Packaging Covenant.
Engaging Our Investors
We will continue to engage our shareholders and the broader investment community through our
disclosure program. However, there is also a trend to expand sustainability programs beyond
direct environmental impacts and so we plan to consult with investors to understand how the
“big-picture” themes on sustainable development may affect David Jones.

REPORTING OUR PERFORMANCE
Annual Report
To communicate our environmental impacts and initiatives to interested stakeholders, David
Jones publishes an Environment Report in our Annual Report.
Australian Packaging Covenant
David Jones first became a signatory to the National Packaging Covenant in 2003 and will
continue to support the objectives and principles of the new Australian Packaging Covenant:
National Greenhouse and Energy Reporting (NGER) Act
David Jones has an obligation to report under the National Greenhouse and Energy Reporting
scheme.
Carbon Disclosure Project (CDP)
David Jones participates in the Carbon Disclosure Project and was recognised in 2010 as one of
Australia’s Top-30 listed companies for carbon disclosure on the Carbon Disclosure Leadership
Index (CDLI).
David Jones-Carbon Disclosure Project Information RequestDavid Jones Limited is an ASX 200 Australian retailer with earnings from its core department store business of AUD198.8 million in FY11 and a further AUD47.7 million from its complementary financial services business. The Company employs over 9,000 people and (as of February 2011) operates 36 department stores in key metropolitan and suburban centres in and around Sydney, Melbourne, Brisbane, Adelaide, Perth and Canberra.
David Jones is uniquely positioned in Australia’s retail sector, with a loyal customer base and a broad range of national and international brands across categories, including: womenswear, menswear and childrenswear; shoes and accessories; fragrances and beauty; homewares, bedding and furniture, appliances, home entertainment and home office; and a high-end food and liquor offer in selected stores.
As a good corporate citizen, David Jones is committed to managing its operations in an environmentally sustainable manner, through investment in efficiency measures that reduce the impact that the business has on the environment, and by developing robust management systems to ensure transparency and confidence in environmental reporting. This commitment is in recognition of David Jones’ responsibilities to its shareholders, employees and customers, and aligns with expectations held by government and the broader community.
This is David Jones’ third submission to the Carbon Disclosure Project (CDP) and demonstrates the Company’s commitment to improved transparency and disclosure in relation its response to climate change. Providing information to the market, through the CDP mechanism, forms a key component of the Company’s environment strategy, which has four strategic objectives:
1. Improving environmental outcomes, by investing in efficiency measures and driving behavioural change;
2. Reporting environmental performance;
3. Ensuring that interested stakeholders are able to access information about David Jones’ environmental impacts and initiatives; and
4. Driving cultural change across the business, to ensure that 9,000 employees incorporate environmental sustainability into decision making.
This submission covers the 12 months ended June 2011 (FY11) and discloses David Jones’ Absolute Scope 1 and Scope 2 emissions from its retail operations, warehousing facilities and logistics activities, as per the standard definition of operational control.After lodging its first submission to the CDP in 2010, David Jones was recognised on the Australian Carbon Disclosure Leadership Index (CDLI) and is pleased to maintain its association with the CDP.


Coca Cola
Coca-Cola Amatil (CCA) in Australia, has been voluntarily reporting carbon emissions and identifying opportunities to reduce them since 1999 as part of the Australian Government's Greenhouse Challenge. It is now mandatory through the National Greenhouse and Energy Reporting (NGER) scheme.CCA also participates in the global Carbon Disclosure Project and, since 2007, have been included in the Australia/New Zealand Goldman Sachs JBWere Climate Leaders Index. This index recognises leadership in disclosure to the investment community across a range of relevant climate change issues. CCA was placed in the Top 25 of 141 ASX100 and New Zealand X50 participating companies.While water savings remain a priority, energy management and climate protection is also a focus area. Advancing our energy efficiency and stabilising our emissions continues to help us reduce costs and minimise our impact. CCA is working hard to understand and measure how all aspects of climate change are affecting our business. Our strategy is to:
Accelerate the implementation of energy saving projects and energy awareness Reduce our direct carbon impacts Increase our focus on co-operative activities with our customers and suppliers
in AustraliaSince 2008, Coca-Cola Amatil has initiated a number of energy reduction projects at its Australian and New Zealand operations. These include:
The installation of a new pasteuriser for Keri Juice in Auckland, which is currently saving 50 tonnes of CO2 per year.
The start of a filling optimisation project at Richlands, Queensland, saving 807 tonnes of CO2 per year.
The building of new air compressors in the Northmead and Smithfield plants, New South Wales, saving a total of 588 tonnes of CO2 per year.
A power correction at Thebarton, South Australia, saving 333 tonnes of CO2 per year.
Installation of solar hot water at both our Northmead and Eastern Creek distribution centres.
Purchase of 2.5% Greenpower at the Richlands operations in Queensland in order to offset emissions by 411 tones of CO2 per annum.
In 2007, the Kings Cross Coca-Cola sign was switched off intentionally for WWF Earth Hour for the first time since 1974. 2008, 2009 and 2010 saw us continue our support for WWF Earth Hour by switching off the Kings Cross Coca-Cola sign each year.

Often small changes make a big difference. For example, in our Sydney-based, national contact centre, basic lighting controls resulted in a 30% reduction in power used in our fluorescent lighting levels. Not only did this mean fewer CO2 emissions (102 tonnes less) but also a $10,000 energy bills saving. Best of all, the company that provided the technology planted 102 trees in recognition of our achievement.
Refrigeration
Cold drink equipment is critical for our business - it also represents a significant source of indirect carbon emissions. Because of these we're continuing to work on a number of projects that seek to improve the energy efficiency of our fridges.The Coca-Cola Company was the first to introduce two major refrigeration initiatives:
All new equipment must contain Hydro Fluorocarbon (HFC) free insulation, which can avoid up to three-quarters of the direct (greenhouse gas) emissions compared to our old equipment.
Development and implementation of our own special energy-saving device, Energy Management System 55 (EMS-55), that now delivers energy savings of up to 35%.
Our EMS-55 'smart' controllers can sense changes in the local environment and react to usage patterns, reducing energy consumption by up to 35%. Implemented in 2004, our EMS-55 is used in every piece of new equipment with a capacity of 250L and above.
Refuel
An efficient distribution system lies at the heart of our success - one that we are continuously looking to improve. We recognise that the transportation of our products and the raw materials required to make them have an environmental impact and are always looking for ways to minimise this.The majority of our products are manufactured here in Australia, and we have also established a local network of distribution facilities. These are just two of the ways we're improving our transportation footprint.
This is one of the most important ways we are reducing our overall impact. It often surprises people to learn that the majority of the products we sell in Australia are manufactured here. This means we can reduce travel times and distances for distribution. All this leads to lower fuel usage and, therefore, lower emissions as well as an improvement in overall operating efficiency.With manufacturing plants and distribution facilities spread throughout Australia, we're always looking for ways to minimise this impact further.One of the most recent ways we've found to reduce our transportation footprint still further is through 'smart' distribution route planning.A new route planning tool has enabled us to find ever more efficient ways of getting our products from the factory to the customer. Shorter, quicker journey times means less fuel used and therefore less emissions.We'll continue to explore new ways of improving our distribution efficiency in Australia whether through the introduction of hybrid trucks currently being trialled in New Zealand or driver education to reduce idle-time and inefficient driving techniques.
Product Carbon Footprint
As well as measuring the carbon emissions for our operations, we've worked with the Carbon Trust to calculate the carbon footprint of some of our most popular drinks - including 'Coca-Cola', 'diet Coke', 'Coke Zero' and 'Oasis'.
This work marked the first time that the footprint of any brand of sparkling drink had been certified by the Carbon Trust.
For 'Coca-Cola' 'diet Coke' and 'Coke Zero' we measured the carbon footprint of a 330ml can, 330ml glass bottle, 500ml PET bottle and a two-litre plastic bottle.
For 'Oasis' we measured the footprint of our 375ml glass bottle and 500ml plastic bottle.
The table below shows the carbon footprints of these products, as measured by the Carbon Trust in 2008
Carbon footprint (g/CO2e) Coca-Cola Diet Coke Coke Zero Oasis
330ml aluminium can 170g 150g 150g n/a
330ml glass bottle 360g 340g 340g n/a

Carbon footprint (g/CO2e) Coca-Cola Diet Coke Coke Zero Oasis
375ml glass bottle n/a n/a n/a 340g
500ml plastic bottle 240g 220g 220g 240g
2 litre plastic bottle 500g 400g 400g n/a
The research showed that
Packaging is the largest contributor to a product's carbon footprint - accounting for between 30-70% of the total emissions.
Using recycled materials in packaging and recycling the empty container after use can reduce the carbon footprint of a product by up to 60%.
We think this is one of the single most important - and powerful - messages we can get out to all consumers of our products.
Climate change is perhaps the biggest long-term challenge our planet faces. We at Coca-Cola are determined to help reduce emissions as part of our commitment to be a responsible, sustainable business.
The overwhelming majority of experts agree that human activity is changing our climate. They warn that the carbon dioxide and other greenhouse gases we pump into our atmosphere will have a damaging impact on our environment and way of life. And they have called for us all to reduce greenhouse gas emissions if we want to limit this damage.
It is not easy. These gases are produced by almost everything we do - from the way food is grown and businesses operate, to every time we drive our cars, cook or watch TV at home. It is estimated that in the UK we produce 869 million tonnes of carbon dioxide emissions every year - an average of 15 tonnes per person*.
*CenSA data for UK consumption based emissions in 2004
Personal Carbon AllowancesA White Paper in partnership with the Carbon Trust, The Coca-Cola Company and Coca-Cola Enterprises was launched in April 2012.

While consumer awareness of sustainability is growing and leading to emerging interest in selecting sustainable products, a significant knowledge gap exists. The White Paper examines how to enhance consumer awareness and understanding of sustainability and explores options for providing environmental information in a simple and easy-to-understand way. In particular, the White Paper introduces the concept of Personal Carbon Allowances, where individuals could be given an allowance to represent the maximum level of carbon emissions that should result from an individual's typical daily activities (including travel, food and drink).
A carbon footprint helps us gauge the impact we are having on our environment. It measures the amount of greenhouse gas emissions produced by different activities. Every business and individual has their own footprint. If we know the size of our footprint and what this comprises, it is easier for each of us to decide how to change the way we do things to reduce it.
We have measured our product's carbon footprint in partnership with the Carbon Trust, an independent body set up by the Government to help organisations in the fight against climate change.
You can find outmore about the Carbon Trust onhttp://www.carbon-label.com
Along with other key industry bodies, we have been working with the Carbon Trust since 2007 to see how the method they use can be accurately applied to soft drinks. We wanted to be sure, for example, their calculations include the time our drinks could be stored in a cooler and the recycled material we use in our packaging. Our work has been focused on Great Britain, but we have shared the information across our operations worldwide to help shape their journey towards sustainable energy stewardship.
Each product carbon footprint was calculated by identifying the key stages in the full lifecycle of the selected drinks - from growing ingredients, through production, distribution and retailing, to the disposal of the empty bottle or can.
At each stage, we measured the energy used, calculated the associated carbon emissions and also looked at other sources of greenhouse gas emissions. We then added the total greenhouse gas emissions together to get the carbon footprint of the product.
It is a complicated process - taking into account a whole range of factors. The source of electricity, for example, has a major impact on the carbon footprint of a product. Products produced at a manufacturing site powered by electricity generated from nuclear power, for example, would have a much lower carbon footprint that products produced at an identical site powered by electricity generated from coal or gas.

Brisbane City Council Annual Report 2011-2012 (http://www.brisbane.qld.gov.au/about-council/council-information-and-rates/news-and-publications/annual-report-and-financial-statements/index.htm).

1.1 SUSTAINABILITY AND CLIMATE CHANGE
We will provide leadership, guidance and program delivery to Council and the community. We will maximise sustainability outcomes, reduce greenhouse gas emissions by 50% and support a carbon-neutral city. Key results for 2010-11 • Reduced Council’s greenhouse gas emissions by approximately 89,000 tonnes a year by purchasing 100% GreenPower for electricity supply. • Bought 130,000 tonnes of accredited carbon offsets to neutralise the carbon emissions from Council’s bus, ferry and vehicle fleets. • Supported residents to become more sustainable in their homes and reduce greenhouse emissions resulting from energy use. More than 185,000 residents have subscribed to the Green Heart Homes program to date. • Launched EzyGreen in July 2010, in partnership with the Queensland Government and private enterprises, to help Brisbane residents reduce their power bills and carbon emissions by reducing home energy consumption. EzyGreen has reduced Brisbane’s carbon emissions by approximately 24,000 tonnes a year by providing more than 34,000 Brisbane residents with a range of energy saving products and services. • Initiated a tender process for the long term supply of renewable energy for Council. • Hosted Green Heart Fairs in Mount Gravatt and Chermside to showcase the real benefits of sustainability while making it accessible and fun for Brisbane residents. More than 25,000 people visited exhibitors, markets and workshops and 12,000 free plants were given away to residents. • Hosted 12 Green Up events, including six dedicated flood recovery Green Ups to connect flood impacted residents with experts and Council programs to help them make sustainable building choices. • Support local non-profit community based organisations to establish, develop and maintain community gardens on Council-owned land through Cultivating Community Garden grants. New gardens were established at Carina, Kelvin Grove, Banyo, Coorparoo, Wynnum, Upper Mt Gravatt, Graceville, Deagon, Carindale, The Gap, East Brisbane and Geebung. • Distributed more than 72,000 free plants to residents, schools, and community groups. • Offered more than 25,000 Brisbane households a $50 Climate Smart Home Service rebate when they used the Queensland Government’s ClimateSmart Home Service. • Incentivised businesses to consider sustainable choices by expanding the national CitySwitch Green Office program to 48 businesses equating to 137,000 square metres of office space. • Council’s Eco Development Advisory Service provided advice on 11 developments and 26 Neighbourhood Plans across the city. • Offered three Sustainable Development Assessment grants to assist promoting sustainable development totalling $2,220,574.

CHALLENGES Changing community attitudes and behaviour towards environmental and sustainability issues is a long-term process that requires sustained commitment from Council. The results of behaviour change programs are often difficult to measure because these changes require time to emerge and the community varies so widely in its readiness to take action on environmental issues. Council’s Green Heart program engages and empowers a range of target audiences to make changes over the longer term. A Green Heart Resident Survey has been developed to track to changes in the Brisbane community’s behaviour.

AppleApple comprehensively reports our environmental impact. We do this by focusing on our products: what happens when we design them, what happens when we make them, and what happens when you take them home and use them.
Total Carbon Footprint
For 2012, we estimate that Apple was responsible for 30.9 million metric tonnes of greenhouse gas emissions.1
2% Facilities 98% Product Life Cycle
The vast majority of our carbon emissions come from manufacturing, transporting, using and recycling our products. The rest — 2 per cent — come from our data centres and other facilities.
How we calculate our carbon footprint.To accurately measure a company’s environmental footprint, it’s important to look at the impact that company’s products have on the planet. Other companies continue to report only the carbon footprint of their facilities. But we use a comprehensive life cycle analysis approach to determine where our greenhouse gas emissions come from. That means adding up the emissions generated from manufacturing, transporting, using and recycling our products, as well as the emissions generated by our facilities. We know that about 98 per cent of Apple’s carbon footprint is directly related to our products. The remaining 2 per cent is related to our facilities, including our data centres.
Minimising the impact of our growth.We know that the most important thing we can do to reduce our impact on the environment is to improve the environmental performance of our products. That’s why we design them to use less material, ship with smaller packaging, be free of many toxic substances, and be as energy-efficient and recyclable as possible. So as we continue to grow faster than the rest of the industry, we’re doing it with products that are friendlier to the environment than ever, and we remain committed to creating products that have the least amount of impact on the environment. Though our revenue has grown, our greenhouse gas emissions per dollar of revenue have decreased by 21.5 per cent since 2008. And we’re still the only company in our industry with an entire product line that not only meets but exceeds the strict energy guidelines of the ENERGY STAR specification. L
ManufacturingManufacturing — including extraction of raw materials and product assembly — accounts for 61 per cent of Apple’s total greenhouse gas emissions.

18,934,000 metric tonnes of greenhouse gas emissions
Apple’s attention to product design has led to significant reductions in carbon emissions compared with earlier-generation products — even though new products are more powerful than ever.
Material use.Over the past decade, Apple designers and engineers have continued to pioneer new ways to build our products. Manufacturing innovations such as unibody construction have allowed MacBook and iPad products to become thinner while being even more resilient. And the latest iMac features a process called friction-stir welding, which helps enable iMac to use 68 per cent less material and also generate 67 per cent fewer carbon emissions than earlier generations.
TransportationFive per cent of Apple’s greenhouse gas emissions are a result of transporting our products from assembly locations to distribution hubs in regions where our products are sold.
1,608,000 metric tonnes of greenhouse gas emissions
Smaller packaging.Making thinner, lighter and more material-efficient products not only reduces their carbon footprint, but it also means that we can ship them in smaller packaging. In fact, we employ teams of design and engineering experts who develop product packaging that’s slim and light yet protective. Efficient packaging design reduces materials and waste, and it also helps reduce the emissions produced during transportation.

For example, the packaging for iPhone 5 is 28 per cent smaller than the packaging for the original iPhone shipped in 2007. That means that up to 60 per cent more iPhone 5 boxes fit on each shipping pallet and fewer boats and planes are used — resulting in fewer CO2 emissions.
By reducing iPhone packaging by 28 per cent from 2007 to 2012, we ship up to 60 per cent more boxes in each airline shipping container. That saves one 747 flight for every 416,667 units we ship.*
*Calculated using US configurations.
Apple in Australia is a signatory to the Australian Packaging Covenant, an Australian Government and industry initiative to reduce the environmental impacts of packaging with a focus on packaging design. Apple has been a signatory to the National Packaging Covenant since 2006. See Apple’s Action Plan and Annual Report.
Product UseThe use of our products generates 30 per cent of Apple’s total greenhouse gas emissions.3
9,306,000 metric tonnes of greenhouse gas emissions
Energy efficiency.Using a life cycle approach, Apple measures the greenhouse gas emissions associated not only with producing products but also with their use by our customers. We know of no other company in our industry going this far in measuring and disclosing its carbon emissions. Because we design both the hardware and the operating system, we’re able to make sure they work together to conserve power and lessen the amount of greenhouse gases generated. Since 2008, we’ve reduced the average power consumed by Apple products by 40 per cent, reflecting our drive to create the world’s most energy-efficient products. And as a result of our emphasis on creating products that consume less energy, the portion of greenhouse gas emissions caused by usage of our products has decreased by 43 per cent since 2008.
Here are some examples of how we’re making our products more energy-efficient:
Mac mini. Through innovations both big and small, Mac mini uses as little as one-fifth the power consumed by a typical lightbulb.4 It uses even less power than a single 13-watt compact fluorescent lamp (CFL) bulb, making Mac mini the most energy-efficient desktop computer in the world.5
iMac. By using highly efficient in-plane switching (IPS) display panel technology and power supplies that are over 90 per cent efficient6, we reduced overall power consumption on the 21.5-inch iMac by half compared to its predecessor.
ENERGY STAR qualification.Unlike other manufacturers that may have one or a few products that are ENERGY STAR qualified, every single Apple product not only meets but exceeds the United States Environmental Protection Agency’s strict ENERGY STAR guidelines for efficiency. We are the only company in our industry that can make this claim.

RecyclingTwo per cent of Apple’s total greenhouse gas emissions are related to recycling.
538,000 metric tonnes of greenhouse gas emissions
Product recyclability.Apple’s approach to recycling begins in the design stage, where we create compact, efficient products that require less material to produce. And the materials we do use — including arsenic-free glass, high-grade aluminium and strong polycarbonate — are reclaimed by recyclers for use in new products. Even our product packaging uses recyclable materials wherever possible.
Longer lasting products.Apple designs products that last. The built-in battery in our MacBook line-up is a perfect example. It can be charged up to 1,000 times.7 And because this battery lasts up to five years, it saves you money you might otherwise have to spend on new batteries, produces less waste and increases the lifespan of your notebook.
Responsible recycling.All e-waste collected by Apple-controlled voluntary and regulatory programs worldwide is processed in the region in which it is collected. Nothing is shipped overseas for recycling or disposal. Our recyclers must comply with Apple’s stringent contractual environmental controls as well as all applicable health and safety laws, and Apple does not allow the use of prison labour at any stage of the recycling process. Nor do we allow the disposal of hazardous electronic waste in solid-waste landfills or incinerators. We currently work with 153 partners around the globe whose facilities are evaluated annually on such topics as worker health and safety, environmental compliance, material tracking and social responsibility.
Apple recycling programs.Once an Apple product reaches the end of its useful life, we will help you recycle it responsibly. Apple has instituted recycling programs in cities and university campuses in 95 per cent of the countries where our products are sold, diverting more than 151,504 metric tonnes of equipment from landfills since 1994. In regions where we don’t have a formal take-back program, we arrange for pick-up, transport and environmentally sound recycling of end-of-life electronics. Our goal for 2010 was to achieve a worldwide recycling rate of 70 per cent. (To calculate this rate, we use a measurement that assumes a seven-year product lifetime. The weight of the materials we recycle each year is compared to the total weight of the products Apple sold seven years earlier.) We met and exceeded that goal in 2010. This far surpasses the last reported numbers from Dell and HP, numbers that were each lower than 20 per cent. In 2012, Apple global recycling exceeded our 70 per cent goal, and we are confident that we will maintain this level though to 2015.

*As a percentage of weight of products sold seven years earlier.
When our products reach the end of their useful life, we make it easy for you to send them to us for recycling in environmentally responsible ways.
FacilitiesApple’s facilities — including corporate offices, distribution hubs, data centres and retail stores — account for 2 per cent of our total greenhouse gas emissions.
486,000 metric tonnes of greenhouse gas emissions
Renewable Energy
More than 13,000 Apple employees participated in 2012 — a 30 per cent increase over 2011.
Facilities in the big picture.Other companies in our industry primarily report on the greenhouse gas emissions associated with their facilities as a gauge of their environmental impact. But switching off lights and recycling office waste aren’t enough. The products we make represent the

biggest impact on our environment. That’s why Apple focuses on product design and innovation. Even so, Apple has taken significant steps to lessen greenhouse gas emissions produced by our facilities worldwide.
Clean energy.We are working toward the goal of net zero — using 100 per cent clean, renewable energy at all our facilities and data centres. In many locations, we have already met that goal. We’re constructing new buildings and updating existing ones. We’re installing our own onsite renewable energy sources, including solar arrays and fuel cells. And for the balance of our energy needs, we’re establishing as many long-term contracts with energy suppliers as we are allowed. We have made tremendous progress and have now converted 75 per cent of our energy needs at our corporate facilities and data centres to renewable sources.
Data centres.All of our data centres are energy-efficient and 100 per cent powered by renewable energy. Our facility in Maiden, North Carolina in the US opened in 2012 and demonstrates our commitment to reducing the environmental impact of our facilities. The data centre earned the coveted LEED Platinum certification from the US Green Building Council — to our knowledge, the only data centre of its size and type so honoured. And over 60 per cent of the renewable energy it uses is generated onsite through the largest privately owned solar array in the US and the nation’s largest operating non-utility fuel cell installation.Learn more about renewable energy at our data centres
Employee commuter programs in the US.In fiscal year 2012, more than 13,000 employees participated in our Commute Alternatives program — a 30 per cent increase year over year — and commuted to work using transport options that have reduced traffic, smog and CO2e emissions associated with the use of single-occupancy vehicles. This includes more than 1,600 Cupertino-based Apple employees who ride to work daily on free biodiesel commuter coaches and shuttles. Employees in Cupertino also helped prevent more than 102,500 kilograms of CO2e emissions by using electric vehicle charging stations, and they took more than 50,000 trips on Apple’s shared bicycles in 2012.