rent seeking in groups - florida state universitymyweb.fsu.edu/tsalmon/ais_rs.pdf · rent seeking...
TRANSCRIPT

Rent Seeking in Groups�
T.K. Ahny
Korea UniversityR. Mark Isaacz
Florida State UniversityTimothy C. Salmonx
Florida State University
December 2009
Abstract
Rent-seeking contests between groups involve con�icts of interests at the levels ofindividuals, groups, and the society as a whole. We conduct a series of economic exper-iments to study the behavior of groups and individuals competing against each other inrent-seeking contests. We �nd substantial over-contribution to rent-seeking relative tothe equilibrium predictions of standard models regardless whether individuals competeagainst other individuals, groups compete against other groups, or individuals competeagainst groups.JEL Codes: C92, D72Key Words: Rent Seeking, Economic Experiments
1 Introduction
�Rent-Seeking� is a common activity in which individuals, �rms, cities and states com-pete to obtain some bene�t from a governmental or quasi governmental source that rangefrom monopoly rights for operating a cable franchise, a contract for building airplanes forthe armed forces, to protectionist tari¤s levied on foreign competitors. Many rent-seekingcontests involve individuals competing against individuals but others involve competitionbetween groups including situations in which groups compete against individuals. As anexample, in the spectrum license auctions conducted by the Federal Communications Com-mission, multiple companies often form partnerships or consortia to pool their resourcesand compete against other consortia as well as individual �rms.
When groups are involved in a rent seeking contest this adds some interesting elementsof a public goods game but with some interesting di¤erences. In a classic public goods game,there is a con�ict between individual self-interest and social welfare such that individualsseeking to maximize their own self-interest would generate low contributions while maximiz-ing social welfare requires higher contributions. The con�icts are more complicated in the
�The authors would like to thank the National Science Foundation for research support in funding theseexperiments.
yDepartment of Public Administration, Korea University, Seoul 136-701, Korea, [email protected] of Economics, Florida State University, Tallahassee, FL, 32306-2180, mis-
[email protected]. Phone: 850-644-7081 Fax: 850-644-4535.xDepartment of Economics, Florida State University, Tallahassee, FL, 32306-2180, [email protected].
Phone: 850-644-7207 Fax: 850-644-4535.
1

rent seeking context. When only individuals are competing there is still a con�ict betweenindividual optimality and social welfare but in the opposite direction of the public goodscase. Individuals wish to contribute high enough to secure the prize while society is actuallybest o¤with low or even no contributions. When teams are competing to win the prize thereis a standard public goods dilemma inside of each group but then there is also the socialwelfare concern at the level of the entire society. Speci�cally, individual self interest in thiscase suggests contributing little and free-riding on group members. Group interest suggestscontributing high so your group wins, while maximizing social interest would involve neithergroup expending resources in the competition. This leads to an interesting di¤erence fromthe standard public goods dilemma because now the incentives for maximizing individualself-interest and social welfare are actually aligned, though imperfectly.1 Examining howsocial welfare changes based upon rent seeking competitions occurring between individualsversus between groups then may demonstrate substantially di¤erent properties. This studywill use economic experiments to examine this issue of how individuals respond to di¤eringgroup sizes and how this e¤ects overall social welfare. We are particularly interested in thecases in which competing groups are of di¤erent sizes. Game theoretic analyses show that,other things being equal, the smaller group is advantaged against a larger group in thesense that the smaller group induces more aggregate rent-seeking e¤orts from its members.However, this has never been tested in controlled experiment.
The standard rent seeking game was �rst discussed by Tullock (1967) and then given afuller theoretical exposition in Rogerson (1982).2 Several more recent studies have extendedthese models to examine the impact of within-group sharing rules on the level of rent-seekingwith a general conclusion that even when groups use sharing rules that encourage contribu-tions for group rent-seeking, the overall level of rent-seeking is lower in group competitionthan in individual competition. See for example Lee (1995), Baik and Lee (1997), Lee andKang (1998), Gürtler (2005) and Baik and Shogren (1995). Our experimental setup is mostclosely associated with Nitzan (1991) which extends the standard rent seeking model toallow for competition between asymmetrically sized groups.
There are several early experimental studies examining predictions of rent seeking mod-els in laboratory experiments such as Millner and Pratt (1989), Millner and Pratt (1991),Shogren and Baik (1991) and Davis and Reilly (2000). These generally focus on the degreeand conditions for rent-dissipation. Most of the extant experimental literature has looked atthe individual, rather than a group, as the economic actor in rent-seeking contests but thereis a literature on group interaction. Davis and Reilly (2000) utilizes groups of rent defenderscompeting against individual rent-seekers and Abbink et al. (Forthcoming) examines thee¤ects of intra-group punishment options.
Social-psychologists have conducted various types of experiments of group competitionutilizing matrix form games, see for example Bornstein and Ben-Yossef (1994), Insko et al.(1992) and Insko et al. (1994), and generally �nd a �discontinuity e¤ect�in which group aremore competitive than individuals. Among them, Bornstein, Winter, and Goren (1996) and
1Bornstein (2003) provides an excellent review of the interest alignment between individuals, groupsand the larger society in diverse game settings. The group size asymmetry of interest in our study is notdiscussed.
2We note that Krueger (1974) �rst used the term �rent-seeking�to refer to these socially wasteful activ-ities.
2

Gunnthorsdottir and Rapoport (2006) present perhaps the most similar approaches to oursbut Gunnthorsdottir and Rapoport (2006) focusses on examining equal vs. proportionalsharing rules while Bornstein, Winter, and Goren (1996) utilizes a substantially simplerenvironment which lacks some of the richness allowed in our more general framework.
There is also a literature on behavior of individuals and groups in tournaments as wellas in auctions such as Fonseca (2009), Cox and Hayne (2006), Hayne and Cox (2005), Nal-bantian and Schotter (1997), Bull, Schotter, and Weigelt (1987), Orrison, Schotter, andWeigelt (2004) and Sutter, Kocher, and Strauß(2009). Tournament games are mathemati-cally the same as rent seeking games though they typically have di¤erent motivations.
The current paper contributes by studying group dynamics in rent-seeking competitionby varying the size of the group as well as including the competition between groups ofdi¤erent sizes. Several of the above mentioned research features groups competing againstgroups, but none except, Davis and Reilly (2000) and Abbink et al. (Forthcoming) studiescompetition among asymmetrically sized groups. Of the two, Abbink et al. utilizes anexperimental design that is very similar to ours in that it compares the outcomes of com-petition between individuals, between groups and between a group and an individual.3 Inaddition to the fact that Abbink et al. includes a treatment with intragroup punishment,there is a very important di¤erence between the two studies. In our experiments, the prizeis a rivalous good and, thus, the bene�t one gets when her group wins the competitiondecreases in the size of her group. On the other hand, Abbink et al. assume a nonrivalousgood as a prize for the winning members. This results in many di¤erences, including theNash equilibrium prediction. In our design the total spending on rent-seeking decreases asgroup size (or size of a team, in Abbink et al.�s terminology) gets larger. On the otherhand, Abbink et al.�s design leads to Nash equilibria in which the total group (or team)rent-seeking is invariant to group size. At least on this aspect, we believe the two papersare complementary to each other rather than being redundant. One of the common �ndingsbetween our and Abbink et al.�s experiments is the universal tendency of over rent-seekingregardless of the size of the competing group. The results can be taken as much more robustas it is con�rmed for both in-group rivalous and non-rivalous prize environments.
Our focus will be explicitly on the group dynamics, i.e., how the individuals� choicesvary in response to di¤erent con�gurations of their own and their rival group. We compareindividual contests, group contests, and mixed contests in which a single player competesagainst a group of �ve players. We compare the behavior players in these contests againstequilibrium game-theoretic predictions, socially optimal benchmarks, and against more in-formal disequilibrium conjectures which can be derived from years of observation of behaviorin public goods experiments.
An important part of our story as it unfolds is the necessity for individuals to deal witha dual level strategic problem: each individual must not only consider the �game�beingplayed by members of his own group, but also the �game�being played by members of theother rent-seeking rival groups.
3Our experiment was conceived during the fall of 2006 and the experiments were run in the summer of2007, unaware of Abbink et al.�s study.
3

2 Theory
We will construct a standard model of rent seeking between groups of potentially unevensizes which is similar to that of Nitzan (1991). Let R be the value of the franchise orprize that the two groups are competing to win. We will use Gi to indicate the group thatplayer i is in and gi the size of that group. G�i will refer to the rival group for playeri: All individuals in both groups will simultaneously choose some amount to contributetowards the rent seeking endeavor, xi 2 [0; X]: The probability of winning for the group ofplayer i is simply the ratio of the total contributions of their group to the total from both
groups, or pi =Pj2Gi xj=
�Pj2Gi xj +
Pj2G�i xj
�: We will assume that the prize will be
divided evenly among all members of the winning group. Consequently the problem foreach individual is given by equation 1.
maxxi
R
gi
Pj2Gi xjP
j2Gi xj +Pj2G�i xj
!� xi (1)
st xi � X
There will be many asymmetric and mixed strategy equilibria in this game, but for thepurposes of establishing a benchmark equilibrium, we will consider only symmetric purestrategy equilibria in which all members of a group contribute the same amount, x�i ; andthe members of the rival group also contribute (a perhaps di¤erent) common amount, x��i.This gives rise to the solution shown in equations 2 and 3.
x�i = R
�g�i
gi(gi + g�i)2
�(2)
x��i = R
�gi
g�i(gi + g�i)2
�(3)
Note that in this setting contributions to rent-seeking represent purely wasteful activityfrom a social standpoint. Consequently, social welfare is trivially maximized when there areno contributions assuming prize is still awarded. As equations 2 and 3 show, the equilibriumcontributions among the members of a group are strictly positive unless if the rival grouphas 0 members. Thus, some level of social waste due to rent-seeking is always expected inrent-seeking contests.
Based upon these equilibrium contribution levels, it is useful to note a few comparativestatic results. An obvious one is that contributions are decreasing in own group size asshown in equation 4. A more interesting e¤ect is that not only do the contributions ofindividual group members decrease as the number of members increases but the sum ofcontributions by the group decreases as the group size increases as shown by equation 5.This shows the public good aspect of team contributions. Were all individuals to considerthe team itself as a single entity then they would just divide the contribution level for a groupof size one among themselves. Instead, they drop their contributions by even more thanthat amount showing a standard free-rider e¤ect. The �nal comparative static concerns anindividual�s reaction to a change in group size by the rival group. This is shown in equation
4

SessionsSubjects PerSession
TotalSubjects
IndepGroups
Phase 1 Phase 2
Baseline 2 16 32 8 1V1 1V1AG 3 18 54 9 1V1 1V5SG 4 20 80 8 1V1 5V5RAG 2 18 36 6 1V5 1V1
Total 11 � 202 31 - -
Table 1: Details on sessions conducted.
6 and the sign of it is indeterminate. If the size of i�s group is larger than the rival groupthen contributions increase as the rival group size increases. If, however, the rival group isalready larger then as that rival gets even larger i decreases his contributions.
@x�i@gi
=�g�iR (3gi + g�i)g2i (gi + g�i)
3< 0 (4)
@(gix�i )
@gi=
�2g�iR(gi + g�i)3
< 0 (5)
@x�i@g�i
=R(gi � g�i)(gi + g�i)
3 gi< 0 if gi < g�i (6)
3 Experiment Design
Our experiments are designed as a test of the predictions of the model outlined above. Ourmain interest is in the comparative statics regarding how subjects shift behavior when thesize of their group changes and when the size of their rival group changes. What we areparticularly interested in is whether group members will be able to solve their in-group socialdilemma by contributing above the Nash equilibrium or whether the paired rival groups willbe able to overcome their social dilemma by tacitly agreeing to decrease rent-seeking levelsbelow the equilibrium benchmarks.
Towards this end, we have conducted a set of experiments with four treatments. Eachtreatment has two phases. In the �rst phase of three of the four treatments, each subjectcompetes against another individual. This �rst phase lasts for 15 periods. In the secondphase of our Baseline treatment, subjects are re-matched to another subject and they againplay the rent seeking game for 15 rounds. In the Symmetric Groups (SG) treatment,subjects are placed in groups of �ve and then matched with another group of �ve to playthe rent seeking game for 15 periods. In the Asymmetric Groups (AG) treatment, onegroup consists of �ve members and they compete against a single individual for 15 rounds.The idea behind these treatments is that they allow us to clearly assess how contributionschange moving from the base 1V1 condition to either a restart of that condition or to casesin which group sizes adjust in a symmetric or asymmetric manner. Our fourth treatmentreversed the Asymmetric Groups treatment (RAG) and so the experiments began withsubjects playing 1V5 games for 15 rounds and were then switched to 1V1 games for the
5
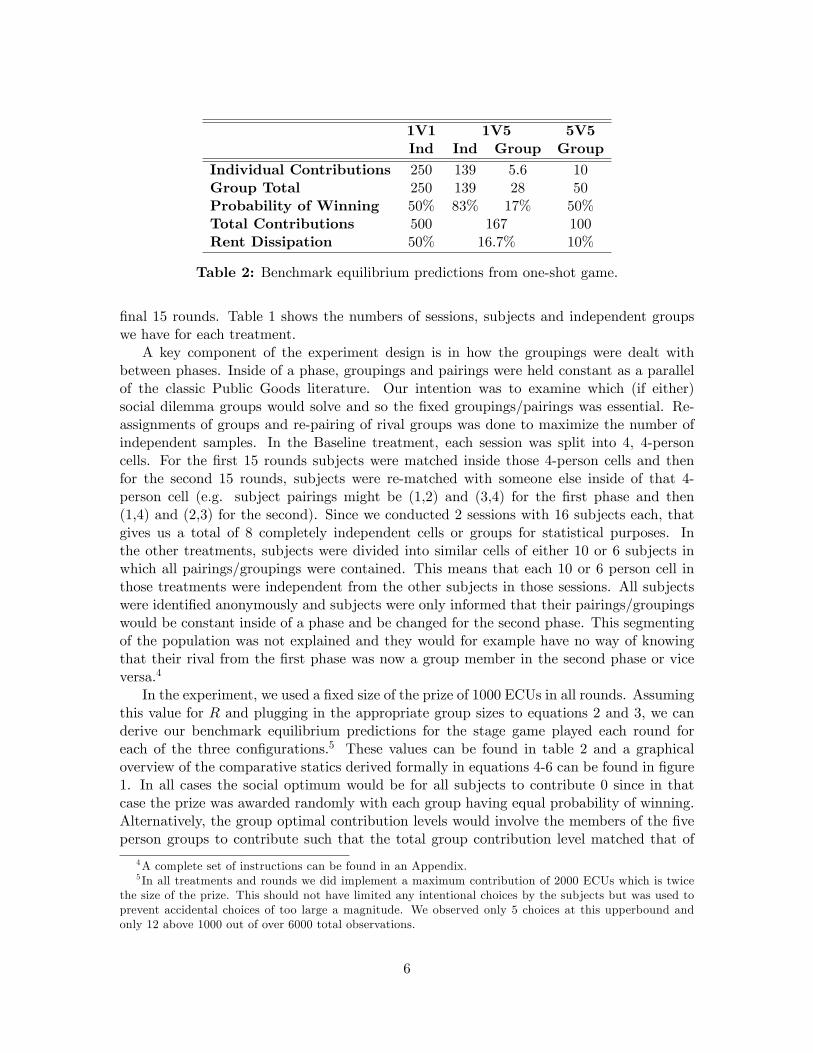
1V1 1V5 5V5Ind Ind Group Group
Individual Contributions 250 139 5.6 10Group Total 250 139 28 50Probability of Winning 50% 83% 17% 50%Total Contributions 500 167 100Rent Dissipation 50% 16.7% 10%
Table 2: Benchmark equilibrium predictions from one-shot game.
�nal 15 rounds. Table 1 shows the numbers of sessions, subjects and independent groupswe have for each treatment.
A key component of the experiment design is in how the groupings were dealt withbetween phases. Inside of a phase, groupings and pairings were held constant as a parallelof the classic Public Goods literature. Our intention was to examine which (if either)social dilemma groups would solve and so the �xed groupings/pairings was essential. Re-assignments of groups and re-pairing of rival groups was done to maximize the number ofindependent samples. In the Baseline treatment, each session was split into 4, 4-personcells. For the �rst 15 rounds subjects were matched inside those 4-person cells and thenfor the second 15 rounds, subjects were re-matched with someone else inside of that 4-person cell (e.g. subject pairings might be (1,2) and (3,4) for the �rst phase and then(1,4) and (2,3) for the second). Since we conducted 2 sessions with 16 subjects each, thatgives us a total of 8 completely independent cells or groups for statistical purposes. Inthe other treatments, subjects were divided into similar cells of either 10 or 6 subjects inwhich all pairings/groupings were contained. This means that each 10 or 6 person cell inthose treatments were independent from the other subjects in those sessions. All subjectswere identi�ed anonymously and subjects were only informed that their pairings/groupingswould be constant inside of a phase and be changed for the second phase. This segmentingof the population was not explained and they would for example have no way of knowingthat their rival from the �rst phase was now a group member in the second phase or viceversa.4
In the experiment, we used a �xed size of the prize of 1000 ECUs in all rounds. Assumingthis value for R and plugging in the appropriate group sizes to equations 2 and 3, we canderive our benchmark equilibrium predictions for the stage game played each round foreach of the three con�gurations.5 These values can be found in table 2 and a graphicaloverview of the comparative statics derived formally in equations 4-6 can be found in �gure1. In all cases the social optimum would be for all subjects to contribute 0 since in thatcase the prize was awarded randomly with each group having equal probability of winning.Alternatively, the group optimal contribution levels would involve the members of the �veperson groups to contribute such that the total group contribution level matched that of
4A complete set of instructions can be found in an Appendix.5 In all treatments and rounds we did implement a maximum contribution of 2000 ECUs which is twice
the size of the prize. This should not have limited any intentional choices by the subjects but was used toprevent accidental choices of too large a magnitude. We observed only 5 choices at this upperbound andonly 12 above 1000 out of over 6000 total observations.
6

Figure 1: Individual and group equilibrium contributions assuming one group consists of5 members and the other has a group size which varies along the x axis.
the individual in the 1v1 treatment, 250. That would break down to 50 per subject werethey to divide it evenly but unequal divisions that sum to 250 are also possible. Since thephases are repeated for a �nite and known period of time these stage game equilibria canalso be supported by appropriately de�ned strategies in the repeated game. While there willbe other asymmetric equilibria, mixed strategy equilibria and other equilibria which couldbe derived based on the repeated game structure, we will use these stage game symmetricequilibria as our benchmark predictions as a means of organizing and interpreting the thedata.
Because of the fact that subjects would almost certainly make losses in at least someperiods we started all subjects with an initial balance of 2500 ECUs. Subjects whoseearnings went negative once were reset to a new balance of 2500 ECUs while the secondtime a subject went bankrupt they were removed from the experiment and would leave withtheir fee for showing up. Only one of our subjects did in fact go bankrupt twice6 while 24(out of 202 total subjects) went bankrupt once with 75% coming from the SG and RAGtreatments. While it is possible that the rules indemnifying the �rst bankruptcy could havegenerated more aggressive contributions than we would otherwise observe, evidence will beshown in the results section suggesting that was unlikely to be the case.
The experiments were conducted using a computer interface programmed using ztree,Fischbacher (2007). After each round subjects were reminded of their own contribution,informed of the total contributions from their own and their rival group and shown how thosecontributions generated a probability for their group winning. They were also informed ifthey won or lost as well as their own net earnings for the round. Subjects received $10
6 In this case, the session continued with the bankrupt subject replaced by a randomly choosing robot.This was done to allow the other subjects to continue to accrue the rest of the money for the session. Wehave chosen to remove the data from all periods/groups in which that twice bankrupt subject was included.This choice does not alter any of the results presented in the paper.
7

for showing up on time and their earnings in ECUs translated into dollars at the rate of4 ECUs=$0.01 making the 1000 ECU prize per round equal to $2.50. Each session lastedan hour to an hour and a half. We used a total of 202 subjects. Their total compensationincluding show-up fee ranged from a minimum of $10 to a maximum of around $48 with anaverage of approximately $25.
4 Results
We will �rst examine the data using general summary statistics to determine how well theequilibrium predictions perform at that level and how overall social welfare and e¢ ciencychanges with group size. We will then move on to examining the behavior on a more detailedstatistical basis to generate formal results.
4.1 Summary Statistics
The general summary statistics for the key variables are shown in table 3. For the twoasymmetric treatments we have separated out the subjects who will be in the big groupsfrom the individuals during the asymmetric phase even for the 1V1 Phase to allow for amore precise demonstration of the behavioral comparative static.
There are a number of ways to examine these data. The �rst comparison would be tothe stage game equilibrium benchmarks shown in table 2. In the 1V1 cases, the predictionis that subjects invest 250 ECUs each and the data show that the subjects contribute wellover 300 in all cases and over 500 in the 1V1 phase of the RAG (i.e. periods 16-30). Inthe 5V5 phase of the SG treatment, all subjects should be contributing 10 ECUs while thedata shows them contributing over 5 times that amount. This happens to coincide withthe benchmark prediction of the group optimal level of contribution. In the asymmetrictreatments, the subject competing as an individual should contribute 139 while the datashows them contributing 333.60 and 577.58 while members of their rival group should eachonly contribute 5.6 and they end up contributing over 70. Even without statistical tests(whose results will be presented later), it should be clear that there is substantial over-contribution relative to the benchmark Nash equilibrium. In the SG treatment these over-contributions are almost exactly at the level one would expect were the subjects engagedin equilibrium play and fully valuing the return on their contributions to their fellow groupmembers. Based on the level of over-contribution in all other conditions, though, it wouldseem premature to conclude that this is evidence of behavior aimed at maximizing groupwelfare.
The high levels of rent-seeking contributions lead to the level of rent-dissipation higherthan predicted in the equilibrium. In the RAG treatment, contributions go so high asto dissipate almost 100% of the rents in the asymmetric phase and most cases show rentdissipation is in the 70% range. The theoretical prediction is that the most rent shouldbe dissipated in the 1V1 arrangement and the least in the 5V5. The SG treatment doesshow that rent dissipation decreases from 72% to 51% in moving from the 1V1 phase tothe 5V5 phase, but this is still far above the predicted values of 50% and 10%. There isalso a predicted drop from 1V1 to 1V5 which is not observed. In the AG treatment, rentdissipation is 68% in the 1V1 and 67% in the 1V5 instead of 50% and 16.7% as predicted. In
8

Baseline AG SG RAGPeriods Ind Ind Group Ind Group Ind Group
Ind 1-15 336.93 400.16 325.14 360.52 - 577.58 76.40Contrib 16-30 348.13 333.60 67.98 - 50.79 504.76 356.49Group 1-15 336.96 400.16 325.14 360.52 - 577.58 382.02Total 16-30 348.13 333.60 339.92 - 253.93 504.76 356.49Prob of 1-15 .50 0.55 0.45 .50 - 0.60 0.40Win 16-30 .50 0.495 0.505 - .50 0.59 0.41Total 1-15 673.85 675.28 721.04 959.60Contrib 16-30 696.26 673.52 507.87 762.40Rent 1-15 0.67 0.68 0.72 0.96Dissip 16-30 0.70 0.67 0.51 0.76
Table 3: Basic summary statistics on contributions. Note that in both asymmetrictreatments there are columns for �individual�and �group�which refer to which group the
subjects are in during the asymmetric phase.
the RAG treatment, we �nd a 96% rent dissipation for the 1V5 case and then 76% for 1V1which moves in the opposite of the predicted direction. What this means is that there aresubstantial welfare consequences due to the over-contribution observed in this environment.
To help compare the results across treatment and across time �gures 2-4 show theaverage individual contributions per period for the SG, AG and RAG treatments comparedto the Baseline treatment. In the RAG and AG �gures we have again separated out thedata for those who will be in the groups of di¤ering sizes even for the 1V1 phase of thosesessions to help determine if there were subject speci�c di¤erences which may account forthe di¤erences once they are assigned to groups of di¤ering sizes. The clear point in the SGand AG �gures is that the behavior in the 1V1 phase is equivalent across all three treatmentsand that in the Baseline behavior does not change much between the �rst 15 and last 15periods. Further, in the AG treatment the subjects playing as individuals during the 1V5phase do not adjust their contributions much from the 1V1 phase. In the SG treatmentwhen subjects become part of 5 person groups, they show an immediate and substantialdrop with a slow decay after that point and this is matched almost exactly in the membersof the groups in the 1V5 AG treatment. The RAG treatment shows substantially di¤erentbehavior. Recall that in this treatment subjects began in a 1V5 phase and we see thatthe subjects playing as individuals contributed substantially above the level of the Baseline1V1 case and also above the subjects playing as individuals in the 1v5 phase in the AGtreatment. The members of the 5 person groups, however, are evidencing a roughly similarpattern to the other 5 person groups. Then in the 1V1 phase of the RAG treatment, thosewho were playing as individuals do not appear to drop back down to the level of othersubjects from other treatments in the 1V1 phase while those who were members of thelarge groups do converge to the standard behavior. Statistical characterization of theseproperties will be established in the next section.
9

Figure 2: Average individual contributions over time in the Baseline and SymmetricGroups treatments. Solid line is equilibrium prediction for 1V1 phases while dashed line is
for the 5V5 portion of the SG treatment.
Figure 3: Average individual contributions over time in the Baseline and AsymmetricGroups treatments. Solid line is equilibrium prediction for 1V1 phases while long dashedline is the prediction for the small group in the 1V5 phase and the short dashed line is for
the large group.
10

Figure 4: Average individual contributions in the Baseline and Reverse AsymmetricGroups treatments. Solid line is equilibrium prediction for 1V1 phases while long dashedline is the prediction for the small group in the 1V5 phase and the short dashed line is for
the large group.
4.2 Statistical Analysis
To provide a �ner statistical characterization of the results on individual contributions wepresent several di¤erent regression based analyses of the choice data. The �rst set of regres-sions are aimed at identifying any e¤ects due to treatment di¤erences and is contained intable 4. That table contains two speci�cations one including all data and one limited to onlythe data from decisions in 5 member groups to better isolate di¤erences across those cases.The fundamental speci�cation is the same in both and involves regressing contributionson dummy variables that identify di¤erent treatments, phases and groups. This includesseparating out subjects in the 1v1 phases of the AG and RAG treatments depending onwhether they will be or were on the individual or group side in the 1v5 phase. The regres-sions are performed using pooled OLS with robust standard errors clustered by subject. Inthe regression using all data the coe¢ cients can be interpreted as whether or not contri-butions in the indicated treatment/population segment di¤er from the contributions foundin Phase 1 of the Baseline treatment. In the regression using only the data from the largegroups, the baseline comparison used is the contributions in Phase 2 of the SG treatmentand so coe¢ cients can be interpreted as indicating the degree to which behavior in othertreatments di¤ers from that reference point. The interpretation of these two regressionswill be explained through a series of results.
Result 1 - There is no statistically signi�cant di¤erence in contributions between any ofthe situations in which subjects are competing as individuals except for the �rst phase of theRAG treatment in which the individual subjects are matched against rival groups of size 5.
This result is supported by the coe¢ cients for the variables in the section for playerscompeting as individuals in that almost all of the coe¢ cients are not signi�cantly di¤erent
11
from 0. The only signi�cant coe¢ cient among the coe¢ cients for players competing asindividuals set is for the RAG treatment in phase 1 when those individuals are competingagainst 5 person groups. This is the same con�guration as in the second phase of theAG treatment but the contributions in the latter are not signi�cantly di¤erent from thebaseline. This suggests that having initial experience of being a single person competingagainst another individual before competing against a group leads to di¤erent contributionlevels than if an individual is matched against a group for their initial experience. Therelated point of interest is that in the AG treatment, there is no signi�cant di¤erence incontributions for the subjects competing as individuals in phase 2 when matched againsta group and the phase 1 contributions in the baseline case. Thus these subjects are notadjusting their contribution level as their rival group changes from an individual in Phase1 to a group of 5 in Phase 2: Other pairwise comparisons among treatments can be doneby comparing the relevant coe¢ cients. For all of the coe¢ cients that are not di¤erent from0 and positive, it should be clear that they will also not be signi�cantly di¤erent from eachother. The con�dence intervals around each estimate are large enough that they will turnout to be not signi�cantly di¤erent from the one negative coe¢ cient as well.7
One aspect of these results that might seem surprising given the graphical depictionin �gure 4 is the fact that the variable for the RAG in Phase 2 for those who had beencompeting as individuals is not signi�cantly di¤erent from the baseline data. While it shouldbe obvious, we also note for completeness that this coe¢ cient is not signi�cantly di¤erentfrom the one for the subjects in Phase 2 of the RAG who �rst competed as members of thegroup, p�value of 0.28. While the coe¢ cient on the dummy variable for the individuals islarge, it is insigni�cant because there is such substantial variance in the contributions ofthose subjects.
Result 2 - There is no statistically signi�cant di¤erence in contributions between SG Phase2 and the subjects competing as members of 5 person groups in AG phase 2 but there is aborderline signi�cant increase among subjects in 5 person groups during Phase 1 of the RAGtreatment. In all cases though, individuals show decreased contribution levels when in groupsof 5 rather than when playing as individuals.
Again support for this is straightforward to �nd in table 4. In the regressions includingall data, the dummy variables for the cases in which subjects are competing as members ofgroups are signi�cant, large (in absolute value) and negative indicating the drop from thebaseline 1V1 condition. In the regression using only data from individuals competing asgroup members, the dummy variable for Phase 2 of the AG is insigni�cant but the coe¢ cientfor the counterparts in the RAG is borderline signi�cant (actual p�value=0.096). So whilethere may be some increase in contributions in the RAG treatment, in general members ofthe large groups behave quite similarly when facing individuals or other large groups.
To understand how subjects� behavior depends on past experience and not just thetreatment alone, we present another set of regressions better aimed at these questions.Table 5 provides separate regressions for each distinct population of subjects in which we
7The most relevant coe¢ cient to test against the negative one would be AG, Phase 1 Ind as it is of interestwhether these individuals are signi�cantly di¤erent from individuals in the AG, Phase 1 Group population.The result of this test is a p�value of 0.154 indicating that there is no statistically signi�cant di¤erence inbehavior between those who will be later competing as individuals and those who will be later competingas groups in the 1v5 phase.
12

All Data Group Data Only
Players Baseline Phase 2 11.20Competing (25.34)
as Individuals AG, Phase 1 Ind 63.23(53.86)
AG, Phase 1 Group -11.79(34.11)
SG, Phase 1 23.59(31.72)
RAG, Phase 2 Ind 167.8(135.69)
RAG, Phase 2 Group 19.56(40.82)
AG, Phase 2 Ind -3.327(52.76)
RAG, Phase 1 Ind 240.7***(73.52)
Players SG, Phase 2 -286.1***Competing (26.26)
in Groups AG, Phase 2 Big -268.9*** 17.20(27.28) (10.48)
RAG, Phase 1 Big -260.5*** 25.62*(29.47) (15.30)
Constant 336.9*** 50.79***(25.73) (5.24)
Observations 5760 2175Adjusted R2 0.36 0.01
Robust standard errors in parentheses, *** p<0.01, ** p<0.05, * p<0.1
Table 4: Pooled OLS regressions of contributions on main treatment e¤ects with robuststandard errors clustered by subject. Baseline Phase 1 data is the default comparison forAll Data regression and Phase 2 SG is the default for the Group Data Only regression.
13
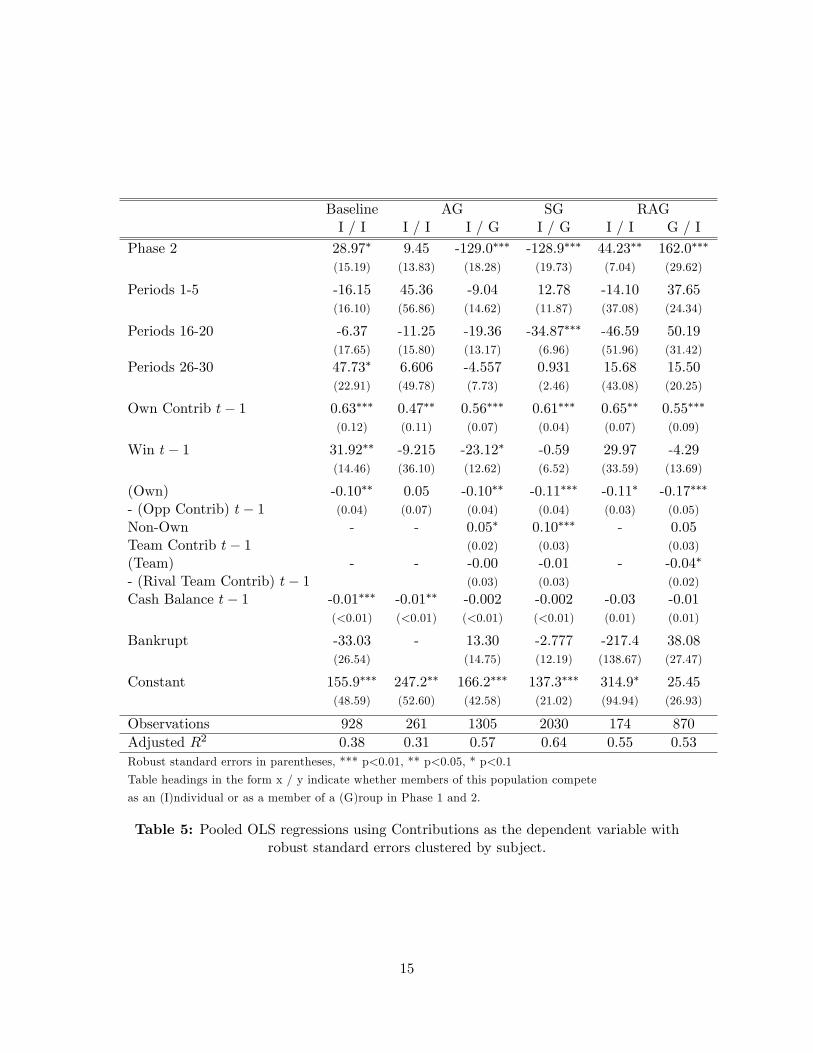
distinguish by treatment and by group in the AG and RAG treatments. The regressionsconsist of individual contributions being regressed on various measures of prior experience ofa subject. The underlying speci�cation is pooled OLS with robust standard errors clusteredby subject. The next several results will provide an interpretation of these regression results.
Result 3 - There are not strong temporal e¤ects after controlling for subject responses toprior experiences.
While the �gures above do show time trends, careful regression analysis shows thatthese apparent time trends can mostly be explained by forces other than simple time trends.There are three variables included in the regressions designed to pick up any adjustmentsbased on temporal e¤ects alone. One is a dummy variable for the �rst �ve rounds of theexperiment and it is insigni�cant in all populations. The second is a dummy variable forthe �ve rounds at the beginning of Phase 2 and it is signi�cant for only one population.The �nal variable is a dummy variable for the �nal �ve rounds to detect an end game e¤ectand it is signi�cant for only a single population. The general lack of signi�cance of thesevariables indicates that there are in general few shifts in the data occurring at di¤erentpoints in the experiment not explained by the other variables. The two that are found to besigni�cant are inconsistent in sign and location in the experiment which does not suggestthat they indicate a systematic e¤ect.
Result 4 - There is a substantial e¤ect of inertia (or perhaps substantial individual hetero-geneity) but relatively weak responses to past outcomes. Subjects do appear though to con-sistently respond to the di¤erential between their and their opponent�s contributions whencompeting as an individual.
The variables for an individual�s own past contributions are included to measure theinertia level in a subject�s contributions. A possibly superior interpretation of that variablethough is as a way of modeling individual heterogeneity. This variable turns out to behighly signi�cant and to possess substantial coe¢ cients indicating that subjects tend tomaintain similar contribution levels from one period to the next. The other variables onprior experience are typically of inconsistent signi�cance across treatments and even whensigni�cant typically small in magnitude. For example, in two of the populations, subject�scontributions are found to be signi�cantly related to whether they won in the previous roundand the e¤ects appear sizable but the e¤ects are opposite in sign between the two populationsindicating a lack of a consistent e¤ect. There is, however, one of these experience variablesthat is robustly signi�cant across treatments and of approximately the same magnitudewhich is the variable (Own) - (Opponents�Contrib) t � 1: This variable is the di¤erencebetween the subject�s own contribution and their opponent�s in the prior round when thesubject is competing as an individual. It is 0 when competing as a group. The relativecontribution levels between groups are accounted for in the next two variables in the table.The variable referring to relative contributions for individuals is robustly negative and ofsimilar magnitude across treatments indicating a robust e¤ect. This sign being negativeindicates that subjects adjust their contributions to be closer to that of their opponent,but the magnitude indicates that they only adjust by around 10% of the di¤erential. Thisindicates that the subjects do consistently react to their opponent�s behavior when playingas individuals but the magnitude of the response might be judged small.
Table 5 contains two additional variables of importance which are a subject�s Cash Bal-
14
Baseline AG SG RAGI / I I / I I / G I / G I / I G / I
Phase 2 28.97� 9.45 -129.0��� -128.9��� 44.23�� 162.0���
(15.19) (13.83) (18.28) (19.73) (7.04) (29.62)
Periods 1-5 -16.15 45.36 -9.04 12.78 -14.10 37.65(16.10) (56.86) (14.62) (11.87) (37.08) (24.34)
Periods 16-20 -6.37 -11.25 -19.36 -34.87��� -46.59 50.19(17.65) (15.80) (13.17) (6.96) (51.96) (31.42)
Periods 26-30 47.73� 6.606 -4.557 0.931 15.68 15.50(22.91) (49.78) (7.73) (2.46) (43.08) (20.25)
Own Contrib t� 1 0.63��� 0.47�� 0.56��� 0.61��� 0.65�� 0.55���
(0.12) (0.11) (0.07) (0.04) (0.07) (0.09)
Win t� 1 31.92�� -9.215 -23.12� -0.59 29.97 -4.29(14.46) (36.10) (12.62) (6.52) (33.59) (13.69)
(Own) -0.10�� 0.05 -0.10�� -0.11��� -0.11� -0.17���
- (Opp Contrib) t� 1 (0.04) (0.07) (0.04) (0.04) (0.03) (0.05)
Non-Own - - 0.05� 0.10��� - 0.05Team Contrib t� 1 (0.02) (0.03) (0.03)
(Team) - - -0.00 -0.01 - -0.04�
- (Rival Team Contrib) t� 1 (0.03) (0.03) (0.02)
Cash Balance t� 1 -0.01��� -0.01�� -0.002 -0.002 -0.03 -0.01(<0.01) (<0.01) (<0.01) (<0.01) (0.01) (0.01)
Bankrupt -33.03 - 13.30 -2.777 -217.4 38.08(26.54) (14.75) (12.19) (138.67) (27.47)
Constant 155.9��� 247.2�� 166.2��� 137.3��� 314.9� 25.45(48.59) (52.60) (42.58) (21.02) (94.94) (26.93)
Observations 928 261 1305 2030 174 870Adjusted R2 0.38 0.31 0.57 0.64 0.55 0.53Robust standard errors in parentheses, *** p<0.01, ** p<0.05, * p<0.1
Table headings in the form x / y indicate whether members of this population compete
as an (I)ndividual or as a member of a (G)roup in Phase 1 and 2.
Table 5: Pooled OLS regressions using Contributions as the dependent variable withrobust standard errors clustered by subject.
15

ance at the end of the prior round and a dummy variable indicating whether or not theyhave previously gone bankrupt. The latter variable is insigni�cant in all cases indicatingthat subjects after a bankruptcy bid no di¤erently from other subjects. The Cash Balancevariable is one that is di¢ cult to interpret. It is negative and signi�cant in two treatmentswhich might be taken as an indication that when subjects are getting close to bankruptcythey contribute more to implement that generous indemnity option for �rst time bankrupt-cies. This e¤ect is quite small though and is insigni�cant in the RAG treatment whichgenerated the most bankruptcies while being largest in the Baseline treatment (in terms ofsigni�cance) which generated only two bankruptcies.8
These �rst four results collectively imply that there were three driving forces behindthe observed contributions. Those forces consist of responses to treatment, individual het-erogeneity and, when playing as an individual against another individual, some adjustmentbased on the previous choices of an opponent. The dominant point though seems to bethat whatever is driving the overcontributions does not appear to be learned behavior fromdynamic interaction. Rather it appears to be consistent and persistent from the �rst in-stance of engaging in the rent seeking game and it does not dissipate over time. Given thatand the individual heterogeneity in the degree of overcontribution this would suggest thatexplanations for this behavior could be based on heterogeneity in individual preferences,perceptions of probabilities or some similar phenomenon. We return to this point in theconclusion.
The statistical characterization of the individual behavior is useful for understandinghow individuals respond to the di¤erent group arrangements, but it is also important tounderstand how the overall contributions adjust and ultimately the impact on social wel-fare. Table 6 presents a pair of regressions to determine how these variables change underthe di¤erent treatments. The �rst regression uses the total contributions of each groupper period, or
Pj2Gi xj ; as the dependent variable while the second uses the percentage
of total rent or social welfare dissipated by period, or�P
j2Gi xj +Pj2G�i xj
�=R. The
independent variables are all just dummy variables indicating the phase and treatment. Forthe group production regressions, there are separate variables in the asymmetric phases forthe small and large groups to allow us to compare the group totals. The default comparisongroup is phase 1 of the Baseline treatment. We will present the interpretation of theseregressions in an additional two results.
Result 5 - The only two group con�gurations that lead to di¤erences in total contributionsare the symmetric 5-member groups and the individuals in the asymmetric phase of the RAGtreatment. All other groups generate total contributions that are not signi�cantly di¤erentfrom the baseline.
This result demonstrates an intriguing property of the data. While it should not be a
8 Interpreting this variable is made more di¢ cult though by an endogeneity issue. Is it the case that alow cash balance is driving aggressive behavior or is the low cash balance due to the fact that the subjectcontributes aggressively? There is also another confound due to the fact that cash balance is potentially atime measure as well. Disentangling these issues is shown in Ham, Kagel, and Lehrer (2005) to be a problemin any study of this sort not designed to speci�cally examine the relationship between current wealth andbehavior and as that was not the purpose of the present study we can not appropriately derive properinference on this issue. We will only argue that there is no reason to suspect a strong relationship betweencontribution behavior and wealth.
16

Total Group Contributions Rent DissipationPhase 2 Baseline, 1V1 11.20 0.022
(26.187) (0.052)
AG Phase 1, 1V1 0.712 0.001(35.300) (0.071)
SG Phase 1, 1V1 23.591 0.047(41.657) (0.083)
RAG Phase 2, 1V1 44.271 0.089(51.961) (0.104)
AG Phase 2, 1V5 Individuals -3.327 -(54.491)
AG Phase 2, 1V5 Groups 2.991 -(45.976)
AG Phase 2, 1V5 ALL - -0.0003(0.073)
SG Phase 2, 5V5 -82.994�� -0.166��
(37.035) (0.074)
RAG Phase 1, 1V5 Individuals 240.651��� -(75.108)
RAG Phase 1, 1v5 Groups 45.095 -(67.301)
RAG Phase 1, 1v5 ALL - 0.286���
(0.098)
Constant 336.927��� 0.674���
(28.400) (0.057)
Observations 4020 2010Adjusted R2 0.032 0.040Robust standard errors in parentheses, *** p<0.01, ** p<0.05, * p<0.1
Table 6: Pooled OLS regressions using Group Contributions or the total percentage ofsurplus dissipated as the dependent variable. Phase 1 of the Baseline is the comparison
treatment.
17

surprise that none of the individuals (except in phase 1 of the RAG treatment) generatedi¤erent contributions based upon result 1, it is perhaps more surprising that the 5-membergroups in the AG treatment generate on average the same level of total contributions asthe individuals. This shows that the individuals do not respond to the change in the sizeof their rival group and that the members of that rival group on average simply divide theaverage individual contribution by 5 to arrive at their contributions toward their group�schances of winning. Perhaps this is an indication that the subjects are not falling victimto the free-rider problem in this situation. On the other hand, we do see a drop in totalgroup contributions in the 5V5 arrangement in the SG treatment. While the individualcontributions in the SG treatment do not di¤er statistically from the 5-member groups inthe AG treatment, once those individual contributions are added up the di¤erence becomeslarge enough to be signi�cant at the 10% level. Again, the most substantial di¤erence isfound in the �rst phase of the RAG treatment with the members of the single group outcontributing all other group arrangements.
This results allows us to better interpret result 1 which showed that individuals didnot alter their contributions based upon being matched with individuals or �ve membergroups despite the theoretical prediction that they should. Result 5 helps to explain whythis was perhaps reasonable behavior by the individuals. It is easy to see that an individualshould best respond to the total contributions of the rival group regardless of the makeupof that group. Consequently, if the �ve member groups are contributing at the same levelas individuals by themselves, then those individuals matched with the �ve member groupsshould in fact not alter their behavior. Alternatively, given the contribution level of theindividuals, those in the �ve member groups should still best respond by lowering theircontributions. Consequently the key deviation from the equilibrium predictions is by the�ve member groups and not the fact that the individuals do not appear to respond to facinggroups of di¤erent size.
Result 6 - The symmetric 5-member group con�guration yields the least rent dissipationwhile the asymmetric phase of the RAG treatment yields the most. All other arrangementsyield on average the same level of rent dissipation.
This result is of course heavily foreshadowed by result 5 but the second regression intable 6 provides the veri�cation of the point. Most of the treatments yield a base level ofrent dissipation of about 67% while the 5V5 arrangement drops this by about 20 percentagepoints and the asymmetric phase of the RAG increases it by 29 percentage points. Theoverall levels are all greater than the theoretical predictions and only the comparative staticprediction of the shift between the 1V1 or 1V5 and the 5V5 con�guration is validated. Thepredicted drop between the 1V1 and 1V5 is not borne out in the data.
5 Conclusion
The motivation of this study was to examine how the con�ict among individual, groupand social concerns would net out in rent seeking games. In general we �nd strong over-contribution relative to Nash levels which leads to an overall level of social welfare which isnot only lower than the social optimum benchmark but also much lower than the equilibriumbenchmark. Our result matches with the over-contribution found in investigations of all-pay
18

auctions such as Noussair and Silver (2006), over rent-seeking in contests for intra-groupnon-rivalrous prizes between asymmetrically sized groups reported in Abbink et. al. as wellas some of the previously cited work on rent seeking and tournament contests.
Explaining the degree of over contribution is more di¢ cult. As explained above, thefact that the predominant determinants of contribution levels are simply response to treat-ment and individual heterogeneity suggests the explanations for the ovecontribution shouldbe found in modeling individual characteristics that lead to the overcontribution. Onecandidate for this is found in Baharad and Nitzan (2008) where the authors attempt tounderstand deviations from Nash behavior by assuming that participants mis-perceive thetrue probability of winning according to a standard S-shape, which overweights low proba-bilities and under-weights high probabilities. They �nd that they predict under-dissipationfor the numbers of contestants examined here and only �nd over-dissipation when a largenumber of groups are competing for the prize. This does not match our �ndings. Salmonand Iachini (2007) provides a model of attentional bias in which decision makers place lessweight on undesirable states than they should, which is able to explain overbidding in all-pay auctions. Applications of that model to this environment, though, can not generateover-contribution to the degree observed here for reasonable parameterizations. Thus somealternative model is clearly needed to provide a satisfactory explanation for this behavior.
Perhaps more surprising results emerge when we examine group behavior. In the treat-ment with individuals matched against �ve member groups, equilibrium analysis suggeststhat the group should su¤er from under-contributions due to free riding and that the in-dividuals should anticipate this and reduce their contributions accordingly. What we �ndinstead is that the groups do not reduce their contributions by as much as expected, leavingtheir overall total contributions to be the same as the individuals. As a result the indi-viduals best respond by keeping their contributions constant. This is consistent with andcomplements Abbink et al.�s �nding that, when the prize is intra-group nonrivalous, thetotal group contribution for rent-seeking increases instead of remaining at the same level(as would be predicted according to the Nash equilibrium).
We also �nd that, contrary to the equilibrium prediction, the overall contribution levelsdo not decrease as substantially as predicted when two groups are competing comparedto when two individuals are competing. Consequently, at least in our results we �nd thatthe groups are not su¤ering from a public good or free-rider problem as much as onewould expect. The cause of this phenomenon is an open question and is a prime areafor further research. Our experimental results appear to eliminate at least two possibleexplanations. First, the high level of contribution is clearly not an e¤ort to maximizeoverall social welfare. High levels of contribution in the standard public goods games maybe interpreted as attempts to raise social welfare. In our experiment, however, in-groupcontributions for rent-seeking actually decrease social welfare and, thus, the observed over-contribution is inconsistent with a motivation to maximize overall social welfare. Secondly,we investigated whether the result could be an artifact of sequencing, that is in the AGtreatment is the lack of an adjustment to the asymmetric condition due to some imprintingof norms from the initial experience competing as individuals. Given the results of the RAGtreatment in which ordering was reversed, it does not appear to be the case that the behaviorin the asymmetric phase is driven by an ordering e¤ect. In fact, the initial experiencecompeting against individuals could have been a moderating in�uence on contributions.
19

One other simple explanation might be the relatively small decrease in expected monetarypayo¤ when an individual belonging to a large group over-contributes. The fact that we seesimilar over-contributions by the individual players not belonging to a group, for whom over-contribution is quite costly, suggests that this should not be the main explanation either.Further research will be necessary to exactly identify the reasons for the over-contributionin group rent-seeking games.
References
Abbink, K., J. Brandts, B. Herrmann, and H. Orzen (2010). Inter-Group Con�ict andIntra-Group Punishment in an Experimental Contest Game. The American EconomicReview �(�), �.
Baharad, E. and S. Nitzan (2008). Contest E¤orts in Light of Behavioral Considerations.The Economic Journal 118, 2057�2059.
Baik, K. B. and S. Lee (1997, February). Collective rent seeking with endogenous groupsizes. European Journal of Political Economy 13 (1), 121�130.
Baik, K. H. and J. F. Shogren (1995). Competitive-share group formation in rent-seekingcontests. Public Choice 83, 113�126.
Bornstein, G. (2003). Intergroup con�ict: Individual, group and collective interests. Per-sonality and Social Psychology Review 7 (2), 129�145.
Bornstein, G. and M. Ben-Yossef (1994). Cooperation in intergroup and single-group socialdilemmas. Journal of Experimental Social Psychology 30 (11), 52�67.
Bornstein, G., E. Winter, and H. Goren (1996). Experimental Study of Repeated Team-Games. European Journal of Political Economy 12, 629�639.
Bull, C., A. Schotter, and K. Weigelt (1987). Tournaments and Piece rates: An Experi-mental Study. Journal of Political Economy 95 (1), 1�33.
Cox, J. C. and S. C. Hayne (2006). Barking up the right tree: Are small groups rationalagents? Experimental Economics 9 (3), 209�222.
Davis, D. D. and R. J. Reilly (2000). Multiple Buyers, Rent-Defending and the ObservedSocial Costs of Monopoly. Paci�c Economic Review 5, 389�410.
Fischbacher, U. (2007). z-Tree: Zurich Toolbox For Readymade Economic Experiments.Experimental Economics 10 (2), 171�178.
Fonseca, M. (2009). An experimental investigation of asymmetric contests. InternationalJournal of Industrial Organization 27 (5), 582�591.
Gunnthorsdottir, A. and A. Rapoport (2006). Embedding Social Dilemmas in Inter-group Competition Reduces Free-Riding. Organizational Behavior and Human DecisionProcesses 101, 184�199.
20
Gürtler, O. (2005). Collective contests with externalities: Corrigendum. European Journalof Political Economy 21 (2), 533�536.
Ham, J., J. Kagel, and S. Lehrer (2005, March-April). Randomization, Endogeniety andLaboroatory Experiments: The Role of Cash Balances in Private Value Auctions. Journalof Econometrics 125 (1-2), 175�205.
Hayne, S. C. and J. C. Cox (2005). When does an incentive for free riding promote rationalbidding? In Experimental Business Research, pp. 133�149. Springer US.
Insko, C. A., J. Schopler, K. A. Graetz, S. M. Drigotas, D. P. Currey, S. L. Smith, D. Brazil,and G. Bornstein (1994). Interindividual-intergroup discontinuity in the prisoner�s dilemmagame. Journal of Con�ict Resolution 38 (1), 87�116.
Insko, C. A., J. Schopler, J. F. Kennedy, K. Dahl, K. A. Graetz, and S. M. Drigotas(1992). Individual-group discontinuity from the di¤ering perspectives of campbell�s realisticgroup con�ict theory and tajfel and turner�s social identity theory. Social PsychologyQuarterly 55 (3), 272�291.
Krueger, A. O. (1974). The Political Economy of the Rent-Seeking Society. AmericanEconomic Review 64 (3), 291�303.
Lee, S. (1995, October). Endogenous sharing rules in collective-group rent-seeking. PublicChoice 85 (1/2), 31�44.
Lee, S. and J. H. Kang (1998, November). Collective contests with externalities. EuropeanJournal of Political Economy 14 (4), 727�738.
Millner, E. L. and M. D. Pratt (1989). An Experimental Investigation of E¢ cient Rent-Seeking. Public Choice 62 (2), 139�151.
Millner, E. L. and M. D. Pratt (1991). Risk Aversion and Rent Seeking: An Extensionand Some Experimental Evidence. Public Choice 69 (1), 81�92.
Nalbantian, H. R. and A. Schotter (1997). Productivity Under Group Incentives: AnExperimental Study. American Economic Review 87 (3), 314�340.
Nitzan, S. (1991). Collective rent dissipation. Economic Journal 101, 1522�1534.
Noussair, C. and J. Silver (2006). Behavior in All-Pay auctions with Incomplete Informa-tion. Games and Economic Behavior 55 (1), 189�206.
Orrison, A., A. Schotter, and K. Weigelt (2004). Multiperson Tournaments: An Experi-mental Examination. Management Science 50 (2), 268�279.
Rogerson, W. P. (1982). The social costs of monopoly and regulation: A game theoreticanalysis. The Bell Journal of Economics 13, 391�401.
Salmon, T. C. and M. Iachini (2007). Continuous Ascending Vs. Pooled Multiple UnitAuctions. Games and Economic Behavior 61 (1), 64�85.
21

Shogren, J. F. and K. H. Baik (1991). Re-examining E¢ cient Rent-Seeking in LaboratoryMarkets. Public Choice 69, 69�97.
Sutter, M., M. G. Kocher, and S. Strauß(2009). Individuals and teams in auctions. OxfordEconomic Papers 61 (2), 380�394.
Tullock, G. (1967). The Welfare Costs of Tari¤s, Monopolies and Theft.Western EconomicJournal 5, 224�32.
22