rental housing discrimination and the persistence of ...ftp.iza.org/dp5583.pdf · spanish cities,...
TRANSCRIPT

DI
SC
US
SI
ON
P
AP
ER
S
ER
IE
S
Forschungsinstitut zur Zukunft der ArbeitInstitute for the Study of Labor
Rental Housing Discrimination and thePersistence of Ethnic Enclaves
IZA DP No. 5583
March 2011
Mariano BoschM. Angeles CarneroLídia Farré

Rental Housing Discrimination and the
Persistence of Ethnic Enclaves
Mariano Bosch Universidad de Alicante
M. Angeles Carnero
Universidad de Alicante
Lídia Farré IAE-CSIC, Barcelona GSE and IZA
Discussion Paper No. 5583 March 2011
IZA
P.O. Box 7240 53072 Bonn
Germany
Phone: +49-228-3894-0 Fax: +49-228-3894-180
E-mail: [email protected]
Any opinions expressed here are those of the author(s) and not those of IZA. Research published in this series may include views on policy, but the institute itself takes no institutional policy positions. The Institute for the Study of Labor (IZA) in Bonn is a local and virtual international research center and a place of communication between science, politics and business. IZA is an independent nonprofit organization supported by Deutsche Post Foundation. The center is associated with the University of Bonn and offers a stimulating research environment through its international network, workshops and conferences, data service, project support, research visits and doctoral program. IZA engages in (i) original and internationally competitive research in all fields of labor economics, (ii) development of policy concepts, and (iii) dissemination of research results and concepts to the interested public. IZA Discussion Papers often represent preliminary work and are circulated to encourage discussion. Citation of such a paper should account for its provisional character. A revised version may be available directly from the author.

IZA Discussion Paper No. 5583 March 2011
ABSTRACT
Rental Housing Discrimination and the Persistence of Ethnic Enclaves*
We conduct a field experiment to show that discrimination in the rental market represents a significant obstacle for the geographical assimilation process by immigrants. We employ the Internet platform to identify vacant rental apartments in different areas of the two largest Spanish cities, Madrid and Barcelona. We send emails showing interest in the apartments and signal the applicants’ ethnicity by using native and foreign-sounding names. We find that, in line with previous studies, immigrants face a differential treatment when trying to rent an apartment. Our results also indicate that this negative treatment varies considerably with the concentration of immigrants in the area. In neighborhoods with a low presence of immigrants the response rate is 30 percentage points lower for immigrants than for natives, while this differential disappears when the immigration share reaches 50%. We conclude that discriminatory practices in the rental housing market contribute to perpetuate the ethnic spatial segregation observed in large cities. JEL Classification: J15, J61 Keywords: immigration, discrimination, spatial segregation Corresponding author: Lídia Farré Institut d’Anàlisi Econòmica Campus UAB 08193 Bellaterra, Barcelona Spain E-mail: [email protected]
* We thank Jesús Fernández-Huertas Moraga for helpful comments and suggestions. Financial support from Fundación Ramón Areces to the project “Discriminación por raza y género en el mercado español” is gratefully acknowledged. We also acknowledge the IVIE (Instituto Valenciano de Investigaciones Económicas) and the Spanish Ministry of Science for grants ECO2008-05721/ECON and SEJ2007-62656. Farré acknowledges the support of MOVE, the Barcelona GSE and the Government of Catalonia.

1 Introduction
Upon arrival to a new country immigrants often settle in segregated neighborhoods. Ethnic
networks are useful to �nd a job and facilitate the adjustment to the new society (Bartel 1989;
Zavodny 1997; Jaeger 2000; Bauer et al. 2002, 2005). As the newcomers or their descendants
assimilate - �nd a steady job, accumulate some wealth and form families - they may be willing
to move out of the ethnic enclave. A di¤erent address in a less segregated neighborhood may
signal that the immigrant family has improved economically and socially. However, a well-
established empirical regularity is that immigrants in advanced societies tend to live spatially
concentrated within large cities (Bartel 1989; Borjas 1998).
The most common theories to explain the formation of ethnic enclaves are based on the
fact that immigrants prefer living near people with similar tastes and who speak the same
language (Cutler et al. 1999). Hence, the concentration of immigrants in particular areas
is demand driven. However, it has also been suggested that the native�s behavioral response
towards immigration may contribute to the surge of ethnic enclaves (Card et al. 2008 and
Saiz and Wachter 2011). The literature has identi�ed two main mechanisms. First, natives
may be willing to move to all-native neighborhoods and pay a premium to avoid immigrants
(decentralized discrimination). Second, natives can �nd ways to e¤ectively restrict immigrant
location choices to certain areas (centralized discrimination).
This paper investigates the role of rental housing discrimination for the persistence of ethnic
enclaves. To isolate the e¤ect that discriminatory practices have in determining residential
sorting we conduct a �eld experiment where native and immigrant candidates apply to vacant
rental apartments announced on the Internet in the two largest Spanish cities, Madrid and
Barcelona. We employ Moroccan and Spanish-sounding names in the applications to signal the
ethnicity of the candidate.1 We then compare the response rate di¤erentials between the two
groups across areas with di¤erent concentration of immigrants to identify the extent to which
rental housing discrimination represents a barrier for the geographical assimilation process.
Our results uncover a signi�cant negative correlation between the immigration share in a
particular neighborhood and the degree of discrimination against Moroccan applicants. That
1By nationality the most numerous groups of immigrants come from Romania (14.2%), Morocco (12.7%),
Ecuador (7.4%) and Colombia (5.2%). Source: Spanish Statistical O¢ ce, Local Population Registry, 2009.
We restrict our analysis to Moroccan immigrants as their names, as opposed to those of Ecuadorians and
Rumanians, are clearly distinguishable from those of natives.
2
is, discrimination against immigrants is particularly intense in areas where there are very few
immigrants. In particular, the response rate to applications signed with a Moroccan-sounding
name is, on average, 18 percentage points lower than to those signed by natives. However, in
all-natives neighborhoods this di¤erential would increase up to 30 percentage points. As the
share of immigrants increases the di¤erential treatment decays. Accordingly where this share
is around 50%, immigrants and natives have the same probability of being contacted.2 This
result is robust to the inclusion of �at and applicant�s socioeconomic characteristics. While
we do not claim that discriminatory practices are behind the creation of ethnic enclaves, our
evidence strongly suggests that discrimination in the rental market can perpetuate the spatial
ethnic segregation pattern observed in large cities.
The bulk of previous studies on ethnic enclaves and segregation have been conducted in the
US. A recent study by Cutler et al. (2008) examines the residential integration of the foreign
born between 1910 and 2000. Using decennial census data they document that segregation
declined in the �rst part of the century, but has been rising over the past few decades. They
argue that the increase responds mainly to two forces: First, recent immigrants arrive from
countries with greater cultural distinction from the US natives and thus a higher propensity
to segregate. Second, the rise of low-density suburban residence and employment areas forces
socially and economically marginalized groups to live close to the public transit grid or potential
carpool-mates. In addition, Saiz and Wachter (2011) document that natives have preferences
for avoiding immigrant areas and are willing to pay a premium to live in predominantly native
neighborhoods.3 Card et al. (2008) provide further support for the view that segregation is
driven at least in part by preferences of white families over the racial and ethnic composition
of neighborhoods. They show that when the minority share in the neighborhoods exceeds a
certain level, which ranges between 5% and 20% (i.e. the tipping point), all the white families
leave.
Native preferences for spatial ethnic segregation or the so called "white �ight" can be viewed
as a form of discrimination in highly mobile societies where residents are willing to change neigh-
borhood as the minority population increases. However, in societies less prone to geographical
2Similar results are obtained when the share of all immigrants is replaced by the share of only Moroccan
immigrants.3Saiz and Wachter (2011) �nd that within metropolitan areas increases in a neighborhood�s immigrant share
are associated with lower housing price appreciation.
3
mobility, like Spain, negative attitudes toward the minority group may lead to other discrim-
inatory practices that range from charging immigrants higher housing prices to limiting their
housing search to speci�c areas.
A number of papers have used housing price di¤erentials to measure the extent of discrim-
ination (see for example Bailey 1966, Yinger 1978 or Chambers 1992). While in the 1960s
there was evidence that African-Americans paid more for equivalent housing in US cities and
metropolitan areas, this premium had entirely disappeared by 1990. Another approach to quan-
tify the extent of discrimination is based on experimental audit studies to test the behavior
of real estate and rental agents. These studies suggest some degree of discrimination against
Hispanics in terms of the quality, price and quantity of housing units o¤ered (Yinger 1995).
In this paper we examine the extent to which natives are able to impose barriers to the
geographical assimilation of immigrants by limiting the supply of rental housing units. The use
of the Internet platform has become very popular to buy, sell or rent housing units. Advertising
on the Internet is usually free of charge and candidates can contact the property owners by re-
sponding to the ad at no cost. Renters and sellers can then decide whether to provide additional
information or invite the potential candidate to a showing. Note that discrimination in this
context is costless as property owners are not obliged to respond emails and thus di¤erential
treatment cannot be proved or reported to the authorities.
The Internet platform has been employed in previous investigations to uncover the presence
of discriminatory practices in the rental market (Ahmed and Hammarstedt 2008; Ahmed et
al. 2010 and Bosch et al. 2010). These studies �nd evidence of a substantial amount of
discrimination against immigrants, which does not disappear even when the candidates signal a
high ability to pay the rent. Our contribution here is to show that rental housing discrimination
complicates the geographical assimilation process of immigrants and thus contributes to the
persistence of ethnic enclaves.
The paper is organized as follows. The next section describes the geographical concentration
of immigrants in Spain, section 3 describes the experimental setup, section 4 discusses our main
results and some conclusions follow in section 5.
4

2 The geographical concentration of immigrants
The immigration episode in Spain began in the late 1990�s. Over a period of 10 years the share
of foreign born population shifted from 3% to 14%. While the labor market impact of this
supply shock has been found to be negligible, the immigration episode radically reshaped the
ethnic composition of Spanish regions and cities.4
Immigrants are unevenly distributed across Spain. Regions in the Mediterranean coast, the
Canary and Balearic Islands and the province of Madrid have received the bulk of immigration.
Economic reasons and network e¤ects seem to be responsible for this regional concentration
(Farré et al. 2009). In those regions immigrants are more likely to be in urban than in rural
areas and within cities the degree of geographical segregation is substantial (Fernández-Huertas
et al. 2009).
In this paper we study the concentration of immigrants in the two major Spanish cities,
Madrid and Barcelona. These cities concentrate the 16% of the foreign born population in
Spain in 2008. Further both cities have experienced a large increase in the share of immigrants
(i.e. from 5% in 2000 to 20% in 2008). Interestingly, within cities there are large variations in
immigrant concentration across neighborhoods. Figures 1 and 2 display the immigration share
in the di¤erent census districts in Madrid and Barcelona for 2000 and 2008.5 Immigrants are
substantially overrepresented in some areas. For example, in downtown Madrid the share of
immigrants in 2008 was 31%, while it was less than 15% in the residential areas located in the
north of the city (see Figure 1). Di¤erences in immigrant concentration across districts are
even more pronounced in Barcelona (see Figure 2).
Spain hosts immigrants from a variety of ethnic origins. The bulk of the immigration �ow,
however, comes from Latin America (30%), Eastern Europe (20%) and North Africa (13%).
Because we employ the soundness of the name to signal ethnicity, our experimental study focuses
only on Moroccan immigrants whose names are clearly distinguishable from those of natives.
Given the geographical proximity between Morocco and Spain, this group already represented
4Several studies analyze the economic impact of immigration in Spain and �nd no signi�cant e¤ect on the
wages and employment opportunities of natives (González and Ortega 2011; Carrasco et al. 2008).5There are 10 census districts in Barcelona and 21 in Madrid. The census districts are geographical sub-
divisions created for the collection of statistical data. Their average population size is 155,780 inhabitants,
with a standard deviation of 56,569, a minimum of 43,951 and a maximum of 265,866. Source: Spanish Local
Population Registry.
5
a substantial share of the foreign born population at the beginning of the immigration boom.
By 2008, they were still one of the most popular minority groups accounting for almost the
13% of all immigrants. Their spatial distribution pattern does not exhibit important di¤erences
relative to that of other groups. According to the results in Fernández-Huertas et al. (2009) the
dissimilarity index at the metropolitan area level oscillates between 0.3 and 0.5 for Moroccans,
Ecuadorians and Rumanians during the whole immigration episode. The tables accompanying
Figures 1 and 2 also display the share of Moroccan immigrants by census districts in 2008. While
their concentration pattern seems to follow that of other groups, they are overrepresented in
downtown Barcelona and the Usera district in Madrid.
The literature has identi�ed several factors that may be responsible for the existence of
ethnic enclaves. Recent immigrants choose to live in areas with a larger concentration of
people from their same country of origin. If the supply of houses in those areas is limited,
rental prices will raise in response to an immigration shock (Saiz 2007). Column (4) in the
tables below Figures 1 and 2 suggests that immigrants are indeed concentrated in expensive
neighborhoods.6 As immigrants assimilate and become less dependent of their ethnic network,
they could move to cheaper neighborhoods. In the absence of geographical barriers one would
expect a negative relationship between rental prices and years since arrival to the country
(Cutler et al. 2008). Figure 3 examines this possibility using data from the Spanish National
Immigrant Survey, 2007.7 The �gure displays the coe¢ cients obtained from regressing the
monthly rent on a set of dummy variables indicating years of residence in the country. Most
of those coe¢ cients are not statistically signi�cant, suggesting that immigrants do not tend to
move to cheaper neighborhoods.8
The high concentration of immigrants in certain areas and the high premium they seem to
pay for it may respond to the existence of natives�preferences for non-integrated neighborhoods.
Some studies suggest that natives�animosity against immigration goes beyond its economic
impact (Dustman and Preston 2007; Mayda 2006). After all, most of the e¤ects of immigration
can also be attributed to international trade, outsourcing or o¤-shoring. The singularity of
6Rental prices in 2008 are obtained from the website used to conduct our experiment (www.idealista.com).7The Spanish National Immigrant Survey collects information about the socioeconomic characteristics of a
representative sample of immigrants living in Spain in 2007. The survey is conducted by the Spanish Statistical
O¢ ce (INE, www.ine.es).8We run the same regression using only the sample of Moroccans in the National Immigration Survey and
obtain similar results.
6
immigration is the physical presence of foreigners in the host country. Accordingly natives
may view immigrants not only as a threat to their labor market prospects but also to the
country�s cultural and social life. We �nd support for this conjecture in the "Attitudes towards
Immigration" supplement of the European Social Survey, 2008. Figure 4 plots the distribution
of natives� opinions towards immigrants in terms of their economic (short dashed line) and
cultural (long dashed line) impact. The distribution of responses suggests that a substantial
fraction of the population fears the economic consequences of immigration, but also that a non
negligible one thinks that immigration tends to undermine a country�s cultural life. The solid
line indicates that natives�support to immigration is limited as a non-trivial fraction of them
thinks that immigrants have made of Spain a worse rather than a better place to live.
By reducing the supply of rental housing units available to immigrants natives can
e¤ectively block their entrance to certain areas. Next we examine the presence of this type of
discrimination and its contribution to the persistence of ethnically segregated neighborhoods.
3 Experimental Design
Our experimental approach is similar to that in other studies that have attempted to identify
discrimination in the rental housing market (Ahmed and Hammarstedt 2008; Ahmed et al.
2010 and Bosch et al. 2010). Next we brie�y summarize our strategy and highlight the main
di¤erences with respect to previous studies.
We use the email correspondence testing method to examine the chances of natives and
immigrants to rent a �at in areas with di¤erent concentration of foreign born population.
Written applications are sent to rental vacant apartments advertised on www.idealista.com,
which is the leading real estate website in Spain.9 On this platform, private owners and real
estate agencies can advertise properties for sell or rent. For private owners, the �rst ad is free
of charge. Fees for agencies start at a minimum of 79 Euros per month. In contrast, individuals
interested in a particular housing unit can send an electronic application containing the name,
email address and a short message at no cost.
In our experimental setup, the potential tenants applied to all rental ads published by
9According to this website almost 50% of people in Spain use the Internet to search for housing. Popular press
such as The New York Times, The Telegraph, The Wall Street Journal and The Washington Post, identi�es ide-
alista.com as the biggest Spanish online property advertising site (http://www.idealista.com/pagina/ranking).
7

private owners on idealista.com between December 2009 and June 2010. For each housing unit,
the site contains information on the rental price per month, the exact address, the number of
rooms, the size in squared meters and, in most cases, the name and, therefore, the gender of
the person placing the ad. Each week, we collected information on available �ats on Tuesdays
and sent the applications on the next day. One week later we recorded whether emails sent by
the �ctitious applicants received a response. Those candidates invited to visit the apartment
or to provide additional information politely declined the invitation.
Common native and Moroccan-sounding names are used to signal the ethnicity of the can-
didate. Based on name frequency data provided by the Spanish National Statistics O¢ ce
(www.ine.es), we select the most popular Spanish male names (Manuel, Antonio, José and
Juan) and female names (Ana, Isabel, Carmen and María) and the four most common Spanish
surnames (García, González, Fernández and Rodríguez). We also use the most common Moroc-
can names for males in Spain (Mohamed, Ahmed, Rachid and Youssef), the most common for
females (Rachida, Aicha, Naima and Khadija) and the four most common Moroccan surnames
(El Idrissi, Mohamed, Saidi and Serroukh).
Applicants use email accounts which have been created from 3 di¤erent providers: gmail,
hotmail and yahoo. For example: [email protected]; [email protected]
Previous studies show that information about the socioeconomic characteristics of the candi-
dates a¤ect discriminatory practices. Accordingly, we send emails containing di¤erent amount
of information about the occupation of the candidate. We consider two types of candidates:
(1) an applicant who sends an email showing interest in the �at and without any information
other the name; (2) an applicant whose email contains information about his/her highly reliable
job and therefore represents the ideal tenant for property owners (i.e. university professor or
banking clerk).
Our �ctitious applicants sent the Spanish version of the following emails:
No information
�Hello,
I am interested in renting this apartment. I would be very grateful if you contacted me.
Thank you. NAME�
8

High-paying occupation
�Hello,
I am interested in this �at. I work as a �nancial analyst for a bank (La Caixa/Caja Madrid).
I have recently moved to the city (Barcelona/Madrid) and I am looking for a �at where to live
for at least a couple of years. I would be happy to provide a �nancial guarantee. Please contact
me if interested. Many thanks. NAME�
Or alternatively:
�Hello,
I am a Professor at the Department of Political Science of the University (Pompeu Fabra/Carlos
III de Madrid). I have been living in the city (Barcelona/Madrid) for a couple of years and I
would like to �nd a new apartment. I have a permanent contract with the University. I am
very interested in your �at and I would be very grateful if you could contact me. Best regards.
NAME�.
We create eight types of �ctitious applicants: a Moroccan and a native, male and female,
candidates who do not provide information about their socioeconomic status, and four more
candidates (Moroccan and native, male and female) with information about their occupations.
We use a random assignment procedure, where each vacant apartment is contacted by only one
of the eight applicants.10 We apply to 1186 apartments, and each type of applicant applied,
approximately, to 150 apartments.
The focus of this paper however is not on the average discrimination that immigrants are
subject to, but on how discrimination varies across neighborhoods with di¤erent concentration
of immigrant population. From the Internet platform we obtain the complete address where
each vacant �at is located.11 We match this information with the geographical concentration of
immigrants obtained from the Spanish Local Population Registry.12 In particular, we employ
10Hence we follow the methodology used by Ahmed et al. (2010). Alternatively, we could have used a
matching procedure as in Bosch et al. (2010), where all property owners receive inquiries from all applicants.11The websites used in previous studies to investigate rental market discrimination do not contain the address
of the housing units, hence it is not possible to conduct the type of analysis that we propose here.12The Registry is conducted at the municipality level and it provides a very accurate measure of immigrant
9
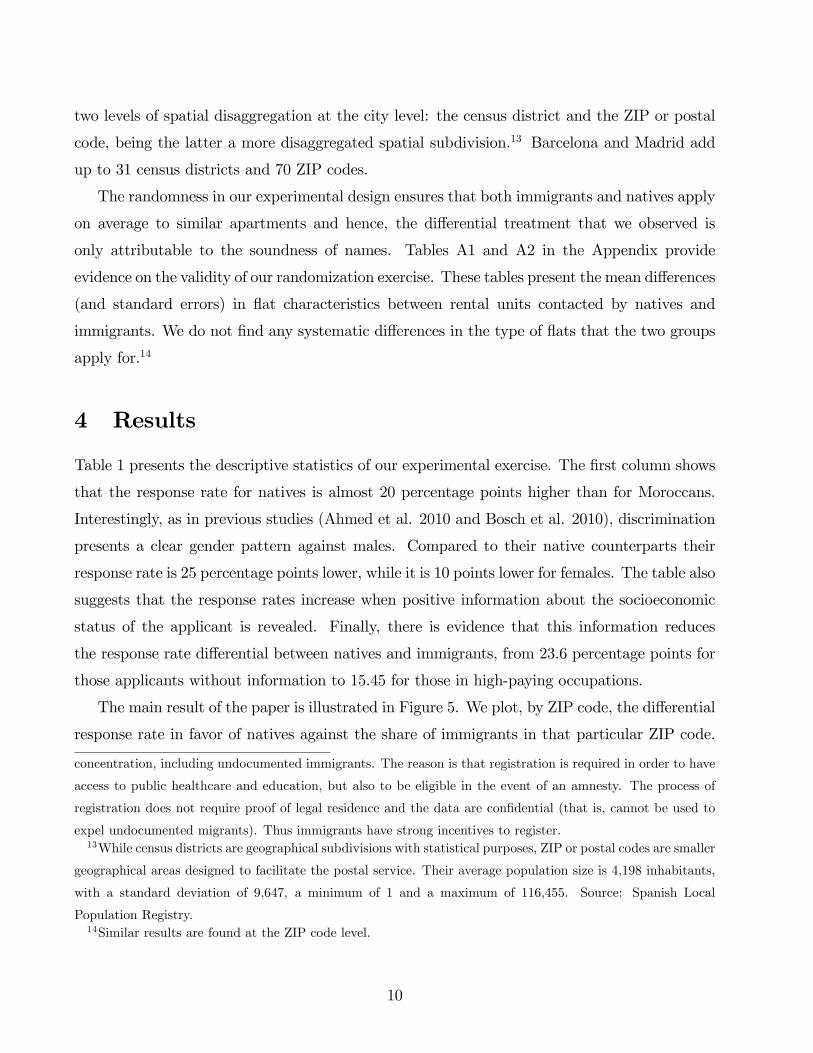
two levels of spatial disaggregation at the city level: the census district and the ZIP or postal
code, being the latter a more disaggregated spatial subdivision.13 Barcelona and Madrid add
up to 31 census districts and 70 ZIP codes.
The randomness in our experimental design ensures that both immigrants and natives apply
on average to similar apartments and hence, the di¤erential treatment that we observed is
only attributable to the soundness of names. Tables A1 and A2 in the Appendix provide
evidence on the validity of our randomization exercise. These tables present the mean di¤erences
(and standard errors) in �at characteristics between rental units contacted by natives and
immigrants. We do not �nd any systematic di¤erences in the type of �ats that the two groups
apply for.14
4 Results
Table 1 presents the descriptive statistics of our experimental exercise. The �rst column shows
that the response rate for natives is almost 20 percentage points higher than for Moroccans.
Interestingly, as in previous studies (Ahmed et al. 2010 and Bosch et al. 2010), discrimination
presents a clear gender pattern against males. Compared to their native counterparts their
response rate is 25 percentage points lower, while it is 10 points lower for females. The table also
suggests that the response rates increase when positive information about the socioeconomic
status of the applicant is revealed. Finally, there is evidence that this information reduces
the response rate di¤erential between natives and immigrants, from 23.6 percentage points for
those applicants without information to 15.45 for those in high-paying occupations.
The main result of the paper is illustrated in Figure 5. We plot, by ZIP code, the di¤erential
response rate in favor of natives against the share of immigrants in that particular ZIP code.
concentration, including undocumented immigrants. The reason is that registration is required in order to have
access to public healthcare and education, but also to be eligible in the event of an amnesty. The process of
registration does not require proof of legal residence and the data are con�dential (that is, cannot be used to
expel undocumented migrants). Thus immigrants have strong incentives to register.13While census districts are geographical subdivisions with statistical purposes, ZIP or postal codes are smaller
geographical areas designed to facilitate the postal service. Their average population size is 4,198 inhabitants,
with a standard deviation of 9,647, a minimum of 1 and a maximum of 116,455. Source: Spanish Local
Population Registry.14Similar results are found at the ZIP code level.
10
Positive numbers in the y-axis indicate that emails signed with a native-sounding name obtain a
higher response rate than those signed with a foreign-sounding one. The �gure also displays the
�tted values from regressing the response rate di¤erential on the share of immigrants, weighted
by number of observations at the ZIP level. Although, arguably, there is some noise in the
data, a negative relationship emerges, indicating that as the share of immigrants increases in
a particular area rental housing discrimination decreases. This evidence suggests that while
many factors are likely to be responsible for the geographical concentration of immigrants,
the presence of arti�cial barriers to their mobility may contribute to the persistence of ethnic
enclaves in large cities.
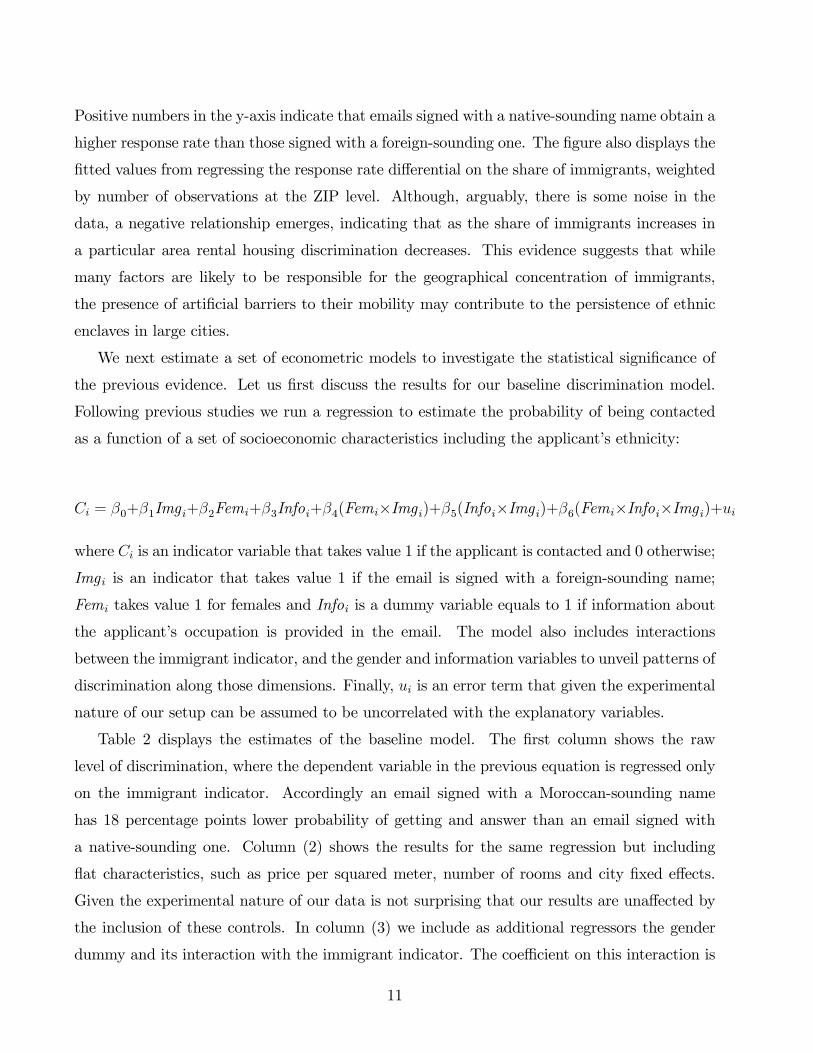
We next estimate a set of econometric models to investigate the statistical signi�cance of
the previous evidence. Let us �rst discuss the results for our baseline discrimination model.
Following previous studies we run a regression to estimate the probability of being contacted
as a function of a set of socioeconomic characteristics including the applicant�s ethnicity:
Ci = �0+�1Img i+�2Femi+�3Infoi+�4(Femi�Img i)+�5(Infoi�Img i)+�6(Femi�Infoi�Img i)+ui
where Ci is an indicator variable that takes value 1 if the applicant is contacted and 0 otherwise;
Img i is an indicator that takes value 1 if the email is signed with a foreign-sounding name;
Femi takes value 1 for females and Infoi is a dummy variable equals to 1 if information about
the applicant�s occupation is provided in the email. The model also includes interactions
between the immigrant indicator, and the gender and information variables to unveil patterns of
discrimination along those dimensions. Finally, ui is an error term that given the experimental
nature of our setup can be assumed to be uncorrelated with the explanatory variables.
Table 2 displays the estimates of the baseline model. The �rst column shows the raw
level of discrimination, where the dependent variable in the previous equation is regressed only
on the immigrant indicator. Accordingly an email signed with a Moroccan-sounding name
has 18 percentage points lower probability of getting and answer than an email signed with
a native-sounding one. Column (2) shows the results for the same regression but including
�at characteristics, such as price per squared meter, number of rooms and city �xed e¤ects.
Given the experimental nature of our data is not surprising that our results are una¤ected by
the inclusion of these controls. In column (3) we include as additional regressors the gender
dummy and its interaction with the immigrant indicator. The coe¢ cient on this interaction is
11

positive, large in magnitude and highly signi�cant. The point estimate indicates that female
immigrants are 15 percentage points more likely to be contacted than their male counterparts.
This is evidence of the large penalty that male immigrants face in the rental housing market.
Column (4) estimates the same model including �at characteristics and, as expected, the results
are una¤ected.
Next we study how the discriminatory behavior changes with the amount of information
disclosed in the application. The model in column (5) contains as additional regressors the
information dummy and its interaction with the immigrant indicator to capture di¤erences
in the response rate between �high-quality� candidates and those who do not provide any
information about their socioeconomic status. According to our estimates candidates signaling
a high-paying occupation are 8 percentage points more likely to be contacted than those who do
not report any information about their jobs. The interaction of this variable with the immigrant
indicator suggests the presence of some additional informational premium for immigrants of
around 8 percentage points, which is statistically insigni�cant. However when this informational
premium is interacted with the gender indicator (see column (6)), the returns to information
becomes positive and statistically signi�cant for male immigrants.15 Note that despite this
positive premium information does not eliminate the di¤erence in response rate between natives
and immigrants.
In all, the results in table 2 con�rm the previous �ndings in the literature. Agents in the
rental market use the informational content of names to di¤erentially treat immigrants. This
di¤erential treatment is substantially larger for males and it does not disappear when informa-
tion about the socioeconomic status of the candidate is revealed. This last result indicates that
either information other than the socioeconomic status is relevant for the property owners or
that negative attitudes towards immigrants are behind the substantial amount of discrimination
observed in the rental market.16
Table 3 explores discriminatory practices across neighborhoods with di¤erent concentration
of immigrants. Column (1) displays the estimates of the model for the raw level of discrimination
including as additional regressor the share of immigrants at the ZIP code level (ZIP-Img-
Sharei) interacted with the immigrant indicator. The results indicate that in all-native areas
15While �5 captures the returns to information for male immigrants, �5+�6 captures the returns for females,
which according to our point estimates are approximately 0.16See Bosch et al. (2010) for a deeper discussion about the e¤ect of information on discrimination.
12

immigrants are on average 30 percentage points less likely to be contacted than natives. However
this di¤erential decreases as the presence of immigrants in the area increases. In particular,
a 10 percentage points increase in the immigration share at the ZIP code level increases the
chances of being contacted (relative to those of natives) by 5.5 percentage points. Accordingly
discrimination will disappear in areas where the concentration of immigrants is around 50%.
The remaining columns in table 3 investigate the robustness of the previous result. Column
(2) adds ZIP code �xed e¤ects to control for unobserved characteristics that may a¤ect the
probability of being contacted. However, due to the experimental nature of our design the
results are unaltered. Column (3) investigates the e¤ect of outlier observations. According to
Figure 5 one could think that our results are driven by those extreme values. We estimate the
model excluding the observations at the top and bottom 10% of the immigrant share distribu-
tion. While the relationship between discrimination and immigrant share remains positive and
signi�cant, the point estimate increases to 1.23. This increase is mainly due to the substan-
tial reduction in the variance of the immigrant share across neighborhoods after excluding the
extreme values. Column (4) adds to the speci�cation with all the observations the set of �at
characteristics. Again, the relationship between discrimination and immigrant concentration
remains una¤ected. Column (5) includes the gender and the information dummy and their
interactions with the immigrant indicator. No signi�cant changes a¤ect our results. Finally
column (6) investigates whether the relationship between immigrant concentration and discrim-
ination varies with the applicants�characteristics. Accordingly the gender and the information
indicators are interacted with the share of immigrants. We do not �nd evidence that the rela-
tionship between immigrant concentration and di¤erential treatment varies with the gender or
the quality of the applicant.17
A similar analysis can be conducted using the concentration of Moroccan immigrants at
the ZIP code level. The results are shown in table 4. The point estimate on the interaction
between the share of Moroccan immigrants (ZIP-Moroccan-Sharei) and the immigrant indicator
is larger, but this is due to the fact that the mean and the variance of this share are smaller.18
The point estimate suggests that a 1 percentage point increase in the share of Moroccans at the
17The results using a probit model instead of a linear probablity model are extremely similar and are available
upon request.18The share of Moroccan immigrants in the sample has mean 1.14 and standard deviation 0.97. The share of
all immigrants in the sample has mean 22.05 and standard deviation 9.93.
13

ZIP code level, increases the chances of response to an email signed by a Moroccan applicant
by 5 percentage points. This e¤ect is large and reinforces the view that while several factors
may be responsible for the important geographical concentration of immigrants in certain areas
of big cities, part of this segregation responds to discriminatory practices in the rental housing
market. In particular, property owners through the Internet platform seem to be e¤ectively
blocking the supply of housing units immigrants have access to.
Robustness Checks
We now investigate the e¤ect of a series of confounding factors that could threat the validity
of our previous results. One possibility is that the quality of �ats in areas with few immigrants
is di¤erent from that in areas with a high concentration of them. If the quality/price of the
�at determines the level of discrimination (maybe because of the owner�s risk aversion) this
could be causing the observed correlation. We investigate this possibility in the �rst column of
table 5. We allow the coe¢ cient on the interaction between the share of immigrants and the
immigrant indicator to vary by �at characteristics. None of those interactions is statistically
signi�cant and our main result remains invariant, suggesting that the reason for the observed
spatial pattern is not that discrimination occurs in expensive/high-quality �ats that happen to
be in areas where there are few immigrants.
The geographical pattern of discrimination that we observe may also respond to the fact
that, because of urban segregation, owners in areas with a high concentration of immigrants are
immigrants themselves and less prone to discriminate against those of their own kind. However,
the immigration phenomenon in Spain is relatively recent and originates mainly from low income
countries. Hence, the home ownership rate among immigrants is relatively low. According to
the National Immigrant Survey (2007) this rate is around 30%. Thus it is unlikely that a
substantial share of the immigrant population is operating on the supply side of rental market
and driving our results. We can actually test this hypothesis with our data. We have the name
of approximately 80% of the property owners or renters in our sample, either because they were
advertising it in the rental ad or because they would sign the reply email. With this information
we can infer the nationality of the owner and test whether it is responsible for the observed
discriminatory patterns. In our sample 85% of all the owners (for which we have names) have a
Spanish-sounding name. We then compute the share of �non-Spanish�owners by ZIP code and
14

interact it with the immigrant indicator. The results for this speci�cation appear in column
(2) of table 5. We do not �nd any signi�cant e¤ect for this variable suggesting that our results
identify the behavior of native owners.
Another possible explanation is rooted in the fact that attitudes towards immigration may
di¤er across neighborhoods. In Spain the more conservative parties have been strong supporters
of laws restricting immigration. They were also against the general amnesty in 2005, whereby
immigrants who had lived in Spain for at least one year, had a job and no criminal record
could obtain a residence permit. We argue that the share of �conservative�vote in the 2008
general election in a particular neighborhood is a good proxy for the views against immigration
in that area.19 Information on the electoral results is only available at the census district level.
To see whether this higher level of aggregation a¤ects our results in column (3) of table 5 we
re-estimate our basic speci�cation using the concentration of immigrants by census district. At
this level, a 10 percentage points increase in the share of immigrants is associated with a 6
percentage points increase in the probability that an immigrant will be contacted. Since the
results at the census district and ZIP code level are similar, column (4) includes the district share
of vote to the conservative parties in the 2008 general elections (District-conservative votei)
interacted with the immigrant indicator. This allows us to study whether more conservative
districts discriminate more. We do not �nd support for this hypothesis in our data as the new
interaction is statistically insigni�cant. In contrast, the coe¢ cient on the interaction between
the concentration of immigrants and the immigrant indicator variable slightly falls from 0.56 to
0.52, but remains signi�cant at the 10% level of signi�cance. Thus we conclude that political
preferences are not responsible for the persistence of ethnic enclaves.
Finally, we discuss two possible channels that can explain the correlation between discrim-
ination and immigrant concentration by studying the evolution of the latter during the last
decade. Again we use the census district as a unit of analysis since we only have data on the
past spatial concentration of immigrants at this level. The idea is to relate the increase in
immigrant concentration in a particular neighborhood with the current level of discrimination.
We employ as explanatory variable the growth in the share of immigrants by district between
2000 and 2008 interacted with the immigrant indicator. Column (5) shows that there is a very
19In Madrid this includes the share of vote to the conservative Popular Party (PP). In Barcelona we pool
together the shares to the Popular Party and the Catalan Conservative Nationalist Party (CIU) on the grounds
that they have common views on immigration.
15
strong correlation between the increase in the immigrant population and the current levels of
discrimination. In particular, a 1 percentage point increase in the stock of immigrants in one
district is associated to a fall in discrimination of 0.85 percentage points. One possible expla-
nation for this result is that districts discriminating more in 2008 were also over discriminating
in 2000, thus generating a lower in�ux of immigrants. Alternatively, one could argue that im-
migrants moving into certain districts brought in new information and increased acceptance of
the foreign born population. Unfortunately our data do not allow us to disentangle these two
explanations. The former would suggest that discriminatory practices are crucial for shaping
spatial segregation. The latter would imply that as immigrants move into particular areas,
assimilation reduces discriminatory practices.
On the whole, our results indicate that the degree of discrimination varies substantially
with the ethnic composition of the neighborhood. We �nd evidence that property owners or
renters discriminate more in areas with a higher concentration of natives. Although possible
there are other factors determining ethnic segregation at the city level, we can conclude that
the presence of rental housing discrimination contributes to the existence of ethnic enclaves in
large cities and makes the geographical assimilation process of immigrants an arduous task.
5 Conclusions
In this paper we conduct a �eld experiment to show that discrimination against immigrants in
the rental market is strongly correlated with their spatial concentration in the two largest Span-
ish cities, Madrid and Barcelona. Our estimates indicate that in areas with very few immigrants
the di¤erential in response rates between natives and immigrants reaches a magnitude of 30
percentage points. As the concentration of immigrants increases, this di¤erential is reduced. In
particular, a 10 percentage points increase in the share of immigrants at the ZIP or postal code
level increases the chances that an immigrant will be contacted by the property owner or renter
by 6 percentage points (relative to their native counterpart). We also show that this spatial
pattern does not respond to di¤erences in the quality and price of �ats, political preferences,
or ethnic origin of the owners across geographical areas.
These results do not allow us to conclude that discriminatory practices generated the current
distribution of immigrants across neighborhoods. Probably other factors, like housing prices
and immigrants�preferences to live close to each other played a substantial role in shaping the
16

spatial distribution we observed today. Nonetheless our results show that, even if other forces
would have been responsible for triggering ethnic segregation, the discriminatory behavior of
property owners and renters would have created persistency once segregation started and thus
prevent the geographical assimilation of immigrants.
17

References
[1] Ahmed, A. and Hammarstedt, M. 2008. Discrimination in the rental housing market: A
�eld experiment on the Internet. Journal of Urban Economics, 64 (2008) 362-272.
[2] Ahmed, A., L. Andersson, M. Hammarstedt. 2010. "Can Discrimination in the Housing
Market be Reduced by Increasing the Information about the Applicants?" Land Economics,
vol 86, issue 1, 79-90
[3] Bailey, M J. 1966. "E¤ects of Race and of Other Demographic Factors on the Values of
Single-Family Homes" Land Economics, vol 42, no. 2, pp. 215-220.
[4] Bartel, A. 1989. "Where do the new immigrants live?" Journal of Labor Economics, vol
7(4): 371-91.
[5] Bauer, T., G. Epstein and I.N. Gang. 2002. "Herd E¤ects or Migration Networks? The
Location Choice of Mexican Immigrants in the U.S" IZA Discussion Paper, 551.
[6] Bauer, T., G. Epstein and I.N. Gang. 2005. "Enclaves, Language and the Location Choice
of Immigrants" Journal of Population Economics, vol 18(4): 649-662.
[7] Borjas, G. 1998. "To Ghetto or Not to Ghetto: Ethnicity and Residential Segregation"
Journal of Urban Economics, vol 44, 228-253.
[8] Bosch, M., M.A. Carnero and L. Farré. 2010. "Information and Discrimination in the
Rental Housing Market: Evidence from a Field Experiment", Regional Science and Urban
Economics, vol 40, 11-19.
[9] Card, D., A. Mas and J. Rothstein. 2008. "Tipping and the dynamics of segregation", The
Quarterly Journal of Economics, vol 123(1), 177-218.
[10] Carrasco, R., J.F. Jimeno and A. C. Ortega. 2008. "The E¤ect of Immigration on the
Labor Market Performance of Native-Born Workers: Some Evidence for Spain", Journal
of Population Economics, Vol 3, 627-648.
[11] Chambers, D N. 1992. "The Racial Housing Price Di¤erential and Racially Transitional
Neighborhoods", Journal of Urban Economics, 32, pp. 214-232.
18

[12] Cutler, D., E. Glaeser, and J. Vigdor. 1999. �The Rise and Decline of The American
Ghetto.�Journal of Political Economy v.107 pp.455-506.
[13] Cutler, D., E. Glaeser and J. Vigdor. 2008. "Is the melting pot still hot? Explaining the
resurgence of immigrant segregation", The Review of Economics and Statistics, vol 90(3):
478-497.
[14] Dustmann, C. and I. Preston. 2007. "Racial and Economic Factors in Attitudes to Immi-
gration". The B.E. Journal of Economic Analysis&Polciy. Advances. Vol 7(1). Art 62.
[15] Farré, L, L. González and F. Ortega. 2009. "Immigration, Family Responsibilities and the
Labor Supply of Skilled Native Women", IZA Working Paper 4265.
[16] Fernández-Huertas Moraga, J., A. Ferrer-i-Carbonell and A. Saiz. 2009. "Localización de
los inmigrantes y preferencias residenciales de la población. ¿Nuevos Guetos?" Mimeo IAE.
[17] González, L and F. Ortega. 2011. "How Do Very Open Economies Adjust to Large Immi-
gration Flows? Evidence from Spanish Regions". Labour Economics, vol. 18, 57-70.
[18] Jaeger, D.A. 2000. "Local Labor Markets, Admission Categories and Immigrant Location
Choice" Working Paper, Department of Economics, Hunter College, NY.
[19] Mayda, AM. 2006. "Who is Against Immigration? A Cross-Country Investigation of Indi-
vidual Attitudes toward Immigrants" The Review of Economics and Statistics, vol. 88(3),
510-530
[20] Saiz, A. 2007. "Immigration and Housing Rents in American Cities", Journal of Urban
Economics, 61, pp:345-371.
[21] Saiz, A. and S. Wachter. 2011. "Immigration and the Neighborhood", American Economic
Journal: Economic Policy. Forthcoming.
[22] Yinger, J. 1978. "The Black-White Price Di¤erential in Housing: Some Further Evidence"
Land Economics, vol. 54(2), 187-206
[23] Yinger, J. 1995. "Closed Doors, Opportunities Lost: The Continuing Costs of Housing
Discrimination" New York: Russell Sage Foundation.
19

[24] Zavodny, M. 1997. "Welfare and the locational choices of new immigrants" Economic and
Financial Policy Review, Federal Reserve Bank of Dallas, issue Q II, pages 2-10
20

Figure 1: Immigrant share by census districts in Madrid (2000-2008)
All
immigrants
2000
All
immigrants
2008
Moroccan
immigrants
2008
Rental prices�m2�
2008
(1) Fuencarral 4:92 13:05 1:71 10:5
(2) Moncloa 5:98 16:09 0:74 12:3
(3) Tetuán 7:65 25:39 0:57 13:0
(4) Chamartín 7:20 16:07 0:60 14:2
(5) Hortaleza 4:82 15:14 0:66 12:3
(6) Barajas 5:09 15:39 1:63 11:2
(7) Chamberí 6:86 18:33 0:68 15:2
(8) Salamanca 6:88 17:89 0:84 15:9
(9) Ciudad Lineal 5:78 21:06 0:64 12:3
(10) San Blas 3:33 16:36 0:94 11:7
(11) Centro 11:92 31:43 1:08 16:8
(12) Retiro 4:73 12:58 0:84 13:9
(13) Moratalaz 3:20 13:18 1:36 10:4
(14) Vicálvaro 3:62 17:87 0:55 9:7
(15) Latina 4:37 21:17 0:70 11:0
(16) Carabanchel 4:89 25:22 0:64 11:3
(17) Usera 4:15 25:47 2:39 10:5
(18) Arganzuela 5:95 19:08 1:75 13:1
(19) Puente de Vallecas 3:60 20:89 1:14 11:1
(20) Villaverde 3:76 25:34 0:52 10:3
(21) Villa de Vallecas 2:94 17:77 1:11 10:6
21

Figure 2: Immigrant share by census districts in Barcelona (2000-2008)
All
immigrants
2000
All
immigrants
2008
Moroccan
immigrants
2008
Rental prices�m2�
2008
(1) Ciutat Vella 14:81 47:26 3:55 15:3
(2) Eixample 5:71 20:59 0:56 15:1
(3) Sants-Montjuïc 4:82 21:73 1:42 13:2
(4) Les Corts 5:20 14:73 0:46 14:3
(5) Sarrià-Sant Gervasi 6:25 15:08 0:34 14:1
(6) Gràcia 5:08 18:20 0:54 13:3
(7) Horta-Guinardó 3:26 14:92 0:62 12:1
(8) Nou Barris 2:86 18:10 1:01 11:3
(9) Sant Andreu 3:17 15:21 1:01 11:9
(10) Sant Martí 3:62 17:01 0:92 14:7
22

Figure 3: Rental price and years in the country
300
250
200
150
100
50
0
50
100
150
1 2 3 4 5 6 7 8 9 10 11 12 13 14 15 16 17 18 19
Source: Spanish National Immigrant Survey (2007). The �gure displays the coe¢ cients obtained
from regressing the monthly rent on a set of dummy variables indicating years of residence in the
country. The dashed lines represent the con�dence interval at 5% level of signi�cance. The dependent
variable of the regression is rental price per month, other regressors included are a set of socioeconomic
variables regarding the household head (gender, age, Spanish nationality, region of birth), numbers of
rooms, number of people in the household and province of residence.
23
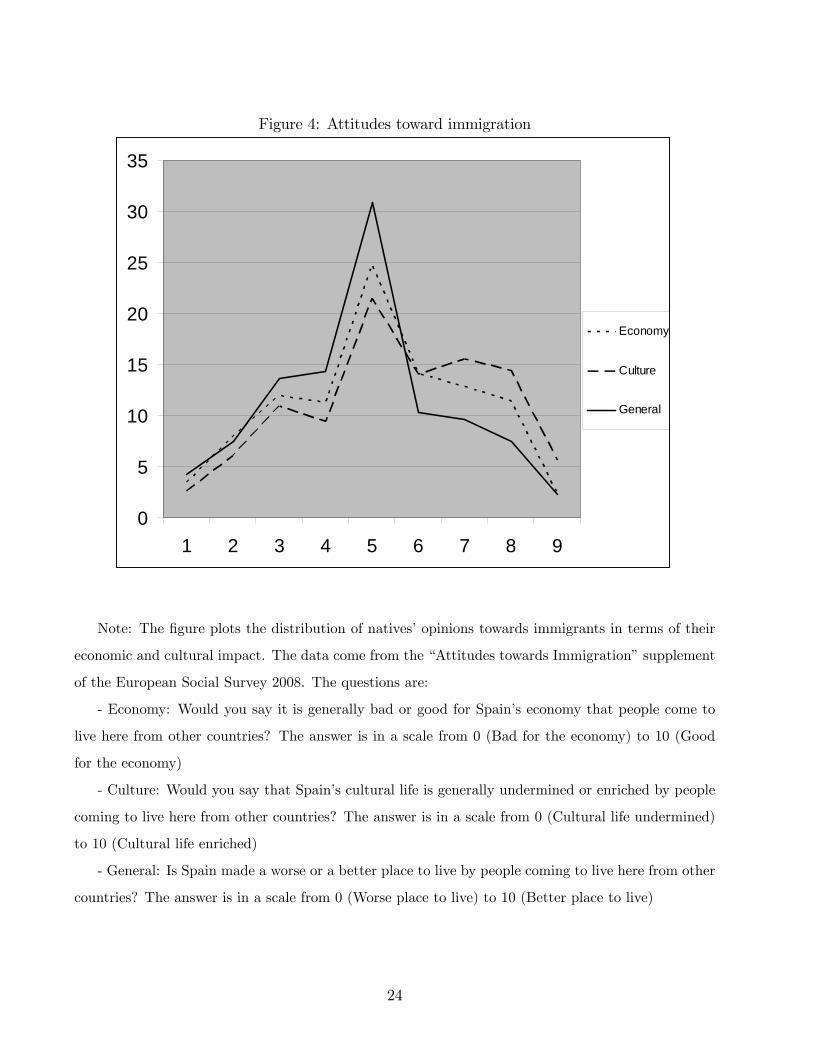
Figure 4: Attitudes toward immigration
0
5
10
15
20
25
30
35
1 2 3 4 5 6 7 8 9
Economy
Culture
General
Note: The �gure plots the distribution of natives�opinions towards immigrants in terms of their
economic and cultural impact. The data come from the �Attitudes towards Immigration�supplement
of the European Social Survey 2008. The questions are:
- Economy: Would you say it is generally bad or good for Spain�s economy that people come to
live here from other countries? The answer is in a scale from 0 (Bad for the economy) to 10 (Good
for the economy)
- Culture: Would you say that Spain�s cultural life is generally undermined or enriched by people
coming to live here from other countries? The answer is in a scale from 0 (Cultural life undermined)
to 10 (Cultural life enriched)
- General: Is Spain made a worse or a better place to live by people coming to live here from other
countries? The answer is in a scale from 0 (Worse place to live) to 10 (Better place to live)
24
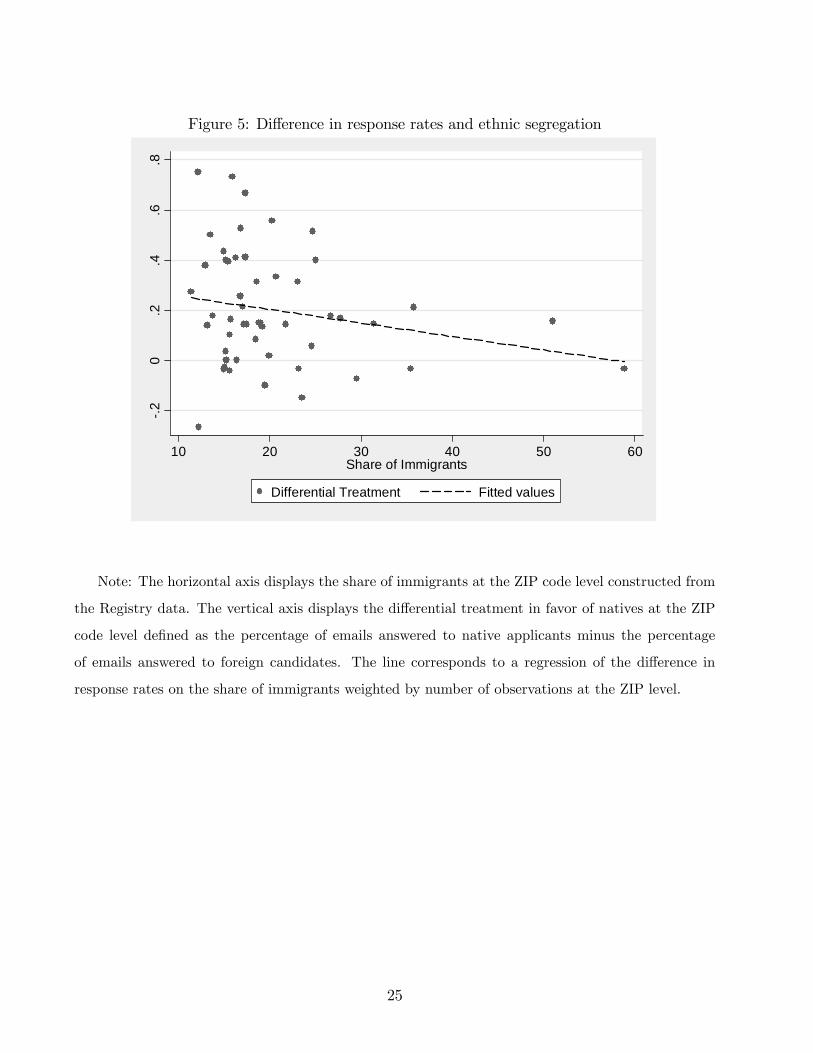
Figure 5: Di¤erence in response rates and ethnic segregation
.20
.2.4
.6.8
10 20 30 40 50 60Share of Immigrants
Differential Treatment Fitted values
Note: The horizontal axis displays the share of immigrants at the ZIP code level constructed from
the Registry data. The vertical axis displays the di¤erential treatment in favor of natives at the ZIP
code level de�ned as the percentage of emails answered to native applicants minus the percentage
of emails answered to foreign candidates. The line corresponds to a regression of the di¤erence in
response rates on the share of immigrants weighted by number of observations at the ZIP level.
25

Table 1: Descriptive Statistics
All Males Females No information High paying occupation
Natives 71:83%(a) 72:85% 70:81% 65:48% 74:94%
N. obs. 600(b) 302 298 197 403
Immigrants 53:75% 46:74% 60:68% 41:88% 59:49%
N. obs. 586 291 295 191 395
(a): Percentage of applicants that receive an email back from the renter.
(b): Number of emails sent.
26
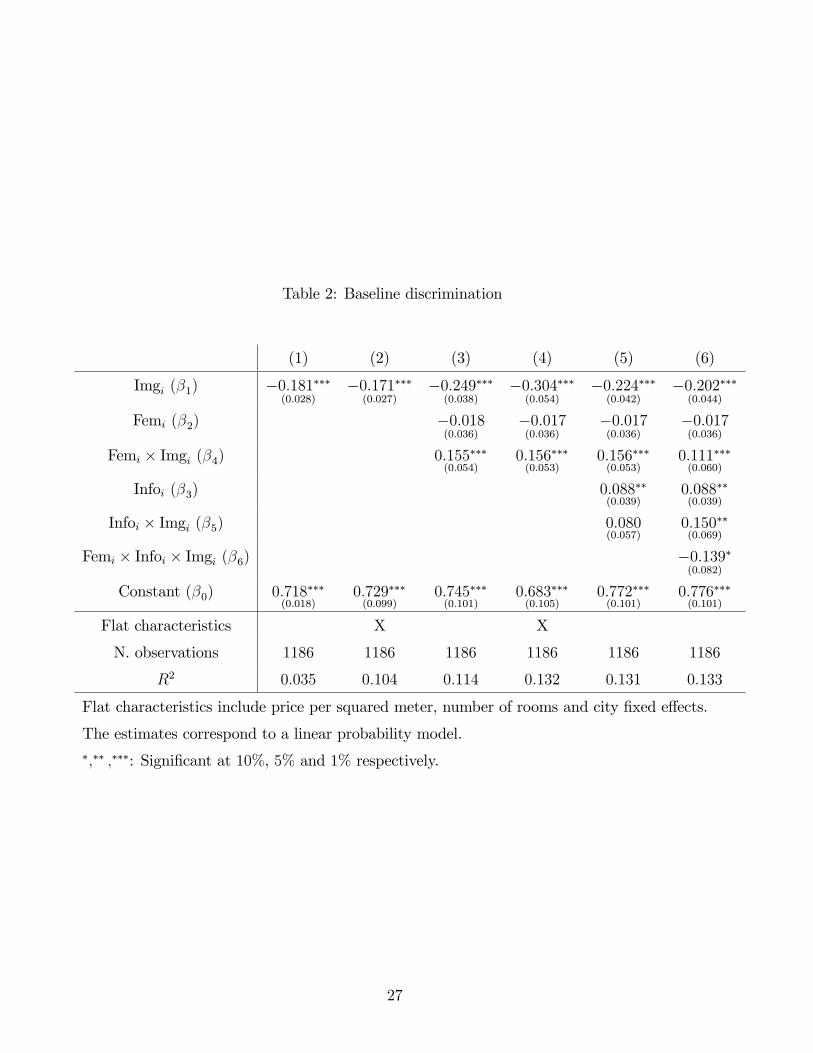
Table 2: Baseline discrimination
(1) (2) (3) (4) (5) (6)
Imgi (�1) �0:181���(0:028)
�0:171���(0:027)
�0:249���(0:038)
�0:304���(0:054)
�0:224���(0:042)
�0:202���(0:044)
Femi (�2) �0:018(0:036)
�0:017(0:036)
�0:017(0:036)
�0:017(0:036)
Femi � Imgi (�4) 0:155���(0:054)
0:156���(0:053)
0:156���(0:053)
0:111���(0:060)
Infoi (�3) 0:088��(0:039)
0:088��(0:039)
Infoi � Imgi (�5) 0:080(0:057)
0:150��(0:069)
Femi � Infoi � Imgi (�6) �0:139�(0:082)
Constant (�0) 0:718���(0:018)
0:729���(0:099)
0:745���(0:101)
0:683���(0:105)
0:772���(0:101)
0:776���(0:101)
Flat characteristics X X
N. observations 1186 1186 1186 1186 1186 1186
R2 0:035 0:104 0:114 0:132 0:131 0:133
Flat characteristics include price per squared meter, number of rooms and city �xed e¤ects.
The estimates correspond to a linear probability model.�;�� ;���: Signi�cant at 10%, 5% and 1% respectively.
27

Table 3: Discrimination and immigrant concentration. Evidence at the ZIP code level
(1) (2) (3) (4) (5) (6)
Imgi �0:304���(0:048)
�0:308���(0:062)
�0:448���(0:097)
�0:282���(0:061)
�0:349���(0:074)
�0:365���(0:080)
ZIP-Img-Sharei � Imgi 0:549���(0:172)
0:576��(0:237)
1:232��(0:468)
0:510��(0:234)
0:555��(0:221)
0:625���(0:229)
ZIP-Img-Sharei � Imgi � Femi �0:001(0:003)
ZIP-Img-Sharei � Imgi � Infoi �0:000(0:003)
Femi �0:032(0:040)
�0:032(0:040)
Femi � Imgi 0:173���(0:055)
0:180��(0:090)
Infoi 0:090��(0:043)
0:090��(0:043)
Infoi � Imgi 0:094�(0:055)
0:060(0:097)
Constant 0:718���(0:016)
0:658���(0:034)
0:720���(0:017)
1:223���(0:117)
1:339���(0:112)
1:334���(0:111)
ZIP �xed e¤ects X X X X X
Flat characteristics X X X
N. observations 1186 1186 938 1186 1186 1186
R2 0:042 0:112 0:051 0:175 0:203 0:203
Flat characteristics include price per squared meter, number of rooms and city �xed e¤ects.
The estimates correspond to a linear probability model where the standard errors are
clustered by ZIP code level.�;�� ;���: Signi�cant at 10%, 5% and 1% respectively.
28

Table 4: Discrimination and concentration of Moroccan immigrants. Evidence at the ZIP code
level
(1) (2) (3) (4)
Imgi �0:233���(0:040)
�0:217���(0:038)
�0:281���(0:053)
�0:271���(0:060)
ZIP-Moroccan-Sharei � Imgi 4:598��(2:186)
4:118��(1:980)
4:809��(1:989)
4:016(2:482)
ZIP-Moroccan-Sharei � Imgi � Femi 0:004(0:029)
ZIP-Moroccan-Sharei � Imgi � Infoi �0:013(0:038)
Femi �0:032(0:041)
�0:032(0:041)
Femi � Imgi 0:172���(0:055)
0:157��(0:074)
Infoi 0:090��(0:044)
0:090��(0:044)
Infoi � Imgi 0:095(0:055)
0:100(0:071)
Constant 0:678���(0:029)
1:224���(0:116)
1:342���(0:112)
1:346���(0:112)
ZIP �xed e¤ects X X X X
Flat characteristics X X X
N. observations 1186 1186 1186 1186
R2 0:111 0:174 0:202 0:202
Flat characteristics include price per squared meter, number of rooms and city �xed e¤ects.
The estimates correspond to a linear probability model where the standard errors are
clustered by ZIP code level.�;�� ;���: Signi�cant at 10%, 5% and 1% respectively.
29

Table 5: Robustness Checks
(1) (2) (3) (4) (5)
Imgi 0:000(0:000)
�0:286���(0:063)
�0:294���(0:050)
�0:250(0:182)
�0:305���(0:048)
ZIP-Img-Sharei � Imgi 0:496�(0:251)
0:487�(0:249)
ZIP-Img Owners-Sharei � Imgi 0:064(0:220)
District-Img-Sharei � Imgi 0:559���(0:150)
0:516�(0:267)
District-conservative votei � Imgi �0:078(0:265)
Increase in Sharei � Imgi 0:848���(0:187)
Constant 1:236���(0:137)
1:226���(0:116)
0:681���(0:101)
0:686���(0:094)
0:688���(0:102)
ZIP �xed e¤ects X X
District �xed e¤ects X X X
Flat characteristics X X X X X
Flat characteristics � Img X
N. observations 1186 1186 1186 1186 1186
R2 0:175 0:175 0:133 0:133 0:134
Flat characteristics include price per squared meter, number of rooms and city �xed e¤ects.
The estimates correspond to a linear probability model where the standard errors are
clustered by ZIP code level.�;�� ;���: Signi�cant at 10%, 5% and 1% respectively.
30

Table A1: Comparison of �ats contacted by natives and immigrants. Madrid
ROOMS PRICE M2 GENDER-L GENDER-A0@ Number
of rooms
1A 0@ Rental price
per month
1A 0@ Squared
meters
1A 0@ Gender of
the landlord
1A 0@ Gender of
the applicant
1A(1) Fuencarral �0:349(1)
(0:381)(2)�271:4�(153:3)
�19:99(17:02)
0:127(0:216)
0:062(0:195)
(2) Moncloa �0:167(0:396)
�133:3(158:6)
0:417(17:36)
�0:136(0:243)
0:083(0:197)
(3) Tetuán 0:074(0:233)
�58:38(64:21)
�5:384(6:747)
0:125(0:166)
�0:236�(0:132)
(4) Chamartín �0:129(0:404)
�171:3(145:8)
�9:190(15:68)
�0:094(0:227)
�0:243(0:186)
(5) Hortaleza 0:292(0:512)
�197:5(192:3)
�5:750(22:61)
0:133(0:260)
0:125(0:237)
(6) Barajas �0:550(0:776)
�267:5�(130:6)
�31:00(21:02)
0:333(0:333)
0:150(0:350)
(7) Chamberí �0:578�(0:321)
�206:1(181:7)
�13:69(12:66)
0:433(0:092)
0:000(0:156)
(8) Salamanca 0:006(0:325)
278:2(194:5)
13:23(14:07)
0:050(0:172)
0:018(0:152)
(9) Ciudad Lineal �0:261(0:280)
6:797(97:70)
�4:882(8:440)
0:442��(0:188)
�0:126(0:163)
(10) San Blas 0:974�(0:472)
155:7�(82:87)
29:23��(11:29)
0:299(0:246)
0:282(0:218)
(11) Centro 0:047(0:141)
127:1��(60:53)
1:147(4:767)
0:090(0:109)
0:103(0:093)
(12) Retiro �1:114���(0:284)
�135:9�(78:73)
�27:13��(10:90)
�0:077(0:201)
�0:188(0:179)
(13) Moratalaz 0:133(0:501)
�18:87(131:2)
�2:133(22:33)
�0:333(0:471)
0:067(0:414)
(14) Vicálvaro(3) 1:000(:)
70:00(:)
�9:000(:)
�1:000(:)
1:000(:)
(15) Latina �0:425(0:324)
�97:53�(48:70)
�13:42(8:958)
�0:089(0:222)
�0:117(0:185)
(16) Carabanchel 0:158(0:352)
31:84(51:83)
5:413(8:686)
�0:198(0:220)
0:113(0:177)
(17) Usera 0:143(0:479)
55:24(74:22)
5:024(11:35)
0:429�(0:202)
0:238(0:292)
(18) Arganzuela �0:326(0:306)
�80:64(71:41)
�12:18(7:252)
0:100(0:188)
�0:140(0:170)
(19) Puente de Vallecas �0:775�(0:363)
�82:50(61:50)
�4:425(13:57)
�0:222(0:274)
0:275(0:208)
(20) Villaverde 0:250(0:412)
�50:63(52:51)
1:000(10:67)
0:458�(0:247)
0:250(0:250)
(21) Villa de Vallecas �0:686(0:699)
�57:14(120:5)
�19:97(28:08)
�0:083(0:416)
�0:457(0:284)
(1): Di¤erence in average characteristics (i.e. number of rooms) between housing units contacted by natives
and immigrants.(2): Standard error of the di¤erence in average characteristics.(3): Standard errors cannot be computed since there is only 1 observation.�;�� ;���: Signi�cant at 10%, 5% and 1% respectively.
31
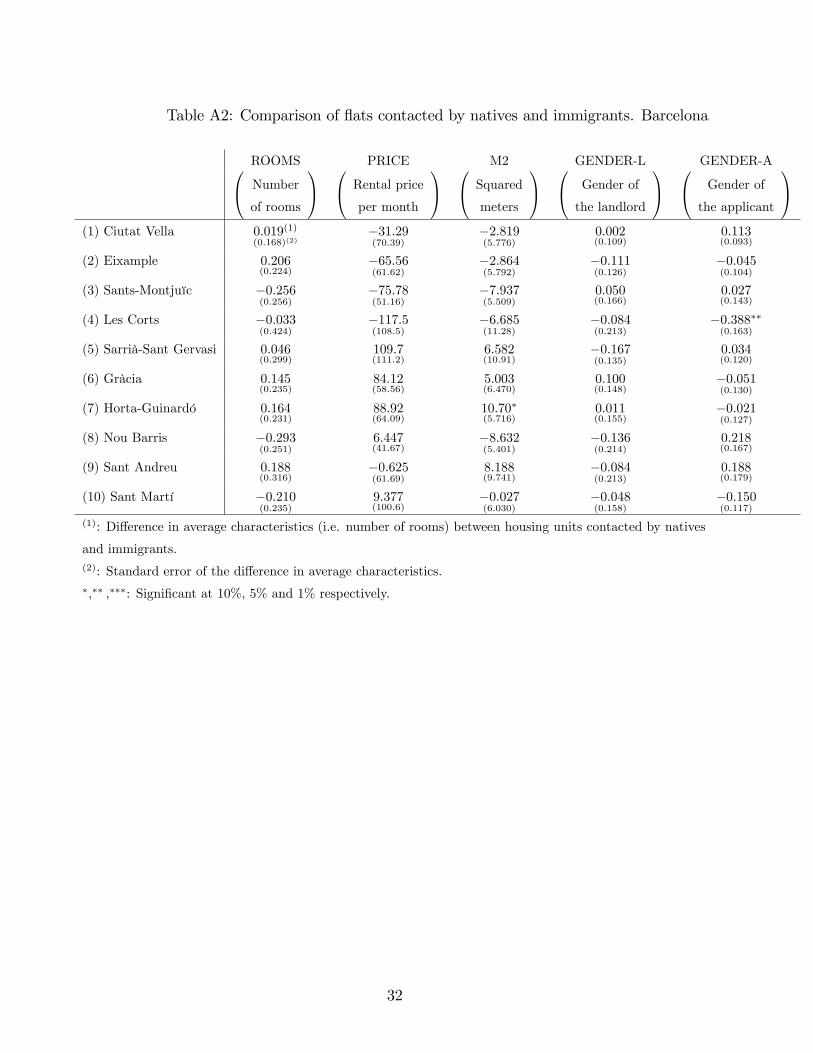
Table A2: Comparison of �ats contacted by natives and immigrants. Barcelona
ROOMS PRICE M2 GENDER-L GENDER-A0@ Number
of rooms
1A 0@ Rental price
per month
1A 0@ Squared
meters
1A 0@ Gender of
the landlord
1A 0@ Gender of
the applicant
1A(1) Ciutat Vella 0:019(1)
(0:168)(2)�31:29(70:39)
�2:819(5:776)
0:002(0:109)
0:113(0:093)
(2) Eixample 0:206(0:224)
�65:56(61:62)
�2:864(5:792)
�0:111(0:126)
�0:045(0:104)
(3) Sants-Montjuïc �0:256(0:256)
�75:78(51:16)
�7:937(5:509)
0:050(0:166)
0:027(0:143)
(4) Les Corts �0:033(0:424)
�117:5(108:5)
�6:685(11:28)
�0:084(0:213)
�0:388��(0:163)
(5) Sarrià-Sant Gervasi 0:046(0:299)
109:7(111:2)
6:582(10:91)
�0:167(0:135)
0:034(0:120)
(6) Gràcia 0:145(0:235)
84:12(58:56)
5:003(6:470)
0:100(0:148)
�0:051(0:130)
(7) Horta-Guinardó 0:164(0:231)
88:92(64:09)
10:70�(5:716)
0:011(0:155)
�0:021(0:127)
(8) Nou Barris �0:293(0:251)
6:447(41:67)
�8:632(5:401)
�0:136(0:214)
0:218(0:167)
(9) Sant Andreu 0:188(0:316)
�0:625(61:69)
8:188(9:741)
�0:084(0:213)
0:188(0:179)
(10) Sant Martí �0:210(0:235)
9:377(100:6)
�0:027(6:030)
�0:048(0:158)
�0:150(0:117)
(1): Di¤erence in average characteristics (i.e. number of rooms) between housing units contacted by natives
and immigrants.(2): Standard error of the di¤erence in average characteristics.�;�� ;���: Signi�cant at 10%, 5% and 1% respectively.
32