replacement of bridge in oklahoma utilizing accelerated bridge construction … · ·...
TRANSCRIPT
Oklahoma Demonstration Project:Replacement of Bridge in Oklahoma Utilizing Accelerated Bridge Construction and Bridge Sliding Methodology
Final Report
March 2015
FOREWORD The purpose of the Highways for LIFE (HfL) pilot program is to accelerate the use of innovations that improve highway safety and quality while reducing congestion caused by construction. LIFE is an acronym for Longer-lasting highway infrastructure using Innovations to accomplish the Fast construction of Efficient and safe highways and bridges. Specifically, HfL focuses on speeding up the widespread adoption of proven innovations in the highway community. “Innovations” is an inclusive term used by HfL to encompass technologies, materials, tools, equipment, procedures, specifications, methodologies, processes, and practices used to finance, design, or construct highways. HfL is based on the recognition that innovations are available that, if widely and rapidly implemented, would result in significant benefits to road users and highway agencies. Although innovations themselves are important, HfL is as much about changing the highway community’s culture from one that considers innovation something that only adds to the workload, delays projects, raises costs, or increases risk to one that sees it as an opportunity to provide better highway transportation service. HfL is also an effort to change the way highway community decision makers and participants perceive their jobs and the service they provide. The HfL pilot program, described in Safe, Accountable, Flexible, Efficient Transportation Equity Act: A Legacy for Users (SAFETEA-LU) Section 1502, includes funding for demonstration construction projects. By providing incentives for projects, HfL promotes improvements in safety, construction-related congestion, and quality that can be achieved through the use of performance goals and innovations. This report documents one such HfL demonstration project. Additional information on the HfL program is at www.fhwa.dot.gov/hfl
NOTICE
This document is disseminated under the sponsorship of the U.S. Department of Transportation in the interest of information exchange. The U.S. Government assumes no liability for its contents or use thereof. This report does not constitute a standard, specification, or regulation. The U.S. Government does not endorse products or manufacturers. Trade and manufacturers’ names appear in this report only because they are considered essential to the object of the document.
1. Report No. 2. Government Accession No 3. Recipient’s Catalog No
3. Title and Subtitle Replacement of Bridge in Oklahoma Utilizing Accelerated Bridge Construction and Bridge Sliding Methodology
5. Report Date March 2015 6. Performing Organization Code
7. Authors James Bledsoe
8. Performing Organization Report No.
9. Performing Organization Name and Address 10. Work Unit No. (TRAIS) C6B Applied Research Associates, Inc. 100 Trade Centre Drive, Suite 200 11. Contract or Grant No. Champaign, IL 61820
12. Sponsoring Agency Name and Address Office of Infrastructure Federal Highway Administration 1200 New Jersey Avenue, SE Washington, DC 20590
13. Type of Report and Period Covered Final Report
14. Sponsoring Agency Code
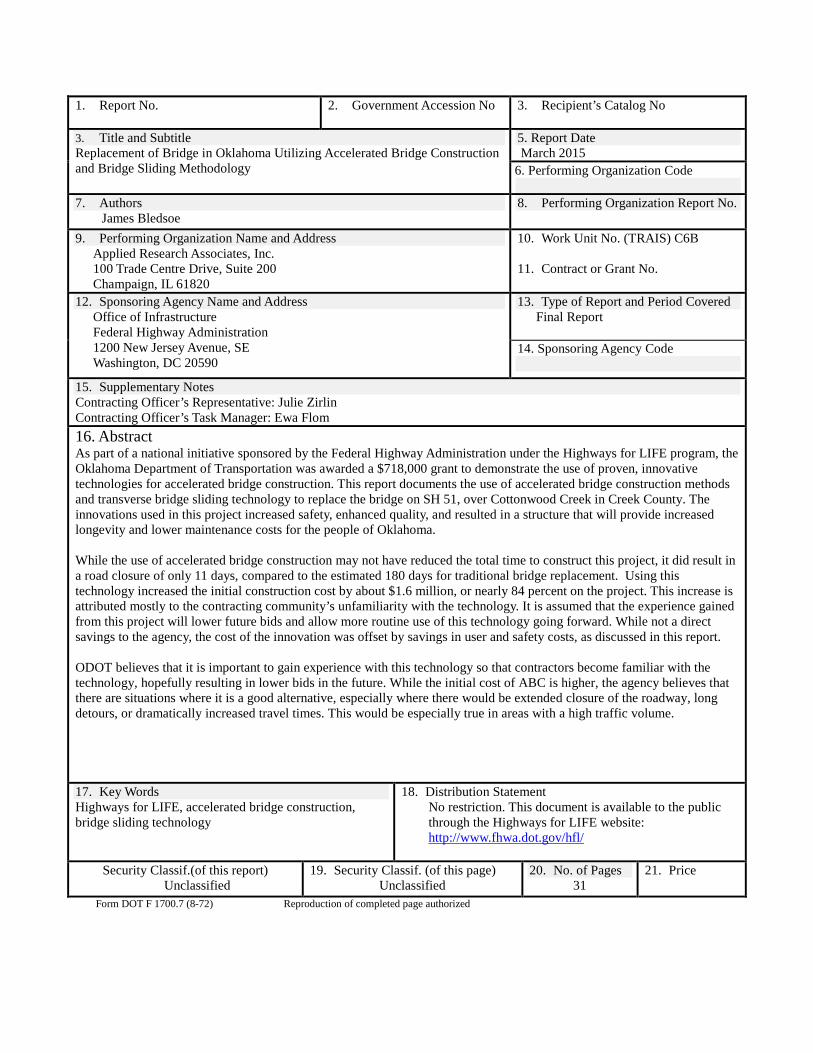
15. Supplementary Notes Contracting Officer’s Representative: Julie Zirlin Contracting Officer’s Task Manager: Ewa Flom 16. Abstract As part of a national initiative sponsored by the Federal Highway Administration under the Highways for LIFE program, the Oklahoma Department of Transportation was awarded a $718,000 grant to demonstrate the use of proven, innovative technologies for accelerated bridge construction. This report documents the use of accelerated bridge construction methods and transverse bridge sliding technology to replace the bridge on SH 51, over Cottonwood Creek in Creek County. The innovations used in this project increased safety, enhanced quality, and resulted in a structure that will provide increased longevity and lower maintenance costs for the people of Oklahoma. While the use of accelerated bridge construction may not have reduced the total time to construct this project, it did result in a road closure of only 11 days, compared to the estimated 180 days for traditional bridge replacement. Using this technology increased the initial construction cost by about $1.6 million, or nearly 84 percent on the project. This increase is attributed mostly to the contracting community’s unfamiliarity with the technology. It is assumed that the experience gained from this project will lower future bids and allow more routine use of this technology going forward. While not a direct savings to the agency, the cost of the innovation was offset by savings in user and safety costs, as discussed in this report. ODOT believes that it is important to gain experience with this technology so that contractors become familiar with the technology, hopefully resulting in lower bids in the future. While the initial cost of ABC is higher, the agency believes that there are situations where it is a good alternative, especially where there would be extended closure of the roadway, long detours, or dramatically increased travel times. This would be especially true in areas with a high traffic volume. 17. Key Words 18. Distribution Statement Highways for LIFE, accelerated bridge construction, No restriction. This document is available to the public bridge sliding technology through the Highways for LIFE website:
http://www.fhwa.dot.gov/hfl/
Security Classif.(of this report) 19. Security Classif. (of this page) Unclassified Unclassified
20. No. of Pages 21. Price 31
Form DOT F 1700.7 (8-72) Reproduction of completed page authorized
ii
SI* (MODERN METRIC) CONVERSION FACTORS APPROXIMATE CONVERSIONS TO SI UNITS
Symbol When You Know Multiply By To Find Symbol LENGTH
(none) Mil 25.4 micrometers μm in Inches 25.4 millimeters mm ft Feet 0.305 meters m yd Yards 0.914 meters m mi Miles 1.61 kilometers km
AREA in2 square inches 645.2 square millimeters mm2 ft2 square feet 0.093 square meters m2 yd2 square yards 0.836 square meters m2 ac Acres 0.405 hectares ha mi2 square miles 2.59 square kilometers km2
VOLUME fl oz fluid ounces 29.57 millimeters mL gal Gallons 3.785 liters L ft3 cubic feet 0.028 cubic meters m3 yd3 cubic yards 0.765 cubic meters m3
NOTE: volumes greater than 1000 L shall be shown in m3 MASS
oz Ounces 28.35 grams g lb Pounds 0.454 kilograms kg T short tons (2000 lb) 0.907 megagrams (or "metric ton") Mg (or "t")
TEMPERATURE (exact degrees) °F Fahrenheit 5 (F-32)/9 Celsius °C
or (F-32)/1.8 ILLUMINATION
fc foot-candles 10.76 lux lx fl foot-Lamberts 3.426 candela per square meter cd/m2
FORCE and PRESSURE or STRESS lbf Poundforce 4.45 Newtons N lbf/in2 (psi) poundforce per square inch 6.89 kiloPascals kPa k/in2 (ksi) kips per square inch 6.89 megaPascals MPa
DENSITY lb/ft3 (pcf) pounds per cubic foot 16.02 kilograms per cubic meter kg/m3
APPROXIMATE CONVERSIONS FROM SI UNITS Symbol When You Know Multiply By To Find Symbol
LENGTH μm Micrometers 0.039 mil (none) mm Millimeters 0.039 inches in m Meters 3.28 feet ft m Meters 1.09 yards yd km Kilometers 0.621 miles mi
AREA mm2 square millimeters 0.0016 square inches in2 m2 square meters 10.764 square feet ft2 m2 square meters 1.195 square yards yd2 ha Hectares 2.47 acres ac km2 square kilometers 0.386 square miles mi2
VOLUME mL Milliliters 0.034 fluid ounces fl oz L Liters 0.264 gallons gal m3 cubic meters 35.314 cubic feet ft3 m3 cubic meters 1.307 cubic yards yd3
MASS g Grams 0.035 ounces oz kg Kilograms 2.202 pounds lb Mg (or "t") megagrams (or "metric ton") 1.103 short tons (2000 lb) T
TEMPERATURE °C Celsius 1.8C+32 Fahrenheit °F
ILLUMINATION lx Lux 0.0929 foot-candles fc cd/m2 candela per square meter 0.2919 foot-Lamberts fl
FORCE and PRESSURE or STRESS N Newtons 0.225 poundforce lbf kPA kiloPascals 0.145 poundforce per square inch lbf/in2 (psi) MPa megaPascals 0.145 kips per square inch k/in2 (ksi) *SI is the symbol for the International System of Units. Appropriate rounding should be made to comply with Section 4 of ASTM E380. (Revised March 2003)
iii
TABLE OF CONTENTS
INTRODUCTION ................................................................................................................................................ 1
HIGHWAYS FOR LIFE DEMONSTRATION PROJECTS ............................................................................... 1 REPORT SCOPE AND ORGANIZATION .......................................................................................................... 3
PROJECT OVERVIEW AND LESSONS LEARNED ........................................................................................ 5
PROJECT OVERVIEW ................................................................................................................................................ 5 DATA COLLECTION .................................................................................................................................................. 5 ECONOMIC ANALYSIS .............................................................................................................................................. 6 LESSONS LEARNED................................................................................................................................................... 7
PROJECT DETAILS – SH 51, CREEK COUNTY ............................................................................................. 9
BACKGROUND ..................................................................................................................................................... 9 SUBSTRUCTURE CONSTRUCTION ..................................................................................................................................... 11
DATA ACQUISITION AND ANALYSIS ...................................................................................................................... 21
CONSTRUCTION CONGESTION......................................................................................................................................... 22 QUALITY AND DURABILITY ............................................................................................................................................. 23 USER SATISFACTION ...................................................................................................................................................... 24
ECONOMIC ANALYSIS ........................................................................................................................................... 25
CONSTRUCTION TIME ................................................................................................................................................... 25
TECHNOLOGY TRANSFER...................................................................................................................................... 29
ACKNOWLEDGMENTS .......................................................................................................................................... 31
iv
LIST OF FIGURES
Figure 1. Map. Project location (detour route highlighted in yellow). ........................................... 9
Figure 2. Photo. Existing structure 15375 on SH 51. ................................................................... 10
Figure 3. Photo. Deteriorated steel and support mechanisms on existing bridge. ........................ 10
Figure 4. Diagram. Location of new and existing bridge piers. ....................................................11
Figure 5. Photo. New piers and caps in place below and between existing piers. ........................ 12
Figure 6. Diagram. New pier locations along with falsework location. ....................................... 12
Figure 7. Diagram. Cross section of new concrete girders. .......................................................... 13
Figure 8. Photo. Center section of concrete girders in place (courtesy: ODOT). ......................... 13
Figure 9. Photo. Concrete girders in place on falsework (courtesy: Google Earth). .................... 14
Figure 10. Photo. Completed deck alongside existing structure (courtesy: ODOT). ................... 14
Figure 11. Photo. Removal of existing piers (courtesy: ODOT). ................................................. 15
Figure 12. Diagram. Cross section of revised pull assembly. ....................................................... 15
Figure 13. Photo. Hard plastic rails attached to pier caps. ............................................................ 16
Figure 14. Diagram. Lifting jack locations. .................................................................................. 16
Figure 15. Photo. Screw jack attached to end of abutment to facilitate pull. ............................... 17
Figure 16. Photo. Threaded rod run through sled under girders. .................................................. 17
Figure 17. Photo. Threaded nut used to lock rod to ram prior to pull. ......................................... 18
Figure 18. Photo. Air-operated jack placed between abutment and deck slab to provide adjustment between sections. ........................................................................................................ 18
Figure 19. Photo. Steel in place for approach slab pour. .............................................................. 19
Figure 20. Photo. Traffic on completed structure (courtesy: Google Earth)................................. 19
LIST OF TABLES
Table 1. Crash rates for original and detour routes before construction. ...................................... 21
Table 2. Crash rates for original and detour routes during construction. ...................................... 22
Table 3. Mobility impacts of full road closures. ........................................................................... 23
Table 4. Capital cost comparison. ................................................................................................. 26
v
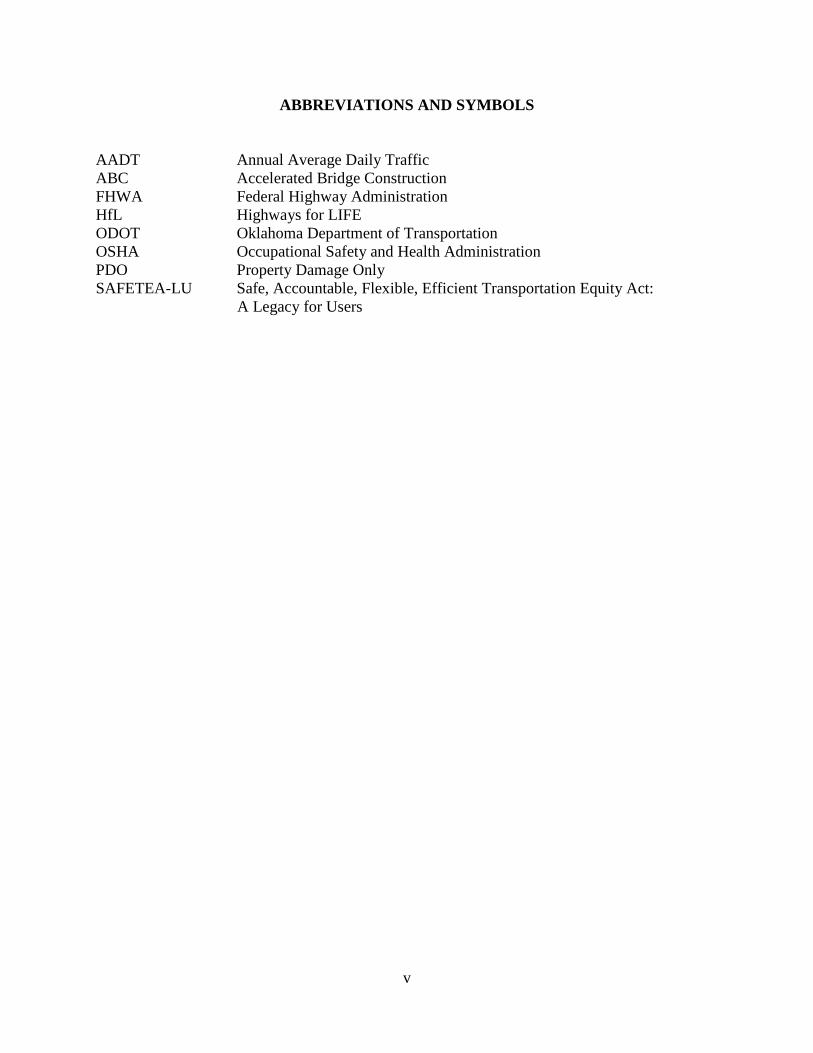
ABBREVIATIONS AND SYMBOLS
AADT Annual Average Daily Traffic ABC Accelerated Bridge Construction FHWA Federal Highway Administration HfL Highways for LIFE ODOT Oklahoma Department of Transportation OSHA Occupational Safety and Health Administration PDO Property Damage Only SAFETEA-LU Safe, Accountable, Flexible, Efficient Transportation Equity Act:
A Legacy for Users

vi
1
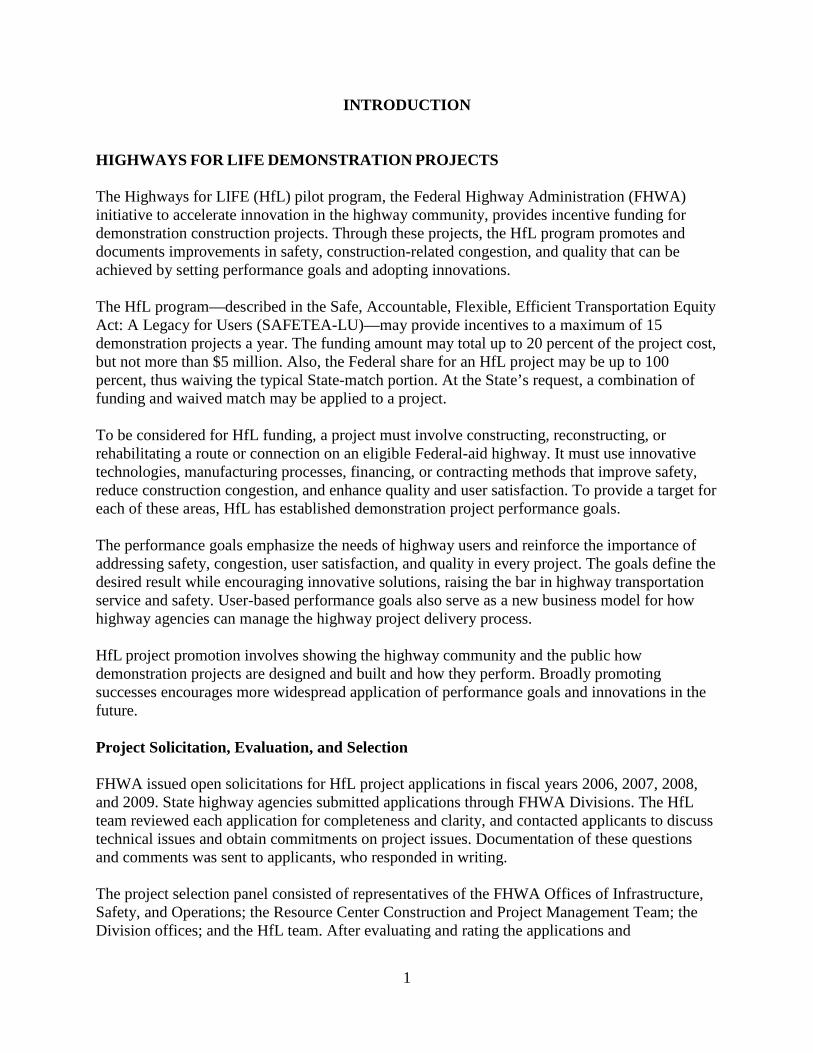
INTRODUCTION
HIGHWAYS FOR LIFE DEMONSTRATION PROJECTS The Highways for LIFE (HfL) pilot program, the Federal Highway Administration (FHWA) initiative to accelerate innovation in the highway community, provides incentive funding for demonstration construction projects. Through these projects, the HfL program promotes and documents improvements in safety, construction-related congestion, and quality that can be achieved by setting performance goals and adopting innovations. The HfL program—described in the Safe, Accountable, Flexible, Efficient Transportation Equity Act: A Legacy for Users (SAFETEA-LU)—may provide incentives to a maximum of 15 demonstration projects a year. The funding amount may total up to 20 percent of the project cost, but not more than $5 million. Also, the Federal share for an HfL project may be up to 100 percent, thus waiving the typical State-match portion. At the State’s request, a combination of funding and waived match may be applied to a project. To be considered for HfL funding, a project must involve constructing, reconstructing, or rehabilitating a route or connection on an eligible Federal-aid highway. It must use innovative technologies, manufacturing processes, financing, or contracting methods that improve safety, reduce construction congestion, and enhance quality and user satisfaction. To provide a target for each of these areas, HfL has established demonstration project performance goals. The performance goals emphasize the needs of highway users and reinforce the importance of addressing safety, congestion, user satisfaction, and quality in every project. The goals define the desired result while encouraging innovative solutions, raising the bar in highway transportation service and safety. User-based performance goals also serve as a new business model for how highway agencies can manage the highway project delivery process. HfL project promotion involves showing the highway community and the public how demonstration projects are designed and built and how they perform. Broadly promoting successes encourages more widespread application of performance goals and innovations in the future. Project Solicitation, Evaluation, and Selection FHWA issued open solicitations for HfL project applications in fiscal years 2006, 2007, 2008, and 2009. State highway agencies submitted applications through FHWA Divisions. The HfL team reviewed each application for completeness and clarity, and contacted applicants to discuss technical issues and obtain commitments on project issues. Documentation of these questions and comments was sent to applicants, who responded in writing. The project selection panel consisted of representatives of the FHWA Offices of Infrastructure, Safety, and Operations; the Resource Center Construction and Project Management Team; the Division offices; and the HfL team. After evaluating and rating the applications and
2
supplemental information, panel members convened to reach a consensus on the projects to recommend for approval. The panel gave priority to projects that accomplish the following:
• Address the HfL performance goals for safety, construction congestion, quality, and user satisfaction.
• Use innovative technologies, manufacturing processes, financing, contracting practices, and performance measures that demonstrate substantial improvements in safety, congestion, quality, and cost-effectiveness. An innovation must be one the applicant State has never or rarely used, even if it is standard practice in other States.
• Include innovations that will change administration of the State’s highway program to more quickly build long-lasting, high-quality, cost-effective projects that improve safety and reduce congestion.
• Will be ready for construction within 1 year of approval of the project application. For the HfL program, FHWA considers a project ready for construction when the FHWA Division authorizes it.
• Demonstrate the willingness of the applicant department of transportation to participate in technology transfer and information dissemination activities associated with the project.
HfL Project Performance Goals The HfL performance goals focus on the expressed needs and wants of highway users. They are set at a level that represents the best of what the highway community can do, not just the average of what has been done. States are encouraged to use all applicable goals on a project:
• Safety o Work zone safety during construction—Work zone crash rate equal to or less than
the preconstruction rate at the project location. o Worker safety during construction—Incident rate for worker injuries of less than
4.0, based on incidents reported via Occupational Safety and Health Administration (OSHA) Form 300.
o Facility safety after construction—Twenty percent reduction in fatalities and injuries in 3-year average crash rates, using preconstruction rates as the baseline.
• Construction Congestion o Faster construction—Fifty percent reduction in the time highway users are
impacted, compared to traditional methods. o Trip time during construction—Less than 10 percent increase in trip time
compared to the average preconstruction speed, using 100 percent sampling. o Queue length during construction—A moving queue length of less than 0.5 miles
in a rural area or less than 1.5 miles in an urban area (in both cases at a travel speed 20 percent less than the posted speed).
• Quality o Durability—An assessment of how composite material are expected to perform
with respect to increased life and decreased maintenance of the composite structural elements.
• User Satisfaction
3
o User satisfaction—An assessment of how satisfied users are with the new facility compared to its previous condition and with the approach used to minimize disruption during construction.
REPORT SCOPE AND ORGANIZATION This report documents the Oklahoma Department of Transportation (ODOT) HfL demonstration project, which involved accelerated replacement of a deficient bridge over Cottonwood Creek, near Mannford. The report presents project details relevant to the HfL program, including innovative contracting, superstructure and substructure design and construction highlights, rapid bridge removal and replacement, HfL performance metrics measurement, and economic analysis. Technology transfer activities that took place during the project and lessons learned are also discussed.

4
5
PROJECT OVERVIEW AND LESSONS LEARNED
PROJECT OVERVIEW State Highway 51 is a rural minor arterial carrying traffic between the Tulsa metropolitan area and the city of Stillwater. Cottonwood Creek feeds Lake Keystone, located less than a mile downstream of the project location. Property along both sides of SH 51 in this area is owned by the US Government and is designated as the Keystone Wildlife Management Area. The desire to minimize the impact to traffic and to minimize right-of-way impacts weighed greatly in ODOT’s decision to use innovative features on this project. The primary innovative feature employed was the use of accelerated bridge construction (ABC) techniques, specifically the use of bridge sliding technology. Using this technology allows a bridge superstructure to be built adjacent to the existing structure and then moved into place using a series of temporary supports and positioned on new piers or abutments. In this case, new piers were constructed under the existing structure with no disruption to traffic. While the use of ABC may not have reduced the total time to construct this project, it did result in a road closure of only 11 days, compared to the estimated 180 days for traditional bridge replacement. While the ABC component of the contract was new to ODOT, the contracting method was the traditional design-bid-build contract. An incentive/disincentive clause was included to facilitate completion of the project. The clause provided for a penalty of $20,000 per day for each day the road was closed beyond the scheduled 21 days in the contract. Likewise, the contractor would be paid an additional $20,000 per day for each day the road was opened earlier than the 21-day schedule. DATA COLLECTION The successful implementation of this project was assessed with respect to how the HfL safety, construction congestion, quality, and user satisfaction goals were addressed. On most HfL projects, data are collected before, during, and after construction, as appropriate, to demonstrate that the featured innovations can be deployed while simultaneously meeting the HfL performance goals in these areas:
• Safety o Work zone safety during construction—Complete closure of the roadway during
the slide operation eliminated any traditional work zone crashes. While local traffic was allowed on both ends of the closure, at the time of this report, no motorist incidents were reported during construction. This was greatly facilitated by the fact that the road was actually closed to traffic for only 11 days. ODOT exceeded the HfL requirements for work zone safety.
o Worker safety during construction—No worker injuries occurred during construction, which exceeded the goal of less than a 4.0 rating on the OSHA 300 form.
6
o Facility safety after construction—The use of ABC technology cannot be expected to directly influence safety on this facility in the future. However, the replacement structure was widened to the current standard of 40 feet from the existing 28-foot structure with lanes and shoulders matching the approaching roadway. In addition, the substandard railings were replaced with modern systems and end treatments, which should generally improve safety along the corridor.
• Construction Congestion o Faster construction—The ABC technology did not reduce the total construction
time for the project. However, traditional construction would have closed the road to traffic for an estimated 180 days. The total time of closure using ABC was 11 days. With respect to construction inconvenience to the public, the HfL goal of a 50 percent reduction was easily met.
o Trip time during construction—Road closure required a detour of approximately 29 miles with a corresponding increase in travel time of more than 19 minutes. While the HfL goal of less than 10 percent increase in trip time compared to the average preconstruction time could not be met under these conditions, the total duration of the detour was reduced by 169 days, resulting in a total delay far less than with conventional construction.
o Queue length during construction—Given the low traffic volumes encountered on this project, no queue length was observed, meeting the HfL performance goal of less than 0.5 miles.
• Quality o Durability—The new structure resulted in a far superior product in terms of both
quality and durability. The use of the latest design standards provides a facility with a far greater design life than the existing structure, limiting future maintenance and inconvenience to the public. Also included in the project was the use of stainless steel bearing assemblies with elastomeric bearing pads, along with the application of a liquid urethane coating for all surfaces of the substructure and the vertical surfaces of the piers. This should also increase the long-term durability of the structure.
• User Satisfaction o User satisfaction - A user satisfaction survey was conducted prior to construction of the Cottonwood Creek project. Results indicated that the public did not think the existing structure provided a safe avenue of travel through the corridor. A post construction survey was planned, but had not been completed at the time of this report.
ECONOMIC ANALYSIS
The costs of delivering this HfL project was about $3.6 million, compared to the most likely traditional alternative of about $1.95 million. The traditional approach would be to demolish the structure and rebuild in place. The innovation involved the construction of additional falsework that would not be necessary with traditional construction, but that was offset by the reduced user costs achieved by a great reduction in road closure time. There was also an additional cost associated with the slide itself because it required that a highly specialized team be brought in for the purpose of the slide.
7
There was an additional upfront cost associated with the use of ABC technology on this project of approximately $1.2 million. This equates to an increase of more than 50 percent. While no immediate savings were realized in capital cost, it is believed that there could still be uses for the technology on future projects when there is a high traffic volume and a minimal closure of the roadway is desired. Also, there was a large reduction in user cost associated with the innovation, due to the greatly decreased closure time (and thus, detour time). It is also assumed that much of the additional cost of this project was due to the contracting community’s unfamiliarity with the innovation, which may have resulted in bidders adding substantial “risk” cost into the project. LESSONS LEARNED There were minimal issues identified with the use of ABC technology on this project. While there were delays, the delays were not necessarily a result of the ABC innovation. Most involved weather, design changes, and issues with nesting migratory birds. Had these same issues occurred during a traditional construction project, the closure could have extended far beyond the assumed 180 day for the project. It was helpful to have the original bridge design consultant on board under a separate contract to approve changes or post letting issues, as he was intimately familiar with the project design. ODOT believes that it is important to gain experience with this technology so that contractors become familiar with the technology, hopefully resulting in lower bids in the future. While the initial cost of ABC is higher, the agency believes that there are situations where it is a good alternative, especially where there would be extended closure of the roadway, long detours, or dramatically increased travel times. This would be especially true in areas with a high traffic volume.

8
9
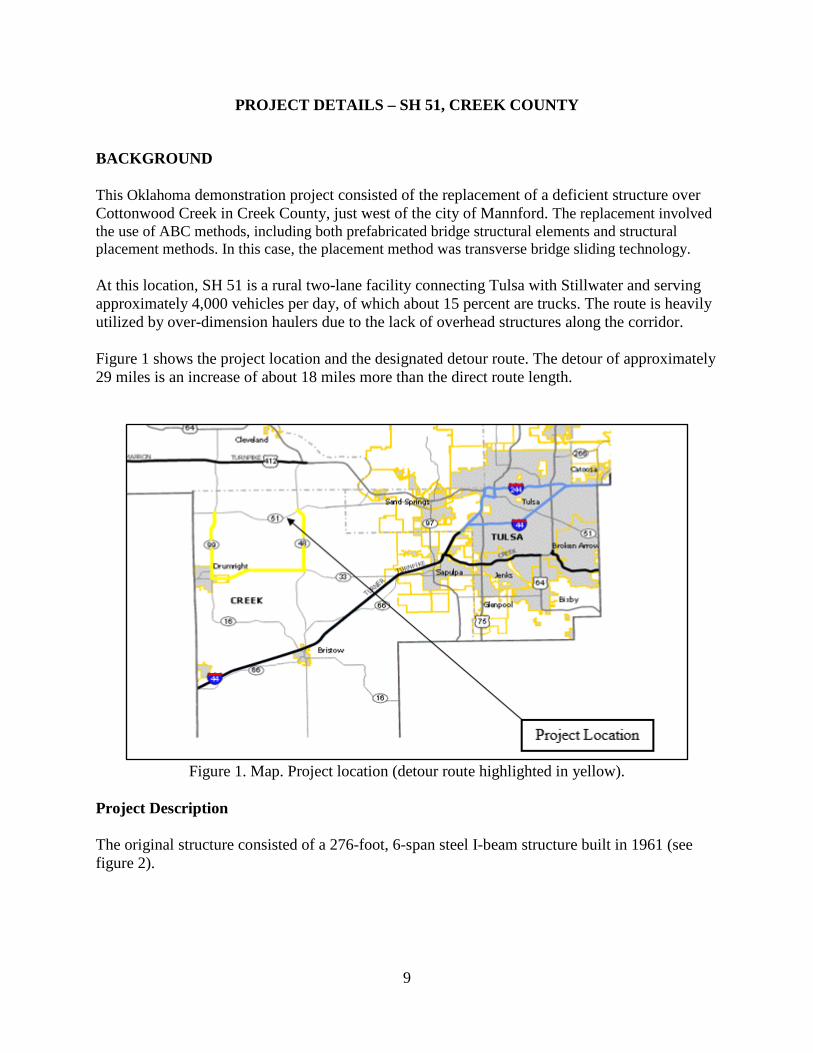
PROJECT DETAILS – SH 51, CREEK COUNTY BACKGROUND This Oklahoma demonstration project consisted of the replacement of a deficient structure over Cottonwood Creek in Creek County, just west of the city of Mannford. The replacement involved the use of ABC methods, including both prefabricated bridge structural elements and structural placement methods. In this case, the placement method was transverse bridge sliding technology. At this location, SH 51 is a rural two-lane facility connecting Tulsa with Stillwater and serving approximately 4,000 vehicles per day, of which about 15 percent are trucks. The route is heavily utilized by over-dimension haulers due to the lack of overhead structures along the corridor. Figure 1 shows the project location and the designated detour route. The detour of approximately 29 miles is an increase of about 18 miles more than the direct route length.
Figure 1. Map. Project location (detour route highlighted in yellow).
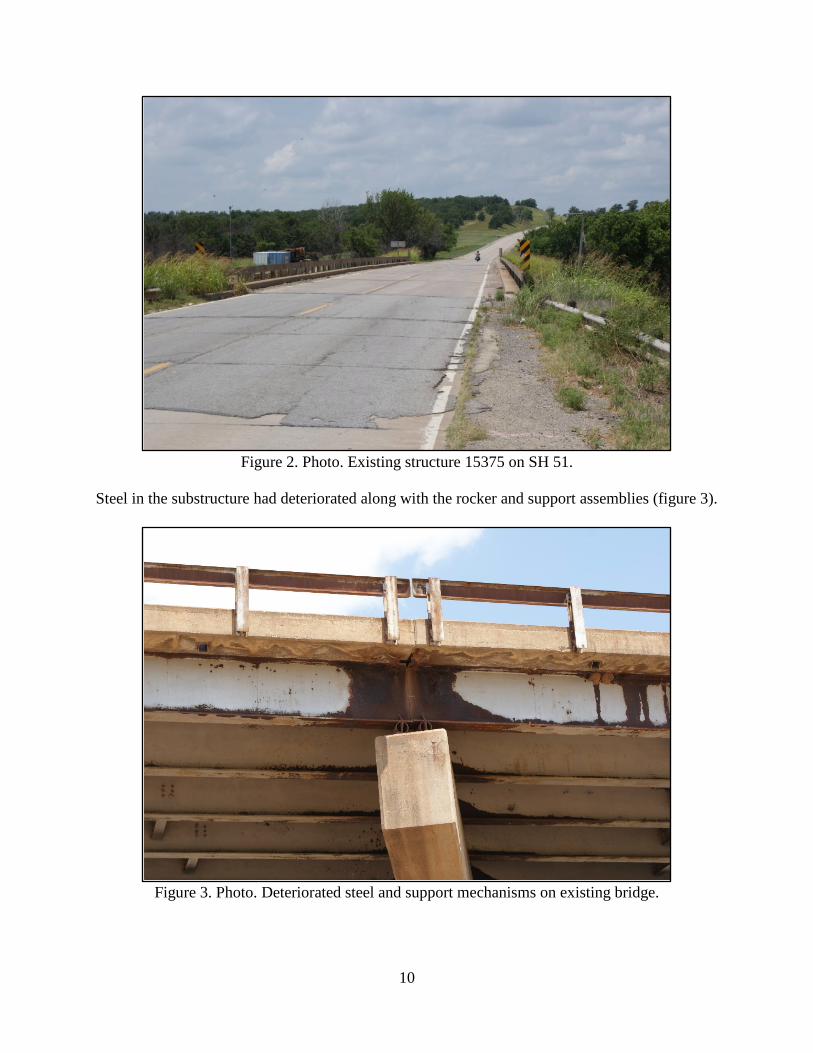
Project Description The original structure consisted of a 276-foot, 6-span steel I-beam structure built in 1961 (see figure 2).
10
Figure 2. Photo. Existing structure 15375 on SH 51.
Steel in the substructure had deteriorated along with the rocker and support assemblies (figure 3).
Figure 3. Photo. Deteriorated steel and support mechanisms on existing bridge.
11
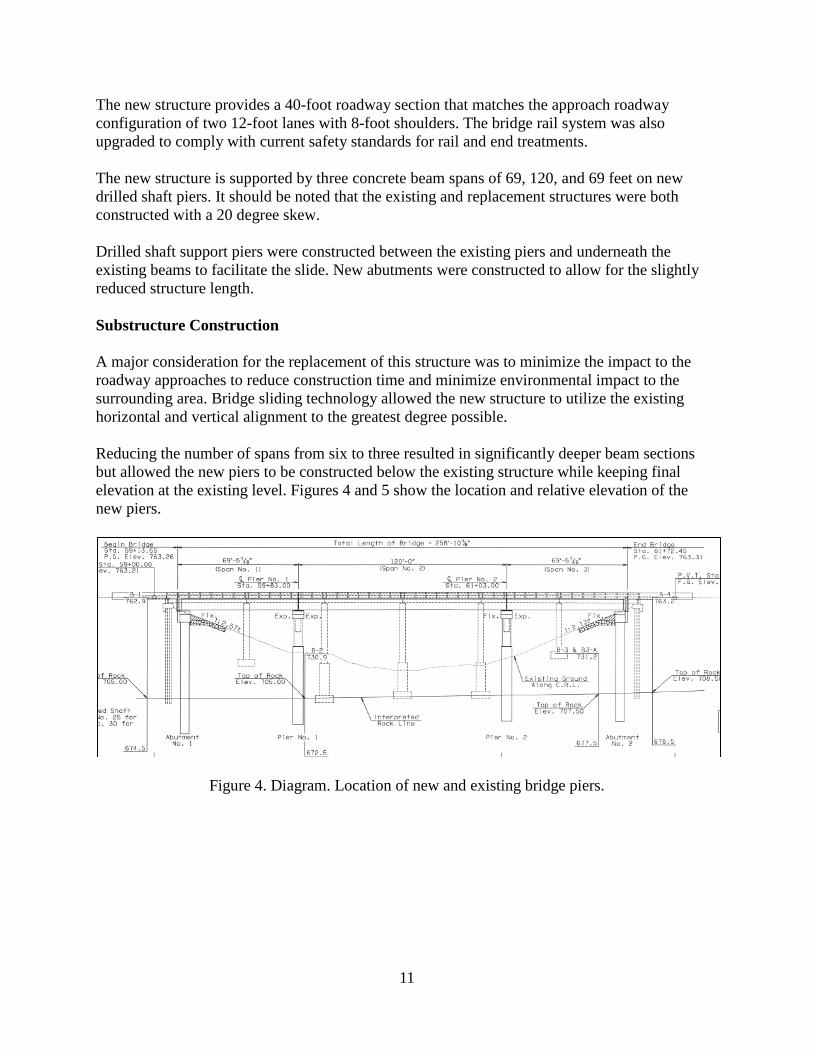
The new structure provides a 40-foot roadway section that matches the approach roadway configuration of two 12-foot lanes with 8-foot shoulders. The bridge rail system was also upgraded to comply with current safety standards for rail and end treatments. The new structure is supported by three concrete beam spans of 69, 120, and 69 feet on new drilled shaft piers. It should be noted that the existing and replacement structures were both constructed with a 20 degree skew. Drilled shaft support piers were constructed between the existing piers and underneath the existing beams to facilitate the slide. New abutments were constructed to allow for the slightly reduced structure length. Substructure Construction A major consideration for the replacement of this structure was to minimize the impact to the roadway approaches to reduce construction time and minimize environmental impact to the surrounding area. Bridge sliding technology allowed the new structure to utilize the existing horizontal and vertical alignment to the greatest degree possible. Reducing the number of spans from six to three resulted in significantly deeper beam sections but allowed the new piers to be constructed below the existing structure while keeping final elevation at the existing level. Figures 4 and 5 show the location and relative elevation of the new piers.
Figure 4. Diagram. Location of new and existing bridge piers.
12
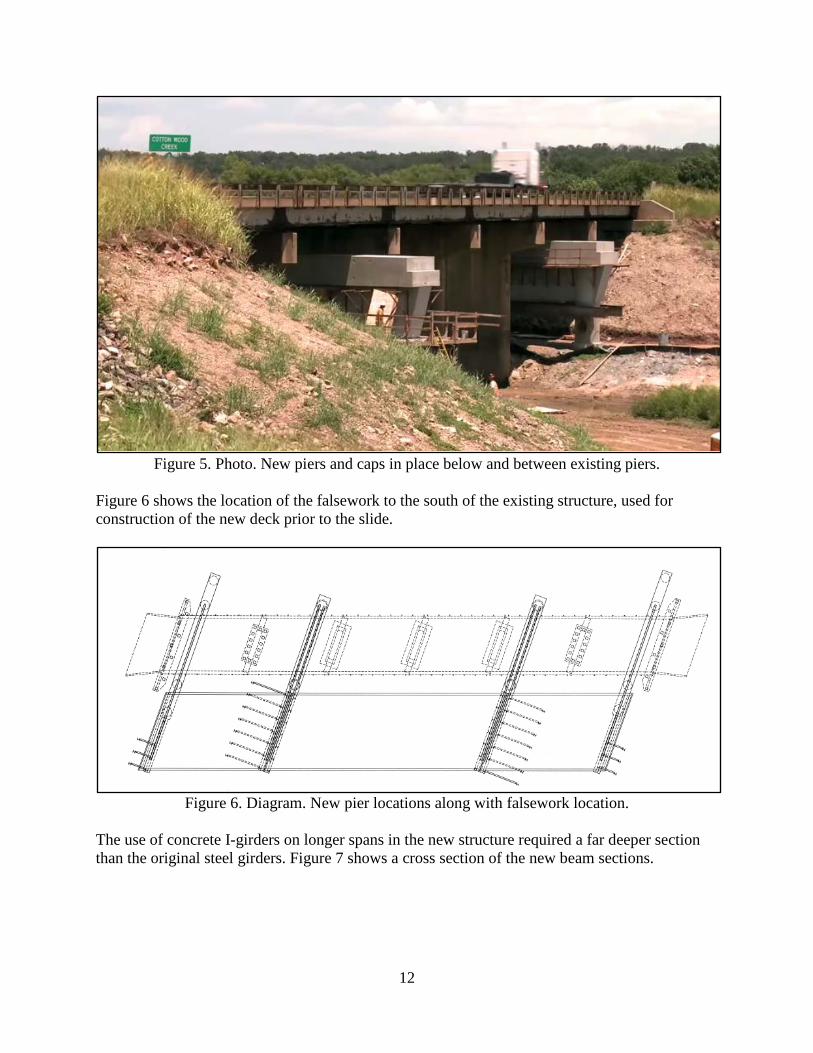
Figure 5. Photo. New piers and caps in place below and between existing piers.
Figure 6 shows the location of the falsework to the south of the existing structure, used for construction of the new deck prior to the slide.
Figure 6. Diagram. New pier locations along with falsework location.
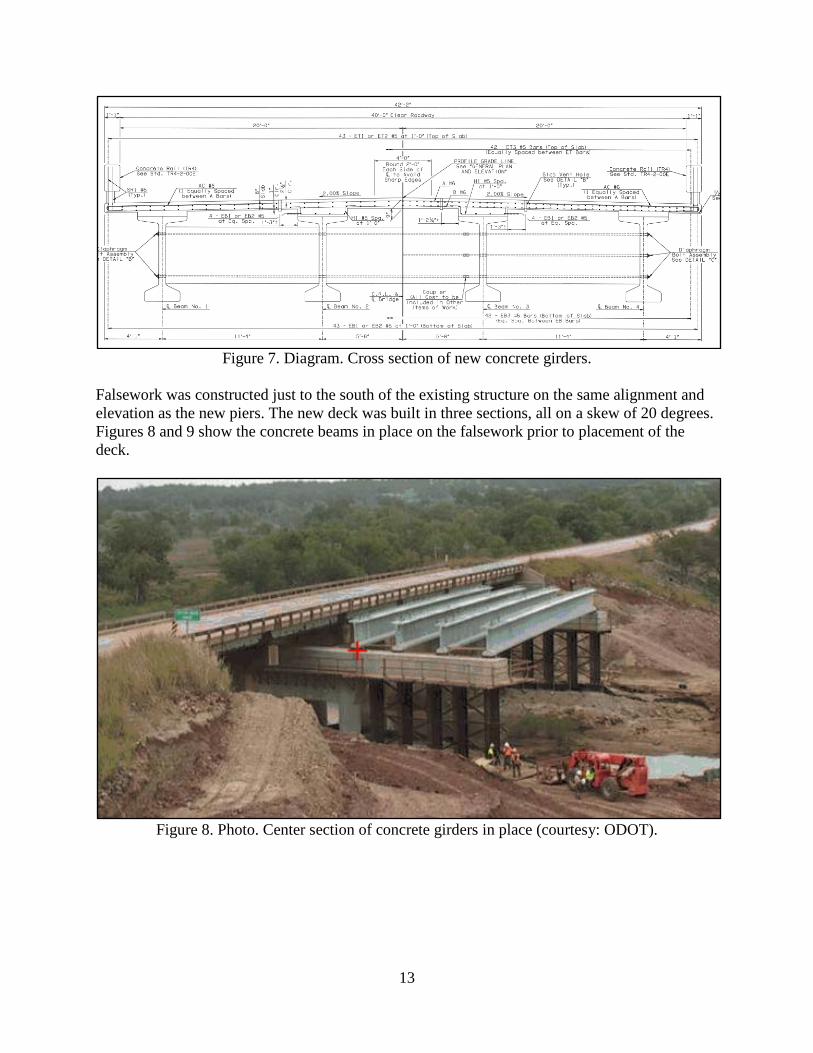
The use of concrete I-girders on longer spans in the new structure required a far deeper section than the original steel girders. Figure 7 shows a cross section of the new beam sections.
13
Figure 7. Diagram. Cross section of new concrete girders.
Falsework was constructed just to the south of the existing structure on the same alignment and elevation as the new piers. The new deck was built in three sections, all on a skew of 20 degrees. Figures 8 and 9 show the concrete beams in place on the falsework prior to placement of the deck.
Figure 8. Photo. Center section of concrete girders in place (courtesy: ODOT).
14
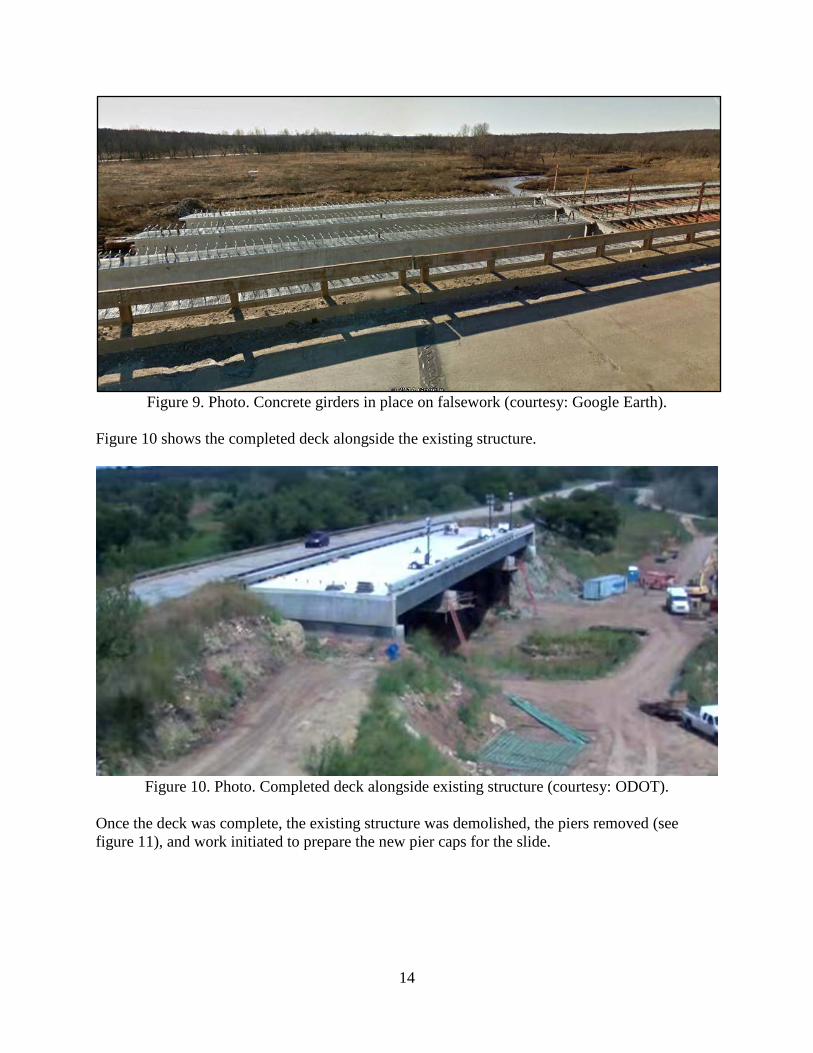
Figure 9. Photo. Concrete girders in place on falsework (courtesy: Google Earth).
Figure 10 shows the completed deck alongside the existing structure.
Figure 10. Photo. Completed deck alongside existing structure (courtesy: ODOT).
Once the deck was complete, the existing structure was demolished, the piers removed (see figure 11), and work initiated to prepare the new pier caps for the slide.
15
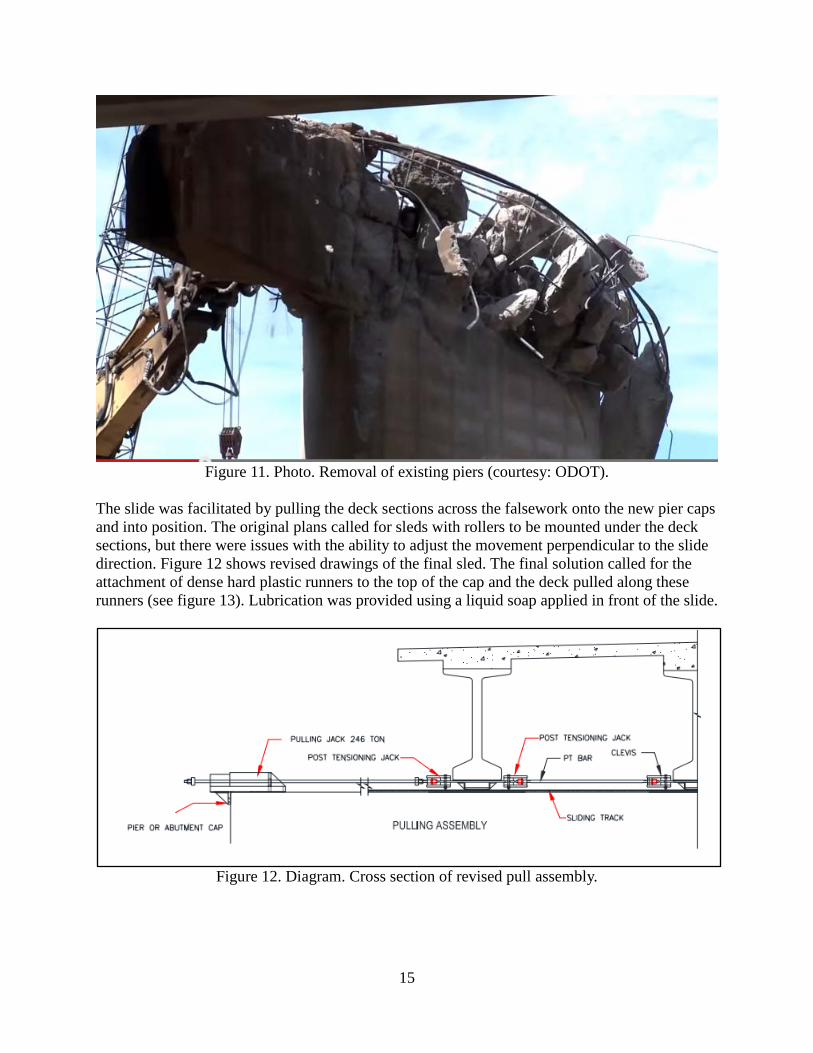
Figure 11. Photo. Removal of existing piers (courtesy: ODOT).
The slide was facilitated by pulling the deck sections across the falsework onto the new pier caps and into position. The original plans called for sleds with rollers to be mounted under the deck sections, but there were issues with the ability to adjust the movement perpendicular to the slide direction. Figure 12 shows revised drawings of the final sled. The final solution called for the attachment of dense hard plastic runners to the top of the cap and the deck pulled along these runners (see figure 13). Lubrication was provided using a liquid soap applied in front of the slide.
Figure 12. Diagram. Cross section of revised pull assembly.
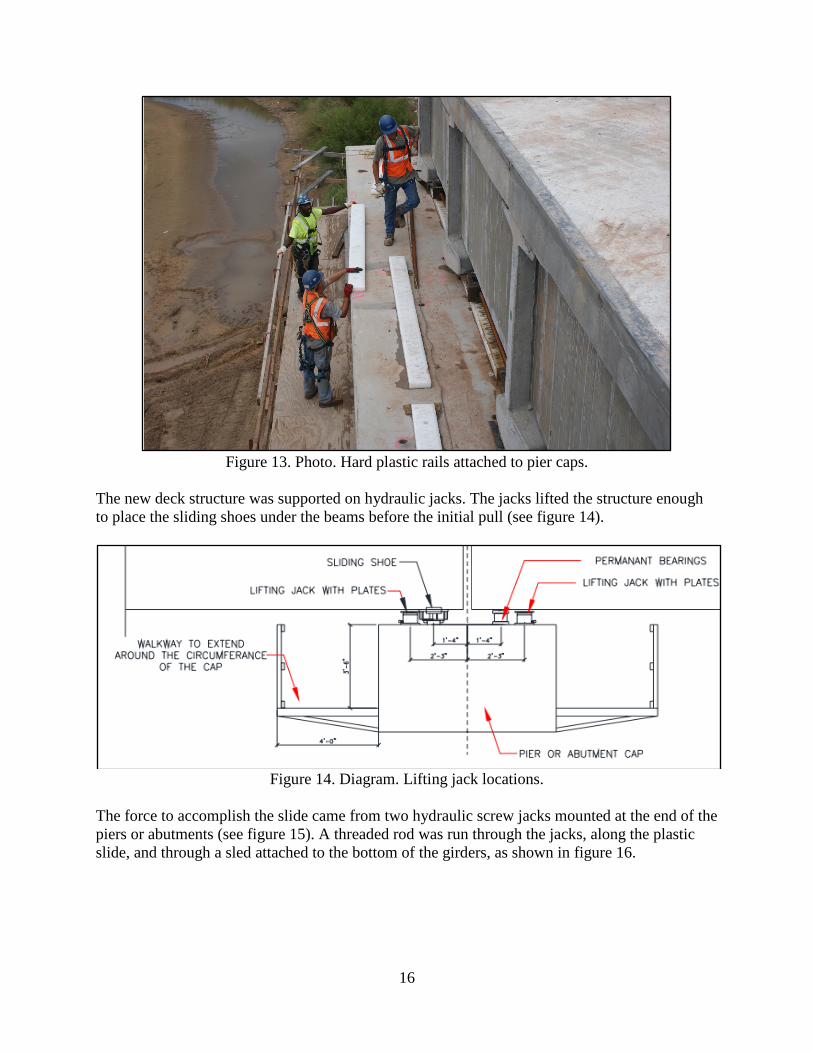
16
Figure 13. Photo. Hard plastic rails attached to pier caps.
The new deck structure was supported on hydraulic jacks. The jacks lifted the structure enough to place the sliding shoes under the beams before the initial pull (see figure 14).
Figure 14. Diagram. Lifting jack locations.
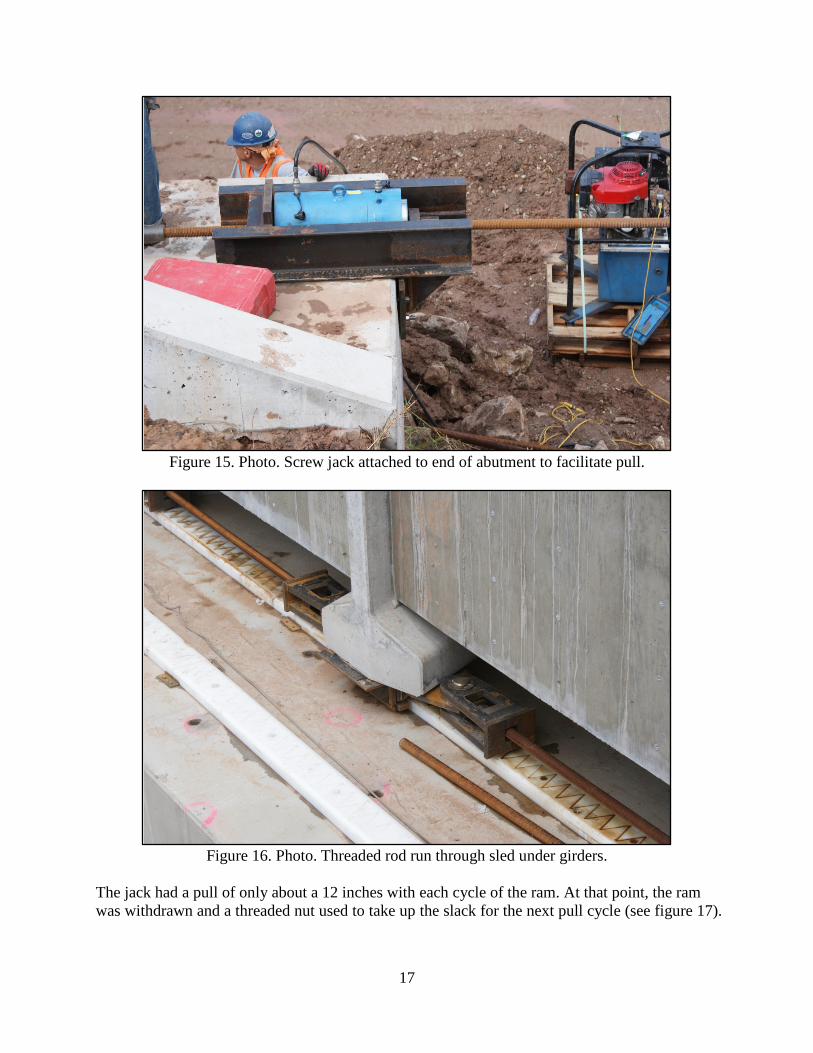
The force to accomplish the slide came from two hydraulic screw jacks mounted at the end of the piers or abutments (see figure 15). A threaded rod was run through the jacks, along the plastic slide, and through a sled attached to the bottom of the girders, as shown in figure 16.
17
Figure 15. Photo. Screw jack attached to end of abutment to facilitate pull.
Figure 16. Photo. Threaded rod run through sled under girders.
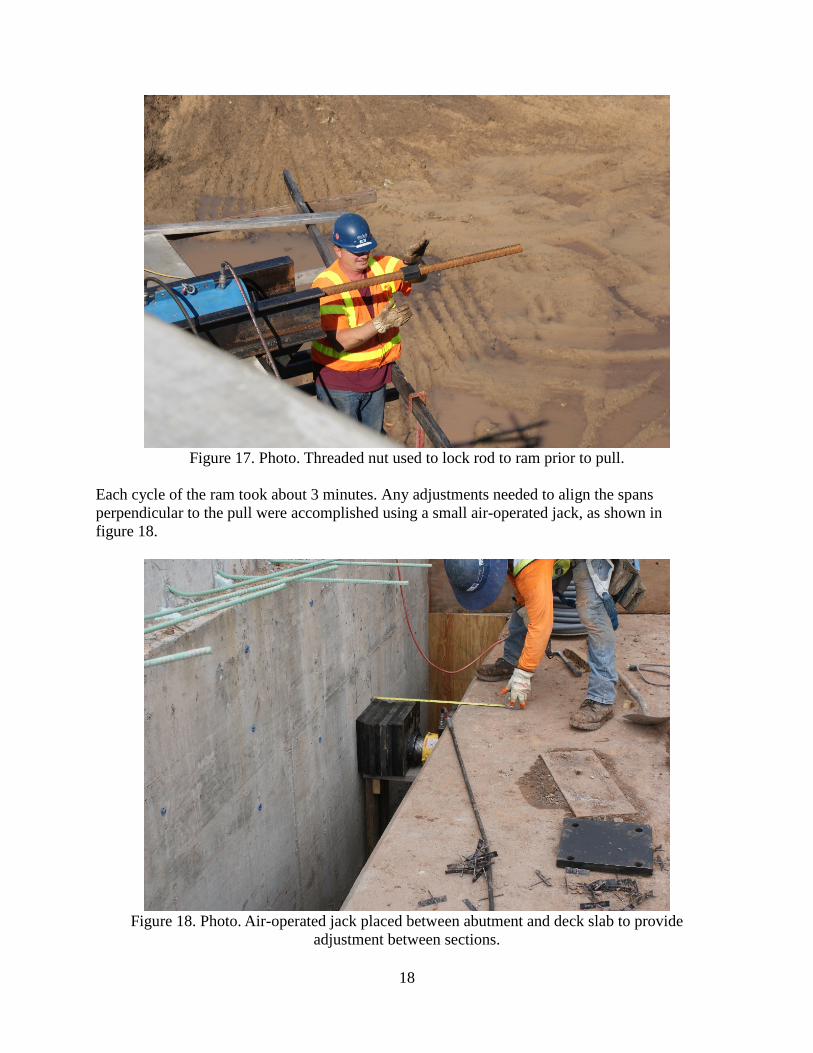
The jack had a pull of only about a 12 inches with each cycle of the ram. At that point, the ram was withdrawn and a threaded nut used to take up the slack for the next pull cycle (see figure 17).
18
Figure 17. Photo. Threaded nut used to lock rod to ram prior to pull.
Each cycle of the ram took about 3 minutes. Any adjustments needed to align the spans perpendicular to the pull were accomplished using a small air-operated jack, as shown in figure 18.
Figure 18. Photo. Air-operated jack placed between abutment and deck slab to provide
adjustment between sections.
19
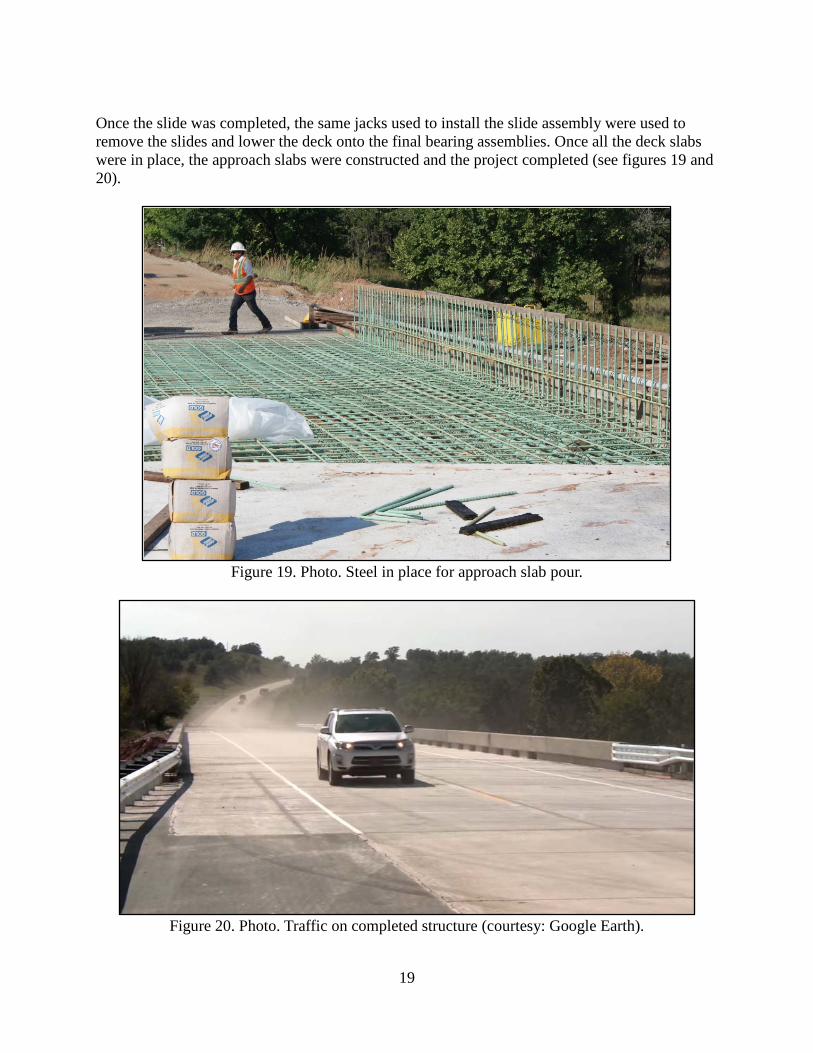
Once the slide was completed, the same jacks used to install the slide assembly were used to remove the slides and lower the deck onto the final bearing assemblies. Once all the deck slabs were in place, the approach slabs were constructed and the project completed (see figures 19 and 20).
Figure 19. Photo. Steel in place for approach slab pour.
Figure 20. Photo. Traffic on completed structure (courtesy: Google Earth).

20
21
DATA ACQUISITION AND ANALYSIS Safety, congestion, and quality data were collected before and after construction for this project to quantify the project performance, to provide an objective basis to determine the feasibility of the project innovations, and to demonstrate that the innovations can be used to do the following:
• Achieve a safer work environment for the traveling public and workers. • Reduce construction time and minimize traffic interruptions. • Produce a high-quality project and gain user satisfaction.
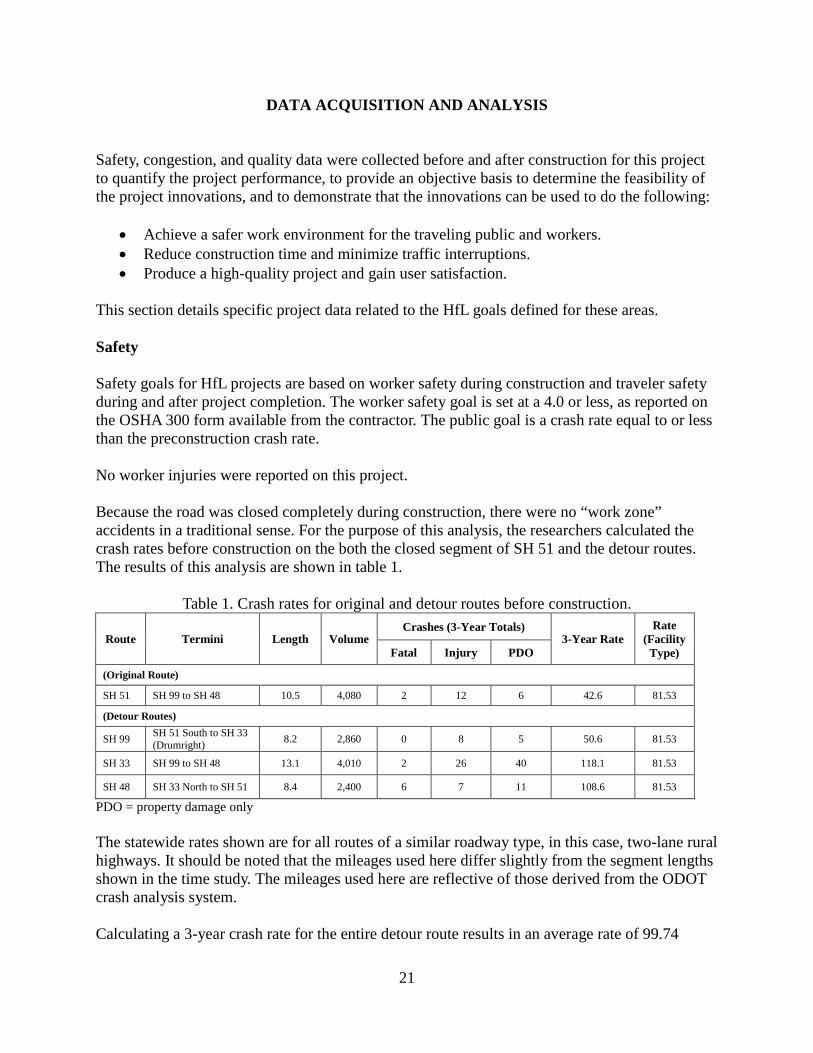
This section details specific project data related to the HfL goals defined for these areas. Safety Safety goals for HfL projects are based on worker safety during construction and traveler safety during and after project completion. The worker safety goal is set at a 4.0 or less, as reported on the OSHA 300 form available from the contractor. The public goal is a crash rate equal to or less than the preconstruction crash rate. No worker injuries were reported on this project. Because the road was closed completely during construction, there were no “work zone” accidents in a traditional sense. For the purpose of this analysis, the researchers calculated the crash rates before construction on the both the closed segment of SH 51 and the detour routes. The results of this analysis are shown in table 1.
Table 1. Crash rates for original and detour routes before construction.
Route Termini Length Volume Crashes (3-Year Totals)
3-Year Rate Rate
(Facility Type) Fatal Injury PDO
(Original Route)
SH 51 SH 99 to SH 48 10.5 4,080 2 12 6 42.6 81.53
(Detour Routes)
SH 99 SH 51 South to SH 33 (Drumright) 8.2 2,860 0 8 5 50.6 81.53
SH 33 SH 99 to SH 48 13.1 4,010 2 26 40 118.1 81.53 SH 48 SH 33 North to SH 51 8.4 2,400 6 7 11 108.6 81.53
PDO = property damage only The statewide rates shown are for all routes of a similar roadway type, in this case, two-lane rural highways. It should be noted that the mileages used here differ slightly from the segment lengths shown in the time study. The mileages used here are reflective of those derived from the ODOT crash analysis system. Calculating a 3-year crash rate for the entire detour route results in an average rate of 99.74
22
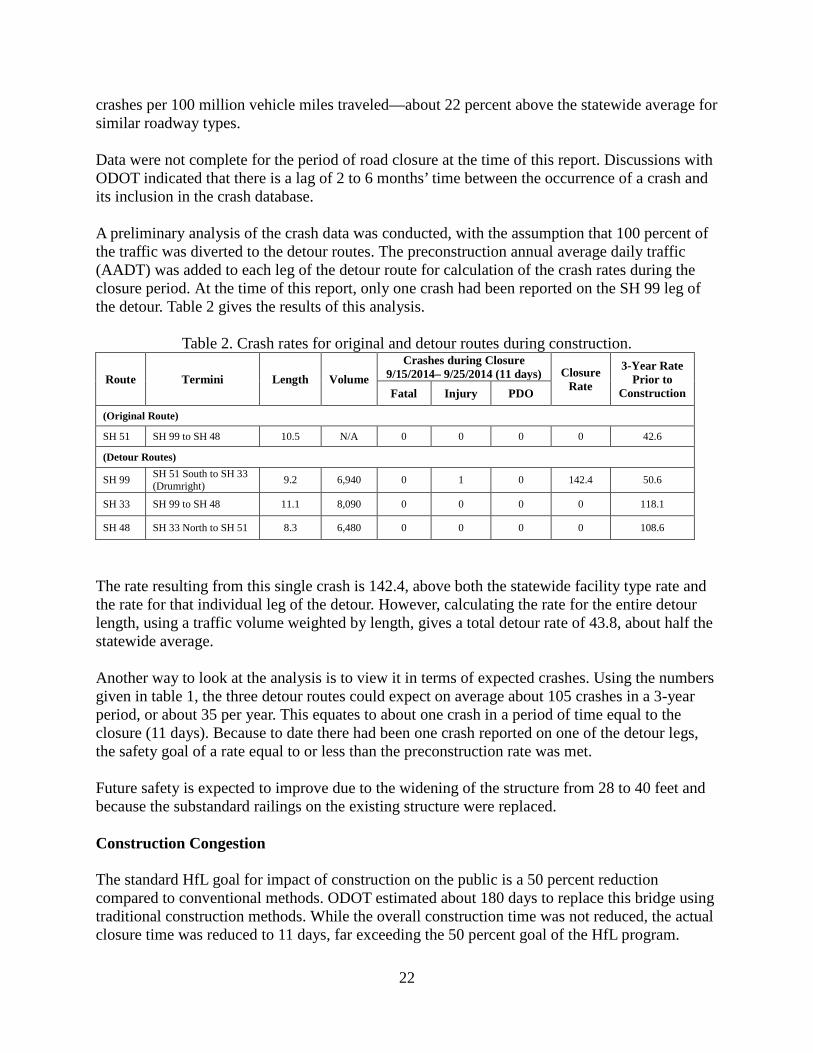
crashes per 100 million vehicle miles traveled—about 22 percent above the statewide average for similar roadway types. Data were not complete for the period of road closure at the time of this report. Discussions with ODOT indicated that there is a lag of 2 to 6 months’ time between the occurrence of a crash and its inclusion in the crash database. A preliminary analysis of the crash data was conducted, with the assumption that 100 percent of the traffic was diverted to the detour routes. The preconstruction annual average daily traffic (AADT) was added to each leg of the detour route for calculation of the crash rates during the closure period. At the time of this report, only one crash had been reported on the SH 99 leg of the detour. Table 2 gives the results of this analysis.
Table 2. Crash rates for original and detour routes during construction.
Route Termini Length Volume Crashes during Closure
9/15/2014– 9/25/2014 (11 days) Closure Rate
3-Year Rate Prior to
Construction Fatal Injury PDO
(Original Route)
SH 51 SH 99 to SH 48 10.5 N/A 0 0 0 0 42.6
(Detour Routes)
SH 99 SH 51 South to SH 33 (Drumright) 9.2 6,940 0 1 0 142.4 50.6
SH 33 SH 99 to SH 48 11.1 8,090 0 0 0 0 118.1 SH 48 SH 33 North to SH 51 8.3 6,480 0 0 0 0 108.6
The rate resulting from this single crash is 142.4, above both the statewide facility type rate and the rate for that individual leg of the detour. However, calculating the rate for the entire detour length, using a traffic volume weighted by length, gives a total detour rate of 43.8, about half the statewide average. Another way to look at the analysis is to view it in terms of expected crashes. Using the numbers given in table 1, the three detour routes could expect on average about 105 crashes in a 3-year period, or about 35 per year. This equates to about one crash in a period of time equal to the closure (11 days). Because to date there had been one crash reported on one of the detour legs, the safety goal of a rate equal to or less than the preconstruction rate was met. Future safety is expected to improve due to the widening of the structure from 28 to 40 feet and because the substandard railings on the existing structure were replaced. Construction Congestion The standard HfL goal for impact of construction on the public is a 50 percent reduction compared to conventional methods. ODOT estimated about 180 days to replace this bridge using traditional construction methods. While the overall construction time was not reduced, the actual closure time was reduced to 11 days, far exceeding the 50 percent goal of the HfL program.
23
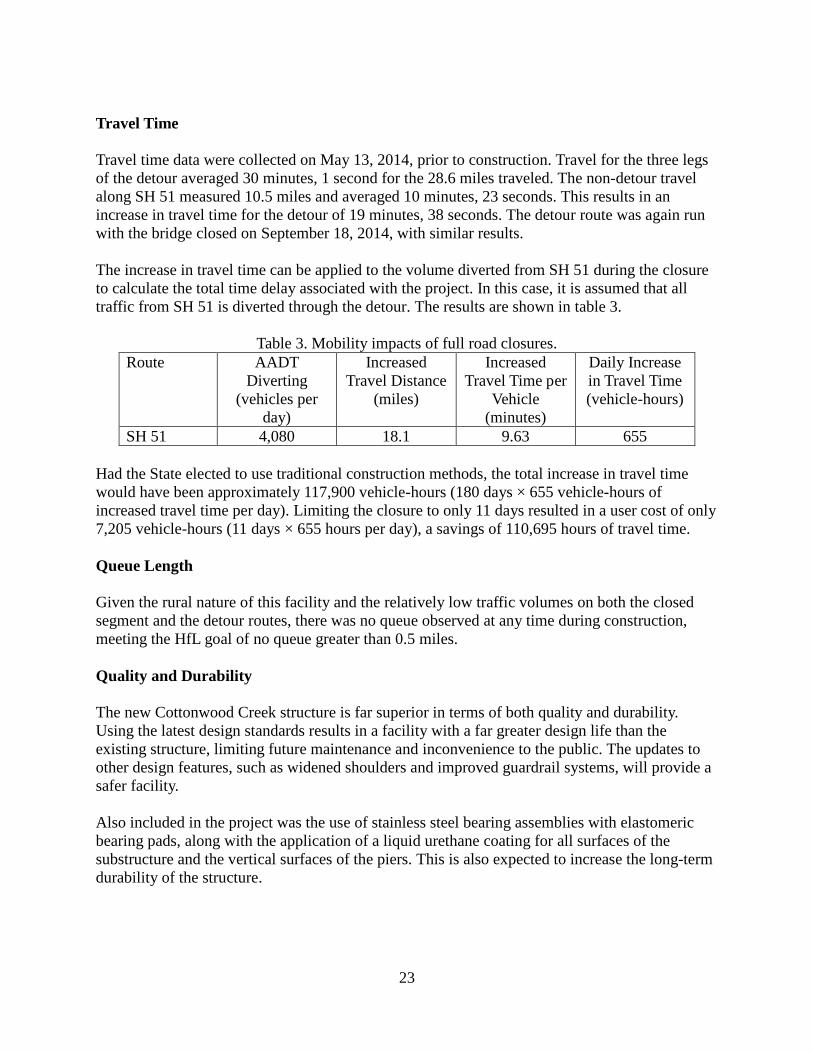
Travel Time Travel time data were collected on May 13, 2014, prior to construction. Travel for the three legs of the detour averaged 30 minutes, 1 second for the 28.6 miles traveled. The non-detour travel along SH 51 measured 10.5 miles and averaged 10 minutes, 23 seconds. This results in an increase in travel time for the detour of 19 minutes, 38 seconds. The detour route was again run with the bridge closed on September 18, 2014, with similar results. The increase in travel time can be applied to the volume diverted from SH 51 during the closure to calculate the total time delay associated with the project. In this case, it is assumed that all traffic from SH 51 is diverted through the detour. The results are shown in table 3.
Route AADT Increased Increased Daily Increase Diverting Travel Distance Travel Time per in Travel Time
(vehicles per (miles) Vehicle (vehicle-hours) day) (minutes)
SH 51 4,080 18.1 9.63 655
Table 3. Mobility impacts of full road closures.
Had the State elected to use traditional construction methods, the total increase in travel time would have been approximately 117,900 vehicle-hours (180 days × 655 vehicle-hours of increased travel time per day). Limiting the closure to only 11 days resulted in a user cost of only 7,205 vehicle-hours (11 days × 655 hours per day), a savings of 110,695 hours of travel time. Queue Length Given the rural nature of this facility and the relatively low traffic volumes on both the closed segment and the detour routes, there was no queue observed at any time during construction, meeting the HfL goal of no queue greater than 0.5 miles. Quality and Durability The new Cottonwood Creek structure is far superior in terms of both quality and durability. Using the latest design standards results in a facility with a far greater design life than the existing structure, limiting future maintenance and inconvenience to the public. The updates to other design features, such as widened shoulders and improved guardrail systems, will provide a safer facility. Also included in the project was the use of stainless steel bearing assemblies with elastomeric bearing pads, along with the application of a liquid urethane coating for all surfaces of the substructure and the vertical surfaces of the piers. This is also expected to increase the long-term durability of the structure.
24
Noise and Smoothness The improvement included on this HfL project was limited to the length of the structure and a few feet on either end for construction of approach slabs. Given the total length was less than 0.1 miles, it was determined that collection of noise and smoothness data would not be required. User Satisfaction ODOT conducted satisfaction surveys both before and after the construction of this project. They provided for extensive preconstruction public involvement and education, which is especially necessary when significant detours are required. The preconstruction survey pool was drawn from three towns where residents were considered to be most affected by travel across the bridge—Mannford, Cleveland, and Yale. Questions asked concerned the perceived safety of the structure and the ability to travel with limited delay through the area. The overall average for the five questions was a rating of 2.7, or “undecided.” The two questions concerning travel ease or speed averaged a 3.0 (undecided). The three questions concerning perceived safety averaged 2.4, indicating the public did not agree that the existing structure provided a safe traffic environment. The post-construction survey results were not available at the time of this report.
25
ECONOMIC ANALYSIS A key aspect of HfL demonstration projects is quantifying, as much as possible, the value of the innovations deployed. This entails comparing the benefits and costs associated with the innovative project delivery approach adopted on an HfL project with those from a more traditional delivery approach on a project of similar size and scope. The latter type of project is referred to as a baseline case and is an important component of the economic analysis. The key innovation on the SH 51 project was the use of ABC technology, specifically the use of bridge sliding technology. The baseline case is a traditional bridge replacement, requiring the removal of the structure and replacing it at the same location. The economic analysis compares the benefits and costs of ABC with those of a traditional bridge reconstruction. ODOT supplied the cost figures for both the as-built project and the baseline case. Construction Time The construction on the SH 51 bridge replacement started in April 2013 with the clearing of a work site to the south of the existing structure for material staging and construction of the new piers and falsework required for the deck construction. Several issues slowed work throughout the spring of that year. Work was suspended in May due to flooding caused by heavy rain and the resulting backup from Lake Keystone. Other issues caused delay through the end of the year, with the original slide scheduled for May 2014. However, the appearance of nesting cliff swallows caused work to be shut down until after September 2014. The closure of the road and demolition of the structure started on September 15, 2014, and continued through September 25. While the entire project lasted nearly 17 months, the actual road closure lasted only 11 days. For the analysis used in this report, we have used 180 days as the baseline time to construct an average project using traditional methods. However, it can be seen that should the traditional approach encountered similar delays, the impact to the public could have been even more dramatic. By any account, the 11-day closure to traffic for this project easily achieved the 50 percent reduction desired by the HfL program. Construction Costs Table 4 presents a comparison of the capital costs for both the as-built and baseline alternatives. The costs shown for falsework and slide come from two lump sum items included in the contract and include all design, materials, and labor necessary to perform these tasks.
26
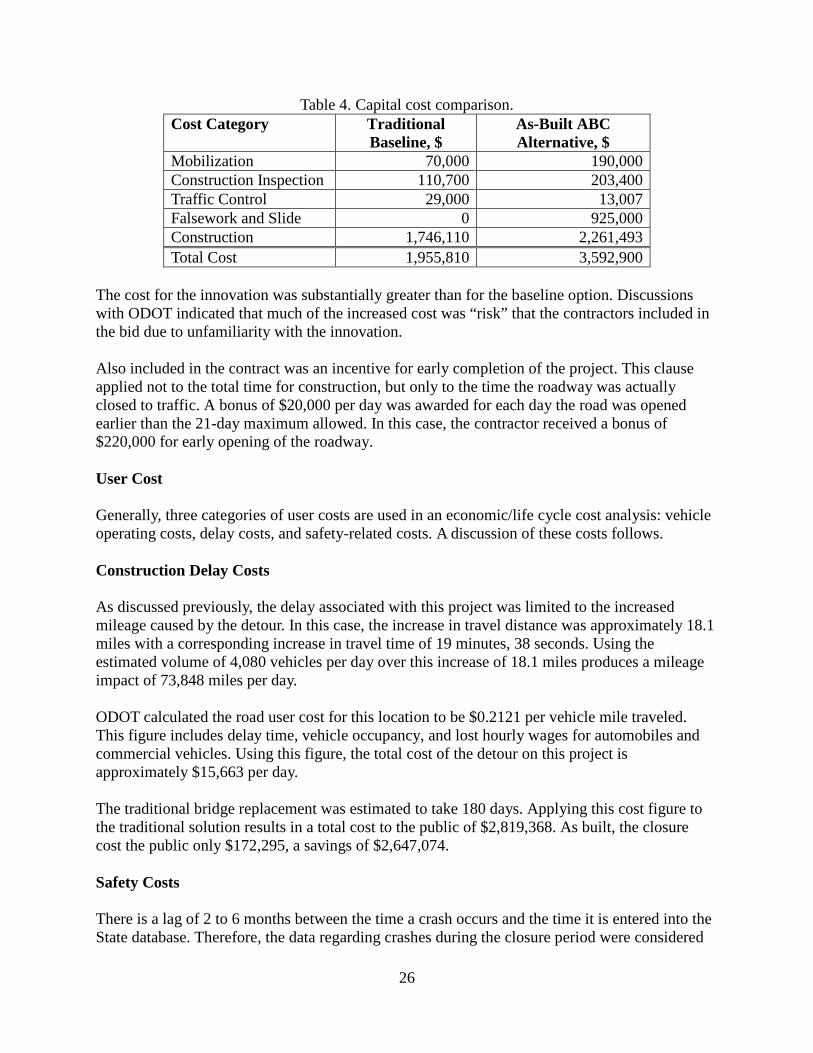
Table 4. Capital cost comparison. Cost Category Traditional As-Built ABC
Baseline, $ Alternative, $ Mobilization 70,000 190,000 Construction Inspection 110,700 203,400 Traffic Control 29,000 13,007 Falsework and Slide 0 925,000 Construction 1,746,110 2,261,493 Total Cost 1,955,810 3,592,900
The cost for the innovation was substantially greater than for the baseline option. Discussions with ODOT indicated that much of the increased cost was “risk” that the contractors included in the bid due to unfamiliarity with the innovation. Also included in the contract was an incentive for early completion of the project. This clause applied not to the total time for construction, but only to the time the roadway was actually closed to traffic. A bonus of $20,000 per day was awarded for each day the road was opened earlier than the 21-day maximum allowed. In this case, the contractor received a bonus of $220,000 for early opening of the roadway. User Cost Generally, three categories of user costs are used in an economic/life cycle cost analysis: vehicle operating costs, delay costs, and safety-related costs. A discussion of these costs follows. Construction Delay Costs As discussed previously, the delay associated with this project was limited to the increased mileage caused by the detour. In this case, the increase in travel distance was approximately 18.1 miles with a corresponding increase in travel time of 19 minutes, 38 seconds. Using the estimated volume of 4,080 vehicles per day over this increase of 18.1 miles produces a mileage impact of 73,848 miles per day. ODOT calculated the road user cost for this location to be $0.2121 per vehicle mile traveled. This figure includes delay time, vehicle occupancy, and lost hourly wages for automobiles and commercial vehicles. Using this figure, the total cost of the detour on this project is approximately $15,663 per day. The traditional bridge replacement was estimated to take 180 days. Applying this cost figure to the traditional solution results in a total cost to the public of $2,819,368. As built, the closure cost the public only $172,295, a savings of $2,647,074. Safety Costs There is a lag of 2 to 6 months between the time a crash occurs and the time it is entered into the State database. Therefore, the data regarding crashes during the closure period were considered
27
incomplete at the time of this report. However, using the 3-year period prior to construction as a guide would indicate that about 105 crashes could be expected to occur during a 3-year period, or about 35 per year. This equates to roughly one crash during an 11-day period, exactly what was observed during the construction period. It can be assumed that the effect of the detour on the overall safety related to the construction was negligible, and that there were no safety-related costs. Cost Summary Construction costs for the Oklahoma ABC project totaled about $3,592,900, compared to an initial capital cost of about $1,955,810 for a traditional bridge replacement. Additionally, the incentive for early completion cost the agency $220,000. This results in a total increased cost for the innovation of more than $1.8 million. However, a savings of $2,647,074 in road user cost was estimated from the reduction of road closure days from 180 to only 11. While not directly recouped by the agency, this indicates an actual savings of about $800,000 using ABC technology. Furthermore, it is believed that much of the additional cost of the ABC alternative was due to the contracting community’s unfamiliarity with the technology. As contractors become more familiar with this technology, future projects could result in more savings.

28
29
TECHNOLOGY TRANSFER ODOT conducted extensive preconstruction public education with respect to the expected construction activities. It was realized that public education would be vital to the successful application of the technology. In house, ODOT created several avenues to view the progress of the construction and to promote the innovative concept. A camera mounted to the southwest of the new structure provided continuous video overage of construction activities, from start to finish. This video was available statewide to ODOT personnel. ODOT also created several videos on the construction to be used as internal communication tools. One of these was also posted to an internal YouTube site that any interested employees could view.

30
31
ACKNOWLEDGMENTS The project team would like to acknowledge the invaluable insights and guidance of Federal Highway administration Highways for LIFE Team Leader Byron Lord, Contracting Officer’s Representative Julie Zirlin, and Program Managers Ewa Flom and Kathleen Bergeron, who served on the technical panel on the demonstration project. The team also is indebted to Tom Goldstein and John Lairet of the FHWA Oklahoma Division for their effective coordination effort and to ODOT Engineer and Manager Mark Williams, Division 8 Construction Engineer Mark Ziska, Traffic Safety Engineer David Glabas, and State Bridge Engineer Walt Peters for their efforts and cooperation on this project. The team also acknowledges the efforts of Randy Leonard and Liz Romero of the FHWA Oklahoma Division for assisting ODOT with the application process and Randy Leonard, John Lairet, and Jim Stevenson with the oversight of the construction project. The team was instrumental in making this project a success and provided the information that helped shape this report.