replacement of chiller system of a terminal...
TRANSCRIPT

University of Southern Queensland
Faculty of Engineering and Surveying
Replacement of Chiller System
Of a Terminal Building
A dissertation submitted by
Lim Chun Hao
In fulfillment of the requirement of
Course ENG4111 and 4112 Research Project
towards the degree of
Bachelor of Engineering (Mechanical)
Submitted : January, 2005

Abstract The air conditioning system of terminal building has deteriorated over the past 13 years.
The system has caused some problems and breakdown. The owner of the terminal has
engaged us to study the existing chiller system and propose a new system configuration.
The new system should provide better efficiency and easy system control.
In the past 10 years, chillers technology and efficiency has improved significantly. Since
chiller system is probably the largest electrical consumer of a building, the operating cost
of the terminal will significantly reduce.
i
University of Southern Queensland
Faculty of Engineering and Surveying
ENG4111 & ENG4112 Research Project
Limitations of Use
The Council of the University of Southern Queensland, its Faculty of Engineering and
Surveying, and the staff of the University of Southern Queensland, do not accept any
responsibility for the truth, accuracy or completeness of material contained within or
associated with this dissertation.
Persons using all or any part of this material do so at their own risk, and not at the risk of
the Council of the University of Southern Queensland, its Faculty of Engineering and
Surveying or the staff of the University of Southern Queensland.
This dissertation reports an educational exercise and has no purpose or validity beyond
this exercise. The sole purpose of the course pair entitled "Research Project" is to
contribute to the overall education within the student’s chosen degree program. This
document, the associated hardware, software, drawings, and other material set out in the
associated appendices should not be used for any other purpose: if they are so used, it is
entirely at the risk of the user.
Prof G Baker
Dean
Faculty of Engineering and Surveying
ii

Certification
I certify that the ideas, design and experimental work, results, analyses and conclusions
set out in this dissertation are entirely my own effort, except where otherwise indicated
and acknowledged.
I further certify that the work is original and has not been previously submitted for
assessment in any other course or institution, except where specifically stated.
Lim Chun Hao
Student Number : D1033565X
_______________________________
Signature
_______________________________
Date
iii

Acknowledgement
This report was prepared in response to the building owner need to improve the chiller
system of the terminal building. I would like to take this opportunity to express my
appreciation to the following person and company for the valuable helps and advise given
to thank Dr. Harry Ku for his guidance and support.
iv

List of Figures
Figure Description Page
2.1 Configuration of Basic Water-Cooled Chiller System 5
2.2 Typical Compressor Chiller Equipment 7
2.3 Typical Induced Draft Cooling Tower 9
2.4 Typical Forced Draft Cooling Tower 10
2.5 Typical Closed Loop Piping 12
2.6 Typical Open Loop Piping System 12
2.7 Typical Parallel Chiller System 15
2.8 Typical Series Chiller System 17
2.9 Typical Primary/Secondary Piping System 19
3.1 Existing Chiller Configuration of the Terminal 25
3.2 Existing Chillers and Chilled Water Piping Arrangement 28
3.3 Operating 1 chiller stage using Chiller no. 1 and chiller no. 4 29
4.1 New Parallel Primary/Secondary Chiller Configuration 36
4.2 New Parallel Chillers and Chilled Water Piping Arrangement 39
5.1 Trend Logging of Electrical Consumption’s Profile 48
5.2 Installation of the Thermometers 50
5.3 Measurement of Existing Chiller Consumption 51
v

List of Tables
Table Description Page
2.1 Minimum Piping Insulation As Per Standard 90.1 14
2.2 Chilled Water Temp. Range vs. Suggested Supply Water Temp 22
5.1 Average Electrical Consumption of the Chiller System 49
5.2 Chiller No. 1’s Average Cooling Load 52
5.3 Chiller No. 2’s Average Cooling Load 52
5.4 Chiller No. 3’s Average Cooling Load 52
5.5 Average Total Chillers loading of the Chiller System 53
List of Charts
Figure Description Page
2.1 Primary Vs. Secondary Flow 21
5.1 Electrical Profile of the Chiller System’s Consumption 48
5.2 Total Chillers Loading Profile of the Chiller System 53
vi

Table of Contents
Abstract i
Disclaimer Page ii
Certification Page iii
Acknowledgement iv
List of Figures v
List of Tables vi
List of Charts vi
Table of Contents vii
Chapter 1 Introduction 1
1.1 Background 1
1.2 Objectives 2
1.3 Design Assumption and Constraints 3
1.4 Overview of the Dissertation 3
Chapter 2 Literatures Review of Chiller System 5
2.1 Basic Water-Cooled Chiller Loop 5
2.2 Basic Chiller 7
2.3 Basic Cooling Tower 8
2.4 Basic Piping 11
2.5 Parallel Chiller System 15
2.6 Series Chiller System 17
2.7 Primary/Secondary Piping System 19
2.8 Chilled Water/Condenser Water Temperature
Range 22
2.8.1 Chilled Water Temperature Range 22
2.8.2 Condenser Water Temperature Range 23
2.8.3 Temperature Range Trends 24
vii

Chapter 3 Existing Chiller System and Configuration 25
3.1 Existing Chiller System Layouts and
Configuration 25
3.2 Existing Chiller Arrangement 26
3.3 Existing Primary/Secondary Chilled Water Pumps 30
3.4 Existing Cooling Towers and Condenser Pumps 31
3.5 Optimization Program for Chiller System 32
3.6 Existing Chiller System Operation Conditions 32
3.7 Advantages and Disadvantages of the Existing
Chiller System 34
Chapter 4 Proposed New Chiller System and Configuration 35
4.1 New Chiller System Layouts and Configuration 35
4.2 New Chiller Arrangement 37
4.3 New Primary/Secondary Chilled Water Pumps
And Headers 40
4.3.1 Primary Chilled Water Pump 40
4.3.2 Primary Chilled Water Flow Sequence 41
4.4 New Cooling Tower, Condenser Water Pumps
And Headers 42
4.4.1 Condenser Water Pump 42
4.4.2 Condenser Water Flow Sequence 43
4.5 Optimization Program for New Chiller System 43
4.6 Advantages and Disadvantages of the New
Chiller System 45
Chapter 5 Energy Analysis for Existing and New Chiller System 47
5.1 Energy Measurement for Existing Chiller System 47
viii

5.2 Expected Energy Requirement for New
Chiller System 54
Chapter 6 Conclusion and Future Plan 56
6.1 Achievement Project Objectives 56
6.2 Future Works 56
References 58
Appendix A Project Specification 59
Appendix B Supporting Information 61
ix

Chapter 1 Introduction 1.1 Background The company I am working for has been given a project to replace the Water Cooled
Chiller System of a terminal building. The terminator is a 24 hours operating building.
The terminal had experienced a major air conditioning system breakout down 2 months
ago. It is a priority of the management to avoid re-occurrence of such incident. Thus, the
project for replacement of the chiller system was recommended.
There are 4 sets of Chillers in the existing Chilled water system design, serving 14 sets of
Air Handling Units. The equipment has been installed the last 13 years ago, since the
opening of the terminal building. Presently, 3 sets of chillers have to be in operation in
order to provide the terminal with a desired temperature range of 22 degree Celsius to 24
degree Celsius. At times, when the ambient temperature is high, hot weather, all 4 sets of
chillers have to operate. Otherwise, the building temperature will rise up to 25 degree
Celsius. At the same time, due to the aging of the chiller equipment, the chillers also
suffered frequent breakdown and the reliability of the system is deteriorating.
The optimization system (automation system) of the chiller system is not in used. Some
of the sensing devices of the control system are out of order, which causes errors to the
automation system. As such, the chilled water system could, at most, operate in a semi-
auto mode. It is tuned at the most ‘sensible’ setting, which is determined by trial and error
method. The maintenance team has to load the chiller if the building temperature is on the
high side or unload it when the building temperature gets too cold.
The facility management of the Terminal has been changed a few times over the last 13
years, the operation manual and related document of the chiller system is not complete.
The design concept of the chilled water system could not be determined
comprehensively. As such, reinstating the automation system is quite impossible and not
cost effective.

With the limited information of the Existing Chilled Water System, we are to conduct a
thorough investigation of the existing chilled water system and the existing system
infrastructure. We shall then submit our proposal of the chilled water system
replacements to our client.
1.2 Objectives
The immediate aim of the project is to replace of the chiller equipment as the existing
equipment is deteriorating in a fast rate. This is to reduce any chances of another major
equipment breakdown. It will involve the reviewing of the existing chiller system design
and configuration, selection of chiller equipment and ancillary equipment. This portion of
the project will mainly focus on the configuration of the chiller system as the existing
configuration is outdated and not efficient (due to the technology at the time of
installation).
In order to carry out the project to the satisfaction of the client, the following objectives
shall be achieved:
• To study the design and configuration of the existing chiller system
• To study the constraints due to terminal operation and existing system infra-
structure
• To propose a design and configuration for the new chiller system
• To conduct a energy measurement of the existing and new chiller system
• To calculate the energy consumption of the proposed chiller system
• To replace the existing chiller system

1.3 Design Assumptions and Constraints
Due to the cost constraints, the new proposal will base on the following assumption and
constraints:
• Chiller of the same capacity to the chiller shall be able to satisfy the cooling load
demand of the building (if the chiller capacity change, the electrical transformers
and the starter panels to the chiller equipment have to be replacement. The set up
cost will be very high.).
• The main chilled water piping and the condenser water piping shall be remained.
• The air conditioning of the terminal cannot be interrupted.
1.4 Overview of the Dissertation
This report contains six majors section: An introduction and background information on
the existing system, literature review on background of chiller component and design,
analysis of the existing chiller system, proposal of the new chiller design, energy study on
the existing and new system and the conclusions and proposal further work for the
system.
Chapter one will look into the introduction and background information of the project
and also the reason why the project is required to be carried out. It also briefly mentions
the constraints of in the new design. Chapter two contains the literature review and
regulations of the chiller system. It covers the set up of a basic chiller system and its
equipment, the different type of chiller arrangement and piping arrangement. Chapter
three looks into the set up of the existing chiller system. It shows how the existing system
is supposed to be operated, how it is being operated and also give the reasons why the
system is being deign in the present configuration. Chapter four shows the new system
design and explains the rational for the design. Chapter five provides the results of the
energy measurement of the existing chiller system and calculates the expected energy

consumption of the new system. It also provides the comparison of the two results.
Chapter six will look into the progress and the overall achievement of the project objects.
It also includes recommendation of the future work to be undertaken to further improve
the system.

Chapter 2 Literatures Review of Chiller System
In this chapter, we will discuss on the set-up of a basic chiller system and the function of
main components in the system. We will also look into the different types of chiller
system configuration, the piping arrangement and discussion on the chilled/condenser
water range.
2.1 Basic Water-Cooled Chiller Loop
The basic chiller loop system consists of a chiller, cooling tower, building
heating/cooling load, chilled water pump, condenser water pump and piping infra-
structure (figure 2.1).
Figure 2.1: Configuration of Basic Water-Cooled Chiller System
Chiller acts like a heater exchanger where chilled water carries the heat load from the
building to the chiller. The chiller will transfer load to the condenser water, which will be
cooled in the cooling tower.
The temperature changes in the fluid (which in this case is water) for either the condenser
or the evaporator can be described using the following formula:
Q = q x del T /24 (eqn 2.1)
Where
Q = Quantity of heat exchanged, Load (ton)
q = flow rate of water (USgpm)
del T = temperature change of water (del F)
Changing the chilled water flow rate affects a specific chiller’s performance. Too low a
flow rate lowers the chiller efficiency and ultimately leads to a laminar flow. The
minimum flow rate is typically around 0.75 m/sec. Too high a flow rate leads to
vibration, noise and tube erosion. The maximum flow rate should be maintained below 3
m/sec. The maximum flow rate of the chilled and condenser water headers should
maintain below 2 m/sec.

2.2 Basic Chiller
Chiller can be water cooled, air-cooled or evaporative cooled (Figure 2.2). The
compressor of the chiller typically are reciprocating, scroll, screw or centrifugal.
Figure 2.2: Typical Compressor Chiller Equipment
The evaporator of the chiller acts as a heat exchanger. When chilled water flows through
the evaporator, it gives up the sensible heat (the water temperature drops) and transfer the
heat to the refrigerant as latent energy (the refrigerant evaporates or boils). The condenser
is also a heat exchanger. The condenser water flows through the condenser of the chiller.
In this case the heat absorbed from the building, plus the work of the compression, leaves
the refrigerant (condensing the refrigerant) and enters the condenser water (raising its
temperature). The condenser has same limitations to flow change as evaporator.

Chillers are often the single largest electrical users in a building. A 1000 ton chiller
typically has a motor rate at 700 hp. Improving the chiller performance has immediate
benefit to the building operating cost. Chiller full load efficiency ratings are usually given
in the form of kW/ton, COP (Coefficient of the Performance) or EER (Energy Efficiency
Ratio). Full load performance is either the default ARI conditions or the designer
specified conditions. It is important to be specific about operating conditions since chiller
performance varies significantly at different operating conditions.
Chiller part load performance can be given at the designer-specified conditions or the
NPLV (Non-Standard Part Load Valve) can be used. The definition of NPLV is spelled
out in ARI 500/590-98. Test Standard for Chillers.
Since the building rarely operate at the design load conditions (typically less than 2% of
the time) chiller part load performance is critical to good overall chiller plant
performance. Chiller full and part load efficiencies have improved significantly over the
last 10 year to the point where future chiller plant energy performance will have to come
from chiller plant design.
ASHARE Standard 90.1-2001 includes mandatory requirements for minimum chiller
performance. Table 6.2.1.C of this standard covers chillers at ARI standard conditions.
Tables 6.2.1.H to M cover centrifugal at non-standard conditions.
2.3 Basic Cooling Tower
Cooling towers are used in conjunction with water-cooled chillers. Air cooled chillers
does not require cooling tower. A cooling tower rejects the heat collected from the
building plus the work of the compression from the chiller. There are two common forms
of cooling tower used in the HVAC industry: induced draft and force draft.
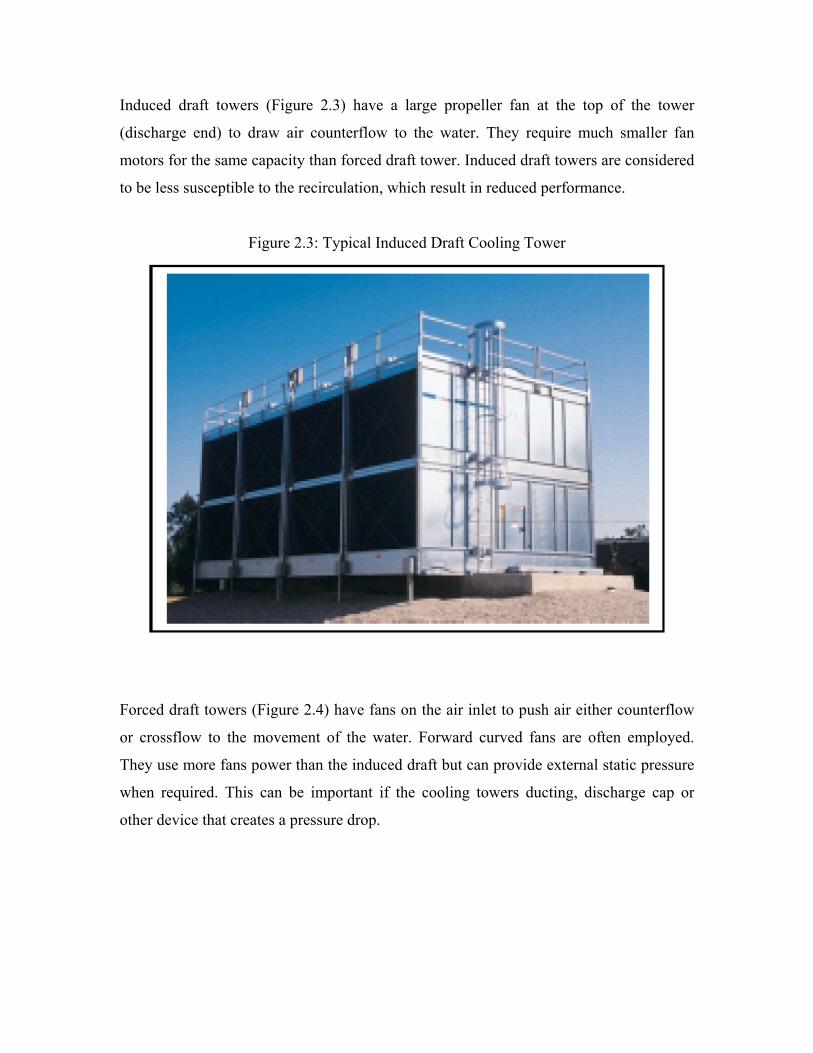
Induced draft towers (Figure 2.3) have a large propeller fan at the top of the tower
(discharge end) to draw air counterflow to the water. They require much smaller fan
motors for the same capacity than forced draft tower. Induced draft towers are considered
to be less susceptible to the recirculation, which result in reduced performance.
Figure 2.3: Typical Induced Draft Cooling Tower
Forced draft towers (Figure 2.4) have fans on the air inlet to push air either counterflow
or crossflow to the movement of the water. Forward curved fans are often employed.
They use more fans power than the induced draft but can provide external static pressure
when required. This can be important if the cooling towers ducting, discharge cap or
other device that creates a pressure drop.

Figure 2.4: Typical Forced Draft Cooling Tower
Condenser water is dispersed through the tower through trays or nozzles. The water flows
over fill within the tower, which greatly increases the air-to-water surface contact area.
The water is collected into a sump, which can be integral to the tower or remote from the
tower. The latter is popular in the freezing climates where the condenser water can be
stored indoors.
Condenser water in the cooling tower has all the right ingredients for biological growth; it
is warm, exposed to air and provides surfaces to grow on. In addition, the constant water
loss makes water treatment even more difficult. Both chemical and ozone-based
treatment systems are used to prevent biological growth.
Cooling Tower consumes power to operate the fans. Induced draft towers should be
selected since they typically use half the fan horsepower force draft tower use. Some
form of fan speed control is also recommended such as piggyback motors, multi-speed
motors or Variable Speed Drives (VFDs). In addition, a sensible controls logic is required
to take advantage of the variable speeds.
ASHRAE 90.1-2001 requires the following for heat rejection devices:
• Requires fan speed control for each fan motor 7.5 hp or larger. The fan must be
able to operate at two-thirds speed or less and have the necessary controls to
automatically change the speed. (6.3.5.2)
Exceptions include:
• Condenser fans serving multiple refrigeration circuits.
• Condenser fans serving flooded condenser.
• Installations in the climates with greater 7200 CDD50.
• Up to one-third of the fans on a condenser or tower with multiple fans,
where the lead fans comply with the speed control requirement.
2.4 Basic Piping
The piping is usually steel, copper or plastic. The chilled water piping is usually a closed
loop (Figure 2.5). A closed loop is not open to the atmosphere. In a chilled water piping
system, the static pressure created by the change in elevation is equal in both side of the
pump. In a closed loop, the pump needs to only overcome the friction loss in the piping
and components. The pump does not need to ‘lift’ the water to the top of the loop.
The condenser water piping is an open type as the cooling tower is open to the
atmosphere for cooling to take places (Figure 2.6). The condenser pump must overcome
the friction of the system and also ‘lift’ the water from the sump to the top of the cooling
tower. The pump only needs to overcome the elevation difference of the cooling tower,
not the building.

Figure 2.5: Typical Closed Loop Piping
Figure 2.6: Typical Open Loop Piping System

Insulation is required for chilled water piping since the water and hence the piping is
below dew point temperature. Condensate would form on it and heat loss would occur.
The goal of the insulation is to minimize heat loss and maintain the outer surface above
the ambient air dew point. Condenser water piping is typically not insulated since there
will be negligible heat gain or loss and sweating will not occur. However, if the piping is
exposed to cold ambient, it could need to be insulated and heat traced to avoid freezing.
Piping materials and design have a large influence on the system pressure drop, which in
turn affects the pump work. Many of the decisions made in the piping system design will
affect the operating cost of the chiller every hour the plant operates for the life of the
building. When viewed from this life cycle point of view, any improvements that can
lower the operating pressure drop should be considered. Some areas to consider are:
• Pipe material. Different materials have different frictions factors.
• Piping sizing. Smaller piping raises the pressure drop. This must be balanced
against the capital cost and considered over the lifetime of the system.
• Fitting. Minimize fittings as much as possible.
• Valves. Valves represent large pressure drops and can be costly. Isolation and
balancing valves should be strategically placed.
• Direct return vs. Reverse return.
Piping insulation reduces heat gain into the chilled water. This has a compound effect.
First, any cooling effect that is lost due to heat gain is additional load on the chiller plant.
Second, in most cases, to account for the resultant temperature rise, the chilled water set
point must be lowered to provide the correct supply water temperature at the load. This
increases the lift on the chillers and lowers their performance.

ASHRAE 90.1-2001 requires the following for the piping systems:
• Piping must be insulated as per ASHRAE Standard 90.1 Table 6.2.4.1.3 (See
Table 2.1)
Exceptions include:
• Factory installed insulation.
• System operating between 60 deg F and 105 deg F.
• The hydronic system be proportionally balanced in a manner to first minimize
throttling losses and then the impeller trimmed or the speed adjusted to meet the
design flow conditions (6.2.5.3.3)
Exceptions include:
• Pumps with motors less than 10 hp.
• When throttling results in no greater than 5% of the nameplate horsepower or
3 hp, whichever is less.
• Three pipe systems with a common return for heating and cooling are not allowed
(6.3.2.2.1)
• Two pipe changeover systems are acceptable providing: (6.3.2.2.2)
• Controls limit changeovers based on 15 deg F ambient drybulb dreadband.
• System will operate in one mode for at least 4 hours.
• Reset controls lower the changeover point to 30 deg F or less.
• Systems with total pump nameplate horsepower exceeding10 hp shall be variable
flow able to modulate down to 50%. (6.3.4)
Table 2.1 Minimum Piping Insulation As Per Standard 90.1
Fluid Design Operating
Temp. Range (deg F) Insulation Conductivity Nominal Pipe or Tube Size (in)
Conductivity
BTU.in/(h.ft2.deg F)Mean Rating Temp Del F <1
1 to <1.5
1.5 to <4
4 to <8
more than 8
Cooling System (Chilled Water, Brine and Refrigerant) 40-60 0.22-0.28 100 0.5 0.5 1.0 1.0 1.0 >60 0.22-0.28 100 0.5 1.0 1.0 1.0 1.5

2.5 Parallel Chiller System
Parallel chiller systems (Figure 2.7) are straightforward to design and are easily
programmed. In designing the system, the sum of the chiller capacities should meet the
design for the building or process. Additional capacity can be added, if required, by
oversizing the chillers. It is common for parallel chillers to be the same size and type
although it is not a requirement. The chilled water loop can be either constant flow or
variable flow. Variable flow system increases the complexity of the system, and will be
discussed in the Primary/ Secondary Systems.
Figure 2.7: Typical Parallel Chiller System
For constant flow systems, the chilled water temperature range varies directly with the
load. Depending on the load diversity, the chiller design temperature range will be less
than the temperature range seen at each chiller.

Parallel chiller system creates a unique situation when used in a constant flow design.
Consider the system operating at 50%. From a chiller performance aspect, turning off one
chiller and operating the other at full capacity is most desirable. However, this will not
happen. At 50% capacity, the return water will be 49F. The chiller that is turned off will
pass through it unchanged. The operating chiller will only see a 50% load (49F return
water), and will cool the water down to the set point of 44F. The two chilled water
streams will then mix to 46.5F supply temperature.
If the system operated in this manner, the warmer supply chilled water will cause the
control valves to open (increase flow) to meet the space requirements. At iterative
process will occur and the system may stabilize. The problem is whether the cooling coils
can meet the local loads with higher chilled water temperature. Depending on the actual
design conditions, the building sensible load could be met but high chilled water
temperature will make it difficult to meet the latent load.
One of the solutions is to operate both chillers at all time. However, it is not energy
efficient and causes unnecessary equipment wear. Another is to lower the set point to
offset the mixed water temperature, but this will make the chiller work harder and might
even cause stability problem in extreme conditions.

2.6 Series Chiller System
Series chiller system (Figure 2.8) is another method of operating more than one chiller in
a system. This design concept resolves the mixed flow issues found in parallel designs.
The chillers can be preferentially loaded as well, allowing the designer to optimize chiller
performance. The chilled water loop can be either constant flow or variable flow.
Variable flow system increases the complexity of the system, and will be discussed in the
Primary/ Secondary Systems.
Figure 2.8: Typical Series Chiller System
For constant flow systems, the chilled water temperature range varies directly with the
load. Depending on the load diversity, the chiller design temperature range will be less
than the temperature range seen at each chiller.

If both chillers are the same and the condensers are piped in parallel, the lead chiller will
accomplish about 45% of the system load and the lag chiller will accomplish about 55%
system load. This occurs because the lead (downstream) chiller is supplying chiller water
at the system set point (typically 44F). The lag (upstream) chiller is supplying chiller at
approximately 48.5F to the lead chiller. The reduced lift for the lag chiller allows it to
provide more cooling capacity.
Series chillers can preferentially load chillers. As the chiller system load increases, the
lead (downstream) chiller will load from 0 to 100% capacity to meet it. Once the lead
chiller is fully loaded (which is likely to be about 45% of the system capacity) the lag
chilled is started. While the lead chiller operates at full load, the lag chiller will ramp up
as the chiller system load goes from about 45% to 100%.
A problem with the series chillers system is the high flow rate and low temperature range
through the chillers. The high flow rate can result in high water pressure drops. Since the
chillers are in series, the pressure drops of the chillers must be added. The selection of the
chillers must it into consideration. The chillers can be of the same machine or different.
Selecting both chillers to be the same machine and able to meet the requirements of the
lead position allows the chillers to be interchangeable when the system load is less than
one chiller’s capacity.
Increasing the chilled water temperature range affects series chillers differently than the
parallel chillers. As the range is increased, series chillers will generally outperform
parallel chiller arrangement. This occurs because the cascading effect of series enhances
the chillers’ performance.

2.7 Primary/ Secondary Piping System
For large chillers or where more than two chillers are anticipated, primary/ secondary
(also called decoupled) piping systems are often used. To reduce installation and
operating costing, it is desirable to apply diversity to the system flow. With diversity
applied to the flow, the pumps and piping will be smaller. It is desirable to provide
constant flow through the chillers to maintain chiller stability. The solution is primary/
secondary piping.
In a primary/ secondary piping system, the only requirement is all the chillers must
operate on the same chilled water temperature range.
Figure 2.9: Typical Primary/Secondary Piping System

The primary pumps provide constant flow through the chillers. They can be dedicated to
each chiller or there can be a primary chilled water header pumping constant flows to
each chiller. The advantage is should a pump fail, activating one of the other pumps can
allow the chiller to operate. A spare pump can also be built into the arrangement. The
disadvantage to the primary chilled water header is the complexity and the setup cost.
The flow for each chiller is based on the design flow required by the chiller. The flow is
only provided when the chiller is operating. An automatic isolating valve is required for
each chiller to stop short-circuiting when the chiller and pump are off.
Primary pumps need only provide enough head to move chilled water through the chiller
and the piping pressure drops between the chiller and the secondary pumps.
Secondary pumps are variable flow and sized to provide flow throughout the chilled
water system. In a sense, they handle all the pressure drops ‘outside the chiller plant
room’. In system where the secondary pumps have to serve areas of different drops,
multiple loops are deployed. The individual loops can be scheduled off when not
required. A good system design should always group loads with common pressure drop
and scheduling requirements to reduce pumping work.
The primary and secondary pumps in the system appeared to be in series. This is,
however, not the case because of the present of the decoupler (Figure 2.7). The decoulper
allows the pumps to operate at different flow rates. This is necessary because the primary
pumps are fixed speed and the secondary pumps are variable speed.

Chart 2.1 shows primary flow vs. secondary flow. Secondary flow is based on the load in
the building. Specifically, the secondary flow rate is produced to maintain the necessary
system pressure differential. Primary flow must always meet or exceed the secondary
flow. Any excess primary water flows through the decoupler to return side and back to
the chillers. Any time the primary flow is less than the secondary flow, warm return
water will flow ‘backwards’ through the decoupler and mix the primary flow going out to
the building.
Chart 2.1 Primary Vs. Secondary Flow

2.8 Chilled Water/ Condenser Water Temperature Range
2.8.1 Chilled Water Temperature Range
Increasing the chilled water temperature range reduces the required floe rate and
consequently the pump and piping sizes. In come situations, the savings both in capital
cost and operating cost can be very large. Increasing the chilled water temperature range
while maintaining the same supply water temperature actually improves the chiller
performance because the chiller log mean temperature difference, LMTD, increases. It
has just the opposite effect on the cooling coil where LMTD decreases between the air
and the chilled water. In some cases, it may be necessary to lower the supply water
temperature to balance the chiller LMTD with the coil LMTD.
Table 2.2 provides suggested supply water temperatures for various ranges. The best
balance of supply water temperature and range can only be found through annual energy
analysis. Every project is unique.
Table 2.2: Chilled Water Temp. Range vs. Suggested Supply Water Temp.
Chilled Water Temperature Range (deg F) Suggested Supply Water Temperature (deg F)
10 44
12 44
14 42
16 42
18 40
Equipment such as fans and unit ventilators have standardized coils designed to work
with 10 to 12 deg F chilled water range. When these products are used with this range of
chilled water, they provide the sensible heat ratio and return water temperature generally
required. When the range is increased, the coils may not provide the necessary sensible
heat ratio and return temperature. It is recommended that for these products, the chilled

water range stay close to industry standard conditions. Chilled water coils designed for
the application-specific conditions so this is generally not an issue.
2.8.2 Condenser Water Temperature Range
Increasing the condenser water temperature range reduces the condenser water flow,
which requires smaller pumps and piping. It also increases the required condenser
pressure while improving the LMTD for the cooling tower. Increasing the condensing
pressure on the chiller will result in a combination of increased chiller cost and reduced
performance. Improving the cooling tower LMTD allows a smaller tower to be used, but
savings from this strategy will not generally offset the increased cost of the chiller.
In most cases, the overall design power requirement will go up. At full load conditions,
the increased chiller power requirement to overcome the increased lift will more than
offset the savings from the smaller cooling tower fan and condenser pump.
As the chilled water load decreases, the chiller and cooling tower work will reduce but
the condenser pump work will remain the same. At some part load operating point, the
savings from the smaller condenser pump will offset the chiller penalty and for all
operating points below this, the increased condenser range will save energy. Whether an
increased condenser temperature range will save energy annually will depend on when
the crossover point occurs (the pump motor size) and the chiller operating profile
(whether the operating hours favor the chiller or the pump). This can only be found with
annual energy analysis.

2.8.3 Temperature Range Trends
Changing the temperature ranges and supply temperatures requires careful analysis. The
following are some points to consider:
• The traditional ARI operating conditions work very well for many buildings.
• Unnecessary reduction of the chilled water supply temperature should be avoided
as it increases chiller work.
• When using standard products such as fancoils and unit ventilators, maintain the
chilled water temperature range between 10 deg F to 12 deg F where they are
design to operate.
• Increasing the chilled water temperature range is a good way to reduce the capital
and operating cost of a building, particularly if the pump head is large or the
piping runs long.
• With larger chilled water temperature ranges it may be necessary to lower the
supply water temperature to find a balance between coil and fan performance vs.
chiller performance.
• If the chilled water supply temperature is reduced, consider over sizing the
cooling tower to reduce the condenser water temperature and minimize the affect
on the chiller.
• Always take into account the actual design ambient drybulb or wetbulb conditions
when designing a chiller plant. If the location is arid, then lower the wetbulb
design as per ASHRAE design weather data and select both cooling tower and
chiller accordingly.
• For very large chilled water ranges, use series chillers possibly with counterflow
condenser circuits to optimize performance.
• Increasing the condenser water range should only considered for projects where
the piping runs are long and the pump work high. When it is required, optimize
the flow to the actual pipe size that is selected and select the chillers accordingly.
Consider over sizing the cooling towers to minimize the affect on the chiller.

Chapter 3 Existing Chiller System and Configuration
3.1 Existing Chiller System Layouts and Configuration
The existing chiller design is what we called a Series/Parallel Chillers in Primary/
Secondary Arrangement (Figure 3.1).
Figure 3.1: Existing Chiller Configuration of the Terminal

3.2 Existing Chiller Arrangement
The existing chiller plant has 4 sets of existing chillers; each rated at 1500 tons, which
arrangement in 2 chiller stages. Each chiller stage consists of 2 chillers connected in
series. The 2 chiller stages were connected in parallel to each other. The designed chilled
water flow rate across each chiller is 315 L/sec and produced an estimated temperature
different of 4 deg C.
Using eqn 2.1,
Q = q x del T /24
where Q = 1500 tons (2 chillers of 1500Rtons in series)
del T = 4 deg C (2 chillers of 4 deg C temperature each)
= 4 x 9/5 deg F
= 7.2 deg F
Q = q x del T /24
1500 = q x 7.2 /24
q = 5000 USgpm
= 315 L/sec
During the operation of the system, at least a set of 2 chillers (1 chiller stage) will be
operating at anytime. It is impossible to cater to the building cooling load demand by
operation only one chiller.

The advantage of using a series system was to reduce the set up cost for the construction
of the piping system. A typical chiller system is design with temperature range of 6 deg
C. In this design, the designer increased the range to 8 deg C. With a higher temperature
range, the chilled water flow rate can be reduced to produce the same cooling capacity.
Hence, the piping size can be reduced.
Due to the technology back during the construction of the building, it is uncommon to
have chiller of the temperature of 8 deg C. Even if manufacturers did produce such
chiller, the cost of the chiller would be very high and would also face maintenance
difficulty. These might be the reasons why the design of the existing system deploys the
series chiller arrangement.
The disadvantage of the system is that the chillers have to be operated in pairs. If a chiller
stage could not satisfy the building-cooling load, another chiller stage has to cut in,
instead of just one chiller. This will increase the operating cost of the chiller system.

Figure 3.2 shows the existing chillers and chilled water piping arrangement. It is when
operating in 1 or 2 chiller stage/s. During the operation, chilled water will flow through
‘chiller no. 1 then chiller no. 2’ and/or ‘chiller no. 3 then chiller no. 4’.
Figure 3.2: Existing Chillers and Chilled Water Piping Arrangement

When the system operating in 1 chiller stage, i.e. chiller no. 3 and chiller no. 4 and in the
event when 1 chiller, i.e. chiller no. 3, is out of order. Chiller no. 1 will ‘kick in’ and take
over the chiller no. 3. Figure 3.3 shows chilled water flows through chiller no. 1 then
chiller no. 4, using the bypass piping.
Figure 3.3 Operating 1 chiller stage using Chiller no. 1 and chiller no. 4

3.3 Existing Primary/ Secondary Chilled Water Pumps
The existing chiller system is using a Primary/ Secondary Chilled Water Pump design.
The primary chilled water pumps are delivering chilled water directly to the chiller. Each
of the chilled water pumps is adjusted to deliver 315 L/sec of water. The primary chilled
water system is a constant flow loop.
The set of series chillers will cool the chilled water and pump them to the secondary
chilled water header. Due to the fact the chilled water is delivering to different part of the
terminal, the different in pressure drops between these areas are very wide. The designer
used a multiple loops to serve these areas. The system has dedicated secondary pumps for
each of the 3 loops. They are grouped according to their zones.
During the operation, the total flow rate required by the secondary pumps shall not excess
the total flow rate delivered by the primary pump (the chillers). The excess cooled water
in the secondary header will return to the primary return chiller water header through the
decoupler. This unused chilled water will mix with the return chilled water from the air-
handling units. The temperature of this mixed return chilled water will determine whether
the chiller is to increase or decrease its operating capacity. If the mixed return water
temperature is lower than the set point (due to large amount of unused chilled water
return through the decoupler), the chiller will unload. This process will continue until the
temperature of the mixed return water is the same as the set point. If the temperature of
the mixed return chilled is higher than the set point, the same process will take place, but
the chiller will increase its loading instead of decrease.

3.4 Existing Cooling Towers and Condenser Pumps
The existing chiller system has 4 set of cooling tower; each has a capacity of 1800 tons
(cooling tower capacity is sized 20% larger than chiller). The designed condenser water
flow rate to each of the cooling tower is 291 L/sec and produced an estimated
temperature range of 5.2 deg C.
Using eqn 2.1,
Q = q x del T /24
where Q = 1800 tons
del T = 5.2 deg C
= 5.2 x 9/5 deg F
= 9.36 deg F
Q = q x del T /24
1800 = q x 9.36 /24
q = 4615 USgpm
= 291 L/sec
The existing condenser is a direct piping system. Each cooling tower is connected to a
dedicated condenser pump, which is also connected directly to a dedicated chiller. For
instance, Cooling Tower 1 is connected to Condenser Pump 1 and Condenser Pump 1 is
connected to Chiller 1.

3.5 Optimization Program for Chiller System
The existing optimization/automation program of the chiller system is not in working
condition. It is unable to determine the sequencing of the system. As a result, the program
is bypass and the chillers are turned on or off manually.
When the temperature in the building is rising, the maintenance team will load the
chillers. On the other hand, if the building temperature is too cold, the maintenance team
will unload the chiller. This method is not accurate or advisable; as a result, a new
program will be installed in the new chiller system.
3.6 Existing Chiller System Operation Conditions
In the initial design, only one set of series chillers is needed to ‘cool’ the building. Due to
the deterioration of the air conditioning system (the chiller system, the air handling units,
the air diffusing system), operating one chiller stage can no longer satisfy the building’s
cooling load demand. As a result, the second set of chillers should ‘kick in’ to ‘cool’ the
building. Since the chiller system is not operating by any automatic program, the
maintenance team, in fact, decided to ‘run’ a third chiller to provide higher cooling
capacity.
Each chiller has a capacity of 1500 tons, by ‘running’ a third chiller; the system can
produce 4500 tons of cooling capacity. With an increase of 50% in cooling capacity
(compare to the design 3000 tons from 2 chillers), the chiller system can easily satisfy the
building cooling load demand. At the same time, it also introduced another problem to
the system.

According to the design concept, the chillers are to be operated in pairs. By operation
only the third chiller, it will affect the operation perimeter of the chiller system operation.
The chilled water temperature supplied by the series chillers will reach around the
temperature of 7 deg C, but the temperature of the chilled water supplied by the third
chiller could only around 10.6 deg C. The waters will mix in the secondary pumps
header, which resulted in the higher supplied chilled water temperature to the air-
handling units.
The warmer chilled water will cause the control valves to open (increase flow) to meet
the space requirements. An iterative process will occur and the system may stabilize. The
problem is that the cooling coils might not meet the local loads with the higher chiller
water temperature. The building sensible load could be met but higher chilled water
temperature will make it difficult to meet the latent load (the specifications of the air-
handling units are not in the scope of this study). Thus, the efficiency of the chiller
system is affected.

3.7 Advantages and Disadvantages of the Existing Chiller System
The advantages of the existing Series/Parallel Primary/Secondary Chiller System:
a. Lower Setup Cost – the chilled water flow rate in the chilled water pipe is to
maintain below 3 m/s. By designing the temperature range of the system with an 8
deg C instead of the typical 6.5 deg C, the pipe size of the chilled water piping
used had been reduced. Cost saving was achieved.
b. Better Temperature Control – generally, series chillers system provide a better
temperature control than a parallel system. In the event when the building demand
load is extremely low (less than 1500 tons), the system can actually operate with
one chiller and will not affecting the overall air conditioning system. In a parallel
chiller system, operating one chiller will reduce the system chilled water flow
rate. Hence, provide insufficient chilled water to the Air Handling Units.
c. Lower Operating Cost – with a wider temperature range, the series system will
actually outperform the parallel system. This occurs because the cascading effect
of series enhances the chillers’ performance
The disadvantages of this system:
a. Lack of Flexibility – In the event when one set of series chillers cannot satisfy the
building cooling load demand, the system has to ‘kick in’ the second set of series
chillers, instead of just one chiller.

Chapter 4 Proposed New Chiller System and Configuration
4.1 New Chiller System Layouts and Configuration
During the design stage, in order not to incur additional cost for replacing the chillers
starter panels and electrical transformers, the new chillers will be of the same capacity
with the existing chiller. The main chilled water and condenser water piping will also
remain unchanged.
The terminal owner has informed us of the intention of extending the building, increasing
the total floor area of the building. The size of the new extension has not determined, it is
believed to be around 10% to 15% of the existing building size.
Taking into consideration of the new building cooling load, the new design has to be
more flexible in operation. Operating 2 chillers, of 1500 tons each, might not be
sufficient to satisfy the new extend building cooling load demand. The chiller system
might need to operate 3 chillers.
As such, in the new chiller system design, the chillers are arranged in parallel. This
allows the system to operate as many numbers of chillers as needed. In order to provide
the system water with more even chilled water temperature and operation flexibility, new
primary chilled water header and condenser chilled water header are installed. An
optimization program is introduced to provide better control of the system chilled water
temperature and also improve operating cost effectiveness.
Figure 4.1 shows the new chiller system design. It rearranges the chiller into parallel
arrangement and consists of new primary chilled water header and condenser water
header.
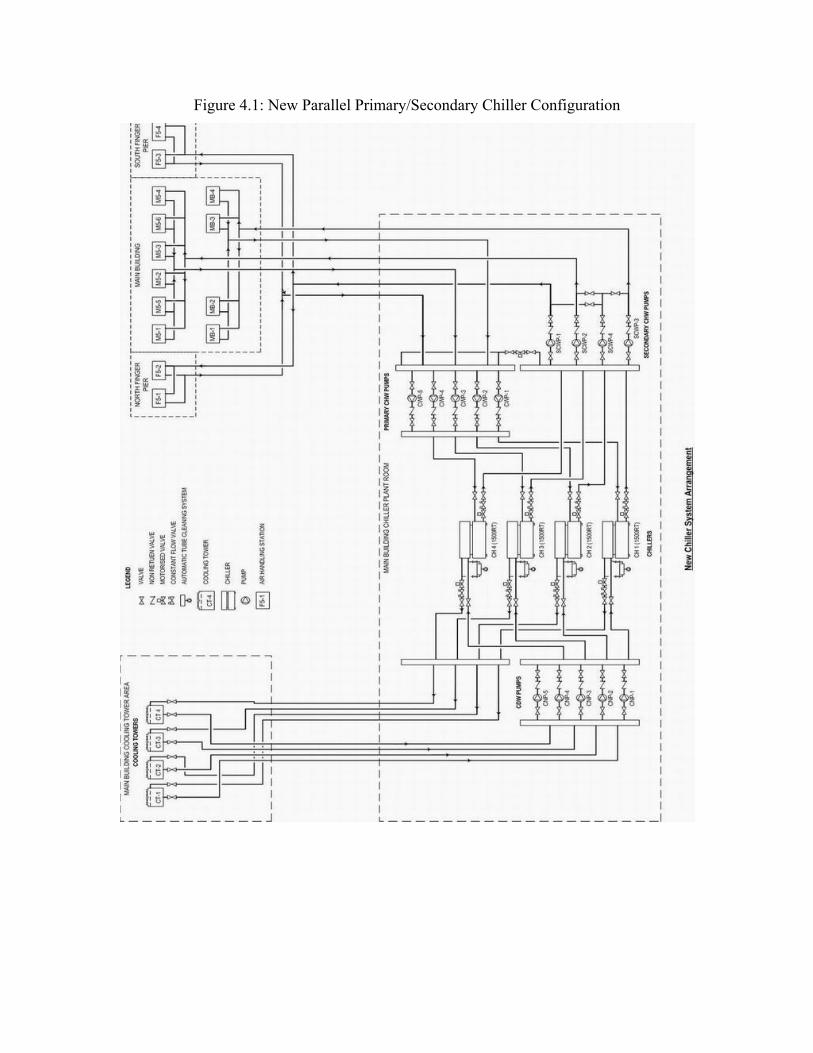
Figure 4.1: New Parallel Primary/Secondary Chiller Configuration

4.2 New Chiller Arrangement
Taking the expected increases in cooling load demand, it is desirable to have a chiller
system with better flexibility. Arranging the chillers in series restrict operating the chiller
individually, as the chillers have to operate in pairs. As such, arranging the chillers in
parallel will allow the system to operate any numbers of chilled required.
(For instance, when the building cooling loads demand is around 3500 tons, in a series
system, all 4 chillers have to be operating, as the chillers are design to operate in pairs. In
a parallel system, the system will operate 3 chillers, which are sufficient to cater for the
requirement. Operating a parallel system will be more cost effective in this
circumstance.)
In the new chiller system design, all the 4 chillers are arrange in parallel which formed 4
chiller stages (Figure 4.2). Each stage consists of a chiller, a primary chilled water pump,
a cooling tower and a condenser water pump.
With the primary/secondary pumps system, the problem of the inconstant chilled water
flow that inherits from the parallel chiller arrangement is overcome. The constant flow
rate across each chiller in the primary circuit provides the system with a constant chilled
water temperature of 6.5 deg C. The secondary pumps circuit delivers the required
amount of chilled water (variable flow rate) to the air handling units according to its
demand.
The existing chillers, of 1500 tons capacity each, have temperature range of 4 deg C with
flow rate of 315 L/sec. The chilled water velocity (from 1 chiller) in the existing piping,
of 500mm diameter, is 0.8 m/sec. With this temperature range, the velocity of the chilled
water in the piping will be 3.2 L/sec when operating 4 chillers at the same time. The
recommended velocity is less than 3 m/sec. As a result, the temperature range of the new
chillers (of the same capacity of 1500 tons) has to be increased in order to reduce the
flow rate of the chillers (of the same capacity). Thus, the selected temperature range of

the new chillers is 8.8 deg C. with a flow rate of 143 L/sec per chiller. The new velocity
when operating 1 chiller and 4 chillers are 0.73 m/sec and 2.92 m/sec respectively.
Using Eqn 2.1,
q = A x V
where q = flow rate of water (cu m/sec)
A = Cross Section Area of Pipe (sq m)
V = velocity of water (m/sec)
Since the velocity of the water should be lesser than 3 m/sec,
q < A x V
< 22/7 x 0.25 x 0.25 x ¾
< 147 L/sec
Using eqn 2.1,
Q = q x del T /24
where Q = 1500 tons
q = 147 L/sec
= 2333.8 USgpm
Q = q x del T /24
1500 = 2333.8 x del T /24
del T = 15.4 deg F
= 15.4 x 5/9 deg C
= 8.57 deg C
Hence, we select chiller with temperature of 8.8 deg C in order to lower the required flow
rate in the piping.
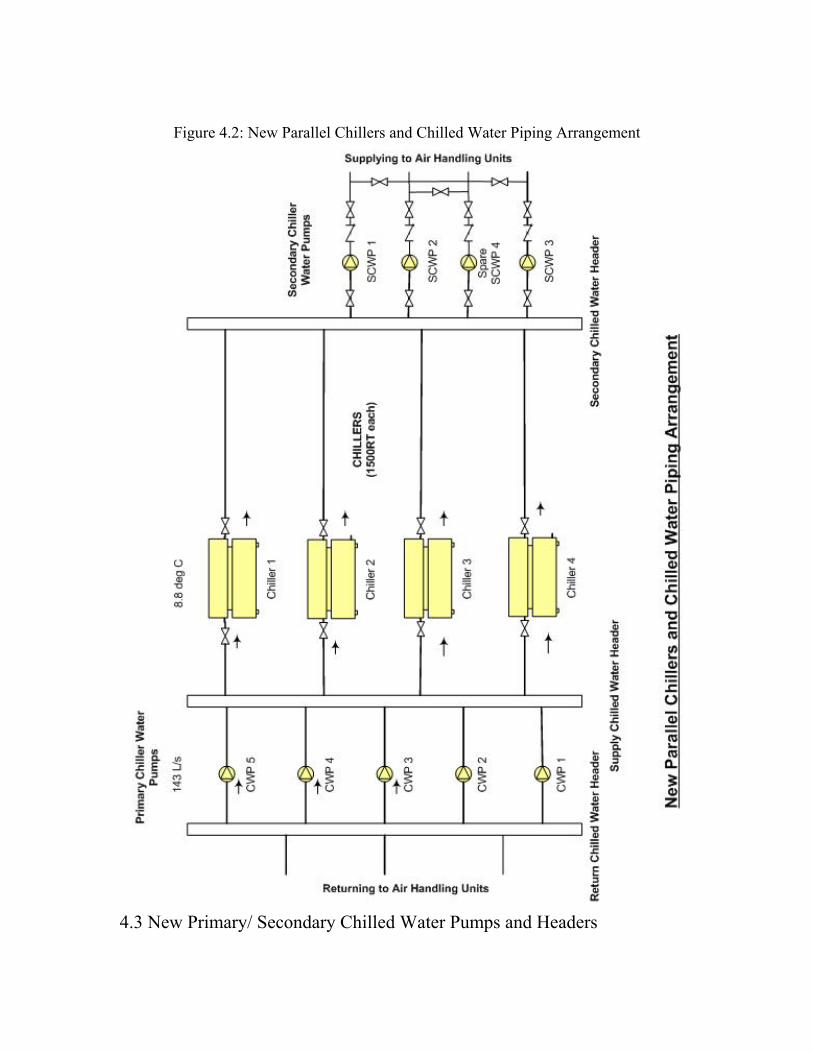
Figure 4.2: New Parallel Chillers and Chilled Water Piping Arrangement
4.3 New Primary/ Secondary Chilled Water Pumps and Headers

The new chiller system is using a Primary/ Secondary Chilled Water Pumps design and
also introduces new chilled water headers to the system.
4.3.1 Primary Chilled Water Pump
The head loss for the primary chilled water piping is:
Equipment Flow rate (L/sec)
Dia (mm) Qty
Fitting Equivalent
Length/Unit (Ft)
Fitting Equivalent Length (Ft)
Pipe (m) 17.2 3.281 56.43 Elbow 3 20 60.00 T-Joint 2 66 132.00 Flex. Connector 2 10 20.00 Gate Valve 2 6.7 13.40 Strainer 1 280 280.00 Check Valve
143.3 300
1 140 140.00 Total Equivalent Length (Ft) 701.83 Friction Loss per 100 Ft (Ft) 1.22 Friction Loss 1 (Ft) 8.56 Pipe (m) 12.6 3.281 41.34 Elbow 3 27 81.00 T-Joint 1 87 87.00 Flex. Connector 2 10 20.00 Gate Valve 2 9 18.00 Motorised Vlave
143.3 400
1 9 9.00 Total Equivalent Length (Ft) 256.34 Friction Loss per 100 Ft (Ft) 0.28 Friction Loss 2 (Ft) 0.73 Pipe (m) 171 3.281 561.05 Elbow 3 40 120.00 T-Joint
429.9 600 10 140 1400.00
Total Equivalent Length (Ft) 2081.78 Friction Loss per 100 Ft (Ft) 0.28 Friction Loss 3 (Ft) 5.91

Total Friction Loss (Ft) 15.20 Chiller Loss (Ft) 14.01 Constant Flow Valve 1 13.12 13.12 Safety Factor of 10% 4.23 Total Head Loss (Ft) 46.57
For 1500 ton chiller with temperature range of 8.8 deg C, the chilled water flow rate
across the chiller is 143L/sec. With the calculated operating head of 46.57 feet, we
selected Crane Weinman – CSC250/200/280 as primary chilled water pump.
The number of primary chilled water pumps will increase to 5 (inclusive of 1 spare
pump). One chilled water pump will be ‘running’ with every chiller operating.
4.3.2 Primary Chilled Water Flow Sequence
The primary chilled water pumps will pump chilled water to the new chilled water supply
header. This header will distribute it to all/any of the operating chillers. As the pressure
across all the 4 chillers is the similar, thus, the flow rate to each chiller should be even.
The chillers will cool the chilled water and pump them to the secondary chilled water
header. The dedicated secondary pumps for each of the 3 loops will deliver the chilled
water to different parts of the terminal. It will return back to the return chilled water
header and then to the chilled water pumps.
During the operation, the total flow rate required by the secondary pumps shall not excess
the total flow rate delivered by the primary pump (the chillers). The excess cooled water
in the secondary header will return to the primary return chiller water header through the
decoupler. This unused chilled water will mix with the return chilled water from the air-
handling units. The temperature of this mixed return chilled water will determine whether
the chiller is to increase or decrease its operating capacity. If the mixed return water
temperature is lower than the set point (due to amount of unused chilled water return
through the decoupler), the chiller will unload. This process will continue until the
temperature of the mixed return water is the same as the set point. If the temperature of
the mixed return chilled is higher than the set point the chiller will increase its loading,
instead of decrease.
4.4 New Cooling Towers, Condenser Water Pumps and Headers
4.4.1 Condenser Water Pump
The head loss for the condenser water piping is:
Equipment (400mm dia) Qty
Fitting Equivalent
Length/Unit (Ft)
Fitting Equivalent Length (Ft)
Pipe (m) 328.8 3.281 1078.79 Elbow 33 27 891.00 T-Joint 7 87 609.00 Flex. Connector 4 10 40.00 Gate Valve 11 9 99.00 Strainer 1 320 320.00 Check Valve 1 260 260.00 Motorised Vlave 1 9 9.00 Total Equivalent Length (Ft) 3306.79 Friction Loss per 100 Ft (Ft) 1.15 Friction Loss(Ft) 38.03 Chiller Loss (Ft) 34.78 Safety Factor of 10% 7.28 Static Head 19.70 Total Head Loss (Ft) 99.79
For 1800 ton Cooling Tower with temperature range of 5.2 deg C (specified by the
chiller), the condenser water pumps require flow rate of 284L/sec. With calculated
operating head of 99.79 feet, we selected Crane Weinman - CSC350/300/340 as
condenser water pumps.
4.4.2 Condenser Water Flow Sequence

This condenser water system introduces new headers before and after the condenser
water pumps, and one header after the chillers (flowing back to the cooling towers).
With the new headers, system has full flexibility of operating any cooling tower or
condenser pumps to ‘serve’ the chiller. In the existing design, cooling tower no 1 and
condenser no 1 are dedicated to serve chiller 1. Flexibility is minimal. In the new design,
when the system is operating 3 chiller stages, the controller can operate any 3 condenser
water pumps and 3 cooling tower with the opening and closing of respective valves. This
has allows greater interchangeability among the condenser water pumps and the cooling
towers.
4.5 Optimization Program for New Chiller System
The optimization program is an integrated part of a chiller system; it decides sequencing
and load-shedding of the chiller system, provides the benefits of energy management
system, ability to respond immediately to off-normal situation, and capturing data on
equipment run-time for energy analysis and decision-making.
The start-up sequence for each circuit stage is:
a. Start cooling tower fans.
b. Wait for time delay of 30 seconds to elapse to ensure the system has stabilized.
Start condenser water pump.
c. Start primary chilled water pump.
d. Wait for time delay of 1 minute to ensure system flow has settled down. Start the
chiller and load the chiller to 50%

e. No chiller shall be started if any of the following is encountered before the start-
up sequence:
i. No flow in the condenser water pump, or
ii. No flow in the chilled water pump.
Optimization control is to provide the intelligence to the program to decide the number of
the chiller stages have to put into operation in order to maintain the building at the
predetermine temperature. The program will decide to add/reduce chiller stages during
the operation, to performance load balancing,
The program shall provide the enabling of additional chiller stage when the following
criteria are met:
a. The supply chilled water temperature exceeds the current set point by a
differential as predetermined by the operator (default one degree in this design).
b. The return chilled water temperature exceeds the current supply chilled water set
point plus an adjustable delta temperature (of 8.8 design, in this design) by a
differential as predetermined by the operator (default one degree in this design).
c. The calculated current cooling load exceeds the load capacity of the current stage.
The system shall provide the stopping of lag chiller circuit (determine by the operator
defined algorithm selection) when the following criteria are met,
a. At least one chiller is available if to be operated at a lower stage.
b. The average percent load of the entire operating chiller is less than the calculated
stage-down set point.
c. The calculated current cooling load allows for the lag chiller to be stopped whist
still maintaining the required cooling load capacity.

The program also perform load balancing, it shall continuously read the motor load for
each compressor (of chiller) that is running and calculate the load balancing capacity
limit to be an adjustable valve (set at 5%) above the lowest percent motor load that is
read. The loading balance capacity limit shall apply to each chiller so that each
compressor shall operate within the calculated limit. This load balancing function shall be
operator enable or disable.
4.6 Advantages and Disadvantages of New Chiller System
The advantages of the Parallel Primary/Secondary Chiller System:
a. Low operation cost – as the new design have 4 chiller stages instead of the 2
chiller stages of the existing system, it allows the system to operate any number of
chillers according to the building cooling load requirement. This will result in
lower operating cost.
b. Even water temperature – with new headers, the condenser water and primary
chilled water will be able to mix in the header. This will provide the system with
more even temperature that is desirable in operation.
c. High flexibility – with the new headers, the pumps are no longer connecting to the
chillers directly. The pumps will delivery to the headers and it will ‘distribute’
according to their head loss in each condenser/primary chilled water circuit.
Hence, as long as the pumps delivery sufficient amount of water to the headers,
whichever is operating will not affect the operation of the chillers. Unlike the
existing design, all the pumps are designated to the respective chillers with a
standby pump, the new design provides higher flexibility.

The disadvantages of this system:
a. Short condenser and primary chilled headers – due to space constraint, the
headers are not as long as desired. The temperature of the condenser/chilled water
is not as even as desire. The ideal design is to have a longer header where the
incoming water enters from one end of the header and the outgoing water leave at
the other end. This will allows the water to be more evenly mixed.

Chapter 5 Energy Analysis for Existing and New Chiller System
In this project, we are to look into the energy consumption of the existing and the new
proposed chiller system. We will look into the efficient of the existing chiller system and
the new system.
5.1 Energy Measurement for Existing Chiller System
As mentioned in chapter 3, the existing system is operating 3 chillers to supply sufficient
cooling load to the terminal. During the measure, chiller no. 1, chiller no. 3 and chiller
no. 4 are operating.
In order the measure the average profile of the terminal cooling demand, the overall
electrical consumption of the chiller system and each chiller loading will be measured for
8 days. The chiller system includes the chillers, the primary chilled water pumps, the
secondary chilled water pumps, the cooling towers and the condenser water pumps. In the
electrical measurement, the chillers electrical consumption will be recorded separately for
the rest of the equipment.
The electrical consumption of the chiller system is obtained by ‘trend logging’ the
electrical panel for 8 days. Figure 5.1 shows the equipment and setup for the energy
measurement of the chiller system electrical consumption. Chart 5.1 shows the profile of
the electrical loading of the entire chiller system and Table 5.1 shows the average
electrical consumption for each day and the entire week.

Figure 5.1: Trend Logging of Electrical Consumption’s Profile
Chart 5.1: Electrical Profile of the Chiller System’s Consumption
Changi Airport Terminal 2 - Pre-Measurement of Electrical Loading - Total Chiller Plant Consumption
3000.000
3100.000
3200.000
3300.000
3400.000
3500.000
3600.000
3700.000
00:0
0:31
04:0
0:31
08:0
0:31
12:0
0:31
16:0
0:31
20:0
0:31
00:0
0:31
04:0
0:31
08:0
0:31
12:0
0:31
16:0
0:31
20:0
0:31
00:0
0:31
04:0
0:31
08:0
0:31
12:0
0:31
16:0
0:31
20:0
0:31
00:0
0:31
04:0
0:31
08:0
0:31
12:0
0:31
16:0
0:31
20:0
0:05
00:0
0:05
04:0
0:05
08:0
0:05
12:0
0:05
16:0
0:05
20:0
0:05
00:0
0:05
04:0
0:05
08:0
0:05
12:0
0:05
16:0
0:05
20:0
0:05
00:0
0:05
04:0
0:05
08:0
0:05
12:0
0:05
16:0
0:05
20:0
0:05
00:0
0:05
04:0
0:05
08:0
0:05
12:0
0:05
16:0
0:05
20:0
0:05
Time
Kilo
wat
t (kW
)
Total kW
Day 1 Day 2 Day 3 Day 4 Day 5 Day 6 Day 7 Day 8
Average kilowatt = 3,570.416 kWe

Table 5.1: Average Electrical Consumption of the Chiller System
Average Peak No. Measurement
Point Day Kilowatt (in kW)
Kilowatt (in kW) At Time
1 Total 1 3580.382 3635.973 16:27 Electrical 2 3581.432 3638.841 12:04 Load 3 3568.493 3633.909 16:50 (Main 4 3571.637 3626.285 23:03 Terminal 5 3574.495 3616.678 12:05 Building) 6 3535.314 3621.285 16:50 7 3564.764 3626.524 23:04 8 3586.809 3689.989 23:01 Total Average 3570.416
To measure the chiller loading, a flow meter has to be installed at each of the operating
chiller, and a thermometer is to be placed, in the chilled water pipe, before and after the
chiller. This will obtain the chilled water flow rate and the temperature different across
each chiller. By measuring the cooling load of each operating chiller will provide a good
indication the efficiency of the chiller when compare against the electrical consumption
of the respective chiller. Comparing the total chiller loading against the overall chiller
system electrical consumption will show the overall operating cost of the chiller system.
Figure 5.2 shows photograph of the installation of the thermometers and Figure 5.3
shows the locations of the flowmeters and thermometers on system layout plan. With the
results, the operating load of each chiller can be calculated.
Table 5.2, 5.3 and 5.4 show the average measurement recorded for the ‘trend logging’
measurement. Using Eqn 2.1, the average cooling load of each chiller is calculated.
Chart 5.2 and Table 5.5 show the average total (combine) cooling load for the entire
chiller system. These are obtained by summing the reading measured from each chiller.
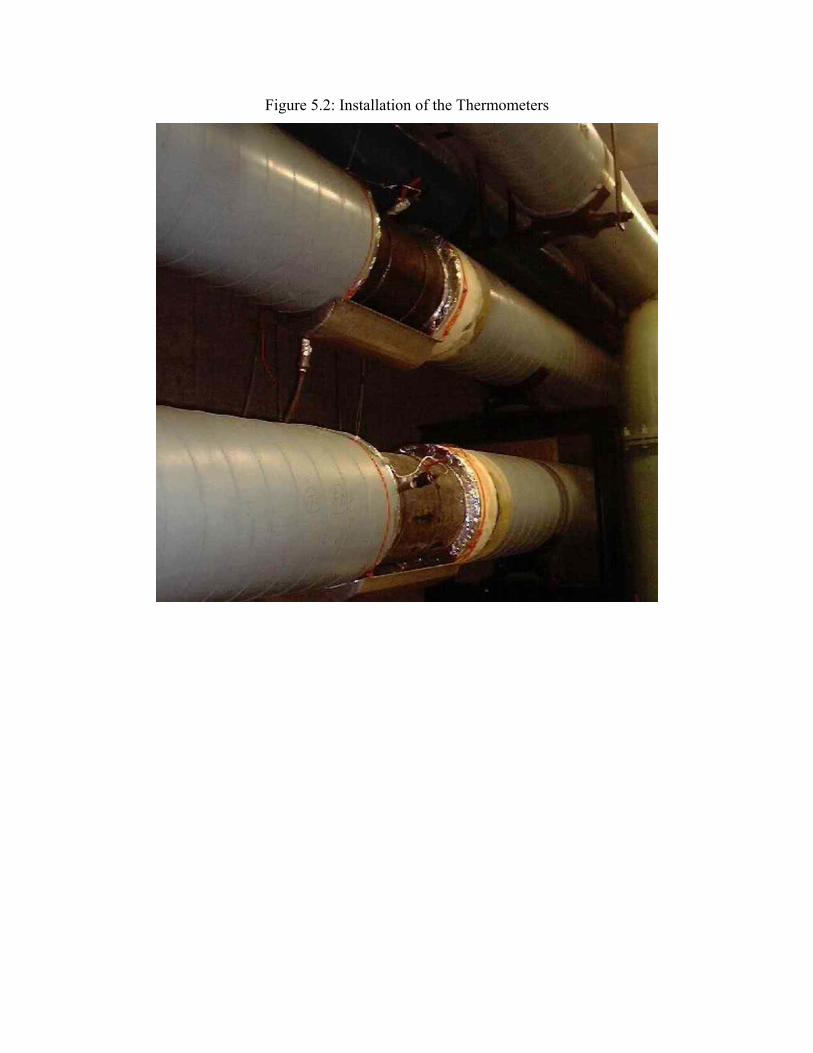
Figure 5.2: Installation of the Thermometers

Figure 5.3: Measurement of Existing Chiller Consumption

Table 5.2: Chiller No. 1’s Average Cooling Load
Average No. Measurement
Point Day Flow Rate (USgpm)
Del T (del C)
Cooling Load (in Rtons)
Chiller loading (in %)
1 Chiller 1 1 5068.1 3.47 1319.093
Cooling 2 5038.8 3.52 1330.376
Load 3 4947 3.72 1380.349
(Main 4 4974.5 3.69 1376.822
Terminal 5 5042 3.62 1369.021
Building) 6 5061.5 3.68 1397.102
7 5065.9 3.54 1345.121
8 4984.5 3.48 1301.094
Total Average 1352.372 90%
Table 5.3: Chiller No. 2’s Average Cooling Load
Average No. Measurement
Point Day Flow Rate (USgpm)
Del T (del C)
Cooling Load (in Rtons)
Chiller Loading (in %)
1 Chiller 2 1 5060.1 3.71 1407.831
Cooling 2 5163.5 3.67 1421.114
Load 3 5078.5 3.86 1470.088
(Main 4 5108.9 3.82 1463.561
Terminal 5 5193.9 3.74 1456.760
Building) 6 5149.7 3.85 1486.841
7 5126 3.73 1433.860
8 5144.3 3.6 1388.833
Total Average 1441.111 96%
Table 5.4: Chiller No. 3’s Average Cooling Load
Average
No. Measurement Point Day Flow
Rate (USgpm)
Del T (del C) Cooling Load
(in Rtons) Chiller Loading
(in %)
1 Chiller 3 1 5060.1 3.49 1325.962
Cooling 2 5163.5 3.46 1339.245
Load 3 5078.5 3.64 1388.218
(Main 4 5108.9 3.61 1381.691
Terminal 5 5193.9 3.53 1374.890
Building) 6 5149.7 3.64 1404.971
7 5126 3.52 1351.990
8 5144.3 3.39 1306.963
Total Average 1359.241 90%

Chart 5.2: Total Chillers Loading Profile of the Chiller System
Measurement Trend - Main Terminal Building Chiller Plant Total RTons
0.000
1000.000
2000.000
3000.000
4000.000
5000.000
6000.00000
:00:
32
04:0
0:32
08:0
0:32
12:0
0:32
16:0
0:32
20:0
0:32
00:0
0:32
04:0
0:32
08:0
0:32
12:0
0:32
16:0
0:32
20:0
0:32
00:0
0:32
04:0
0:32
08:0
0:32
12:0
0:32
16:0
0:32
20:0
0:32
00:0
0:32
04:0
0:32
08:0
0:32
12:0
0:32
16:0
0:32
20:0
0:14
00:0
0:14
04:0
0:14
08:0
0:14
12:0
0:14
16:0
0:14
20:0
0:14
00:0
0:14
04:0
0:14
08:0
0:14
12:0
0:14
16:0
0:14
20:0
0:14
00:0
0:14
04:0
0:14
08:0
0:14
12:0
0:14
16:0
0:14
20:0
0:14
00:0
0:14
04:0
0:14
08:0
0:14
12:0
0:14
16:0
0:14
20:0
0:14
Time
RTo
ns
Total RTons
Day 1 Day 2 Day 3 Day 4 Day 5 Day 6 Day 7 Day 8
Average Rtons = 4,152.724 RTons
Table 5.5: Average Total Chillers loading of the Chiller System
Average No. Measurement Point Day Cooling Load
(in Rtons) 1 Total 1 4052.887 Cooling 2 4092.735 Load 3 4239.653 (Main 4 4220.074 Terminal 5 4199.669 Building) 6 4289.912 7 4130.969 8 3995.89 Total Average 4152.724

5.2 Expected Energy for New Chiller System
In the new proposed chiller system, the expected electrical consumption of all the
equipment could be obtained from the data sheet of the equipment.
For Cooling Towers –
The new 1800 Rtons cooling tower, we have selected Kuken - SKB2300PWR. It deploys
4 sets of 22kw fans. Hence, total electrical consumption of each cooling tower is 88kw.
For Condenser Water Pumps –
The condenser water pumps require flow rate of 284L/sec and operating head of 99.79
feet. From the data sheet of Crane Weinman - CSC350/300/340, the electrical
consumption of each condenser pump is 95.9kw.
For Primary Chilled Water Pump –
The primary chilled water pumps require flow rate of 143L/sec and operating head of
46.57 feet. From the data sheet of Crane Weinman – CSC250/200/280, the electrical
consumption of each condenser pump is 28.7kw.
For Secondary Chilled Water Pumps –
As the secondary piping remains unchanged, we select pumps of the same capacity as the
existing secondary pumps.
Secondary Pump Make/Model Power Requirement No 1 American Marsh/12x14-15HD 147kw No 2 American Marsh/10x12-16HD 127kw No 3 American Marsh/12x14-15HD 147kw

For Chiller –
The new 1500 Rtons chiller, we selected Carrier – 19XR-8787505EPH55. From the
energy measurement result obtained, we new that chiller no 1 and chiller no 4 were
operating at 90% and chiller no 3 was operating at 96%. Hence, we could obtain the
respective expected electrical consumption from the datasheet.
At 90% and 96% part loads, the chiller electrical inputs are 803kw and 858.8kw
respectively.
Total Expected Electrical Power Required to operated 2 chillers at 90% load and 1 chiller
at 96% load is:
Equipment Qty Power Requirement
per unit (kw) Power Requirement
(kw) Chiller @ 90% loading 2 803 1606 Chiller @ 96% loading 1 858.8 858.8 Cooling Tower 3 88 264 Primary Chilled Water Pumps 3 28.7 86.1 Secondary Chilled Water Pumps operating @ 47m head 2 147 294 Secondary Chilled Water Pumps operating @ 36m head 1 127 127 Condenser Water Pump 3 95.9 287.7 Total Power Requirement 3523.6
Comparing the calculated electrical requirement of the new chiller system of 3523.6kw to
the measured consumption of the existing chiller system of 3570.4kw, there is only a
slight improvement of 46.8kw.
In the existing operation, the supply chilled water temperature to the air handling unit is
around 8.5 deg C, which is higher than original design supply temperature and the new
chiller design supply temperature. With the higher temperature, the chiller system has to
produce 4152 Rtons of cooling capacity to satisfy the terminal load demand. As the
chilled water supply temperature of the new chiller at 6.5 deg C, the chiller will operate at
a lower loading. Since the chiller equipment take up 70% of the total electrical
consumption of the system, a significant reduction in the consumption is expected.
Chapter 6 Conclusion and Future Plan 6.1 Achievement of the Project Objectives Since the undertaking of this project, the schedule to complete to replacement of the chiller is in February 2005. After the replacement of the first chiller, the terminal experienced another breakdown of the from the existing chiller system where the control panel was faulty. All the 3 existing chillers could not operate. It takes 12 hours to re-wire and bypass the control and ‘run’ the chiller manually. Due to this incident, the chillers replacement program was on hold for 4 months. After revising our schedule, the replacement will complete on the April 2005. To-date, we had completed replacement of the 2 sets of chillers and cooling towers. The new headers have also been installed. The replacement of the third set of chiller and cooling tower is in the process. In summary, I would like to conclude that the list of objectives in section 1.2 have been achieved except the replacement of the chiller system which is underway and the energy measurement of the new system. These include the investigating the existing chiller system and understanding its operating perimeter. The design of the new chiller system has established and the replacement of the chiller system has started. The energy measurement of the existing system was also carried out and the calculation of the energy requirement of the new system was also established. 6.2 Further Works After the replacement of the chiller system, the operation within the plant room should be in place. In order to achieve good temperature control in the terminal and better energy saving, suggestions of the further works are as below:
1. To replace the two-way valves and it’s sensing devices at the air handling units. This will modulate the amount of required chilled water flowing into the air handling units. After all the component replacement, a ‘water’ balancing should be carried out to calibrate the amount of chilled water entering the air handling units, accordingly to its capacity. With the ‘chilled water’ side of the system balanced, the system can benefit from the optimization program to a larger extend.
2. After taken care of the ‘chilled water’ side of the air conditioning system, we recommend the existing pneumatic Variable Air Volume boxes to be replaced with electrical VAV boxes. The existing pneumatic system is not interface to the Building Automatic System and the condition of the equipment is not good. Replacing with new electrical VAV boxes will

allows the VAV boxes to interface with the BAS and it will able to respond to the terminal temperature changes accordingly.
3. Replacement of the Cooling Coils at the air handling units. This will
permit better heat exchange at the air handling units.

References
1. Wilbert F.Stoecker/Jerold W. Jones, Refrigeration & Air Conditioning, Second Edition: Mcgraw-Hill Book Company, 1982
2. Singapore, The Code of Practice, Mechanical Ventilation and
Air conditioning in Building, CP 13 (1999) 3. ASHRAE, Standard 90.1-2001: ASHRAE, 2001
4. ASHRAE, 2001 ASHRAE Handbook: ASHRAE, 2001

Appendix A: Project Specification

University of Southern Queensland
FACULTY OF ENGINEERING AND SURVEYING
ENG 4111/4112 Research Project PROJECT SPECIFICATION
TOPIC: REPLACEMENT AND RE-CONFIGURATION OF CHILLER
SYSTEM IN TERMINAL BUILDING SUPERVISOR: Dr. Harry Ku PROJECT AIM: The project aim is to measure the efficiency of the chiller system
before and after the replacement, calculate and measure the effect of the replacement.
PROGRAMME:
1. Study and understand the configuration of Existing Chiller System and the Demand Cooling Load of the Building.
2. Measure the performance of the Existing Chiller System. 3. System Analysis for the Existing Chiller System and design of the new system
and configuration. 4. Calculate the Cooling Effect of the new system. 5. Confirmation of the Final Configuration of the New Chiller System and define
the Operation Perimeter. 6. Replacement of the Chiller System (divided into 4 phases). 7. Measure the performance and effect of the phase by phase.
As possible:
8. Measure the performance and effect of the New Chiller System. AGREED: _________ (Student) _______________ (Supervisors) Oliver Goh Dr Harry Ku (Dated) 18 / 04 / 2004

Appendix B : Supporting Information