replacing affinity with binding kinetics in qsar studies resolves otherwise confounded effects
TRANSCRIPT
JOURNAL OF CHEMOMETRICSJ. Chemometrics 2006; 20: 370–375Published online 5 February 2007 in Wiley InterScience
(www.interscience.wiley.com) DOI: 10.1002/cem.1010Replacing affinity with binding kinetics in QSARstudies resolves otherwise confounded effects
Karl Andersson and Markku D. Hamalainen*
Biacore AB, Uppsala, Sweden
Received 3 March 2006; Revised 3 July 2006; Accepted 15 July 2006
*CorrespoSE-75450E-mail: M
Steady-state binding affinity is a commonly used response variable in quantitative structure-activity
relationship (QSAR) studies. In this paper we show that affinity alone may introduce unnecessary
noise to the model or even cause model failure. Binding affinity is a ratio between the dissociation
rate and association rate. Mathematical modeling of a ratio with unknown variation structure of
nominator and denominator is difficult and the interpretation of the resulting model might be
meaningless under certain circumstances. Commercially available biosensors can be used for
measurement of binding kinetics enabling separate modeling of association and dissociation rates.
In this paper we discuss the problems caused by the confounded effect in the compiled response
affinity and show examples where separate modeling of the rate constants improves the interpret-
ation of QSAR models. Copyright # 2007 John Wiley & Sons, Ltd.
KEYWORDS: quantitative structure-activity relationship; biosensor; surface plasmon resonance; Biacore; on-rate; off-rate
1. INTRODUCTION
In quantitative structure-activity relationship (QSAR) stu-
dies, biological activity is often represented by the binding
affinity of the binders to the selected target [1–3]. This is an
understandable choice, since the binding affinity represents
the average degree of drug-populated targets at equilibrium,
and a large number of successful QSAR models have been
reported using this strategy. Furthermore, the assays used
for the characterization of the binders are often only suitable
for affinity measurements.
However, in recent years it has become increasingly
obvious that binding affinity alone may not always be a
suitable descriptor of biological activity. Binding affinity is
composed of an association and a dissociation event
according to the equation
KD ¼ kdka
(1)
whereKD is the binding affinity (M), kd is the dissociation rate
(s�1) and ka is the association rate (M�1 s�1). In cases where
the association or the dissociation rate dictates biological
activity, affinity alone may be a directly misleading measure
of activity.
When modeling the relationship between the settings of
influential factors and responses, it is vital that the responses
ndence to: M. D. Hamalainen, Biacore AB, Rapsgatan 7,Uppsala, [email protected]
accurately describe the desired function of the system under
study. Quotients can only be used with confidence in cases
where either the denominator or nominator is known to have
limited variation, or when they are proportional to each
other. For example, the frequent use of signal to noise ratios
in quality modeling has been heavily criticized [4]. In the
field of QSAR, it is commonly but erroneously believed that
the association rate is approximately constant due to
diffusion limitation and that the affinity reflects the
dissociation rate of the interaction.
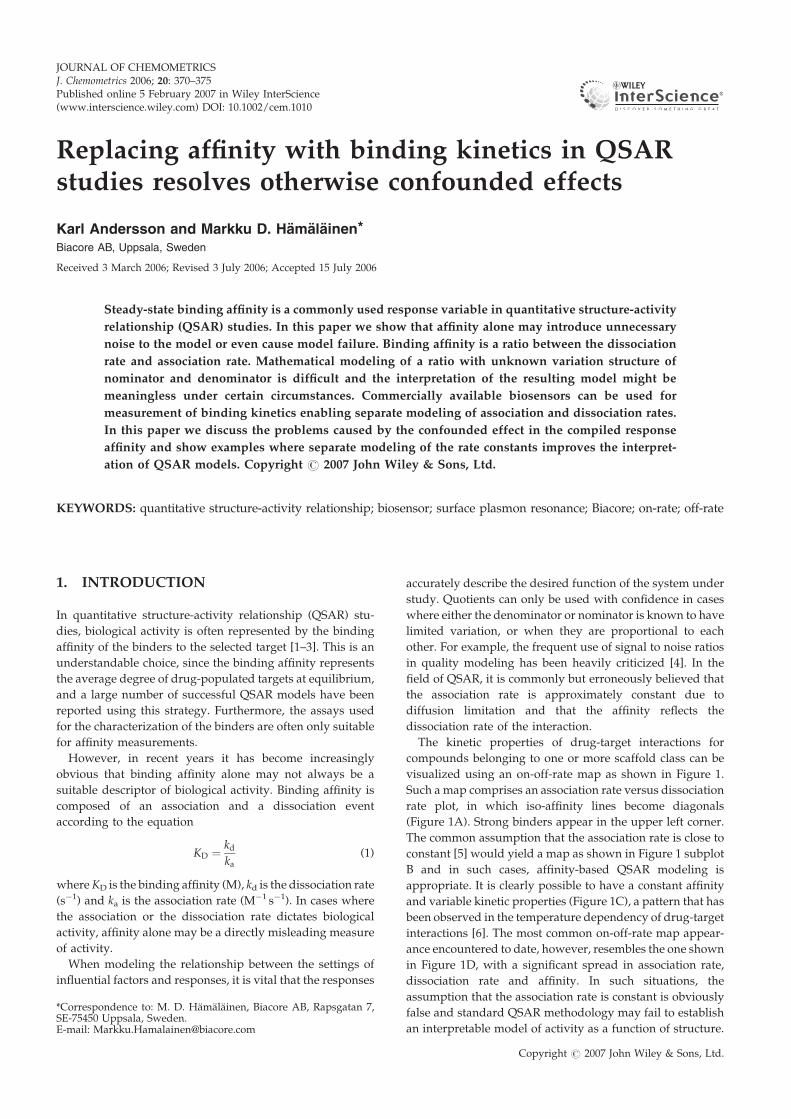
The kinetic properties of drug-target interactions for
compounds belonging to one or more scaffold class can be
visualized using an on-off-rate map as shown in Figure 1.
Such amap comprises an association rate versus dissociation
rate plot, in which iso-affinity lines become diagonals
(Figure 1A). Strong binders appear in the upper left corner.
The common assumption that the association rate is close to
constant [5] would yield a map as shown in Figure 1 subplot
B and in such cases, affinity-based QSAR modeling is
appropriate. It is clearly possible to have a constant affinity
and variable kinetic properties (Figure 1C), a pattern that has
been observed in the temperature dependency of drug-target
interactions [6]. The most common on-off-rate map appear-
ance encountered to date, however, resembles the one shown
in Figure 1D, with a significant spread in association rate,
dissociation rate and affinity. In such situations, the
assumption that the association rate is constant is obviously
false and standard QSAR methodology may fail to establish
an interpretable model of activity as a function of structure.
Copyright # 2007 John Wiley & Sons, Ltd.
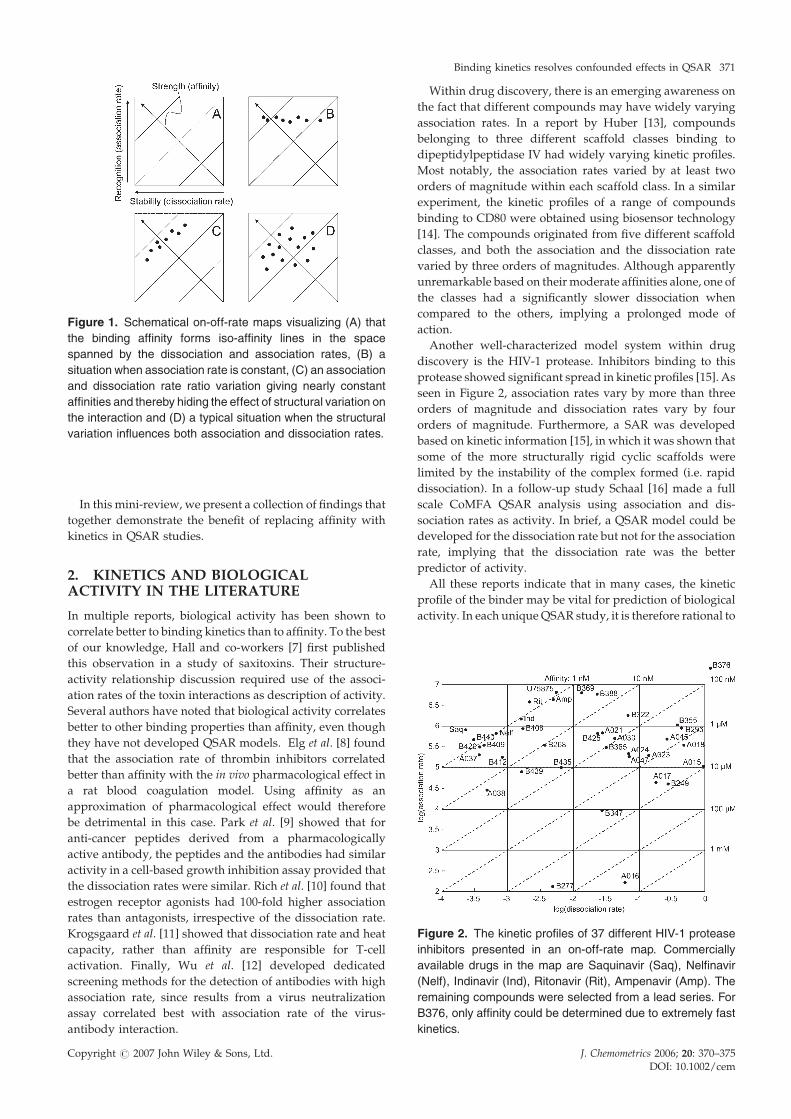
Figure 1. Schematical on-off-rate maps visualizing (A) that
the binding affinity forms iso-affinity lines in the space
spanned by the dissociation and association rates, (B) a
situation when association rate is constant, (C) an association
and dissociation rate ratio variation giving nearly constant
affinities and thereby hiding the effect of structural variation on
the interaction and (D) a typical situation when the structural
variation influences both association and dissociation rates.
Binding kinetics resolves confounded effects in QSAR 371
In this mini-review, we present a collection of findings that
together demonstrate the benefit of replacing affinity with
kinetics in QSAR studies.
Figure 2. The kinetic profiles of 37 different HIV-1 protease
inhibitors presented in an on-off-rate map. Commercially
available drugs in the map are Saquinavir (Saq), Nelfinavir
(Nelf), Indinavir (Ind), Ritonavir (Rit), Ampenavir (Amp). The
remaining compounds were selected from a lead series. For
B376, only affinity could be determined due to extremely fast
kinetics.
2. KINETICS AND BIOLOGICALACTIVITY IN THE LITERATURE
In multiple reports, biological activity has been shown to
correlate better to binding kinetics than to affinity. To the best
of our knowledge, Hall and co-workers [7] first published
this observation in a study of saxitoxins. Their structure-
activity relationship discussion required use of the associ-
ation rates of the toxin interactions as description of activity.
Several authors have noted that biological activity correlates
better to other binding properties than affinity, even though
they have not developed QSAR models. Elg et al. [8] found
that the association rate of thrombin inhibitors correlated
better than affinity with the in vivo pharmacological effect in
a rat blood coagulation model. Using affinity as an
approximation of pharmacological effect would therefore
be detrimental in this case. Park et al. [9] showed that for
anti-cancer peptides derived from a pharmacologically
active antibody, the peptides and the antibodies had similar
activity in a cell-based growth inhibition assay provided that
the dissociation rates were similar. Rich et al. [10] found that
estrogen receptor agonists had 100-fold higher association
rates than antagonists, irrespective of the dissociation rate.
Krogsgaard et al. [11] showed that dissociation rate and heat
capacity, rather than affinity are responsible for T-cell
activation. Finally, Wu et al. [12] developed dedicated
screening methods for the detection of antibodies with high
association rate, since results from a virus neutralization
assay correlated best with association rate of the virus-
antibody interaction.
Copyright # 2007 John Wiley & Sons, Ltd.
Within drug discovery, there is an emerging awareness on
the fact that different compounds may have widely varying
association rates. In a report by Huber [13], compounds
belonging to three different scaffold classes binding to
dipeptidylpeptidase IV had widely varying kinetic profiles.
Most notably, the association rates varied by at least two
orders of magnitude within each scaffold class. In a similar
experiment, the kinetic profiles of a range of compounds
binding to CD80 were obtained using biosensor technology
[14]. The compounds originated from five different scaffold
classes, and both the association and the dissociation rate
varied by three orders of magnitudes. Although apparently
unremarkable based on theirmoderate affinities alone, one of
the classes had a significantly slower dissociation when
compared to the others, implying a prolonged mode of
action.
Another well-characterized model system within drug
discovery is the HIV-1 protease. Inhibitors binding to this
protease showed significant spread in kinetic profiles [15]. As
seen in Figure 2, association rates vary by more than three
orders of magnitude and dissociation rates vary by four
orders of magnitude. Furthermore, a SAR was developed
based on kinetic information [15], in which it was shown that
some of the more structurally rigid cyclic scaffolds were
limited by the instability of the complex formed (i.e. rapid
dissociation). In a follow-up study Schaal [16] made a full
scale CoMFA QSAR analysis using association and dis-
sociation rates as activity. In brief, a QSAR model could be
developed for the dissociation rate but not for the association
rate, implying that the dissociation rate was the better
predictor of activity.
All these reports indicate that in many cases, the kinetic
profile of the binder may be vital for prediction of biological
activity. In each unique QSAR study, it is therefore rational to
J. Chemometrics 2006; 20: 370–375DOI: 10.1002/cem

372 K. Andersson and M. D. Hamalainen
verify the accuracy of affinity as predictor of biological
response and consider use of kinetic rate constants.
3. AMBIGUOUS RESPONSE VARIABLESIN MODELING
It is not uncommon to use compiled responses within
chemometrics. This is perhaps most frequently seen in the
use of closure in chromatography, where the peaks are
expressed as percentage of all peaks areas, and in the use of
signal/noise ratio in quality modeling. Such responses may
be perfectly acceptable for use in modeling, but certain
caution must be taken to ensure that the underlying
mechanisms are not masked in the process of compiling
the response. For example, if the signal of a system is related
to the factors in a completely different way than the noise, the
quotient signal/noise may have a quite complex relationship
to the factors that could be resolved more easily if they were
modeled as separate responses.
By analogy, affinity is the quotient of the dissociation rate
and the association rate and if the kinetic rate constants are
related to structural factors in different ways, themodeling of
the compiled response (i.e. affinity) will become problematic.
4. KINETICS-BASED QSAR: EXAMPLES
Two QSAR studies have been performed explicitly to show
that kinetic rate constants are beneficial for the QSAR
modeling process and for the interpretation of the model
[17–19]. These two studies were easily designed and dealt
with peptides or proteins binding to antibodies. In brief, the
experiments were designed in the following manner:
� S
Co
election of a set of molecules. In both cases, the sequence
of a polypeptide was modified. Two or three positions in
the polypeptide were mutated simultaneously. In order to
achieve maximal span in sequence space, the amino acid
substitutions were selected according to a multivariate
experimental design using three tabulated amino acid
properties as factors: hydrophilicity (ZZ1), size (ZZ2)
and electronic characteristics (ZZ3) [20].
Figure 3. Left: Amino acid (aa) sequence
conclusions from the QSKR model. Righ
dissociation rate for the interaction of Fab
height of the markers in the plot indicates
observed values.
pyright # 2007 John Wiley & Sons, Ltd.
� C
o
t:
5
th
haracterization of the activity of the molecules. The
binding kinetics for the interaction with the target mol-
ecule as measured by Biacore analysis was selected as
activity measure in both studies. This resulted in separate
models for association and dissociation rate.
� M
athematical description of the molecules. The sametabulated values of amino acid properties used during
the design of the mutated polypeptides were used as
description. In one of the studies, a fourth descriptor,
helix-forming tendency (HFT) was also included [21].
� I
dentification of a mathematical model that relates thedescription to the characterization. Since the design of the
polypeptides was statistically sound, the modeling part
became simple, with a linear model providing accurate
predictions.
The first QSAR study involved peptides binding to a
fragment of the recombinant antibody 57P (Fab 57P) [17]. The
wild-type peptide was originally derived from a viral
antigen, the tobacco mosaic virus protein (TMVP) [22].
The interaction of Fab 57P with the wild-type peptide had
been extensively characterized prior to the present study
[22]. Importantly, the wild-type peptide had been point
mutated at a number of positions [23]. It was therefore
possible to select three positions to mutate (142, 145 and 146),
which were all known to influence but not severely disrupt
the interaction, see Figure 3. After design, kinetic character-
ization, description andmodeling, the resulting models were
simply
ka ¼ 106 � ð1:175� 0:511 � ½142HFT�þ 0:0822 � ½145ZZ3�ÞðQ2 ¼ 0:49Þ
logðkdÞ ¼ � 1:052� 1:11 � ½145HFT�� 0:186 � ½146ZZ3�ðQ2 ¼ 0:73Þ
where [142HFT] denotes the value of the HFT descriptor for
the amino acid present at position 142. As seen from the
model equations, association and dissociation rate were
controlled by different properties of the peptide. For
obtaining a fast on–slow off binder (i.e. a high affinity
binder), the amino acid at position 142 should have a small
f the wild-type TMVP peptide and
Plot of observed versus predicted
7P with the different peptides. The
e pooled standard variation of the
J. Chemometrics 2006; 20: 370–375DOI: 10.1002/cem

Figure 4. Left: CDR3 loop structure (for the wild-type antibody TS) and list of
mutant single domain camel antibodies available for the study. Right: Plots of
observed versus predicted kinetic constants. Mutants used for deriving model are
depicted as circles, mutants used for validation as plus signs. The upper plot
describes predictive ability for association rate and the lower plot predictive ability
for dissociation rate.
Binding kinetics resolves confounded effects in QSAR 373
HFT value, 145 should have a large HFT value and a large
positive ZZ3 value and 146 should have a large positive ZZ3
value. To obtain high affinity, glycine should be put at
position 142, serine or phenylalanine at 145 and aspartic acid
or serine at position 146. The validity of the model for log(kd)
has been verified in a follow-up study using eight novel
peptides [24], of which the kd of seven could be accurately
predicted by the model.
The second QSAR study included single and double
mutated proteins, namely single domain camel antibodies
(cAb) binding to lysozyme [18]. In this case, two residues
present in the CDR3 loop of cAb were mutated according to
the experimental design outlined in Figure 4. The experiment
was performed essentially as for the TMVP peptides,
yielding the predictive models
logðkaÞ ¼ 3:60� 0:0016 � ½101ZZ1� � 0:25 � ½101ZZ2� � 0:18
� ½101ZZ3� þ 0:16 � ½105ZZ1� � 0:097 � ½105ZZ2�
� 0:19 � ½105ZZ3�ðQ2 ¼ 0:88Þ
logðkdÞ ¼ �2:0þ 0:051 � ½101ZZ1� þ 0:092 � ½101ZZ2� þ 0:23
� ½101ZZ3� þ 0:091 � ½105ZZ1� þ 0:0095 � ½105ZZ2�
� 0:57 � ½105ZZ3�ðQ2 ¼ 0:85Þ
where [101ZZ1] denotes the value of the ZZ1 for the amino
acid present at position 101. Fourteen cAb were used for
deriving the models, while another four were used for model
Copyright # 2007 John Wiley & Sons, Ltd.
validation. A graphic presentation of the predictive ability of
the models is given in Figure 4. As can be seen, the validation
mutants were predicted within the noise of the model,
indicating that the models were valid. They predicted that a
small and non-electrophilic amino acid (e.g. glycine) at
position 101 would increase binding strength both via
increased association rate and decreased dissociation rate. At
position 105 there was a conflict, since it was impossible to
find an amino acid giving both high association rate and low
dissociation rate. If the highest possible affinity is required,
the best compromise was predicted to be aspartic acid,
serine, glycine or proline.
The results from the De Genst [18] paper were later
re-analyzed using a completely different strategy [25]. The
method for describing the mutated single domain antibodies
was extended to allow for 3D-QSAR analysis. Using the
measurements in De Genst et al. and the 3D structure of the
wild-type camel antibody [26], a detailed 3D-QSAR model
was derived. Estimated structures of the mutated antibodies
were obtained by using commercial molecular modeling
software. The amino acids at positions 101 and 105 in the
wild-type antibody were replaced in silico according to the
mutation scheme. For each mutant, the software calculated
the 3D structure with lowest energy. These 3D structure
estimates were then used for developing a QSARmodel. The
spatial co-ordinates for backbone and side-chain for all
amino acids in the CDR3 loop and the ZZ3-scales for each of
the two mutated positions were used as structure descrip-
J. Chemometrics 2006; 20: 370–375DOI: 10.1002/cem

374 K. Andersson and M. D. Hamalainen
tions of the antibody. Interestingly, co-ordinate changes for
amino acids that were not mutated correlated with changes
in binding characteristics. Thus, if the 3D structure of a
protein is available, not all positions in the binding site region
need to be mutated to get information about how each
position near the binding site influences the interaction. The
information on non-mutated amino acid movements was not
as detailed as the information available for the mutated
amino acids. However, enough information was obtained for
detecting which amino acids contributed to the binding,
providing guidance for which residues to mutate in
follow-up studies.
5. CONCLUSION
Contrary to common belief, both the association rate and the
dissociation rate of drug-target interactions vary signifi-
cantly, even within what appears to be fairly homogenous
sets of molecules (drugs of the same scaffold class and
peptides of similar lengthwith large homology). The fact that
binders to the same protein with opposite function (agonist/
antagonist) have been discriminated by kinetics and not
affinity strengthens the arguments for inclusion of kinetic
rate constants in QSAR studies. Furthermore, it has been
shown that simple, separate QSAR models for association
and dissociation rates could be developed for the TMVP
peptides and the cAb. In both cases the models were clearly
different for association and dissociation rate, indicating that
different mechanisms govern the creation and the stability of
a molecular complex. Therefore, it is most likely beneficial to
replace commonly used affinity-assays to get access to kinetic
profiles, proven to be valuable in QSAR by improving the
accuracy and simplifying the interpretation of the model.
The habit of using a compiled response, affinity, in QSAR
may have led to unnecessary failures in modeling and
significant confusion when interpreting results. Simpler
models and more straightforward interpretation are anticip-
ated with the use of unambiguous kinetic rate constants.
Given the collection of proof on the importance of binding
kinetics for explaining biological activity, combined with the
shown benefits of kinetically resolved QSAR, binding
kinetics should be the preferred response in QSAR studies.
AcknowledgementsProfessor Olav Kvalheim is acknowledged for hosting the
post doc visit of M. D. H. 1992 and for acting opponent
during the dissertation of K. A. 2004. We also thank Dr Gary
Franklin for commenting on the manuscript.
REFERENCES
1. Kubinyi H. Comparative molecular field analysis(CoMFA). In The Encyclopedia of Computational Chemistry,Vol. 1, Schleyer PvR, Allinger NL, Clark T, Gasteiger J,Kollman PA, Schaefer HF, III, Schreiner PR (eds). JohnWiley & Sons: Chichester, 1998; 448–460.
2. Demyttenaere-Kovatcheva A, Cronin MT, Benfenati E,Roncaglioni A, Lopiparo E. Identification of the struc-tural requirements of the receptor-binding affinity ofdiphenolic azoles to estrogen receptors alpha and beta
Copyright # 2007 John Wiley & Sons, Ltd.
by three-dimensional quantitative structure-activityrelationship and structure-activity relationship analysis.J. Med. Chem. 2005; 48(24): 7628–7636.
3. Bohl CE, Chang C,MohlerML, Chen J, Miller DD, SwaanPW, Dalton JT. A ligand-based approach to identifyquantitative structure-activity relationships for theandrogen receptor. J. Med. Chem. 2004; 47(15): 3765–3776.
4. Box G. Signal-to-noise ratios, performance criteria, andtransformations. Technometrics 1988; 30: 1–17.
5. Lundqvist T. The devil is still in details—driving earlydrug discovery forward with biophysical experimentalmethods. Curr. Opin. Drug Discov. Dev. 2005; 8: 513–519.
6. Shuman CF, Hamalainen MD, Danielson UH. Kineticand thermodynamic characterization of HIV-1 proteaseinhibitors. J. Mol. Recognit. 2004; 17(2): 106–119.
7. Hall S, Strichartz G, Moczydlowski E, Ravindran A,Reicharrdt PB. The saxitoxins: sources, chemistry, andpharmacology. In Marine Toxins Origin, Structure andMolecular Pharmacology, Hall S, Strichartz G (eds), ACSSymposium Series. American Chemical Society:Washington, DC, 1990; 29–65.
8. Elg M, Gustafsson D, Deinum J. The importance ofenzyme inhibition kinetics for the effect of thrombininhibitors in a rat model of arterial thrombosis. Thromb.Haemost. 1997; 78(4): 1286–1292.
9. Park BW, Zhang HT, Wu C, Berezov A, Zhang X, Dua R,Wang Q, Kao G, O’Rourke DM, Greene MI, Murali R.Rationally designed anti-HER2/neu peptide mimeticdisables P185HER2/neu tyrosine kinases in vitro andin vivo. Nat. Biotechnol. 2000; 18(2): 194–198.
10. Rich RL, Hoth LR, Geoghegan KF, Brown TA, LeMottePK, Simons SP, Hensley P, Myszka DG. Kinetic analysisof estrogen receptor/ligand interactions. Proc. Natl. Acad.Sci. U.S.A. 2002; 99: 8562–8567.
11. Krogsgaard M, Prado N, Adams EJ, He XL, Chow DC,Wilson DB, Garcia KC, Davis MM. Evidence that struc-tural rearrangements and/or flexibility during TCRbinding can contribute to T cell activation. Mol. Cell.2003; 12: 1367–1378.
12. Wu H, Pfarr DS, Tang Y, An LL, Patel NK, Watkins JD,Huse WD, Kiener PA, Young JF. Ultra-potent antibodiesagainst respiratory syncytial virus: effects of bindingkinetics and binding valence on viral neutralization.J. Mol. Biol. 2005; 350: 126–144.
13. Huber W. A new strategy for improved secondaryscreening and lead optimization using high-resolutionSPR characterization of compound-target interactions.J. Mol. Recognit. 2005; 18(4): 273–281.
14. Lofas S. Optimizing the hit-to-lead process using SPRanalysis. Assay Drug Dev. Technol. 2004; 2: 1–9.
15. Markgren P-O, Schaal W, Hamalainen MD, Karlen A,Hallberg A, Samuelsson B, Danielsson UH. Relation-ships between structure and interaction kinetics forHIV-1 protease inhibitors. J. Med. Chem. 2002; 45(25):5430–5439.
16. SchaalW.Computational Studies ofHIV-1Protease Inhibi-tors. Comprehensive Summaries of Uppsala Dissertations fromthe Faculty of Pharmacy, 2002, ISBN: 91-554-5213-2.
17. Andersson K, Choulier L, Hamalainen MD, van Regen-mortel MHV, Altschuh D, Malmqvist M. Predicting thekinetics of peptide-antibody interactions using a multi-variate experimental design of sequence and chemicalspace. J. Mol. Recognit. 2001; 14: 62–71.
18. De Genst E, Areskoug D, Decanniere K, Muyldermans S,Andersson K. Kinetic and affinity predictions of a pro-tein–protein interaction using multivariate experimentaldesign. J. Biol. Chem. 2002; 277(33): 29897–29907.
19. Andersson K. Characterization of Biomolecular Inter-actions Using a Multivariate Approach. Comprehensive
J. Chemometrics 2006; 20: 370–375DOI: 10.1002/cem
Binding kinetics resolves confounded effects in QSAR 375
Summaries of Uppsala Dissertations from the Faculty ofMedicine, 2004, ISBN: 91-554-5999-4.
20. Hellberg S, Sjostrom M, Skagerberg B, Wold S.Peptide quantitative structure-activity relationships, amultivariate approach. J. Med. Chem. 1987; 30: 1126–1135.
21. Deleage G, Roux B. An algorithm for protein secondarystructure based on class prediction. Protein Eng. 1987; 1:289–294.
22. Chatellier J, Rauffer-Bruyere N, Van Regenmortel MHV,Altschuh D, Weiss E. Comparative interaction kinetics oftwo recombinant Fabs and of the corresponding anti-bodies directed to the coat protein of tobacco mosaicvirus. J. Mol. Recognit. 1996; 9: 39–51.
23. Choulier L, Rauffer-Bruyere N, Ben Khalifa M, Martin F,Vernet T, Altschuh D. Kinetic analysis of the effect on
Copyright # 2007 John Wiley & Sons, Ltd.
Fab binding of identical substitutions in a peptide andits parent protein. Biochemistry 1999; 38(12): 3530–3537.
24. Choulier L, Andersson K, Hamalainen MD, van Regen-mortel MHV, Malmqvist M, Altschuh D. QSAR studiesapplied to the prediction of antigen–antibody interactionkinetics as measured by BIACORE. Protein Eng. 2002;15(5): 373–382.
25. Freyhult EK, Andersson K, Gustafsson MG. Structuralmodeling extends QSAR analysis of antibody–lysozymeinteractions to 3D-QSAR. Biophys. J. 2003; 84: 2264–2272.
26. Desmyter A, Transue TR, Ghahroudi MA, Thi M-HD,Poortmans F, Hamers R, Muyldermans S, Wyns L. Crys-tal structure of a camel single-domain VH antibodyfragment in complex with lysozyme. Nat. Struct. Biol.1996; 3(9): 803–811.
J. Chemometrics 2006; 20: 370–375DOI: 10.1002/cem