repor t resumes - eric · descriptors- *electronics technicians, *educational needs, ... frank t....
TRANSCRIPT

.-.-n-...,-
REPOR T RESUMESED 020 327 VT 004 420THE ROLE OF MATHEMATICS IN ELECTRICAL-ELECTRONIC TECHNOLOGY.BY- BARLOW, MELVIN L. SCHILL, WILLIAM JOHNCALIFORNIA UNIV., LOS ANGELES
PUB DATE 62EDRS PRICE MF-$0.75 HC-$5.46 135F.
DESCRIPTORS- *ELECTRONICS TECHNICIANS, *EDUCATIONAL NEEDS,*MATHEMATICS, JUNIOR COLLEGES, TECHNICAL EDUCATION, TECHNICALMATHEMATICS, FIELD INTERVIEWS, Q SORT, TEACHER ATTITUDES,.EMPLOYEE ATTITUDES, SURVEYS,
. .
THIS STUDY WAS CONCERNED WITH DETERMINING THE KIND OFMATHEMATICS THE ELECTRONICS TECHNICAL WORKER ACTUALLY USED,OR NEEDED TO HAVE KNOWLEDGE OF ON THE JOB SO THAT JUNIORCOLLEGES COULD DETERMINE THE WAYS AND MEANS OF INTEGRATING ORSCHEDULING IT INTO THE TECHNICAL CURRICULUM. DATA WEREGATHERED FROM 90 TECHNICAL WORKERS, SELECTED AT RANDOM FROM44RANDOMLY SELECTED CALIFORNIA ELECTRONICS COMPANIES, ANDFROM 29 INSTRUCTORS SELECTED AT RANDOM FROM 45 JUNIORCOLLEGES WITHELECTRONICS PROGRAMS. THE TWO METHODS OFCOLLECTING DATA WERE INDIVIDUAL INTERVIEWS IN WHICH PERSONALDATA AND JOB HISTORY DATA WERE COLLECTED, AND Q-SORTS WHICH
. DETERMINED MATHEMATICAL CONCEPTS OR SKILLS NEEDED TO PERFORMON THE JOB. THE 0-SORT WAS A MEANS OF GETTING THE TECHNICALWORKERS TO DISTRIBUTE INTO 9 DIFFERENT FILES 66 MATHEMATICALPROBLEMS ACCORDING TO THE EXTENT TO WHICH THESE PROBLEMS WERECHARACTERISTIC OF THEIR DAY-TO-DAY WORK. MATHEMATICALCONCEPTS OR SKILLS DEFINED AS ESSENTIAL TO ELECTRONICSTECHNICAL WORKERS IN RESEARCH. AND DEVELOPMENT WERE CONVERSIONOF FRACTIONS TO DECIMALS, PERCENT CALCULATIONS OF TOLERANCE,CHANGING PERCENTAGE TO DECIMALS, CONVERSION OF MET1IC TOAMERICAN MEASURING SYSTEM, SQUARE ROOT LONG-HAND METHOD,DIVISION OFSIGNED NUMBERS, SCIENTIFIC NOTATION, ESTIMATIONOF ARITHMETIC PROBLEMS, MULTIPLICATION WITH EXPONENTS,DIVISION WITH EXPONENTS, RAISING TO A POWER WITH EXPONENTS,USE OF NEGATIVE EXPONENTS, RATIOS, AND PYTHAGOREAN THEOREM.INSTRUCTORS RECRUITED TO TEACH THIS CURRICULUM SHOULD HAVEHAD EXPERIENCE IN RESEARCH AND DEVELOPMENT IN INDUSTRY, ANDHAVE COMPLETED MATHEMATICS THROUGH. CALCULUS. (HC)

The Role ofMathematics in
Electrical-ElectronicTechnology
DIVISION OF VOCATIONAL EDUCATION
UNIVEREITY OF CALIFORNIA, LOS ANGELES
1962

U.S. DEPARTMENT OF HEALTH, EDUCATION & WELFARE
OFFICE OF EDUCATION
THIS DOCUMENT HAS BEEN REPRODUCED EXACTLY AS RECEIVED FROM THE
PERSON OR ORGANIZATION ORIGINATING IT POINTS OF VIEW OR OPINIONS
STATED DO NOT NECESSARILY REPRESENT OFFICIAL OFFICE OF EDUCATION
POSITION OR POLICY.
The Role ofMathematics in
Electrical-ElectronicTechnology
MELVIN L. BARLOWAssociate Professor
Director, Division of Vocational EducationUniversity of California, Los Angeles
WILLIAM JOHN SCHILLResearch Consultant
Division of Vocational EducationUniversity of California, Los Angeles
DIVISION OF VOCATIONAL EDUCATION
University of California, Los Angeles
1962

Foreword
The California State Department of Education through the Bureau
of Industrial Education has been sensitive to the needs of the junior
colleges in California for research concerning critical elements of the
Technical Education curriculum.The project concerning the role of mathematics in Electrical-
Electronic Technology was made possible through funds allocated
to the State of California by Title VIII of the National Defense Edu-
cation Act. The project was planned and conducted in cooperationwith the Division of Vocational Education, University of California,
Los Angeles.The Bureau of Industrial Education feels that service in the area
of curriculum development is most important at this time of rapidchange in the manpower profile of California. The opportunity to
co-sponsor curriculum projects along with the Division of Vocational
Education of the University of California at Los Angeles provides
a significant manner in which the instructional content of trade andtechnical programs cf,n be updated. We are indebted to the Divisionof Vocational Education and especially to its director, Dr. Melvin L.
Barlow, for the continued interest in building an ever better program
of trade and technical education in California.
V
ERNEST G. KRAMER
Chief, Bureau of Industrial EducationCalifornia State Department of Education

=KINCOMMOr
Preface
The Division of Vocational Education has for many years worked incooperation with the vocational services of the California State Depart-ment of Education to prepare studies of state-wide significance and valuein vocational - technical education. Such studies have been largely con-cerned with element;; of the instructional program of the public schoolsof California and were prepared as an aid to the schools in improving theirinstructional programs. The study of the role of mathematics in Electrical-Electronic Technology was begun in the fall of 1960 and completed in thefall of 1961.
The study involved cooperative arrangements with many industrial con-cerns in California for the purpose of interviewing technical workers andfor the purpose of identifying mathematical competencies of such workers.Industry cooperated wholeheartedly in this undertaking. Similar coopera-tive arrangements were made with the junior colleges having curriculumsin Electrical-Electronic Technology. Both the administration and the in-structors of these junior college programs gave generously of their timeand spent many hours with representatives of the research staff in meet-ings related to the study.
Identification of all persons who have made contributions to the researchis not possible. However, it is appropriate to identify the members of theadvisory committee. Invitations to assist with the project in an advisorycapacity were issued jointly by the Chief of the Bureau of IndustrialEducation, California State Department of Education, and the Director ofthe Division of Vocational Education, University of California.
Advisors From L.mior Colleges
Norman Harris, Dean, Vocational-Technical Education, Bakersfield College,Bakersfield, California.
vii

viii / Preface
Frank T. Jacobs, Dean, Technical and Vocational Center, Stockton College,Stockton, California.
Franklin Johnson, Dean, Los Angeles Trade-Technical College, Los Angeles,
California.P. W. Knowles, Vice-President, Sacramento City College, Sacramento,
California.Ivan Lauritzen, Electronics Instructor, San Diego City College, San Diego,
California.Robert Moses, Chairman, Engiieering and Technical Department, Pasadena
City College, Pasadena, California,Phil H. Putnam, President, Compton College, Compton, California.Walter L. Thatcher, Director, San Diego City College, San Diego, California.F. Parker Wilber, President, Los Angeles Trade-Technical College, Los Ange-
les, California.
Advisors From Industry
Henry Gunderson, Coordinator, Santa ClaraSan Benito Counties ElectricalConstruction Industry, San Jose, California.
Max Selby, Manager of Personnel, Hughes Aircraft Co., Newport Beach,California.
Advisors From The State Department of Education
Samuel L. Fick, Ernest G. Kramer, David Allen, Sidney McCaw, Mack Stoker,
Van Lawrence.
Advisors From The University of CaliforniaBonham Campbell, William Brownell, CDR John Meyer, Lawrence H. Stew-
art, Fred Kintzer, B. Lamar Johnson, Howard Wilson, Evan Keislar, LetaAdler, C. Wayne Gordon.
Workshop Assistance
Mention should be made also of the special workshops in which prob-lems related to the study were probed deeply. The keen insight of theinstructors who participated in the workshops and the understanding andenthusiasm of junior college administrators were valuable aids to theresearch staff. Instructors from the following junior colleges participatedin the workshops:
American River Junior College, Sacramento, CaliforniaAntelope Valley College, Lancaster, CaliforniaBakersfield College, Bakersfield, CaliforniaCerritos College, Norwalk, CaliforniaChaffey College, Alta Loma, CaliforniaCoalinga College, Coalinga, CaliforniaCollege of Marin, Kentfield, California

Preface / ixCollege of San Mateo, San Mateo, CaliforniaCompton College, Compton, CaliforniaDiablo Valley College, Concord, CaliforniaEl Camino College, Los Angeles, CaliforniaFoothill College, Los Altos Hills, CaliforniaLos Angeles Pierce College, Los Angeles, CaliforniaLos Angeles Trade-Technical College, Los Angeles, CaliforniaLong Beach City College, Long Beach, CaliforniaModesto Junior College, Modesto, CaliforniaMonterey Peninsula College, Monterey, CaliforniaOakland City College, Oakland, CaliforniaPasadena City College, Pasadena, CaliforniaReedley College, Reedley, CaliforniaSacramento City College, Sacramento, CaliforniaSan Diego City College, San Diego, CaliforniaSan Francisco City College, San Francisco, CaliforniaSan Jose City College, San Jose, CaliforniaSanta Monica City College, Santa Monica, CaliforniaShasta College, Redding, CaliforniaVentura College, Ventura, California
Lee W. Ralston, Director of Practical Arts, Los Angeles County Schools,assisted with the organization of instructor conferences and acted as adiscussion leader for the conferences. Three meetings of the advisory com-mittee were held: two on the Los Angeles Campus of the University ofCalifornia and one on the Berkeley Campus.
RICHARD S. NELSON
Supervisor of Technical EducationBureau of Industrial EducationCalifornia State Department of Education

Contents^=110
ForewordPreface viiIntroduction 1
PART IAbstract and Recommendations 9
Abstract 9Job Classification 9Educational Attainment 9Mathematics Achievement 9Needed Mathematical Skills or Concepts 11
Experimental Study 13
Instructional Material 14
Recommendations 14
PART IICHAPTER 1
The Interview Schedule and the Q-Sort 21Developing the Interview Schedule 21Occupational Mobility 22Developing the Q-Sort 23Pilot Study 24Falsifiers 25Necessary Assumptions 25Summary 25
xi

xii I Contents
CHAPTER 2The Technical Worker 27
The Industrial Universe for the Study 27Selecting the Sample of Technical WorkersDefinition 28Development of Job Classifications for Technical Workers 29Distribution of Technical Workers Within the Classifications 31Analysis of Interview Data 32Formal Education of the Technical Worker 32Formal Mathematics Background of the Technical Worker 34Age of the Technical Worker 37Factors Influencing Occupational Choice of the Technical Worker 39Summary 40
28
CHAPTER 3The Instructor 42
Instructor Workshops 42Analysis of Interview Data 44Electronics Experience of Instructors 44Formal Education of the Instructors 46Formal Mathematics Background of the Instructors 48Summary 48
CHAPTER 4Mathematical Competencies Needed by Technical Workers 49
Administering the Q -Sot and Interviewing theTechnical Workers 49
The Recommended Order of Instruction 50Technical Workers Assessing the Mathematical
Competencies Needed 50Analysis of the Q-Sort 51Results of the Q-Sort 53Summary 53
PART IIICHAPTER 5
The Experimental Study 61Statement of the Problem 61Method of Student Assignment 61
Contents / xiii
Conduct of the Classes 62
Material Covered 63
Comparison of Experimental and Control Classes 64
Measurements 64
Characteristics of the Students in the Study 66
Characteristics of the Students by Group 66
Comparisons of Student Gain 68
Comparison of Control and Experimental Groups on Gain inMathematics Achievement 68
Fourfold Comparison of Gain in Mathematics Achievement 68
Comparison Between Electronics Majors and Non-electronicsMajors on Gain in Mathematics Achievement 69
The Instructor's Comments on the Use of the AutoTutor 69
Student Reaction to the AutoTutor 70
Summary 70
CHAPTER 6Instructional Materials 71
The Initial 4'onception 71
Materials Presented at the Workshops 71
Questionnaires on Instructional Material 72
Self-Instructional Textbooks 73
Commercially Prepared Teaching Aids 73
Application of the Teaching Aids 74
Use of the Teaching Aids 74The Instructors' Appraisal of the Teaching Aids in Use 74
Summary 75
PART IVAPPENDICES
A Annotated Bibliography 79
B Forms 98
C Data 115
TABLESCHAPTER 2
I Distribution of Companies Contacted by Sample midAlternates
II Technical Workers Included in the Study by JobClassifications, in Groups
28
31

xiv / Contents
III Formal Education of Technical Workers in the Sample byJob Classification 32
IV Kruskal-Wallis (H) One-Way Analysis of Variance 33V Formal Mathematics of Technical Workers by Job
Classification 35
VI Sources Credited by Respondents as Contributing Most toTheir Ability to Perform on the Job, by Job Classification 36
VII Correlation of Selected Interview Data for Technical Workers 38
VIII Sources of Interest in Electronics 39IX The Role of Personal Influence in Choosing a Career in
Electronics 40
CHAPTER 3I Formal Education of Instructors in the Sample by Job
Classification 45
II Tests of Significance for Selected Interview Data onElectronics Instructors 46
III Distribution of Mathematics Background of Instructors byIndustrial Experience 47
CHAPTER 4I Coefficient of Concordance for Q-Sorts by Job Classification 52
II Reliability Coefficient of Resultant Sorts 53
III Placement of Mathematical Concepts or Skills by JobClassification 54
CHAPTER 5I Initial Distribution of Students in Experimental and
Control Classes 62
II Final Distribution of Students in Experimental andControl Classes 62
III Correlation of Data on Students for Bakersfield Study 65
IV Distribution of Mean Gain Among Control and Experimental,Major and Non-Major Groups 68
CHAPTER 6
I Total Returns from the Questionnaire Survey of 65Instructors of Electronics . 72
II Responses Indicating Acquaintance with CommerciallyPrepared Teaching Aids 74
III Responses Indicating Use of Teaching Aids Covered in Survey 75
Introduction
The programs of vocational and technical education in the public schools
of California have been sensitive to industrial and technological changes
and consequently to the curriculum adjustments which such changes
require. Advisory committees representative of the vocational or technical
area concerned and also representative of the needs of labor and manage-
ment assist the public schools in keeping abreast of technological change.
The school, armed with the advice and suggestions of a group representa-
tive of industry, makes appropriate educational adjustments to the end
that the salable knowledge and skills of graduates are in tune with current
industrial needs.The rate of technological change varies greatly among the various tech-
nical areas. In the case of the electrical-electronic industry the rate of
change has been most rapid. Since 1950, the electronic industry has grown
at a rate of about three times that of the national economy as a whole.
The electronic industry in California is centered in the Los Angeles area
and in the San Francisco Bay area and radiates outward to other locations.
Service agencies such as the Federal Aviation Agency, the IBM customer
service installations, and local radio and television repair shops are dis-
tributed throughout the state. Employment in the industry has been good,
particularly for the person who can qualify for employment in a classifica-
tion roughly identified as a "technician." The term "technician" has not
been used in the report and has been replaced by the term "technical
worker" or "technical employee." (The problem of identification of techni-
cal workers is discussed in Chapter 2.)The majority of the students being trained in the California public
junior colleges for entry occupations in electronics is located in the Los
Angeles and San Francisco Bay areas. Outlying junior colleges also have
electronics programs due to the geographical mobility pattern of the
1

,
2 / The Role of Mathematics in Electrical-Electronic Technology
SAN FRANCISCO
SACRAMENTO
STOCKTONI I I
SAN JOSE11/111
SANTA CRUZ/'
<0":-.......11BiARDI;. ,/ f7r/ " . :. : '..* \NN
SANTA BARB \\%SAN BERNARDINORIVERSIDELOS AWE
in)
SAN DIEGO
Figure 1
Centers of the Electronics Industry in California
working force in California and to the location of service agencies through-out the State.
Forty-five public junior colleges in California had programs of instruc-tion in electrical-electronic technology during the period of this study,1960-61. These programs differed in many respects, particularly in theamount of mathematics required of a student to enter the program and inthe amount and nature of mathematics to be included in the curriculum.This study of the role of mathematics in the electrical-electronic technology

Introduction / 3
provides data for junior colleges to use as they attempted to resolve theknotty problems of the technical curriculum.
The Nature of the Study
The study was concerned largely with the kind of mathematics thetechnical worker actually used, or needed to have knowledge of, on thejob. From such data the junior colleges could then determine the waysand means of integrating or scheduling the needed mathematics into thetechnical curriculum.
In order to accomplish the primary purpose of the study it was importantto consider a number of related elements. Data which would be supple-mentary to the primary purpose and which would expand the generalarea of understanding of the total problem were obtained through thefollowing activities:
Group discussions with electrical-electronic instructors.Interviews with a selected sample of the technical workers.
An experimental study involving the use of self-instructional devices.An analysis of instructional materials used in electrical-electronic
programs.A review of the literature related to the basic study.These activities provided a vast amount of data concerning technical
workers in California, their instructors, their jobs, and their need for math-ematics. These data are reported in the study where appropriate in devel-oping the main problem of needed mathematics.
For the most part the data were gathered by conferences with smallgroups of persons, by reviews of printed documents, and by questionnaires.The data concerning mathematical concepts needed by technical workerson the job were acquired by the use of a special adaptation of a techniqueknown as the Q-sort. The Q-sort, which is described in more detail in afollowing chapter, was simply a means of getting the technical workers todistribute into nine different piles 66 mathematical problems accordingto the extent to which these problems were characteristic of their day-to-day work.
All data acquired were subjected to exhaustive statistical treatmentusing appropriate statistical methods to determine significance, validity,reliability, and relationships. The facilities of the Western Data ProcessingCenter on the U.C.L.A. campus were used generously in the treatment ofdata.
The Plan of the ReportPart I consists of a brief abstract of the entire report. Since this part
deals with the report only in summary fashion it is necessary to refer toother parts, and to the appendix, for the supporting rationale, assumptions,

4 / The Role of Mathematics in Electrical-Electronic Technology
hypotheses, procedures, and other data. In addition, the recommendationsfor the entire report are shown in Part I.
Part II consists of four chapters related to mathematical competenciesneeded by the technical worker. The interview schedule and the Q-sortare described in Chapter 1. Data concerning the technical worker and theenvironment in which he works are shown in Chapter 2. Description andanalysis of workshops conducted with electrical-electronic instructors arefound in Chapter 3. Chapter 4 reports upon the mathematical compe-tencies needed by technical workers as revealed by an analysis of theQ-sort.
Part III of the report is related to the general topic of instructionalmaterials and includes, as Chapter 5, a report of an experimental studyconcerning self-tutoring devices. A general treatment of instructionalmaterials in electrical-electronic technology is included in Chapter 6.
Part IV consists of an appendix of three parts. Appendix A is an anno-tated bibliography of selected research related to the topic of the study.Appendix B includes a reproduction of the various forms, scales, lettersand other materials used in the study. Appendix C consists of the dataupon which the report was based.
How to Use the ReportThe only purpose for which this study was made was to provide data of
state-wide significance which could be used by junior colleges to improveand expand their programs of technical education which were related tothe electrical-electronic industry.
The report provides an adequate realistic treatment of the character-istics of instructors involved in the junior college program in the area ofelectronics in general. Such data could be useful when considering selec-tion and professional growth of instructors.
The data concerning the technical workers employed in the electrical-electronic industry provide insight into the characteristics of persons em-ployed in the industry and have implications kr screening and selection ofstudents for programs in electrical- electronic,, technology.
The data concerning the mathematical competencies needed by techni-cal workers were derived from the technical workers then selves. Thesedata indicate the exent to which employed technical workers have needfor mathematics in their work.
Junior colleges can therefore use the report as an aid in selecting instruc-tors and students and as a means of determining how their electrical-electronic programs will provide experiences leading to mathematical com-petencies upon which technical workers place value. No attempt has beenmade to suggest specific patterns to be used because such decisions mustbe made with full knowledge of situational factors which are peculiar to
Introduction / 5
a particular institution. Each institution must determine how it will pro-
vide for the needed mathematical competencies. Usual, customary, andtraditional courses in mathematics have many advantages but also havesevere limitations. This would be true also of a thoroughly integrated pro-gram of mathematics as a part of the electrical-electronic curriculum. Itis probable that neither extreme is thoroughly appropriate. It is also prob-able that some combination of newly designed mathematics courses andan integrated mathematics structure will offer enticing advantages.


qt1MCNIMe-.17.E.sWAsez7.1vms....." -.2traWMANIMI
Abstract and Recommendations
Abstract
The persons most qualified to assess the mathematical competen-cies needed by technical workers in the California electronics industry arethe workers themselves. The instructors of electronics in the Californiapublic junior colleges are well qualified to assess the applicability of math-ematical competencies to their programs.
Job Classification
Data were gathered from 90 technical workers, selected at random from44 randomly selected California electronics companies, and from 29 in-structors selected at random from 45 junior colleges with electronics pro-grams. Figure 1 shows the distribution of the technical workers amongthe nine job classifications in which they are employed and the distribu-tion of the instructors among job classifications in which they obtainedtheir industrial experience.
Educational AttainmentThe two methods of collecting data from the technical workers and
electronics instructors were: (1) individual interviews in which personaldata and job history data were collected, and (2) Q-sorts which determinedmathematical concepts or skills needed to perform on the job.
The interview data were used to divide the respondents into groupswith similar educational attainment and mathematical background. Thedistribution of technical workers and electronics instructors for educa-tional attainment is shown in Figure 2.
Mathematics AchievementThe highest level of mathematics achieved correlated highly with edu-
cational attainment, but the relationship was not 1 to 1. This indicates that
9

10 / The Role of Mathematics in Electrical-Electronic Technology
FIELD SERVICE
ELECTRICIAN
PLANT MAINTENANCE
INSTRUMENT MAINTENANCE
TESTING
RESEARCH do DEVELOPMENT
COMMUNICATIONS
RADIO I TELEVISION
DESIGN DRAFTING
COMPUTER
Immo WORKERS (9O)immomINST RUC T OR 5(29)
1111111I111111111111
111111111111111
V1111111l11111111111111111111111111111111111111111111111111111111111111111111111111
0 5 10 15 20 25 30 35 40PERCENT
Figure 1
Distribution of Technical Workersand Electronics Instructors
Among the Job Classifications
Emmy INSTRUCTORSWORKERS
13 14 15 16 17 IS 19 20
EDUCATIONAL ATTAINMENT IN YEARS
Figure 2
Distribution of Technical Workers and Electronic Instructors
on Educational Ana nment

5160111111111MMINNOMMIIIMMINNIIIIIIINNIONISKOEI
Abstract and Recommendations / 11
the respondent with the highest educational attainment is not necessarilythe one with the most mathematics in his background. Therefore, the levelof mathematics achieved is shown for the technical workers and the in-structors in Figure 3.
Needed Mathematical Skills or ConceptsIn the body of the report the analysis of the Q-sort data is accomplished
by partialing on the basis of job classification; however, for this abstractthe mathematics needed on the job is reported for the technical workers
1z
a.
7
25
0
.141/1/11174/1111/411IN2.
R UoroRS
1 ; NI avs 11
Sllg2 ON uzg Pil
LEVEL OF ATTAINMENT IN MATHEMATICS
Figure 3
Distribution of Technical Workers and ElectronicsInstructors on Mathematics
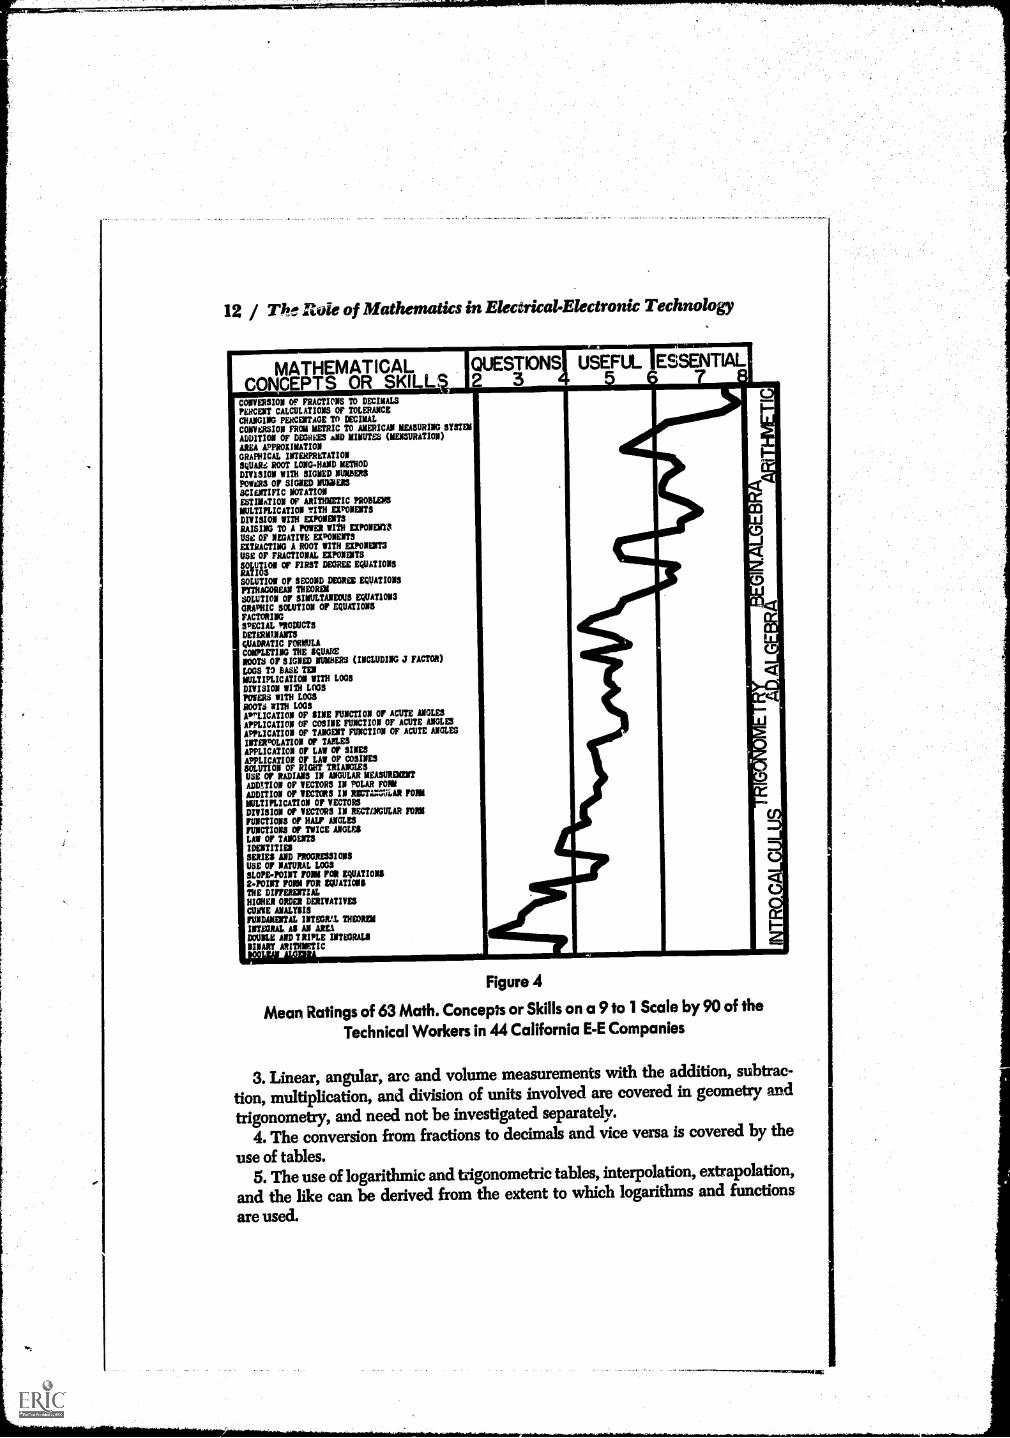
as a whole. The ratings of the mathematical concepts or skills used in theQ-sort was from 9 (most essential) to 1 (least essential). Figure 4 showsthe mean rating given each item along with the customary groupings inareas of mathematics and the cut-off points used to define "essential,""useful," and "of questionable value" items.
Before discussing the conclusions and recommendations drawn from thedata, it is essential that the reader be acquainted with the assumptionsupon which the research was based. It has already been stated that thetechnical workers were assumed to be qualified to assess the mathematicalskills or concepts needed on their job. In addition, there were the followingassumptions:
1. Addition, subtraction, multiplication, and division were assumed to beessential to all productive members of our industrial society.
2. The concept of ratio or proportion as included in algebra was representativeenough without including the same arithmetic concept.
12 / The Ride of Mathematics in Electrical-Electronic Technology
USEFUL ESSENTIAL.
CONVERSION OF FRACTIONS TO DECIMALSPERCENT CALCULATIONS OF TOLERANCECHANGING PERCENTAGE TO DECIMALCONVERSION FROM METRIC TO AMERICAN MEASURING SYSTEMADDITION OF DEGREES AND MINUTES (MENSURATION)AREA APPROXIMATIONGRAPHICAL INTERPRETATIONSQUARE ROOT LONG-HAND METHODDIVISION WITH SIGNED NUMBERSPOWERS OF SIGNED NUMBERSSCIENTIFIC NOTATIONESTIMATION OF ARITHMETIC PROBLEMSMULTIPLICATION PITH EXPONENTSDIVISION WITH EXPONENTSRAISING TO A POWER WITH EXPONENTSUSE OF NEGATIVE EXPONENTSEXTRACTING A ROOT WITH EXPONENTSUSE OF FRACTIONAL EXPONENTSSOLUTION OF FIRST DEGREE EQUATIONSRATIOSSOLUTION OF SECOND DEGREE EQUATIONSPYTHAGOREAN THEOREMSOLUTION OF SIMULTANEOUS EQUATIONSGRAPHIC SOLUTION OF EQUATIONSFACTORINGSPECIAL PRODUCTSDETERMINANTSQUADRATIC FORMULACOMPLETING THE SQUAREROOTS OF SIGNED NUMBERS (INCLUDING J FACTOR)LOGS TO BASE TENMULTIPLICATION WITH LOOSDIVISION WITH LOGSPOWERS WITH LOGSROOTS WITH LOGSAll'LICATION OF SINE FUNCTION OP ACUTE ANGLESAPPLICATION OF COSINE FUNCTION OF ACUTE ANGLESAPPLICATION OF TANGENT FUNCTION OF ACUTE ANGLESINTERPOLATION OF TABLESAPPLICATION OF LAW Or SINESAPPLICATION OF LAW OF COSINESSOLUTION OF RIGHT TRIANGLESUSE OF RADIANS IN ANGULAR MEASUIEMMTADDITION OF VECTORS IN POLAR FORMADDITION or VECTORS IN RECTAEGUEAR FORMMULTIPLICATION OF VECTORSDIVISION or VECTORS IN RECT./JOCULAR FOAMFUNCTIONS OF HALF ANGLESFUNCTIONS or TWICE ANGLESLAW OF TANGENTSIDENTITIESSERIES AND PROGRESSIONSUSE OF NATURAL LOGSSLOPE -POINT FOAM FOR EQUATIONS2 -POINT FORM FOR EQUATIONSTHE DIFFERENTIALHIGHER ORDER DERIVATIVESCURVE ANALYSISFUNDAMENTAL INTEGRIL THEOREMINTEGRAL. AS AN AREADOUBLE ANDTRIPLE INTEGRALSBINARY ARITHMETIC
Figure 4
Mean Ratings of 63 Math. Concepts or Skills on a 9 to 1 Scale by 90 of the
Technical Workers in 44 California E-E Companies
3. Linear, angular, arc and volume measurements with the addition, subtrac-
tion, multiplication, and division of units involved are covered in geometry and
trigonometry, and need not be investigated separately.4. The conversion from fractions to decimals and vice versa is covered by the
use of tables.5. The use of logarithmic and trigonometric tables, interpolation, extrapolation,
and the like can be derived from the extent to which logarithms and functions
are used.
I

Abstract and Recommendations / 13
6. Vectors in rectangular form and complex numbers involve the same mathe-matical concepts.
7. The slide rule is a tool and not a mathematical concept in itself.
The assignment of items in the Q-sort into "essential," "useful," and "ofquestionable value" was determined by analysis of the Q-sort data. Thethree categories fit nicely into another frame of reference. The "essential"category contains basic arithmetic skills which are considered to be neededby all technical workers in the electrical-electronics industry. These canbe considered prerequisite mathematical skills or concepts, and they are
ESSENTIAL
student populationwith prerequisite
knowledge of mathematics
USEFUL QUESTIONABLE
students who electto study electronics
I employed technical workerswho desire upgrading
entryoccupations
1
advancedoccupations
Figure 5
Theoretical Relationships Between Mathematical Categories,Training and Advancement in the Electronics Industry
of a sufficiently low order to allow the majority of high school graduatesto qualify.
Those students who elect to study electronics should be required tomaster the items in the "useful" category in the process ofcompleting theirtraining. Mastery of these skills or concepts would assure sufficientknowl-edge of mathematics to gain entry into the industry.
The items listed in the "of questionable value" category are of question-able value to the training of students for entry occupations only and arenot of questionable value in themselves. It is proposed that these items beconsidered as part of the offering in part-time programs designed to up-grade employed technical workers.
A graphical representation of the discussion above is shown in Figure 5.
Experimental StudyInstructional materials are considered to be highly correlated with stu-
dent achievement and, therefore, two attempts were made to assess theeffectiveness of instructional materials related to the teaching of mathe-matics for electronics.
An experiment was conducted at Bakersfield College in the use ofautomated instruction. Experimental and control groups were used to

14 / The Role of Mathematics in Electrical-Electronic Technology
:a.ssess the relative effect of automated instruction upon student achieve-
ment in mathematics. The results are shown in Figure 6.
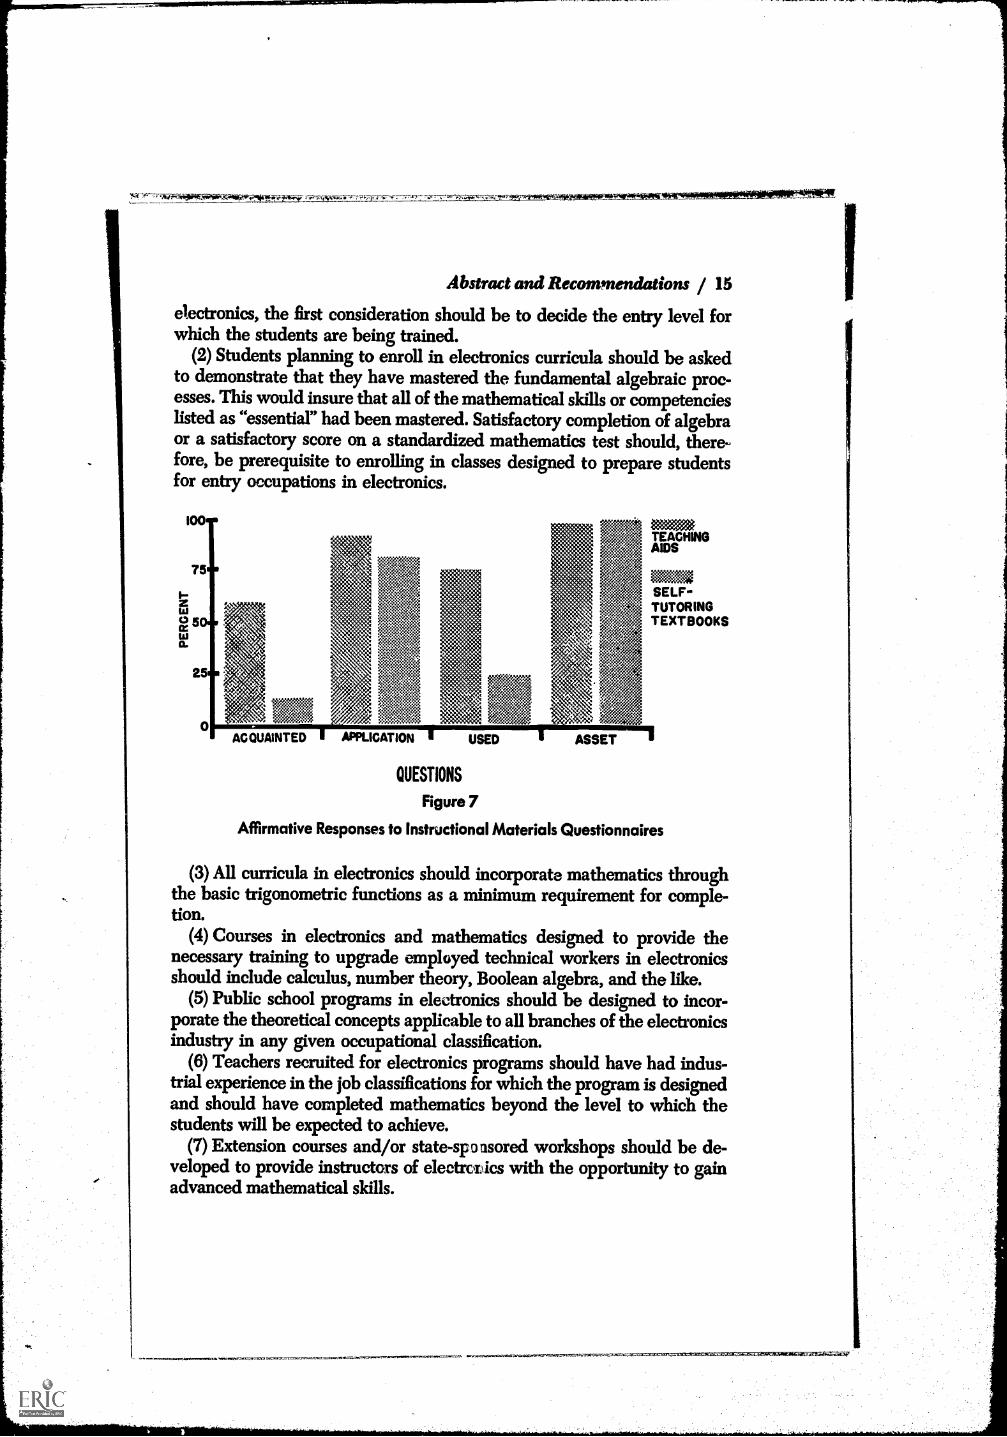
Instructional MaterialA questionnaire survey was employed to collect data on five self-
instructional textbooks and eight commercially prepared teaching aids.Electronics instructors were asked to answer the following questions abouteach of the books and aids:
CONTROL GROUP(36)
EXPERIMENTAL GROUP(29)
1 0-5 6-10 15 16-20 OVER 20
PRE-TEST , POST-TEST GAIN
Figure 6
Distribution of Students on Gain in Mathematics by
Control and Experimental Groups
1. Are you acquainted with the book or aid?2. Do you see an application to instruction in electronics or mathematics
related to electronics?3. Have you used the book or aid in your program?4. Do you think this book or aid was an asset?The questions were so worded that if an instructor gave a negative
response to any one of them, the subsequent questions were not applicable.
This means that each of the four questions has a different number of
responses.Eighty-nine percent of the instructors responded. There was no differ-
entiation among the teaching aids nor among the books. Consequently,the responses are for the two groups as a whole. The affirmative responses
to the four questions listed above are shown in Figure 7.
RECOMMENDATIONS
(1) In order to define the mathematical skills or concepts to be included
in a curriculum designed to train technical workers for occupations in
AsAk,... :`;rn. X' ..'vfaW'rei.411---.WILOger4-6~1061010"0"1._111W.
Abstract and Recommendations / 15
electronics, the first consideration should be to decide the entry level forwhich the students are being trained.
(2) Students planning to enroll in electronics curricula should be askedto demonstrate that they have mastered the fundamental algebraic proc-esses. This would insure that all of the mathematical skills or competencieslisted as "essential" had been mastered. Satisfactory completion of algebraor a satisfactory score on a standardized mathematics test should, there-fore, be prerequisite to enrolling in classes designed to prepare studentsfor entry occupations in electronics.
1001.
75
zo5
2
MIOSELF-TUTORINGTEXTBOOKS
ACQUAINTED APPLICATION USED
QUESTIONS
Figure 7
Affirmative Responses to Instructional Materials Questionnaires
(3) All curricula in electronics should incorporate mathematics throughthe basic trigonometric functions as a minimum requirement for comple-tion.
(4) Courses in electronics and mathematics designed to provide thenecessary training to upgrade employed technical workers in electronicsshould include calculus, number theory, Boolean algebra, and the like.
(5) Public school programs in electronics should be designed to incor-porate the theoretical concepts applicable to all branches of the electronicsindustry in any given occupational classification.
(6) Teachers recruited for electronics programs should have had indus-trial experience in the job classifications for which the program is designedand should have completed mathematics beyond the level to which thestudents will be expected to achieve.
(7) Extension courses and/or state-sp o asored workshops should be de-veloped to provide instructors of electrorics with the opportunity to gainadvanced mathematical skills.

16 / The Role of Mathematics in Electrical-Electronic Technology
(8) The teacher training agencies in California that offer programs lead-
ing to a baccalaureate degree should strive to include advanced mathe-
matics courses in the programs of their students who aspire to teach elec-
tronics.It is recommended that commercially prepared teaching aids be con-
sidered an asset to instruction in electronics and be given preference overinstructor-prepared devices.
EXAMPLE
In order to define the mathematical skills or concepts to be included in
a curriculum designed to train technical workers for occupations in elec-
tronics, the first consideration should be to decide the entry level forwhich
the students are being trained. On the basis of the preceding data anddiscussion, it is evident that testing and research and development shouldreceive prime consideration as entry occupations. To point up the use towhich this report can be put, the recommendations to the junior collegesthat follow will be in the form of an example. This example is based uponthe assumption that the junior college involved has a student body suffi-ciently large from which to recruit students into electronics and the neces-
sary facilities to conduct the program.On the basis of the report and knowledge of the electronics companies
in the junior college area, it was concluded that a program designed toprepare students to enter the electronics industry in the area of research
and development is necessary.The following concepts or skills have been defined as being essential to
technical workers in research and development:
1. Conversion of fractions to decimals2. Percent calculations of tolerance3. Changing percentage to decimal4. Conversion from metric to American measuring system5. Square root long-hand method6. Division with signed numbers7. Scientific notation8. Estimation of arithmetic problems9. Multiplication with exponents
10. Division with exponents11. Raising to a power with exponents12. Use of negative exponents13. Ratios14. Pythagorean Theorem
To facilitate the teaching of the required electronics theory, knowledgeof the foregoing list of "essential" mathematical skills or concepts wouldbe required for entry into the electronics program. The entry requirements

4PW,V. - =
Abstract and Recommendations / 17
in mathematics could be satisfied by having satisfactorily completed highschool algebra (which would guarantee the completion of all 14 of theconcepts listed above). In the absence of the prerequisite mathematicscourses the student could gain entry into the electronics program bydemonstrating on an entrance test that he was able to use the "essential"mathematical concepts.
The mathematical competencies or skills listed below have been definedas being useful to research and development technical workers and will,therefore, be built into the curriculum.
1. Addition of degrees and minutes (mensuration)2. Area approximation3. Graphical interpretation4. Powers of signed numbers5. Extracting a root with exponents6. Use of fractional exponents7. Solution of first degree equations8. Solution of second degree equations9. Solution of simultaneous equations
10. Graphic solution of equations11. Factoring12. Special products13. Quadratic formula14. Completing the square15. Roots of signed numbers (including j factor)16. Logs to base ten17. Multiplication with logs18. Division with logs19. Powers with logs20. Roots with logs21. Application of sine function of acute angles22. Application of cosine function of acute angles23. Application of tangent function of acute angles24. Interpolation of tables25. Application of Law of Sines26. Application of Law of Cosines27. Solution of right triangles28. Use of radians in angular measurement29. Addition of vectors in polar form30. Addition of vectors in rectangular form31. Multiplication of vectors32. Division of vectors in rectangular form33. Functions of half angles34. Functions of twice angles35. Use of natural logs36. Slope-point form for equations37. 2-point form for equations

PosfeAvet,i,-'11tArtmire'111.-orrinmgrealra ...e.L.a
18 / The Role of Mathematics in Electrical-Electronic Technology
To insure the ability of the instructor to teach the required mathematics,the person recruited to teach this proposed curriculum in research anddevelopment technology for electronics would have had experience inresearch and development in industry and would have completed mathe-
-"ics through the calculus, even though the calculus itself is not includedin the concepts to be taught in the curriculum.
To provide the opportunity for the research and development workersin local industries to upgrade themselves, extended-day classes would beoffered in advanced mathematics including the calculus number theoryand Boolean algebra.
RECOMMENDATIONS FOR FURTHER RESEARCH
1. Research is needed in the area of physics, chemistry, and property ofmaterials applicable to electronics to help define the extent to which theyshould be included in electronics curricula.
2. A long-term follow-up of the graduates of programs in electronicstechnology should be made to determine the occupational success of thesegraduates in comparison with industry-trained, service-trained and un-trained technical workers in industry.

Part II
1111111Ariiir'.1111011111111161111111.111111411111111110iiloragriad......riairiegrommadmiaL

: . .
Chapter 1
Vr,"7-?7tAlr:1;7,0,.:V,1"-^,7.
THE INTERVIEW SCHEDULEAND THE Q-SORT
Developing the Interview Schedule
The determination of the data to be obtained by interviewingtechnical workers was dictated to a large degree by two obvious variables:the amount of formal education completed and the amount of mathematics
studied.It was apparent that the amount of formal education and of mathe-
matics studied would have a bearing upon the amount of mathematics atechnical employee used on his job, or at least would have bearing uponhis opinion concerning mathematics needed on his job. Therefore, in theprocess of interviewing technical employees, data concerning the amountof formal education and the level of mathematics achieved were collected.Formal education was broadly interpreted to include public schools, pri-vate schools, military service schools, correspondence courses, and classesheld in industry. Because formal education was broadly defined, it wasnecessary to devise a scale of equivalency to indicate achievement of eachof the technical workers. The customary units of high school or collegecourses completed were not satisfactory because military service schoolsand classes conducted in industry are not measured in this fashion. Theassessment of formal education achieved and formal mathematics com-pleted took place during the interview with the technical employee andhis placement on the following scales was determined:
Formal Education1less than high school2high school or equivalent3high school +4Associate of Arts or equivalent
21
5Associate of Arts +6Bachelor of Arts or equivalent7Master of Arts or equivalent8Master of Arts +

22 / The Role of Mathematics in Electrical-Electronic Technology
Baccalaureate and higher degrees were included in the classification offormal education in order to permit classification of the electronics in-structors on the same scale with the technical workers.
The respondents were asked to recall the courses in mathematics theyhad studied in high school, college, and/or other formal educational pro-grams. These were then classified according to the following categories:
Formal Mathematics1none2arithmetic3plane geometry4 algebra5intermediate algebra6solid geometry
7higher algebra8trigonometry9analytical geometry
10differential calculus11integral calculus12beyond
The assumption was made that a person who completed the mathematicscourses identified by any point on the scale would not necessarily havecompleted all of the courses listed below that point; but he would have hadto master the aspects of the preceding courses that are prerequisite to thecourse at that particular point on the scale.
As a part of the interview process, the technical employees were askedto identify the factors that influenced their choice of occupation. It wasanticipated that there would be ct.2siderable personal influence involvedin occupational choice. During the interview, the technical employeeswere asked to identify (by name, if possible) any individual who had hadan effect upon their occupational choice. If they could not remember any-one having influenced them, or if they credited someone with havinginfluenced them, but could not recall the individual's name, it was re-corded as "no personal influence." It was anticipated that military serviceor other employment circumstances influenced occupational choice. This,too, was investigated in the process of interviewing.
The question concerning the development of an interest in electronicsby technical workers (whether there was any personal influence involvedand where they received their training) was an attempt, in addition toinvestigating the mathematical skills necessary, to identify the extent towhich public education had contributed to occupational-vocational guid-ance of the technical workers currently employed in the industry.
Occupational Mobility
The occupational experience pattern of the respondents was consideredto be an important variable that might have an effect upon the Q-sort. Forthis reason a job history was solicited from each respondent. The job his-tory was pursued far enough to enable the investigator to determine

The Interview Schedule and the Q-Sort / 23
whether the individual involved was stable within the occupational area,horizontally mobile within the occupational area, or vertically mobile.
Job stability needs no definition; however, horizontal and vertical mo-bility do. For the purposes of this study, horizontal mobility means thatthe technical employee has made two or more job changes within the pastthree years without substantially improving his status. Vertical mobilitymeans that the technical employee has made two or more moves, each ofwhich improved his occupational status.
It seemed imperative to check the validity of the job histories reportedby the technical employee. Nine of the interviewees (10 percent of thetotal) were selected and their job histories and formal education, as re-ported, checked against the job histories and formal education on file withthe personnel office of their employers. Of the nine investigated, two hadactual job histories slightly different from those reported. In each instance,however, the difference was not great enough to change their classificationby mobility. This investigation satisfied the validity requirements of thisphase of the research report.
Developing the Q-SortTo identify the mathematics continuum, a variety of published
studies was consulted. A study by David Allen listed approximately 100mathematical skills or competencies needed in the electrical-electronics in-dustry in California' In addition, standard texts, final examinations admin-istered at the junior colleges in the State, and interviews with 25 teachers ofelectronics who were attending the 1960 summer session at U.C.L.A. wereused. Each of the teachers interviewed was asked to submit five problemsrepresentative of concepts or skills that they would expect their graduatesto master. All of the skills and concepts accumulated from the aforemen-tioned sources were grouped according to similarity and arranged in alogical sequence. It was assumed that knowledge and understanding ofthe fundamental arithmetic skills (addition, subtraction, multiplication,and division of whole numbers) could be deleted from the list since suchconcepts were representative of the needs of society as a whole.
Sixty-six mathematical concepts evolved, ranging from the more complexarithmetic processes to integral and differential calculus. Typical problemswere then developed that represented these specific mathematical conceptsor skills. The problems were constructed to represent each skill or conceptinvolved and were screened to be sure that the jargon of the electrical-electronics industry had been omitted, and that as often as possible onlyone mathematical skill or concept was represented by the problem.
1 A Guide for Developing Electronics Courses, Electronic Committee of the LocalAdministration of Vocational and Practical Arts, and the Bureau of Industrial Educa-tion, Second Edition, California State Department of Education (Sacramento: 1960).
j;_36rakity
24 / The Role of Mathematics in Electrical-Electronic Technology
In the process of the Q-sort the interviewees were asked to make aforced normal distribution of the mathematical skills or concepts (whichwere printed on 66 cards) into nine piles with the distribution of the cardsranging from those representative of problems most similar to the prob-lems encou. .,ered on the job to problems which were least similar to theproblems en..:entered on the job. (The directions, reporting forms, andsample problems used in the Q-sort re shown in Appendix B.)
By definition, the technical workers included in the sample (see Chapter2) had to make use of basic electrical-electronics theory on the job. Thiseliminated the workers whose jobs were repetitive. If the technical workerused the entire range of mathematics, it was assumed that the resultingsort would follow the recommended order of instruction in mathematics.
The Q-sort, as it was used in this study, seemed the best possible wayto determine whether specific skills or concepts in algebra, trigonometry,and other branches of mathematics were widely used while others in thesame broad categories of mathematics were seldom used.
Pilot Study
A pilot study was conducted for the purpose of checking: (1) whetherthe questions to be asked were meaningful and capable of being answeredby technical workers in industry; (2) the time required to complete theQ-sort (this proved to be between 45 and 70 minutes); (3) the validity ofthe problems (determining whether the problems truly represented themathematical skill or concept that they were intended to represent).
The pilot study consisted of 18 interviews with technical workers in theelectrical-electronics industry in Southern California. These workers wereselected because they had been identified by their employers as havingmathematical skills and as being able to recognize the skill or conceptinvolved in each problem. After the interview and the sort an extensivediscussion was held with each interviewee to determine whether he couldin fact identify the specific mathematical skills or concepts represented oneach of the 66 problems. As the result of these interviews, a number ofproblems were changed. There were items that unwittingly included elec-trical or electronic terminology in the symbols used in the mathematicalproblems. A goal example was the use of "db" as a literal number, whereasin electronics it represented decibels. Another example was the use of "S"as a literal number, whereas in electronics it represented the complex "j"factor. After each interview, the Q-sort problems were re-evaluated andchanged so that by the time the 18 interviews had been completed, thelast three interviewees were able to identify the mathematical skills orconcepts represented by each of the 66 problems.
A70110taii,
The Interview Schedule and the Q-Sort / 25
Falsifiers
During the process of constructing the Q-sort, three items were injected
that were false or mathematically impossible. One was for the calculus,
one for binary arithmetic, and one for Boolean algebra. The purpose of
the falsifiers was to identify the respondents who recognized the mathe-
matical skills or competencies involved and included them in the "essen-
tial" category but could not have made use of the skill or competency in
that they were unable to differentiate these falsifiers from the other ex-
amples. During the process of recording the Q-sort, notice was taken of
the placement of the falsifiers in the sort. If a respondent placed the false
items in the "essential" or "useful" category, a discussion with the respond-
ent was held to provide an opportunity for him to mention the items that
were impossible. On three occasions the falsifiers were placed in the
"essential" or "useful" section of the sort. In each case during the discussion
the res.,' Indent remarked that there were items that were mathematically
impossible but he had interpreted them as mistakes and had included them
along with the true items which represented the skill or concept involved.
This satisfied the validity of the sort, and the falsifiers have been ignored
in reporting the items in the Q-sort.
Necessary Assumptions
As has already been mentioned, the mastery of addition, subtraction,
multiplication, and division was assumed essential to productive members
of our industrial society. In addition, other assumptions were made and
validated during the interviews with 18 technical workers and 33 instruc-
tors. These were as follows:
1. The concept of ratio or proportion as included in algebra was sufficiently
representative to make it unnecessary to include the same arithmetic concept.
2. Linear, angular, arc, and volume measurements, including addition, sub-
traction, multiplication, and division of units are covered in geometry and trigo-
nometry, and need not be investigated separately.3. The conversion from fractions to decimals and vice versa is covered by the
use of tables.4. Knowledge of logarithmic and trigonometric tables, interpolation, extra-
polation, and the like can be derived from the extent to which logarithms and
functions are used.5. Vectors in rectangular form and complex numbers involve the same mathe-
matical concepts.6. The slide rule is a tool and not a mathematical concept in itself.
SUMMARYGathering information concerning the role of mathematics in electrical-
electronics technology required that certain technical workers be inter-

26 / The Role of Mathematics in Electrical-Electronic Technology
viewed and be asked to participate in supplying data concerning them-selves and their use of mathematics.
Personal data were to be obtained. The interview schedule includedprovisions to identify the extent of formal education completed and thenature of formal mathematics studied. In addition, it was important to thestudy to inquire into the nature and circumstances of the occupationalchoice of the technical workers, and to record information concerning thejob history of the technical workers. From these data the occupationalmobility of technical workers could be studied.
A technique known as the Q-sort was used to determine the amount ofmathematics actually used on the job. This made it possible for the tech-nical worker to make a distribution (from a previously prepared 1.;st ofproblems representative of mathematical skills or concepts) of the prob-lems which were most like those he actually encountered in his work tothose which were least like those encountered in his work. The Q-sort wasused as the basis for determining the role of mathematics in electrical-electronics technology.
Chapter 2
THE TECHNICAL WORKER
The Industrial Universe for the Study
It was intended that the sample of technical workers to be in-cluded in the study be representative of all technical worker3 in the Stateemployed in the electrical-electronics industry. To insure representation,it was necessary to have randomly selected technical workers from ran-domly selected electrical-electronics companies.
The list of companies involved in the manufacture, installation, repair,and service of electrical-electronics components, sub-systems, and systems
was derived from the following sources: (1) directory of the Western Elec-tronics Manufacturers' Association; (2) Electronic Sources, published byDirectories of Industry, Inc.; (3) rosters of advisory committees servingjunior college electronics courses; (4) California Manufacturers AnnualRegister, 1960; (5) Federal Communications Commission List of Radioand TV stations; (6) directories prepared by Chambers of Commerce andCounty Boards of Trade for the major cities in the State; and (7) the yellowpages of telephone directories.
The name and location of each company were punched on IBM cards(the list included the various branches of the large corporations). Whenall of the sources had been listed, the cards were alphabetized and printedand duplications were removed. A total of 2,643 specific installations com-prised the list of the State's electrical-electronics industry. With the aidof a table of random numbers, a sample of companies was selected. Theoriginal sample was 50, with two matched alternates for each.
The total number of companies contacted was 86, of which 44 wereincluded in the study. Thirty-nine companies were rejected because theydid not employ technical workers of the classification desired, or becausethey employed only one or two such workers. Three companies which metthe requirements of the study refused to participate. The breakdown bysample, first alternates, and second alternates is shown in Table I.
27

28 / The Role of Mathematics in Electrical-Electronic Teal/to logy
TABLE IDISTED3IITION OF COMPANIES CONTACTED BY SAMPLE AND ALTERNATES
let sample let alternate 2nd alternate Totals
Companies contacted 50 22 14 86
Companies participating in study 28 8 8 44
Rejected 19 14 6 39
Companies refused to participate 3 0 0 3
Selecting the Sample of Technical Workers
Inquiries were made of each of the companies to determinewhether they employed technical personnel that fell within the scope ofthe study. The next step consisted of a visit with the chief personnelofficer, factory superintendent, or general manager, to solicit cooperationin the research. At this point, the person authorized to give approval toparticipate was given a prospectus of the study and copies of the interviewschedule and Q-sort information. Once permission had been obtained tointerview the technical workers and to give the Q-sort, a number of tech-nical workers were selected at random from the total technical workingforce. This number had been previously set in relation to the total numberof employees who fell within thegeneral classification of technical worker.This was accomplished in a variety of ways dependent upon the size ofthe group involved. If the total number of such workers was 30 or fewer,they were given consecutive numbers, and those to be interviewed weredrawn from a hat. If the number was above 30, they were also given con-secutive numbers, and the starting point for selection was drawn from ahat, and every nth man was picked.
DefinitionThere have been numerous efforts to define the technical employee and
his place in industry. The following definition is similar to many, but alittle more precise than most:The technician is a person who works at a job which requires applied technicalknowledge and applied technical skill. His work in this respect is somewhat akin
to that of the engineer, but usually narrower in scope. His job also requires somemanipulative skills, those necessary to handle properly the tools and instrumentsto perform the technical tasks. In his special field he has considerable technical
knowledge of industrial processes, and in the field he knows how to apply thenecessary principles of the physical sciences and mathematics. In general, he uses

The Technical Worker / 29
instruments in contrast with tools. His contribution is mainly through mentaleffort in contrast with muscular exertion.'
For the purpose of this study, technical employees in the electrical-elec-tr( aics industry were defined as "skilled workers who are required on theirjobs to apply basic electrical-electronic theory." This definition was limitedby an additional requirement that the "skilled workers" have not as yetreceived a baccalaureate degree. This was intended to, and did, eliminatethe engineers who were performing technicians' jobs.
From the 44 companies that participated in the study, 90 technicalworkers, selected at random, were interviewed and were given the Q-sort.These 90 were representative of the 963 technical workers employed in the44 companies.
Development of Job Classifications for Technical WorkersThe specific classifications within the broad classification of tech-
nical worker were determined by defining operationally the jobs of theemployees included in the siztuly. The job functions of those employeeswho performed similar functions were grouped into one classification, andthe description of this classification became a synthesis of the operationaldefinitions of the jobs of the men who fell within this classification. By thismethod, nine classifications were established, and the technical workerswho fell into each classification did approximately the same type of work.These classifications are as follows:
TestingPerforms product tests (test after production) from specifications. Tests
and troubleshoots components, sub-systems, and systems to locate causesof failure. Checks components, sub-systems, and systems for capability ofdoing the job for which they are designed (reports findings to engineer orsupervisor). Conducts operational checks on instruments such as oscillo-scope, VTVM, multimeter, signal generator (AF -RF), and E-put meters.
Field ServiceInstalls, maintains, and/or repairs complex electrical or electronic equip-
ment (work is generally performed on customer's premises). Troubleshootsand makes necessary adjustments and repairs (adjustments and repairsare commonly made with the aid of the manufacturer's detailed specifica-tions and maintenance manuals).
Plant MaintenanceConstructs, installs, maintains, and/or repairs electrical and occasionally
electronics in-plant equipment. Troubleshoots and makes adjustments1 Vocational-Technical Education for American Industry, U. S. Department of
Health, Education, and Welfare, circular No. 530 (Washington: 1958), p. 1.

30 / The Role of Mathematics in Electrical-Electronic Technology
and/or repairs to obtain satisfactory operation, i.e., rewires or rewindselectrical motors. Understands and applies knowledge of simple circuitry(generally works without prints and diagrams).
Instrument MaintenanceTests, adjusts, maintains, calibrates, repairs, and modifies electronic and
electrical test equipment. Performs periodic functional tests on all typesof electrical and electronic instruments to determine if equipment meetsspecifications. Generally works from equipment manufacturer's manual toinsure measurement within the specifications.
Research and DevelopmentWorks from schematics and/or verbal instructions to build "bread-
boards" of design circuits and prototypes (the initial model of productionitem). Sets up testing procedures and designs test programs to check outproduction items. Designs or participates in the design of electro-mechan-ical packaging and sets up environmental test procedures. Checks andcalibrates prototypes of production items; makes modifications and re-designs circuits when and where necessary; uses complete line of elec-tronic test equipment.
Design DraftingPrepares detailed drawings and circuit diagrams (from rough sketches,
block diagrams, or verbal instructions, furnished by engineers or designers)to be used in the installation and manufacture of various types of elec-trical or electronic equipment; makes modification in drawings as requiredby engineering changes.
CommunicationsInstalls, maintains, and repairs radar, telemetry, sonar, NAV-AID radio
transmitters, and similar equipment; insures operation of the equipmentwithin specifications, makes on-the-spot adjustments, replacements, ormodifications required; performs periodic functional checks to guaranteecontinuous operation; uses multimeter, VTVM, milliammeter, tube checker,oscilloscope, pulse generator, BF generator, audio oscillator, sound ana-lyser, spectrum analyser, echo box, and other similar instruments.
ComputerLays out experimental computer circuits from engineering sketches,
using knowledge of computer logic, transistors, semiconductors, circuitanalysis, and other electronic computer technical skills; prepares test dataand charts indicating operating characteristics under each of the testconditions to which the component or system was subjected; applies
The Technical Worker / 31
Boolean algebra, binary and octal number system., to the design of com-
puter logic circuits.
Radio and TelevisionTroubleshoots and brings to satisfactory operation radio, television, and
sound reproduction sets (work is performed in the shop, or on the premises
of the owner; generally, this work is done with the aid of the manufac-
turer's specifications and repair manual). Uses VTVM, multimeter, tube
tester, oscilloscope, and the basic test instruments.
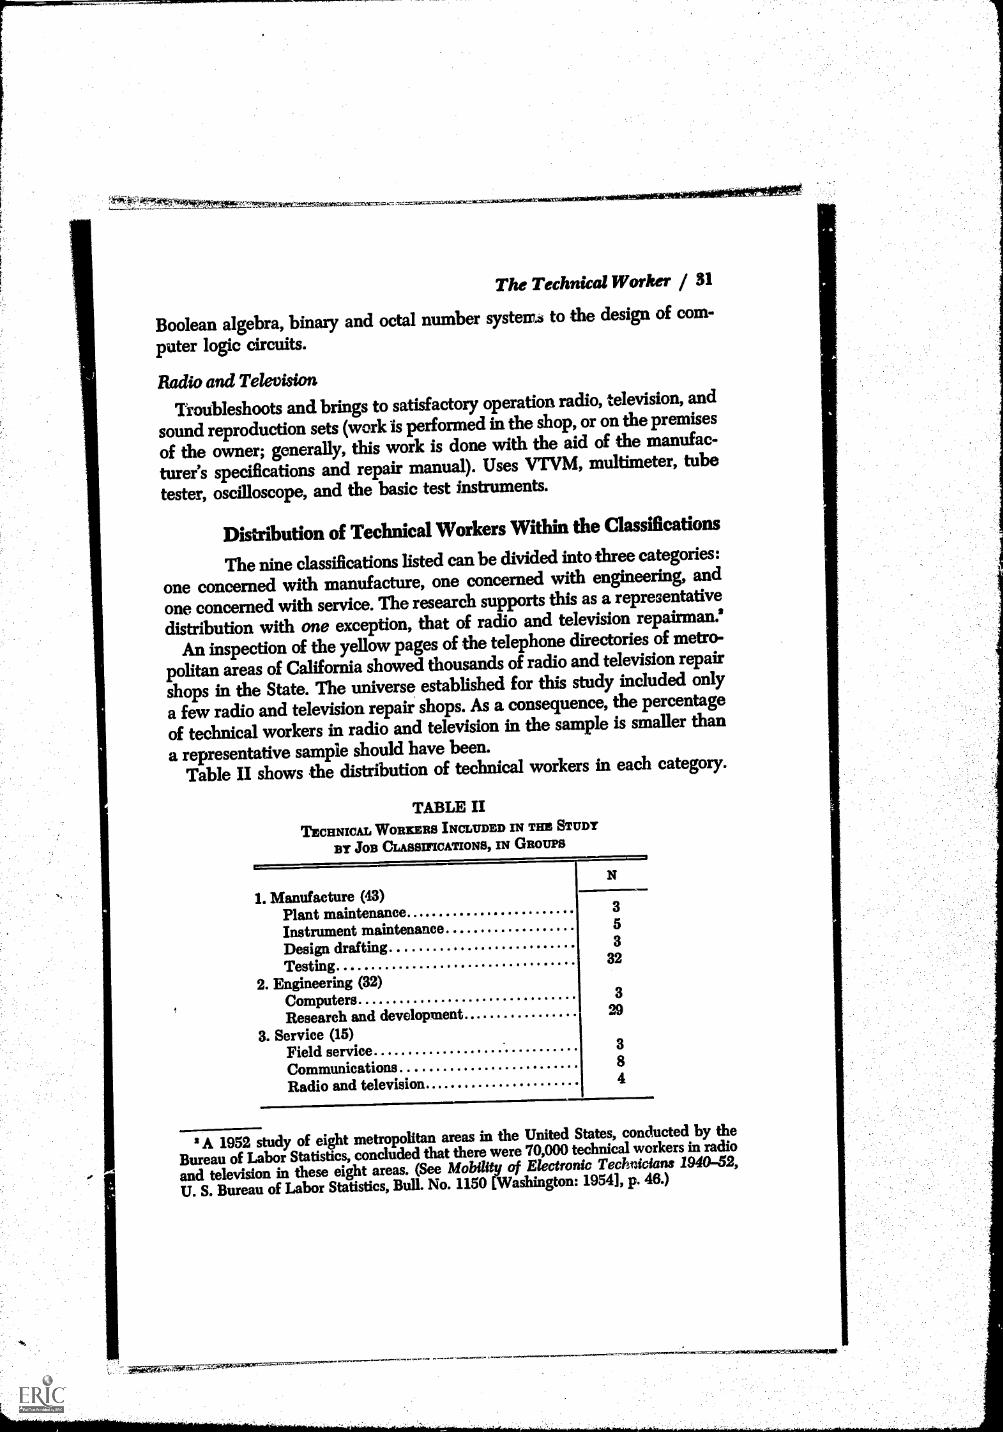
Distribution of Technical Workers Within the Classifications
The nine classifications listed can be divided into three categories:
one concerned with manufacture, one concerned with engineering, and
one concerned with service. The research supports this as a representative
distribution with one exception, that of radio and television repairman'
An inspection of the yellow pages of the telephone directories of metro-
politan areas of California showed thousands of radio and television repair
shops in the State. The universe established for this study included only
a few radio and television repair shops. As a consequence, the percentage
of technical workers in radio and television in the sample is smaller than
a representative sample should have been.Table II shows the distribution of technical workers in each category.
TABLE IITECHNICAL WORKERS INCLUDED IN THE STUDY
BY JOB CLASSIFICATIONS, IN GROUPS
N
1. Manufacture (43)Plant maintenanceInstrument maintenanceDesign draftingTesting
2. Engineering (32)ComputersResearch and development
3. Service (15)Field serviceCommunicationsRadio and television
353
32
329
3
4
2 A 1952 study of eight metropolitan areas in the United States, conducted by the
Bureau of Labor Statistics, concluded that there were 70,000 technical workers in radio
and television in these eight areas. (See Mobility of Electronic Technicians 1940-52,
U. S. Bureau of Labor Statistics, Bull. No. 1150 [Washington: 1954], p. 46.)

32 / The Role of Mathematics in Electrical- Electronic Technology
Analysis of Interview DataA correlation analysis of the interview data was made to demon-
strate the extent to which the variables investigated in the interviewsvaried with one another. In addition, Kruskal- Wallis (H) one-way analysisof variance' was computed to determine whether the technical workersvaried significantly in the amount of formal education and mathematicswhen grouped by job classification.
Fourfold correlations and multiple correlatIons were computed to inves-tigate the relationship between mobility, age, and educational backgroundfor the technical workers in total and by job classification.
Formal Education of the Technical Worker
TABLE IIIFORMAL EDUCATION OF TECHNICAL WORKERS IN THE SAMPLE
BY JOB CLASSIFICATION
Job classificationLem than
highschool
Highschool school13001
A.A. ore
lentA.A. plus N Mean formal
educationeducation
Radio andtelevision 0 1 0 1 2 4
A.A. orequivalent
Plantmaintenance 1 1 0 1 0 3 High school
Field service 0 0 2 0 1 3A.A. orequivalent
Design drafting 0 1 0 1 1 3A.A. orequivalent
Testing 2 4 14 7 5school
plus
Instrumentmaintenance 0 1 1 2 1 5
A.A. orequivalent
Research anddevelopment 0 0 8 8 13 29
A.A. orequivalent
Communica-tions 1 1 1 3 2
schoolplus
Computer 0 0 0 2 1 3A.A. orequivalent
N 4 9 26 25 26 90 A.A. minus
The distribution of formal education by job classifications is shown inTable III. The mean formal education background of the technical workerproved to be 3.72 on the scale of educational equivalency. This is equiva-
The ICruskal-Wallis (H) one-way analysis of variance does not require normal dis-tribution, but it does require that the data being analyzed be continuous. Explanation

The Technical Worker / 33
lent to slightly less than two years of junior college. The technical workersin this study have a slightly higher mean formal education backgroundthan did those in Stewart's' study who had a mean formal education ofslightly more than one year of junior college.
To carry forward the description of the technical worker, a ICruskal-Wallis (H) one-way analysis of variance for formal education by job classi-fication was computed (see Table IV). From this analysis it was concluded
TABLE IVKnusicaL-WALus (II) ONE-WAY ANALYSIS OF VARIANCE
Categories H Degrees offreedom
Formal education by job classification 16.40t 8
Formal education by job classification with horizontallymobile technical workers omitted 17.23t 8
Formal education by service, manufacturing, and engineer-ing categories 13.75* 2
Formal education by service and manufacturing categories 3.58 1
Formal education by service and engineering categories.... 1.50 1
Formal education by manufacturing and engineering cate-gories 11.90* 1
Level of mathematics achievement by job classification 34.89* 8
Level of mathematics achievement by job classification withhorizontally mobile technical workers omitted 37.77* 8
Level of mathematics achievement by source credited withhaving contributed most to the ability to perform on the job 4.23 8
Significant at 1%.tSignificant at 5%.H vanes as Chi square (theoretically from metro to infinity) and the significance of the diffennces in rank
order is based upon the number of sub-groups (job classifications) minus one.If His signifiamt at five per cent, this is interpreted to mean that the difference in rank order could have
occurred by chance five times out of s hundred.
that there is a difference in the amount of formal education from classifi-cation to classification for the technical worker. However, it seemed pos-sible that the technical worker Oa the lower end of the educational laddermay be undesirable in terms of performance on the job. The only attemptmade to measure the job efficiency of the respondents was in terms of
of the scales used and the basis for assuming continuous data are given in Chapter 1.The reason for using this statistic is to determine if the differences that exist among
the job classifications in this study could hav, occurred by chance. The ICruskal-Wallis(H) statistic compares the placement of the s'ab-groups within the rank order of thetotal group and assesses the distribution of the sub-group ranks in terms of the prob-ability of the distribution occurring by chance.
4 Mathematics and Science Competencies for Technicians, by Lawrence H. Stewartand Arthur D. Workman, Bulletin of the California State Department of Education,Vol. XXIX, No. 12 (Sacramento: Dec. 1960), p. 14.

34 / The Role of Mathematics in EkctricatEkctronic Technology
their job history. From the history solicited each man was assigned to acategory dependent upon his job history. These categories are "stable,""horizontally mobile," and "vertically mobile" (see Chapter 1). It is as-sumed here that if the technical worker is stable or upwardly mobile, hehas demonstrated his efficiency to the satisfaction of the employer. If he ishorizontally mobile, it is possible that he may not be able to validate as anefficient technical worker.
With these assumptions in mind, another (H) was computed in whichthe horizontally mobile technical workers were left out (see Table IV).This increased the (H), and it remained significant.
The nine classifications of technical workers had previously been com-bined to form three categories of technical workers: service, manufactur-ing, and engineering. These categories were then subjected to the Kruskal-Wallis (H) one-way analysis, which yielded a significant (H). (See TableIV.) Since the initial analysis omitting the horizontally mobile workerdemonstrated that the significance was not artificial, this analysis was notrepeated with these categories. The analysis led to the conclusion thatnot only is there a difference in the formal education of technical workers,based on job classifications, but that the classifications can be rankedaccording to the formal education scale in Chapter 1 as follows:
1 plant maintenance2testing3instrument maintenance4design drafting5communications
Rank Order6radio and television7field service8research and development9computers
Formal Mathematics Background of the Technical Worker
It is to be expected that the amount of mathematics an individual hasstudied will correlate highly with the amount of formal education in hisbackground. The correlation of mathematics with education is .622 (seeAppendix C). The mean level of formal mathematics of the technicalworkers as a whole is through trigonometry. Formal mathematics, whenconsidered by job classifications, is shown in Table V. (Notice that researchand development and computer technical workers exceed the other classi-fications in the level of formal mathematics completed.)
To follow the same procedure as in the analysis of formal education,Kruskal-Wallis (H) was computed for level of mathematics by job classi-fication (see Table IV). An additional (H) was computed, leaving out thosetechnical workers who were horizontally mobile. The resulting (H) wassignificant at one percent (see Table IV).
This leads to the conclusion that the mathematical attainment of the

TA
BL
E V
FOR
MA
L M
AT
HE
MA
TIC
S O
F T
EC
HN
ICA
L W
OR
KE
RS
BY
JO
B C
LA
SSIF
ICA
TIO
N
Job
clas
sifi
catio
nth
anal
gebr
aA
lgeb
ram
edia
teal
gebr
aSo
lidge
omet
ryH
ighe
ral
gebr
aT
rigo
-no
met
ryA
naly
t-ge
oini
caltr
y
Dif
fer-
caer
ctui
tlis
Inte
gral
max
;B
eyon
dN
Mea
n le
vel o
fm
athe
mat
ics
Rad
io a
ndte
levi
sion
01
00
02
10
00
4H
ighe
r al
gebr
a
Plan
tm
aint
enan
ce1
10
10
00
00
03
Alg
ebra
Fiel
d se
rvic
e1
00
00
00
02
03
Tri
gono
met
ry
Des
ign
draf
ting
00
00
02
00
10
3'
Ana
lytic
alge
omet
ry
Tes
ting
23
22
314
22
20
32H
ighe
r al
gebr
a
Inst
rum
ent
mai
nten
ance
00
00
13
10
00
5T
rigo
nom
etry
Res
earc
h an
dde
velo
pmen
t0
11
00
37
47
629
Dif
fere
ntia
lca
lcul
us
Com
mun
icat
ions
01
20
02
20
10
8H
ighe
r al
gebr
a
Com
pute
r0
00
00
00
02
13
Inte
gral
cal
culu
s
N4
75
34
2613
615
790
1 1
Tri
gono
met
ry
v.IIM
IIMM
EN
OIN
INIM
IMO
MM
IIIIIS
MO
MIN
ION
IMM
IIIM
INN
OM
S,

PAMOECarmelMille2;35fftgettligtie.
36 / The Itok of Mathematics in Electrical-Electronic Technology
technical workers varies with the classification and, again, the classifica-tions can be ranked in terms of mathematical attainment. This ranking isthe same as the ranking on formal education.
There were five sources credited by the technical workers as havingcontributed to the ability to perform on the job. These were Armed Forces
TABLE VISOURCES CREDITED BY RESPONDENTS AS CONTRIBUTING MOST TO THEIR ABILITY
TO PERFORM ON THE JOB, BY JOB CLASSIFICATION
Job classification
Sources
On own Service Publicschools
Privateschools Industry N
Radio and television 0 0 1 1 2 4
Plant maintenance 0 0 1 0 2 3
Field service 0 1 2 0 0 3
Design drafting 0 1 1 0 1 3
Testing 4 9 2 3 14 32
Instrumentmaintenance 0 0 0 2 3 5
Research anddevelopment 7 3 6 0 13 29
Communications 0 4 0 0 4 8
Computer 0 0 1 1 1 3
N 11 18 14 7 40 90
training, public school training, private school training, classes held inindustry, and studying on their own (see Table VI). Anyone acquaintedwith these five methods of acquiring the technical skills would expect adiffering amount of mathematics dependent upon the method under whichthe technical worker had been trained. The Kruskal-Wallis (H) one-wayanalysis of variance was computed to determine whether this was the case(see Table IV). The analysis demonstrated that there was no significantdifference in the amount of mathematics dependent upon the source oftraining.
Of the 90 technical workers in the sample, 18 were upwardly mobile.

7777.-`7,77,,,^-7771.77.
°71
The Technical Worker / 37
It is impossible to demonstrate whether the achievement in mathematicscontributed to mobility, but it is possible to demonstrate whether there isa correlation between achievement in mathematics and mobility. Thecorrelation between achievement in mathematics and mobility for thetotal sample is .146.
This is to some extent misleading because mathematics achievementwas ranked on a continuum, whereas mobility was grouped as one of threeclassifications. To investigate the possibility that a correlation existed be-tween mathematics achievement and mobility and that the negative cor-relation previously mentioned was misleading, multiple correlations werecomputed in which job classifications and then age were held constant,while mathematics achievement was correlated with mobility.' These cor-relations were .285 and .322 respectively (see Table VII). In addition, afourfold correlation was computed for testing and for research and devel-opment workers (see Table VII). These two classifications were usedbecause the number of workers was large enough to permit the calculation,whereas the number in the other seven classifications was too small.
The correlations between mathematics achievement and vertical mo-bility demonstrates that the two do not vary together for the technicalworkers in the testing area, but they do vary together for the workers inresearch and development. This would seem to indicate that the researchand development technical workers, who are on the upper end of the rankorder, are vertically mobile when they possess more mathematics back-ground than their co-workers.
The fourfold correlations coupled with the multiple correlations demon-strated that the more mathematics the technical worker has, the morelikely it is that he will progress upward within the industry.
Age of the Technical Worker
From sociological studies about occupations it is generally concludedthat "the first job is a good predictor of the subsequent career" and that"mobility decreases with age." The correlation between mobility and age
5 The correlations used in this study are product-moment, multiple, and fourfoldcorrelations. In each case, normal distribution and a linear relationship are assumed.The function of a correlation is to measure the extent to which variables are related toone another.
Correlations can vary from minus one to plus one. The si ii cance of the correlationis dependent upon the number of observations being corre ted. If a correlation is sig-nificant at five percent, this indicates that the variables being measured vary with oneanother to the extent that this relationship could happen by chance five percent of thetime.
The product-moment correlation is based upon raw scores and the multiple corre-lations are in turn based upon the product-moment correlations. The fourfold (tetra-choric) correlation is based upon dichotomized variables.
Seymour Martin Upset and Reinhard Bendix, Social Mobility in Industrial Society(Berkeley and Los Angeles; University of California Press, 1959), pp. 173-74.

38 / The Role of Mathematics in Electrical-Electronic Technology
for the total sample was .292 (see Appendix C), which would seem tosuggest that the technical workers in this study follow the pattern of mostof the industrial workers, and that the statements quoted above are ap-plicable to the technical workers in this study.
Electronics education in the California public schools has been receivingmore and more attention during the last decade. Considering the varietyof sources from which the technical workers could receive training and
TABLE VIICORRELATION OF SELECTED INTERVIEW DATA FOR TECHNICAL WORKERS
Multiple CorrelationsC Classification M Mathematics Mo Mobility A ... Age
Ec.m.mo .285t with N ... 90RA.M.110 .322* with N r. 90
Fourfold Correlations
Fourfold correlations N
Between technical worker's age (split at the median) and sourceof training (public schools and other training agencies) 90 .184
Between mathematics (above or below the median) and mobility(vertical or not vertical) for test 32 .028
Between mathematics (above or below the median) and mobil-ity (vertical or not vertical) for research and development 29 .596
Betwr-n mobility (stable and unstable) and age (above andbelow tne median) 90 .334
Between mobility (horizontal and vertical) and age (above andbelow the median) 41 .032
Significant at 1%.f Significant at M.
the age range of the technical worker, it was not surprising that only 16percent of the workers in the sample credited the public schools withhaving contributed most significantly to their ability to perform on the job(see Table VI). For this reason, a fourfold correlation was computed todetermine whether there was any correlation between the age and thesource of training, which proved to be .184 (see Table VII). This fourfoldcorrelation of .184 differs with the correlation between age and the areaof training as reported in Appendix C, which is .057, because the fourfoldcorrelation is a dichotomous correlation comparing the technical workerswho received their training in public schools with the technical workerswho received their training elsewhere, whereas the correlation reported inAppendix C is between age and all five areas as they were listed in theinterview reporting form. Hence, it is concluded that the public schoolsare increasing in importance in terms of their contribution to the trainingof technical workers.

The Technical Worker / 39
Factors Influencing Occupational Choice of the Technical Worker
There were two considerations in determining how the technical work-ers became interested in electronics to the point where they sought em-ployment in the industry. The first was circumstantial influence, and thesecond was personal influence. The distribution of sources of interest by
TABLE VIIISOURCES OF INTEREST IN ELECTRONICS
Job °Unification None Service Hobby School Job N
Radio and television 4 0 0 0 0 4
Plant maintenance 1 2 0 0 0 3
Field service 2 1 0 0 0 3
Design drafting 0 3 0 0 0 3
Testing i 11 9 2 3 32
Instrumentmaintenance 1 0 2 1 1 5
Research anddevelopment 4 7 13 3 2 29
Communications 0 2 6 0 0 8
Computer 1 2 0 0 0 3
N 20 28 30 6 6 90
classification is shown in Table VIII, by personal influence in Table IX.Hobbies have played a significant role in the development of the interestin electronics and in some cases have contributed to the ability of thetechnical worker to perform the job. There were only seven instances wheretechnical workers named teachers or classes as having contributed to theinterest in electronics.
Interest and influences which led prospective technical workers to seekemployment in the electrical-electronics industry turned out to be as com-plicated and varied as they are for workers in other avenues of employ-ment.
One-third of the interviewees credited hobbies as the source of interest.Nearly one-third of the technical workers indicated their source of inter-
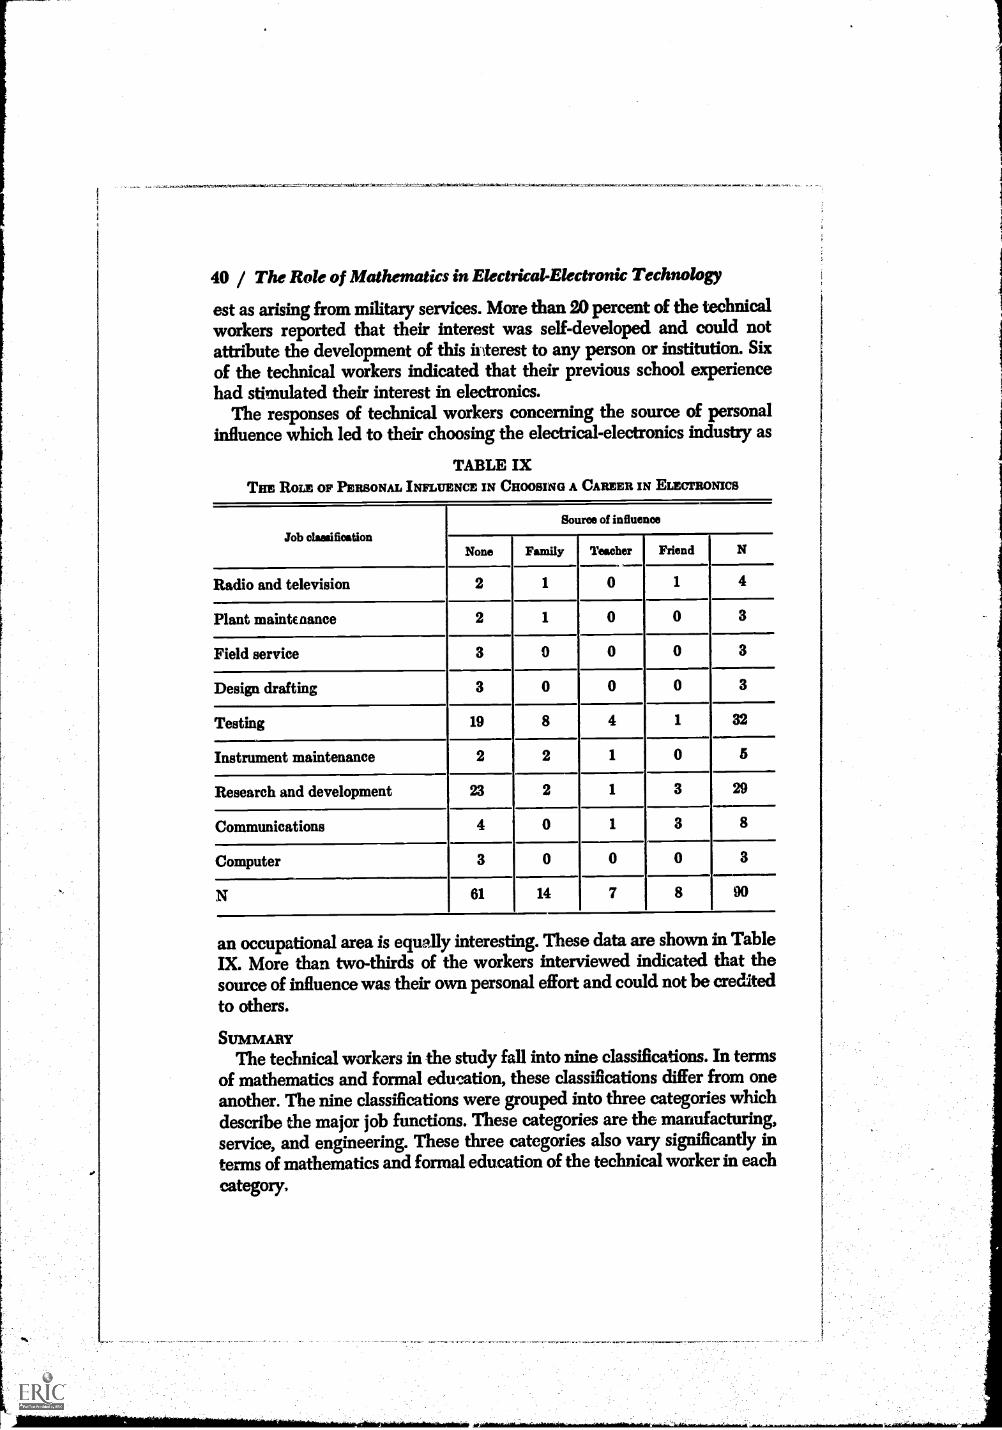
40 / The Role of Mathematics in Electrical-Electronic Technology
est as arising from military services. More than 20 percent of the technicalworkers reported that their interest was self-developed and could notattribute the development of this Merest to any person or institution. Sixof the technical workers indicated that their previous school experiencehad stimulated their interest in electronics.
The responses of technical workers concerning the source of personalinfluence which led to their choosing the electrical-electronics industry as
TABLE IXTHE ROLE OF PERSONAL INFLUENCE IN CHOOSING A CAREER IN ELECTRONICS
Job classification
Source of influence
None Family Teacher Friend N
Radio and television 2 1 0 1 4
Plant maintenance 2 1 0 0 3
Field service 3 0 0 0 3
Design drafting 3 0 0 0 3
Testing 19 8 4 1 32
Instrument maintenance 2 2 1 0 5
Research and development 23 2 1 3 29
Communications 4 0 1 3 8
Computer 3 0 0 0 3
N 61 14 7 8 90
an occupational area is equally interesting. These data are shown in TableIX. More than two-thirds of the workers interviewed indicated that thesource of influence was their own personal effort and could not be creditedto others.
SUMMARYThe technical workers in the study fall into nine classifications. In terms
of mathematics and formal education, these classifications differ from oneanother. The nine classifications were grouped into three categories whichdescribe the major job functions. These categories are the manufacturing,service, and engineering. These three categories also vary significantly interms of mathematics and formal education of the technical worker in eachcategory,

The Technical Worker / 41
The classifications can be ranked in terms of the amount of formal edu-cation the technical workers possess and the amount of mathematics theyhave studied. Both formal education and mathematics are related to theage of the technical worker, as is mobility. Technical workers become inter-ested in electronics in four ways: through military service experience,through job experience, through hobbies, and through school experience.There seems to be evidence of some contribution on the part of educa-tional institutions in developing the interest in electronics. This, however,did not come about through any conscious effort toward vocational guid-ance on the part of the institutions. The technical workers do not differ inthe amount of mathematics dependent upon where they received thistraining.
Chapter 3
THE INSTRUCTOR
Instructor Workshops
It is obvious that the electronics instructor holds a commandingposition in relation to the mathematical competencies which students canultimately bring to their industrial employment. The instructor's closerelationship to the industry he serves and to the student preparing to enterthat industry are valuable components to be considered in research con-cerning the role of mathematics in the electrical-electronics industry.
Forty-five of California's junior colleges offered electronics programs athe time of the study. In order to consult with as many junior collegeelectronics instructors as possible, three regional workshops were con-ducted during the fall of 1960. 'Thirty-three full-time electronics instruc-tors, representing 27 junior colleges, participated in these meetings.
The major purposes of the workshops were: (1) to discuss the natureand progress of the research with instructors and administrators; (2) tosolicit the advice and suggestions of each group; (3) to test the Q-sort tech-nique and to interview instructors; and (4) to obtain information andrecommendations about teaching aids used in developing mathematicalconcepts in electronics classes.
The 33 instructors who participated in the workshops were asked tosort the cards in terms of the extent to which they would expect graduatesof their programs to encounter and master the mathematical skills andconcepts of the problems involved. As in the interviews with the technicalworkers there was a discussion of the problems in the sort after each ofthese workshops. A further refinement of the Q-sort developed from theexperience of these workshops. At this point, the Q-sort deck was suffi-ciently refined and reflected the mathematics continuum well enough tobe used empirically in an investigation of the needed mathematical com-petencies in the electrical-electronics industry in California.
42

The Instructor / 43
Following the regional workshops, a statewide workshop was held atU.C.L.A. to consider the advisability of developing a standardized test forpredicting student success in junior college electronics programs and thedesirability of self-instructional devices for remedial areas of mathematics.
The workshops provided an opportunity for the instructors to exchangeideas on instructional materials and practices. The instructors also dis-cussed at length their individual mathematics prerequisites for enteringelectronics students. From this discussion agreement was reached thatjunior colleges with advanced algebra as prerequisite for students enteringelectronics were able to cover more theory in the electronics courses thanthose that did not have such prerequisites. The lack of prerequisites inmathematics, it was agreed, handicapped the electronics program by re-quiring remedial work in mathematics.
From this agreement came the recommendations to the research projectto investigate the efficacy of self - instructional techniques in the area ofmathematics considered to be of a remedial nature for electronics students.This led to the establishment of an experimental study at BakersfieldCollege which is described in detail in Chapter 5.
The feasibility of developing a standardized test for predicting students'success in junior college electronics programs was discussed. It was recom-mended that the test include the following areas of mathematics:
1. Simple Arithmeticlowest common denominator
addition of common fractionsaddition of mixed numbers
converting fractions to deci-mals
converting decimals to frac-tions
percentagenegative numbers
ratio and proportion2. Visual Mathematical Skills and
Reasoningsimple syllogisminteipretation of graphsuse of tablesMarkov-chain
3. Units and MensurationareavolumeMme rateangular
4. Related Conceptspowers of ten
exponentslogarithms
maaipulation of radicalsadding literal numberssubtracting literal numbers
multiplying literal numbersdividing literal numbers
The test which was developed from the recommendations had 75 mul-tiple choice items (see Appendix B) and was used as the pre- and post-testin the experimental study (see Chapter 6).
Another outcome of the workshops was the testing of the Q-sort forvalidity.
.......,-...-n-
44 / The Role of Mathematics in Electrical-Electronic Technology
Analysis of Interview DataData were collected from 29 junior college instructors of elec-
tronics in a manner similar to that for technical workers. The instructorsreported on their work experience in industry, their formal education, andtheir mathematics background. The study of their mobility was based upontheir industrial experience rather than upon their teaching experience.
A correlation analysis of the interview data was made to demonstratethe extent to which the variables investigated in the interview varied withone another. In addition, Kruskal-Wallis (H) one-way analysis of variancewas computed to determine whether the instructors varied significantlyin the amount of formal education and mathematics when grouped by jobclassification.
Fourfold correlations and multiple correlations were computed to inves-tigate the relationship between mobility, age, and educational backgroundfor the instructors in total and by job classifications.
The t-test was used to measure the significance of the difference in themean amount of formal education and formal mathematics backgroundcomparing the total sample of instructors with the total sample of technicalworkers.
Electronics Experience of Instructors
The distribution by job classification of the industrial experience of theinstructors is shown in Column N of Table I. Compared with the distribu-tion of the technical workers by classification, it is apparent that the re-search and development area is underrepresented in the teaching ranksas is the testing area. The fact that 41 percent of the instructors gainedtheir electronics experience in radio and television repair may be discon-certing for the electronic industry but may be justified in terms of thenumber of radio and television repairmen employed in the State.
The reason for the large number of instructors with radio and televisionrepair backgrounds has not been explored in this study, but it is very likelydue to the historical development of electronics. Just as radio and thentelevision were the forerunners of the more complex electronic systems in
use today, radio and television repair classes preceded the more ambitioustechnical program in the junior colleges of California.
1 The t-test is used to determine the probability of the means for two groups differ-ing by chance. Normal distribution is assumed. The si canoe of the t-reitio is de-pendent upon the size of the sample being tested, an the degrees of freedom areequal to the total sample minus the number of groups being compared.
If ft- ratio is significant at the five-percent level, this indicates that the differencethat exists between two groups being tested could have occurred by chance five timesout of a hundred.

TABLE I
FOR
MA
L E
DU
CA
TIO
N O
F IN
STR
UC
TO
RS
IN T
HE
SA
MPL
E B
Y J
OB
CL
ASS
IFIC
AT
ION
Job
clas
sifi
catio
nH
igh
scho
olH
igh
1131
11:1
A A
or
equi
vale
ntA
.A. p
lus
equi
vale
nteq
uiva
lent
M.A
. Phu
NM
ean
Yea
rsof
for
mal
educ
atio
n
Rad
io a
nd te
levi
sion
10
23
42
012
15.25
Plan
t mai
nten
ance
01
10
00
02
13.5
0
Fiel
d se
rvic
e0
01
02
00
315.33
Tes
ting
00
00
10
01
16.0
0
Inst
rum
ent m
aint
enan
ce0
00
00
01
118
.00
Res
earc
h an
d de
velo
pmen
t0
00
12
00
315.67
Com
mun
icat
ions
01
01
00
02
14.00
Com
pute
r0
00
00
10
117
.00
Ele
ctri
cian
00
01
11
14
16.50
N1
24
610
42
2915
.40
%3.4
6.9
13.8
20.7
34.4
13.8
6.9
100

46 / The Role of Mathematics in Electrical-Electronic Technology
Formal Education of the Instructors
The mean amount of formal education of the instructors in total andby job classification exceeds that of the technical workers, as would beexpected. However, it still seemed necessary to test the significance of thedifference of the mean amount of formal education (instructors compared
TABLE IITESTS OF SIGNIFICANCE FOR SELECTED INTERVIEW DATA
ON ELECTRONICS INSTRUCTORS
t-test
t test for significance of the difference in the mean amountof formal education comparing the total sample of technicalworkers with the total sample of instructors
t s test for significance of the difference in mean formal mathe-matics backgrounds comparing total sample of technicalworkers with total sample of instructors
t s test for significance of the difference in mean formal mathe-matics backgrounds of total sample of instructors with tech-nical workers in research and development
t Degrees offreedom
5.97* 117
2.91* 117
.62 56
Kruskal-Wallis (H)
Formal education by classification of industrial experience ofinstructors
Formal education by mobility
Formal education (above and below the mean) comparingupwardly mobile instructors with all others
H s ofDegreefreedom
10.44 8
1.43 2
1.43 1
Significant at 1%.The significance of the t-ratio is dependent upon the size of the sample being tested, and the degrees of
freedom are equal to the total sample minus the number of groups being compared.
with technical workers). It was demonstrated that this difference was sig-nificant (see Table II). Based upon the random method by which theinciuctors and technical workers were selected, it can be concluded thatelectronics instructors in the California public junior colleges possess sig-nificantly more formal education than technical workers currently em-ployed in the industry. The presence of electricians in the instructor group,the absence of design draftsmen, and the small N in all classifications,except radio and television, makes further comparison of the formal edu-cation of the instructors with technical workers undesirable.
A Kruslcal-Wallis (H) one-way analysis of variance was computed for

TA
BL
E I
IID
IST
RIB
UT
ION
OF
MA
TH
EM
AT
ICS
BA
CK
GR
OU
ND
OF
INST
RU
CT
OR
S B
Y I
ND
UST
RIA
L E
ICPE
RIE
NC
E
Job
clus
ific
atIo
nA
lgeb
raSo
lidge
omet
ryT
rigo
-no
met
ryA
naly
tical
geom
etry
Dif
ferl
-ar
iaca
lcul
usIn
tegr
alca
lcul
usB
eyon
dN
Mea
n m
ath
back
grou
nd
Rad
io a
nd te
levi
sion
10
12
35
012
Ana
lytic
al g
eom
etry
+
Plan
t mai
nten
ance
00
10
10
02
Ana
lytic
al g
eom
etry
Fiel
d se
rvic
e0
00
02
10
3D
iffe
rent
ial c
alcu
lus
4-
Ele
ctri
cian
00
00
13
04
Inte
gral
cal
culu
s
Tes
ting
00
00
10
01
Dif
fere
ntia
l cal
culu
s
Inst
rum
ent m
aint
enan
ce0
00
00
v1
01
Inte
gral
cal
culu
s
Res
earc
h an
d de
velo
pmen
t0
10
01
01
3D
iffe
rent
ia'-
calc
ulus
Com
mun
icat
ions
00
20
00
02
Tri
gono
met
ry
Com
pute
r0
00
10
00
1A
naly
tical
geo
met
ry
N1
14
39
101
29D
iffe
rent
ial c
alcu
lus

':'10fsgOVI
48 / The Role o7 Mathematics in Electrical-Electronic Technology
formal education by classification of industrial experience of the instruc-tors, and by mobility and education (see Table II). Even though the formaleducation of the instructors ranged from high school to beyond the Masterof Arts degree, it was concluded that there was no difference when theywere treated as groups within each job classification. There was demon-strated relationship between education and mobility for the electronicsinstructors.
Formal Mathemttics Background of the Instructors
The amount of formal mathematics background of the electronic in-structor is shown in Table III. As with the technical worker, a high corre-lation existed between mathematics and formal education (see AppendixC). A comparison of the mean amount of formal mathematics backgroundof the instructor with the mean of the technical worker by a t-test demon-strated a significant difference (see Table II). This indicates that for the29 instructors in the study and the 90 technical workers the mean amountof formal mathematics in the background of the instructors is greater thanthe mean amount of formal mathematics in the background of the technicalworkers, and this difference would not be expected to exist by chance.
There were 29 instructors in all and 29 technical workers in the researchand development classification. The mean amount of formal mathematicsfor the instructor was between analytic geometry and differential calculus.The mean amount of formal mathematics for the technical worker in re-search and development was slightly above differential calculus. A t-testof the significance of lids difference was computed (see Table II) whichproved to be less than significant
SUMMARY
The only reliable conclusion that can be reached from the interviewdata concerning instructors is that there is no significant difference in theamount of formal education and the amount of formal mathematics back-ground of the instructors when considered in groups by source of indus-trial experience.
Comparing instructors with technical workers leads to the conclusionthat the instructors have significantly more formal education and moreformal mathematics than technical workers. However, when comparingthe instructors in total with the technical workers in research and develop-ment, it is found that the technical workers have more formal mathematicsin their backgrounds than do the instructors, even though this differenceis not significant. Assuming that the instructor should know significantlymore than his students are required to learn, it would appear that onlythose instructors with mathematics background through the calculusshould be involved in curricula intended to train technical workers inresearch and development or for computer occupations.

Chapter 4
2neassesr,m1,, -rzl_...--rmooKairmmalsisaszwanstaiirerralaNOVIONOWNWIN .
MATHEMATICAL COMPETENCIESNEEDED BY TECHNICAL WORKERS
Administering the Q-sort and Interviewing theTechnical WorkersThe instrument for investigating the mathematical competencies
needed by technical workers employed in the electronics industry in Cali-fornia was the Q-sort. The methods by which the instrument was built andvalidated are described in detail in Chapter 1.
The general pattern of the interview and Q-sort administration was asfollows:
The men involved were assembled in a conference room on the industry'spremises and introduced to the investigator by someone from the manage-ment. In the presence of the management's representative, the individualsto be interviewed were given a brief explanation of the purpose of theresearch and were assured that all responses were confidential and wouldremain anonymous. None of the materials collected were coded by name(ID numbers were assigned on the spot to keep the interview and Q-sortmaterial together). The respondents were also assured that managementwould not at any time see nor receive a report of any of the informationfrom the interview or Q-sort, but that management would receive a copyof the final report in which it would be impossible to identify individuals.Immediately before the interview began, the respondents were told thatparticipation was entirely voluntary and should they elect to do so, theywere free to leave at any time, and no mention would be made of theirdesire not to participate. Once the respondents had started on the Q-sort,every possible measure was taken to avoid interruption and communica-tion among them. The investigator also made it a point to assure sufficienttable or desk space for each respondent to distribute the cards. All of theinterviews were conducted by the same person and the information
49
winerprowyPrerpromip.r,
---wwwirintitiallassaffiamigissimlf=5
50 / The Role of Mathematics in Electrical-Electronic Technology
gathered from the interview written on the interview schedule in the pres-ence of the respondents (see Interview Schedule, Appendix B).
The Recommended Order of InstructionIn addition to the sort made by the technical workers in industry,
which was determined by the extent to which they encountered the math-ematical skills or concepts involved in the problems on the cards, a sortto define the recommended order of instruction was made by instructorsin the area of mathematics. They sorted the mathematical skills and con-cepts into the order in which they would present them if they were toteach the entire range of mathematics involved. This allowed for a com-parison between the sorts made by the technical workers and the logicalsequence of mathematics as seen through the eye of the mathematicsinstructor.
Technical Workers Assessing the MathematicalCompetencies NeededEven though there was significant agreement among technical
workers as a whole concerning the mathematical concepts or skills needed,the possibility existed that this may have been distorted by the presence oftechnical workers with very little mathematics background who, in theprocess of sorting, relegated those problems that were beyond their under-standing to the least needed end of the sort. If this were the case, it wouldbring about an apparent agreement with the recommended order of in-struction, because the more complex mathematical processes are taughtafter the simpler ones have been mastered. This does not mean that thetechnical worker is unsuited for the chore of determining the mathematicsneeded on his job, but rather that the sorts need to be analyzed furtherto demonstrate whether the consensus holds up. The mean correlation forthe Q-sort by job classification exceeded the mean correlation for the totalgroup of technical workers in each case (see Appendix C). A similar resultwas obtained when technical workers were grouped by level of mathe-matics. Grouping the 28 technical workers with mathematics backgroundsin the calculus or beyond resulted in a range of correlations from .968 to.512 with a mean of .409. At the other end of the continuum, the fourtechnical workers with less than high school algebra in their mathematicsbackgrounds had a mean Q-sort correlation of .454.
The increase in mean correlations, when technical workers were groupedaccording to their mathematics background, seemed sufficient to concludethat the mathematics used on the job varle4 with job classification andwith the amount of mathematics in the background of the technical work-ers. The more mathematics mastered, the more mathematics would beused on the job.
h.-
.-._

Mathematical Competencies Needed / 51
Analysis of the Q-sortBy combining the information from the interview and the Q-sort,
it was possible not only to identify the essential mathematics, the usefulmathematics, and the mathematics of questionable value in the industry,but also to investigate: (1) the extent to which mathematics contributedto occupational mobility; (2) the extent to which formal mathematics,formal education and background of the respondent contributed to themathematics used on the job; (3) the difference in the mathematical skillsneeded in the various classifications in the industry.
A program was written for the 709 computer atWestern Data ProcessingCenter to perform the Q-sort correlations' The program provided 6430correlations, with a range from .750 to +.968, with a mean correlation of.331. As was hypothesized at the beginning of the study, most of the dis-agreement on the mathematics needed was between technical workers indifferent job classifications. When the Q-sort correlations were groupedaccording to job classifications, the negative range decreased and themean correlation increased. A good example of this is the matrix of cur -relations on technical workers in research and development. Here therange was from .649 to +.742 with a mean correlation of .359. There were32 negative correlations in this matrix, 29 of which were with technicalworker No. 23, i.e., he contributed greatly to the diminishment of the meancorrelEtion. To measure the significance of the agreement between sorts,the mean correlations for each job classification and for the instructorswere converted into the coefficient of concordance (W)" and tested forsignificance' (see Table I). Interpreting the matrix of Q-sort correlations
The zorrelation of Q-sort data is basically a rank order correlation. The valuegiven to each of the items in the sort is taken to be its rank, and the correlation is thencomputed and corrected for ties (the correction for ties is constant in a set of Q-sortdata).
The Q-sort correlation compares the ranks assigned to all items by one respondentwith the ranks assigned by another respondent. These correlations are computed forall possibly; combinations among the respotdents. The significance of a Q-sort corre-lation is dependent upon the number of items in the sort and is constant for a givenset of Q-soft data.
If the Q-sort correlation is significant at the five-percent level, this indicates that theranks assigned by the two respondents for whom the correlation is being reported arerelated to each other to the extent that this relationship would occur by chance fivetimes in a hundred. Therefore, if the correlation is positive and significant at the five-percent level, it can be concluded that the agreement demonstrated between the sortsof the two respondents could have occurred by chance only five times in one hundred.
2 Allen L. Edwards, Statistical Methods for the Behavorial Sciences (New York: Rein-hart & Company, Inc., 1954), p. 412.
The coeffi?.ient of concordance has been demonstrated to have a linear relationshipto the mean of all the possible correlations between rank order data. The value ofthis statistic is that it allows a composite statement to be made about the overall agree-ment or disagreement demonstrated by the individual correlations.
The coefficient of concordance can vary from zero to one and the significance of the

52 / The Role of Mathematics in ElectricatZlectronic Technology
for the total group of technical workers and for the job classification groupis quite difficult, unless there are some statistical means used to draw allof the sorts into a composite. For this reason each job classification wasconsolidated into a resultant sort.' The correlations between the resultantsranged from .993 to .502 with a mean of .355. Technical workers in re-search and development and in testing correlated at .993 and .870 respec-tively with the resultant of the total group. This was to be expected sincethey were the largest groups and contributed the most to the total resultantQ-sort.
TABLE ICOEFFICIENT OF CONCORDANCE FOR Q-SORTS BY JOB CLASSIFICATION
Testing W = .365 F = 17.27$Field service W = .694 F = 4.54$Plant maintenance W .702 F= 4.71$Instrument maintenance W = .631 F = 6.84$Research and development W = .398 F = 18.27$Radio and television W = .729 F = 8.07$Design drafting W = .733 F = 5.49$Communications W = .491 F = 6.76$Computer W = .402 F = 1.34*
Total W = .338 F = 45.44$
im significant at 10%.t la significant at 1%.
The reason for soliciting a number of responses to the Q-sort was toinsure a more accurate statement concerning skills or concepts needed onthe job by technical workers. To measure the reliability of the averagerank assigned each item by the groups within each job classification,Horst's' reliability coefficient was computed .° These are reported inTable II.
coefficient can be tested by converting it to an F-ratio and, therefore, the number ofitems and the number of respondents influence the significance of the coefficient.
If there is a positive coefficient of concordance which is significant at the five-percentlevel, the total agreement demonstrated could have occurred by chance in five casesout of a hundred.
For further discussion of the use of the coefficient of concordance with Q-sort datasee:
William J. Schill, "The Use of the Q-Technique in Determining Curriculum Con-tent," California Journal of Educational Research, XII, No. 4 (Sept. 1961), 178-184.
Joseph E. Morsh, "The Q-Sort Technique as a Group Measure," Educational andPsychological Measurements, Vol. XV, No. 4 (Winter, 1955), pp. 390-95.
5 Sidney Siegel, Nonparametric Statistics for the Behavorial Sciences, (New York:McGraw-Hill Book Company, Inc., 1936), pp. 184-92.
It is generally conceded that the average of two or more estimates of an unknownparameter is more likely to approximate the true value than a single estimate. The

Mathematical Competencies Needed / 53
TABLE IIRELIABILITY COEFFICIENT OF RESULTANT SORTS
Communications .853
Plant maintenance .848
Radio and television .875
Design drafting .784
Computers .451Field service .810
Instrument maintenance .812Testing .944
Research and development .942
Instructors .971
Results of the Q-sortThe purpose of the statistics used in this chapter was to demon-
strate the agreement among technical workers by job classification con-cerning the placement of mathematical skills or concepts contained in theQ-sort and to measure the reliability of the resultant sorts for each group.The agreement was significant and the reliability coefficient was highenough to insure meaningful resultant distributions.
Table III contains the 63 mathematical skills or concepts included in theQ-sort arranged in the recommended order of instruction. Following eachitem is the placement (essential, useful, questionable) given that item bytechnical workers in the nine job classifications and by the instructors ofelectronics who participated in the study.
The forced normal distribution of the mathematical concepts or skillswas divided into "essential," "useful," and "of questionable value," bymaking the cut-off points approximately one standard deviation on eitherside of the mean. This placed the 14 concepts or skills on the most similarend of the distribution in the "essential" category and 14 concepts or skillson the least similar end of the distribution in the "of questionable value"category. The remainder in the center of the distribution comprised the"useful" category.
SunThere was unanimous agreement among the technical workers on the
placement of four mathematical concepts or skills. All agreed that percent
statistic used to assess the reliability of the average ranks assigned to the items in theQ-sort was Horses reliability coefficient.
The number of items in the sort and the number of respondents are included in thecomputation; however, there is no statement of probability connected with the co-efficient of reliability.
ti

TABLE IIIPLACEMENT OF MATHEMATICAL CONCEPTS OR SKILLS BY JOB CLASSIFICATION
In-strips-tors
ItoralD.
Testing RadioandT.V
Com -`mum-cations
Plant!mint.
Inst.maint.
Fieldservice
Draft-ins
Com-puter
Conversion of fractions to decimals E E E E E E E E E U
Percent calculations of tolerance. E E E E E E E E E E
Changing percentage to decimal r E E E E E E E E A U
Conversion from metric to American measuring system E E E U U U E E E E
Addition of degrees and minutes (mensuration) U U U U E E U E U TT
Area approximation ,, U U u u u u u u u uGraphical interpretation U U E U U U U U U ..Square root long-hand method E E I% E E E U U E U
Division with signed numbers E E E E U E U E E U
Powers of signed numbers E U U E E E E E E U
Scientific notation U E U II U U E E U U
Estimation of arithmetic problems U E U E E E U U U E
Multiplication with exponents E E E E E E E E E E
Division with exponents E '4 E E E E E E U U
Raising to a power with exponents E E E E U E E E E U
Use of negative exponents E /3 E is E U E U E E
Extracting a root with exponents U U U .. U U U U U ..Use of fractional exponents U U U U U U E U .. U
Solution of first degree equations U U U U U U U U E U
Ratios E E E E U U E E E E
Solution of second degree equations E U E E E E B E U E
Pythagorean Theorem E E E E E E E U U U
Solution of simultaneous equations U U U U .. U U U U E
Graphic solution of equations U U U U U U U U U U
Factoring U U U U U U U U U U
Special products U U U U U U U U U ..Determinants .. U U U .. U U .. ..Quadratic formula U U U U U .. U ri U ..Completing the squareilnntia nf faiferlati numharo artrallirlin_r tt fta,"+"11A
U U U U U U U ETs
U
Logs to Dalie zen . . . .
Multiplication with logs U U U U U U U U U
Division with logs U U U U U U U .. U U
Powers with logs U U U U U U U U U U
Roots with logs U U U U U U U U U U
Application of sine function of acute angles U U U .. U U U U U U
Application of cosine function of acute angles U U U U E U U U U U
Application of tangent function of acute anglesInterpolation of tables
UU
UU
UU
UU
UU
UU
UU
UU
UU
UU.
Application of Law of Sines ... U U U U U U U U U U
Application of Law of CosinesSolution of right triangles
UU
UU
UU
UU
UU
UU
u..
U..
EU
UU
Use of radians in angular measurement u u U U U U B . U U
Addition of vectors in polar form U U U U U U U .. U ..Addition of vectors in rectangular form U U U U U U .. .. U ..Multiplication of vectors U U U U U U U U U . ,
Division of vectors in rectangular form U U .. .. U U U U U ..
Functions of half angles U U U U .. U .. U U U
Functions of twice angles U U .. U U U U U U U
Law of Tangents U U U U
Identities U U U
Series and progressions .. .. U .. U .. U ..Use of natural logs U U U .. U U U .. U U
Slope-point form for equations U U U . . U U U .. U U
2-point form for equations U U U .. U U U .. U U
The differential .. U .. .. U .. U U B
Higher order derivatives U U U U U .. U U .. U
Curve analysis . U 4
Fundamental Integral Theorem .. .. .. .. .. .. .. U
Integralas an area U
Double and triple integrals .. .. .. .. .. .. .. ..
Binary arithmetic .. .. U .. .. U U .. B
Boolean algebra U U B
KEY: E essential: U useful: Blank aueetionable.

56 / The Role of Mathematics in Electrical-Electronic Technology
calculations of tolerance, multiplication with exponents, and changingpercentage figures to decimal figures were essential, and double and tripleintegrals were of questionable value. The disagreement on the neededmathematical competencies or skills took the form of shifting the conceptsor skills from "essential" to "useful" and from "useful" to "questionable"and vice versa. The technical worker in computer occupations was theonly one who listed mathematical skills considered to be of questionablevalue by technical workers in the other job classifications as being essential.In the case of this worker, binary arithmetic and Boolean algebra wereconsidered "essential" to perform on the job, whereas these competencieswere considered "useful" by only a few of the other workers, and of ques-tionable value by most. Binary arithmetic and Boolean algebra for com-puter occupations are exceptions to the rule that the needed mathematicalcompetencies follow the logical order of the mathematics continuum, andeven here, such workers need, in addition to binary arithmetic and Booleanalgebra, the higher mathematical skills built upon the fundamental arith-metic and algebraic processes.
It may seem that the range in correlations between the Q-sort for thetechnical workers individually and the resultants by job classifications isan indication of lack of agreement concerning what mathematics is neededfor the technical worker as a whole or for a particular job classification.This is not the case. The statistical tool used to assess the extent to whichtechnical workers agreed on needed mathematics was Kendall's coefficientof concordance (W). The agreements by job classification and for all tech-nical workers were significant at one percent in every case, except for theworkers engaged in computer occupations, in which case it was significantonly at the 10-percent level (see Table II). Not only do the technical work-ers agree on the mathematics needed to perform on the job, but they alsoagree with the recommended order of mathematics. The range of correla-tions between technical workers and the recommended order is from .627to .081 with a mean correlation of .523.
The most significant aspect of the analysis of the Q-sort data was thefinding that as a whole technical workers ranked the mathematical skillsor concepts from "essential" to "questionable" in the same order in whichthe instructors of mathematics ranked the mathematical concepts or skillsinto their recommender' sequence of teaching.
It was significant also that the rank order of the mathematical skills orconcepts designated by technical workers with similar mathematics back-grounds correlated highly an led to the conclusion that the amount ofmathematics used by the technical worker on a given job was dependentupon the job classification and also upon the amount of mathematics theparticular worker had studied.

Mathematical Competencies Needed / 57
Not only do the technical workers agree that the order of need of mathe-matical competencies is much the same as the recommended order ofteaching mathematics, but the electronics instructors also agree. Electronicsinstructors were asked to sort the Q-sort cards into a forced normal dis-tribution in the order in which the problems were similar to those theirgraduates were expected to master. The correlations between instructorsorts and the recommended order of instruction ranged from .774 to .351with a mean correlation of .619.
_. ;;
Chapter 5
THE EXPERIMENTAL STUDY
Statement of the ProblemThe 45 public junior colleges in California having programs in
electronic technology differ greatly in the amount of mathematics requiredfor entry and the amount of mathematics included in the curriculum.
One of the outcomes of the instructor workshops (discussed in Chapter3) was the recommendation that an experimental program be conductedto measure the efficacy of self-tutoring materials in mathematics whichcould be used for review or remedial purposes.
Without exception, the instructors in the workshops saw the need for amore uniform mathematical background of the electronics students. Insome cases junior colleges accomplish a more homogeneous grouping byhaving mathematics prerequisites for entry into the electronics programs.In other cases junior colleges are faced with the problem of providing theelectronics student with the necessary mathematical background concur-rently with the study of electronic theory.
If self-instructional materials could remedy mathematical deficiencies,it would enhance the instructional process in electronics. A method ofself-instruction that has been widely used is one which requires eachstudent to review the necessary mathematics on his own time and torn therequired work in to the instructor.
The experimental study compared student achievement under the tra-ditional review method with student achievement under the newer self-instructional materials method as a means of review or remediation.
This study was limited to two classes taught by the same instructor atBakersfield College.
Method of Student AssignmentBoth the experimental and control classes consisted of second
semester technical mathematics students enrolled in Bakersfield College.
61

62 / The Role of Mathematics in Electrical-Electronic Technology
They were assigned to the classes at random within the limits of the col-lege program. Programming proved to be a rather severe limitation. Theinitial distribution is shown in Table I, and the final distribution, afterdrop-outs and program changes, is shown in Table II.
TABLE IINITIAL DISTRIBUTION OF STUDENTS IN EXPERIMENTAL
AND CONTROL CLASSES
EmzePnetr jai
classControl
&a s N
Electronics majors 24 20 44
Other majors 24 20 44
N 48 40 88
TABLE IIFINAL DISTRIBUTION OF STUDENTS IN EXPERIMENTAL
AND CONTROL CLASSES
Expert-mental Control
cladslass N
Electronics majors 13 2'7 40
Other majors 15 9 24
N 28 36 64
Conduct of the ClassesAn experimentally oriented and competent instructor conducted
two sections of technical mathematics dealing with identical subject mat-ter. A self-tutoring machine was provided for the experimental group andthe students in that group were instructed in the use of the device andwere required to spend a minimum of 12 hours on assigned materialsthroughout the semester.
T ho assignments consisted of a review of mathematical concepts alreadycovered in the lecture section of the class. The students used the self-tutoring machine on the basis of a schedule set up by the instructor. Thetime that they were exposed to the self-tutoring materials was recorded.
The control group did not have access to the self-tutoring device butreviewed the same mathematics in the customary homework assignmentmethod. Homework review assignments corresponded with the assign-
......

The Experimental Study / 63
ments made on the self-tutoring machine. The experimental group wasrequired to view the rnatetials on the machine, and the control group wasrequired to turn in homework assignments from day to day.
Material CoveredListed below on the right is the instructor's outline of the material
covered in the first and second semester of technical mathematics. Listedon the left is the material covered under self-tutoring materials.
SELF-TUTORING MATERIALS
1. Introduction to Algebraa. Positive rational numbersb. Negative numbersc. Definition of equationd. Fundamental assumptionse. Commutative Law of Additionf. Associative Law of Additiong. Commutative Law of Multiplicationh. Distributive Law of Multiplicationi. Laws of signs
2. Algebraa. Factorsb. Exponentsc. Decimals
3. Algebraa. Algebraic expressionsb. Evaluating an expressionc. Division of fractions with exponents
4. AlgebraFactoring
5. Algebraa. Roots of numbersb. Square root brieflyc. Fractional exponents
6. Extracting Square Rootsa. Review of roots of numbersb. Square roots
7. Equationsa. Identical and conditional equalitiesb. Satisfaction or solutionc. Rules of equationsd. Transpositione. Equations containing fractionsf. Using equations with formulas
8. Simultaneous Linear Equationsa. First degree of linear equationsb. Variables and constants
c. Using equations to plot graphsd. Simultaneous equationse. Use of quadratic equationsf. Circle graphs
TECHNICAL MATHEMATICS--1STSEMESTER
1. Algebraa. Literal numbersb. Addition and subtractionc. Multiplication and divisiond. Simple linear equationse. Simple simultaneous equationsf. Fractional equations (simple)g. Special products and factoringh. Exponents and powers of teni. Graphing of simple linear equationsj. Graphing of simultaneous
equations2. Slide Rule
a. Multiplication and division on C andD scales
b. Multiplication and division on CIand CF scales
c. Multiplication and division on S, Tand ST scales
3. Trigonometrya. Angles and angular measurementsb. Trigonometric functions and tablesc. Fundamental identitiesd. Solution of right trianglese. Periodic functions
EquationsGraphs
4. Elementary Plane Vectors5. Vectors and Complex Numbers
a. Imaginary numbersb. The "J" operatorc. Rectangular and polar formsd. Conversion techniques (slide rule)

64 / The Role of Mathematils in Electrical-Electronic Technology
6. Fundamentals of Number Systems 2. Slide RuleOther Than Base Ten a. L scalea. Counting symbols b. L L scaleb. Place value of symbols c. A and B scalesc. Conversion from one base to another d. K scaled. Addition and multiplication tables 3. Vector Algebra (continued)
TECHNICAL MATHEMATICS-2ND 4. Boolean Algebra (introduction)SEMESTER 5. Trigonometry
1. Algebra a. Law of Sines
a. Fractions b. Law of Cosinesc. Diagonal Parallelogramb. Fractional equations
c. Exponents and radicals 6. Introductory Lectures on Calculusd. Quadratic equations a. Four-step delta processe. Simultaneous quadratic equations b. Slopef. Exponential equations and c. Idea of infinitesimals and infinity
logarithms d. Functional notation
The self-instructional materials used in this study consisted of about1,000 microfilm images of texts on algebra, originally developed for theU.S. Air Force. The purpose of the materials was to provide prerequisiteinstruction in algebra for students beginning a course in basic electronics.
The content of the material was determined in two ways. First, the basicelectronic course was analyzed in detail to isolate the mathematical skillsrequired and second, the specific mathematics needed for electronics train-ing was expanded to cover related topics also required in first-year physicsand chemistry. The result was a short course in algebra suitable for stu-dents at the junior college level who had studied algebra in high school,but were deficient nonetheless.
Comparison of Experimental and Control ClassesThe following data were abstracted from student personnel rec-
ords of Bakersfield College for each of the students participating in thestudy: (1) age; (2) years of high school mathematics; (3) average grade inhigh school mathematics; (4) SCAT' verbal scores; (5) SCAT quantitativescores; (6) SCAT total scores (SCAT was given in September, 1960).
MeasurementsThe mathematics achievement test (included in Appendix B) prepared
by the research project was administered on the first day of the semesterand again upon completion of the self-instructional materials. The studentscores on this test were used to assess the mean growth in mathematicalachievement for the experimental and control classes.
School and College Ability Test is made up of two sub-tests: one to measure verbalability and the other to measure quantitative ability. The total test score is the com-bination of the two sub-tests (prepared and distributed by the Cooperative Test Divi-sion of the Educational Testing Service, Princeton, N.J.).

The Experimental Study / 65
The test prepared by the research team had content validity in that theareas of mathematics covered by the test were decided upon in coopera-tion with ten selected electronics instructors from California junior col-leges. Further, it had construct validity in that the problems were fashionedafter final exams had been used with success in a variety of junior collegeprograms throughout the State.
TABLE IIICORRELATION OF DATA ON STUDENTS FOR BAKERSFIELD STUDY
Post-test
Pre-test
Averagegrade
Years H.S.math
Age
Total
Quantitative
Verbal
1.0
.830* 1.0
.020 .018 1.0
.542* .502* .140 1.0
.146 .180 .222 .199 1.0
.375* .393* .190 .218t .021
.430* .416* .030 .219 .049
.304f .205 .089 .194 .209
1.0
.546* 1.0
.450* .136 1.0
8 cr
N = 64.* = significant at 1%.t =1, significant at 5%.
To assess the reliability of the test, Pearson? product-moment correla-tion coefficient was calculated for the split halves of the items on the test.This yielded a correlation coefficient of .842 which is significant at theone-percent level (see Appendix C).
2 The split-halves reliability coefficient is the application of the product-momentcorrelation coefficient to objectives test items to assess the reliability of the test in in-stances where retesting is either impossible or undesirable. It consists of splitting thetest into two groups of items and correlating the individual student's score on eachgroup of items.
In this study the test used was split by assigning the odd problems to one group andthe even problems to another.
I.

66 / The Role of Mathematics in Electrical-Electronic Technology
Pearson's product-moment correlation was calculated to measure thecorrelation between the raw scores in the research-designed achievementtest and the data collected on the students (see Table III). This was doneto determine the extent to which standardized tests already in use atBakersfield College predicted success in technical mathematics.
Characteristics of the Students in the Study
The students, confrol and experimental combined, are normally distrib-uted on their SCAT scores (see Figure 1). The distribution on the pre-test
0zw
ta 10
25 ...QUANTITATIVE33=11 VERBAL-- TOTAL
0 1350 340 320 300 280
SCORES
Figure 1
Distribution of Students' SCAT Scores
260 240 230
approximates normality (see Figure 2). There was little variance in theage of the students, and there were no significant correlations with anyof the other measures. Consequently, age was not considered in any cfthe following analyses. The number of years in high school mathematicsand the average grade in themselves had little variance and bimodal dis-tribution, but when considered together, they became more meaningfuland approximated a normal distribution. The multiplication of years ofhigh school mathematics by the average grade in mathematics is equal tothe total number of grade points earned in mathematics and this becomesthe combined measure (see Figure 3).
Characteristics of the Students by GroupThe control group was normally distributed on test score, but the ex-
perimental group had a bimodal distribution which was skewed stronglytoward the lower end of the measures involved. Inspection of the data

The Experimental Study / 67
also showed that the control group had a higher mean on each of themeasures, except grade points earned in high school mathematics (seeAppendix C). Because the two groups were not normally distributed, non-parametric statistics were used to determine whether the two groups
25
20
0 15
w 10a.
5
015
25
20
)-0z 15
0 : 1 0
wO
u.
,/.
5 ,s0
oo
25 35 SCORES
Figure 2
Distribution of the Pre-Test Scores
55 65 75
14
GRADE POINTS
Figure 3
Distribution of Grade Points Earned in High School Mathematics
differed significantly on the five variables involved. The Kruskal-Wallis
(H) one-way analysis of variance was computed for SCAT verbal, SCATquantitative, SCAT total, grade points earned in high school mathematicsand the pre-test (see Appendix C), none of which were significant.
Thus it was established that the experimental and control groups werenot significantly different before the experiment.

,,,,,I
68 / The Role of Mathematics in Electrical-Electronic Technology
Comparisons of Student Cain
Comparison of Control and Experimental Groups on Gainin Mathematics Achievement
The mean gain as measured by the pre- and post-tests, for all thestudents, was 7.625 points. Since the total group was normally distributed,a t-test was made to determine whether the mean gain was significant (seeAppendix C). Once it had been established that the gain for the totalgroup was a significant one, the next step was to determine whether therewas any significance in the difference in gain between the experimentaland control groups. The mean gain for the experimental group was 8.14which exceeded the 7.31 mean gain of the control group.
The Kruskal-Wallis (H) one-way analysis of variance was used to assessthe difference in gain (because of the nonparametric distribution). Thisproved to be .83 which is not significant and indicates that the differencemay well have occurred by chance (see Appendix C). Hence, it was con-cluded that there was no significant difference in gain of the experimentalgroup compared with the control group.
Fourfold Comparison of Gain in Mathematics Achievement
The control and experimental groups consisted of electronics majorsand non-electronics majors. The mean gain for each of the four groups is
TABLE IV
DISTRIBUTION OF MEAN GAIN AMONG CONTROL ANDEXPERIMENTAL, MAJOR AND NON -MAJOR GROUPS
Electronicsmajors
Non-electronicsmajors Total
Control 7.14 7.44 7.22
Experimental 7.69 8.53 8.14
Total 7.32 8.12 7.62
shown in Table IV. If the four sub-groups were listed in the order of theirmean gain, they ranked as follows: (1) experimental group non-electronicsmajors; (2) experimental group electronics majors; (3) control group non-electronics majors; (4) control group electronics majors.
A statistical comparison was made between the four groups (see Ap-pendix C). This showed that even though a difference existed, it was notsignificant.

The Experimental Study / 69
Comparison Between Electronics Majors and Non-electronics
Majors on Gain in Mathematics Achievement
Aside from the experimental group being exposed to the self-tutoring device, another difference in instruction existed. The electronics
majors had a laboratory section during which the electronics theory andmathematical skills presented to them in lecture were put into practice,whereas the non-electronics majors did not have this experience.
The majors and non-majors were compared on the antecedent data (see
Appendix C). After it had been demonstrated that they did not differ
before the experiment, they were compared on their gain in the achieve-
ment in mathematics. The difference in mean gain of 8.12 for the non-
majors against 7.32 for the majors seemed to indicate that the practicalapplication of mathematical skills did not contribute to achievement inmathematics. When the statistical comparison was made, the differenceproved to be less than significant (see Appendix C).
The Instructor's Comments on the Use of the AutoTutor
"The mechanics of scheduling for the AutoTutor were quite simple. A sheet washanded to the class which listed the available hours, and students were askedto sign for the most convenient hour. From this list, a daily schedule was printed,
and each student signed in and out (for the Tutor) on this sheet. The weekly
assignment was written on the blackboard. When handled in this manner, there
was practically no additional teacher load, except to review the material eachweek for suitability of topic."One question that needed to be answered was: "Is this simply a 'new gadget'which the student will not use after it is no longer new?" Remembering that the
(self - instructional) material was very well written, the students seemed to begenuinely sorry when all of the material had been covered. Some students askedfor permission to go back over the material. Very few students wanted to give
up the Tutor."As has been stated, the control class was given weekly review written assign-
ments, from the textbook, in addition to the regular homework. The surprising
result was that, after several weeks, many students volunteered that the weekly
review work was a very effective learning aid. After the study ended, some of
the better students asked for a continuation of the review assignments (thesestudents did not use the AutoTutor)."In conclusion, my opinion is that the machine can be a valuable teaching aid,provided the machine is regularly scheduled and the (self-instructional) materialis well prepared. The AutoTutor is a device which calls for a minimum amountof teacher time after the schedule has been prepared. On the other hand, hap-
hazard use of the machine, or too great a reliance upon the machine, wouldsurely lead to disinterest and poor participation by the student."In my own case, I would use the machine to introduce and build background,
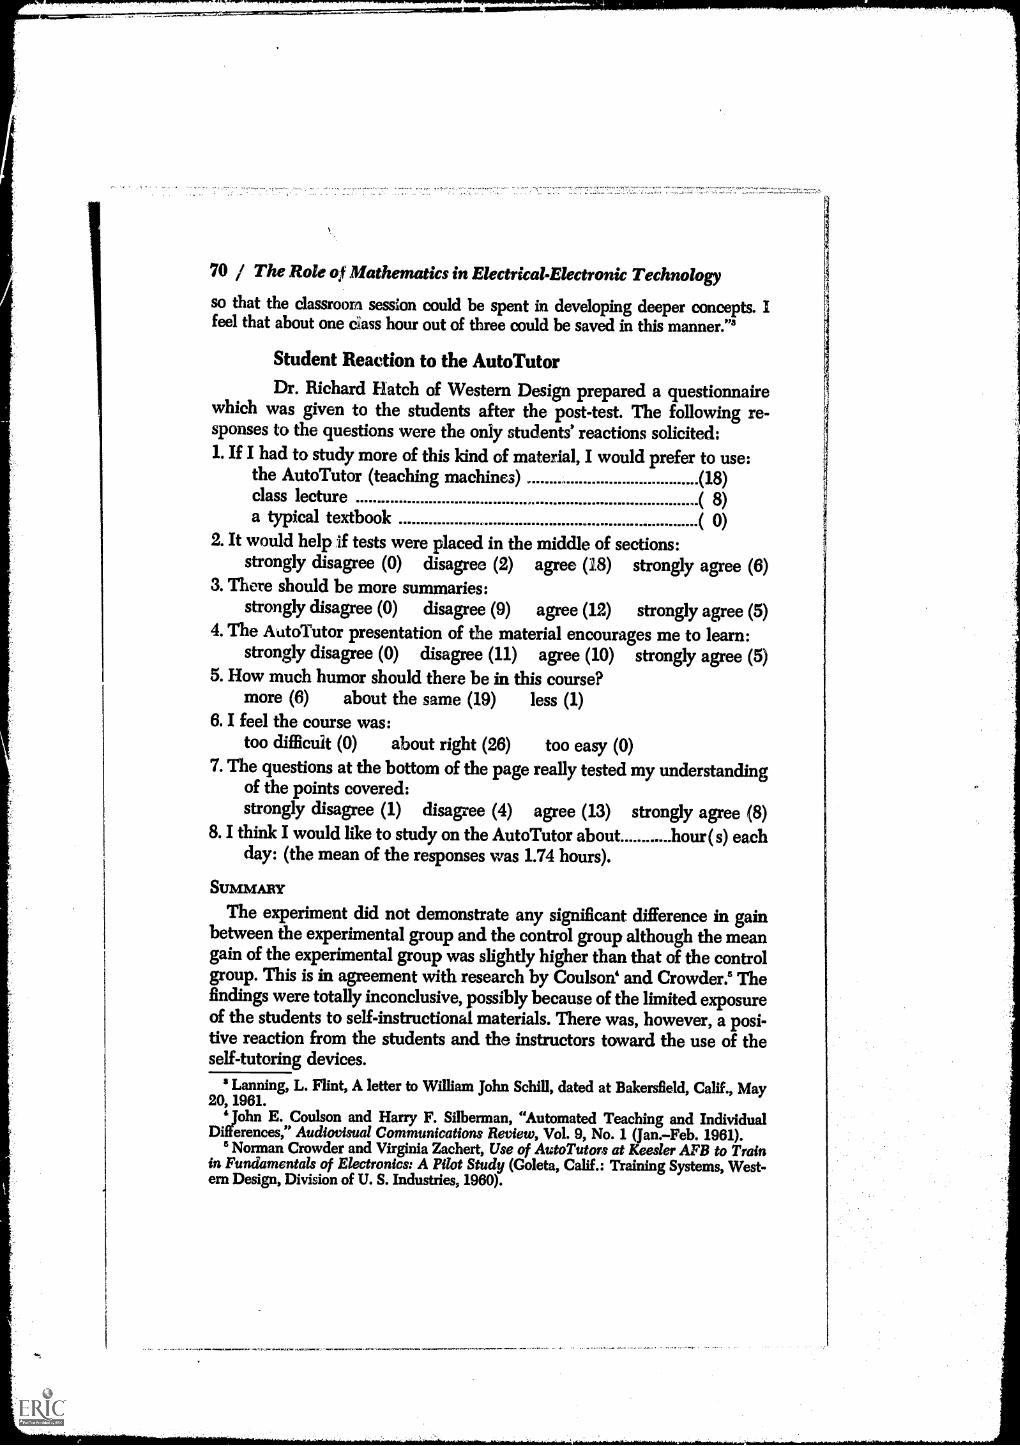
RIVIIITINIIIP.PWWWW1wwwfwgigigwowwwww,
70 / The Role of Mathematics in Electrical-Electronic Technology
so that the classroom session could be spent in developing deeper concepts. Ifeel that about one class hour out of three could be saved in this manner.''
Student Reaction to the Auto Tutor
Dr. Richard Hatch of Western Design prepared a questionnairewhich was given to the students after the post-test. The following re-sponses to the questions were the only students' reactions solicited:1. If I had to study more of this kind of material, I would prefer to use:
the Auto Tutor (teaching machines) (18)class lecture ( 8)a typical textbook ( 0)
2. It would help if tests were placed in the middle of sections:strongly disagree (0) disagree (2) agree (18) strongly agree (6)
3. There should be more summaries:strongly disagree (0) disagree (9) agree (12) strongly agree (5)
4. The Auto Tutor presentation of the material encourages me to learn:strongly disagree (0) disagree (11) agree (10) strongly agree (5)
5. How much humor should there be in this course?more (6) about the same (19) less (1)
6. I feel the course was:too difficult (0) about right (26) too easy (0)
7. The questions at the bottom of the page really tested my understandingof the points covered:strongly disagree (1) disagree (4) agree (13) strongly agree (8)
8.1 think I would like to study on the AutoTutor about hour ( s) eachday: (the mean of the responses was 1.74 hours).
SUMMARY
The experiment did not demonstrate any significant difference in gainbetween the experimental group and the control group although the meangain of the experimental group was slightly higher than that of the controlgroup. This is in agreement with research by Coulson' and Crowder' Thefindings were totally inconclusive, possibly because of the limited exposureof the students to self-instructional materials. There was, however, a posi-tive reaction from the students and the instructors toward the use of theself-tutoring devices.
Lanning, L. Flint, A letter to William John Schill, dated at Bakersfield, Calif., May20, 1961.
:John E. Coulson and Harry F. Silberman, "Automated Teaching and IndividualD" erences," Audiovisual Communications Review, Vol. 9, No. 1 (Jan.Feb. 1961).
5 Norman Crowder and Virginia Zachert, Use of AutoTutors at Keesler AFB to Trainin Fundamentals of Electronics: A Pilot Study (Goleta, Calif.: Training Systems, West-ern Design, Division of U. S. Industries, 1960).

Chapter 6
INSTRUCTIONAL MATERIALSVON
The Initial ConceptionAt the beginning of the research project, the investigation of in-
structional materials was conceived to include the construction of teach-ing aids that would be applicable to mathematics for electronics. It wasproposed that 10 or 12 such de vices be constructed and a lesser numberbe tested in the public school setting to determine whether they aided theinstructional process.
Materials Presented at the WorkshopsIn the four workshops held throughout the State, a variety of
teaching aids was presented and discussed (see Chapter 3). Among thematerials were commercially prepared teaching aids, teaching machines,self-instructional textbooks', closed-circuit overhead television, and instruc-tor-prepared demonstrators. In general, teaching machines and self-instructional textbooks were enthusiastically received and the instructorssaw the need for investigation into the efficacy of these newer media. Theinstructors also saw the need for evaluation of commercially preparedteaching aids. However, the general opinion was that instructor-prepareddemonstrators were of questionable value. These opinions are supportedby Johnson and Nickerson who advocate continuing review of instruc-tional devices, lest "the development of future materials follow its expen-sive trial and error course.. "
The recommendations of the workshops (Chapter 3) brought about therevision of the research project's concerns for instructional materials and
Norman A. Crowder, The Concept of Automatic Tutoring, Organizational Paper,Air Force Personnel and Training Research Center, ARDC (Texas: Lacidand Air ForceBase, 1959).
2 D. A. Johnson and J. F. Nickerson, "The Future of Visual Aids in Mathematics,"Mathematics Teacher, Vol. 40 (1947), pp. 180-81.
71

72 / The Role of Mathematics in Electrical-Electronic Technology
led to the experimental study at Bakersfield ( Chapter 5) and to the devel-opment of questionnaires, discussed in greater detail in the following para-graphs.
Questionnaires on Instructional MaterialThe questionnaires were developed and distributed to a repre-
sentative sample of the electronics instructors in California. These ques-tionnaires were mailed to 65 instructors, and the overall return was 89percent. The ten questionnaires covered five self-instructional textbooks
TABLE ITOTAL RETURNS FROM THE QUESTIONNAIRE SURVEY
OF 65 INSTRUCTORS OF ELECTRONICS
Questionnaire Response Percent
1 62 952 62 953 62 954 58 895 58 896 58 897 61 948 61 949 61 94
10 39 60
Total 582 89
in the area of mathematics or electronics and eight commercially preparedteaching aids for electronics. The self-instructional books were those mostreadily available. The eight commercially prepared teaching aids wereselected as representative of the types of teaching aids available and werewidely known. Each questionnaire was concerned with only one aid ortextbook, except three questionnaires which requested information onpairs of teaching aids. The questionnaires were accompanied by the manu-facturer's descriptive brochure to insure that the responses were relatedto the material toeing investigated.
Table I show, the number of returns to each set of questionnaires. Thequestionnaires were so constructed that if a response was negative, allsubsequent items on the questionnaire were not relevant. For example,the instructors were asked whether they had read a particular self-instruc-tional textbook, and if the response was "no" the remainder of the ques-tions concerning the applicability of the books to instruction in electronicswas beyond the realm of the instructor's ability to answer (see AppendixB).

Instructional Materials / 73
Self-Instructional TextbooksThe responses to the five questions on self-instructional textbooks were
handled as a group. 02 the 325 questionnaires sent out on self-instructionaltextbooks, 285 were returned and of this total only 22 responses indicatedthat the textbooks in question had been read. From this it can be concluded
that the junior college instructors of electronics in California are not ac-quainted with the recent attempts to prepare self-instructional textbooks
applicable to mathematics and electronics, notwithstanding the unanimous
agreement in the workshops that methods which will provide remedial
ins?, .uction for entering electronics students need to be investigated. Therewas no tabulation as to whether those instructors who had read the self-instructional textbooks were the same who attended the workshops, butconsidering the acceptance of these books at the U.C.L.A. workshop, itcould be hypothesized that all 22 positive responses were the result ofexposure to these materials at the workshops.
Twenty-two responses indicated that self-instructional textbooks hadbeen read; 17 indicated an application to the electronics program. Of the
17 responses indicating that the books had some instructional value, four
stated further that the self-instructional textbooks had been tried in aninstructional program and were considered to be of value.
Unrelated to the questionnaire survey, but definitely related to the useof self-instructional textbooks for mathematics or electronics is the state-ment which follows, quoted from a letter of James Chapman, Head ofthe Mathematics and Engineering Department at Antelope Valley College:
"We have introduced the Algebra Tutor Text to a number of students currentlyenrolled in beginning algebra. These students have expressed a high degree ofenthusiasm for the unique approach. We feel that these students have gainedconfidence and that their work has improved."As you know, I have been conducting an in-plant training program for tech-nicians at Jet Propulsion Lab, Edwards. I made use of 15-20 Tutor Texts inalgebra and electronics and 20 volume I and 20 volume II Arithmetic for Com-
puters."These high-level technicians used the books more as a refresher course, butthey too expressed the feeling that the books fill a need."There has been some talk here at AVC about the possibility of conducting one
section of Elementary Algebra from the Tutor Text next fall. The only thing
that is holding us back is the lack of a suitable testing program... ."
Commercially Prepared Teaching Aids
A total of 520 responses was solicited concerning eight commerciallyprepared teaching aids. Of this number, 473 were returned; 311 (60 per-
3james Chapman, a letter to William John Schill, dated at Lancaster, California,
May 12, 1961.

74 / The Role of Mathematics in Electrical-Electronic Technology
cent) indicated that the respondent was acquainted with the aid in ques-tion, or a similar one. The breakdown of the responses by teaching aid wasas shown in Table II. The number of positive responses to the question,"are you acquainted with the . . . teaching aid?" was sufficiently large tolead to the conclusion that the electronics instructors are aware of aidsavailable for teaching electronics.
TABLE IIRESPONSES INDICATING ACQUAINTANCE WITH COMMERCIALLY PREPARED TEACHING AIDS
Aid Returns Acquainted Acquaintedwith similar
Rotating electrical machineryCrow Advanced . .
Model 700 61 38 9Philco classroom demonstrator 58 33 9Packard-Bell 5 RI (tube) radio demonstrator 58 33 9Packard-Bell 6 RTI (transistor) radio demonstrator 58 25 8Philco matching lab chassis 58 23 5Erectronic basic electronics kit BE-4 61 16 24Erectronic basic electricity electronics and radio
kit BE-5 61 16 24Electronic kit multiproject board 53 7 32
Totals 473 191 120
Application of the Teaching Aids
Three hundred eleven responses indicated an acquaintance with theteaching aid in question, or a similar one; of this number, 292 (94 percent)considered them applicable to instruction in electronics. From this, it isconcluded that the teaching aids surveyed have value in the eyes of theelectronics instructors who are acquainted with them.
Use of the Teaching Aids
As would be expected, not all of the instructors who thought the teach-ing aids applicable had had an opportunity to use them in their classrooms.Of the 292 respons s that indicated teaching aids were applicable, 178 (61percent) responded that the teaching aid (or similar one) had been usedin the instructional program. The distribution of the use by teaching aidswas as shown in Table III.
The Instructors' Appraisal of the Teaching Aids in Use
The instructors in the workshops hoped that questionnaires on commer-cially prepared teaching aids would give guidance in selecting teachingaids. The instructors who had used these aids seemed best qualified to
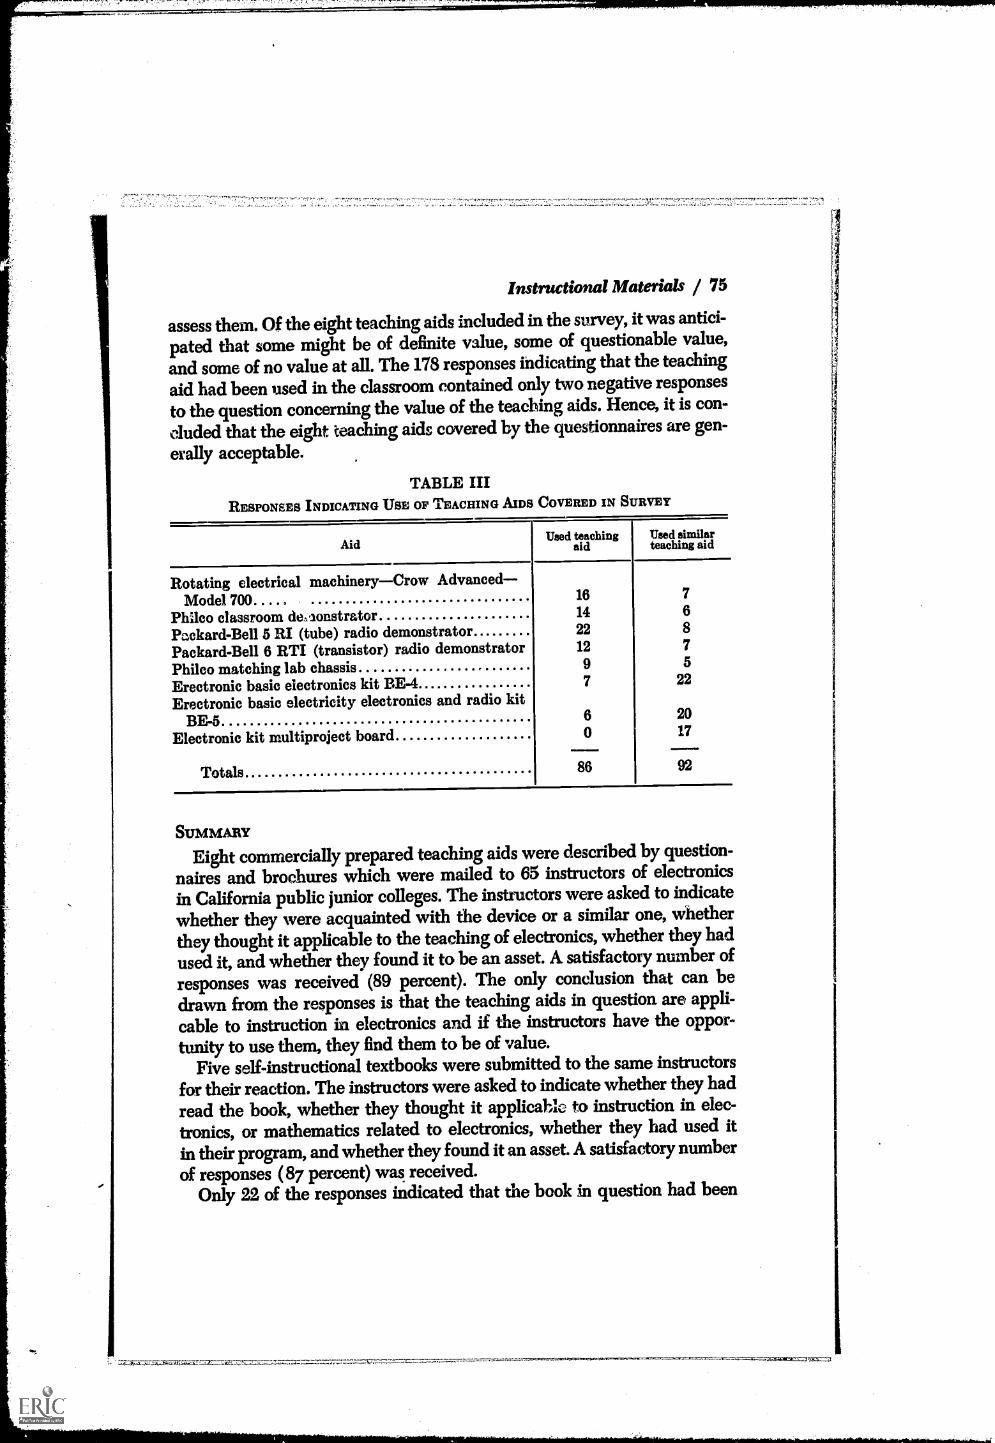
Instructional Materials / 75
assess them. Of the eight teaching aids included in the survey, it was antici-
pated that some might be of definite value, some of questionable value,
and some of no value at all. The 178 responses indicating that the teaching
aid had been used in the classroom contained only two negative responses
to the question concerning the value of the teaching aids. Hence, it is con-eluded that the eight teaching aids covered by the questionnaires are gen-
erally acceptable.
TABLE IIIRESPONSES INDICATING USE OF TEACHING AIDS COVERED IN SURVEY
AidUsed te
daching
aiUsed similarteaching aid
Rotating electrical machineryCrow AdvancedModel 700 16 7
Philco classroom de,aonstrator 14 6
Packard-Bell 5 RI (tube) radio demonstrator 22 8
Packard-Bell 6 RTI (transistor) radio demonstrator 12 7
Philco matching lab chassis 9 5
Erectronic basic electronics kit BE-4 7 22
Erectronic basic electricity electronics and radio kitBE-5 6 20
Electronic kit multiproject board 0 17
Totals 86 92
SUMMARY
Eight commercially prepared teaching aids were described by question-
naires and brochures which were mailed to 65 instructors of electronicsin California public junior colleges. The instructors were asked to indicatewhether they were acquainted with the device or a similar one, whetherthey thought it applicable to the teaching of electronics, whether they hadused it, and whether they found it to be an asset. A satisfactory number ofresponses was received (89 percent). The only conclusion that can bedrawn from the responses is that the teaching aids in question are appli-cable to instruction in electronics and if the instructors have the oppor-tunity to use them, they find them to be of value.
Five self-instructional textbooks were submitted to the same instructorsfor their reaction. The instructors were asked to indicate whether they hadread the book, whether they thought it applicable to instruction in elec-tronics, or mathematics related to electronics, whether they had used itin their program, and whether they found it an asset. A satisfactory numberof responses ( 87 percent) was received.
Only 22 of the responses indicated that the book in question had been

1?":1'-'10v5".1*.011gianuftYLNIN11Mg.ramwsiressimilaltignallit
76 / The Role of Mathematics in Electrical-Electronic Technology
read. Four responses indicated that the book in question had been triedin the school setting and was thought to be of value. There were no dataindicating the extent to which self-instructional textbooks had been used,with the exception of the comments from James Chapman.
Rather widespread acquaintance with commercially prepared teachingaids (other than self-instructional textbooks) seems to indicate that com-mercial distributors can be relied upon to acquaint instructors with theirproducts.

Part IV
Appendices

Appendix A
ANNOTATED BIBLIOGRAPHY
IntroductionTrends
The early studies were devoted to defining the term technician, in orderto develop criteria for classifying him. "What is a technician?" became adifficult question because the term was used to describe a tremendouslywide range of individuals in diverse work situations. It soon became evi-dent that two criteria were used extensively: first, that of training andeducation; second, and most generally, that of function and skill level.The governing factor seems to be the type of job performed. Consensusof opinion developed that in order to qualify as a technician, an individualmust necessarily be performing one of the variety of specific types of jobsin a number of different fields.
Definitions of the TechnicianOn the basis of function and skill level, the U.S. Department of Health,
Education, and Welfare, Office of Education, defines the word technicianas "a general term applied to an individual who assists with technical de-tails in a trade or profession; uses tools, instruments. and/or special devicesto design, illustrate, fabricate, maintain, operate and test objects, materialsor equipment; performs mathematical and scientific operations, reportingand/or carrying out a prescribed action in relation to them; examines andevaluates plans, designs, and data; determines action to be taken on thebasis of analysis; assists in determining or interpreting work proceduresand maintaining harmonious relations among groups of workers."'
Two essential factors characterizing most technicians are proficiency incraft, and manipulative skill and ability to employ scientific and engineer-ing knowledge. To classify a job then, one must first examine the scope of
1 A Report of a National Conference, U. S. Department of Health, Education, andWelfare, Office of Education (Washington: 1957), p. 16.
79
80 / Appendices
the job (the number of different skills and kinds of knowledge necessary)and the level of the job (extent of knowledge and intellectual ability re-quired). Generally acceptable is the classification of technicians as twomajor categories (that of industrial technician and that of engineeringtechnician). However, the classification of the Federal Government showssix main categories: engineering aids, surveying and cartography, engi-neering drafting, physical science aids, electronic technicians.
Fields of WorkClearly identified also are the fields in which technicians are found, with
research, design and development receiving greatest attention. In thesefields, the technicians generally act as direct support personnel for engi-neers and/or scientists. Other fields include production, operations, con-trol, installation, maintenance or sales.
The Employment OutlookThere appears to be some support for the notion that employment of
technicians is stabilizing. Nearly 550,000 technicians, an average of 72 forevery 100 scientists and engineers, was employed in industry in January1959.' The number of technicians primarily engaged in research anddevelopment was estimated at 156,000, or 28 percent of the total number inall activities.
TrainingThere seems to be a trend in the formal technical education toward the
need for an increasing preparation in mathematics and physical science.The primary sources of training at the present are
1. Company on-the-job training2. Armed Forces technical schools3. Formal education by technical institutes, jullior colleges and other
schools of higher education.On-the-job training includes training at the working place, formal clasis-room instruction given by company personnel, and the support of part-time off-the-job education. This program has contributed and continues tocontribute substantially to the current supply of technicians.
It has been reported that companies almost universally encourage theirtechnician personnel to further their education by taking classes in localschools. Over 40 percent of the students enrolled in post high school tech-nician training are part-time students, men generally concurrently em-ployed in technician work. Large corporations combine on-the-job trainingwith formal company classroom duties.
2 Employment Outlook for Technicians, U. S. Department of Labor, Bureau of LaborStatistics, Bulletin No. 1131 (Washington: 1953), p. 6.
111011r01001111r.
, it ;tANr.4woLv7i7..f -..,;.rwarsirettorssIn.lf
Appendices / 81
Supply from the Armed Forces
In the Armed Forces the trend appears to be toward an increase in thenumber of technicians trained. As of 1954, 35,000 enlisted personnel wereengaged in supporting work of a technical nature in the Defense Depart-ment Research and Development Division. The high turnover of men inthis classification provides 5,000-10,000 additional well-trained engineeringtechnicians to industry each year. Many of the skills learned are utilizedby ex-servicemen in civilian industrial technical positions. For example,34 percent of 1,926 electronics technicians working in eight metropolitanareas surveyed in 1953 were found to have attended Armed Forces tech-nical schools.'
Supply from Schools and Colleges
From technical institutes and schools of higher education approximately12,000 technicians students graduate each year. Many of these institutesand colleges offer post high school, one to three-year curricula usuallyleading to an Associate Degree and preparing students for industrial andengineering technician work.
In the decade ahead it is anticipated that training of technical personnelat all levelshigh school, technical institute, collegewill become moreintensive and contain more basic sciences. Changes are predicted on pro-curing men qualified to cope with increasing complexity of technologyand new developments of automation and atomic energy.
1. Bearden, H. D., Survey of Technical Occupations (Texas A & M Col-lege, Division of Engineering Extension, 1959).
This publication is primarily a statistical report of technician requirements inprincipal industrial areas of Texas, prompted by the need to get information onreactivation and relocation of courses and classes. In addition, the inquiry in-cluded an examination of educational requirements for individuals who performin the job of technician.Data were taken from survey, narrative files of interviewers, minutes and notesof review bodies, and excerpts from interviewee comments. A proportional area-wide sample was taken of industries in Texas and from this sample a representa-tive group of 300 industries was selected to aid in determining the needs of theindustry. Industries were identified by standard industrial classification. Seven-teen classifications were used. The State was divided into six general areas soas to provide for a simultaneous effort of six teams of analysts.Six categories of techniciansengineering, mechanical, maintenance, produc-tion, laboratory and electronic technicianswere investigated.Conclusions relating to employment practices of these industries were presented.
James T. Brady et al., Managing Technician Manpower (Cambridge: TechnicianManpower Associates, 1959), p. 13.
82 / AppendicesMinimum age requirements for technicians range from 18 to 21 years andmaximum of 51 years in most firms. Most specified high school graduation asbasic educational requirement. Preference was shown for male technicians."Most firms apparently were unwilling to accept the product of technical insti-tutes and trade schools as qualified technicians. Many prefer these young mento begin their employment as apprentices or helpers, advancing by means ofin-plant or company sponsored training programs. Several companies feel thatthe individual must develop on the job since a thorough knowledge of companybackground and specialized training is indispensable."The firms felt that the answer to the qualified technician procurement programrests with the training of their skilled craftsmen, since they already possessedthe required and related product knowledge.The curriculum, it was proposed, should be strong in functional laboratoryexperiences, both in theory and skill area. All related theory should be of theapplied variety. Certain basic work activities and educational requirementsshould be common to all technicians. Notably strong emphasis was placed onthe areas of communication and human relations in the educational require-ments. English and Mathematics were frequently mentioned. High school grad-uates were delinquent in both areas: manifestly unable to report intelligently orread instructions correctly due to limited understanding of mathematics andinadequacies in the use of the English language. The report presents approxi-mately 50 tables summarizing the research data. Little attempt was made toanalyze the data and interpret the findings.
2. Bodine, Merle W., Training Needs of Highly Skilled Technicians inTwenty-three Selected Manufacturing and Processing Firms (Kansas StateDepartment of Vocational Education, 1959).This study was designed to obtain estimates of the need for technicians in theState of Kansas for the next five years and to identify areas of technical skill andthe knowledge required for highly skilled technicians in selected Kansas manu-facturing and processing establishments.Forty-two technical occupations were analysed and the frequency with whichspecific activities were performed, was noted. Also areas of related technicalinformation and understandings required in the performance of the work activi-ties were determined.Interviews were held with 36 industrial representatives of 23 Kansas manufac-turing and processing firms. The data were based on interviews which providedan analysis of 42 technical occupations, representing 830 highly skilled tech-nicians.Within the number of highly skilled technicians, 42 different titles were found,six of which were in electronics. Common characteristics of the work activitiesof the total group of technicians studied were described as those connected withexperimenting, repairing, designing, and setting up equipment for production(30 percent performed in this area). Fifty percent of the technicians remodel oradapt equipment to new needs, while one-third engage in maintenance of equip-ment. More than 50 percent used instruments for the most common activities,

0.
Appendices / 83
namely, inspecting, measuring and making computations. Nearly the same rateof technicians used instruments for trouble-shooting.The study gives a most complete detailing of the specific activities for the sixclassifications of the technician. With reference to functional mathematicalunderstandings needed by the total group of technicians, there were somenotable conclusions. Based on data from personal interviews of industrial repre-sentatives of the 23 firms participating, it was concluded that beginning algebrawas of considerable importance. An especially strong need was expressed forthe functional understandings of computing ratios, solving equations, substi-tuting in formulas, solving formulas, and interpreting reports. The engineeringtechnician group required the strongest functional understanding of beginningalgebra. Related science needed was found to be mechanics, electricity andmagnetism. The establishment of training programs for technicians in localpublic schools on an area basis was supported strongly by industrial representa-tives.
3. Brady, James T., et al., Teamwork in Technology: Managing Tech-nician Manpower (Scarsdale, New York: Technician Manpower Associates,1954).
The purpose of this publication is to clarify and relate the factors of indus ay'sdevelopment of a policy of managing its technicians more effectively, withemphasis on specific means of teaching technicians properly.The basic data on how industry uses and views technicians were gatheredthrough personal interviews with company executives and through question-naires sent to eighty business firms in the Boston area. In addition, question-naires were sent to educators, union leaders, and government officials. Studentsattending Wentworth Technical Institute, Boston, provided data as to how thetechnical student views his career.
ConclusionsThe report concludes that a great many companies are obviously content to usetechnicians as mere appendages to the technical aspects of the operation; thatthese companies are not getting the most for their money; and that a greatsupply of engineering and productive knowledge is not being fully tapped.In defining the job of the technicians, the authors considered the followingfactors as essential which characterize most technicians: proficiency in craftand manipulative skills, and scientific and engineering knowledge. Techniciansmay be classed into two basic categories according to the scope (different skillsand knowledge necessary) and the level (extent of knowledge and intellectualability required) of their job: (a) Industrial technicians, (b) Engineering tech-nicians.The industrial technician does not require extensive knowledge of science andengineering to perform his work. He uses more craft and manipulative skillsthan engineering knowledge. Some technical occupations are very limited inscope and level. This group includes such jobs as product inspection (dealingwith few specific products and limited number of inspection instruments),
84 / Appendices
routine testing (worker checks specific items of performance following estab-lished standards). Such jobs differ not much from that of the craft worker butare differentiated by the necessity that the technician has to apply some scienceand engineering knowledge. Laboratory technicians are an example.The engineering technician requires more depth and understanding of engineer-ing and scientific principles in the performance of his duties. He uses fewmanipulative skills. Other titles for engineering technicians are: technologists,senior technicians, engineering aides.Some occupations of the engineering technicians require only limited skills andspecific knowledge, but demand a thorough understanding of overall operations,engineering and scientific principles. An example is an electronics technicianwho designs amplifiers. He needs extensive knowledge of the electricity prin-ciples involved, but is directed toward producing a single component.The greatest attention in the report was given to the field of research, designand development, where technicians generally act as direct support personnelfor engineers and scientists. Since they are the supporting group for highlytrained and highly paid personnel, much attention has been devoted to themas a means of increasing productivity of R & D efforts through releasing highertrained personnel for creative scientific or engineering work.The report takes up the following aspects of special import to management:(1) training of technicians; (2) the technician and collective bargaining; (3) hiringpractices and procedures; (4) in-company administration of technicians; (5) man-agement looks at the role of the technician. Of particular interest to educatorswould be the section on "The Technician Views his Career" which is supportedby a study of the sample of students attending Wentworth Institute located inBoston. A detailed analysis of their findings is reported.Another section of value to educators is the section on "The U. S. Governmentas a User of Technicians."
4. Brandon, George L., Twin Cities Technicians: A Limited Survey ofIndustrial Technicians. (Lansing: College of Education, Michigan StateUniversity, 1958), 70 pp.
The pilot program gathers basic data about the work of the industrial technician,his role, status, and needed performance skills. The survey is conducted in theBenton Harbor-St. Joseph, Michigan, community. The study is designed to helpeducational planners in the technical area throughout the State of Michigan.In the process of the research, a guide for preparation of interviewers and aninterview instrument were developed.Personal interviews with industrial personnel of the Benton Harbor-St. Josepharea were conducted by the Department of Vocational Education of the Michi-gan State University. Forty-five interviews in fifteen plants representing 281industrial technicians were held. The objectives were to locate and identify thetechnicians, to describe the job and work activities, and to discover the relatedunderstandings needed by industrial technicians.In the fifteen plants contacted in the area during the years 1956 -57, 281 Indus-

,t2zgazilioggt9MIr
Appendices / 85
trial technicians were employed. They were classified as technicians in mainte-nance (25 percent), in mechanical activities (18 percent), production (18 per-cent), electrical-electronics (14 percent) and laboratory (8 percent). Of the totalnumber employed, seven were electronic technicians whose work activities in-cluded graphics and equipment. Five of them were especially active in con-structing experimental equipment, performing experiments, repairing, oper-ating, testing, adjusting and evaluating equipment and troubleshooting. Mosttechnicians never fabricate or install equipment, or set it up for productionpurposes, it was found.Work activities of industrial technicians were categorized as concerned with:(1) equipment, (2) instruments, (3) production, (4) machines and hand tools,(5) drawing, (6) energy and power, (7) working with other personnel. The mostcommon job activities of the instrument group reported were inspection andtroubleshooting (. . . on the whole, data are outstanding, indicating that tech-nicians seldom operate in production functions. . .).With reference to the related mathematical understandings needed, the reportindicates that the responses reflect a greater use of learning in the beginningareas of mathematics. Relatively lesser need is shown for an understanding ofcalculus and descriptive geometry. ". . . two-thirds of the technicians use anunderstanding of beginning algebra."In this report there are some implications for education. Research may clarifyto a considerable extent the determination of a realistic length of training pro-grams for technicians. Although a period of two years seems to be the acceptedlength of time, there are few data to support or deny appropriately the lengthor shortness of the period.Twin Cities technicians work with the tools, machines, instruments, processesand equipment of modern industry. Consideration of their many job functionsand responsibilities suggests a direct experience program of large dimensions.Laboratory curricula may well include (1) a common or basic core of experiencefor all industrial technicians and (2) specialized courses for the technician of thevarious classifications."The separation of laboratory experience and related technical information isarbitrary and artificialand sometimes unfortunate. In preparation of tech-nicians, the dichotomy of job skills and "know how" is unrealistic."
5. Buller, John L., Orange Coast College Electronic Computer Survey(Orange Coast College, California, 1960).
The study was carried on for and within the Orange Coast College community,in Orange County, California. The problem was to determine changes or modi-fications needed in the present college program of training for the electronictechnician in order to qualify students for the computer field and to identifysound means for selecting prospective technician students.Data were obtained from personal interviews with personnel managers for com-puter industries in Orange County from questionnaires, school visits, and a test-ing program for first-year technical students at Orange Coast College.

86 / Appendices
Conclusions
About a dozen electronics companies in Orange County are engaged in somephase of digital/analog work, with approximately 303 electronic techniciansnow employed. The projected need for technicians with specialized computertraining is estimated at 232. Respondents indicated that 40 percent of this needcould be filled by graduates of a junior college technical program. Investigatingthe activities of a computer programming technician, the report concludes thatthere is a definite need for scientific computer programming technicians, andthat this training is within the scope of the Orange Coast College occupationalcurriculum.After an analysis of available tests which could be used for the purpose of identi-fying aptitudes in the technical areas, the Employee Aptitude Survey wasselected. This test is published by Psychological Services, Inc., Los Angeles, andis a group of ten objectively scored tests, each measuring a different type ofmental aptitude. The test was given to a sample which included students com-pleting their first year in one of the technical programs. From data collected ontests, it appears possible to select specific tests from the Employee AptitudeSurvey which will indicate success in a given technical program and to estab-lish "guidance scores for the purpose of vocational counseling."
Definition of TechnicianElectronic Computer Technician.
"The duties of the Electronic Computer Technician go well beyond routinetesting, repairing, adjusting, assembling or installing of electronic equipment.Specifically these duties will vary depending upon the activities of his employer.The job classifications of the electronic computer technician, however, indicatethat he should be able to perform, to varying degrees, the following jobs:
1. Conduct electrical, mechanical, and environmental tests of prototype com-ponents or complete units of analog/digital computer systems to evaluate con-formance with engineering specifications and to recommend design or construc-tion changes;
2. Lay out experimental computer circuits from engineering sketches usingknowledge of computer logic, transistors, semiconductors, circuit analysis, andother electronic computer technical skills;
3. Prepare test data and measure the operating characteristics under each ofthe test conditions to which the component or system is subjected;
4. Analyse test data and write reports for engineering department or othersimilar purposes;
5. Employ drafting techniques and equipment for making drawings andschematics of final circuits for engineer's approval, and in some cases for tech-nical manuals;
6. Perform tests to evaluate functional operation of manufactured components
or systems using pulse and sweep generators, dual beam oscilloscope, frequencyanalysers, and other similar electronic equipment;
7. Install computer prototype or production models in customer's plant orlaboratory and instruct personnel in operation and maintenance of units."

146
Appendices / 87
6. Department of Health, Education, and Welfare, U.S. Office of Educa-tion, The Technician, What Has He To Do, What Must He Know (Aworking paper prepared by the Division of Vocational Education, Tradeand Industrial Education Branch, 1957).
The paper is directed toward the national industrial scene to get at the problemsrelating to the nature of the work of the technician. The attempt is to discovera pattern of practices and a core of skills required as well as the nature of inter-personal relationships within industry. The aim of the national study, initiatedby the Trade and Industrial Education Branch of the Vocational EducationDivision was to provide guidelines for local community studies of the technician.The paper included a five-point scale for analysing the following work activitiesof the technician: (1) working with equipment, (2) working with instruments orgages, (3) working with production, (4) working with materials and hand tools,(5) working with drawings, reports, records, handbooks, (6) working with energyand power, (7) working with personnel.Part 2 of the paper presented the same five-point scale to analyse the functionalunderstandings used by a technician, including mathematics, science, communi-cations, and interpersonal relationships.
7. Emerson, Lynn A., Vocational-Technical Education for AmericanIndustry (Circular No. 530, U.S. Department of Health, Education, andWelfare, U.S. Office of Education; Washington: GovermLent PrintingOffice, 1958).
Dr. Lynn A. Emerson, Professor Emeritus in Industrial Education, Cornell Uni-versity, acting as special consultant to the Division of Vocational Education,Office of Education, prepared the bulletin. The content of the report is limitedto the field of vocational-technical education for American industry; it does notdeal with education for the large number of vocational-technical occupationsfound in agriculture, business, health and medical services, and other fields.The bulletin defines vocational-technical occupations giving scope and level ofthe occupations, distinguishes the technical from the skilled occupations. Chap-ter 2 presents education for vocational-technical occupations, giving growth oftechnical education and needs for new programs. The bibliography includesselected references with annotations and organizations interested in technicaleducation.Three definitions of the technician are given. Basically, these three definitionsare similar, but they are all given because the differing verbal descriptions mayhelp to provide a clearer picture of the job of the technician.
(1) A general term applied to an individual who assists with technical detailsin a trade or profession. Uses tools, instruments, and/or special devices to design,illustrate, fabricate, maintain, operate and test objects, materials, or equipment.Performs mathematical and scientific operations reporting on and/or carryingout a prescribed action in relation to them. Examines and evaluates plans, de-signs, and data; determines action to be taken on the basis of analyses; assists

88 / Appendices
in determining or interpreting work procedures and maintaining harmoniousrelations among groups of workers.
(2) The technician is a person who works at a job which requires appliedtechnical knowledge and applied technical skill. His work in this area is some-what akin to that of the engineer, but usually the scope is narrower. His jobalso requires some manipulative skillsthose necessary to handle properly toolsand instruments needed to perform the technical tasks. In his special field, hehas considerable technical knowledge of industrial processes, and in this field,he knows how to apply the necessary principles of the physical sciences and ofmathematics. In general he uses instruments, in contrast with tools. His con-tribution is mainly through mental effort in contrast with muscular exertbn.
(3) The scientific or engineering technician usually works in one of the broadfields: research, design or developmentwhere he generally acts in direct sup-port of an engineer or scientist; production, operation, or controlwhere thetechnician usually follows a course laid out by the engineer or scientist, thoughhe may not work under close direction; installation, maintenance or saleswhere he frequently performs tasks that would otherwise be done by an engi-neer or scientist. In performing these functions, the technician thinks out prob-lems for himself. He uses college level mathematics and the principles and func-
tions. He effectively communicates scientific or engineering ideas mathemat-ically, graphically and linguistically.
8. Industrial Technicians in Michigan (Michigan State Department ofEducation, Trade and Technical Education Branch) 1960.
Emphasis is on the industrial technician. The bulletin was prepared by theCommittee of Trade and Technical Education of the Michigan State Depart-ment of Education. Data were drawn from previous State studies and not basedon special surveys. The definition of the engineering technician as given by Ross
G. Henninger, Ohio Mechanics Institute, and the definition for the industrialtechnician are the same as that considered by the President's Committee onScientists and Engineers.The growth in the number of technicians in the Michigan labor force is depicted
in the following ratio changes: 1940, ratio of one technician to 600 workers; in
1960, one to 176; projected into 1970, a ratio of one to 98. The report givesseveral sample curricula for electricity and electronics courses.
9. Industrial Technician and Technical Education Needs, 1960 (Board ofEducation, Syracuse, New York, 1960).
The purpose of the study was to discover community reaction to the need for
a County School of Technology. Conducted in the spring and summer of 1959,it included an industrial survey by personal interview of 33 Syracuse area in-dustries. These represented 67 percent of the employed labor force and allknown major employers of technicians. Eighty percent of high school seniorsand sophomores participated in the study. A return postcard questionnaire wassent out to 5,000 voters from the 1958 County list, with a 29 percent return.Within the number of highly skilled technicians, there existed 42 different titles.

Appendices I 89
Of these 42 titles, six were in electronics. The most common characteristics ofthe work activities of the total group of technicians studied were described asconnected with installing equipment (30 percent performed in this area), ex-perimenting, repairing, designing and setting up equipment for production.Fifty percent of the technicians remodel or adapt equipment to new needs,while one-third of the group engages in maintenance of equipment. Most com-
mon activities are: working with instruments, inspecting, measuring, and mak-ing computations. More than 50 percent use instruments for these purposes andnearly the same number of technicians use instruments for troubleshooting.There were six classifications for electronic technicians, representing 682 tech-nicians, or 82 percent of the total number studied.The study gives most complete details on the specific activities of the six classifi-
cations of technicians. With reference to the functional mathematical under-standings needed by the total group of technicians, there were some notableconclusions. Based on data from personal interviews, a strong need was expressedfor functional understandings of computing ratios, solving equations, substi-tuting in formulas, solving formulas, and interpreting reports. This appears to be
a strictly local study with little or no general import.
10. Lawrence H. Stewart and Arthur D. Workman, Mathematics andScience Competencies for Technicians: A Study of the Training ofElectronics and Chemical Technicians with Special Emphasis on CriticalMathematics and Science Requirements (Bulletin of the California StateDepartment of Education, Volume 29, No. 14. SC-0).
The study attempts to identify mathematics and science competencies neededby electronics and chemical technicians and to develop ways in which the neces-
sary provisions for required competencies may be made in the curricula oftraining programs. The study was conducted in the Greater San Francisco BayArea under the direction of the University of California.The data were obtained from 197 technicians and 62 first-line supervisors in 13different electronics firms, and from 81 technicians and 31 supervisors in sevendifferent chemical companies. All firms participating were located in the GreaterSan Francisco Bay Area. Two samples of technicians and supervisors were em-ployed in the collection of critical incidents related to mathematics and sciencerequirements. The 20 industrial firms represented in the survey varied in sizefrom those employing less than 20 technicians to those employing more than500 technicians. Some of the firms concentrated primarily upon research anddevelopment, others upon production.Another questionnaire designed for junior college instructors of electronics wasadministered to instructors in twelve junior colleges in northern California. Thisaspect of the study was intended to elicit information regarding the instructor'sbackground, the mathematical and scientific skills he considered essential totechnicians, his recommendations for screening students for technical trainingprograms, and his opinion as to the major problems involved in training tech-
nicians.The critical incident technique developed largely by J. C. Flanagan, American
Cs Appendices
:nstitute for Research, requires the "expert" qualified to judge the effectivenessof a particular type of behavior. In this case "experts" were technicians and theirsupervisors. Each was asked to render a specific description of a behavioral situ-ation or incident designed to illustrate effective or ineffective behavior. Reportsof incidents were couched in terms of mathematics and science requirements.General characteristics of the electronic and chemical technicians reported bythe study were found to be: mean age for electronic technicians, 32.6 years,with a range of 25-39 years; for chemical technicians, 35 years, with a tendencyfor both technicians and supervisors in the category to be three years older thanthe average.As for formal education the electronic technicians averaged 13.1 years and 13.9years for electronics supervisors. Approximately 56 percent of the technicianshave had formal education beyond high school. More technicians receivingeducation beyond high school attend junior colleges than four-year institutionsand more supervisors than technicians attended either junior colleges, four-year
institutions, or both.The mean educational level of 13.6 years for the chemical technicians is onlyslightly higher than their counterparts in the electronics area. On the other hand,the supervisors are more highly trained than personnel in the other groups.More than one-half of these have completed requirements for the doctorate.Almost 90 percent reported attendance at a college or university, but none indi-cated junior college work.For electronic technicians, the mean number of years of experience is 7.1, withapproximately 42 percent having less than five years of experience; slightly morework experience for chemical technicians, i.e., 7.6 years.With reference to the origins of interest in electronics, two sources were men-tioned most by electronics technicians. These were self-interest activities, such
as hobbies and reading, and experiences in the Armed Forces. Few of the elec-tronic technicians (14.7 percent) listed school experience as responsible for their
interest in electronics.Slightly more than one-fifth reported receiving their training solely in schools,either college or high school. Another 21.3 percent indicated military serviceschools. Only one in ten received his entire training on the job.Perceived Mathematics and Science Requirements. All the technicians and super-visors were asked to indicate how much mathematics and science training theyconsidered necessary to prepare a technician adequately for his job. One-fourthof the electronic technicians and their supervisors perceived training in ele-mentary algebra as essential. As for the chemical technicians, over 40 percent ofthem and 61 percent of their supervisors indicated that a simple algebraic skillwas adequate. Only 16 percent of these supervisors indicated mathematics train-ing from basic courses through trigonometry as necessary.Formal Training in Mathematics. Slightly more than one in five of the electronictechnicians reported having taken calculus; 28.9 percent having received train-ing through trigonometry. Approximately one out of ten reported mathematicstraining`of a-type more advanced than calculus. Statistics reflected the desire oftechnicians and supervisors for further training. Both reported plans for further

;rxwcvk,r,re;,7,"rAWVA.'ilv4r=:?-l+r4rtteiq:WW...-YW!%F7,r,Oi4Vft
Appendices / 91
work in mathematics and science, especially the electronic technicians. Impliedis the discernment of greater opportunities for advancement in the electronicfield.Implications for Education. "One implication readily apparent from these datais the need for educational institutions not only to offer training curricula fornew entrants into the technical field, but also to provide considerable advancedwork scaled to the needs of technicians already on the job.In general, the data discussed in this chapter indicate that most technicians donot require high-level mathematical and scientific skills. There is some indicationof the need for practically oriented skills, i.e. toward laboratory techniques ratherthan toward abstract theory. Furthermore, the data suggest that perhaps manytechnicians possess higher-level skills than are being tapped by their present job.The disclosure that a large number of technicians plan to expand their capabili-ties by taking additional formal course work portends a greater supply of morehighly trained technicians. But there is some evidence that the skills alreadyavailable are not fully exploited. Does this mean that there will be an evengreater waste of manpower resources? This problem should become a matter ofmost serious concern on the part of both training institutions and industry."
11. Technical Education: Technicians for Florida Industries (FloridaState Department of Education publication, 1959).The study is concerned with the number of technicians employed, their dutiesand responsibilities as outlined by the employer. In addition, the study attemptsto identify prerequisites in algebra, trigonometry, and drafting from which em-ployee proficiency may be measured. Technicians in nine occupational categorieswere studied. Included were aeronautics, agriculture, chemistry, construction,drafting, electricity, electronics, mechanics and metallurgy.Method involved using local directors of vocational education to establish a listof the industries contacted. Some industries were contacted by mailed question-naire, others were contacted in person. Involved were 585 enterprises employinga total of 11,987 technicians.Findings. Of all employed personnel studied, 36.6 percent were classified aselectronic technicians. There will be a projected need for 6,220 technicians by1962 for the State of Florida (one in three will be an electronic technician). Alook at in-service training programs revealed that three out of ten firms spon-sored some type of training program. The group employing from one to fivetechnicians constituted over 41.6 percent of the total, the group employing fromeleven to twenty technicians constituted 11.1 percent of the total, and the groupemploying from 21 to 50 technicians constituted 51.5 percent of the total.
12. U.S. Department of Labor, Bureau of Labor Statistics, EmploymentOutlook for Technicians (Bulletin No. 1131; Washington: GovernmentPrinting Office, 1953).Nature of Work. The definition used is that of Dr. Lynn A. Emerson, CornellUniversity. All jobs held by technicians who work with engineers and scientistshave some common characteristicsnotably that they require a knowledge and

92 / Appendices
practical application of mathematics and physical sciencethe nature of workperformed differs considerably among occupations.Engineering Aides. In general they work under the supervision of an engineerand perform specialized functions requiring less cultural and theoretical trainingthan is provided by professional engineering courses. Work usually requires aknowledge of some specialized field. Aide may assist engineer in productionplanning by designing and analysing layouts. When production begins he maymake tests, record data, make computations, work on production methods, checkmaterial. He may also act as liaison man between engineering department anddrafting department, tool room and production department.In the field of research, aides perform tests with regard to such matters as stress,strain, motion and impact. They may set up, calibrate, and operate instrumentssuch as torsion meters; may also test and calibrate electric controlled devicesemploying vacuum tube circuits, and make calculations with respect to weightcenters of gravity, etc.Electronic technicians. Their background of electronic theory, physical scienceand mathematics enables them to perform jobs above routine operating, main-tenance and repair level. Their work requires them to make practical applicationof theoretical knowledge. The practical part may call for use of such basic toolsas pliers, screw drivers, wrenches, soldering ironswhereas the theoretical partmay call for use, understandings and interpretations of results obtained frominstruments such as oscilloscope, signal generators, ohmmeters, ammeters, volt-meters, multitesters, and Q-meters. Their work often calls for a combination ofmanual skills in handling simple tools and a knowledge of complex testing equip-ment. They must be able to read and interpret layout and other diagrams, usemathematical formulas for circuit work, and wire intricate electronic units.Electronic technicians working in laboratories construct, test, install, modify,operate and under certain conditions design experimental electronic apparatus.They may be called upon to offer ideas and suggestions, devise practical solu-tions to problems of design, select suitable materials and methods of construction,evaluate the operating characteristics of the equipment and in other ways con-tribute to the research and development process.In the industry electronic technicians may perform "trouble-shooting" functionsor do the more complicated types of testing and inspection work. An importantfunction of electronic work with production is building of testing equipment.Past Trends. Employment of technicians has increased markedly over the pastfour decades. Among the technicians allied with engineers and scientists, drafts-men were the first group to become established as a separate occupation, andthey still outnumber every other group of technicians. The number of draftsmenin the country rose from 12,000 in 1910 to 88,000 in 1940. A further sharp in-crease in employment of technicians has taken place since 1940. One reason forthis conclusion is the rise in the number of employed professional engineers(from 245,000 in 1940 to more than 400,000 in 1952). Several studies have beenmade by different organizations of the relative numbers of technicians, engineers,and scientists employed in certain industries. These studies indicate an extremelywide variation in the ratio of technicians to engineers and scientists, due in part

,
Appendices / 93
to the lack of uniform definitions of technical and other related jobs. The ratiowas found to vary from 20 technicians for each engineer to 1.7 per engineer indifferent industries. It also differed considerably among plants in the sameindustry.Outlook. Current announcements (1953) by the U.S. Civil Service Commissionof job opportunities emphasize the Federal Government's need for additionaltechnicians. In May 1952, the Commission listed engineering aide, engineeringdraftsman, junior scientist, tool designer, electronic equipment repairer, andelectronic mechanic among the personnel for whom there was urgent need inspecified localities. The demand for technicians will probably be great as longas the defense program continues. The current shortage of scientists and engi-neers has given renewed impetus to the trend, notably since World War II,toward greater use of technicians. In some cases scientific jobs are being "diluted"and "broken down" so that technicians may be used for some specialized activity.The need for better utilization of fully trained professional personnel is receivingrecognition from many sources and, to this end, the employment of greater num-bers of technicians is recommended.It is expected that the greatest demand for technicians in the next few yearswill be in t defense-related industries. Other industries important in defense-connected research and production such as the machine tool, industrial chemi-cals, and petroleum industries are therefore expected to need additional tech-nicians. The Federal Communications Commission announced in 1952 that2,053 new television stations would be allowed to open, and this will furtherintensify shortages of trained electronics technicians, because sizable numberswill be needed to maintain and service the additional stations when they areestablished.Employment of technicians is likely to continue to expand over the long run.Some of the factors which are expected to affect favorably the long-run employ-ment for them are the general advance of scientific knowledge and its practicalapplication in industrial operations; and the increasirtg use of technically trainedpersonnel in sales jobs, supervisory jobs, and other types of work. Further, it isexpected that high levels of expenditures for research and development willpersist over the long run. More and more companies are establishing researchprograms and existing programs are being expanded to meet the strong com-petition in developing new products and processes. In addition to the newpositions created by growth in the field, many employment opportunities fortechnicians will occur each year because of deaths, retirements, or transfer ofexperienced workers. However, technicians face special competitive problemswhen jobs become scarce, because they are in occupations which can be filledby persons with a wide variety of backgrounds. In the past, during periods ofconsiderable unemployment, the most serious contenders for technician jobs havebeen the professional workers. The possibility of greater flexibility and broaderbackground from the four-year college graduate may influence the employer'spreference. The technician, then, would be well advised to consider taking addi-tional courses of general nature, as well as specialized courses in his field, toprepare himself better to meet competition.

---41=07.11111011101114e
94 / Append ices
13. U.S. Department of Labor, Bureau of Labor Statistics, Mobility of
Electronic Technicians 1940-1952 (Bulletin No. 1150; Washington: Gov-ernment Printing Office, 1954).
The U.S. Bureau of Labor Statistics with the support of the Mr Force undertook
a series of studies of the mobility of workers in critical occupations with four
primary objectives: (1) to identify personal characteristics of the workers in anoccupation and to discover how they will affect the future supply and mobilityof these workers; (2) to locate the sources from which fully or partially trained
workers may be drawn; (3) to discover sources of training for these workers; (4)
to get answers on the mobility of workers between occupation specialties, estab-
lishments, industries, and areas, and factors affecting this movement.The main object of this particular study was to learn how men find their way intoelectronic technician jobs, and how they move among different types of elec-
tronic establishments, employers, and labor market areas. The data were gathered
by personal interview survey of 1,926 electronic technicians employed in eight
of the Nation's largest metropolitan areas: Atlanta, Baltimore, Boston, Chicago,
Detroit, Los Angeles, New York, Philadelphia. The survey conducted in April--
May, 1952 required a great deal of detailed information about workers' personal
background and work history during a twelve-year period from January, 1940
to AprilMay, 1952.Questionnaires. Two questionnaires were used. One was mailed to each indus-
trial establishment soliciting information that the employer would supply, and
an employee questionnaire was used for information obtained by interviewing
the individual technician. Both were pretested in the Philadelphia and Baltimore
areas. Establishments provided data on hiring methods, training conducted in
plants, job breakdowns, plant employment, number of technicians employed and
job descriptions for electronic technicians.Sample Design. A sample of 1,800 technicians was selected from six types of
establishments that employ 90 percent of all civilian electronic technicians in
the United States. The survey was restricted to eight of the largest metropolitan
areas, representing every geographic area. Thus, the universe from which the
sample of electronic technicians was drawn includes all establishments located
in these cities which are engaged in the six types of establishments: (1) Repair
of radio and/or television receivers; (2) Radio and/or television broadcasting;
(3) Manufacturing of aircraft; (4) Manufacturing of other electronic equipment;(5) Manufacturing of radio and/or television receivers; (6) Research and devel-
opment.The work history analysis used in this study is more comprehensive than that
used in previous studies of occupational mobility. Instead of selecting from a
complete work history period specific types of activity or specific points in time,
this study considers the work history period in its totality, showing each respond-
ent's task in each month of the twelve years in terms of type of labor force status.
This method permits a detailed tracing of the steps through which new men
enter a skilled-worker category and, at the same time, allows the usual analysis
of the movements of workers after they are qualified.Collection. Individual technicians to be interviewed were selected from the

"V.441tVief,
Appendices / 95
establishments by obtaining a complete list of electronic technicians employedat each and selecting randomly a proportion of the total that would give theplant the proper representation. The criterion was a minimum of one year ofschool or on-the-job training in electronics. The sample of 1,926 electronictechnicians was one of the largest groups of workers in a single occupation thathad ever been studied. This afforded an opportunity for detailed analysis withoutsacrifice of statistical reliability. Chi square test was used to guard against impu-tation of significance to variations which could be due to chance.Findings. As to the role of the electronic technician, the study noted that theoperation of electronic equipment is based upon complex laws of physics. Forthis reason, the manufacture, installation, and maintenance of electronics devicesrequire the services of skilled workers who understand these physical scienceprinciples. "Electronic technicians perform specialized tasks involving the appli-cation of electronic theory in the manufacture, installation, maintenance, andrepair of electronic equipment. The particular job duties of electronic techniciansvary with the products and services of the establishments they work in . . . never-theless, there is a body of knowledge and skills common to all these groups."Generally speaking, the electronic technician diagnoses the trouble in a pieceof equipment by studying its "symptoms," makes tests to verify or correct hisdiagnosis, and then makes the necessary repairs. He uses meters and other testingcomponents and circuits. He replaces defective parts, using electrician's toolssuch as pliers, screw drivers, wrenches, and soldering irons. After making repairs,he adjusts the equipment to proper operating conditions.This description applies most specifically to repairmen, but those technicianswho construct, install, test, and maintain electronic devices must also performsome of the above operations. In manufacturing, the emphasis is on testing,inspecting, and repair. In research laboratories, construction of equipment, fromblueprints or wiring diagrams, is one of the main jobs of the technician. In air-craft plants, electronic technicians are often concerned with fabrication andinstallation of electronic equipment.Estimated Number Employed. The estimated number of electronic techniciansin the civilian economy was 100,000 in AprilMay, 1950, in the United States.Types of establishments in which they were employed included: repair of radioand/or television, 70,000; broadcasting, 13,000; manufacturing aircraft, 3,500;radio, 1,500; research, 1,500; and other, 7,000.On the whole the electronic technicians were a young group of skilled workerswho changed jobs relatively often from January, 1940 to April, 1952. The mostmobile workers were young men with only one or two years of experience in thefield. Most electronic technicians showed marked aptitude for the physical sci-ences. Electronic training in technical schools was the most common type oftraining for this occupation, though many technicians, particularly the older men,had acquired much of their skill at home through reading and hobby work.Mobility. The average electronic technician changed jobs once every four yearsduring the twelve-year work history under study. About 55 percent had heldcivilian jobs other than electronic technician during this period. Sixty-one percenthad served in the Armed Forces, one-half of them as electronic technicians. Lessthan half had held jobs occupied in 1952 for more than 36 months.

96 / Appendices
The tenure was shortest in aircraft manufacturing and research, and longest inbroadcasting. The electronic technicians moved freely among the different typesof electronic establishments. Those in research had held the highest proportionof electronic technician jobs in other fields. Radio and television repair workwas often a first job in which respondents acquired experience and skill. Elec-tronic technicians performed a wide variety of job duties in the period studied.About 20 percent of the electronic technicians moved from one city to anotherin changing jobs. Twelve percent made one area shift. Five percent made two,three percent made three to five shifts in the twelve-year period. The mostcommon reason given for the shifts was to take a better job. Twelve percent left
because of lay-offs.Though the job changers included a lower proportion of married men and fathers,
and a slightly higher proportion of high school graduates, these differences canbe attributed to age and other factors. No apparent influence of marriage, father-
hood or education on job changing is apparent in the findings.Training. Technical school courses were the most important type of training.More than half of the technicians had attended full time civilian technicalschools, and one-third received training in Armed Forces schools. About fivepercent had been apprentices and fifteen percent reported other on-the-job
training. Most of the men who attended full time civilian technical schools took
courses lasting 12; 18 or 24 months. Those attending Armed Forces technicalschools usually took six or twelve months' courses.Personal Characteristics. The majority were high school graduates who had had
a definite aptitude for mathematics and the physical sciences. More than half of
the electronic technicians came into this field directly from school or the ArmedForces. Electronics was their first regular occupation. Less than one-third of the
men in the survey had worked as electronic technicians before 1940.
Half of the technicians manifested in their youth an interest in electronics whichled them into this field. Other men were influenced by Armed Forces training,
or through personal influence.The median age was 33, four out of five were married, and three-fourths of themarried men were fathers.Technicians were versatile i-a terms of ability to make major repairs on different
types of equipment; over half of them were able to repair four or more types.
Manpower Implications. Direct quotes from the report follow:
"It is, therefore, likely that the attractiveness of this field for new entrants inthe labor market and the strong job attachments of those already working as
technicians will insure a gradually increasing supply of electronics technicians
in the years ahead."The youthfulness of electronic technicians indicates that losses due to deathand retirement will be relatively slight. As a group, electronic technicians are
above average in their propensity to change jobs. . . . Once a man became askilled electronic technician, he was disposed to remain in the electronicsfield, though he showed considerable willingness to change jobs within it.Since it might be difficult to establish a large-scale, long-term training programafter the mobilization period began and since the graduates might not be

ZwezzoisertsronemsaamminillOgIMIllt
Appendices / 97available in time to participate in the mobilization effort, such a programshould be initiated in advance of mobilization."The survey findings can aid considerably in guiding the establishment oftraining programs to develop all-around electronic technicians. They indicatethat there are a number of specific aptitudes and interests that should beused as the basis of selection of trainees. Most of the men who succeeded inthis field liked mathematics and physical sciences and had shown an interestin radio and electronics long before they entered the labor market. Theoreticalknowledge and background is much more important than in most other skilledoccupations and the experience of civilian and Armed Forces Schools indicatesthat some men can master the necessary theoretical concepts much more easilyand rapidly than others. A careful selection system which would attempt toinduct into training those who were 'most likely to succeed' would be a majorfactor in assuring the effectiveness of any training program."The findings also provide information on the methods and content of aneffective training program. Electronic technicians and their employers wereasked for specific suggestions about the best ways of training electronic tech-nicians. The most frequent response was thatan ideal program would combineclassroom instruction in electronics theory, repair and service procedures andrelated topics with actual work in a particular job on a concurrent, daily basis."Logically a program for training electronics technicians should be startedbefore mobilization actually begins. In practice, however, such a programwould face many difficulties. . . . establishing a broad program of training forthese groups would provide a large new pool of skilled workers who would beavailable for electronic technician's work in a mobilization period. Althoughthis program would give many workers training beyond the minimum require-ments for the jobs they actually hold, it would be more desirable than traininglarge numbers of men to be technicians, beyond the needs of the peacetimeeconomy. This is emphasized by the fact that formal training alone is notsufficient to qualify a man for electronic technician's work, especially whenit is not combined with actual job experience. . . ."

T-77-v, 1-
Appendix B
FORMS
Scale for Determining Technical Workers to be Interviewed
The process of determining the number of workmen to be inter-
viewed at each company will be on the basis of the total number of per-
sonnel (that fall within the classifications covered by the study), according
to the following scales:Total Number of Number Drawn
Technical Employees for Sample
from 1 2 0
3 5 1
6 10 2
11 25 3
26 50 4
51 100 5
101 150 6
151 200 7
201 250 8
251 300 9
300 or more 10
INTERVIEW SCHEDULE FOR TECHNICAL WORKERS
Y. LD 2. Company
3. Job classification4. Born (year only) 5. What mathematics courses have you
taken in high school?in college?
6. Job history
98

11.11111.1Ma
Appendices 1 99
7. Where did you receive your training?8. State name and relationship of anyone who influenced you to enter
this area of employment.9. Was there any particular circumstance that influenced you to enter
this area of employment?10. Education: H.S., A.A., etc.:11. What precisely do you do?
DIRECTIONS FOR THE Q-SORT(Technical Workers)
The problems on the cards are to be sorted according to the extent towhich they are similar to problems that you encounter as part of your job.To do this most readily, the following procedures would be useful:
1. Read through all the problems to become familiar with the material.2. Sort the problems into two groups:
a. one group of problems which are most like those you encounter;b. one group of problems which are least like those you encounter.
3. The final distribution will be as follows:MOST SIMILAR LEAST SIMILAR
3 4 7 12 14 12 7 4 -- 34. In other words, these problems should be sorted into nine piles ranging
from the first pile of three problems most like those you encounter in yourwork to the last pile of three problems least like those you encounter inyour work.
5. It is probably easiest to begin with the problems most like those you en-counter. Read through and select the three most similar and place them inone pile; then select the four next in similarity to those you encounter andplace them in the second pile, etc. At some point, you might shift to thegroup of problems least like those you encounter and select the three prob-lems least like those you encounter, then the next four, etc.
6. After you have sorted the problems, check carefully your whole distributionto be sure that you have made no mistakes. Make certain that your sortfollows the distribution indicated.
7. Please report your sortings on the attached form.

100 / Appendices
DIRECTIONS FOR THE Q-SORT(Instructors)
The problems on the cards are to be sorted according to the extent towhich they are similar to pi oblems that you would expect your graduatesto encounter as part of their job. To do this most readily, the followingprocedures would be useful:
1. Read through all the problems to become familiar with the material.
2. Sort the problems into two groups.a. one group of problems which are most like those you would expect your
graduates to encounter.b. one group of problems which are least like those you would expect your
graduates to encounter.3. The final distribution will be as follows:
MOST SIMILAR LEAST SIMILAR
3 4 7 12 14 12 7 4 3
4. In other words, these problems should be sorted into nine piles rangingfrom the first pile of three problems most like those you would expect yourgraduates to encounter to the last pile of three problems least like thoseyou would expect your graduates to encounter as part of their job.
5. It is probably easiest to begin with the problems most like those you wouldexpect your graduates to encounter. Read through and select the three mostsimilar and place them in one pile; then select the four next in similarity tothose you would expect your graduates to encounter and place them in thesecond pile, etc. At some point, you might shift to the group of problemsleast like those you would expect your graduates to encounter and selectthe three problems least like those you would expect your graduates toencounter, then the next four, etc.
6. After you have sorted the problems, check carefully your whole distribu-tion to be sure that you have made no mistakes. Make certain that your sortfollows the distribution indicated.
7. Please report your sortings on the attached form.

Q-SORT REPORTING FORM
ID
_Attxofl.glttf#*_l*reoio*tt
Appendices / 101
Each card has an identification number in the upper right hand corner.List the number on each card in the proper group below.
3 4 7 12 14 12 7 4 3
Most LeastSimilar Similar

102 / Appendices
The Problem
SAMPLE OF Q-SORT PROBLEMS
NumberAssigned toQ-sort Card
Mathematical Skillor Concept
14°27'
22°35'
36°62' = 37°02' 3 Addition of degrees andminutes
35 Area approximation
1 2 3
A = approximately 9 sq. units
-io
When A.= 3, Cy = 11
Cr
12
10
8
57 Graph interpretation
4
A,0
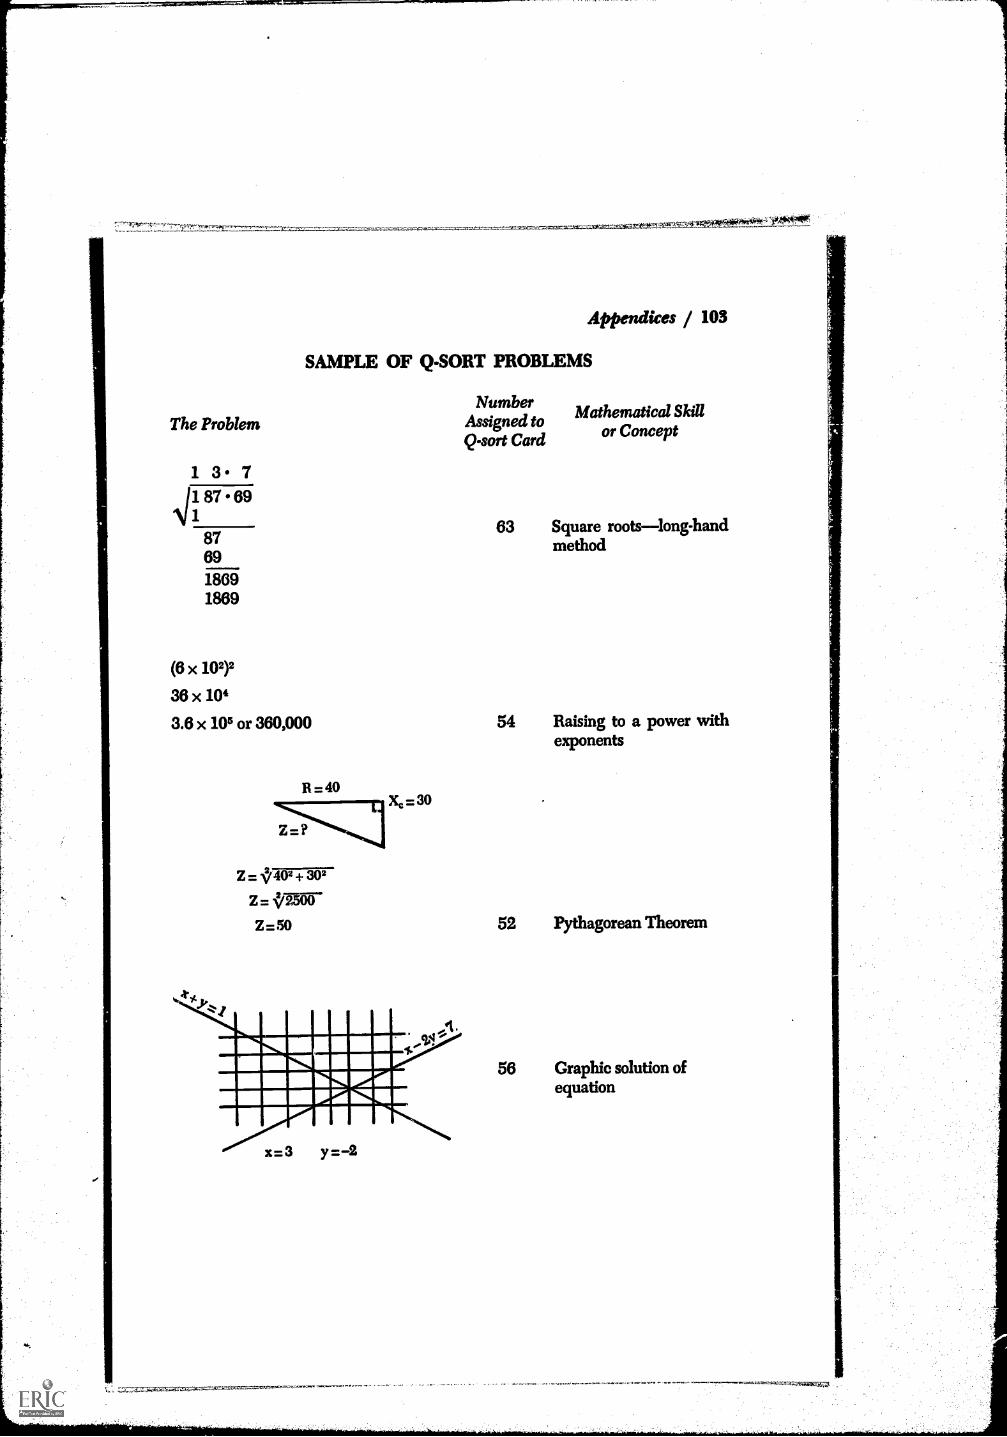
Appendices / 103
SAMPLE OF Q-SORT PROBLEMS
NumberMathematical Skill
The Problem Assigned toor ConceptQsort Card
1 311 87 691
63 Square rootslong-hand8769
method
18691869
(6 x 10²)2
36 x 104
3.6 x 10⁴ or 360,000 54 Raising to a power withexponents
Z = $402+ 302
= '0500Z =50
Xc = 30
52 Pythagorean Theorem
56 Graphic solution ofequation

104 / Appendices
The Problem
SAMPLE OF Q-SORT PROBLEMS
NumberAssigned toQ-sort Card
Mathematical Skillor Concept
x=-2±1/22-4.5.( 3)2 x 5 45 Quadratic formula
x=-2± v6410
x=-2± 810
x = 3/5 or 1
5.96 x 888 x 0.00604 7 Multiplication with logs
log 5.96 = 0.7752log 888 = 2.9484log .00604 = 7.7810 10
log product 11.5046 105.96 x 888 x 0.00604 = 31.97
11012 = 810 + 410 + 010 + 110 = 1310 8 Binary Arithmetic
19 Addition of vector inpolar form

Appendices / 105
SAMPLE OF Q-SORT PROBLEMS
The ProblemNumber
Assigned to Mathematical Skill or ConceptQ-sort Card
Sin 0=± V1 .54462 2
Sin 9= ±1/ .22772
Sin 0= .4762
62 Functions of half angles
A= fydx
A = f(2x6)dx
30 The integral as an area
A = x2 6x c4
(5xs + 7x2 + 9)
y = pet + 7x2 + 9)2
dy = 2(5x3 + 7x2 + 9) (15x2 + 14x)
(Tx
40 The differential
106 / Appendices
UNIVERSITY OF CALIFORNIA
DIVISION OF VOCATIONAL EDUCATION
LOS ANGELES 24, CALIFORNIA
February 2,1961
Dear Sir:Enclosed you will find a number of very brief questionnaires re-
lating to newly published textbooks which are designed to be self-
instructional, i.e. the student should be able to master the contents
without additional instruction.
I shall appreciate receiving the completed questionnaire at the
address given below:
William John Schill, Research ConsultantTechnical OccupationsDivision of Vocational Education123 Moore Hall, 405 Hilgard AvenueLos Angeles 24, California.
WJS:etencl.
Yours truly,
WiLuAm JoHN SarumResearch ConsultantResearch in Technical Occupations

aMmill
-4.-7ZAM11311,1RFEK"
Appendices / 107
UNIVERSITY OF CALIFORNIADIVISION OF VOCATIONAL EDUCATION
RESEARCH IN TECHNICAL OCCUPATIONS
Los ANGELES
QUESTIONNA111E
Title:
Author:
Publisher:
Date:
Contents:
Adventures in Algebra.
Norman A. Crowder and Grace C. Martin.
Doubleday & Company, Inc. Garden City, N.Y.
1960.
1. Elementary processes of algebra.2. Concept of numbers from the positive integers to the entire
set of numbers.3. Repetition of classic proofs to establish the requirement for
numbers other than positive whole numbers.
Please Answer the Following Questions Relative to theBook Described Above:
Ha 7e you read this book?Yes No
If "yes" a) Do you see any application of this bookto instructions in electronics, or mathe-matics related to electronics?
Yes No
b) Have you used it in your instructionprogram?
c) Do you think this book was an asset?
Yes No
Yes No

.1h
,==ORINIONIMMIntlail
108 / Appendices
UNIVERSITY OF CALIFORNIA
DIVISION OF VOCATIONAL EDUCATION
Los ANGELES 24, CALIFORNIA
, 1,4March 15,1961
Dear Sir:
Enclosed are brochures covering commercially prepared instruc-
tional materials with a questionnaire for each of these brochures.
I shall appreciate receiving the completed questionnaire at theaddress given below:
William John Schill, Research ConsultantTechnical OccupationsDivision of Vocational Education123 Moore Hall, 405 Hilgard AvenueLos Angeles 24, California.
WJS: etend.
Yours truly,
WnisAm JOHN SarumResearch ConsultantResearch in Technical Occupations
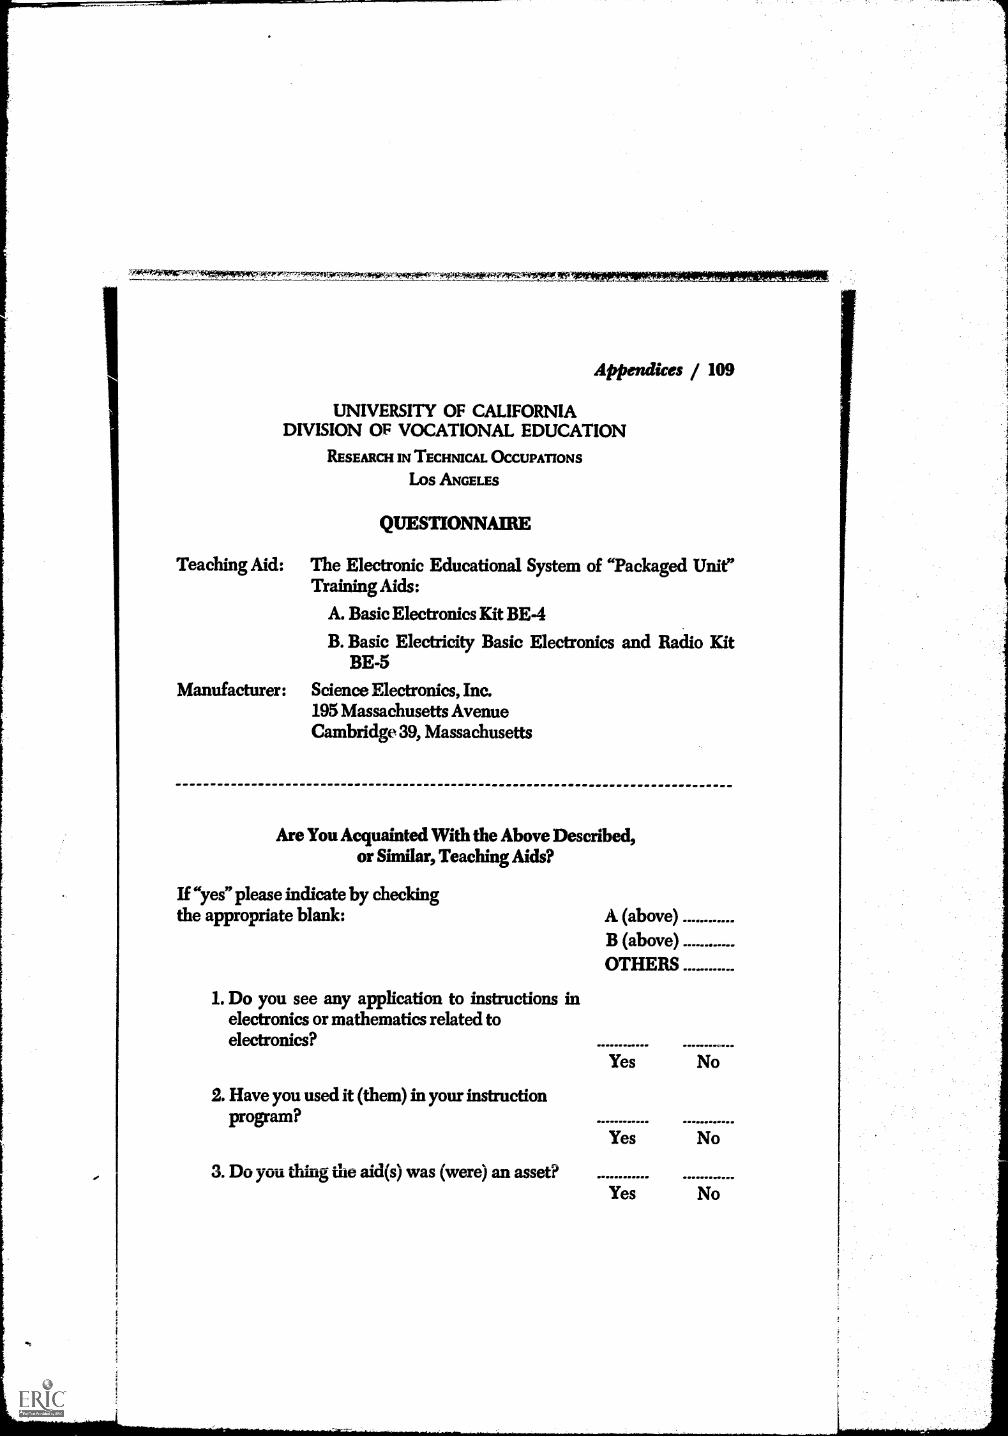
Appendices / 109
UNIVERSITY OF CALIFORNIADIVISION OF VOCATIONAL EDUCATION
RESEARCH IN TECHNICAL OCCUPATIONS
LOS ANGELES
QUESTIONNAIRE
Teaching Aid: The Electronic Educational System of "Packaged Unit"Training Aids:
A. Basic Electronics Kit BE-4
B. Basic Electricity Basic Electronics and Radio KitBE5
Manufacturer: Science Electronics, Inc.195 Massachusetts AvenueCambridge 39, Massachusetts
Are You Acquainted With the Above Described,or Similar, Teaching Aids?
If "yes" please indicate by checkingthe appropriate blank: A (above)
B (above)OTHERS
1. Do you see any application to instructions inelectronics or mathematics related toelectronics?
2. Have you used it (them) in your instructionprogram?
3. Do you thing the aid(s) was (were) an asset?
Yes No
Yes No
Yes No

110 / Appendices
rematageftialgiNIMMINitlfair.
SAMPLE PROBLEMS FROM MATHEMATICSACHIEVEMENT TEST
3+2= Find the lowest common denomi-7 9 nator of 3/5-9/16-5/18
1. 5/8 1.180
2. 5/16 2.360
3. 6/63 3.720
4.41/63 4.440
5. None of the above 5. None of the above
Structural concrete requires a mixture of 1 part cement, 3 parts sand,and 5 parts aggregate. If cement weighs 90 lbs per cubic foot, sand 100 lbsper cubic foot, and aggregate 120 lbs per cubic foot, the weight ratio forconcrete would be:
1.90: 100: 120
2.45: 100 :240
3.45: 150:300
4.90:300:7005. None of the above

rhYRM
Appendices / 111
SAMPLE PROBLEMS FROM MATHEMATICSACHIEVEMENT TEST
Use the scale below for problems 17 and 18
10 +10
A B 0 C D
Which literal number most nearly represents4?1.A
2.B3.04.D5. None of the above
Table of Squares, Cubes, Square Roots, and Cube Roots
Numbern n2 n3 Vn fn15 225 3375 3.8730 2.4662
20 400 8000 4.4721 2.7144
25 625 15625 5.0000 2.9240
30 900 27000 5.4772 3.1072
35 1225 42875 5.9161 3.2711
40 1600 64000 6.3246 3.4200
45 2025 91125 6.7082 3.5569
50 2500 125000 7.0711 3.6840
The following question is based on the table above.
What is the square of 4.5?
1.20.25
2.202.5
3.2025
4.6.7082
5. None of the above
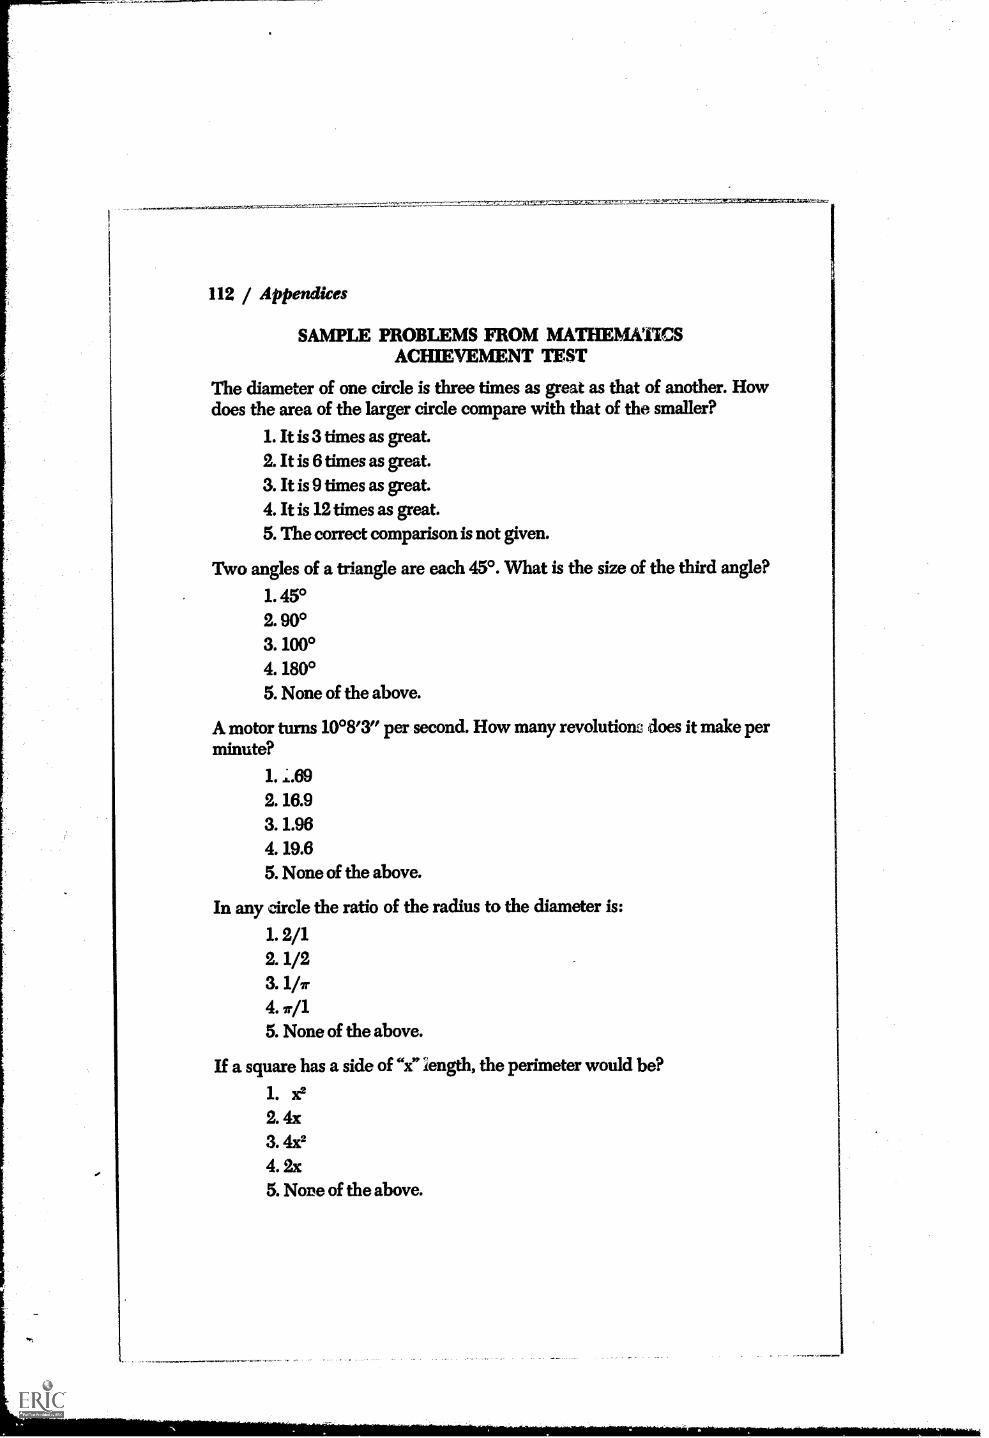
112 / Appendices
SAMPLE PROBLEMS FROM MATHEMATICSACHIEVEMENT TEST
The diameter of one circle is three times as great as that of another. Howdoes the area of the larger circle compare with that of the smaller?
1. It is 3 times as great.2. It is 6 times as great.3. It is 9 times as great.4. It is 12 times as great.5. The correct comparison is not given.
Two angles of a triangle are each 45°. What is the size of the third angle?
1.45°2.90°3.100°4. 180°5. None of the above.
A motor turns 10°8'3" per second. How many revolution: does it make perminute?
1.
2.16.93.1.964.19.65. None of the above.
In any circle the ratio of the radius to the diameter is:
1.2/12.1/23.1 /r4. r/15. None of the above.
If a square has a side of "x" 'length, the perimeter would be?
1. x22.4x3.4x24. 2x
5. None of the above.
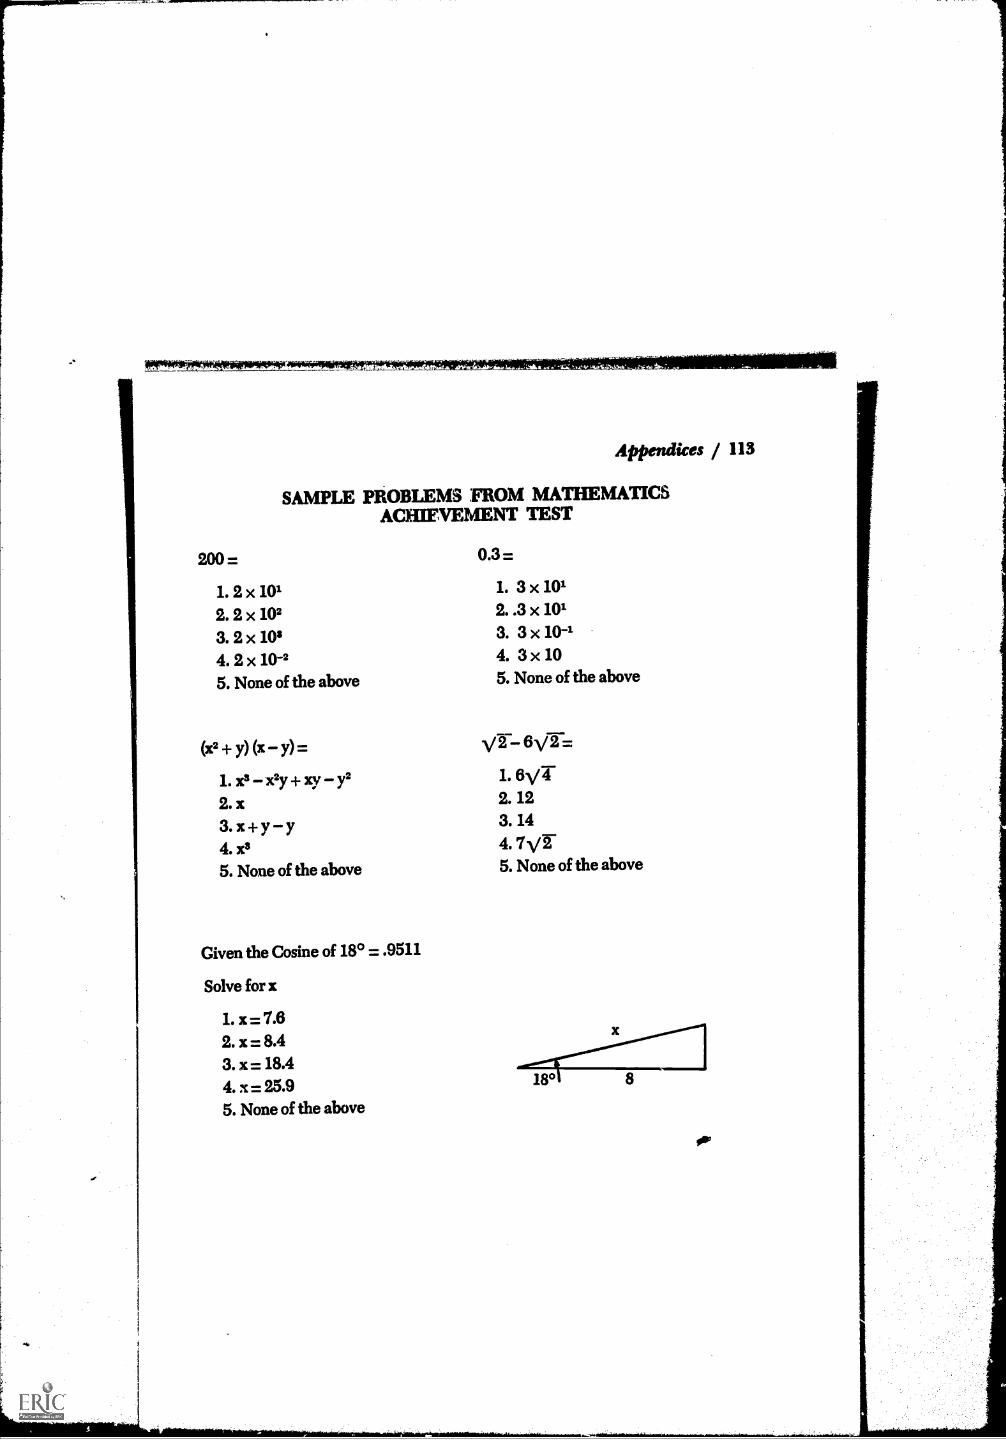
Appendices / 113
SAMPLE PROBLEMS FROM MATHEMATICSACHIEVEMENT TEST
200 = 0.3 =
1. 2 x 101 1. 3 x 101
2.2 x 10² 2. .3 x 101
3. 2 x 10³ 3. 3 x 10⁻¹
4.2 x 10⁻² 4. 3 x 10
5. None of the above 5. None of the above
(x2+ y) (x y) = 6)/2=
1. x2y + xy y2
2. x3. x + y y4. x'5. None of the above
Given the Cosine of 18° = .9511
Solve for x
1. x=7.62. x = 8.43. x = 18.44. x = 25.95. None of the above
1.6/42.123.144.7/25. None of the above
180 8

Appendix C
DATA

DATA FROM INTERVIEWS WITH TECHNICAL WORKERS
ID No. Age Mobility*
1
23456789
101112131415161718192021222324252627282930
31 2632 3533 4334 4635 2838 3237 3638 2439 3640 41
41 3642 21
43 4744 4445 2346 3047 4848 3549 31
50 2751 2452 3553 37
54 2855 42
56 41
57 3258 3559 24
60 3661 2862 25
Education Interestdeveloped
Personalinfluence
Receivedtraining Mathematics Job classification
A.A. Service None Service Beyond Research and development
A.A. Hobby None Service Algebra Communications
H.S. + School Family On own Trigonometry Research and development
H.S. Service None Service Trigonometry Design draftsman
A.A. + None None Public school Beyond Research and development
A.A. + Hobby None Service Differential calculus Research and development
H.S. + Hobby Family Public school Trigonometry TestA.A. Hobby None Industry Integral calculus Research and development
H.S. + Service None Service Differential calculus TestH.S. + Service None Service Trigonometry Research and development
H.S. + Service None industry Integral calculus TestH.S. + Hobby None Industry Integral calculus Research and development
A.A. Hobby None Industry Trigonometry TestA.A. Service None Industry Integral calculus Computer
A.A. + None None Public school Integral calculus Field service
H.S. + None None Public school Integral calculus Field service
H.S. + Service None Service Less than algebra Field serviceH.S. + Hobby Friend Service Algebra Communications
A.A. Service None Service Intermediate Algebra Communications
A.A. + Service Family Industry Trigonometry TestA.A. None Family Private school Analytical geometry Instrument maintenanceA.A. Hobby None Industry Trigonometry Instrument maintenance
H.S. + Service Friend Industry Differential calculus Research and development
A.A. Service None Private school Trigonometry Television and radio
H.S. None Family Industry Algebra Research and development
H.S..+ Hobby Family Industry Trigonometry Television and radio
A.A. None None Private school Trigonometry Research and development
A.A. + Hobby None On own Integral calculus Research and development
A.A. + Hobby Teacher Industry Differential calculus TestA.A. None None Industry Analytical geometry Test
H.S. Hobby None Service Algebra Test
H.S. + Service Teacher Service Trigonometry Test
H.S. + None None Service Less than algebra Research and development
A.A. Job Family Private school Higher algebra Test
H.S. + Job None Industry Trigonometry Test
H.S. + Hobby Family On own Trigonometry Test
H.S. None Family Service Trigonometry Test
H.S. + Service None Industry Solid geometry Test
H.S. + None Family Service Solid geometry Test
H.S. + Hobby None Industry Trigonometry Instrument re ainten an c e
A.A. + None None Industry Trigonometry Test
A.A. + Teacher None Public school Integral calculus Research and development
A.A. + None None Industry Integral calculus Research and development
A.A. + Hobby None Industry Differential calculus Research and development
H.S. None None Industry Algebra Test
A.A. None None Industry Integral calculus Research and development
A.A. Service None Service Trigonometry Research and development
A.A. + None None Industry Trigonometry Television and radio
A.A. + None Friend Private school Analytical geometry Television and radio
H.S. Service None Industry Less than algebra Plant maintenance
A.A. Service None Industry Trigonometry Test
A.A. + None None Private school Beyond Computer
A.A. None Family Private school Solid geometry Plant maintenance
A.A. + Service None Service Differential calculus Test
H.S. + Hobby Teacher Service Less than algebra Test
A.A. Service None Private school Integral calculus Computer
H.S. + Hobby Family Service Algebra Test
A.A. + None None Private school Analytical geometry Research and development
H.S. + Service None Industry Integral calculus Test
A.A. + Hobby None Industry Trigonometry Design draftsman
A.A. Job None Industry Analytical geometry Research and development
A.A. Hobby Friend On own Algebra Research and development
Mobility: .3 a stable; UM B upwardly mobile; HM horizontally mobile.

DATA FROM INTERVIEWS WITH TECHNICAL WORKERSContinued
ID No. Age Mobility* Education PvteloTetd ititerimille t rainingReoeived Mathematics Job clarification
63 27 UM A.A. + Service None Public school Beyond Research and development64 30 UM A.A. + Service None On own Beyond Research and development65 23 UM A.A. + Service None Public school Beyond Research and development66 28 UM H.S. + School Teacher Industry Higher algebra Test67 30 HM A.A. + Hobby None On own Analytical geometry Test68 28 UM A.A. + Service None Industry, integral calculus Research and development69 41 S H.S. + Service None On own Trigonometry Research and development70 45 S A.A. + Job None On own Trignometry Test71 26 5 U.S. + Hobby Friend Industry Intermediate algebra Research and development72 30 S A.A. Service None Public school Integral calculus Design draftsman73 32 5 A.A. + School Teacher Industry Trigonometry Instrument maintenance74 48 5 H.S. + Hobby Teacher Industry Trigonometry Test75 23 5 H.S. + None Family Industry Trigonometry Test .
76 29 UM A.A. + Hobby None Private school Beyond Research and development77 29 HM A.A. Hobby None Private school Trigonometry Test78 24 HM A.A. Service None Service Trigonometry Research and development79 34 5 H.S. + Service None Industry Trigonometry Test80 34 5 H.S. + Service None Industry Trigonometry Test81 27 HM H.S. Service None Service Trigonometry Communications82.... 45 UM A.A. + Hobby Friend Service Integral calculus Communications83 40 S H.S. + Hobby Friend Industry Analytical geometry Communications84 40 5 A.A. Hobby Teacher Industry Trigonometry Communications85 44 8 H.S. Job None Industry Intermediate algebra Test86 42 S A.A. School Friend On own Higher algebra Test87 30 5 A.A. + Service None Public school Integral calculus Test88 29 5 H.S. Job Family Private school Higher algebra Instrument maintenance89 23 HM H.S. Service None Industry Algebra Plant maintenance90 30 5 A.A. School None Industry Analytical geometry Research and development
Mobility: S re stable; UM upwardly mobile; HY horisontally mobile.
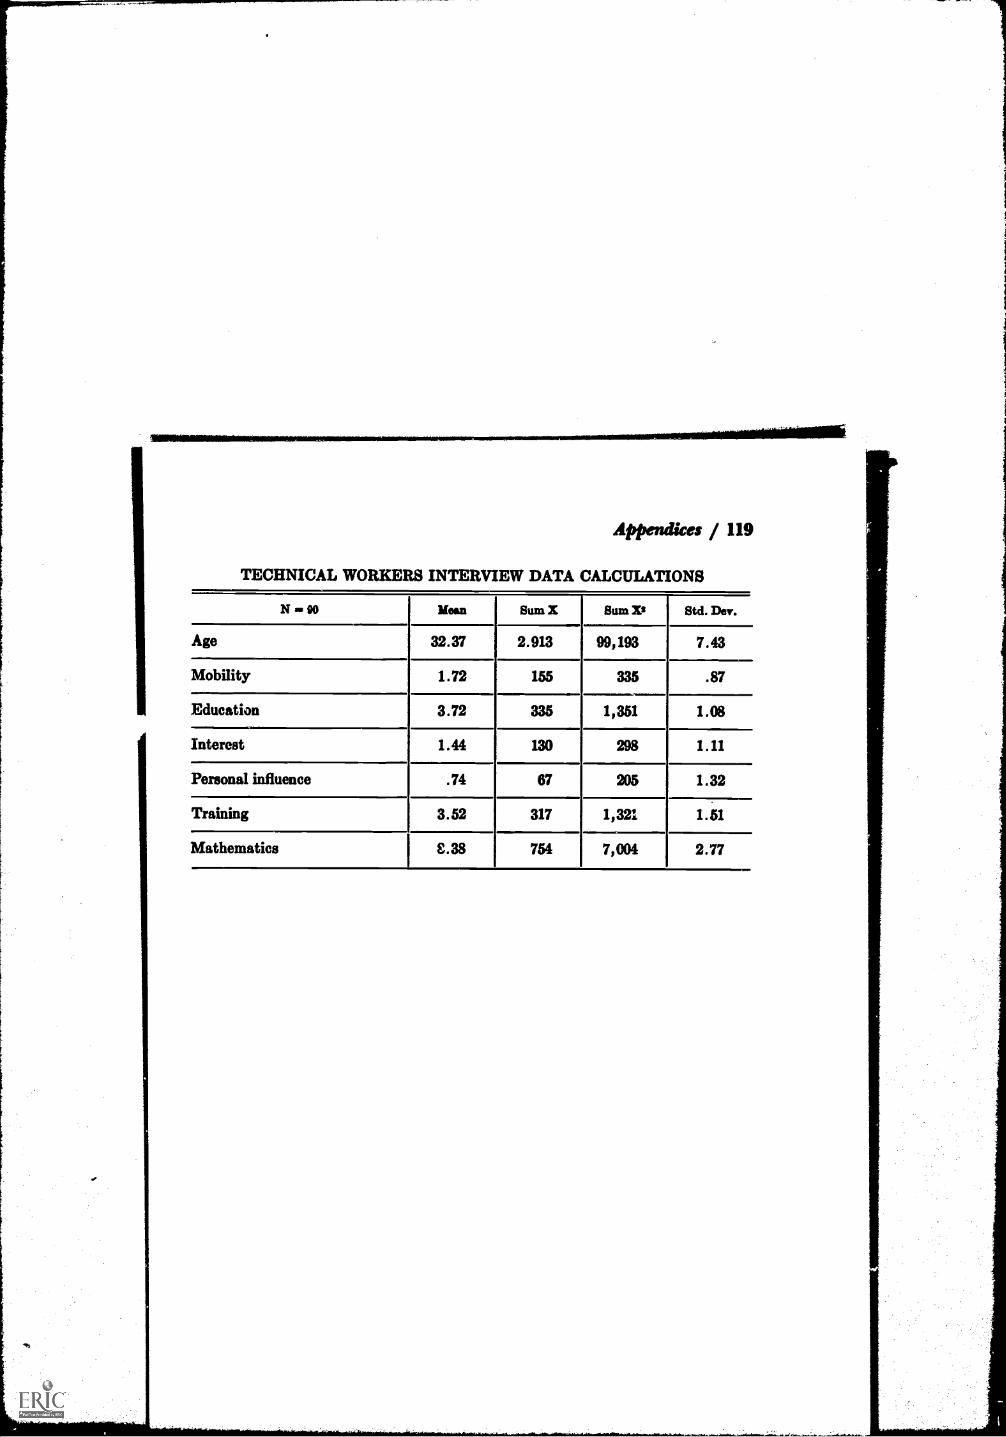
Appendices / 119
TECHNICAL WORKERS INTERVIEW DATA CALCULATIONS
N - 90 Mean Sum X Sum Xs Std. Dew.
Age 32.37 2.913 99,193 7.43
Mobility 1.72 155 335 .87
Education 3.72 335 1,351 1.08
Interest 1.44 130 298 1.11
Personal influence .74 67 205 1.32
Training 3.52 317 1,321 1.51
Mathematics I E.38 754 7,004 2.77
40-

CO
RR
EL
AT
ION
OF
INT
ER
VIE
W D
AT
AA
LL
TE
CH
NIC
AL
WO
RK
ER
S
N =
90
Age
1.00
0
Mob
ility
-.29
2*1.
000
Form
al e
duca
tion
.028
- .1
061.
000
Inte
rest
dev
elop
ed.1
43-
.126
- .0
27I
Pers
onal
infl
uenc
e.2
43t
- .1
89-.
121
I
Tra
inin
g re
ceiv
ed-
.057
- .1
95.0
07I
Form
al m
athe
mat
ics
- .0
94-
.146
.622
I
fr4
1.00
0-
.169
- .0
18I
1.00
0-.
172
I
1.00
0I
IN s
igni
fica
nt a
t 1%
.t
sign
ific
ant a
t M.
1.00
0
.185
- .0
33
- .0
84
1-2
.431
1'
-.33
1
.153
1.00
0
TE
STN
= 3
2"
1.00
0
- .0
171.
000
- .2
15-
.023
1.00
0
4.5
H.
cal
.425
t-.
291
- .2
42A
ge
- .2
08-
.232
-.14
2M
obili
ty
- .1
00-
.013
.605
Form
al E
..z.lu
catio
n
.273
- .1
81-
.093
Inte
rest
dev
elop
ed
1.00
0-
.219
- .1
54Pe
rson
al in
flue
nce
1.00
0.0
68T
rain
ing
rece
ived
1.00
0Fo
rmal
mat
hem
atic
s

PLA
NT
MA
INT
EN
AN
CE
N -
3
Age
1.00
0
Mob
ility
-.96
1
Form
al e
duca
tion
.961
Inte
rest
dev
elop
ed-.
961
Pers
onal
infl
uenc
e.9
61
Tra
inin
g re
ceiv
ed-.
961
Form
al m
athe
mat
ics
.817
1.00
0
us s
igni
fican
t at 1
%.
sign
ifica
nt a
t 5%
.
1111
1111
111.
1111
111.
1111
1111
.111
1MM
INill
CO
RR
EL
AT
ION
OF
INT
ER
VIE
W D
AT
A
1.00
- 1.
00
1.00
- 1.
00
1.00
- .4
45
15:1
.089
1.00
0
1.00
-1.0
01.
00
1.00
-1.0
01.
00
-1.0
01.
00-1
.00
1.00
.945
.945
.945
-.94
5
iy
11 3
.064
- .0
66.5
98.8
02
.320
--.7
39--
.373
- .1
67
1.00
0--
.384
.537
.480
1.00
0.2
75.1
23
1.00
0.0
00
1.00
0
1.00
INST
RU
ME
NT
MA
INT
EN
AN
CE
N -
5
Age
.646
Mob
ility
.620
Form
al e
duca
tion
- .9
53In
tere
st d
evel
oped
.000
Pers
onal
infl
uenc
e
.000
Tra
inin
g re
ceiv
ed
1.00
0Fo
rmal
mat
hem
atic
s
..mso
mio
nsw
auss
mom
mill
nalle
ili

CORRELATION
OF
INT
ER
VIE
W D
AT
ARICSMARCH AND
DIV
EL
OPM
EN
Ts.
,
Non
29
Age
1.00
0
Mob
ility
- .4
49*
1.00
0
Form
al e
duca
tion
- .106
.176
Inte
rest
dev
elop
ed- .
204
.215
Pers
onal
infl
uenc
e-.090
.038
Tra
inin
g re
ceiv
ed.126
-.354
Form
al m
athe
mat
ics
- .199
- .014
1.000
-.629
1.000
al s
igtd
fisa
nt a
t I%
.t m
a si
gnif
ican
t at 5
%.
1.000
- .262
- .316
-.088
1.000
,043
.069
1.000
.139
1.000
.583
-.253
- .509
.099
1.000
11 088
068
1.000
.405
.825
a
Wi
COMMUNICATIONS
N -8
.367
Age
- .311
- .508
- .180
2.76
Mob
ility
.218
-.224
.378
.465
Form
al e
duca
tion
1.000
.570
.577
.178
Inte
rest
dev
elop
ed
1.000
- .066
.304
Pers
onal
infl
uenc
e
1.000
.103
Tra
inin
g re
ceiv
ed
1.00
0Fo
rmal
mat
hem
atic
s

CO
MPU
TE
R
N -
3
CO
RR
EL
AT
ION
OF
INT
ER
VIE
W D
AT
A
Age
1.00
0
Mob
ility
- .822
1.000
Form
al e
duca
tion
.082
.500
Inte
rest
dev
elop
ed-
.082
- .500
Pers
onal
infl
uenc
e.0
00.0
00
Tra
inin
g re
ceiv
ed-.997t
.866
Form
al m
athe
mat
ics
.082
.500
1.000
.327
1.000
g si
gnifi
cant
at 1
%.
t g s
igni
fica
ntat
5%
.
1.00
0
1.0*
1.00
0
.000
.000
.000
.000
1.00
0-1
.000
1.00
0
.000
1.00
0
.000
.000
1.00
0 aa
g
IIil
- 8
roi
3g
1Z4
044
li1.
1il
sg-a
&'
ovr.,
.945t
- .189
.000
.189
.000
.866
.000
-.866
-.866
1.000
- .500
.000
.500
.500
1.000
.000
-1.000
-1.000
1.000
.000
.000
1.000
1.000
FIELDSERVICE
N -
3
.189
Age
Mob
ility
Form
al e
duca
tion
Inte
rest
dev
elop
ed
Pers
onal
infl
uenc
e
Tra
inin
g re
ceiv
ed
I1.
mFo
rmal
mat
hem
atic
s

CO
RR
EL
AT
ION
OF
INT
ER
VIE
W D
AT
AR
AD
IO A
ND
TE
LE
VIS
ION
N Agi
-311
Mob
ility
Form
al e
duca
tion
Inte
rest
dev
elop
ed
Pers
onal
infl
uenc
e
1.00
0
.000
- .1
49 .000
- .1
11
1.00
0
.000
.000
.000
1.00
0
.000
.243
Tra
inin
g re
ceiv
ed
form
al m
athe
mat
ics
.991
*
- .4
28
1.00
0
.000
.000
A .277
1.00
0
- .2
46
.957
*
14 .891
*
- .1
89
I1.
000
1.00
0
.000
1.00
0
.000
I-.
046
.000
L; .000
.000
.298
.000
.000
1.00
0
- .5
10
.996
*
.189
1.00
0 a
wi
- .2
77
-1.0
00
.000
.000
.929
t.1
89
DE
SIG
N D
RA
FTSM
AN
N -
3
Age
Mob
ility
Form
al e
duca
tion
1.00
0.0
00.0
00.0
00
1.00
0.0
00
1.00
0
.000
- .1
89
Inte
rest
dev
elop
ed
Pers
onal
infl
uenc
e
Tra
inin
g re
ceiv
edM
a si
gnifi
cant
at 1
%.
t Nu
sign
ifica
nt a
t 5%
.1.
000
Form
al m
athe
mat
ics

CO
RR
EL
AT
ION
S FO
R R
ESU
LT
AN
T Q
-SO
RT
S
Inst
ruo-
,.. t°-
Reo
.or
der
ofin
str.
Tot
alT
ech.
wor
ker
Cor
n-Pu
t"C
om-
min
im-
tiono
Des
ign
draf
tym
an
T.V
.an
dra
dio
Ree
e . r
ahan
d ae
vel-
opm
ent
Iiita
lnru
t-
n=cl
ee-
inPa
ilann
te.t
nano
eFi
eld
serv
ice
Tes
t
Tes
t.9
24.7
17.8
70-.
241
.549
.470
.443
.872
.648
.613
.466
1.00
Fiel
d se
rvic
e.7
15.6
33.4
13-.
123
.028
.217
.392
.425
.336
.154
1.00
Plan
t mai
nten
ance
.869
.825
.739
-.36
4.6
76.5
73.2
96.7
15.5
261.
00
Inst
rum
ent m
aint
enan
ce.8
84.7
49.7
79-
.249
.636
.285
.299
1.7
311.
00
Res
earc
h an
d de
velo
pmen
t.9
60.8
33.9
93-
.115
.676
.640
.397
1.00
Tel
evis
ion
and
radi
o.7
11.5
84.4
35-.
202
.217
.202
1.00
Des
ign
draf
tsm
an.8
37.7
35.6
76-.
470
.395
1.00
Com
mun
icat
ions
.855
I.7
61.7
19-
.502
1.00
Com
pute
r.3
73.1
91-.
225
1.00
Tot
al te
chni
cal w
orke
rs.7
62.5
231.
00
Rec
. ord
er o
f in
stru
ctor
.619
1.00
Inst
ruct
ors
1.00
.111
11.1
.111
1101
1111
0111
1111
1010
1NIM
PO
NO
MM
INIm
mis
irim
p,

126 / Appendices
AnsarainsailatiOnniklilt
MEAN CORRELATIONS OF Q-SORT DATA BY JOB CLASSIFICATION
Job classification N Mama correlation
Research and development 29 .382
Test 32 .344
Communications 8 .384
Plant maintenance 5 .527
Radio and television 4 .637
Design draftsman 3 .547
Computer 3 .215
Field service 3 .587
Instrument maintenance 3 .590
Total 90
Instructors 29 .528

fi il jl ii
DA
TA
FR
OM
IN
TE
RV
IEW
S W
ITH
IN
STR
UC
TO
RS
ID N
o.A
geM
obili
ty*
Edu
catio
nIn
tere
stde
velo
ped
Pers
oral
infl
uenc
eR
ecei
veci
trai
ning
Mat
hem
atic
s
-.,
Job
clas
sifi
catio
n
103
22U
MB
.A.
Scho
olN
one
Serv
ice
Bey
ond
Res
earc
h an
d de
velo
pmen
t10
642
SH
.S. +
Non
eN
one
Non
eD
iffe
rent
ial c
alcu
lus
Plan
t mai
nten
ance
121
32H
MA
.A. +
Serv
ice
Tea
cher
Serv
ice
Inte
gral
cal
culu
sE
lect
rici
an12
329
SA
.A.
Serv
ice
Non
eSe
rvic
eD
iffe
rent
ial c
alcu
lus
Fiel
d se
rvic
e12
532
SM
.A.
Hob
byT
each
erPu
blic
sch
ool
Inte
gral
cal
culu
sT
elev
isio
n an
d ra
dio
repa
ir12
746
SM
.A. ±
Serv
ice
Non
eSe
rvic
eIn
tegr
al c
alcu
lus
Inst
rum
ent m
aint
enan
ce12
840
MI
A.A
.H
obby
Non
eSe
rvic
eA
lgeb
raT
elev
isio
n an
d ra
dio
repa
ir12
930
HM
A.A
. +Se
rvic
eN
one
Serv
ice
Solid
geo
met
ryR
esea
rch
and
deve
lopm
ent
130
40U
MA
.A. +
Non
eFa
mily
Serv
ice
Dif
fere
ntia
l cal
culu
sT
elev
isio
n an
d ra
dio
repa
ir13
140
UM
B.A
.N
one
Non
eSe
rvic
eA
naly
tical
geo
met
ryT
elev
isio
n an
d ra
dio
repa
ir13
256
SA
.A.
Non
eT
each
erPu
blic
sch
ool
Tri
gono
met
ryPl
ant m
aint
enan
ce13
332
UM
B.A
.Fr
iend
Tea
cher
Publ
ic s
choo
lD
iffe
rent
ial c
alcu
lus
Tes
t13
433
UM
M.A
.H
obby
Tea
cher
Serv
ice
Ana
lytic
al g
eom
etry
Tel
evis
ion
and
radi
o re
pair
135
27S
H.S
.N
one
Fam
ilyPu
blic
sch
ool
Dif
fere
ntia
l cal
culu
sFi
eld
serv
ice
137
34H
MB
.A.
Non
eN
one
Serv
ice
Inte
gral
cal
culu
sE
lect
rici
an13
837
UM
B.A
.H
obby
Frie
ndSe
rvic
eD
iffe
rent
ial c
alcu
lus
Tel
evis
ion
and
radi
o re
pair
139
49S
M.A
. +H
obby
Non
eSe
rvic
eIn
tegr
al c
alcu
lus
Ele
ctri
cian
140
27H
MB
.A.
Scho
olN
one
Publ
ic s
choo
lD
iffe
rent
ial c
alcu
lus
Res
earc
h an
d de
velo
pmen
t14
150
SM
.A.
Hob
byN
one
On
own
Dif
fere
ntia
l cal
culu
sE
lect
rici
an14
254
HM
B.A
.H
obby
Non
ePu
blic
sch
ool
Inte
gral
cal
culu
sT
elev
isio
n an
d ra
dio
repa
ir14
332
HM
A.A
. +Se
rvic
eN
one
Serv
ileIn
tegr
al c
alcu
lus
Tel
evis
ion
and
radi
o re
pair
244
59S
M.A
.H
obby
Frie
ndO
n ow
nIn
tegr
al c
alcu
lus
Tel
evis
ion
and
radi
o re
pair
145
46H
MB
.A.
Non
eN
one
Indu
stry
Ana
lytic
al g
eom
etry
Com
pute
r14
653
UM
B.A
..e
'am
ilyT
each
erPu
blic
sch
ool
Inte
gral
cal
culu
sT
elev
isio
n an
d ra
dio
repa
ir14
728
HM
A.A
.H
obby
Tea
cher
Indu
stry
Tri
gono
met
ryC
omm
unic
atio
ns14
851
SB
.A.
Hob
byN
one
Serv
ice
Inte
gral
cal
culu
sFi
eld
serv
ice
149
29H
MA
.A.
Non
eFr
iend
Serv
ice
Ana
lytic
al g
eom
etry
Tel
evis
ion
and
radi
o re
pair
150
33S
H.S
. +N
one
Non
eSe
rvic
eT
rigo
nom
etry
Com
mun
icat
ions
Mob
ility
: S I
le s
tabl
e; I
TM
Inup
war
dly
mob
ile; E
M1.
1ho
rizo
ntal
ly m
obile
.

iconw.0,10-4,
128 / Appendices
INSTRUCTOR INTERVIEW DATA CALCULATIONS
N m 29 Mean Sum. X Sum X2 Std. dev.
Age 38.90 1,128 46,772 10.17
Mobility '2.00 58 138 .88
Education 5.45 158 920 1.45
Interest 1.31 38 84 1.11
Personal influence 1.21 35 113 1.69
Training 2.34 68 188 1.01
Mathematics 9.72 282 2,838 1.85

Appendices / 129
DATA ON STUDENTS IN BAKERSFIELD STUDY
ID Group Scat -V Scat -Q! Seat-T AgeYrs.H.S.math
Avg.H.S.grade
Pre Yost
9 1 293 310 300 19 4 B 52 59
63 3 279 294 2RF1 19 3 C 48 53
93 3 281 319 298 19 3 C 47 53
64 3 287 291 289 21 2 C 40 40
10 1 293 308 299 19 3 B 56 60
92 1 293 316 303 20 I. 4 C 58 62
5 1 299 316 306 19 2 C 58 69
8 1 308 311 09 19 2 C 25 38
17 1 286 296 290 20 2 B 45 54
2 1 286 :321 301 19 4 B 56 71
4 1 236 316 299 25 1 C 46 55
1 1 298 321 309 19 4 C 59 59
21 1 269 288 280 19 1 C 41 44
16 1 292 307 ZS 19 3 C 46 60
33 1 295 310 301 19 2 C 40 49
28 1 286 317 299 23 1 C 49 67
34 1 288 308 297 19 2 D 40 40
18 1 277 296 286 20 3 C 44 53
13 1 298 305 301 20 2 B 41 43
23 1 298 283 291 19 1 D 34 48
22 1 286 284 285 19 1 B 31 24
26 1 292 323 304 19 1 C 49 52
7 1 286 313 297 20 3 C 51 58
16 1 286 297 291 19 2 C 41 46
14 1 277 300 289 19 2 C 47 46
3 1 317 319 319 19 3 C 60 64
44 1 292 294 293 23 2 C 26 31
19 1 277 288 283 20 1 B 36 45
20 1 260 292 280 21 1 C 27 44
75 3 292 308 299 18 3 C 44 67
62 3 284 297 290 19 4 C 46 60
71 3 295 316 304 19 2 C 39 58
74 3 266 310 289 19 1 D 48 49
12 1 294 307 299 19 2 C 32 37
54 3 279 307 292 23 2 C 51 49
70 3 283 316 297 19 3 B 56 57
1 electronics majors in the control acup.3 non-electronic. majors in the control group.
400;41,n.,

VD-
130 / Appendices
DATA ON STUDENTS IN BAKERSFIELD STUDY
ID Group Scat -V Scat, -t4 Scat -T AgeYrs.H.S.math
Avg.H.S.grade
Pie Post cap.
46 2 279 289 284 18 3 C 38 48 4690 4 292 317 303 21 2 C 37 50 6194 4 303 292 299 20 3 C 48 64 6391 4 286 281 284 20 2 C 28 43 5689 4 251 289 275 22 4 B 47 48 4338 2 263 305 286 19 1 D 34 40 4747 2 263 305 286 18 3 C 45 49 7425 2 284 330 303 19 3 C 57 66 4743 2 260 296 281 19 1 C 33 35 3641 2 290 299 294 25 2 B 27 35 8630 2 294 314 303 !,9 4 C 59 68 6748 2 302 268 289 19 1 C 32 33 6829 2 301 317 308 19 4 C 54 57 7736 2 286 302 293 20 4 C 42 55 6737 2 271 305 289 19 3 C 40 52 5531 2 287 314 299 19 4 C 52 64 9340 2 303 299 301 19 2 C 50 61 8052 4 290 311 299 19 3 C 46 52 6256 4 296 304 299 20 1 C 42 51 7783 4 295 244 295 19 3 C 51 57 4681 4 277 299 288 19 3 D 38 49 7259 4 254 302 283 19 1 C 38 42 8853 4 271 310 291 19 2 C 39 49 8361 4 269 299 285 19 2 D 60 57 7965 4 286 290 286 22 1 B 44 53 4784 4 284 291 287 21 4 C 31 44 6173 4 271 310 291 19 1 C 27 32 6778 4 281 302 291 19 2 D 29 42 54
2 electronic majors in the experimental group.4 . non-electronics majors in the experimental group.

L
Appendices / 131
SPLIT-HALVES CORRELATION ON MATHEMATICALPRE-TEST
Odds Evens
E X = 1401
N = 66
EX' = 31,179
= 21.33
= V28.42
E XY = 32,260
E 1456
66
E Y2 = 33,994
My = 22.06
ai, = 1/21.82
E112. Mi,
r = .824'Crx Cry
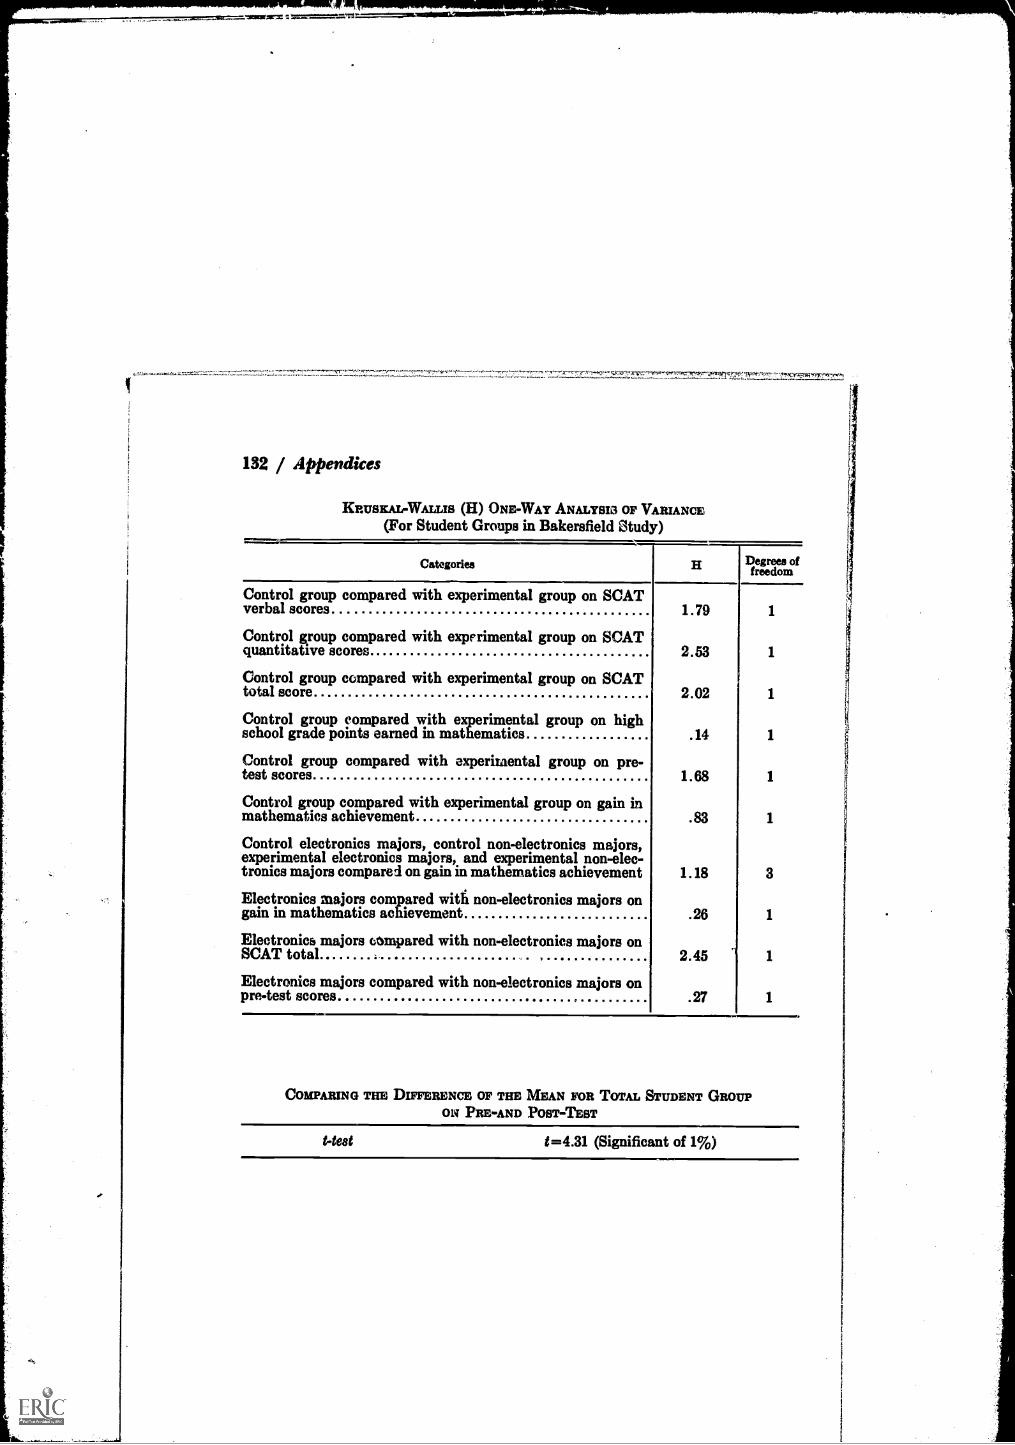
132 / Appendices
KRUSKAL-WALLIS (H) ONE-WAY ANALYSIS OF VARIANCE(For Student Groups in Bakersfield Study)
Categories
Control group compared with experimental group on SCATverbal scores
Control group compared with experimental group on SCATquantitative scores
Control group compared with experimental group on SCATtotal score
Control group compared with experimental group on highschool grade points earned in mathematics
Control group compared with experimental group on pre-test scores
Control group compared with experimental group on gain inmathematics achievement
Control electronics majors, control non-electronics majors,experimental electronics majors,, and experimental non-elec-tronics majors compared on gain m mathematics achievement
Electronics majors compared witfi non-electronics majors ongain in mathematics achievement
Electronics majors compared with non-electronics majors onSCAT total
Electronics majors compared with non-electronics majors onpre-test scores
H Degrees offreedom
1.79 1
2.53 1
2.02 1
.14 1
1.68 1
.83 1
1.18 3
.26 1
2.45 1
.27 1
COMPARING THE DIFFERENCE OF THE MEAN FOR TOTAL STUDENT GROUPON PRE AND POST-TEST
Nest t=4.31 (Significant of 1%)

1
Appendkes / 13!
ei'LIT.HALVES CORRELATION ON MATHEMATICALPRE-TEST
Odds Evens
E x = 1401
N = 66
E x2 = 31,179
M. = 21.33
cr. = V28.42
E XI' = 32,260
E Y = 1456
N = 66
E Y2 = 33,994
My = 22.06
cry = V21.82
EZY 71/* IVN - SU x J.VA y
r= -----as ay
.824'
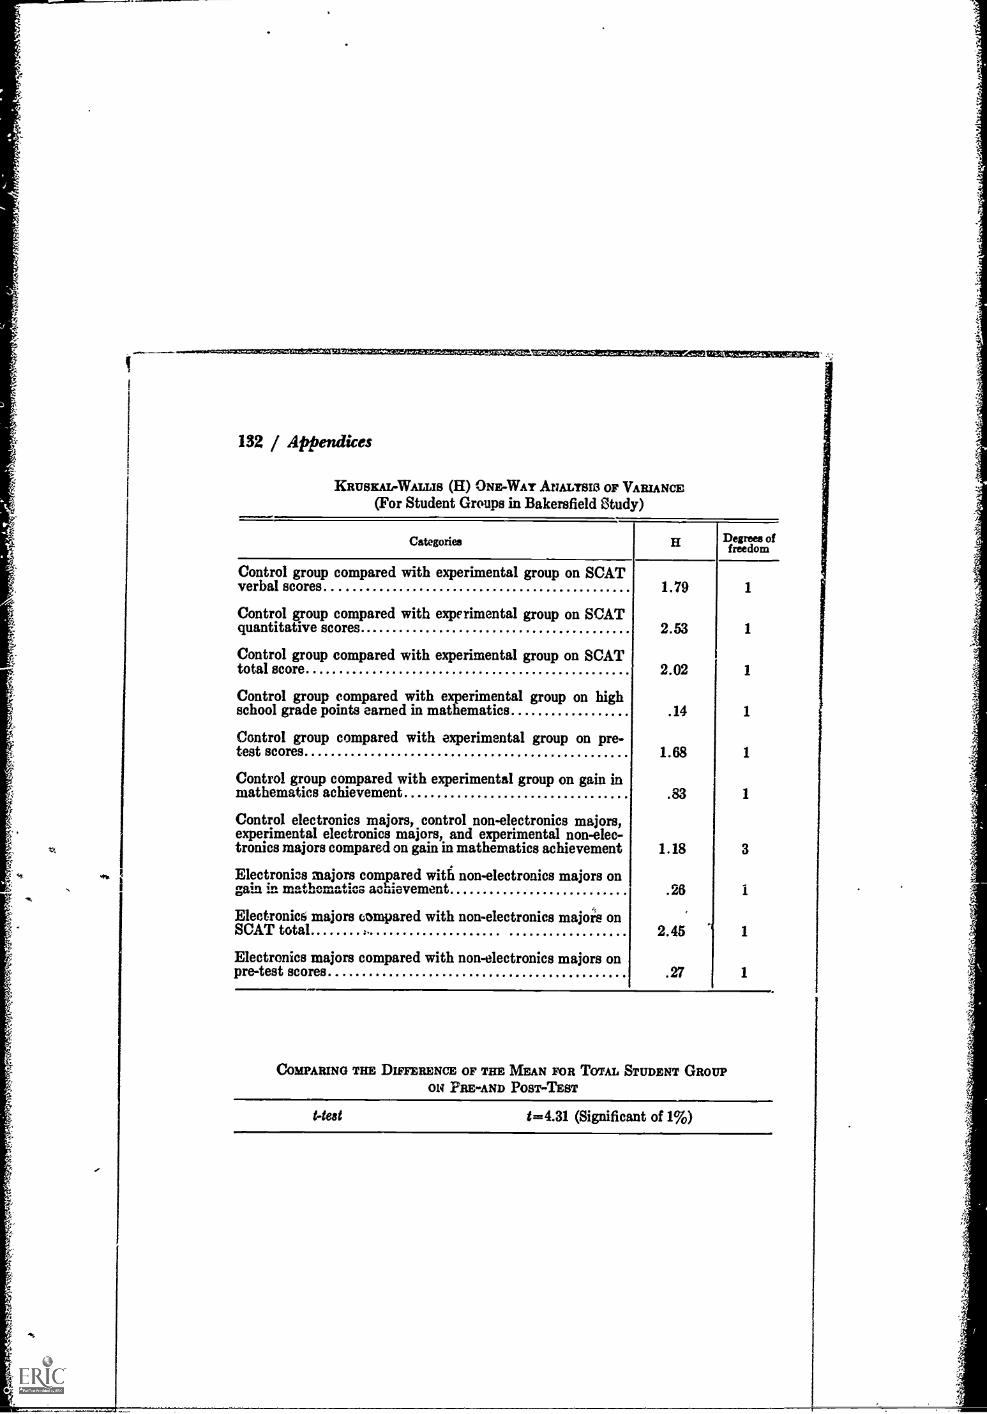
.V
132 / Appendices
KRUSKAL-WALLIS (H) ONE-WAY ANALYSIG OF VARIANCE(For Student Groups in Bakersfield Study)
IZIMEMIMMIEMSEIVISM-,;
Categories
Control group compared with experimental group on SCATverbal scores
Control group compared with experimental group on SCATquantitative scores
Control group compared with experimental group on SCATtotal score
Control group compared with experimental group on highschool grade points earned in mathematics
Control group compared with experimental group on pre-test scores
Control group compared with experimental group on gain inmathematics achievement
Control electronics majors, control non-electronics majors,experimental electronics majors, and experimental non-elec-tronics majors compared on gain in mathematics achievement
Electronics majors compared with non-electronics majors ongain in mathematics achievement
Electronics majors compared with non-electronics major's onSCAT total
Electronics majors compared with non-electronics majors onpre-test scores
H Degrees offreedom
1.79 1
2.53 1
2.02 1
.14 1
1.68 1
.83 1
1.18 3
.26
2.45 1
.27 1
COMPARING THE DIFFERENCE OF THE MEAN FOR TOTAL STUDENT GROUPON PRE AND POST-TEST
1-test 1=4.31 (Significant of 1%)