report 10-531: corrosion inhibitors in concrete second interim report
TRANSCRIPT

State of Florida Department of Transportation
Corrosion Inhibitors in Concrete Second Interim Report
FDOT Office State Materials Office
Research Report Number
FL/DOT/SMO/10-531
Authors Mario A. Paredes
Andres A. Carvallo Richard J. Kessler
Yash P. Virmani Alberto A. Sagüés
Date of Publication
February 2010
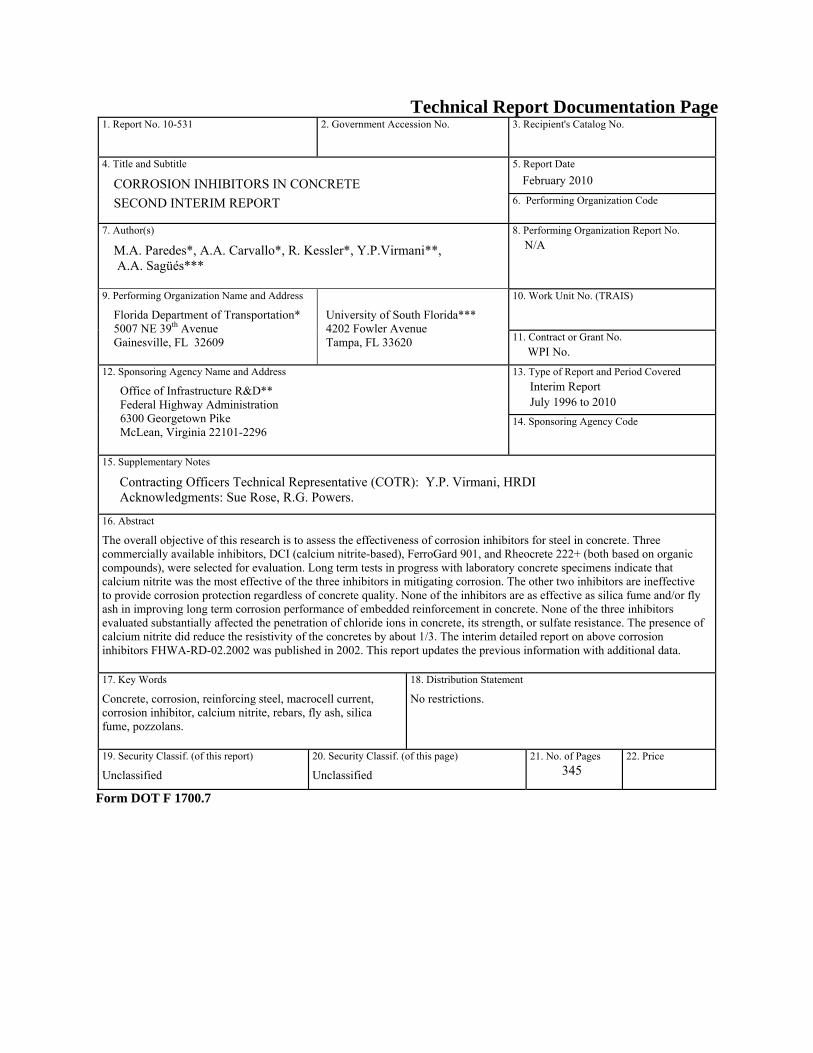
Technical Report Documentation Page 1. Report No. 10-531
2. Government Accession No.
3. Recipient's Catalog No.
4. Title and Subtitle
CORROSION INHIBITORS IN CONCRETE SECOND INTERIM REPORT
5. Report Date February 2010 6. Performing Organization Code
7. Author(s)
M.A. Paredes*, A.A. Carvallo*, R. Kessler*, Y.P.Virmani**, A.A. Sagüés***
8. Performing Organization Report No. N/A
9. Performing Organization Name and Address
Florida Department of Transportation* 5007 NE 39th Avenue Gainesville, FL 32609
University of South Florida*** 4202 Fowler Avenue Tampa, FL 33620
10. Work Unit No. (TRAIS)
11. Contract or Grant No. WPI No.
12. Sponsoring Agency Name and Address
Office of Infrastructure R&D** Federal Highway Administration 6300 Georgetown Pike McLean, Virginia 22101-2296
13. Type of Report and Period Covered Interim Report July 1996 to 2010
14. Sponsoring Agency Code
15. Supplementary Notes
Contracting Officers Technical Representative (COTR): Y.P. Virmani, HRDI Acknowledgments: Sue Rose, R.G. Powers.
16. Abstract
The overall objective of this research is to assess the effectiveness of corrosion inhibitors for steel in concrete. Three commercially available inhibitors, DCI (calcium nitrite-based), FerroGard 901, and Rheocrete 222+ (both based on organic compounds), were selected for evaluation. Long term tests in progress with laboratory concrete specimens indicate that calcium nitrite was the most effective of the three inhibitors in mitigating corrosion. The other two inhibitors are ineffective to provide corrosion protection regardless of concrete quality. None of the inhibitors are as effective as silica fume and/or fly ash in improving long term corrosion performance of embedded reinforcement in concrete. None of the three inhibitors evaluated substantially affected the penetration of chloride ions in concrete, its strength, or sulfate resistance. The presence of calcium nitrite did reduce the resistivity of the concretes by about 1/3. The interim detailed report on above corrosion inhibitors FHWA-RD-02.2002 was published in 2002. This report updates the previous information with additional data. 17. Key Words
Concrete, corrosion, reinforcing steel, macrocell current, corrosion inhibitor, calcium nitrite, rebars, fly ash, silica fume, pozzolans.
18. Distribution Statement
No restrictions.
19. Security Classif. (of this report)
Unclassified
20. Security Classif. (of this page)
Unclassified
21. No. of Pages 345
22. Price
Form DOT F 1700.7

ii

iii
EXECUTIVE SUMMARY This second interim report summarizes the findings of the last ten years of an ongoing investigation conducted jointly by the Florida Department of Transportation (FDOT) and the University of South Florida. The overall objective of this work is to assess the effectiveness of corrosion inhibitors for steel in concrete, with emphasis on new construction applications. The ability of the inhibitors to control corrosion far into the future is evaluated. Three commercially available inhibitors, W.R. Grace Calcium Nitrite (DCI), Sika FerroGard 901 (FER), and BASF Rheocrete 222+ (REO), were selected for examination. This report updates the progress to previous document “Corrosion Inhibitor Study, Interim Report1” FHWA-RD-02-2002 published in 2002. This interim report does not update all the objectives covered in the previous interim report, but only those objectives assessing long-term inhibitor performance in concrete under laboratory and field conditions for corrosion protection Tests are conducted with reinforced concrete specimens partially immersed in salt water, simulated deck slabs, and field test piles. The tests used a variety of concrete mixes, including those using Ordinary Portland Cement (OPC) and cement blended with pozzolanic additions (fly ash and silica fume). Results indicate that DCI was somewhat effective of the three inhibitors in mitigating corrosion. Tests with FER and REO specimens showed little evidence of effective corrosion protection. The performance improvements provided by the addition of corrosion inhibitors is minimal compared to the improvements obtained from the addition of fly ash and/or silica fume. Additional work, both in the laboratory and with test piles at a FDOT coastal test site, to assess the long-term performance of the inhibitors that is still in progress None of the inhibitors tested appear to strongly affect the concrete strength and chloride ions penetration. However, DCI did reduce the resistivity of the concrete by about 1/3 at 28 days of curing. This effect may somewhat increase the severity of corrosion after chloride concentration is above the protective action provided by the inhibitor. This investigation is in progress and the above findings are subject to update as more data is collected. The project duration was intended to be only seven years, but due to the use of High Performance Concrete (HPC), the project has lasted longer. Further updates on this project will be done through research paper publications.

iv
Table of Contents Introduction and Objectives .............................................................................................................1 Objective 4: Estimate Long-Term Effectiveness – Performance Tests 4.1 Perform Long-Term Laboratory Tests, Outdoor Sheltered Tests, and Field Tests .............3 4.1.1 Approach and Experimental Procedures ..................................................................3 4.1.2 Short Term Sheltered Outdoor Tests, Three-Bar Tombstone Columns ................11 4.1.3 Long-Term Laboratory Tests, ASTM G109 Specimens ........................................16 4.1.4 Long-Term Field Tests, Field Columns .................................................................19 4.2 Inhibitor Performance ........................................................................................................21 4.2.1 Calcium Nitrite-Based Inhibitor (DCI) ..................................................................22 4.2.2 Organic Corrosion Inhibitor F (Ferrogard 901) .....................................................22 4.2.3 Organic Corrosion Inhibitor R (Rheocrete 222+) ..................................................23 Objective 5: Determine Possible Negative Side Effects – Performance Tests ..............................24 5.1 Determine Effect of Insufficient Dosage on Corrosion Progression .................................24 5.1.1 Calcium Nitrite-Based Inhibitor (DCI) ..................................................................24 5.1.2 Organic Corrosion Inhibitor F (Ferrogard 901) .....................................................25 5.1.3 Organic Corrosion Inhibitor R (Rheocrete 222+) ..................................................26 5.2 Effect of Inhibitor on Chloride Threshold .........................................................................27 5.2.1 Chloride Profiles of Cores taken from Field Columns after 6.3 years ...................27 5.2.2 Chloride Profiles of Cores taken from Field Columns after 10.3 years .................30 5.3 Examine Possible Adverse Effects on Concrete Physical Properties ................................33 5.3.1 Transport Effects – Rapid Chloride Permeability ..................................................33 5.3.2 Transport Effects – Surface Resistivity of Water Saturated Concrete (SR) ..........36 5.3.3 Transport Effects – Impressed Current ..................................................................38 5.3.4 Compressive Strength ............................................................................................39 Conclusion .........................................................................................................................41 References ......................................................................................................................................43 Appendix 1 – Three-bar Tombstone Specimen Electrochemical Graphs ......................................45 Appendix 2 – G109 Specimen Electrochemical Graphs ..............................................................301 Appendix 3 – Field Specimen Electrochemical Graphs ..............................................................321
v
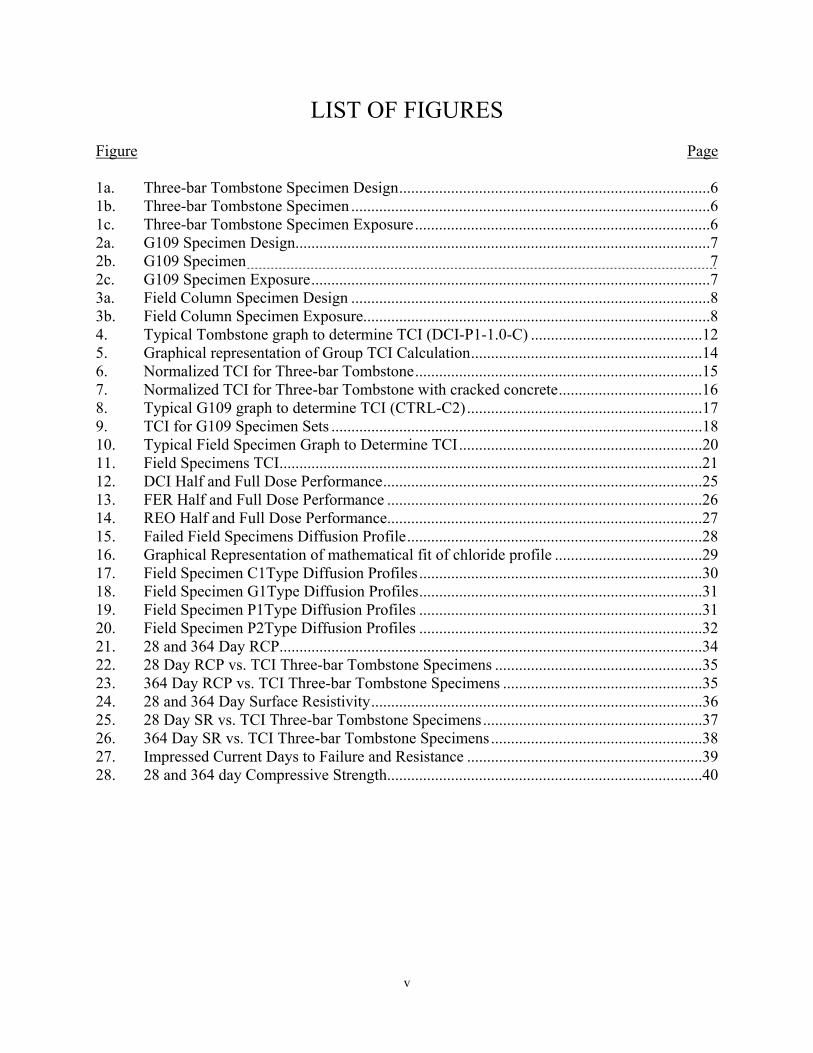
LIST OF FIGURES Figure Page 1a. Three-bar Tombstone Specimen Design ..............................................................................6 1b. Three-bar Tombstone Specimen ..........................................................................................6 1c. Three-bar Tombstone Specimen Exposure ..........................................................................6 2a. G109 Specimen Design........................................................................................................7 2b. G109 Specimen 7 2c. G109 Specimen Exposure ....................................................................................................7 3a. Field Column Specimen Design ..........................................................................................8 3b. Field Column Specimen Exposure.......................................................................................8 4. Typical Tombstone graph to determine TCI (DCI-P1-1.0-C) ...........................................12 5. Graphical representation of Group TCI Calculation ..........................................................14 6. Normalized TCI for Three-bar Tombstone ........................................................................15 7. Normalized TCI for Three-bar Tombstone with cracked concrete ....................................16 8. Typical G109 graph to determine TCI (CTRL-C2) ...........................................................17 9. TCI for G109 Specimen Sets .............................................................................................18 10. Typical Field Specimen Graph to Determine TCI .............................................................20 11. Field Specimens TCI ..........................................................................................................21 12. DCI Half and Full Dose Performance ................................................................................25 13. FER Half and Full Dose Performance ...............................................................................26 14. REO Half and Full Dose Performance...............................................................................27 15. Failed Field Specimens Diffusion Profile ..........................................................................28 16. Graphical Representation of mathematical fit of chloride profile .....................................29 17. Field Specimen C1Type Diffusion Profiles .......................................................................30 18. Field Specimen G1Type Diffusion Profiles .......................................................................31 19. Field Specimen P1Type Diffusion Profiles .......................................................................31 20. Field Specimen P2Type Diffusion Profiles .......................................................................32 21. 28 and 364 Day RCP..........................................................................................................34 22. 28 Day RCP vs. TCI Three-bar Tombstone Specimens ....................................................35 23. 364 Day RCP vs. TCI Three-bar Tombstone Specimens ..................................................35 24. 28 and 364 Day Surface Resistivity ...................................................................................36 25. 28 Day SR vs. TCI Three-bar Tombstone Specimens .......................................................37 26. 364 Day SR vs. TCI Three-bar Tombstone Specimens .....................................................38 27. Impressed Current Days to Failure and Resistance ...........................................................39 28. 28 and 364 day Compressive Strength...............................................................................40
vi
LIST OF TABLES Table Page 1. Concrete Mix Properties 5 2. Concrete Mix Matrix 9 3. Summary of Inhibitor Enhancing TCI ...............................................................................24 4. Field Specimen Calculated Diffusion Coefficient and TCI at 6.3 Years ...........................30 5. Field Specimen Calculated Diffusion Coefficient and TCI at 10.3 Years .........................32

- 1 -
INTRODUCTION AND OBJECTIVES The effectiveness of a steel corrosion inhibitor in concrete depends first on the ability of the inhibitor to remain in place in the concrete for what may be a very long service life (e.g. 100 years), and second on the ability to control corrosion even far into the future when chloride ions from the environment build up to significant levels at the reinforcement surface. Moreover, an appropriate corrosion inhibitor must not cause negative side effects such as pitting corrosion or degradation of physical properties of the concrete. Finally, use of a suitable corrosion inhibitor should favorably impact the life cycle cost of the structure. These considerations led to establishing multiple objectives as described in the interim report1. This report updates tasks related to assessing inhibitor performance in concrete under laboratory and field conditions. Objectives 1, 2, and 3 are not covered in this report since they were covered extensively in the interim1 report published in 2002. Objective 4: ESTIMATE LONG-TERM EFFECTIVENESS -PERFORMANCE TESTS Tasks:
4.1 Perform Long-Term Laboratory Tests, Outdoor Sheltered Tests, and Field Tests 4.2 Inhibitor Performance
Objective 5: DETERMINE POSSIBLE NEGATIVE SIDE EFFECTS -PERFORMANCE
TESTS Tasks:
5.1 Determine Effect of Insufficient Dosage on Corrosion Progression 5.2 Effect of Inhibitor on Chloride Threshold 5.3 Examine Possible Adverse Effects on Concrete Physical Properties
This investigation focused on the ability of the inhibitors to control chloride-induced corrosion, a main source of corrosion deterioration in concrete structures in the U.S. The work addressed three inhibitors that were widely commercially available at the start of the investigation. These inhibitors were already being used in a number of parking and highway structures, or were being considered for future applications. The inhibitors were; calcium nitrite-based product, DCI; and two organic inhibitors, FER, and REO. The objectives and tasks indicated above were addressed for each of the three inhibitors, to the extent described in the following sections. The experimental approach and corresponding methodologies and findings during the first twelve years of the project are described in each section, keyed to the objectives listed above.
- 2 -
INTRODUCTION Literature Review
In recent decades, a major concern in construction is the chloride-induced corrosion of embedded reinforcing steel in concrete structures. According to a study performed in 2004, the average annual direct cost of corrosion for highway bridges (including steel) was estimated to be $8.29 billion2. Corrosion occurs in parking and highway structures where deicing salts are applied to roads in the winter, and in marine structures that are in contact with seawater splash. These concrete structures are usually exposed to wetting and drying cycles that increase the chloride concentration in the concrete at the surface. These surface chlorides slowly penetrate thru the concrete until corrosion initiates and progresses with time. The coefficient of diffusion can be calculated as the amount of substance diffusing across a unit area. In the case of concrete, even though particles are tightly packed together, fluids can still move through pores deep in concrete. Low permeability concrete help to reduce the potential for reinforcing steel to corrode when exposed to salt water by limiting permeation of chloride ions into concrete. In addition, reinforced steel is already protected as soon as it comes in contact with concrete since a chemical reaction takes place that causes a passive layer to develop around the reinforcing steel. Concrete normally provides this reinforcing because its high-alkaline environment creates a tightly adhering film that passivates the steel and protects it from corrosion. This protective film can be broken with the presence of chloride ions that could alter the film’s chemical properties. Chloride ingress into reinforced concrete bridges leads to corrosion of the reinforcing steel and a subsequent reduction in the strength, serviceability, and aesthetics of the structure3. Chloride ions react with ferrous ions after they are liberated from the rebar, where they later precipitate as iron hydroxide. After corrosion occurs, rust is produced and takes up more volume than the rebar causing the concrete to crack. A corrosion inhibitor is a chemical compound that when introduced in the concrete matrix at low concentration decreases the rate of corrosion and lengthens the time of corrosion initiation. These may be added to fresh concrete or applied to the surface of the hardened concrete. Admixing with fresh concrete allows a uniform distribution of the inhibitor. High performance concrete with low permeability helps prevent the inhibitor from leaching out in marine applications.
Inhibitors can also be classified as inorganic or organic according to their chemical composition. Inorganic compounds may be based on nitrites, especially used as additives or based on sodium monofluoro-phosphate used as migrating inhibitors4,5,6. Organic inhibitors are based on mixtures of alkanolamines, amines or amino-acids, or based on emulsion of unsaturated fatty acid ester. These may be used both as admixed and migrating inhibitors7,8. Among available methods, corrosion inhibitors seem to be attractive because of their low cost and easy handling, compared to other preventive methods9. DCI- Calcium nitrite is an inorganic anodic type inhibitor and performs by oxidizing Fe++ ions through an oxidation-reduction process at the rebar surface10. This admixture has been available
- 3 -
since 1978 and its effectiveness as a corrosion inhibitor mainly depends on the ratio of nitrite to chloride concentration present in concrete. Research conducted at the Politecnico di Milano presented in NACE 2006 suggests similar results to occur and shows that a corrosion inhibitor is effective when the molar ratio [NO2−]/ [Cl−] is higher. The inhibitor effectiveness was evaluated by two parameters, as well; measuring the corrosion potential and rate (polarization resistance). Corrosion inhibitors may improve concrete structure’s service life in different ways: they may delay corrosion initiation by increasing the critical chloride threshold or reducing chloride or carbonation penetration rate, or they may reduce the corrosion rate once corrosion has initiated9. In 1980, The Federal Highway Administration (FHWA) initiated an outdoor research study using calcium nitrite as an admixture in salty concrete to inhibit the corrosion of black steel reinforcing rebar11. In the study they have obtained similar results in where the calcium nitrite appears to be effective because it prevents a large electrical potential difference to develop between adjoining steel in the top mat or between the top and bottom mats. Another corrosion inhibitor, FerroGard, is an organic mixed type inhibitor made up mainly of a modified amino alcohol that performs by forming an amino alcohol surface layer on the steel10. According to the manufacturer, FerroGard protects the steel reinforcing bars by forming a continuous mono-molecular film on the steel surface and it covers both the anodic and cathodic sites. The last inhibitor to be tested in this report is Rheocrete which is an organic-based inhibitor made up mainly of amines and fatty acid esters10. The addition of Rheocrete 222+ to the concrete significantly reduces corrosion and extends the service life of reinforced concrete. This is obtained by slowing the ingress of chlorides and moisture into the concrete and by forming a strong, durable protective film on the reinforcing steel for a second level of corrosion protection. It performs by two different protection mechanisms: by forming a corrosion resistant film and by coating the concrete pores which slows the penetration of chloride ion into concrete10. OBJECTIVE 4: ESTIMATE LONG-TERM EFFECTIVENESS – PERFORMANCE TESTS 4.1 Perform outdoor sheltered tests, long-term laboratory tests, and field tests. 4.1.1 Approach and Experimental Procedures. The purpose of these tests was to evaluate the effect of each inhibitor and its dosage on the onset and progression of corrosion in concrete with and without supplementary cementitious materials. In general the variables examined included:
1. Type of concrete: Ordinary Portland Cement (OPC) concrete with 0.41 and 0.5 Water/Cementitious Materials Ratio (w/cm).
2. Concrete admixed with fly ash and/or silica fume. 3. Type of aggregate (limestone, granite).

- 4 -
4. Types of inhibitor: W.R. Grace Calcium Nitrite (DCI), BASF Rheocrete 222+ (REO), Sika Ferroguard (FER).
5. Extent of inhibitor addition (half dosage, full dosage). Special emphasis is given to determine the critical chloride concentrations for corrosion initiation for each inhibitor, as a function of concrete mix parameters. The critical chloride concentration is obtained by using information from non-destructive electrochemical testing. A summary of the mix proportions used is provided in Table 1. All concrete was mixed using 985 kg/m3 coarse aggregate with a maximum diameter of 10 mm. The coarse aggregate was Miami formation limestone unless otherwise indicated. The fine aggregate was silica sand with a fineness module of 2.16. The cementitious factor was 7 bags (444 kg/m3), with 20% Type F fly ash and/or 8% silica fume as cement replacement. The concrete was batched in a 27-ft3 central mixer located in a warehouse. During extreme weather conditions, batching was conducted with a portable mixer in a temperature controlled room. To maintain control of the w/cm, all components were carefully measured and aggregate moisture adjustments were made according to standards. All aggregate was obtained from FDOT approved sources, and tests were conducted to determine proper gradation before batching. The bagged aggregate was submerged in water tanks and completely saturated prior to mixing. One hour before mixing began; the aggregate was removed from the tanks and placed on grating to drain excess moisture from the surface of the aggregate to ensure an accurate w/cm. The concrete was placed into the forms in two lifts using ordinary hand tools. A table vibrator was used to consolidate the laboratory specimens. For each lift, the concrete was vibrated for 45 seconds. Due to the large size and weight, field specimens were placed on the floor and externally vibrated after each concrete lift. After the specimens were cast, they were given a light trowel finish and covered with polyethylene film for 24 hours. All specimens were demolded after 72 hours. Three-bar tombstone and field columns were then stored for at least 6 months in a warehouse environment before exposure to salt water. G-109 specimens were transported to a moisture room where they remained until 28 days from casting as indicated in the test method. Upon removal from the moisture chamber, the G-109 specimens were sealed in polyethylene bags to prevent carbonation. The specimens remained in the bags until they were 90 days old to ensure that some degree of maturity developed before testing commenced.
- 5 -
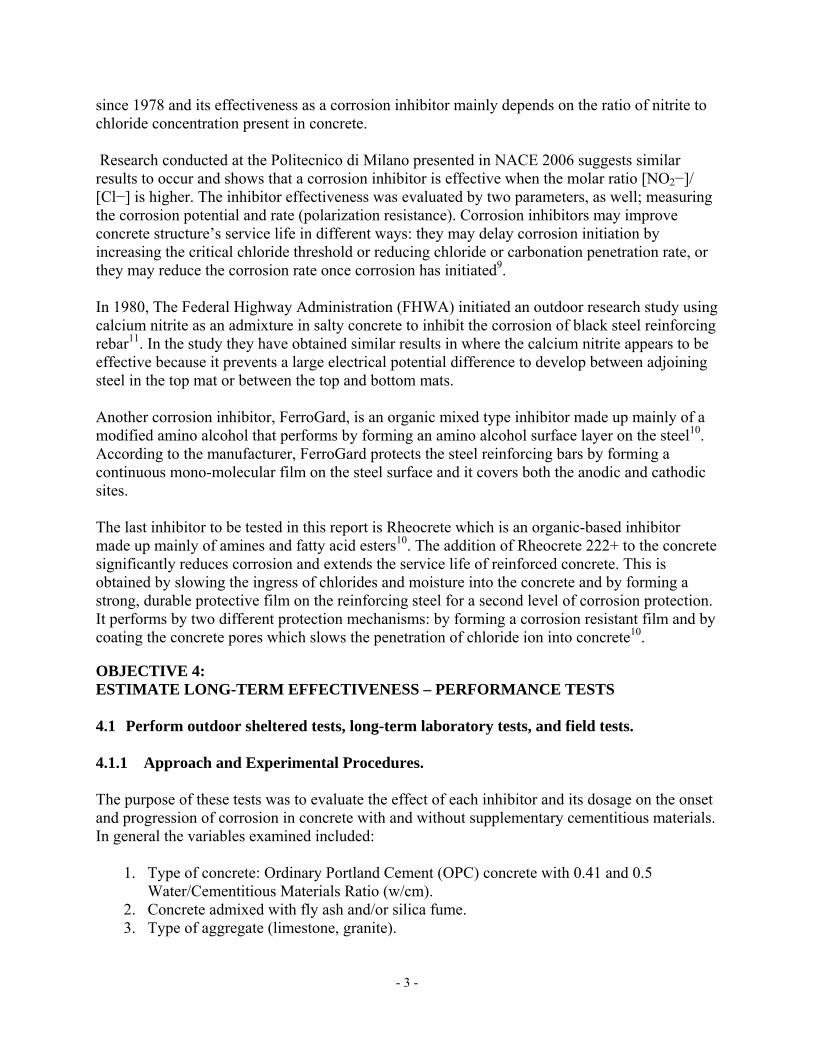
Table 1. Concrete Mix Proportions
Mix Group Water/Cementitious Ratio 20% Fly Ash 8% Silica Fume Granite
C1 0.41 C2 0.50 P1 0.41 x P2 0.41 x x P3 0.50 x P4 0.41 x G1 0.41 x
Three basic types of reinforced concrete specimens were fabricated:
1. Sheltered outdoor specimens designed to provide relatively short-term results (Three-bar tombstone columns, Figures 1a, b, c) with two different variations (uncracked and cracked). These specimens are simulated piles partially submerged in 3.5 wt% salt water with only 1 inch of cover and long enough to create an evaporation zone so that a corrosion cell is created.
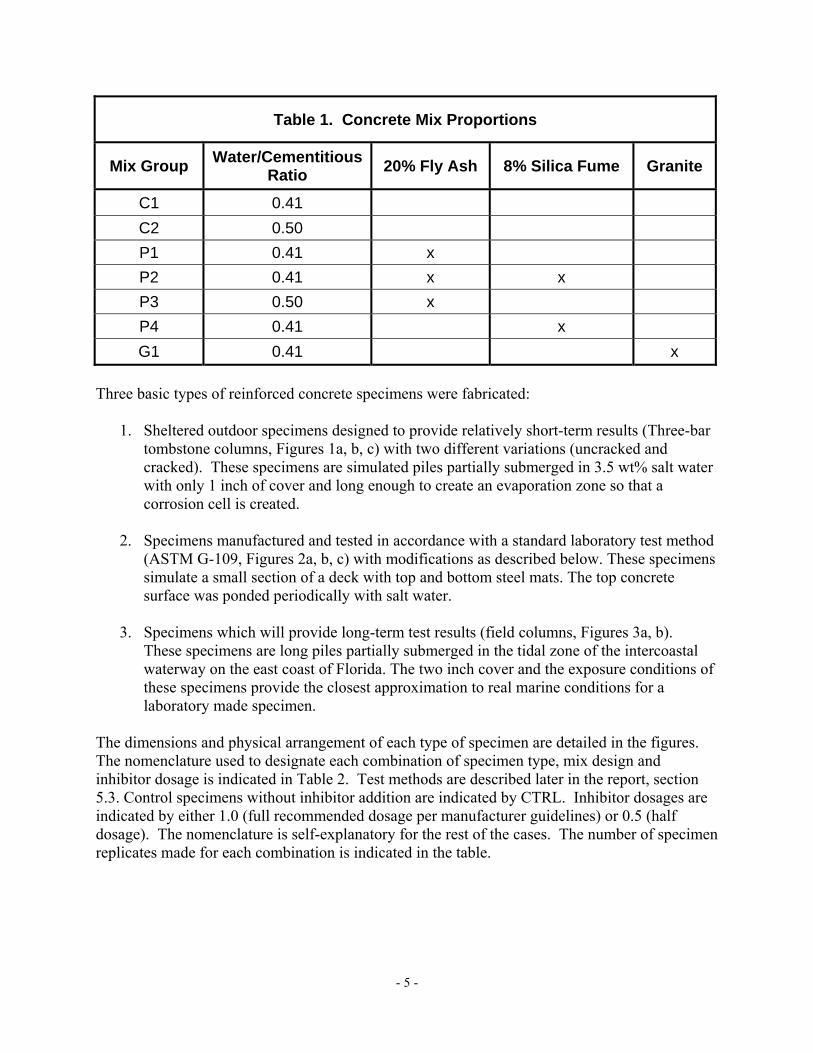
2. Specimens manufactured and tested in accordance with a standard laboratory test method
(ASTM G-109, Figures 2a, b, c) with modifications as described below. These specimens simulate a small section of a deck with top and bottom steel mats. The top concrete surface was ponded periodically with salt water.
3. Specimens which will provide long-term test results (field columns, Figures 3a, b).
These specimens are long piles partially submerged in the tidal zone of the intercoastal waterway on the east coast of Florida. The two inch cover and the exposure conditions of these specimens provide the closest approximation to real marine conditions for a laboratory made specimen.
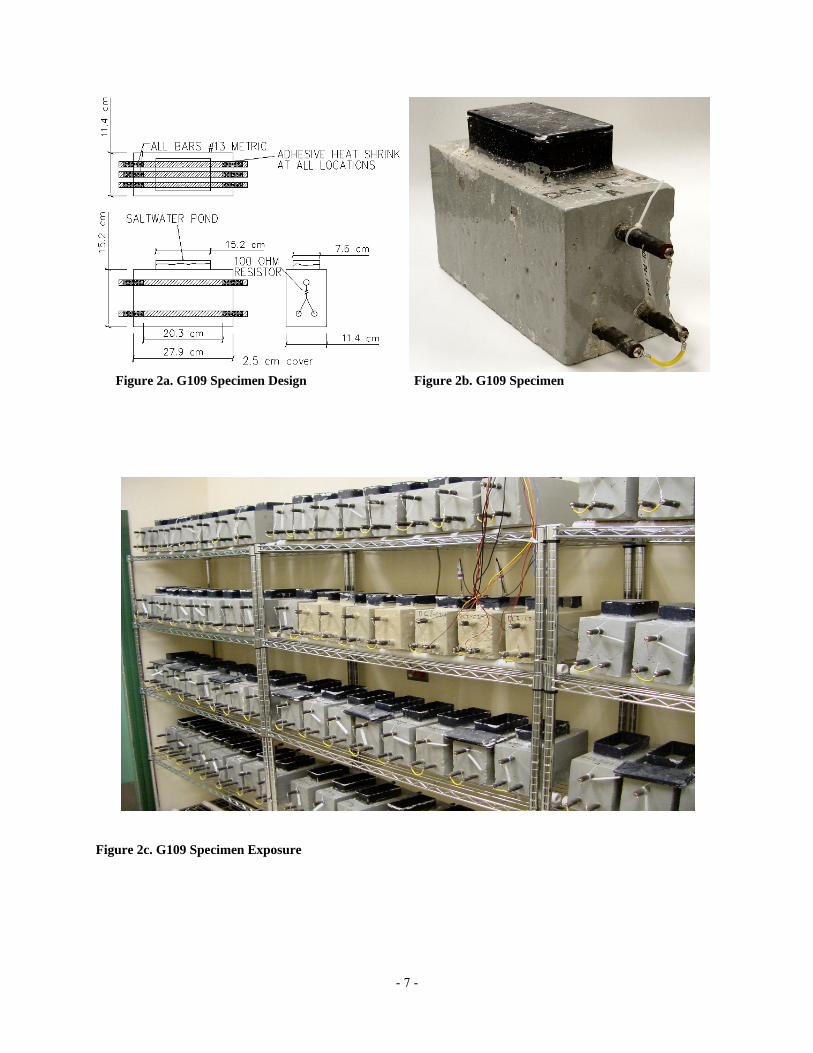
The dimensions and physical arrangement of each type of specimen are detailed in the figures. The nomenclature used to designate each combination of specimen type, mix design and inhibitor dosage is indicated in Table 2. Test methods are described later in the report, section 5.3. Control specimens without inhibitor addition are indicated by CTRL. Inhibitor dosages are indicated by either 1.0 (full recommended dosage per manufacturer guidelines) or 0.5 (half dosage). The nomenclature is self-explanatory for the rest of the cases. The number of specimen replicates made for each combination is indicated in the table.

- 6 -
Figure 1a. Three-bar Tombstone Column Specimen Design Figure 1b. Three-bar Tombstone Column Specimen
Figure 1c. Three-bar Tombstone Column Specimen Exposure
- 7 -
Figure 2a. G109 Specimen Design Figure 2b. G109 Specimen
Figure 2c. G109 Specimen Exposure

- 8 -
Figure 3a. Field Column Specimen design
Figure 3b. Field Column Specimen Exposure
- 9 -
Table 2: Concrete Mix Matrix
MIX NAME Three-bar Tombstone
Column
Three-bar Tombstone
Column Cracked
ASTM G109
Field Column
ASTM C1202 (RCP) & FM5-578
(SR)
ASTM C39 (f’c)
ASTM C1012
(Sulfate)
FM5-522 (Impressed Current)
MIX GROUP C1: w/cm=0.41 CTRL-C1 6 3 3 3 4 6 6 3 FER-C1-.05 6 3 FER-C1-1.0 6 3 3 3 4 6 6 3 DCI-C1-0.5 6 3 DCI-C1-1.0 6 3 3 3 4 6 6 3 REO-C1-0.5 6 3 REO-C1-1.0 6 3 3 3 4 6 6 3
MIX GROUP C2: w/cm=0.50 CTRL-C2 6 3 4 6 3 FER-C2-1.0 6 3 4 6 3 DCI-C2-1.0 6 3 4 6 3 REO-C2-1.0 6 3 4 6 3
MIX GROUP P1: w/cm=0.41, 20% FA CTRL-P1 6 3 6 3 4 6 6 3 FER-P1-0.5 6 3 FER-P1-1.0 6 3 6 3 4 6 6 3 DCI-P1-0.5 6 3 DCI-P1-1.0 6 3 6 3 4 6 6 3 REO-P1-0.5 6 3 REO-P1-1.0 6 3 6 3 4 6 6 3
MIX GROUP P2: w/cm=0.41, 20% FA, 8% SF CTRL-P2 6 3 6 3 4 6 6 3 FER-P2-0.5 6 3 FER-P2-1.0 6 3 6 3 4 6 6 3 DCI-P2-0.5 6 3 DCI=P2-1.0 6 3 6 3 4 6 6 3 REO-P2-0.5 6 3 REO-P2-1.0 6 3 6 3 4 6 6 3
MIX GROUP P3: w/cm=0.50, 20% FA CTRL-P3 6 6 4 6 3 FER-P3-1.0 6 6 4 6 3 DCI-P3-1.0 6 6 4 6 3 REO-P3-1.0 6 6 4 6 3
MIX GROUP P4: w/cm=0.41, 8% SF CTRL-P4 6 3 3 4 6 3 FER-P4-1.0 6 3 3 4 6 3 DCI-P4-1.0 6 3 3 4 6 3 REO-P4-1.0 6 3 3 4 6 3
MIX GROUP G1: w/cm=0.41, Granite CTRL-G1 6 3 3 3 8 9 6 3 FER-G1-1.0 6 3 3 3 8 9 6 3 DCI-G1-1.0 6 3 3 3 8 9 6 3 REO-G1-1.0 6 3 3 3 8 9 6 3
CTRL = Control, FER = Ferroguard, DCI = Calcium Nitrite, REO = Rheocrete, 0.5 = Half dose, 1.0 = Full dose, w/cm = water to cementitious ratio, FA = Fly Ash, SF = Silica Fume
- 10 -
The information derived from the three different types of fabricated specimen is as follows: G109 Specimen: This specimen type determines the effects of corrosion inhibiting admixtures on the corrosion onset of reinforcement by measuring electrochemical potentials and macro-cell currents. Measurements of current and potential are performed periodically and each specimen is monitored until the potential shows a distinctive negative shift of -100 mV vs. SCE and the current reads above 5 µA on the graphs. 3-Bar Tombstone: This specimen type determines the effects of corrosion inhibiting admixtures on the corrosion onset of reinforcement by measuring electrochemical potentials and macro-cell currents of every bar in the specimen. Measurements of current and potential are performed periodically until cracking or visible corrosion product bleed-out is observed. Field Specimens: This specimen type determines the effects of corrosion inhibiting admixtures on the corrosion onset of reinforcement when exposed to a chloride environment. Measurement of electrochemical potential and macro-cell current are performed at the time of initial exposure and on intervals of six months until corrosion-induced cracking or visible corrosion product bleed-out is observed. Description of Test Methods: ASTM C1202 – Standard Test Method for Electrical Indication of Concrete’s Ability to Resist Chloride Ion Penetration. This test method determines the electrical conductance of water saturated concrete to estimate its resistance to chloride ion penetration. This test method can be used as an electrical indicator of concrete permeability where correlations have been established between this test procedure and long-term chloride diffusion procedures such as those described in ASTM C1556. ASTM C39 - Standard Test Method for Compressive Strength of Cylindrical Concrete Specimens. This test method determines the compressive strength of moist cured cylindrical concrete specimens, such as molded cylinders and drilled cores. FM5-522 - Florida Method of Test for An Accelerated Laboratory Method for Corrosion Testing of Reinforced Concrete Using Impressed Current. This test method determines the time to corrosion initiation of rebar by use of cathodic polarization. The time to corrosion initiation is controlled by the permeability of the concrete surrounding the rebar under test.
- 11 -
4.1.2 Short term sheltered outdoor tests, Three-bar tombstone columns. The specimens were constructed during the first year of the project execution between December 1996 and May 1997. Outdoor sheltered exposure commenced in October 1997. Exposure conditions for the outdoor sheltered specimens consisted of partial immersion, as indicated in Figure 1(c), in a tank with a solution of 3.5 wt% NaCl, at temperatures corresponding to the daily cycle encountered in Gainesville, FL. The water is circulated twice per day for a total of 6 hours per day to obtain full water aeration and to maintain uniform chloride content. The water depth is measured weekly and water is added to compensate for evaporation. Salt is added as necessary to maintain the desired concentration. Periodic specimen tests included half-cell potentials versus a Saturated Calomel Electrode (SCE) and macro-cell currents. Triplicate specimens of full dose Three-bar tombstone specimens for groups C1, G1, P1, P2, and P4 had cracks deliberately introduced. The purpose of cracking these specimens was to determine if the corrosion inhibitors could slow or prevent the formation of corrosion in the presence of cracks compared to the cracked control specimens. The procedure for introducing the cracks was as follows: a groove 6 mm wide and 13 mm deep was cut 178 mm from the bottom of the specimen. The groove was cut into three sides of the specimen and steel collars were placed 6 mm from each side of the groove. The steel collars were designed to prevent the concrete from being crushed and to control the position of the crack. Each specimen was placed in a compression machine under three-point loading; pressure was slowly applied until a visible crack developed. The deflection of the rebar maintained the crack width between 0.01 mm and 0.08 mm, with an average width of 0.04 mm. The Three-bar tombstone column specimens showed the earliest corrosion activity of all the geometries tested, as was intended. As of the writing of this report, after more than twelve years of specimen exposure to the chloride solution, only specimens of the P2 (0.41 w/cm, 20% FA, 8% SF) and P4 (0.41 w/c, 8% SF) remain in test. The common denominators between these two groups are the use of silica fume and a 0.41 w/c. In the P4 group, CTRL specimens have not exhibited signs of corrosion. In the P2 group all of the specimen sets are still in test with the exception of the CTRL and the half dose DCI tombstone columns. Currently full dose FER, full dose DCI, full dose REO, half dose FER, and half dose REO tombstone columns have not exhibited signs of corrosion. In the following groups all the specimens have failed: C1 (0.41 w/cm, no pozzolan), C2 (0.5 w/cm, no pozzolan), P1 (0.41 w/cm, 20% FA), P3 (0.5 w/cm, 20% FA), and G1 (0.41 w/cm, no pozzolan, granite.) Each Three-bar tombstone column specimen was monitored until visual indications of corrosion-induced cracking were observed on the surface of the specimen. This event was designated as specimen cracking and the cracked specimen was removed from the test tank for autopsy to confirm rebar corrosion and concrete cover; testing on the uncracked replicates continues. In a large percentage of the specimens the autopsy revealed only one anode bar had corroded thereby cathodically protecting the other bar.
- 12 -
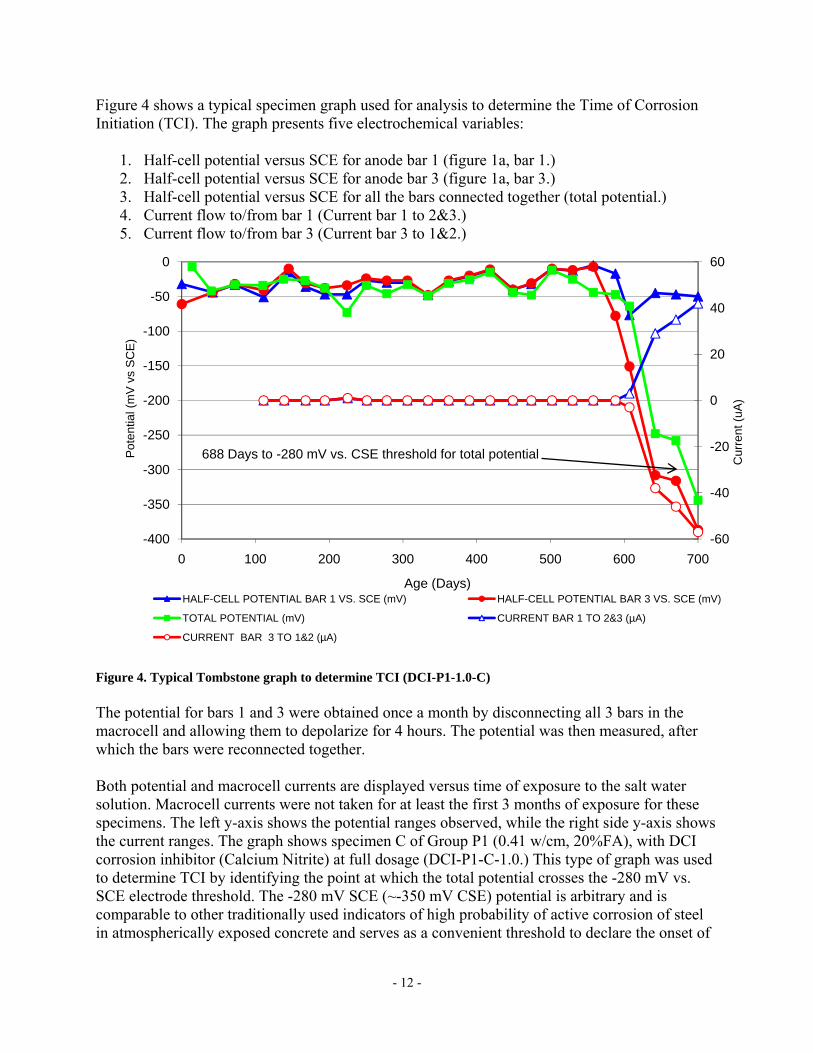
Figure 4 shows a typical specimen graph used for analysis to determine the Time of Corrosion Initiation (TCI). The graph presents five electrochemical variables:
1. Half-cell potential versus SCE for anode bar 1 (figure 1a, bar 1.) 2. Half-cell potential versus SCE for anode bar 3 (figure 1a, bar 3.) 3. Half-cell potential versus SCE for all the bars connected together (total potential.) 4. Current flow to/from bar 1 (Current bar 1 to 2&3.) 5. Current flow to/from bar 3 (Current bar 3 to 1&2.)
Figure 4. Typical Tombstone graph to determine TCI (DCI-P1-1.0-C) The potential for bars 1 and 3 were obtained once a month by disconnecting all 3 bars in the macrocell and allowing them to depolarize for 4 hours. The potential was then measured, after which the bars were reconnected together. Both potential and macrocell currents are displayed versus time of exposure to the salt water solution. Macrocell currents were not taken for at least the first 3 months of exposure for these specimens. The left y-axis shows the potential ranges observed, while the right side y-axis shows the current ranges. The graph shows specimen C of Group P1 (0.41 w/cm, 20%FA), with DCI corrosion inhibitor (Calcium Nitrite) at full dosage (DCI-P1-C-1.0.) This type of graph was used to determine TCI by identifying the point at which the total potential crosses the -280 mV vs. SCE electrode threshold. The -280 mV SCE (~-350 mV CSE) potential is arbitrary and is comparable to other traditionally used indicators of high probability of active corrosion of steel in atmospherically exposed concrete and serves as a convenient threshold to declare the onset of
-60
-40
-20
0
20
40
60
-400
-350
-300
-250
-200
-150
-100
-50
0
0 100 200 300 400 500 600 700
Cur
rent
(uA
)
Pot
entia
l (m
V v
s S
CE
)
Age (Days)HALF-CELL POTENTIAL BAR 1 VS. SCE (mV) HALF-CELL POTENTIAL BAR 3 VS. SCE (mV)
TOTAL POTENTIAL (mV) CURRENT BAR 1 TO 2&3 (µA)
CURRENT BAR 3 TO 1&2 (µA)
688 Days to -280 mV vs. CSE threshold for total potential

- 13 -
sustained corrosion activity. It is used here because both potential and current were not available for each and every specimen in this geometry at the time that TCI was reached. The estimation was done using linear interpolation between the two potential measurements involved. In addition to the potential, the macrocell currents flowing to/from the anode bars are used to confirm the presence of active corrosion if macrocell currents were available at the time of reaching TCI. The currents are less than 1 μA for passive state and exceed 10 μA once TCI is reached, although wide variations in current can be encountered due to the complex interactions occurring in the macrocell. In the case of this specimen, TCI is identified as 688 days. A case could be made that corrosion actually started earlier based on the potential and current development of bar 3. This would require either selecting another potential level where corrosion starts and/or selecting an arbitrary current which would be designated as indicator of corrosion. The ranking would not change significantly had either method been chosen. In addition, many of the specimens did not exhibit simple developments of potential or current as in the specimen used in the example. A great number of the specimens had drops in potential of different levels, followed by recovery to passivation levels making it difficult to ascertain actual corrosion activity. Current also had sudden jumps and drops and then returned to negligible levels. Some variations in cover were expected in this specimen geometry since the bar is only supported on one end during casting and while the concrete is plastic. Specimens were autopsied after identification of TCI; the TCI observations are corrected based on actual concrete cover to account for these variations. The correction or normalization is done by dividing the TCI for each specimen by the square of the amount of cover. This approach is based on the simplifying assumption that chloride transport is simply diffusional, so concentration can be scaled with the square of the distance traveled12. Once the normalization is done for each failed specimen in a given set, linear regression analysis was used to obtain the average failure for the specimen set using the assumption that the cover was exactly one inch. A graphical representation of the linear regression analysis is presented in Figure 5 for group P3.
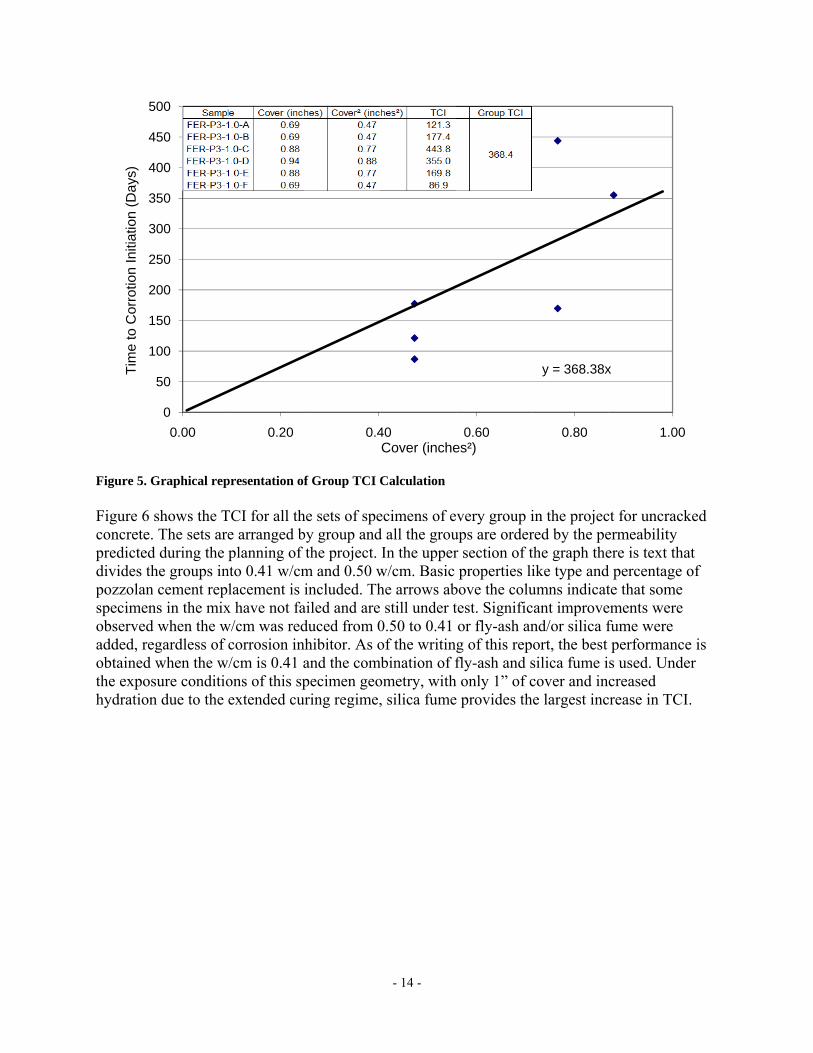
Figure 5. G Figure 6 concrete.predicteddivides thpozzolanspecimenobservedadded, reobtained the exposhydration
1
1
2
2
3
3
4
4
5
Tim
e to
Cor
rotio
n In
itiat
ion
(Day
s)
Graphical rep
shows the T. The sets ared during the he groups in
n cement repns in the mixd when the wegardless of when the w
sure condition due to the
0
50
100
150
200
250
300
350
400
450
500
0.00
presentation of
TCI for all the arranged bplanning of
nto 0.41 w/cmlacement is
x have not faw/cm was red
corrosion inw/cm is 0.41 a
ons of this spextended cu
0.20
f Group TCI C
he sets of speby group andthe project.
m and 0.50 wincluded. Th
ailed and areduced from 0nhibitor. As oand the compecimen geo
uring regime,
0.4
- 14 -
Calculation
ecimens of ed all the grouIn the upper
w/cm. Basic he arrows ab still under t0.50 to 0.41 of the writing
mbination of fometry, with, silica fume
40Cover (inche
very group iups are orderr section of tproperties li
bove the colutest. Significor fly-ash ang of this repfly-ash and s
h only 1” of ce provides th
0.60es²)
in the projecred by the pethe graph theike type andumns indicatcant improvend/or silica fort, the best silica fume icover and ine largest inc
y = 368.38x
0.80
ct for uncrackermeability ere is text thad percentagete that some ements were fume were performancs used. Undecreased
crease in TCI
x
1.00
ked
at of
e is er
I.
0
- 15 -
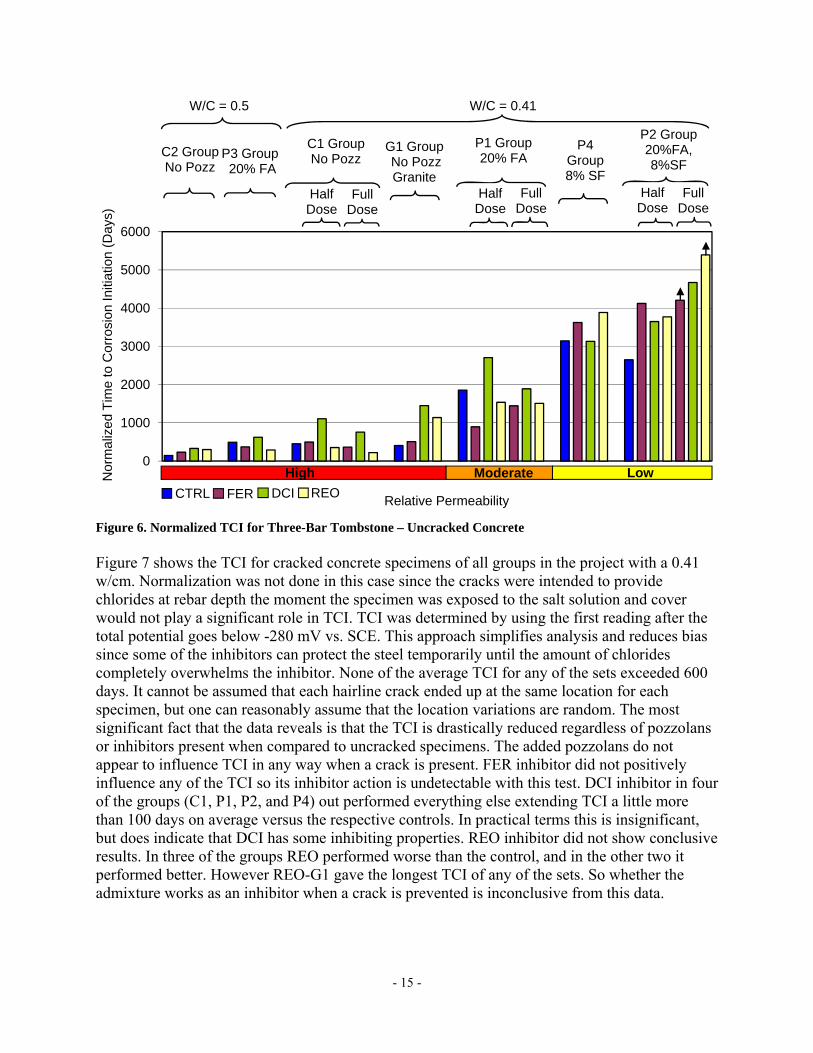
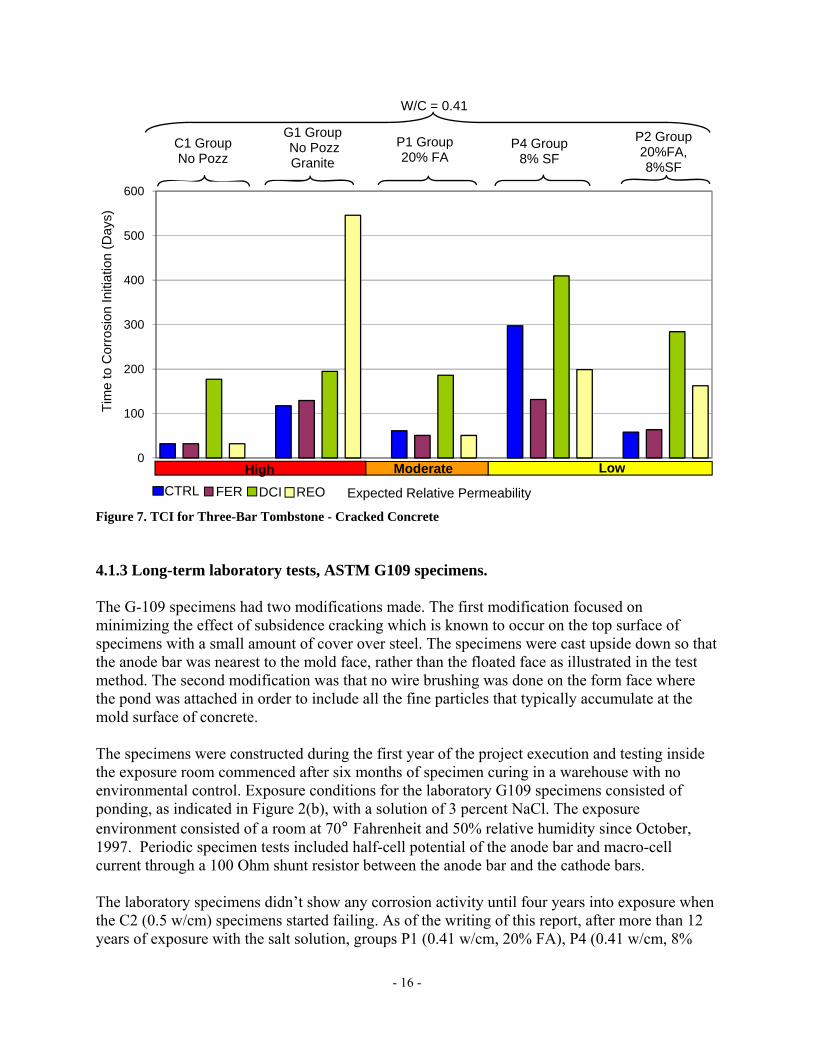
Figure 6. Normalized TCI for Three-Bar Tombstone – Uncracked Concrete Figure 7 shows the TCI for cracked concrete specimens of all groups in the project with a 0.41 w/cm. Normalization was not done in this case since the cracks were intended to provide chlorides at rebar depth the moment the specimen was exposed to the salt solution and cover would not play a significant role in TCI. TCI was determined by using the first reading after the total potential goes below -280 mV vs. SCE. This approach simplifies analysis and reduces bias since some of the inhibitors can protect the steel temporarily until the amount of chlorides completely overwhelms the inhibitor. None of the average TCI for any of the sets exceeded 600 days. It cannot be assumed that each hairline crack ended up at the same location for each specimen, but one can reasonably assume that the location variations are random. The most significant fact that the data reveals is that the TCI is drastically reduced regardless of pozzolans or inhibitors present when compared to uncracked specimens. The added pozzolans do not appear to influence TCI in any way when a crack is present. FER inhibitor did not positively influence any of the TCI so its inhibitor action is undetectable with this test. DCI inhibitor in four of the groups (C1, P1, P2, and P4) out performed everything else extending TCI a little more than 100 days on average versus the respective controls. In practical terms this is insignificant, but does indicate that DCI has some inhibiting properties. REO inhibitor did not show conclusive results. In three of the groups REO performed worse than the control, and in the other two it performed better. However REO-G1 gave the longest TCI of any of the sets. So whether the admixture works as an inhibitor when a crack is prevented is inconclusive from this data.
0
1000
2000
3000
4000
5000
6000
Nor
mal
ized
Tim
e to
Cor
rosi
on In
itiat
ion
(Day
s)
Relative Permeability
High Moderate Low
C2 GroupNo Pozz
P3 Group20% FA
W/C = 0.5
Half Dose
Full Dose
W/C = 0.41
G1 GroupNo PozzGranite
C1 GroupNo Pozz
Half Dose
Full Dose
P1 Group20% FA
P4 Group8% SF
P2 Group20%FA, 8%SF
Half Dose
Full Dose
CTRL FER DCI REO
- 16 -
Figure 7. TCI for Three-Bar Tombstone - Cracked Concrete 4.1.3 Long-term laboratory tests, ASTM G109 specimens. The G-109 specimens had two modifications made. The first modification focused on minimizing the effect of subsidence cracking which is known to occur on the top surface of specimens with a small amount of cover over steel. The specimens were cast upside down so that the anode bar was nearest to the mold face, rather than the floated face as illustrated in the test method. The second modification was that no wire brushing was done on the form face where the pond was attached in order to include all the fine particles that typically accumulate at the mold surface of concrete. The specimens were constructed during the first year of the project execution and testing inside the exposure room commenced after six months of specimen curing in a warehouse with no environmental control. Exposure conditions for the laboratory G109 specimens consisted of ponding, as indicated in Figure 2(b), with a solution of 3 percent NaCl. The exposure environment consisted of a room at 70° Fahrenheit and 50% relative humidity since October, 1997. Periodic specimen tests included half-cell potential of the anode bar and macro-cell current through a 100 Ohm shunt resistor between the anode bar and the cathode bars. The laboratory specimens didn’t show any corrosion activity until four years into exposure when the C2 (0.5 w/cm) specimens started failing. As of the writing of this report, after more than 12 years of exposure with the salt solution, groups P1 (0.41 w/cm, 20% FA), P4 (0.41 w/cm, 8%
0
100
200
300
400
500
600
Tim
e to
Cor
rosi
on In
itiat
ion
(Day
s)
Expected Relative Permeability
High Moderate Low
W/C = 0.41
G1 GroupNo PozzGranite
C1 GroupNo Pozz
P1 Group20% FA
P4 Group8% SF
P2 Group20%FA, 8%SF
CTRL FER DCI REO
- 17 -
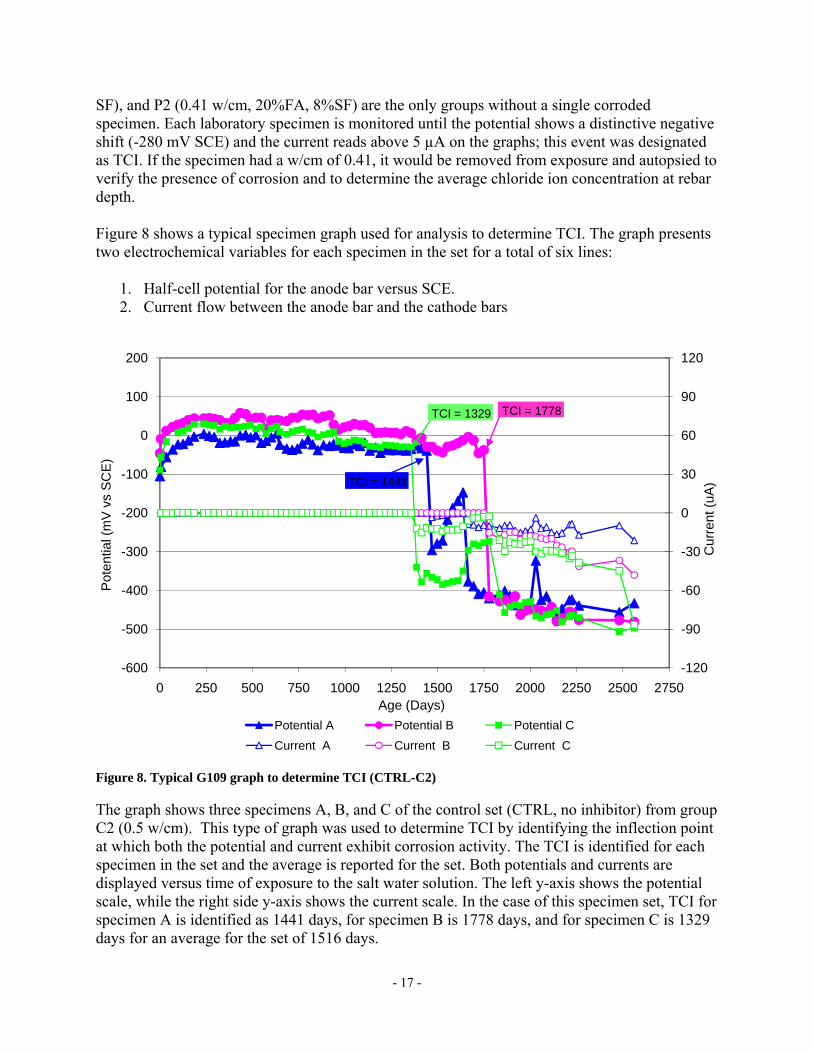
SF), and P2 (0.41 w/cm, 20%FA, 8%SF) are the only groups without a single corroded specimen. Each laboratory specimen is monitored until the potential shows a distinctive negative shift (-280 mV SCE) and the current reads above 5 µA on the graphs; this event was designated as TCI. If the specimen had a w/cm of 0.41, it would be removed from exposure and autopsied to verify the presence of corrosion and to determine the average chloride ion concentration at rebar depth. Figure 8 shows a typical specimen graph used for analysis to determine TCI. The graph presents two electrochemical variables for each specimen in the set for a total of six lines:
1. Half-cell potential for the anode bar versus SCE. 2. Current flow between the anode bar and the cathode bars
Figure 8. Typical G109 graph to determine TCI (CTRL-C2) The graph shows three specimens A, B, and C of the control set (CTRL, no inhibitor) from group C2 (0.5 w/cm). This type of graph was used to determine TCI by identifying the inflection point at which both the potential and current exhibit corrosion activity. The TCI is identified for each specimen in the set and the average is reported for the set. Both potentials and currents are displayed versus time of exposure to the salt water solution. The left y-axis shows the potential scale, while the right side y-axis shows the current scale. In the case of this specimen set, TCI for specimen A is identified as 1441 days, for specimen B is 1778 days, and for specimen C is 1329 days for an average for the set of 1516 days.
-120
-90
-60
-30
0
30
60
90
120
-600
-500
-400
-300
-200
-100
0
100
200
0 250 500 750 1000 1250 1500 1750 2000 2250 2500 2750C
urre
nt (u
A)
Pot
entia
l (m
V v
s S
CE
)
Age (Days)Potential A Potential B Potential CCurrent A Current B Current C
TCI = 1329
TCI = 1441
TCI = 1778
- 18 -
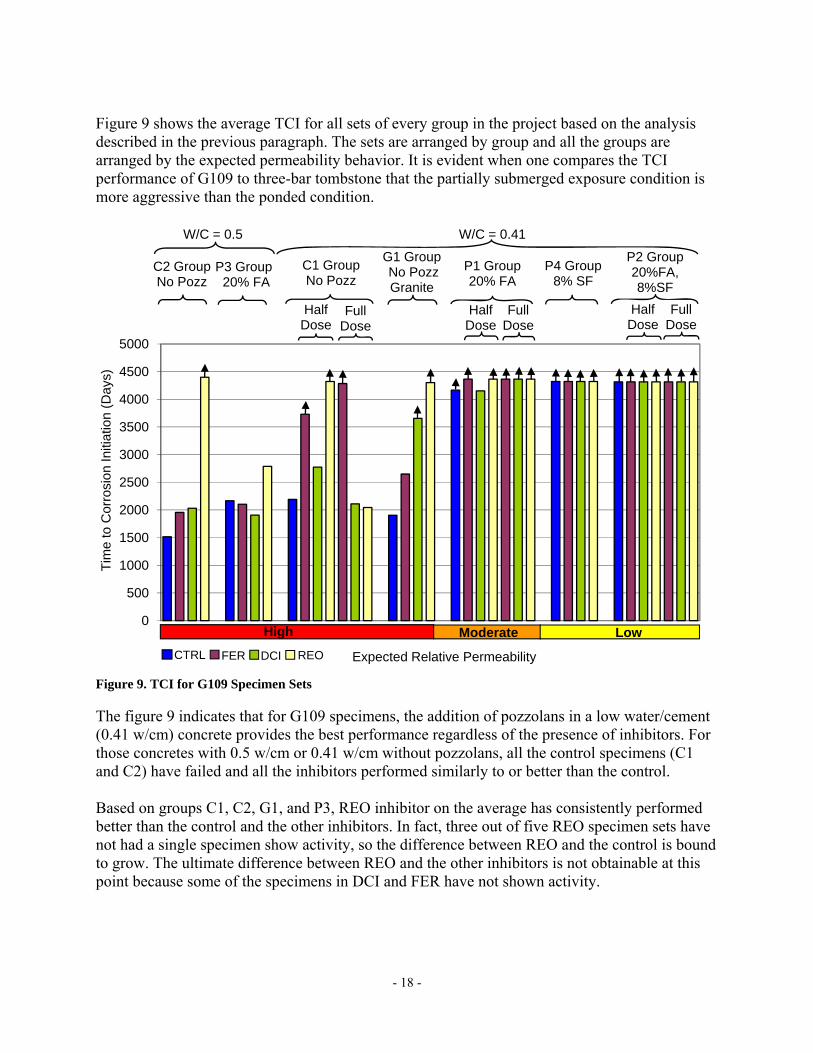
Figure 9 shows the average TCI for all sets of every group in the project based on the analysis described in the previous paragraph. The sets are arranged by group and all the groups are arranged by the expected permeability behavior. It is evident when one compares the TCI performance of G109 to three-bar tombstone that the partially submerged exposure condition is more aggressive than the ponded condition.
Figure 9. TCI for G109 Specimen Sets The figure 9 indicates that for G109 specimens, the addition of pozzolans in a low water/cement (0.41 w/cm) concrete provides the best performance regardless of the presence of inhibitors. For those concretes with 0.5 w/cm or 0.41 w/cm without pozzolans, all the control specimens (C1 and C2) have failed and all the inhibitors performed similarly to or better than the control. Based on groups C1, C2, G1, and P3, REO inhibitor on the average has consistently performed better than the control and the other inhibitors. In fact, three out of five REO specimen sets have not had a single specimen show activity, so the difference between REO and the control is bound to grow. The ultimate difference between REO and the other inhibitors is not obtainable at this point because some of the specimens in DCI and FER have not shown activity.
0
500
1000
1500
2000
2500
3000
3500
4000
4500
5000
Tim
e to
Cor
rosi
on In
itiat
ion
(Day
s)
Expected Relative Permeability
High Moderate Low
C2 GroupNo Pozz
P3 Group20% FA
W/C = 0.5
Half Dose
Full Dose
W/C = 0.41
G1 GroupNo PozzGranite
C1 GroupNo Pozz
Half Dose
Full Dose
P1 Group20% FA
P4 Group8% SF
P2 Group20%FA, 8%SF
Half Dose
Full Dose
CTRL FER DCI REO
- 19 -
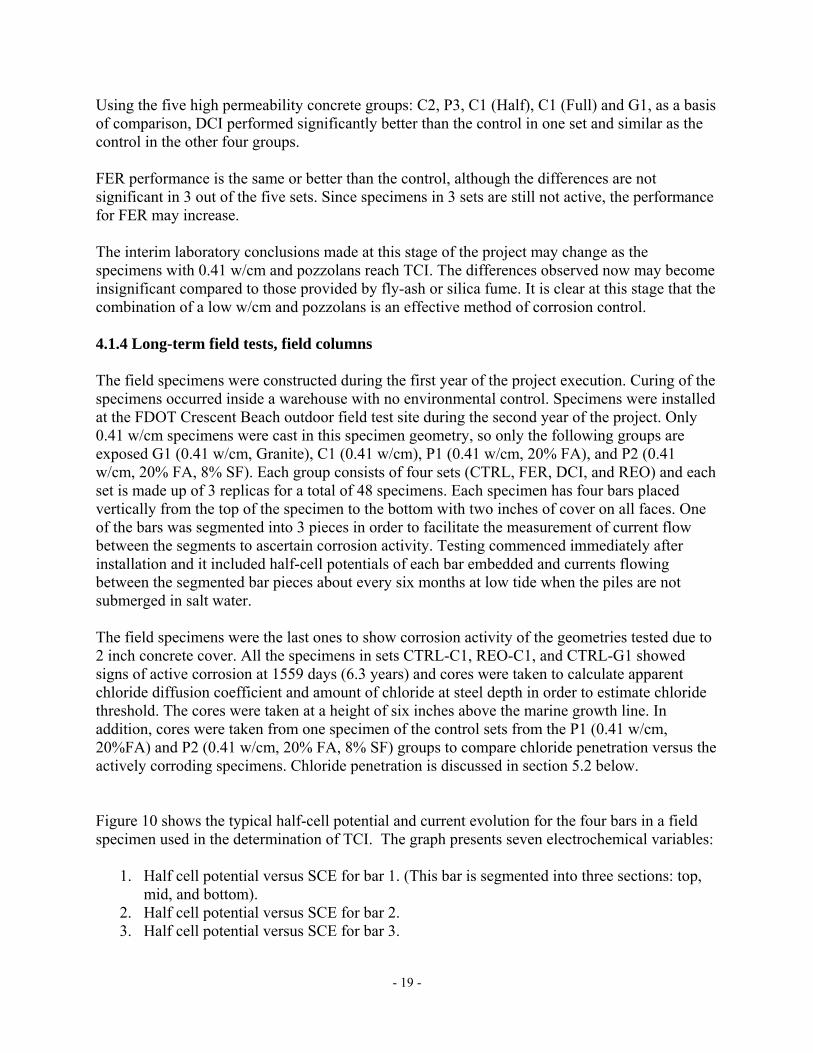
Using the five high permeability concrete groups: C2, P3, C1 (Half), C1 (Full) and G1, as a basis of comparison, DCI performed significantly better than the control in one set and similar as the control in the other four groups. FER performance is the same or better than the control, although the differences are not significant in 3 out of the five sets. Since specimens in 3 sets are still not active, the performance for FER may increase. The interim laboratory conclusions made at this stage of the project may change as the specimens with 0.41 w/cm and pozzolans reach TCI. The differences observed now may become insignificant compared to those provided by fly-ash or silica fume. It is clear at this stage that the combination of a low w/cm and pozzolans is an effective method of corrosion control. 4.1.4 Long-term field tests, field columns The field specimens were constructed during the first year of the project execution. Curing of the specimens occurred inside a warehouse with no environmental control. Specimens were installed at the FDOT Crescent Beach outdoor field test site during the second year of the project. Only 0.41 w/cm specimens were cast in this specimen geometry, so only the following groups are exposed G1 (0.41 w/cm, Granite), C1 (0.41 w/cm), P1 (0.41 w/cm, 20% FA), and P2 (0.41 w/cm, 20% FA, 8% SF). Each group consists of four sets (CTRL, FER, DCI, and REO) and each set is made up of 3 replicas for a total of 48 specimens. Each specimen has four bars placed vertically from the top of the specimen to the bottom with two inches of cover on all faces. One of the bars was segmented into 3 pieces in order to facilitate the measurement of current flow between the segments to ascertain corrosion activity. Testing commenced immediately after installation and it included half-cell potentials of each bar embedded and currents flowing between the segmented bar pieces about every six months at low tide when the piles are not submerged in salt water. The field specimens were the last ones to show corrosion activity of the geometries tested due to 2 inch concrete cover. All the specimens in sets CTRL-C1, REO-C1, and CTRL-G1 showed signs of active corrosion at 1559 days (6.3 years) and cores were taken to calculate apparent chloride diffusion coefficient and amount of chloride at steel depth in order to estimate chloride threshold. The cores were taken at a height of six inches above the marine growth line. In addition, cores were taken from one specimen of the control sets from the P1 (0.41 w/cm, 20%FA) and P2 (0.41 w/cm, 20% FA, 8% SF) groups to compare chloride penetration versus the actively corroding specimens. Chloride penetration is discussed in section 5.2 below. Figure 10 shows the typical half-cell potential and current evolution for the four bars in a field specimen used in the determination of TCI. The graph presents seven electrochemical variables:
1. Half cell potential versus SCE for bar 1. (This bar is segmented into three sections: top, mid, and bottom).
2. Half cell potential versus SCE for bar 2. 3. Half cell potential versus SCE for bar 3.
- 20 -
4. Half cell potential versus SCE for bar 4. 5. Current flow to/from the top segment (current top to mid-bot). 6. Current flow to/from the middle segment (current mid to top-bot). 7. Current flow to/from the bottom segment (current bot to top-mid).
Figure 10. Typical Field Specimen Graph to Determine TCI. (FER-G1-1.0) Both potential and current are displayed versus time of exposure to the salt water solution. The left y-axis shows the potential ranges observed, while the right side y-axis shows the current ranges. The graph shows specimen C of Group G1 (0.41 w/cm), with FER corrosion inhibitor at full dosage (FER-G1-C-1.0.) This type of graph was used to determine TCI by identifying the inflection point at which the potential drops significantly and any of the currents from the segmented bar deviate from zero micro Amps. In some specimens the potential of the bars did not reach the expected level of -350 mV versus CSE, so based on the current levels showing active current flow, it was decided that the TCI had been reached. In the case of this specimen, TCI is identified as 2299 days based on the potential only. The current is not large enough to confirm activity. Routine monitoring will be continued on the remaining experimental test piles until TCI is determined. Figure 11 shows the average TCI for all sets of every group in the project. The sets are arranged by group and all the groups are arranged by the expected permeability behavior.
-15
-12
-9
-6
-3
0
3
-450
-400
-350
-300
-250
-200
-150
-100
-50
0
50
100
150
0 500 1000 1500 2000 2500 3000 3500
Cur
rent
(uA
)
Pot
entia
l (m
V v
s S
CE
)
Age (Days)SEGMENTED BAR 2 BAR 3BAR 4 Current Top to Mid-Bot Current Mid to Top-BotCurrent Bot to Mid-Top
TCI

- 21 -
Figure 11. Field Specimens TCI. As seen previously, with the three-bar tombstone and G109 specimens, the addition of pozzolans is indicating that improved performance will be obtained as observed by examination of the control sets within each group. DCI is the only inhibitor for which not a single Field specimen has shown signs of electrochemical activity. For REO inhibitor all three C1 specimens have reached TCI and for FER two specimens in group G1 indicate corrosion initiation. 4.2 Inhibitor performance It must be emphasized that these observations are subject to revision as corrosion data is generated for the specimens that remain under test. The approximate inventory of specimens remaining is as follows: 2% of the three-bar tombstone specimens, 74% of the G109 specimens, and 69% of the field specimens. A conservative estimate based on the history of the project so far is that it will require another ten years for enough specimens to reach TCI before more solid statements about performance can be made. The three-bar tombstone specimen geometry provides the most aggressive exposure due to the specimen design, 1” of cover, and partially submerged condition. In all specimen geometries significant performance improvements are observed when either the w/cm is reduced and fly-ash and/or silica fume are added. The best corrosion performance is obtained with 0.41 w/cm plus silica fume and fly-ash.
0
500
1000
1500
2000
2500
3000
3500
4000
Day
s to
Fai
lure
(Day
s)
Relative Permeability
Moderate Low
C1 GroupNo Pozz
W/C = 0.41
G1 GroupNo PozzGranite
P1 Group20% FA
P2 Group20%FA, 8%SF
HighCTRL FER DCI REO

- 22 -
4.2.1 Calcium nitrite-based inhibitor (DCI) Three-bar Tombstone Specimens: Using the three-bar tombstone TCI graph (Figure 6), the calcium nitrite specimens showed the same or some improvement in TCI when compared to the control mixes for their respective group. The difference is small in some groups, but when taken as a whole, consistent for the specimen design. Three-bar Tombstone Specimens - Cracked Concrete: The presence of a crack in the concrete drastically decreased the TCI for all specimens regardless of additions used. However, increases in TCI over the CTRL specimens are observed that can only be attributed to the presence of Calcium Nitrite. Improvements in TCI were minimal when compared to the uncracked concrete, but are significant when compared to the control within each group. G 109 Specimens: Only the pre-classified high permeability concrete has shown signs of corrosion, so the following statements are based on just the high permeability specimens of the G109 TCI graph (Figure 9). DCI is performing better than the control in some groups. In three groups it is performing better, in one group it is the same as the control, and in the last group performance is slightly worse. The interim conclusion would be that DCI is contributing somewhat to improving TCI. Any conclusion made at this time will be modified based on the performance of the moderate and low permeability specimens. Field Specimens: The field specimen geometry (Figure 11) does not show any corrosion activity in the calcium nitrite specimens in any of the groups and since the control mixes (CTRL) for groups C1 and G1 have already failed; it can be inferred that calcium nitrite was beneficial in extending TCI. DCI Performance Summary: DCI does appear to increase the TCI of concrete when used as a corrosion inhibiting admixture. The cost effectiveness of DCI when compared to fly-ash and silica fume might not be seen if DCI is used alone. Its use may be more applicable in a concrete specifically designed with high chloride penetration resistance by the use of optimal total cementitious content, low w/c, and admixed pozzolans. 4.2.2 Organic Inhibitor (FER) Three-bar Tombstone Specimens: From the three-bar tombstone TCI graph (Figure 6); no consistent performance trend is discernable for this corrosion inhibitor. In some groups (C1, P1-half dose, and P3) FER performed worse than the control, while in other groups (C2, G1, and P1-full dose,) it performed better. Overall the differences are small and within what can be considered the natural scatter for the variables examined of the concrete produced in this project. FER performance in this specimen geometry can be explained by the large amount of chloride ions that become present at the rebar depth shortly upon exposure that can nullify the inhibiting action of FER. Based on the three-bar tombstone specimen geometry all indications are that FER does not offer any consistent benefits when used in concrete. Three-bar Tombstone Specimens - Cracked Concrete: The presence of a crack in the concrete drastically decreased the TCI for all specimens regardless of additions used. In the case

- 23 -
of FER, no improvement in TCI for any of the groups was observed. The lack of improvement in TCI can be attributed to the large amount of chloride ions that instantly reach the steel upon exposure to salt solution due to the presence of the crack. G 109 Specimens: From the TCI graph for the G109 specimen geometry (Figure 9) it is already evident that FER consistently performs better than the control specimens. This can be attributed to the low concentration of chloride ions that reach the steel in a cyclic exposure condition like the G109. Field Specimens: The field specimen geometry does not show any corrosion activity in the FER specimens for any of the groups except for G1 where 2 samples have imitated corrosion and since all specimens in the control mixes for groups C1 and G1 have already failed, performance improvements can be inferred. FER Performance Summary: FER corrosion inhibitor appears to perform differently depending on the aggressiveness of the exposure condition. Either in an application where the chloride ions move slowly (G109) or in low concentrations (Field specimens due to the larger cover) the inhibitor displayed an increase in the TCI. In an application where the chloride ions move within the concrete in a short amount of time and in large concentrations (three-bar tombstone), the inhibitor is overwhelmed so that no benefit is obtained. 4.2.3 Organic Corrosion Inhibitor (REO) Three-bar Tombstone Specimens: Examination of Figure 6, Three-bar tombstone TCI, reveals that no consistent performance trend is discernable for this corrosion inhibitor. In some groups (C1, P1, and P3) REO performed worse than the control, while in other groups (C2 and G1) it performed better than the control. Overall the differences are small enough to be within the natural scatter of concrete produced in this project based on the variables measured and the TCI analysis made. Based on the three-bar tombstone specimen geometry all indications are that the use of REO does not improve the performance of concrete. Three-bar Tombstone Specimens - Cracked Concrete: REO performance versus the control in the different groups of cracked concrete was not consistent enough to reach consensus on its performance, although the best performance (500+ days) in cracked concrete was obtained with this inhibitor. G 109 Specimens: From the TCI graph of the G109 specimen geometry (Figure 9) it is evident that REO consistently performs better than the control in all but one group (C1-full dose). Field Specimens: In the case of the field specimens (Figure 11), the REO group C1 specimens reached TCI at the same time as the control of the group. In the rest of the groups, REO specimens have not reached TCI, so the final performance verdict for this corrosion inhibitor remains to be identified for this geometry. Of all the corrosion inhibitors under study in the field specimen geometry, REO is the only one in which one full set of specimens (REO-C1) have shown corrosion activity besides the C1 and G1 controls.

- 24 -
REO performance summary: Based on the specimens under test, the variables measured and their analysis, not enough difference is evident to justify use at this time in a marine environment where concrete is partially exposed to salt solutions. For super-structure applications, the data suggests some benefit is obtained from the use of this inhibitor. Inhibitors Summary: Overall only calcium nitrite appears to provide some performance enhancing properties to the concrete, regardless of specimen geometry, but the improvement does not match that obtained from using fly-ash and/or silica fume. In the case of cracked concrete, DCI in the only admixed material that improved performance. The Table 3 below summarizes performance as described in the previous paragraphs.
Table 3. Summary of Inhibitor Enhancing TCI
Inhibitor Three-bar Tombstone G109 Field Column Uncracked Cracked DCI Y Y N Y FER N N Y N REO N N Y N
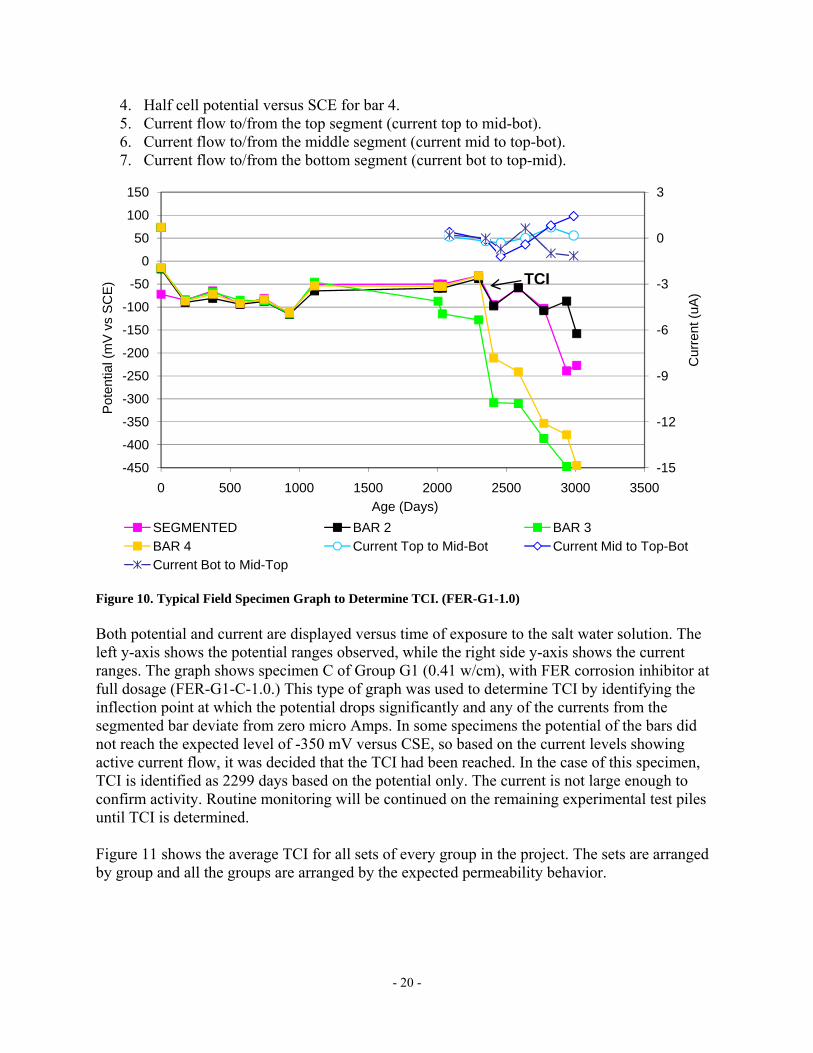
OBJECTIVE 5: DETERMINE POSSIBLE NEGATIVE SIDE EFFECTS – PERFORMANCE TESTS 5.1 Determine effect of insufficient dosage on corrosion progression. Only uncracked three-bar tombstone columns and G109 specimens have half and full dose specimens. Within those geometries only C1, P1, and P2 have all three dosages of zero, half and full for a total of six groups from which observations can be drawn. Two groups from the G109 specimen geometry have not shown any signs of activity, so the analysis that follows is based on three groups from the three-bar tombstone specimen geometry (Figure 6) and one group from the G109 specimen geometry (Figure 9). Figures 12, 13, and 14 display TCI for inhibitors DCI, FER, and REO respectively for only those groups from the three-bar Tombstone and G109 specimens with half and full dose inhibitor amounts. 5.1.1 Calcium nitrite-based inhibitor (DCI) In all four cases the transition between the controls (CTRL) to the inhibitor at half dose showed some kind of improvement, although not very significant in each group. The small improvement is significant in that it occurs in all the groups; so these changes taken as a whole indicate that DCI does provide a positive but modest improvement in performance. In the transition between the half dose to the full dose, the TCI actually shows a decrease in three out of the four groups indicating that the beneficial effects of DCI may be dose dependent. The only group showing an increase of TCI from half dose to full dose is the three-bar tombstone P2 group.
- 25 -
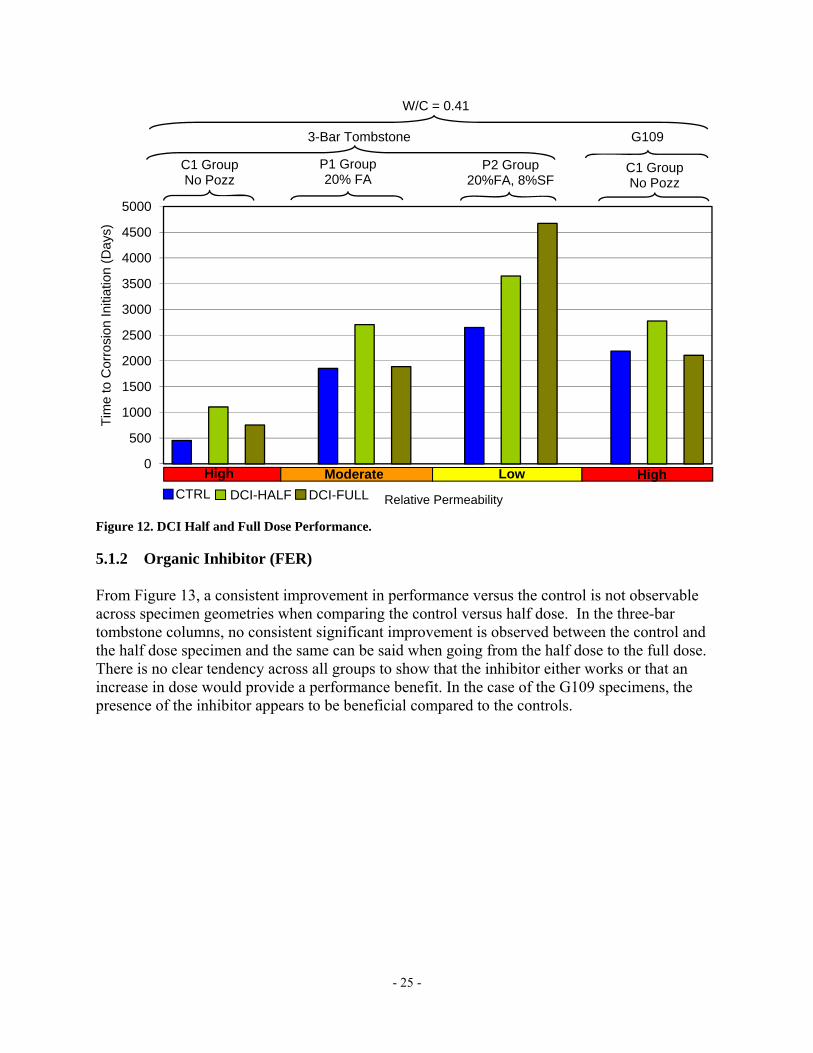
Figure 12. DCI Half and Full Dose Performance. 5.1.2 Organic Inhibitor (FER) From Figure 13, a consistent improvement in performance versus the control is not observable across specimen geometries when comparing the control versus half dose. In the three-bar tombstone columns, no consistent significant improvement is observed between the control and the half dose specimen and the same can be said when going from the half dose to the full dose. There is no clear tendency across all groups to show that the inhibitor either works or that an increase in dose would provide a performance benefit. In the case of the G109 specimens, the presence of the inhibitor appears to be beneficial compared to the controls.
0
500
1000
1500
2000
2500
3000
3500
4000
4500
5000
Tim
e to
Cor
rosi
on In
itiat
ion
(Day
s)
Relative Permeability
High Moderate Low
W/C = 0.41
C1 GroupNo Pozz
P1 Group20% FA
CTRL DCI-HALF DCI-FULLHigh
P2 Group20%FA, 8%SF
C1 GroupNo Pozz
3-Bar Tombstone G109
- 26 -
Figure 13. FER Half and Full Dose Performance. 5.1.3 Organic Corrosion Inhibitor (REO) No appreciable difference between half the recommended dose and the full-recommended dose was observed. As seen in the FER specimens, there doesn’t appear to be any correlation between dosage amounts or effectiveness in extending the TCI. The full dose G109 specimens performed similar to the controls, while the half dose set has yet to reach TCI.
0
500
1000
1500
2000
2500
3000
3500
4000
4500
Tim
e to
Cor
rosi
on In
itiat
ion
(Day
s)
Relative Permeability
High Moderate Low
W/C = 0.41
C1 GroupNo Pozz
P1 Group20% FA
CTRL FER-HALF FER-FULL
High
P2 Group20%FA, 8%SF
C1 GroupNo Pozz
3-Bar Tombstone G109

- 27 -
Figure 14. REO Half and Full Dose Performance. 5.2 Effect of inhibitor on chloride threshold The chloride penetration resistance of all the mixes in this project was previously reported1. The previous analysis was done on the three-bar tombstone column specimens, but due to high scatter in the data no definite conclusions could be reached. In this report, chloride profiles are discussed that were obtained at two different exposure times, 6.3 and 10.3 years.
5.2.1 Chloride Profiles of Cores taken from Field Columns after 6.3 Years.
Chloride profiles for all the failed field specimens at 6.3 years of exposure is presented, as well as the chloride profile for one control specimen from groups P1 (0.41w/cm, 20%FA) and P2 (0.41 w/cm, 20%FA, 8%SF). Figure 15 show the chloride profile for all the groups (CTRL-C1, REO-C1, and REO-G1) that have shown corrosion based on potential measurements and current flow between the segments of the segmented bar. Each point in the lines for the corroded specimens represents the average of the chloride at each depth from three different specimens. The chloride concentrations at each depth for the specimens in a given group were very consistent and with very little scatter. The cores were obtained by wet coring each specimen 6” above the mean high water mark and dry sliced in ¼” thick slices. The depth of the middle of the slice is used in the graph to represent its location. In addition, cores were taken from one of the CTRL-P1 and CTRL-P2 specimens in order to compare concrete chloride penetration to the lower permeability concretes.
0
1000
2000
3000
4000
5000
6000
Tim
e to
Cor
rosi
on In
itiat
ion
(Day
s)
Relative Permeability
High Moderate Low
W/C = 0.41
C1 GroupNo Pozz
P1 Group20% FA
CTRL REO-HALF REO-FULLHigh
P2 Group20%FA, 8%SF
C1 GroupNo Pozz
3-Bar Tombstone G109

Figure 15. Using linfailure foobtained.
*CeFor compCTRL-PconcentraThis is nothe relaticorrosion
0
5
10
15
20
25
0
Chl
orid
e C
onte
nt (L
bs/Y
d3)
. Failed Field
near interpolor the corrod.
CTRL-C1 REO-C1 CTRL-G1
ementitious facparison purp1 and CTRLation at steelot surprisingvely short ex
n.
0
CTRL
Specimens Di
ation to calcded specimen
1.10Kg/m1.05 Kg/1.43 Kg/
ctor: percentageposes, the chlL-P2 is givenl depth, listeg given the sxposure time
0.5
L-C1
ffusion Profile
culate the chlns, the follow
m3 (1.86 /m3 (1.78 /m3 (2.43
e of amount ofloride level
n below. In thed below, walow rate of ce, and is con
CTRL-P1CTRL-P2
REO-C1
- 28 -
e
loride concewing chlorid
Lbs/Yd3) Lbs/Yd3) Lbs/Yd3)
f chloride as a robtained forhe low permas found to bchloride pennsistent with
0.275 L0.458 L
1Depth (inche
CTRL-G1
6.3 YeDif
entration at sde thresholds
0.25% cem0.24% cem0.32% cem
ratio to the totar the deepest
meability conbe in the ordenetration exp
the absence
Lbs/Yd3
Lbs/Yd3
es)
1 CT
ear Field Samffusion ProfileDry Slicing
steel depth (2s for corrosio
mentitious famentitious famentitious fa
al amount of cet slice (1.75”ncrete columer of the bacected for tho
e of indicatio
1.5
TRL-P1
mplees
2”) at the timon initiation
actor* actor* actor*
ementitious. ”) for mixes
mns, the chlorckground levose materialsons of active
CTRL-P2
me of are
ride vels. s and
2
- 29 -
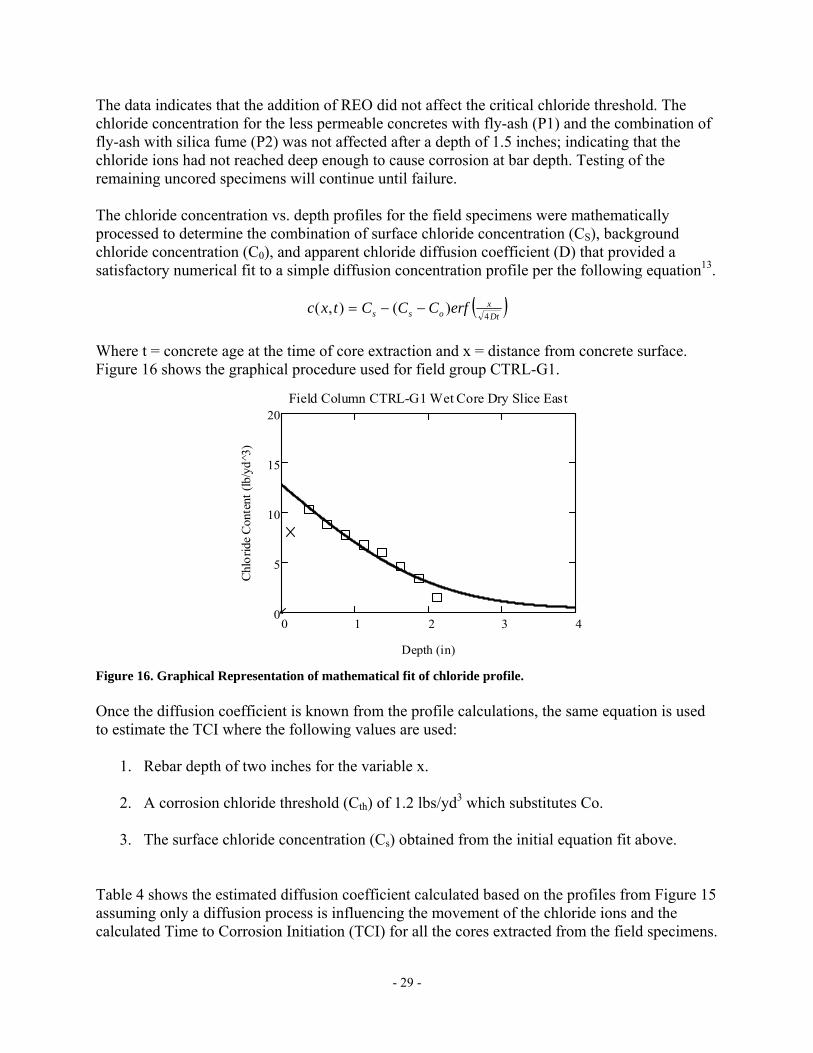
The data indicates that the addition of REO did not affect the critical chloride threshold. The chloride concentration for the less permeable concretes with fly-ash (P1) and the combination of fly-ash with silica fume (P2) was not affected after a depth of 1.5 inches; indicating that the chloride ions had not reached deep enough to cause corrosion at bar depth. Testing of the remaining uncored specimens will continue until failure. The chloride concentration vs. depth profiles for the field specimens were mathematically processed to determine the combination of surface chloride concentration (CS), background chloride concentration (C0), and apparent chloride diffusion coefficient (D) that provided a satisfactory numerical fit to a simple diffusion concentration profile per the following equation13.
( )Dt
xoss erfCCCtxc
4)(),( −−=
Where t = concrete age at the time of core extraction and x = distance from concrete surface. Figure 16 shows the graphical procedure used for field group CTRL-G1.
Figure 16. Graphical Representation of mathematical fit of chloride profile. Once the diffusion coefficient is known from the profile calculations, the same equation is used to estimate the TCI where the following values are used:
1. Rebar depth of two inches for the variable x. 2. A corrosion chloride threshold (Cth) of 1.2 lbs/yd3 which substitutes Co. 3. The surface chloride concentration (Cs) obtained from the initial equation fit above.
Table 4 shows the estimated diffusion coefficient calculated based on the profiles from Figure 15 assuming only a diffusion process is influencing the movement of the chloride ions and the calculated Time to Corrosion Initiation (TCI) for all the cores extracted from the field specimens.
0 1 2 3 40
5
10
15
20Field Column CTRL-G1 Wet Core Dry Slice East
Depth (in)
Chl
orid
e C
onte
nt (l
b/yd
^3)
- 30 -
The Concretes with pozzolanic additions indicate a minimum 3-fold increase in TCI versus the mixes without. The addition of REO did not have any observable effect on TCI.
Table 4: Field Specimen Calculated Diffusion Coefficient and TCI at 6.3 Years
Specimen Calculated
Cs Calculated D Diffusion
Determined TCI
Potential Determined
TCI (Lbs/Yd3) m2/s in2/y Years Years
CTRL-C1 18.202 3.406E-12 0.167 2.6 4.3 REO-C1 14.354 4.336E-12 0.212 2.3 5.5 CTRL-G1 12.823 3.206E-12 0.157 3.3 4.3 CTRL-P1 36.027 2.158E-13 0.010 36 >6.3 CTRL-P2 35.173 7.565E-13 0.037 9.4 >6.3
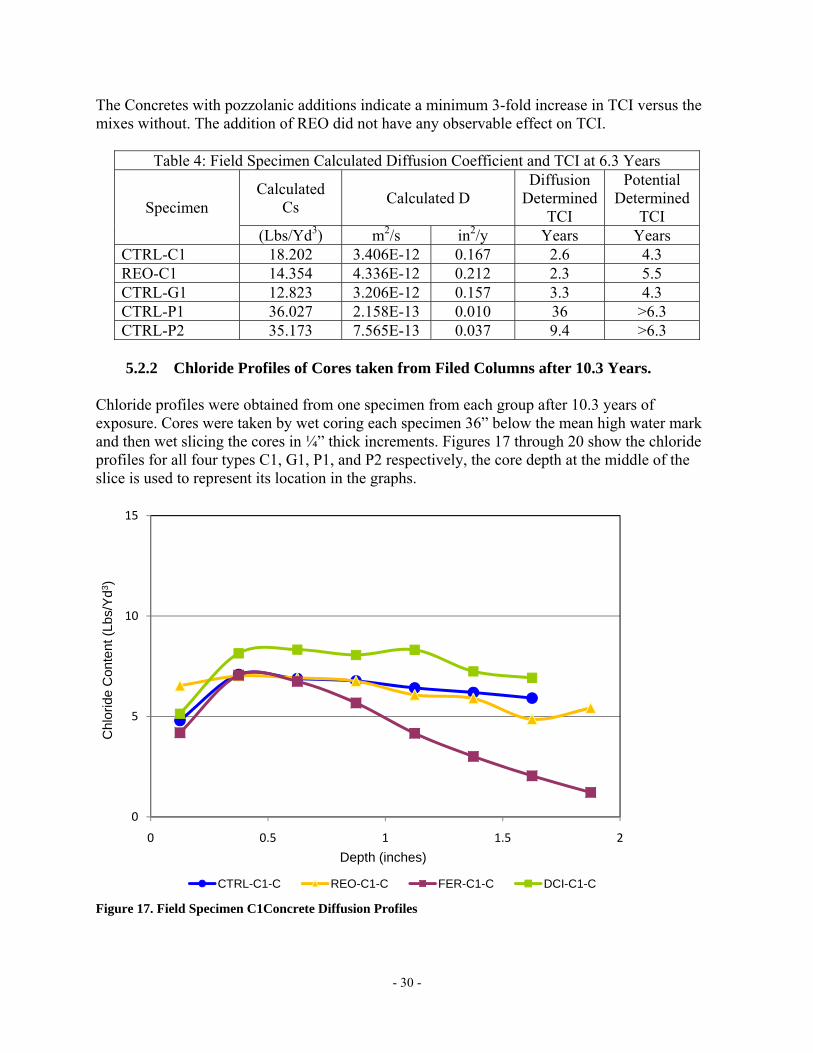
5.2.2 Chloride Profiles of Cores taken from Filed Columns after 10.3 Years.
Chloride profiles were obtained from one specimen from each group after 10.3 years of exposure. Cores were taken by wet coring each specimen 36” below the mean high water mark and then wet slicing the cores in ¼” thick increments. Figures 17 through 20 show the chloride profiles for all four types C1, G1, P1, and P2 respectively, the core depth at the middle of the slice is used to represent its location in the graphs.
Figure 17. Field Specimen C1Concrete Diffusion Profiles
0
5
10
15
0 0.5 1 1.5 2
Chl
orid
e C
onte
nt (L
bs/Y
d3)
Depth (inches)
CTRL-C1-C REO-C1-C FER-C1-C DCI-C1-C
- 31 -
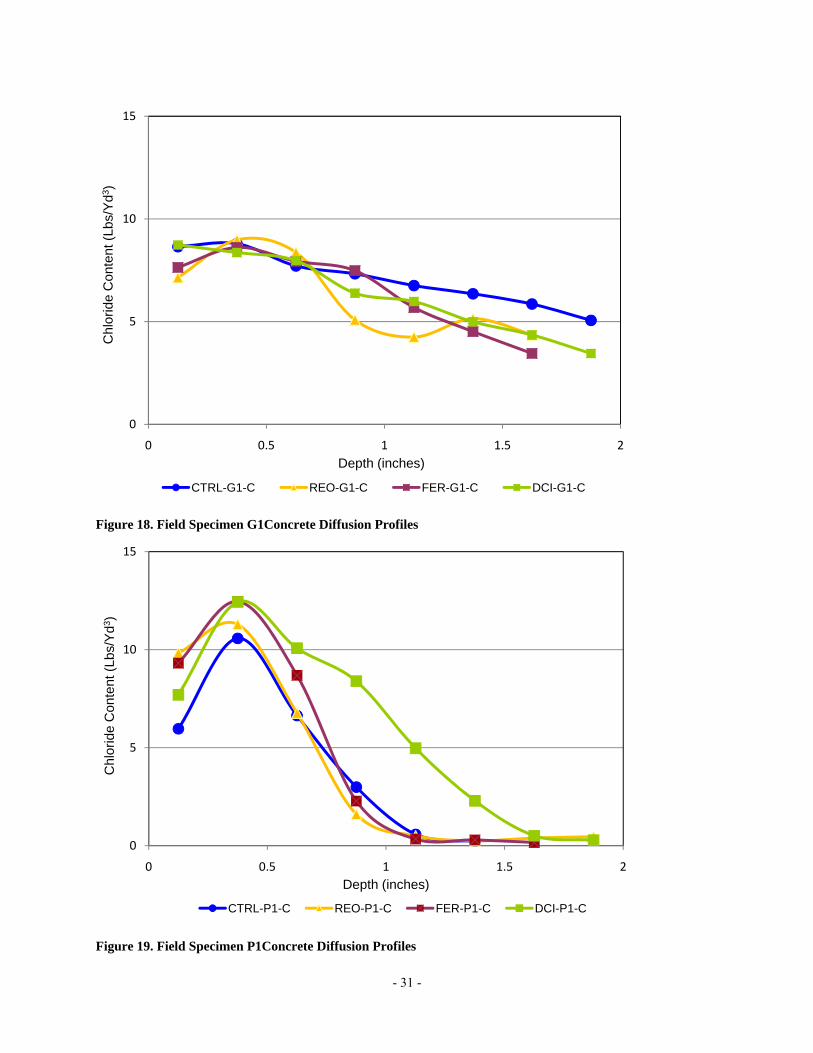
Figure 18. Field Specimen G1Concrete Diffusion Profiles
Figure 19. Field Specimen P1Concrete Diffusion Profiles
0
5
10
15
0 0.5 1 1.5 2
Chl
orid
e C
onte
nt (L
bs/Y
d3)
Depth (inches)
CTRL-G1-C REO-G1-C FER-G1-C DCI-G1-C
0
5
10
15
0 0.5 1 1.5 2
Chl
orid
e C
onte
nt (L
bs/Y
d3)
Depth (inches)
CTRL-P1-C REO-P1-C FER-P1-C DCI-P1-C
- 32 -
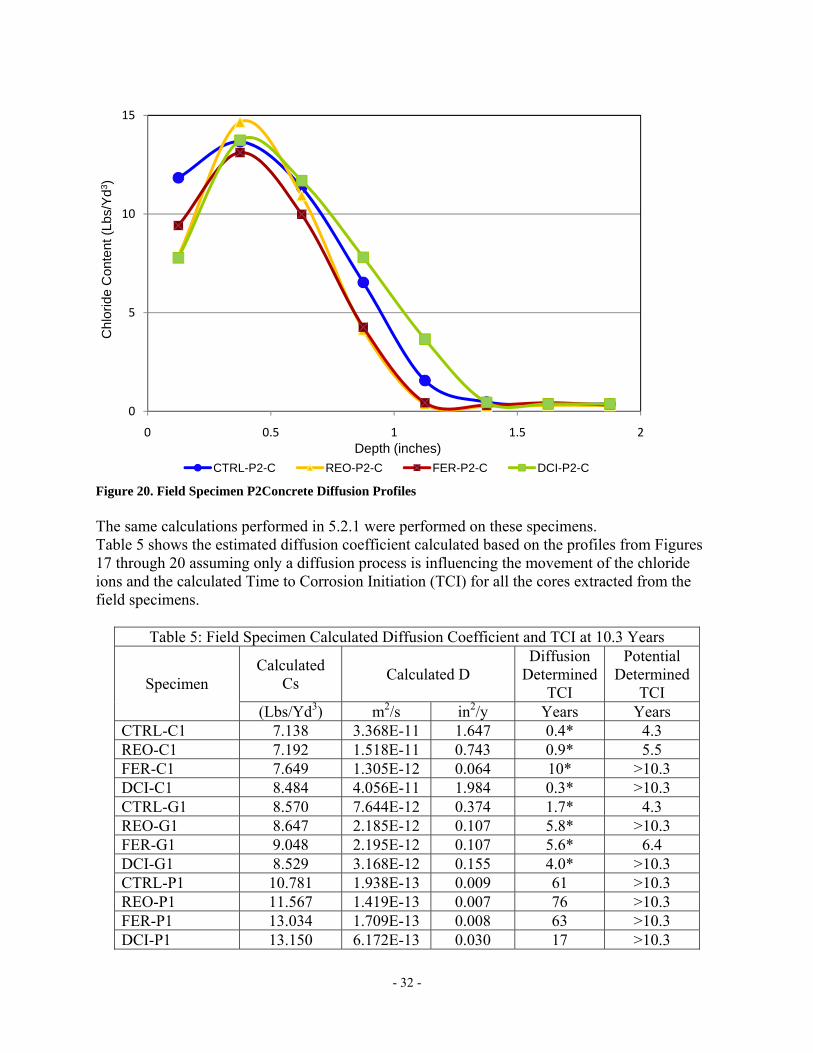
Figure 20. Field Specimen P2Concrete Diffusion Profiles The same calculations performed in 5.2.1 were performed on these specimens. Table 5 shows the estimated diffusion coefficient calculated based on the profiles from Figures 17 through 20 assuming only a diffusion process is influencing the movement of the chloride ions and the calculated Time to Corrosion Initiation (TCI) for all the cores extracted from the field specimens.
Table 5: Field Specimen Calculated Diffusion Coefficient and TCI at 10.3 Years
Specimen Calculated
Cs Calculated D Diffusion
Determined TCI
Potential Determined
TCI (Lbs/Yd3) m2/s in2/y Years Years
CTRL-C1 7.138 3.368E-11 1.647 0.4* 4.3 REO-C1 7.192 1.518E-11 0.743 0.9* 5.5 FER-C1 7.649 1.305E-12 0.064 10* >10.3 DCI-C1 8.484 4.056E-11 1.984 0.3* >10.3 CTRL-G1 8.570 7.644E-12 0.374 1.7* 4.3 REO-G1 8.647 2.185E-12 0.107 5.8* >10.3 FER-G1 9.048 2.195E-12 0.107 5.6* 6.4 DCI-G1 8.529 3.168E-12 0.155 4.0* >10.3 CTRL-P1 10.781 1.938E-13 0.009 61 >10.3 REO-P1 11.567 1.419E-13 0.007 76 >10.3 FER-P1 13.034 1.709E-13 0.008 63 >10.3 DCI-P1 13.150 6.172E-13 0.030 17 >10.3
0
5
10
15
0 0.5 1 1.5 2
Chl
orid
e C
onte
nt (L
bs/Y
d3)
Depth (inches)CTRL-P2-C REO-P2-C FER-P2-C DCI-P2-C
- 33 -
CTRL-P2 14.694 3.196E-13 0.016 30 >10.3 REO-P2 15.481 2.072E-13 0.010 47 >10.3 FER-P2 13.542 3.895E-13 0.019 26 >10.3 DCI-P2 14.819 4.162E-13 0.020 24 >10.3
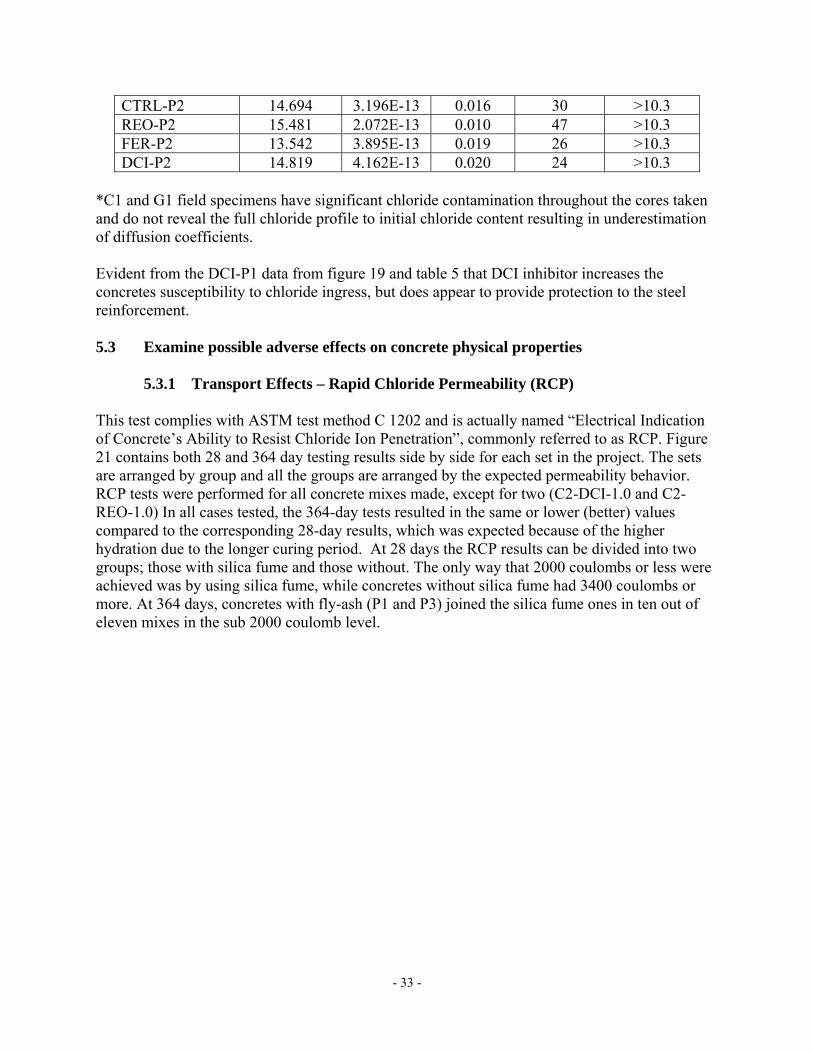
*C1 and G1 field specimens have significant chloride contamination throughout the cores taken and do not reveal the full chloride profile to initial chloride content resulting in underestimation of diffusion coefficients. Evident from the DCI-P1 data from figure 19 and table 5 that DCI inhibitor increases the concretes susceptibility to chloride ingress, but does appear to provide protection to the steel reinforcement. 5.3 Examine possible adverse effects on concrete physical properties 5.3.1 Transport Effects – Rapid Chloride Permeability (RCP) This test complies with ASTM test method C 1202 and is actually named “Electrical Indication of Concrete’s Ability to Resist Chloride Ion Penetration”, commonly referred to as RCP. Figure 21 contains both 28 and 364 day testing results side by side for each set in the project. The sets are arranged by group and all the groups are arranged by the expected permeability behavior. RCP tests were performed for all concrete mixes made, except for two (C2-DCI-1.0 and C2-REO-1.0) In all cases tested, the 364-day tests resulted in the same or lower (better) values compared to the corresponding 28-day results, which was expected because of the higher hydration due to the longer curing period. At 28 days the RCP results can be divided into two groups; those with silica fume and those without. The only way that 2000 coulombs or less were achieved was by using silica fume, while concretes without silica fume had 3400 coulombs or more. At 364 days, concretes with fly-ash (P1 and P3) joined the silica fume ones in ten out of eleven mixes in the sub 2000 coulomb level.
- 34 -
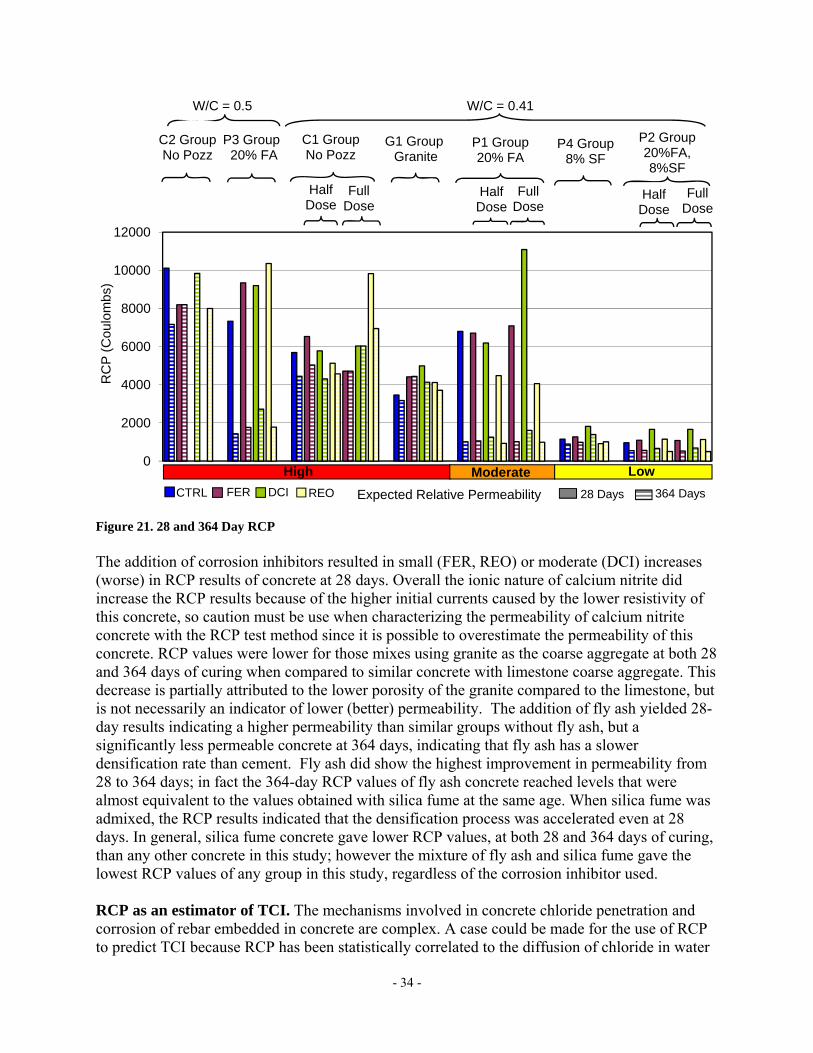
Figure 21. 28 and 364 Day RCP The addition of corrosion inhibitors resulted in small (FER, REO) or moderate (DCI) increases (worse) in RCP results of concrete at 28 days. Overall the ionic nature of calcium nitrite did increase the RCP results because of the higher initial currents caused by the lower resistivity of this concrete, so caution must be use when characterizing the permeability of calcium nitrite concrete with the RCP test method since it is possible to overestimate the permeability of this concrete. RCP values were lower for those mixes using granite as the coarse aggregate at both 28 and 364 days of curing when compared to similar concrete with limestone coarse aggregate. This decrease is partially attributed to the lower porosity of the granite compared to the limestone, but is not necessarily an indicator of lower (better) permeability. The addition of fly ash yielded 28-day results indicating a higher permeability than similar groups without fly ash, but a significantly less permeable concrete at 364 days, indicating that fly ash has a slower densification rate than cement. Fly ash did show the highest improvement in permeability from 28 to 364 days; in fact the 364-day RCP values of fly ash concrete reached levels that were almost equivalent to the values obtained with silica fume at the same age. When silica fume was admixed, the RCP results indicated that the densification process was accelerated even at 28 days. In general, silica fume concrete gave lower RCP values, at both 28 and 364 days of curing, than any other concrete in this study; however the mixture of fly ash and silica fume gave the lowest RCP values of any group in this study, regardless of the corrosion inhibitor used. RCP as an estimator of TCI. The mechanisms involved in concrete chloride penetration and corrosion of rebar embedded in concrete are complex. A case could be made for the use of RCP to predict TCI because RCP has been statistically correlated to the diffusion of chloride in water
0
2000
4000
6000
8000
10000
12000
RC
P (C
oulo
mbs
)
Expected Relative Permeability
High Moderate Low
C2 GroupNo Pozz
P3 Group20% FA
W/C = 0.5
Half Dose
Full Dose
W/C = 0.41
G1 GroupGranite
C1 GroupNo Pozz
Half Dose
Full Dose
P1 Group20% FA
P4 Group8% SF
P2 Group20%FA, 8%SF
Half Dose
Full Dose
CTRL FER DCI REO 28 Days 364 Days
- 35 -
saturated concrete. As such, RCP can be used as an estimator of TCI assuming that concrete chloride threshold is constant regardless of concrete chemistry. Figures 22 and 23 present graphs of RCP versus TCI for the three-bar tombstone specimens at 28 and 364 days respectively. The trend lines indicate that the relationship between RCP and TCI are moderately correlated. The 364 day RCP results are slightly better at predicting TCI because of the hydration of fly ash with longer curing time.
Figure 22. 28 Day RCP vs. TCI Three-bar Tombstone Specimens
Figure 23. 364 Day RCP vs. TCI Three-bar Tombstone Specimens
y = 44.74x0.9924
R² = 0.6172
100
1000
10000
1 10 100 1000
Tim
e to
Cor
rotio
n In
itiat
ion
(Day
s)
Rapid Chloride Permeability (10-4/Coulombs)
y = 25.078x0.9526
R² = 0.7129
100
1000
10000
1 10 100 1000
Tim
e to
Cor
rotio
n In
itiat
ion
(Day
s)
Rapid Chloride Permeability (Coulombs)
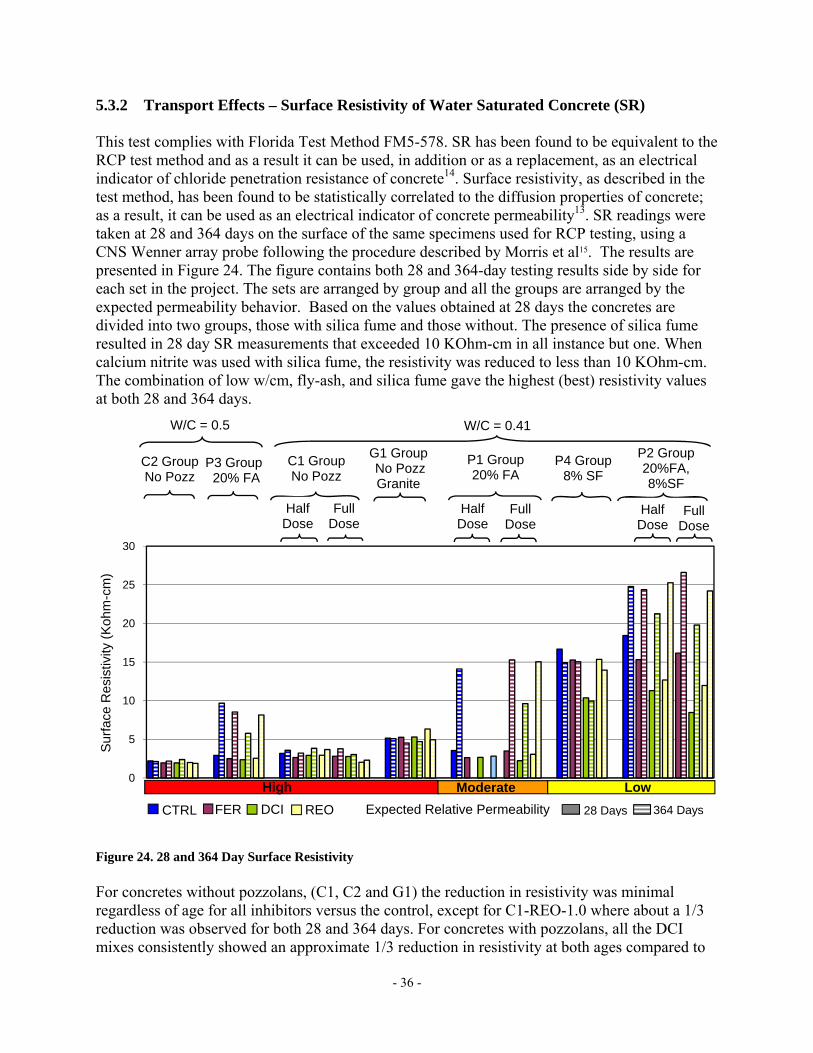
- 36 -
5.3.2 Transport Effects – Surface Resistivity of Water Saturated Concrete (SR) This test complies with Florida Test Method FM5-578. SR has been found to be equivalent to the RCP test method and as a result it can be used, in addition or as a replacement, as an electrical indicator of chloride penetration resistance of concrete14. Surface resistivity, as described in the test method, has been found to be statistically correlated to the diffusion properties of concrete; as a result, it can be used as an electrical indicator of concrete permeability13. SR readings were taken at 28 and 364 days on the surface of the same specimens used for RCP testing, using a CNS Wenner array probe following the procedure described by Morris et al15. The results are presented in Figure 24. The figure contains both 28 and 364-day testing results side by side for each set in the project. The sets are arranged by group and all the groups are arranged by the expected permeability behavior. Based on the values obtained at 28 days the concretes are divided into two groups, those with silica fume and those without. The presence of silica fume resulted in 28 day SR measurements that exceeded 10 KOhm-cm in all instance but one. When calcium nitrite was used with silica fume, the resistivity was reduced to less than 10 KOhm-cm. The combination of low w/cm, fly-ash, and silica fume gave the highest (best) resistivity values at both 28 and 364 days.
Figure 24. 28 and 364 Day Surface Resistivity For concretes without pozzolans, (C1, C2 and G1) the reduction in resistivity was minimal regardless of age for all inhibitors versus the control, except for C1-REO-1.0 where about a 1/3 reduction was observed for both 28 and 364 days. For concretes with pozzolans, all the DCI mixes consistently showed an approximate 1/3 reduction in resistivity at both ages compared to
0
5
10
15
20
25
30
Sur
face
Res
istiv
ity (K
ohm
-cm
)
Expected Relative Permeability
High Moderate Low
C2 GroupNo Pozz
P3 Group20% FA
W/C = 0.5
Half Dose
Full Dose
W/C = 0.41
G1 GroupNo PozzGranite
C1 GroupNo Pozz
Half Dose
Full Dose
P1 Group20% FA
P4 Group8% SF
P2 Group20%FA, 8%SF
Half Dose
Full Dose
CTRL FER DCI REO 28 Days 364 Days

- 37 -
the control specimens (C1-CTRL-1.0), which can be attributed to the ionic nature of calcium nitrite. The other two inhibitors did show a reduction, but the amount is not as consistent across all groups. SR as an estimator of TCI. The same argument used above for RCP as an estimator of TCI can be used for SR. Figures 25 and 26 present graphs of SR versus TCI for the three-bar tombstone specimens at 28 and 364 days respectively. Once again, the 364 day results are better fitted than the 28 days results because of the maturity brought about by the delayed fly-ash pozzolanic reactions. The data does indicate that resistivity can be used to estimate TCI and that relative performance is best obtained using resistivity at 364 days.
Figure 25. 28 Day SR vs. TCI Three-bar Tombstone Specimens
y = 237.87x + 240.51R² = 0.666
0
1000
2000
3000
4000
5000
6000
0 5 10 15 20
Tim
e to
Cor
rotio
n In
itiat
ion
(Day
s)
Surface Resistivity (KOhm-cm)
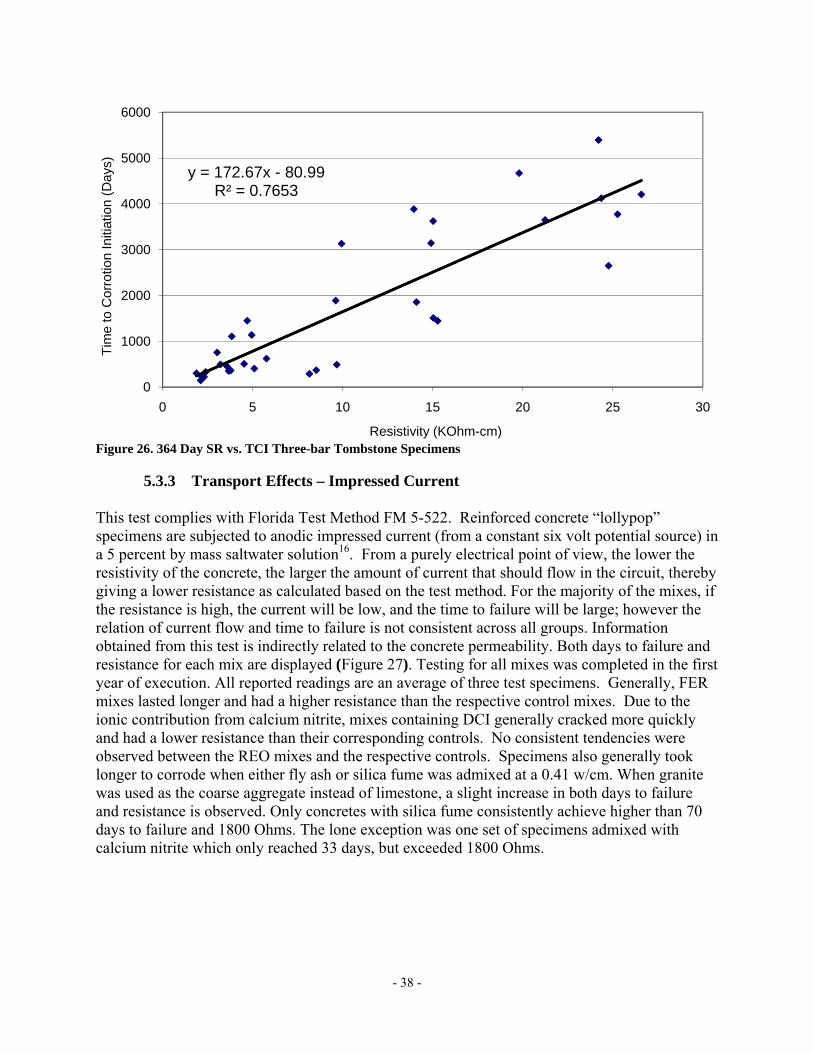
- 38 -
Figure 26. 364 Day SR vs. TCI Three-bar Tombstone Specimens 5.3.3 Transport Effects – Impressed Current This test complies with Florida Test Method FM 5-522. Reinforced concrete “lollypop” specimens are subjected to anodic impressed current (from a constant six volt potential source) in a 5 percent by mass saltwater solution16. From a purely electrical point of view, the lower the resistivity of the concrete, the larger the amount of current that should flow in the circuit, thereby giving a lower resistance as calculated based on the test method. For the majority of the mixes, if the resistance is high, the current will be low, and the time to failure will be large; however the relation of current flow and time to failure is not consistent across all groups. Information obtained from this test is indirectly related to the concrete permeability. Both days to failure and resistance for each mix are displayed (Figure 27). Testing for all mixes was completed in the first year of execution. All reported readings are an average of three test specimens. Generally, FER mixes lasted longer and had a higher resistance than the respective control mixes. Due to the ionic contribution from calcium nitrite, mixes containing DCI generally cracked more quickly and had a lower resistance than their corresponding controls. No consistent tendencies were observed between the REO mixes and the respective controls. Specimens also generally took longer to corrode when either fly ash or silica fume was admixed at a 0.41 w/cm. When granite was used as the coarse aggregate instead of limestone, a slight increase in both days to failure and resistance is observed. Only concretes with silica fume consistently achieve higher than 70 days to failure and 1800 Ohms. The lone exception was one set of specimens admixed with calcium nitrite which only reached 33 days, but exceeded 1800 Ohms.
y = 172.67x - 80.99R² = 0.7653
0
1000
2000
3000
4000
5000
6000
0 5 10 15 20 25 30
Tim
e to
Cor
rotio
n In
itiat
ion
(Day
s)
Resistivity (KOhm-cm)

- 39 -
Figure 27. Impressed Current Days to Failure and Resistance 5.3.4 Compressive Strength This test was conducted in accordance with test method ASTM C 39. Compressive strength tests were conducted at 28 and 364 days after batching on each of the mix groups (Figure 28). All compressive strength information reveals little difference between the mixes containing corrosion inhibitors and their respective control mixes. REO mixes were the only mixes to consistently show a small loss of compressive strength compared to the controls for corresponding mix groups. Generally, 364-day test results were higher than 28-day test results, which imply the specimens continued to cure during that time. The addition of fly ash extended the overall curing time for the specimens, with compressive strength increasing the most from 28-day tests to 364-day tests. The addition of silica fume did not result in specimens achieving much higher early strength versus all the mixes with similar w/cm. Comparison of the differing coarse aggregate groups, the group using granite coarse aggregate exhibited higher compressive strengths than the mix with limestone but the increase was not significantly large. Overall the 0.41 w/cm mixes did not have a problem achieving the 5500 PSI design strength; even though the 0.5 w/cm mixes were not designed for this strength, the mixes almost achieved this strength. One important fact that the strength information revealed is that concrete strength is a very poor predictor of permeability.
0
400
800
1200
1600
2000
2400
2800
3200
3600
4000
0
20
40
60
80
100
120
140
160
180
200
Res
ista
nce
(Ohm
s)
Day
s to
Fai
lure
Expected Relative Permeability
Moder Low
C2 Group P3 Group20% FA
W/C = 0.5
Half Dose
Full Dose
W/C = 0.41
G1 GroupGranite
C1 Group
Half Dose
Full Dose
P1 Group20% FA
P4 Group8% SF
P2 Group20%FA, 8%SF
Half Dose
CTRL FER DCI REO Days Resistance
N/A N/AHigh Moderate
Full Dose
N/A N/A
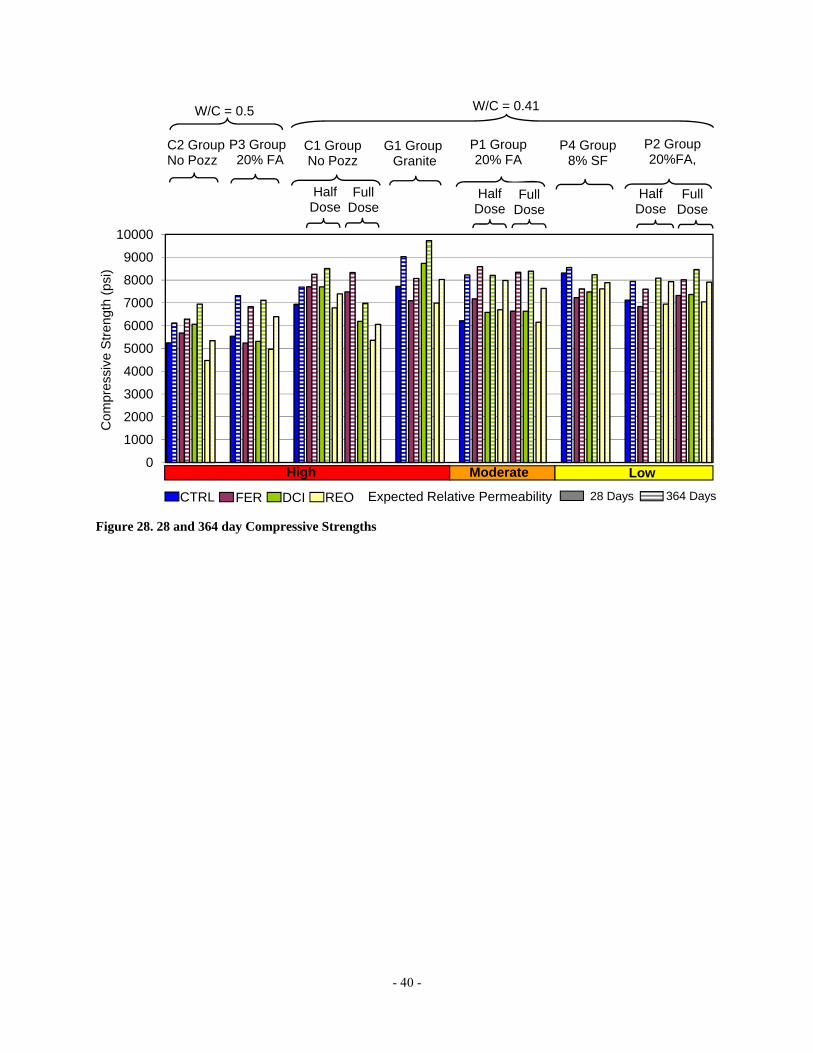
- 40 -
Figure 28. 28 and 364 day Compressive Strengths
0
1000
2000
3000
4000
5000
6000
7000
8000
9000
10000
Com
pres
sive
Stre
ngth
(psi
)
Expected Relative Permeability
High Moderate Low
C2 GroupNo Pozz
P3 Group20% FA
W/C = 0.5
Half Dose
Full Dose
W/C = 0.41
G1 GroupGranite
C1 GroupNo Pozz
Half Dose
Full Dose
P1 Group20% FA
P4 Group8% SF
P2 Group20%FA,
Half Dose
Full Dose
CTRL FER DCI REO 28 Days 364 Days
- 41 -
CONCLUSION Calcium nitrite-based inhibitor (DCI) DCI provided consistency and overall better corrosion protection in the results obtained in the Time of Corrosion Initiation (TCI) when compared to the control mixes for three-bar tombstone specimens group. The difference between these specimens is small, but from a broader perspective it is consistent for the overall project. The comparison between the controls to the inhibitor at half dose showed some kind of improvement, although not very significant in each group. The induced crack specimens considerably decreased the TCI for all specimens regardless of additions used. However, increases in TCI over the control cracked specimens are observed that can be attributed to the presence of calcium nitrite. DCI is contributing somewhat to improving TCI. Field Specimens have not shown any corrosion activity in the calcium nitrite specimens. After all the tests with three types of specimens were performed, it can be concluded that DCI seems to increase the time of corrosion initiation. The cost effectiveness of DCI when compared to fly-ash and silica fume might not be seen if DCI is used alone. Its use may be more applicable to low permeability concrete with optimal total cementitious content, low w/c, and admixed pozzolans. SIKA FerroGard 901 Concrete mixes with FerroGard had a higher corrosion resistance within the group compared to the respective control mixes. On the other hand, it did not show better performance trend for three-bar tombstone specimen. The presence of a crack in the concrete drastically decreased the TCI for all specimens regardless of additions used.. The lack of improvement can be attributed to the large amount of chloride ions that instantly reached the steel upon exposure to salt solution due to the presence of the crack. It is evident that FerroGard consistently performs better than the control for G109 specimens. This can be attributed to the lower diffusion rate of chloride ions that reach the steel in a cyclic exposure condition. The field specimens containing FerroGard did not show any corrosion activity for any of the groups except for G1 where 2 pile specimens have initiated corrosion. All specimens in the control mixes for groups C1 and G1 have already failed, No conclusion can be drawn at this time. Rheocrete 222+ Rheocrete did not improve performance for three-bar tombstone specimens and samples failed fairly quickly. For the cracked tombstone sample, Rheocrete had the best performance in this category compared to the other inhibitors in test, although it did not report a consistent result compared to the control samples in test. The data also indicates it did not affect the critical chloride threshold. As seen in the FerroGard specimens, no appreciable correlation between dosage amounts or effectiveness in extending the TCI on these set of specimens. It is evident that Rheocrete samples consistently performed better than the G109 control samples in all except one control full dose group. On the other hand, field Specimens with Rheocrete group C1reached TCI at the same time as the control group. The tombstone specimen group with

- 42 -
Rheocrete has not reached TCI, so the final evaluation for this corrosion inhibitor remains to be identified for this geometry. Based on the long-term exposure tests performed on corrosion inhibitors, it can be concluded that calcium nitrite was the only inhibitor to provide some performance enhancement against corrosion. This effect was observed for various types of test specimens and concrete including variations of coarse aggregate, W/C ratio, and mineral admixture. On the other hand the improvement does not match that obtained from using fly-ash and/or silica fume, which has demonstrated a high performance when used in concrete.
- 43 -
REFERENCES
1. Powers, R.G., Sagues, A.A., Cerlanek, W.D., Kasper, C.A., Lianfang, L., Liang, H., Poor, N., Baskaran, R., “Corrosion Inhibitors in Concrete – Interim Report,” U.S. Department of Transportation, FHWA Publication No. FHWA-RD-02002, McLean, VA, March 2002.
2. Yunovich, M., Thompson, N.G., Virmani, Y.P. “Corrosion of Highway Bridges:
Economic Impact and Life-Cycle Cost Analysis,” CC Technologies Laboratories, Inc., Dublin, OH, 2004 CBC, p. 1.
3. Stanish, K.D., Hootom, R.D., Thomas M.D.A. (1997). “Testing the Chloride Penetration Resistance of Concrete: A literature Review.” Prediction of Chloride Penetration in Concrete, Federal Highway Administration, Contract DTFH61-97-R-00022.
4. B. Elsener, “Corrosion Inhibitors for Steel in Concrete” – an EFC State of the Art Report, Number 35, IOM Communications, Cambridge 2001. p. 2.
5. Andrade, C. Alonso, M. Acha, B. Malric, “Cement and Concrete Research” Volume 26
Institute of Construction Science “Eduardo Torroja”., Madrid, Spain, 1996 p. 405.
6. V.T. Ngala, C.L. Page, M.M. Page, Corrosion Science 45 (2003) p. 1523.
7. C.K. Nmai, S.A. Farrington, G.S. Bobrowsky, “Organic based corrosion inhibiting admixtures for reinforced concrete”, Concr. Intern., 14 (4) (1992) p. 45-51.
8. F. Wombacher, U. Maeder, B. Marazzani, “Cement and Concrete Composites” 26 (2004)
p. 209.
9. Fabio Bolzoni, Luciano Lazzari, Marco Ormellese, Sara Goidanich. “Prevention of Corrosion in Concrete The Use of Admixed Inhibitors” (Paper # 06344). Dept. Chemistry, Materials and Chemical Engineering –Politecnico di Milano, NACE 2006.
10. Virmani, Y.P., Clear, K. “Time-To-Corrosion of Reinforcing Steel in Concrete” Vol. 5, Federal Highway Administration, Interim Report No. FHWA/RD-83/012, Sep. 1983
11. Sagüés, A.A. “Modeling the Effects of Corrosion on the Lifetime of Extended Reinforced
Concrete Structures”, Corrosion/2003, Vol. 59, p.854, 2003.
12. Virmani P., “Corrosion Inhibitors for New Bridge Members,” Federal Highway Administration, Technical Note on Corrosion Protection System, Structures Division, Office of Engineering Research and Development.
13. Kessler, R.J., Powers, R.G., Paredes, M. A., Vivas, E., Virmani, P., “Surface Resistivity
as an indicator of concrete Chloride Penetration Resistance”. Florida Department of Transportation, Gainesville, 2008 Concrete Bridge Conference, March, 7 2008.
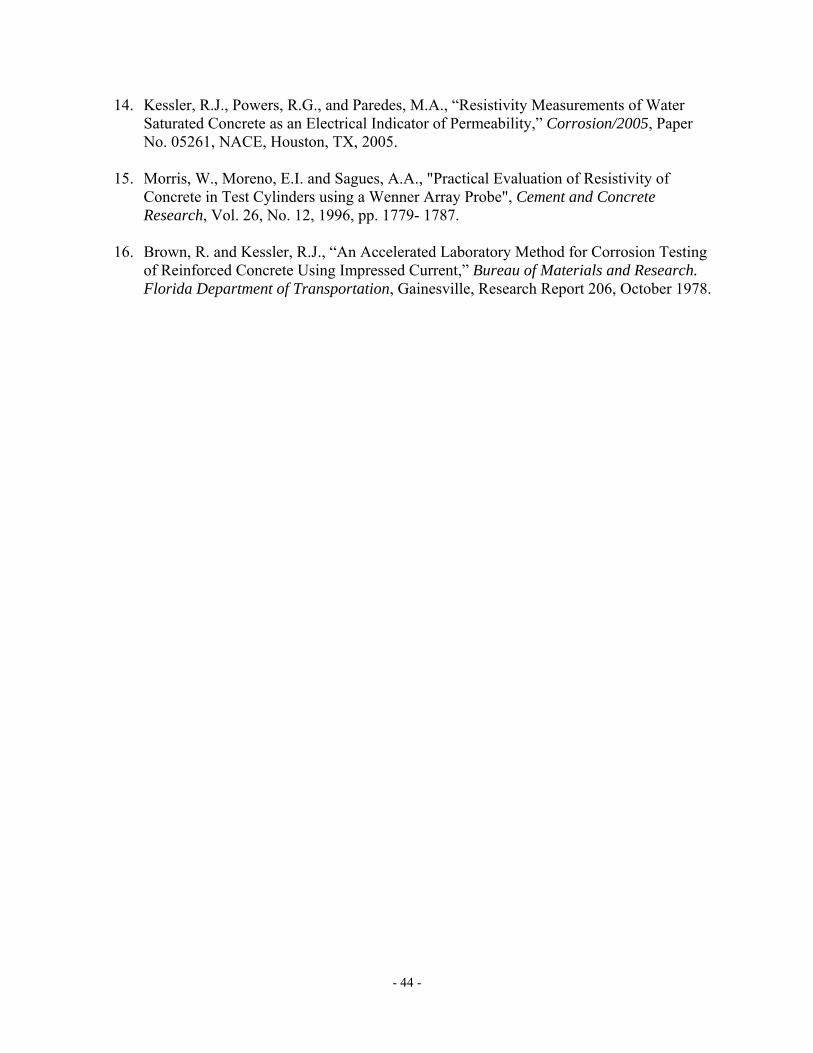
- 44 -
14. Kessler, R.J., Powers, R.G., and Paredes, M.A., “Resistivity Measurements of Water Saturated Concrete as an Electrical Indicator of Permeability,” Corrosion/2005, Paper No. 05261, NACE, Houston, TX, 2005.
15. Morris, W., Moreno, E.I. and Sagues, A.A., "Practical Evaluation of Resistivity of
Concrete in Test Cylinders using a Wenner Array Probe", Cement and Concrete Research, Vol. 26, No. 12, 1996, pp. 1779- 1787.
16. Brown, R. and Kessler, R.J., “An Accelerated Laboratory Method for Corrosion Testing
of Reinforced Concrete Using Impressed Current,” Bureau of Materials and Research. Florida Department of Transportation, Gainesville, Research Report 206, October 1978.

- 45 -
Appendix 1-A
Three-bar Tombstone Specimen Electrochemical Graphs
Potentials Cracked

- 46 -
Figure 1 3-bar Tombstones CTRL-C1-1.0 A Cracked
Figure 2 3-bar Tombstones CTRL-C1-1.0 B Cracked

- 47 -
Figure 3 3-bar Tombstones CTRL-C1-1.0 C Cracked
Figure 4 3-bar Tombstones DCI-C1-1.0 A Cracked
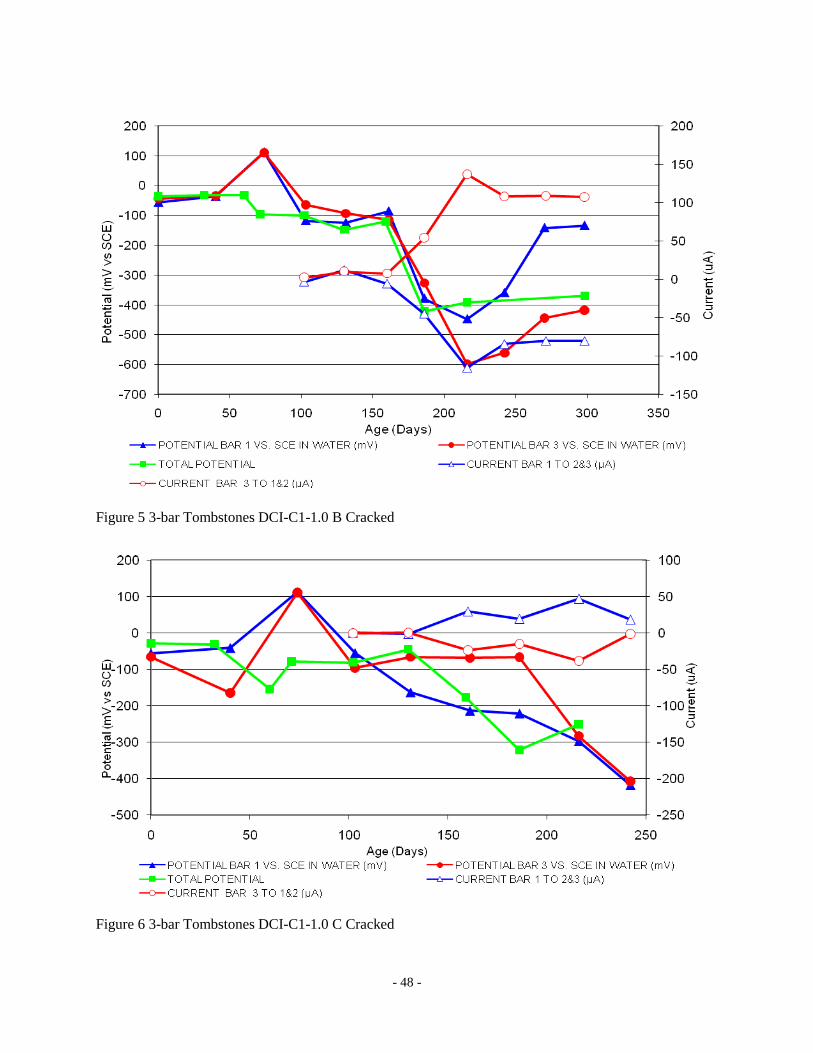
- 48 -
Figure 5 3-bar Tombstones DCI-C1-1.0 B Cracked
Figure 6 3-bar Tombstones DCI-C1-1.0 C Cracked
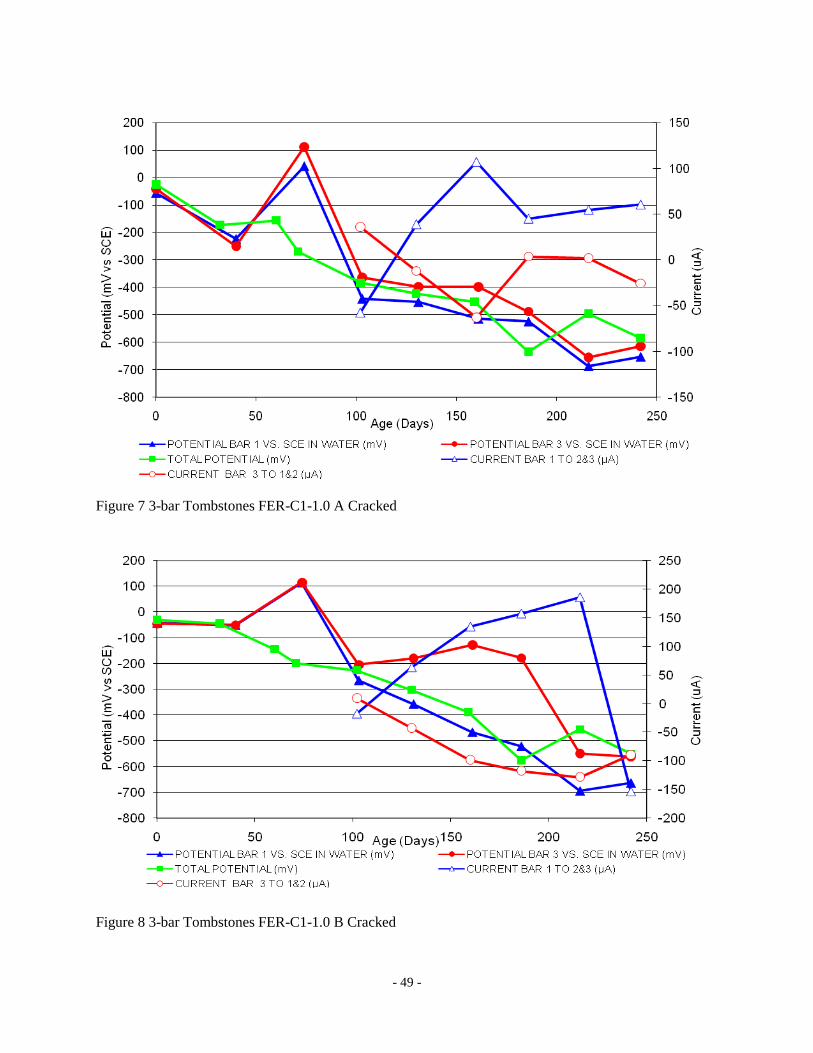
- 49 -
Figure 7 3-bar Tombstones FER-C1-1.0 A Cracked
Figure 8 3-bar Tombstones FER-C1-1.0 B Cracked
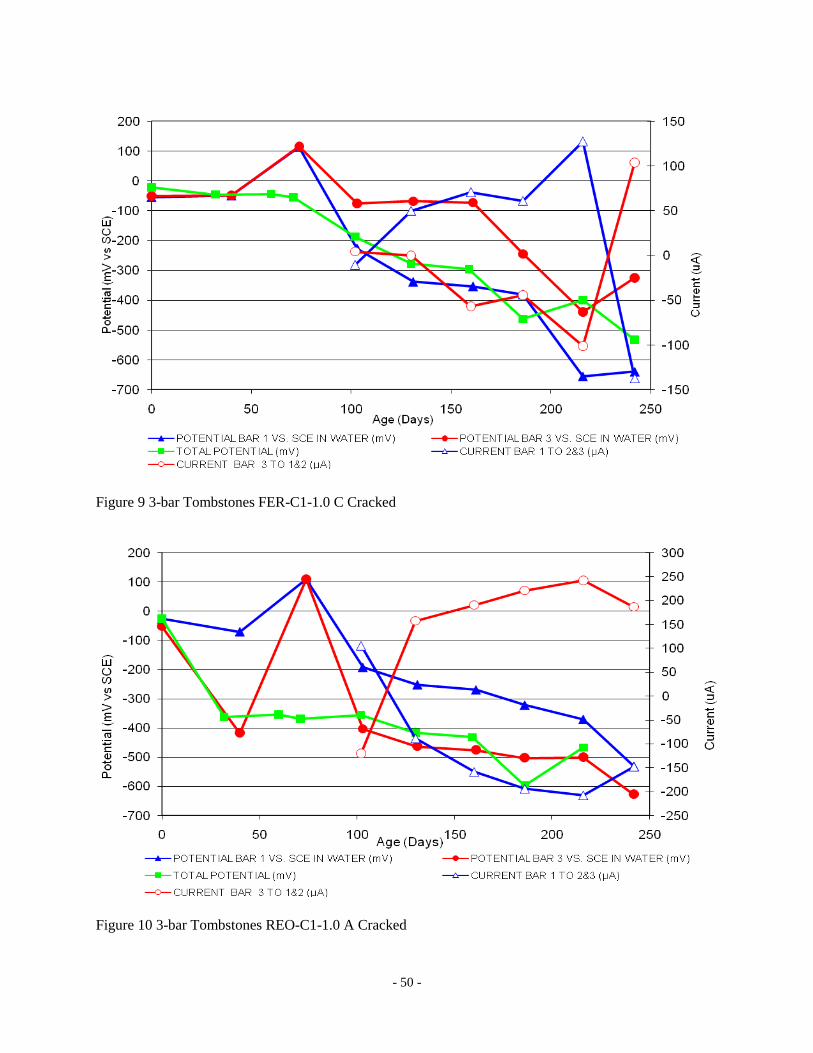
- 50 -
Figure 9 3-bar Tombstones FER-C1-1.0 C Cracked
Figure 10 3-bar Tombstones REO-C1-1.0 A Cracked
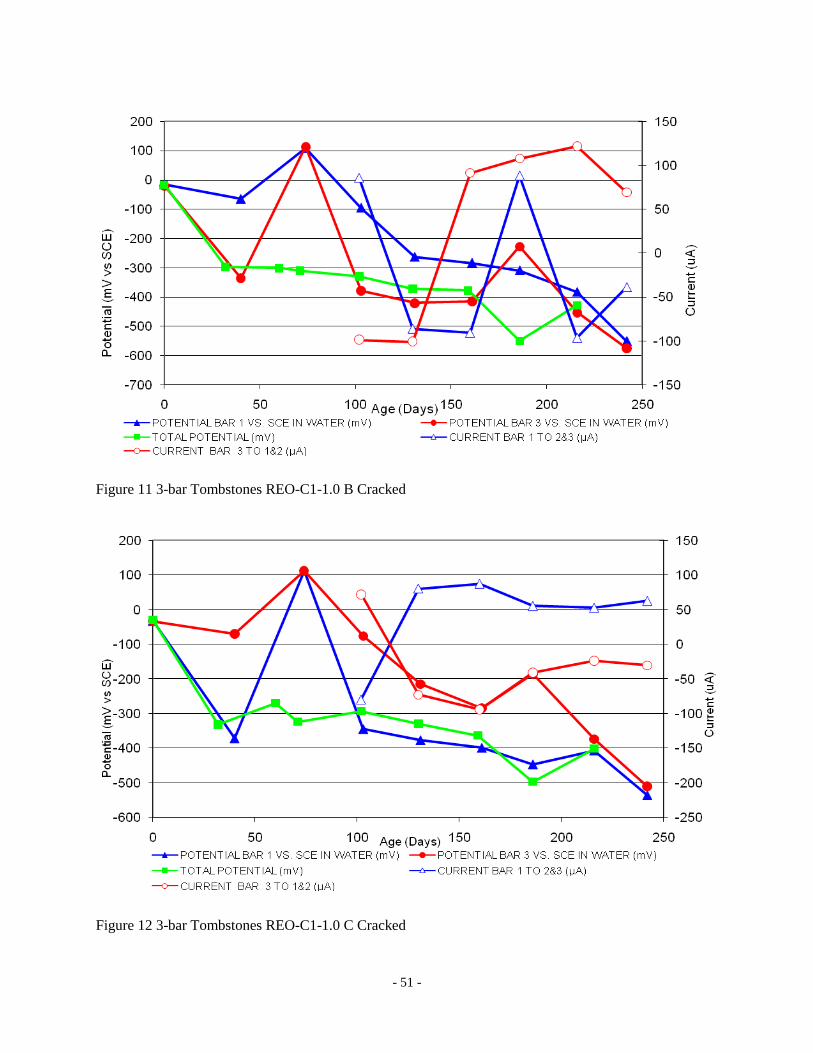
- 51 -
Figure 11 3-bar Tombstones REO-C1-1.0 B Cracked
Figure 12 3-bar Tombstones REO-C1-1.0 C Cracked
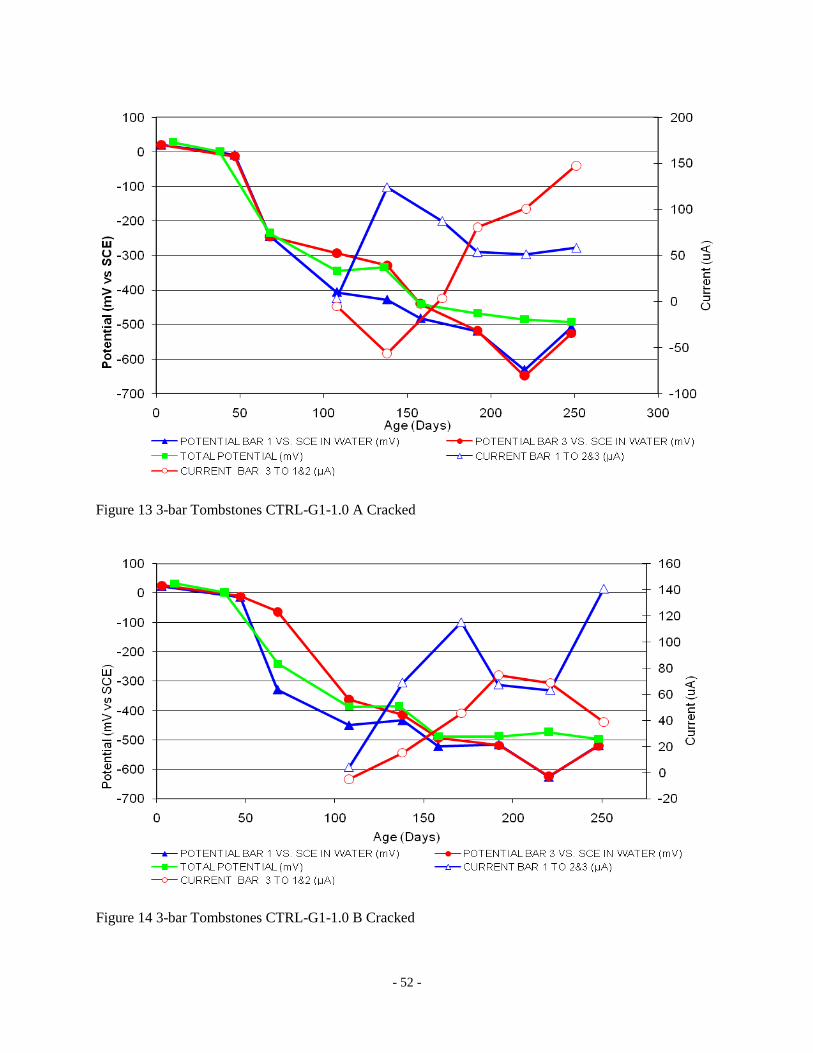
- 52 -
Figure 13 3-bar Tombstones CTRL-G1-1.0 A Cracked
Figure 14 3-bar Tombstones CTRL-G1-1.0 B Cracked

- 53 -
Figure 15 3-bar Tombstones CTRL-G1-1.0 C Cracked
Figure 16 3-bar Tombstones DCI-G1-1.0 A Cracked
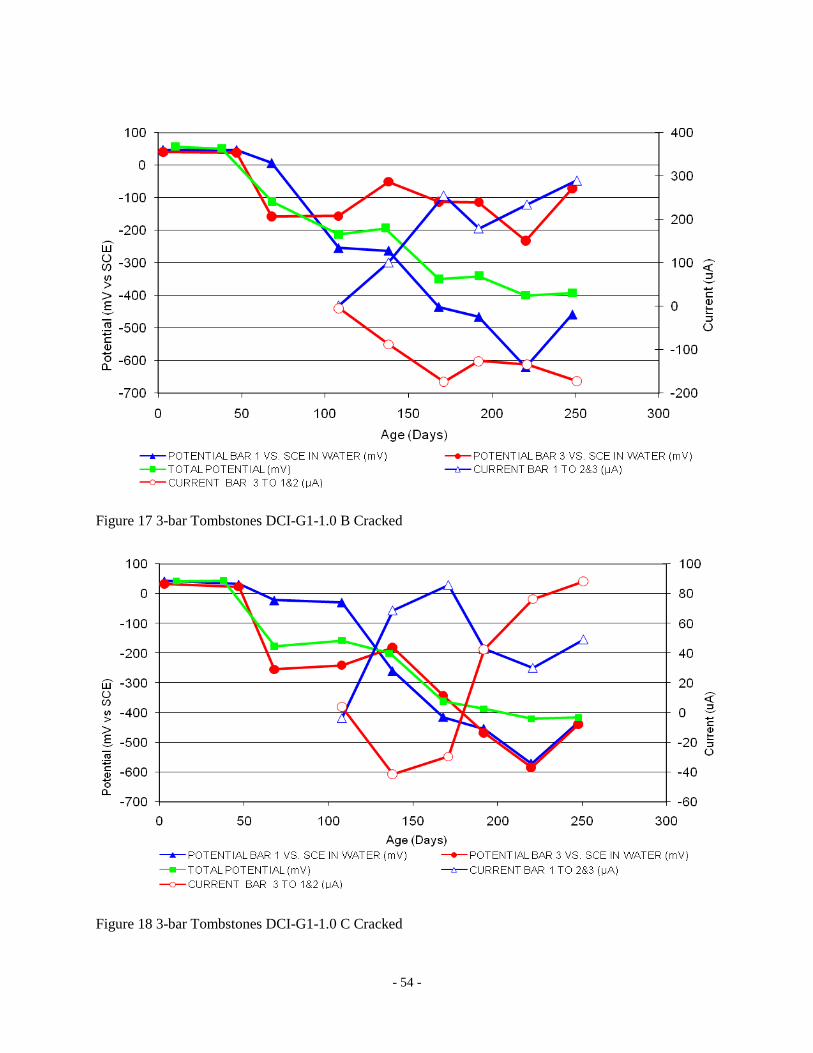
- 54 -
Figure 17 3-bar Tombstones DCI-G1-1.0 B Cracked
Figure 18 3-bar Tombstones DCI-G1-1.0 C Cracked
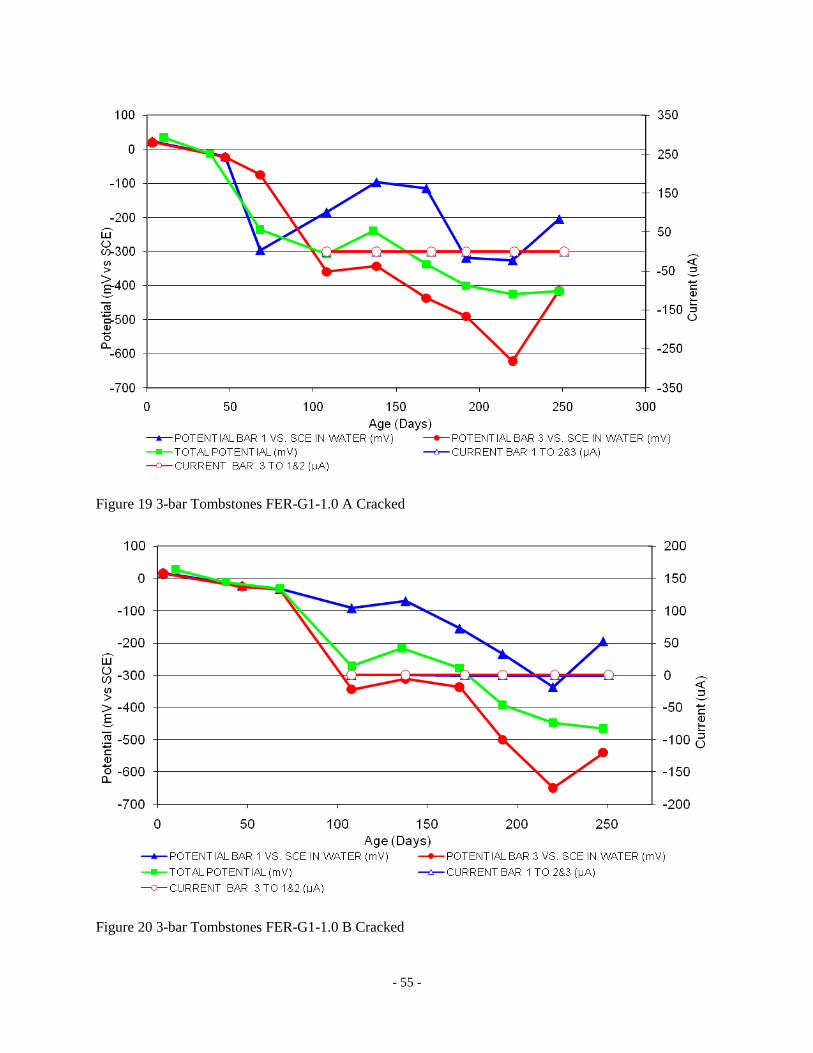
- 55 -
Figure 19 3-bar Tombstones FER-G1-1.0 A Cracked
Figure 20 3-bar Tombstones FER-G1-1.0 B Cracked
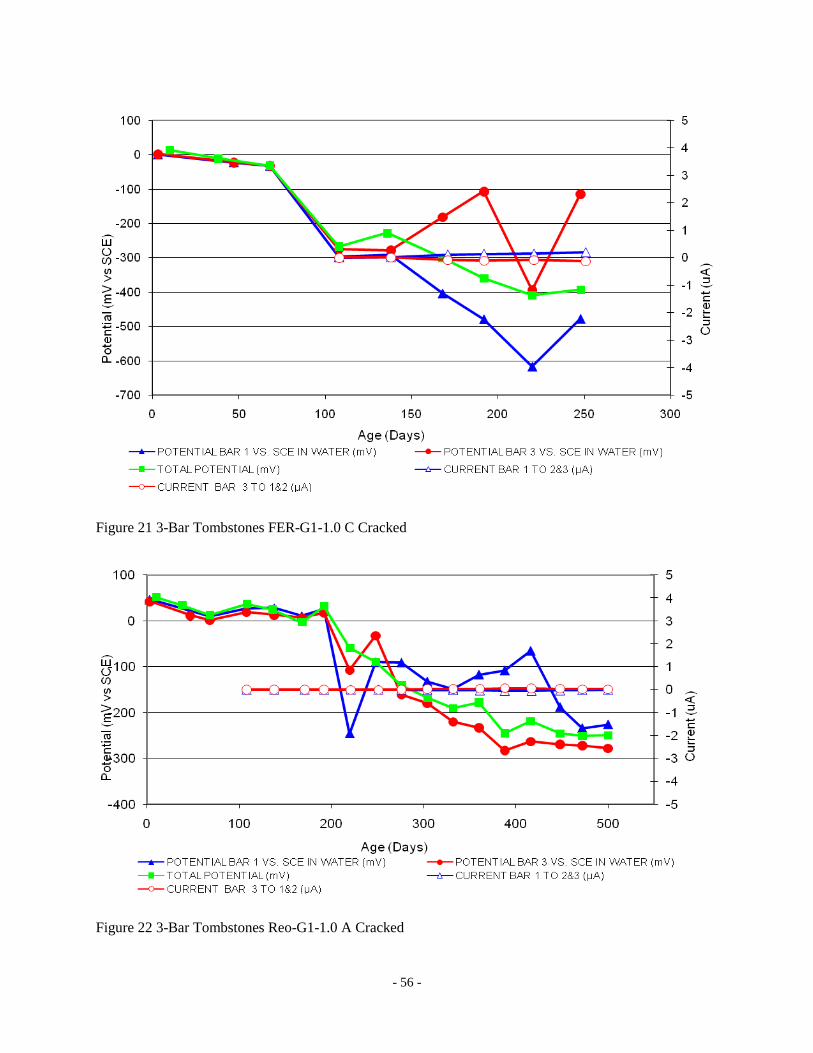
- 56 -
Figure 21 3-Bar Tombstones FER-G1-1.0 C Cracked
Figure 22 3-Bar Tombstones Reo-G1-1.0 A Cracked
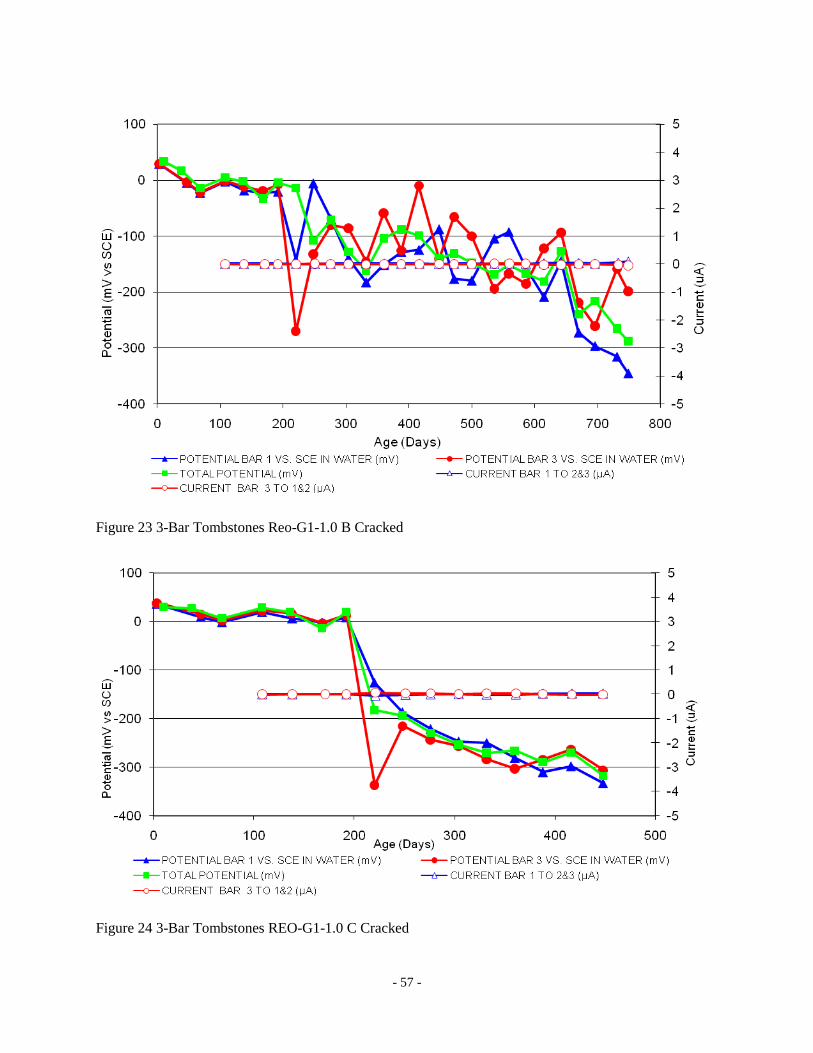
- 57 -
Figure 23 3-Bar Tombstones Reo-G1-1.0 B Cracked
Figure 24 3-Bar Tombstones REO-G1-1.0 C Cracked

- 58 -
Figure 25 3-Bar Tombstones CTRL-P1-1.0 A Cracked
Figure 26 3-Bar Tombstones CTRL-P1-1.0 B Cracked
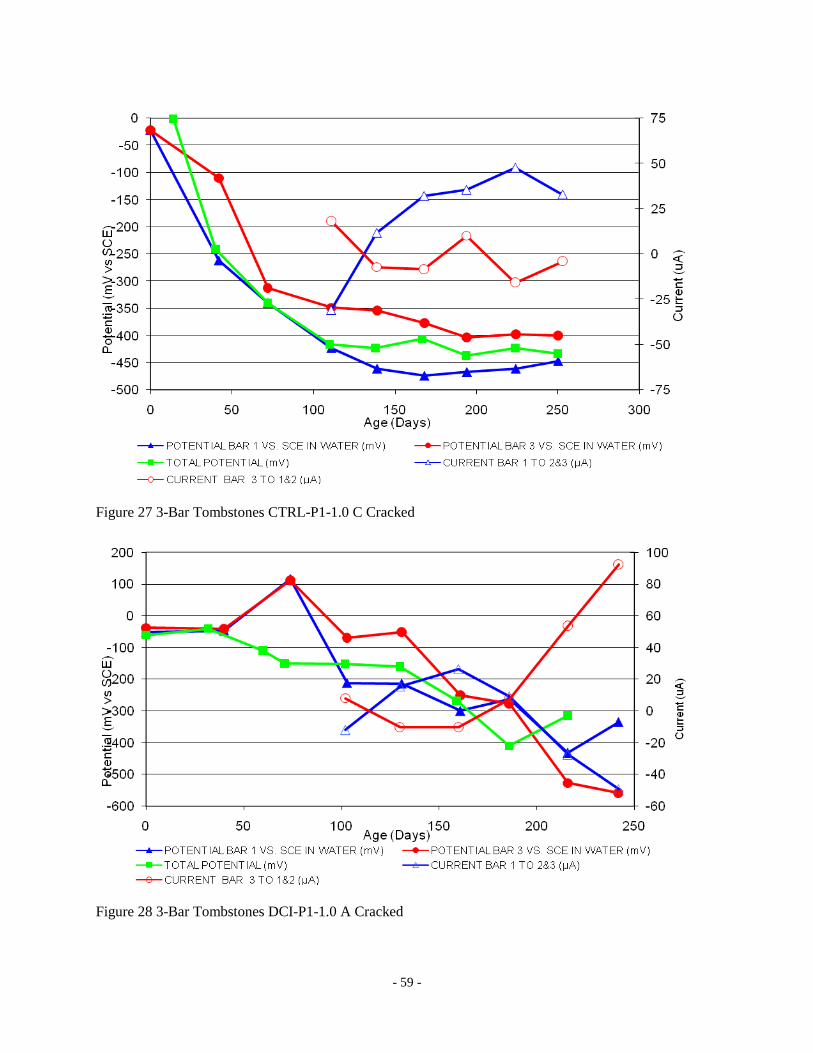
- 59 -
Figure 27 3-Bar Tombstones CTRL-P1-1.0 C Cracked
Figure 28 3-Bar Tombstones DCI-P1-1.0 A Cracked

- 60 -
Figure 29 3-Bar Tombstones DCI-P1-1.0 B Cracked
Figure 30 3-Bar Tombstones DCI-P1-1.0 C Cracked

- 61 -
Figure 31 3-Bar Tombstones FER-P1-1.0 A Cracked
Figure 32 3-Bar Tombstones FER-P1-1.0 B Cracked

- 62 -
Figure 33 3-Bar Tombstones FER-P1-1.0 C Cracked
Figure 34 3-Bar Tombstones REO-P1-1.0 A Cracked

- 63 -
Figure 35 3-Bar Tombstones REO-P1-1.0 B Cracked
Figure 36 3-Bar Tombstones REO-P1-1.0 C Cracked

- 64 -
Figure 37 3-Bar Tombstones CTRL-P2-1.0 B Cracked
Figure 38 3-Bar Tombstones CTRL-P2-1.0 C Cracked

- 65 -
Figure 39 3-Bar Tombstones DCI-P2-1.0 A Cracked
Figure 40 3-Bar Tombstones DCI-P2-1.0 B Cracked

- 66 -
Figure 41 3-Bar Tombstones DCI-P2-1.0 C Cracked
Figure 42 3-Bar Tombstones FER-P2-1.0 A Cracked

- 67 -
Figure 43 3-Bar Tombstones FER-P2-1.0 B Cracked
Figure 44 3-Bar Tombstones FER-P2-1.0 C Cracked
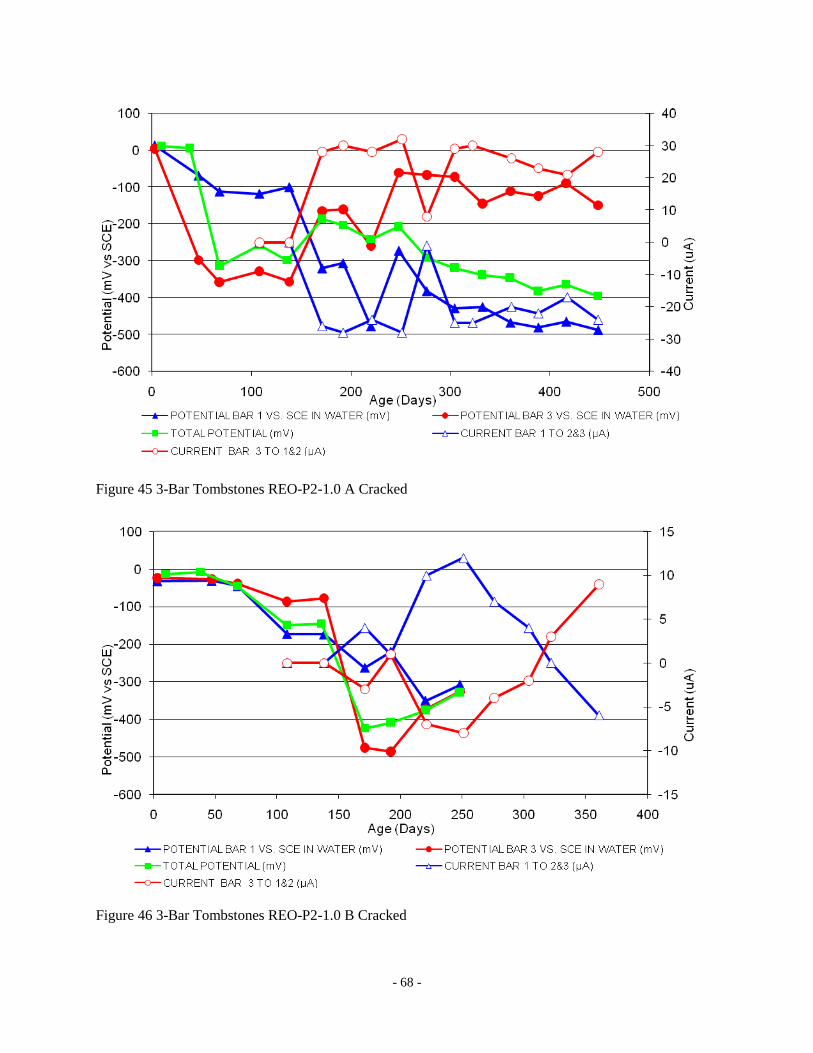
- 68 -
Figure 45 3-Bar Tombstones REO-P2-1.0 A Cracked
Figure 46 3-Bar Tombstones REO-P2-1.0 B Cracked
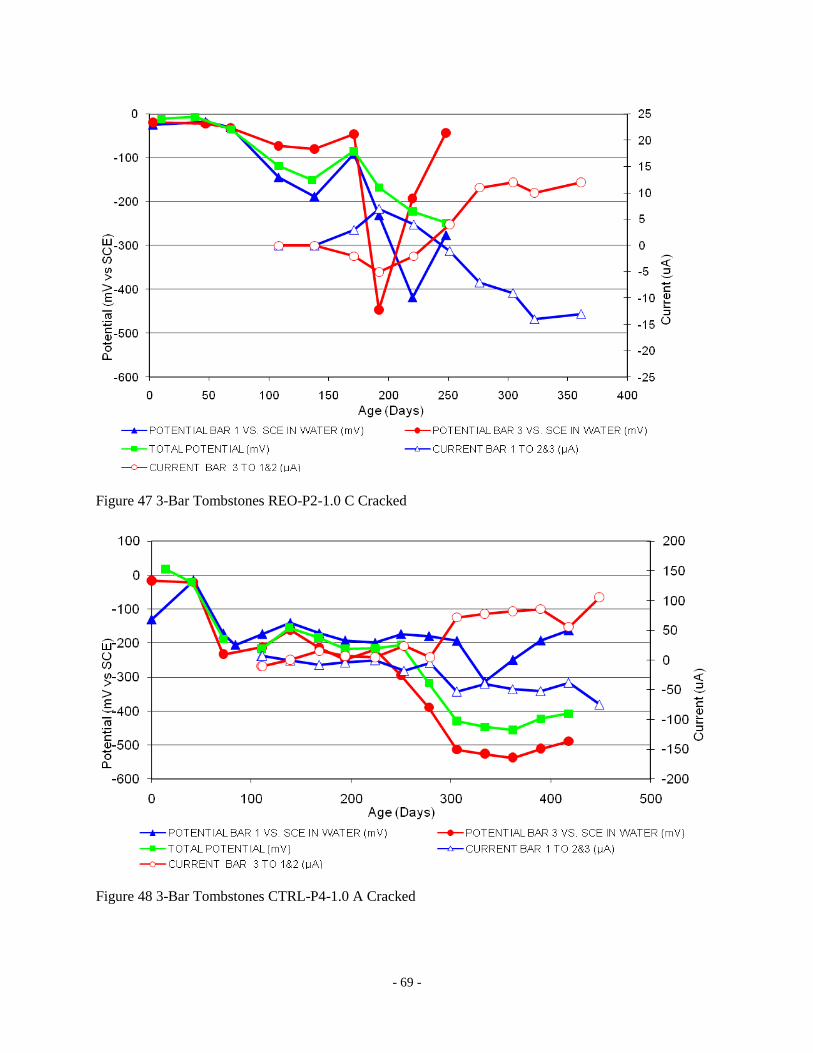
- 69 -
Figure 47 3-Bar Tombstones REO-P2-1.0 C Cracked
Figure 48 3-Bar Tombstones CTRL-P4-1.0 A Cracked
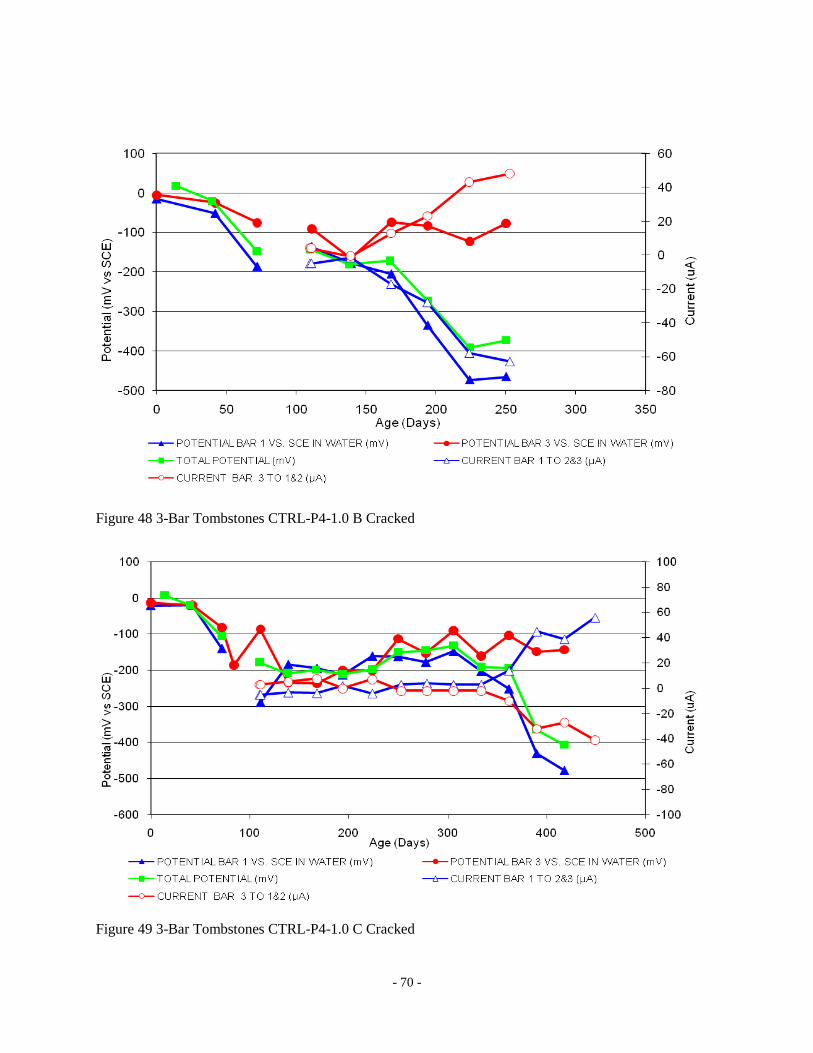
- 70 -
Figure 48 3-Bar Tombstones CTRL-P4-1.0 B Cracked
Figure 49 3-Bar Tombstones CTRL-P4-1.0 C Cracked

- 71 -
Figure 50 3-Bar Tombstones DCI-P4-1.0 A Cracked
Figure 51 3-Bar Tombstones DCI-P4-1.0 B Cracked
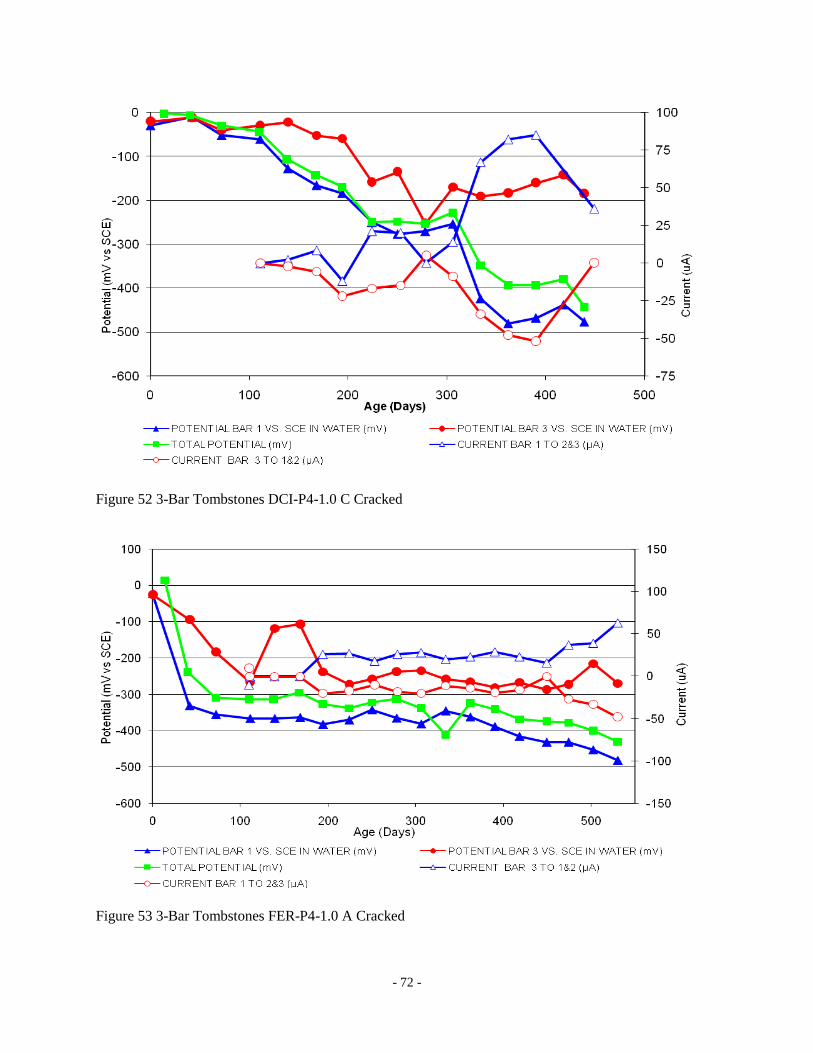
- 72 -
Figure 52 3-Bar Tombstones DCI-P4-1.0 C Cracked
Figure 53 3-Bar Tombstones FER-P4-1.0 A Cracked

- 73 -
Figure 54 3-Bar Tombstones FER-P4-1.0 B Cracked
Figure 55 3-Bar Tombstones FER-P4-1.0 C Cracked
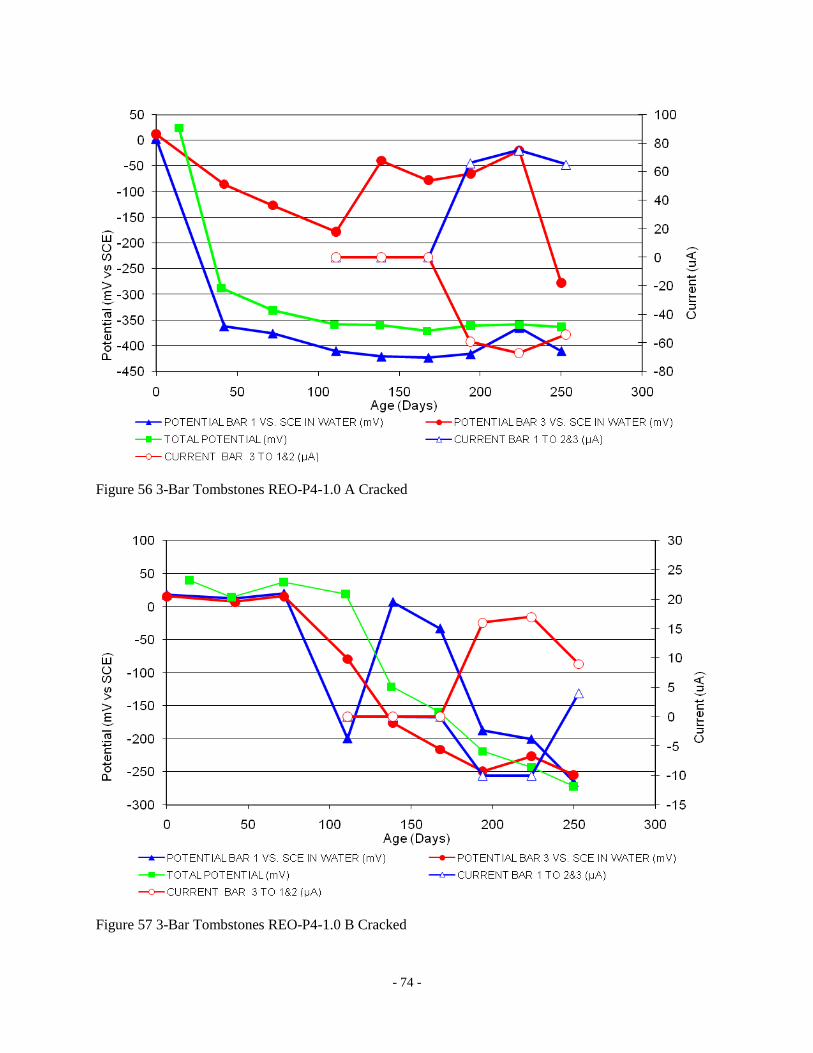
- 74 -
Figure 56 3-Bar Tombstones REO-P4-1.0 A Cracked
Figure 57 3-Bar Tombstones REO-P4-1.0 B Cracked
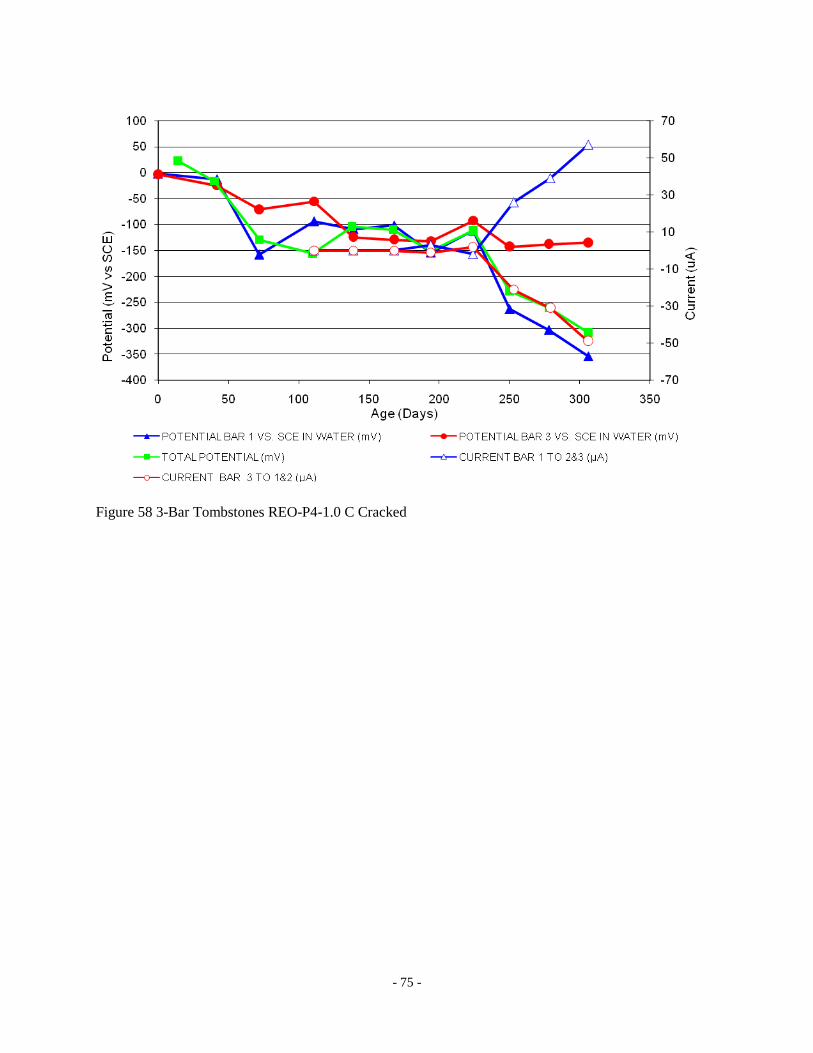
- 75 -
Figure 58 3-Bar Tombstones REO-P4-1.0 C Cracked

- 76 -
Appendix 1-B
Three-bar Tombstone Specimen Electrochemical Graphs
Potentials Uncracked
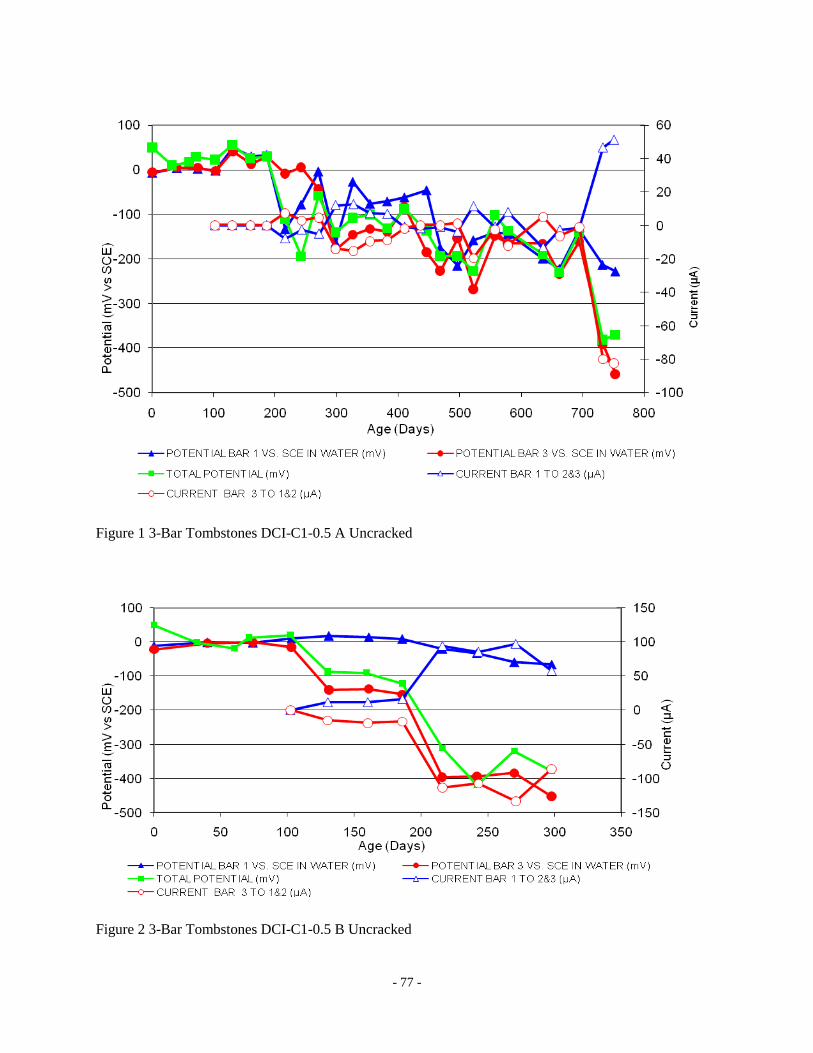
- 77 -
Figure 1 3-Bar Tombstones DCI-C1-0.5 A Uncracked
Figure 2 3-Bar Tombstones DCI-C1-0.5 B Uncracked
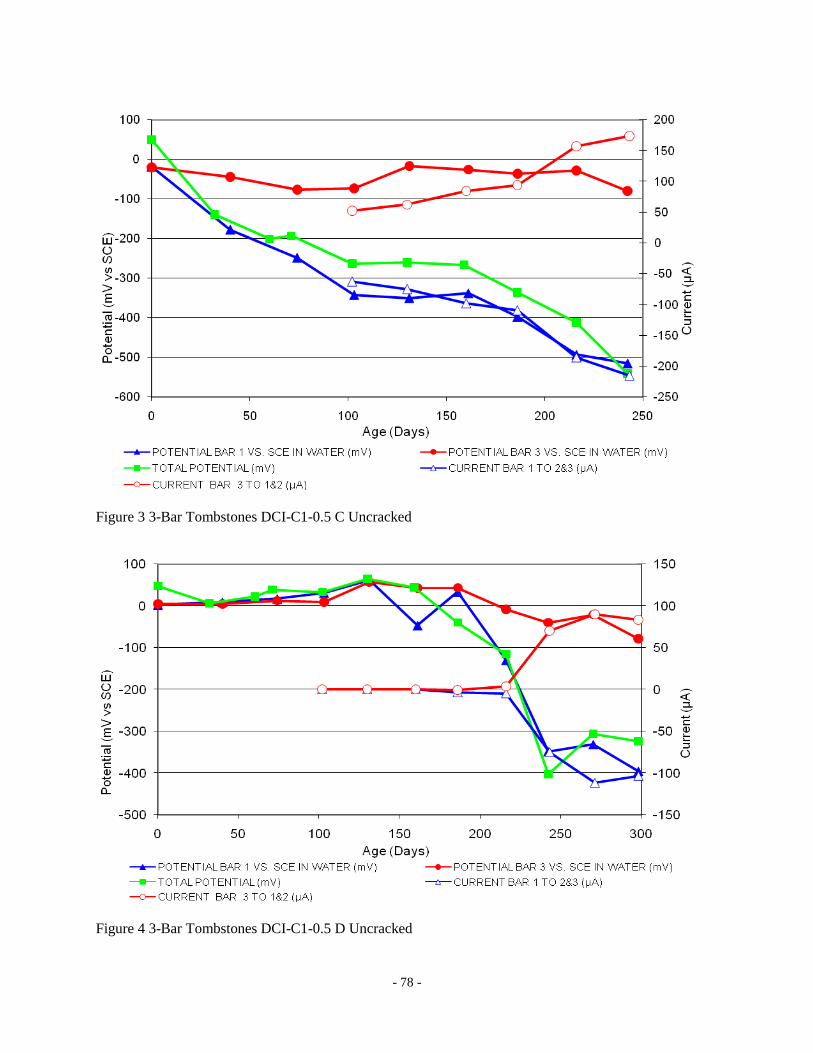
- 78 -
Figure 3 3-Bar Tombstones DCI-C1-0.5 C Uncracked
Figure 4 3-Bar Tombstones DCI-C1-0.5 D Uncracked
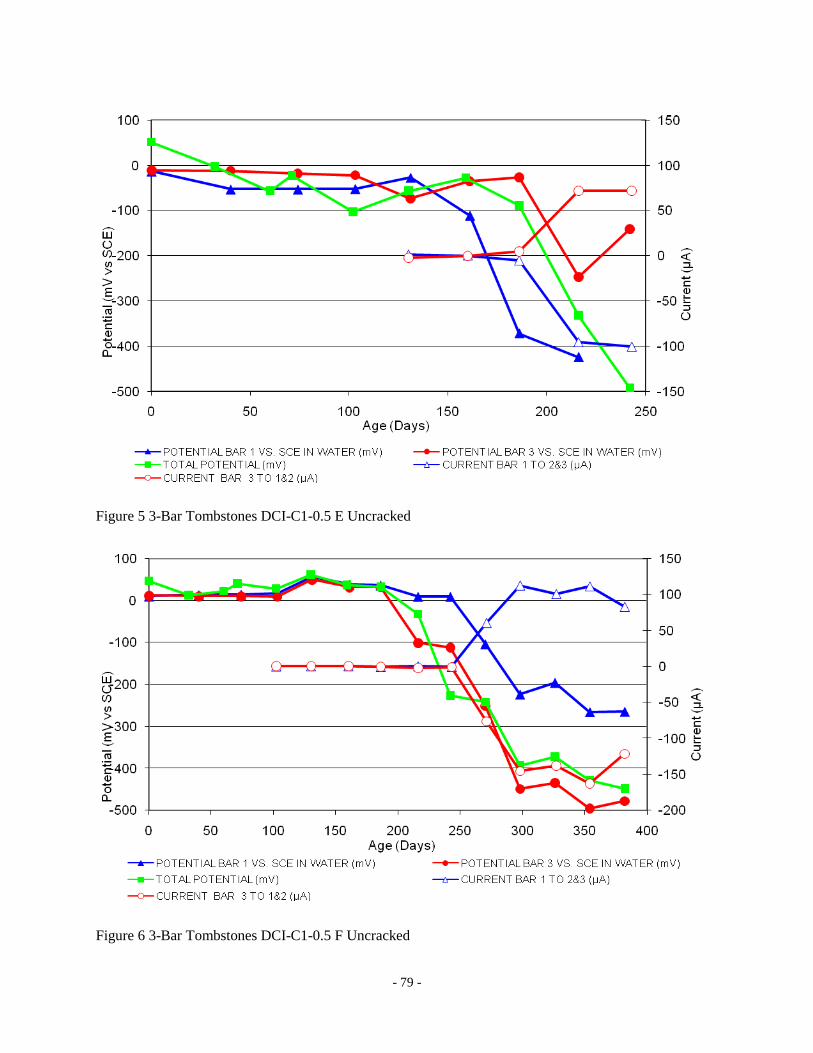
- 79 -
Figure 5 3-Bar Tombstones DCI-C1-0.5 E Uncracked
Figure 6 3-Bar Tombstones DCI-C1-0.5 F Uncracked

- 80 -
Figure 7 3-Bar Tombstones FER-C1-0.5 A Uncracked
Figure 8 3-Bar Tombstones FER-C1-0.5 B Uncracked
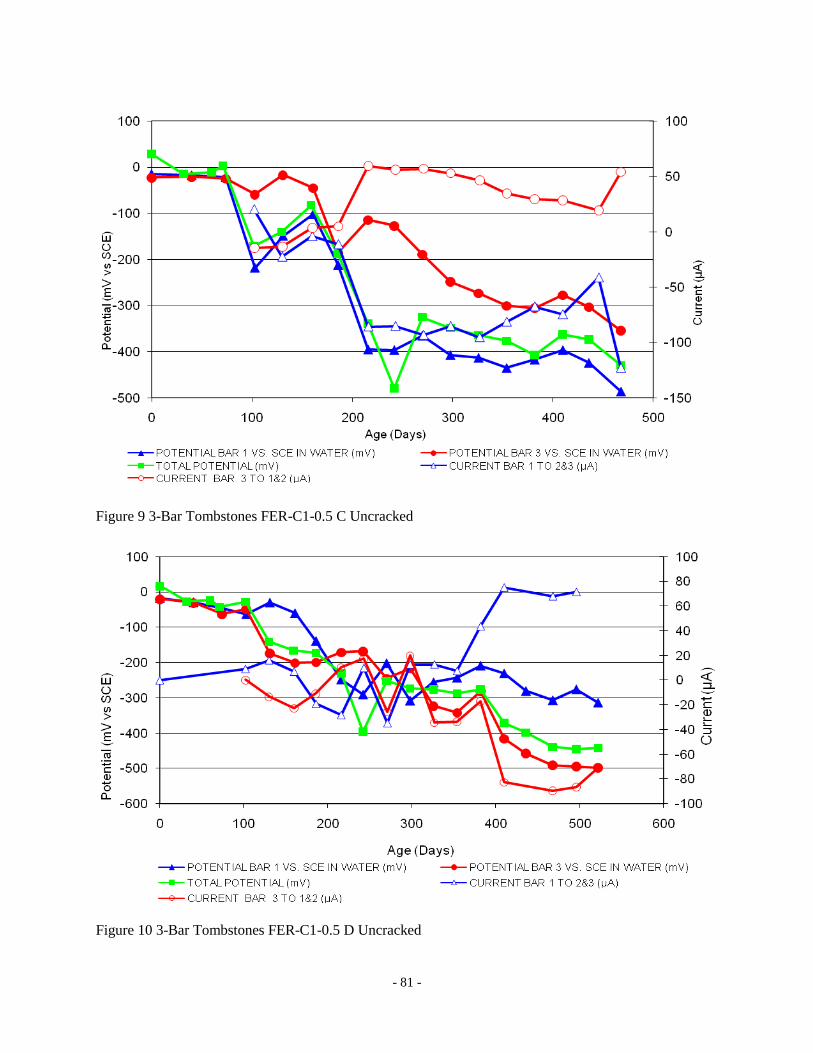
- 81 -
Figure 9 3-Bar Tombstones FER-C1-0.5 C Uncracked
Figure 10 3-Bar Tombstones FER-C1-0.5 D Uncracked

- 82 -
Figure 11 3-Bar Tombstones FER-C1-0.5 E Unracked
Figure 12 3-Bar Tombstones FER-C1-0.5 E Uncracked
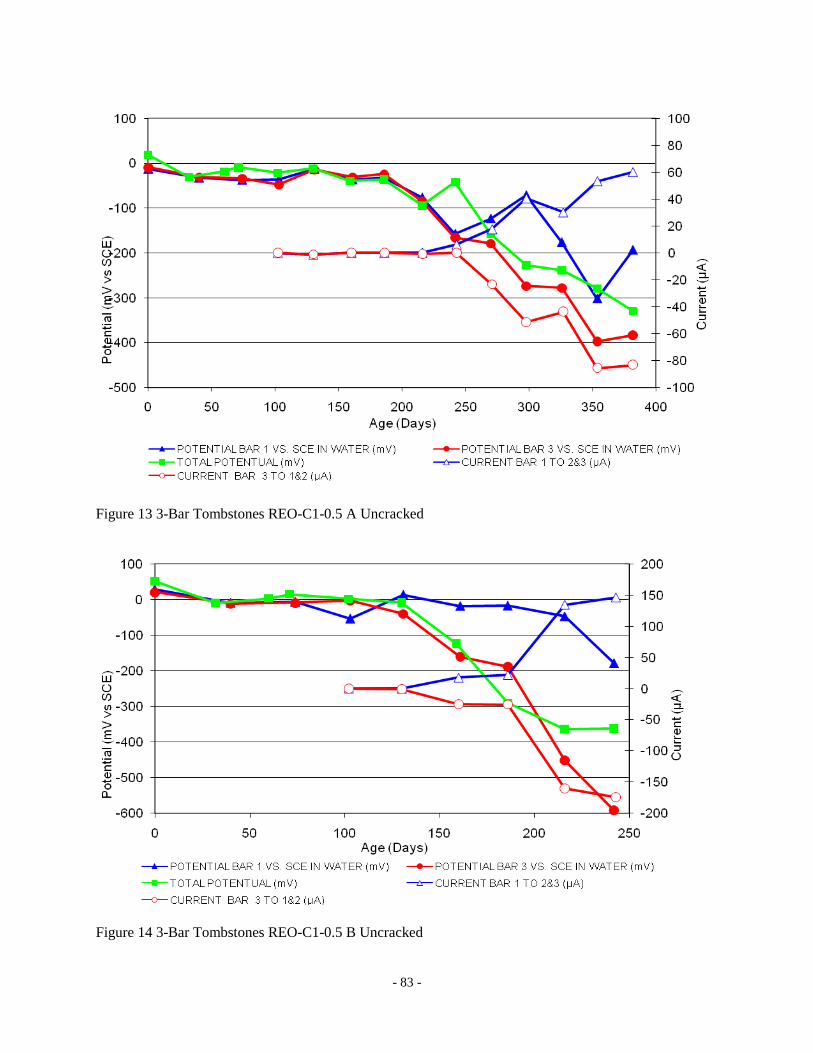
- 83 -
Figure 13 3-Bar Tombstones REO-C1-0.5 A Uncracked
Figure 14 3-Bar Tombstones REO-C1-0.5 B Uncracked
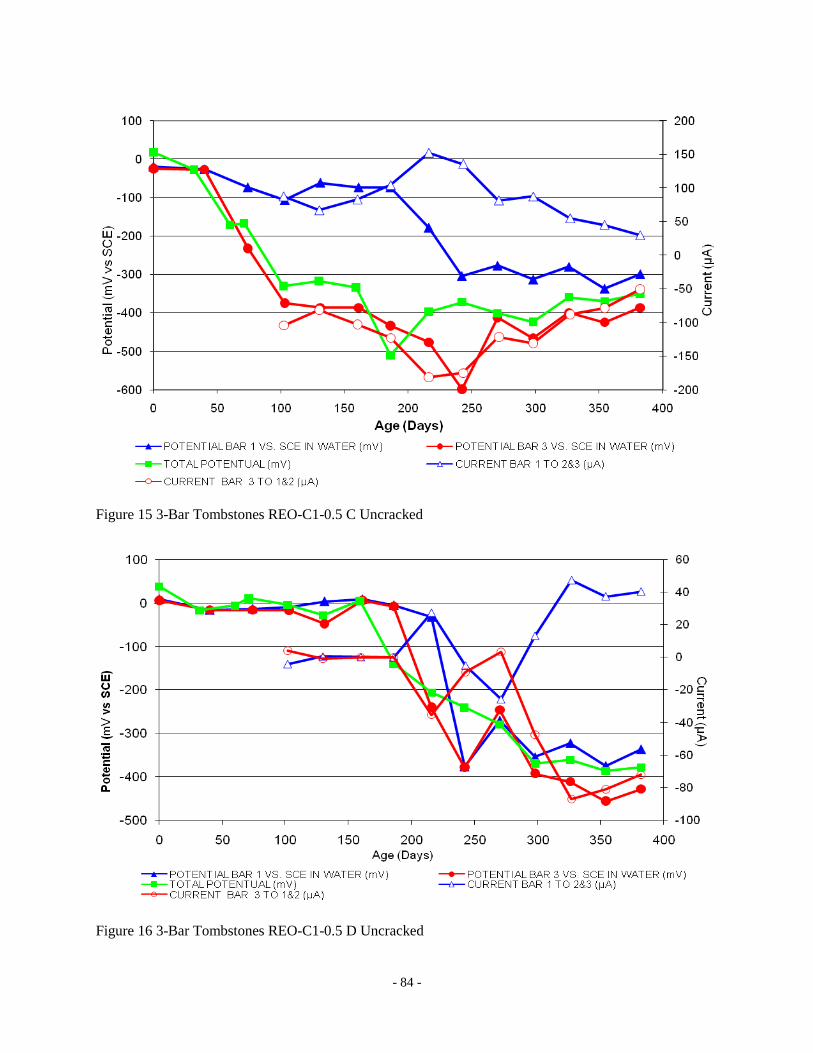
- 84 -
Figure 15 3-Bar Tombstones REO-C1-0.5 C Uncracked
Figure 16 3-Bar Tombstones REO-C1-0.5 D Uncracked

- 85 -
Figure 17 3-Bar Tombstones REO-C1-0.5 E Uncracked
Figure 18 3-Bar Tombstones REO-C1-0.5 F Uncracked

- 86 -
Figure 19 3-Bar Tombstones CTRL-C1-1.0 A Uncracked
Figure 20 3-Bar Tombstones CTRL-C1-1.0 B Uncracked

- 87 -
Figure 21 3-Bar Tombstones CTRL-C1-1.0 C Uncracked
Figure 22 3-Bar Tombstones CTRL-C1-1.0 D Uncracked
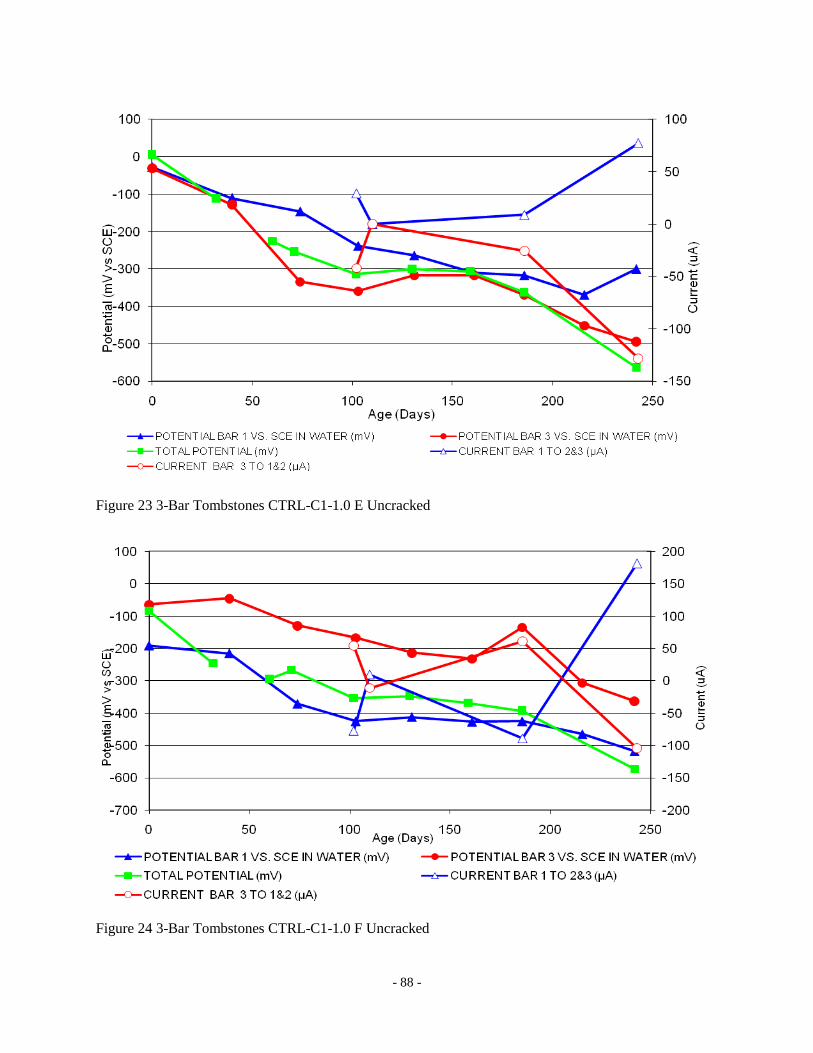
- 88 -
Figure 23 3-Bar Tombstones CTRL-C1-1.0 E Uncracked
Figure 24 3-Bar Tombstones CTRL-C1-1.0 F Uncracked

- 89 -
Figure 25 3-Bar Tombstones DCI-C1-1.0 A Uncracked
Figure 26 3-Bar Tombstones DCI-C1-1.0 B Uncracked
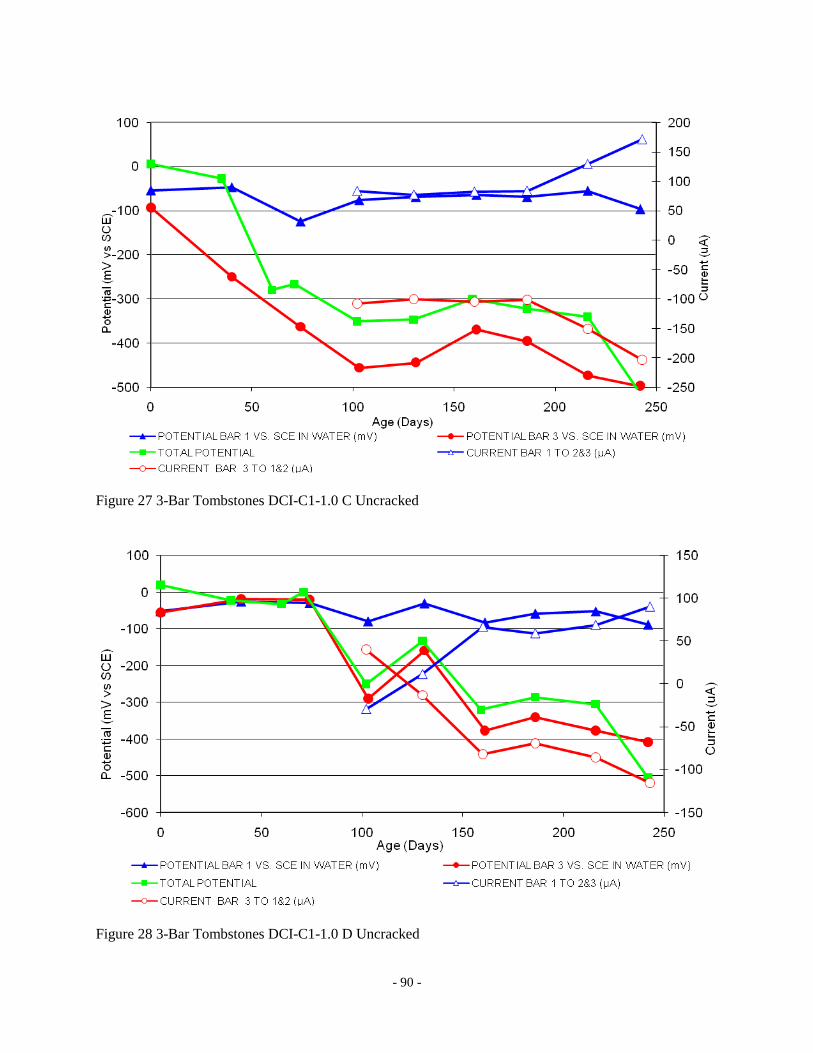
- 90 -
Figure 27 3-Bar Tombstones DCI-C1-1.0 C Uncracked
Figure 28 3-Bar Tombstones DCI-C1-1.0 D Uncracked
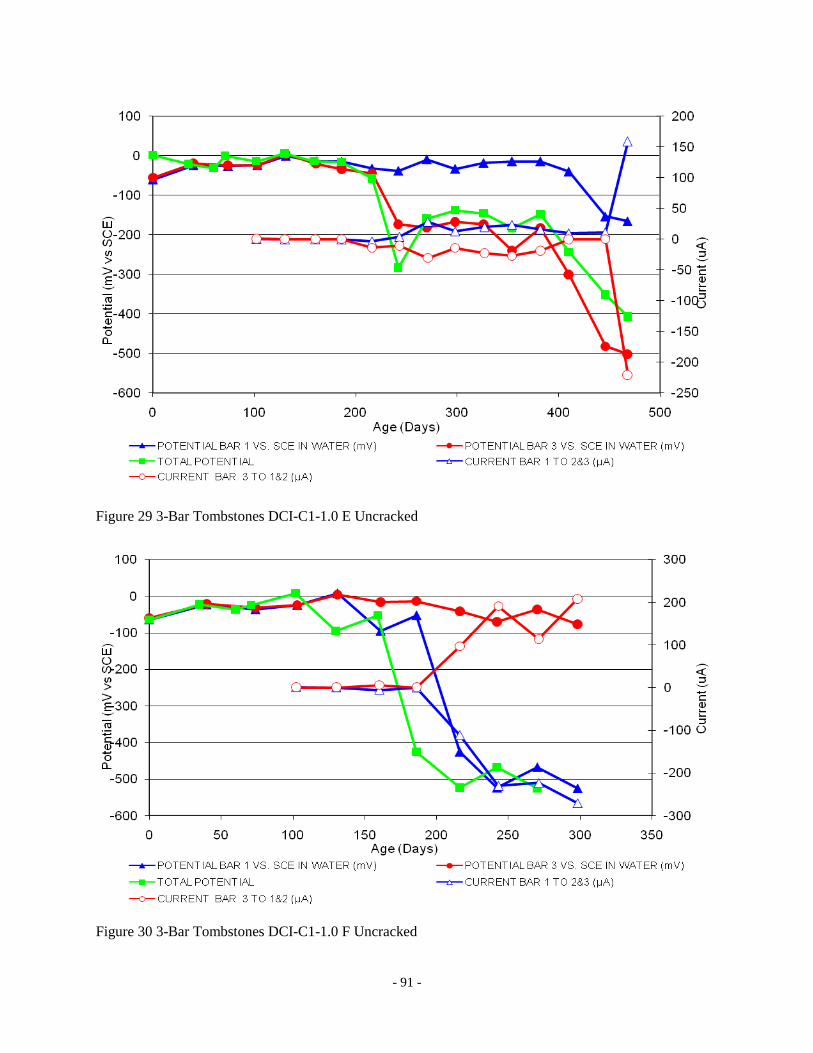
- 91 -
Figure 29 3-Bar Tombstones DCI-C1-1.0 E Uncracked
Figure 30 3-Bar Tombstones DCI-C1-1.0 F Uncracked

- 92 -
Figure 31 3-Bar Tombstones FER-C1-1.0 A Uncracked
Figure 32 3-Bar Tombstones FER-C1-1.0 B Uncracked
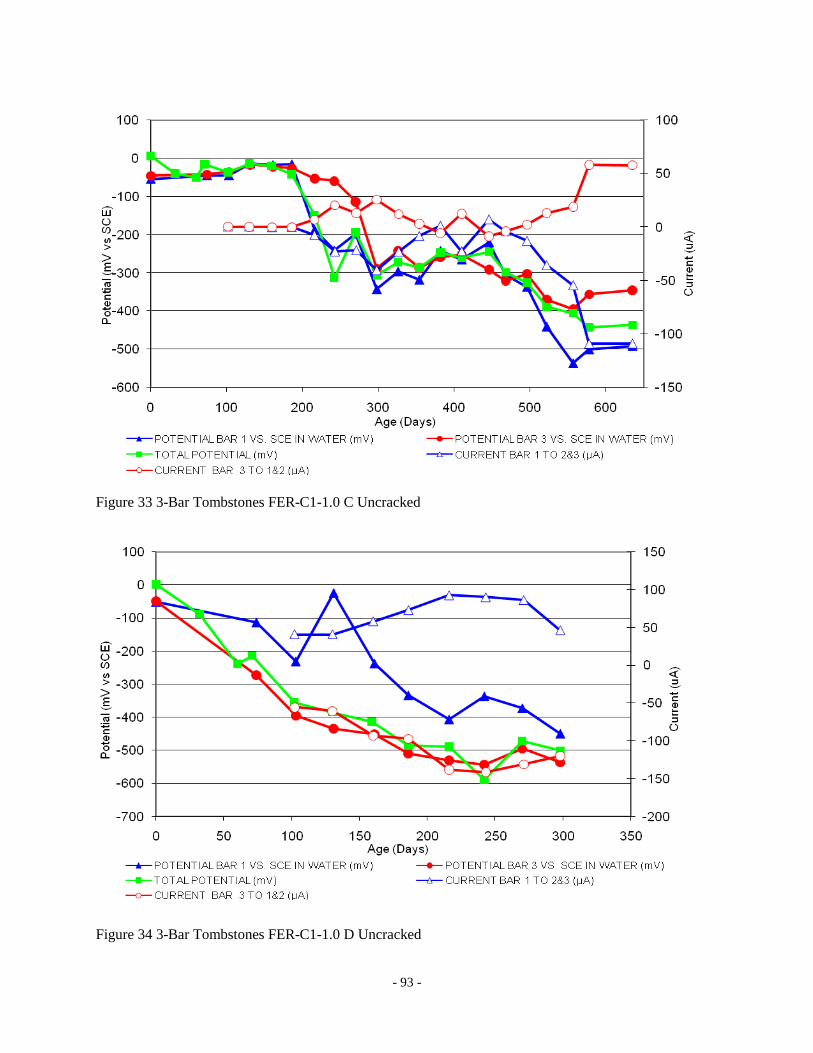
- 93 -
Figure 33 3-Bar Tombstones FER-C1-1.0 C Uncracked
Figure 34 3-Bar Tombstones FER-C1-1.0 D Uncracked
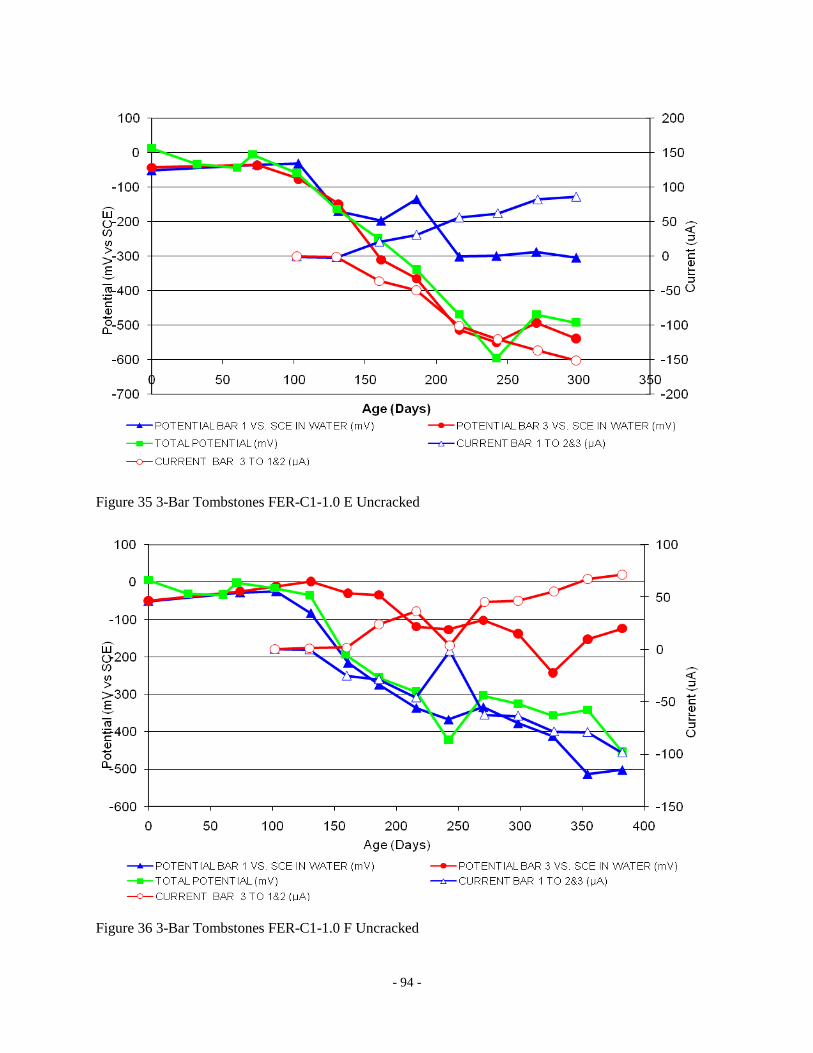
- 94 -
Figure 35 3-Bar Tombstones FER-C1-1.0 E Uncracked
Figure 36 3-Bar Tombstones FER-C1-1.0 F Uncracked
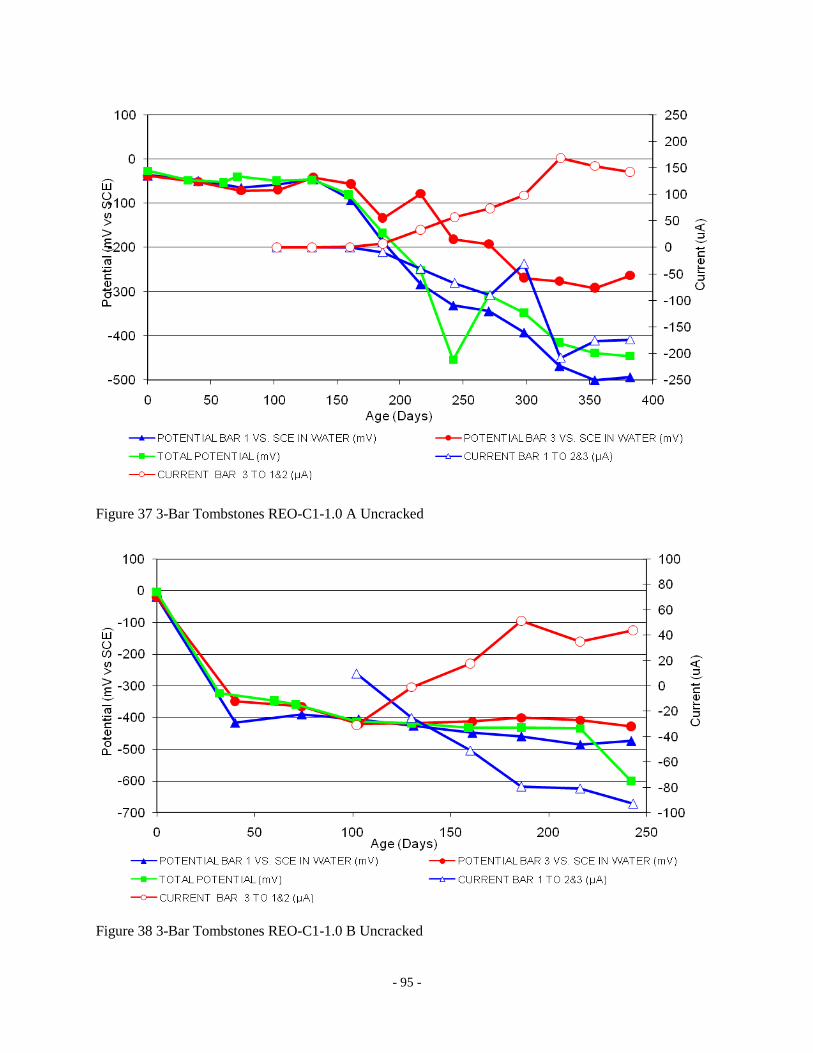
- 95 -
Figure 37 3-Bar Tombstones REO-C1-1.0 A Uncracked
Figure 38 3-Bar Tombstones REO-C1-1.0 B Uncracked
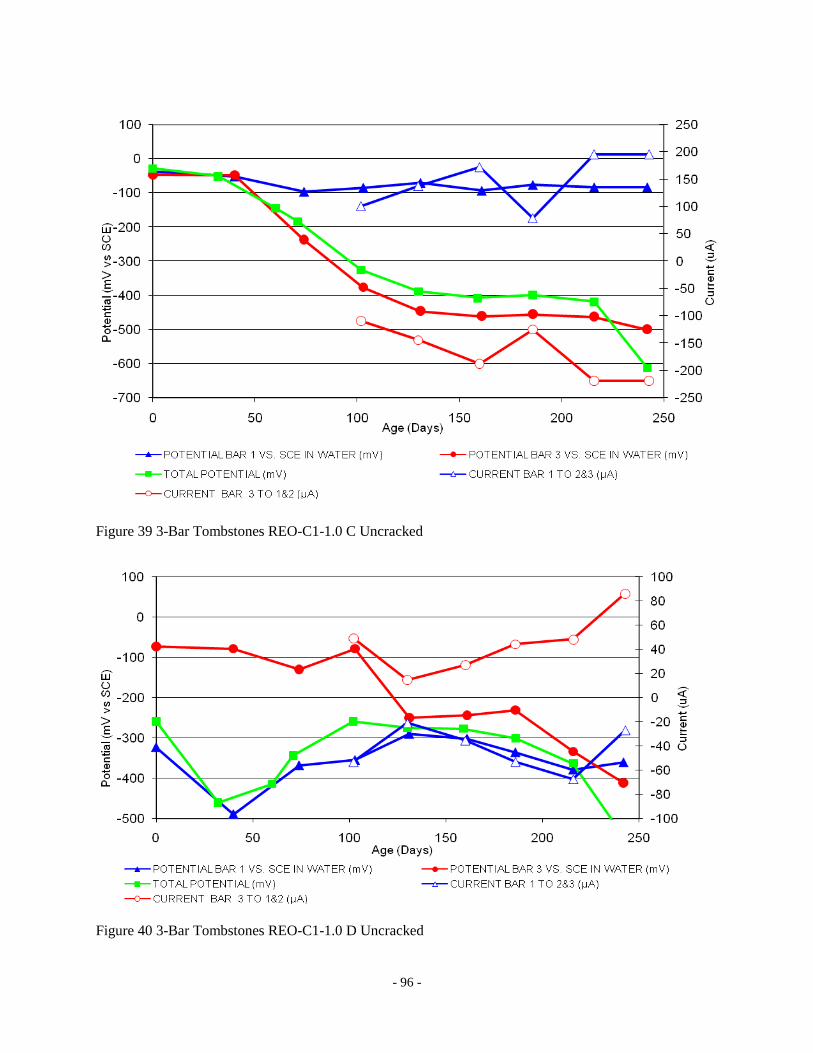
- 96 -
Figure 39 3-Bar Tombstones REO-C1-1.0 C Uncracked
Figure 40 3-Bar Tombstones REO-C1-1.0 D Uncracked
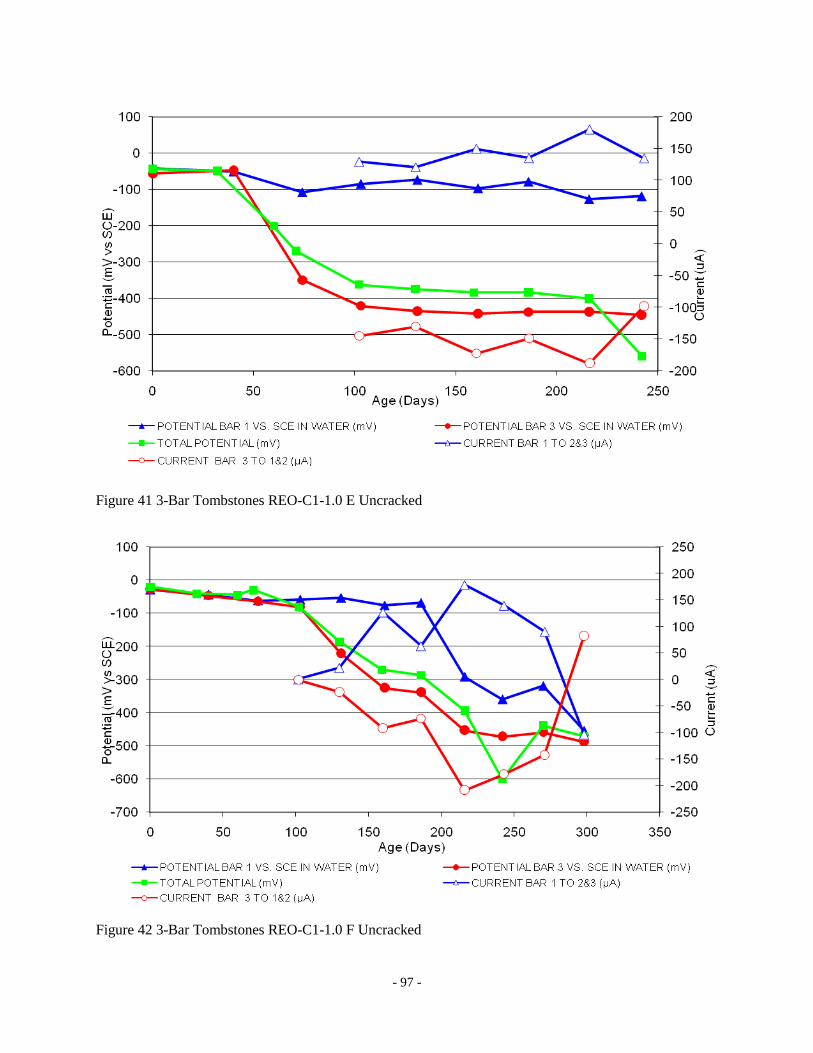
- 97 -
Figure 41 3-Bar Tombstones REO-C1-1.0 E Uncracked
Figure 42 3-Bar Tombstones REO-C1-1.0 F Uncracked
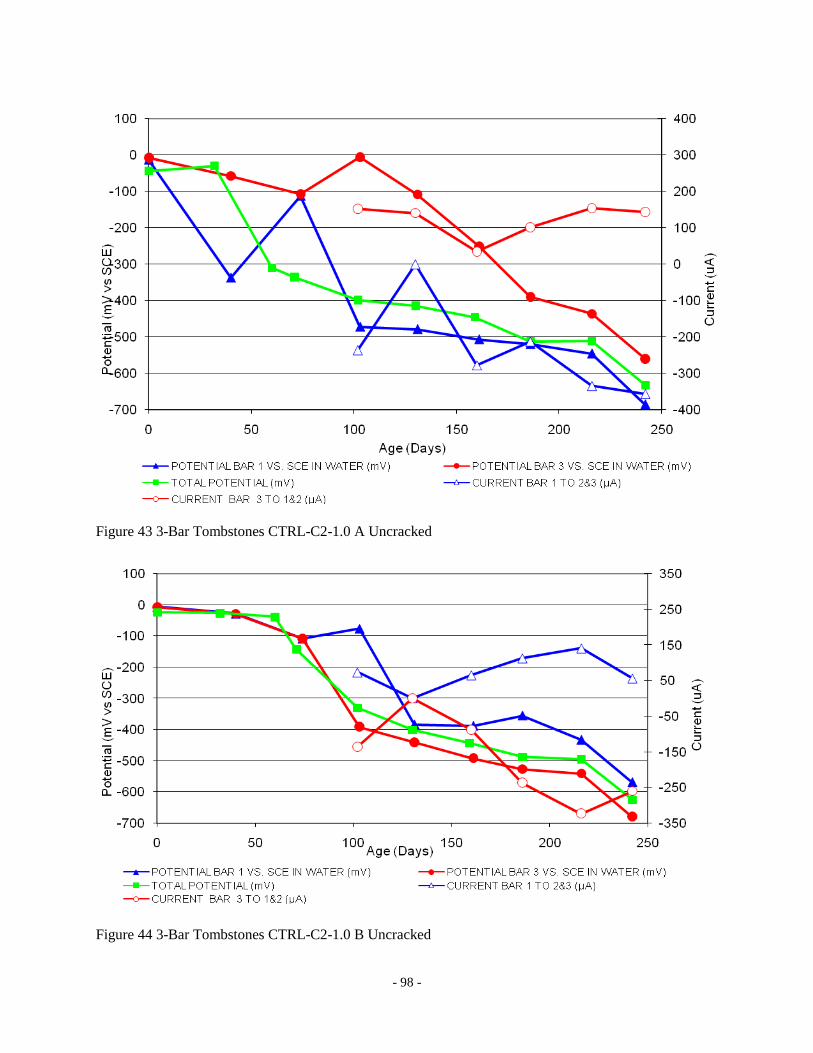
- 98 -
Figure 43 3-Bar Tombstones CTRL-C2-1.0 A Uncracked
Figure 44 3-Bar Tombstones CTRL-C2-1.0 B Uncracked

- 99 -
Figure 45 3-Bar Tombstones CTRL-C2-1.0 C Uncracked
Figure 46 3-Bar Tombstones CTRL-C2-1.0 D Uncracked
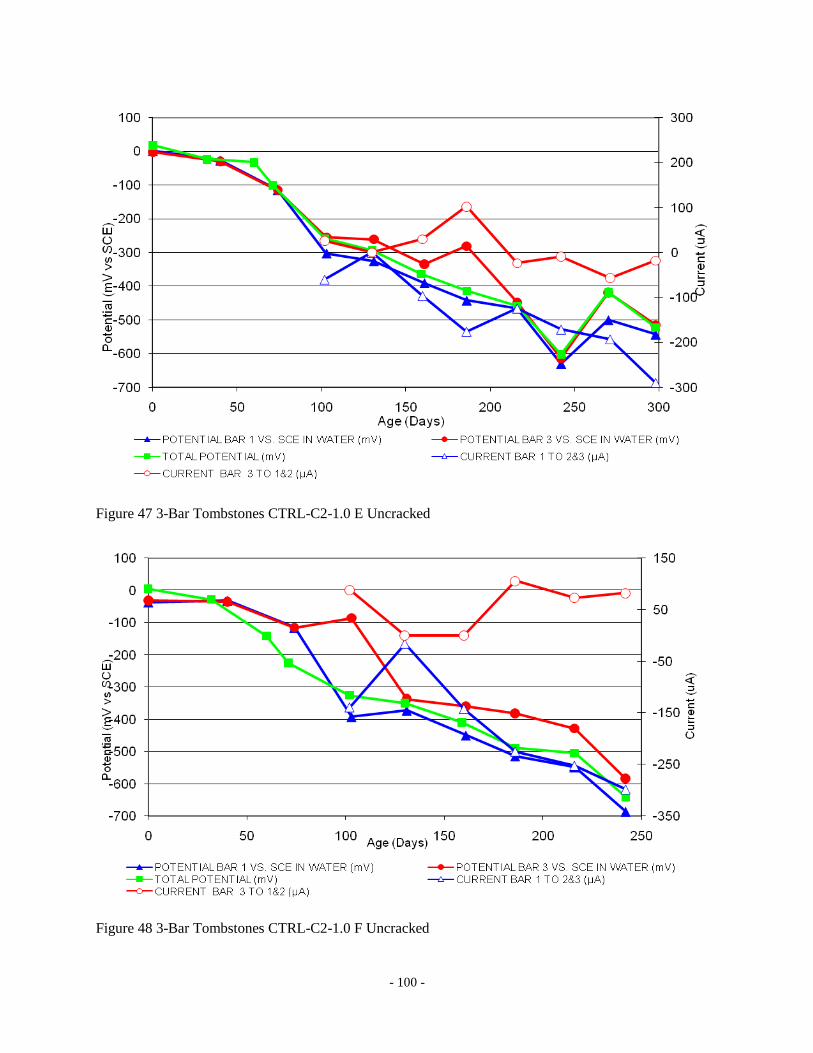
- 100 -
Figure 47 3-Bar Tombstones CTRL-C2-1.0 E Uncracked
Figure 48 3-Bar Tombstones CTRL-C2-1.0 F Uncracked
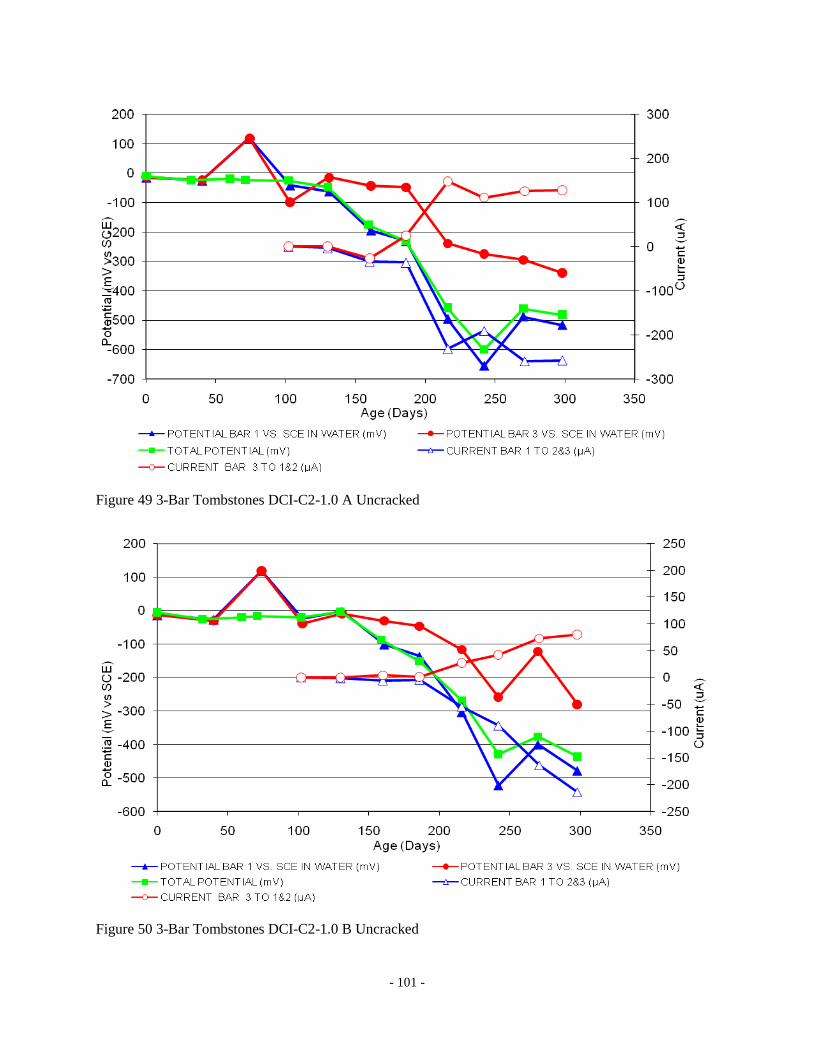
- 101 -
Figure 49 3-Bar Tombstones DCI-C2-1.0 A Uncracked
Figure 50 3-Bar Tombstones DCI-C2-1.0 B Uncracked
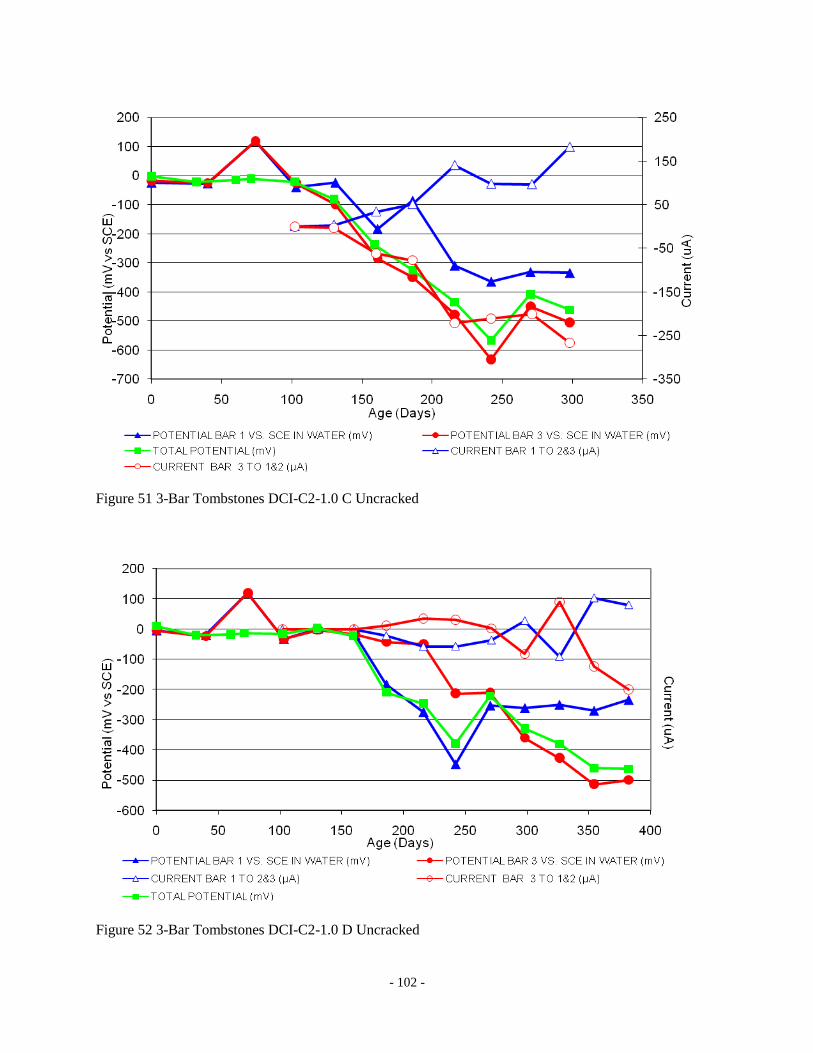
- 102 -
Figure 51 3-Bar Tombstones DCI-C2-1.0 C Uncracked
Figure 52 3-Bar Tombstones DCI-C2-1.0 D Uncracked
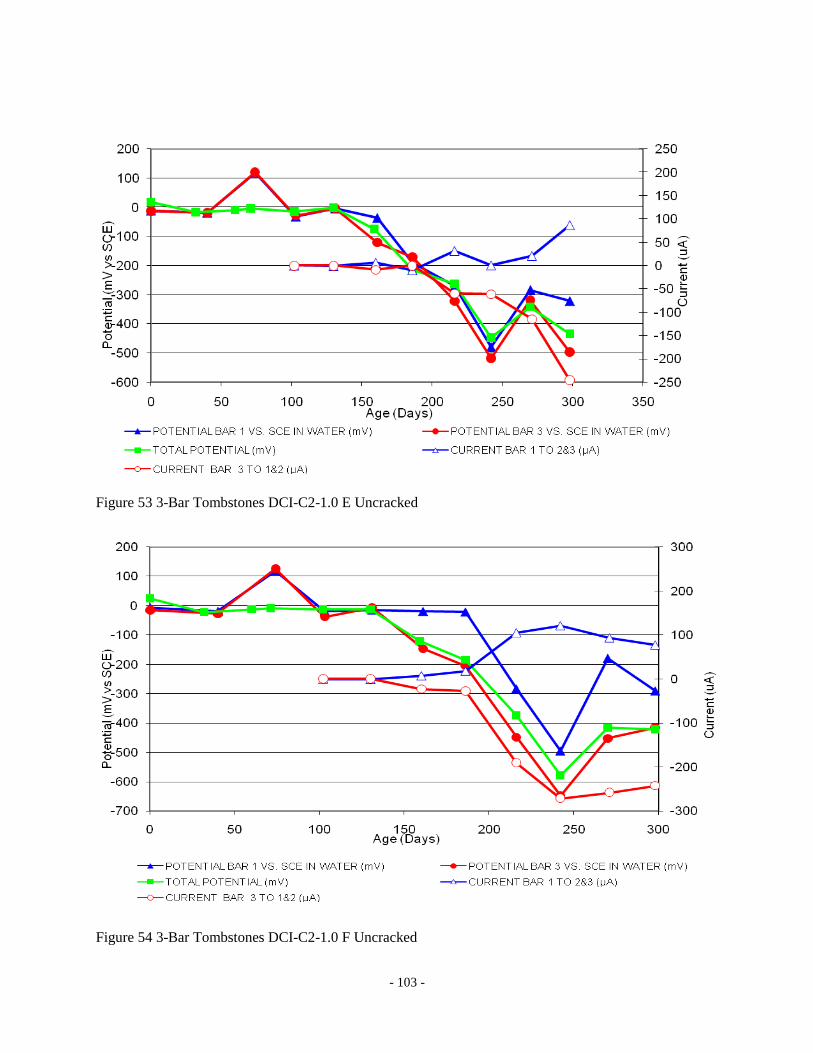
- 103 -
Figure 53 3-Bar Tombstones DCI-C2-1.0 E Uncracked
Figure 54 3-Bar Tombstones DCI-C2-1.0 F Uncracked
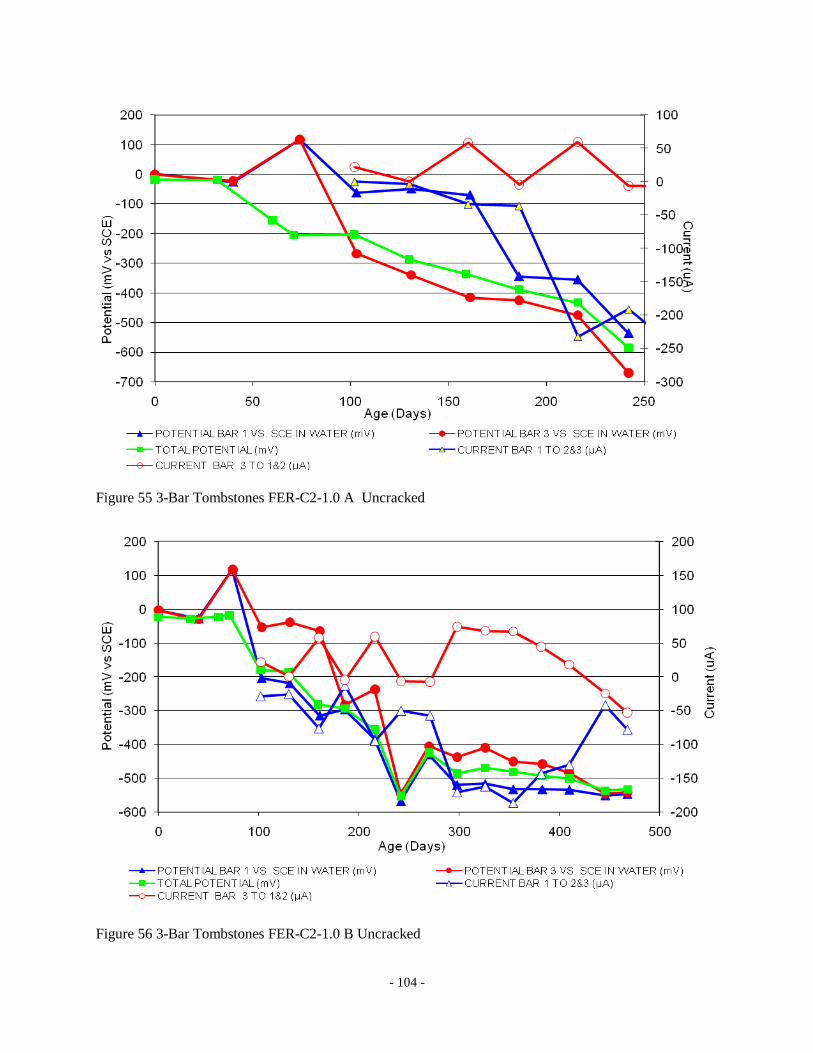
- 104 -
Figure 55 3-Bar Tombstones FER-C2-1.0 A Uncracked
Figure 56 3-Bar Tombstones FER-C2-1.0 B Uncracked

- 105 -
Figure 57 3-Bar Tombstones FER-C2-1.0 C Uncracked
Figure 58 3-Bar Tombstones FER-C2-1.0 D Uncracked

- 106 -
Figure 59 3-Bar Tombstones FER-C2-1.0 E Uncracked
Figure 60 3-Bar Tombstones FER-C2-1.0 F Uncracked

- 107 -
Figure 61 3-Bar Tombstones REO-C2-1.0 A Uncracked
Figure 62 3-Bar Tombstones REO-C2-1.0 B Uncracked

- 108 -
Figure 63 3-Bar Tombstones REO-C2-1.0 C Uncracked
Figure 64 3-Bar Tombstones REO-C2-1.0 D Uncracked
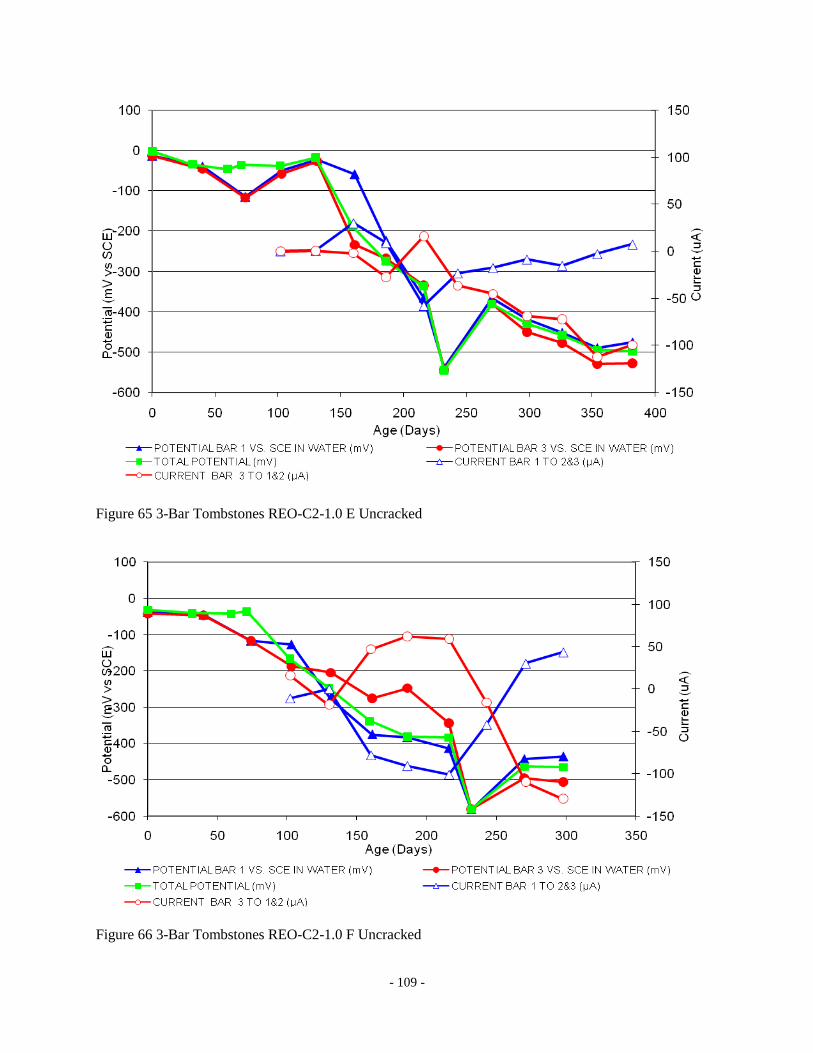
- 109 -
Figure 65 3-Bar Tombstones REO-C2-1.0 E Uncracked
Figure 66 3-Bar Tombstones REO-C2-1.0 F Uncracked
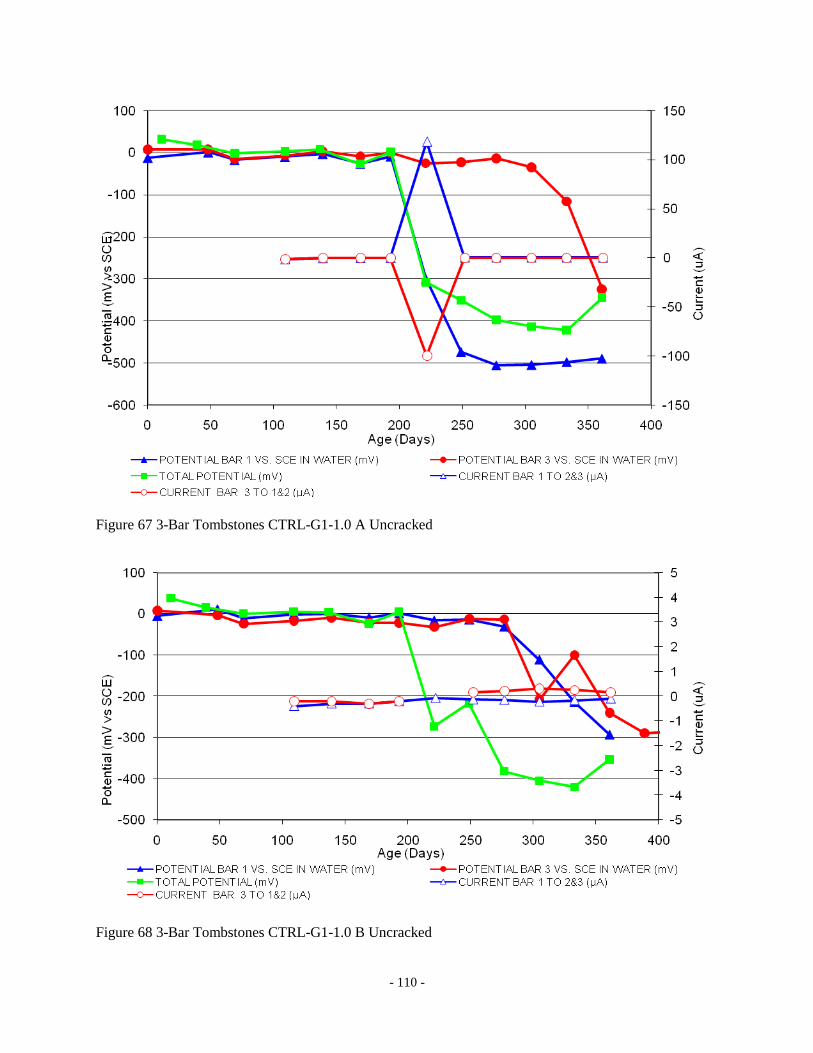
- 110 -
Figure 67 3-Bar Tombstones CTRL-G1-1.0 A Uncracked
Figure 68 3-Bar Tombstones CTRL-G1-1.0 B Uncracked
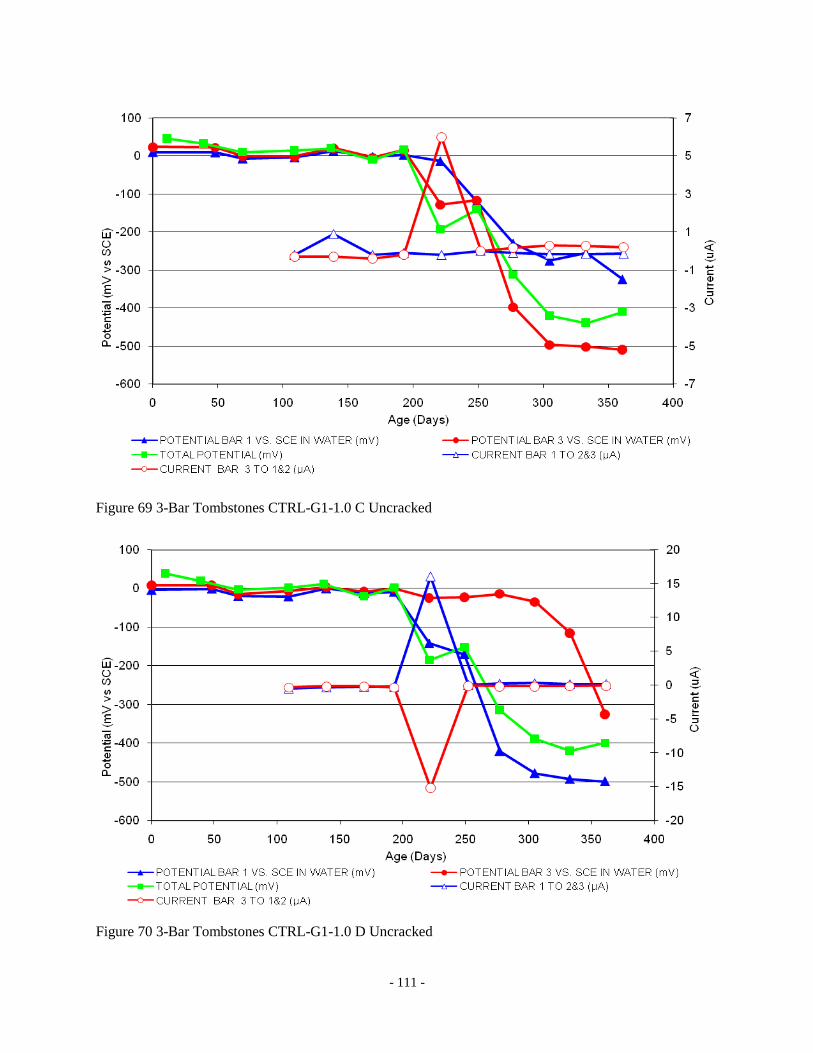
- 111 -
Figure 69 3-Bar Tombstones CTRL-G1-1.0 C Uncracked
Figure 70 3-Bar Tombstones CTRL-G1-1.0 D Uncracked

- 112 -
Figure 71 3-Bar Tombstones CTRL-G1-1.0 E Uncracked
Figure 72 3-Bar Tombstones CTRL-G1-1.0 F Uncracked
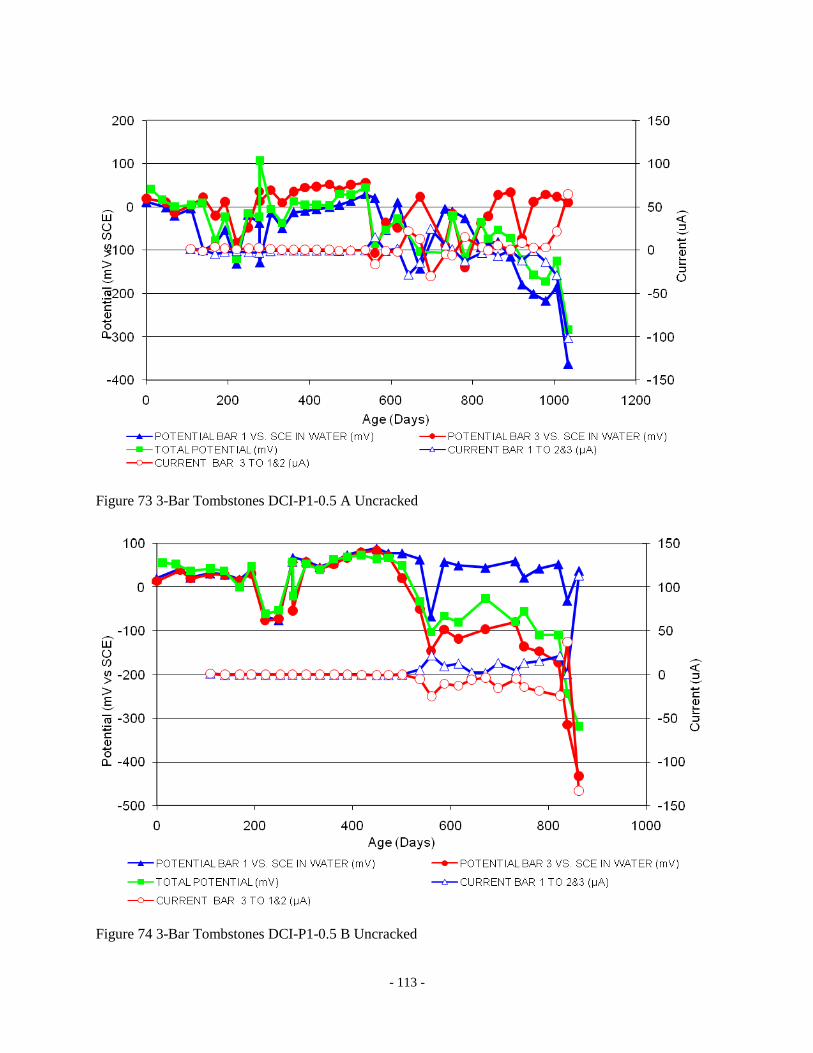
- 113 -
Figure 73 3-Bar Tombstones DCI-P1-0.5 A Uncracked
Figure 74 3-Bar Tombstones DCI-P1-0.5 B Uncracked

- 114 -
Figure 75 3-Bar Tombstones DCI-P1-0.5 C Uncracked
Figure 76 3-Bar Tombstones DCI-P1-0.5 D Uncracked
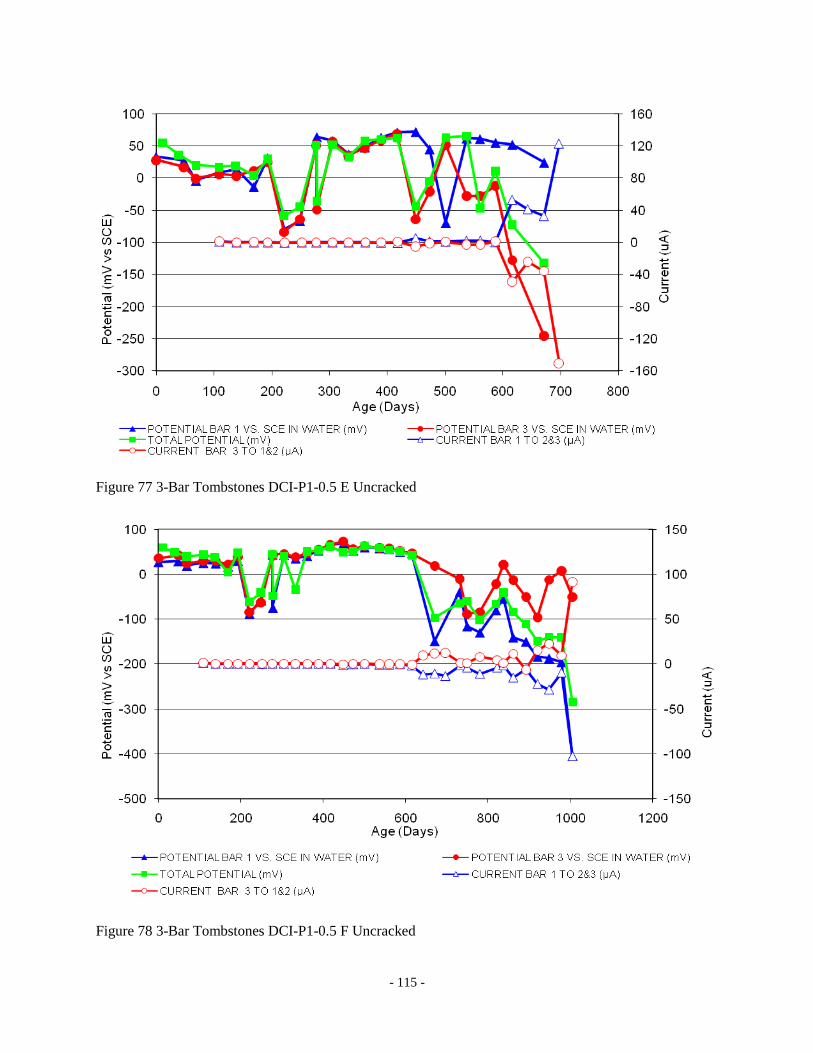
- 115 -
Figure 77 3-Bar Tombstones DCI-P1-0.5 E Uncracked
Figure 78 3-Bar Tombstones DCI-P1-0.5 F Uncracked

- 116 -
Figure 79 3-Bar Tombstones FER-P1-0.5 A Uncracked
Figure 80 3-Bar Tombstones FER-P1-0.5 B Uncracked
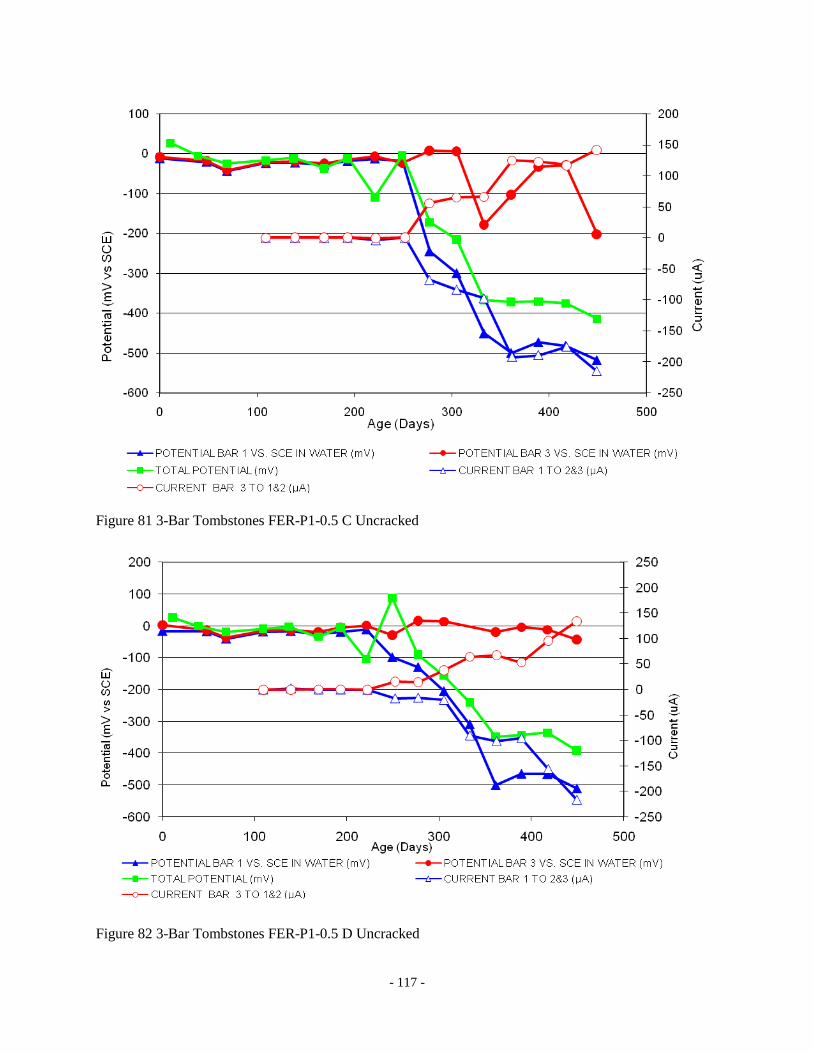
- 117 -
Figure 81 3-Bar Tombstones FER-P1-0.5 C Uncracked
Figure 82 3-Bar Tombstones FER-P1-0.5 D Uncracked
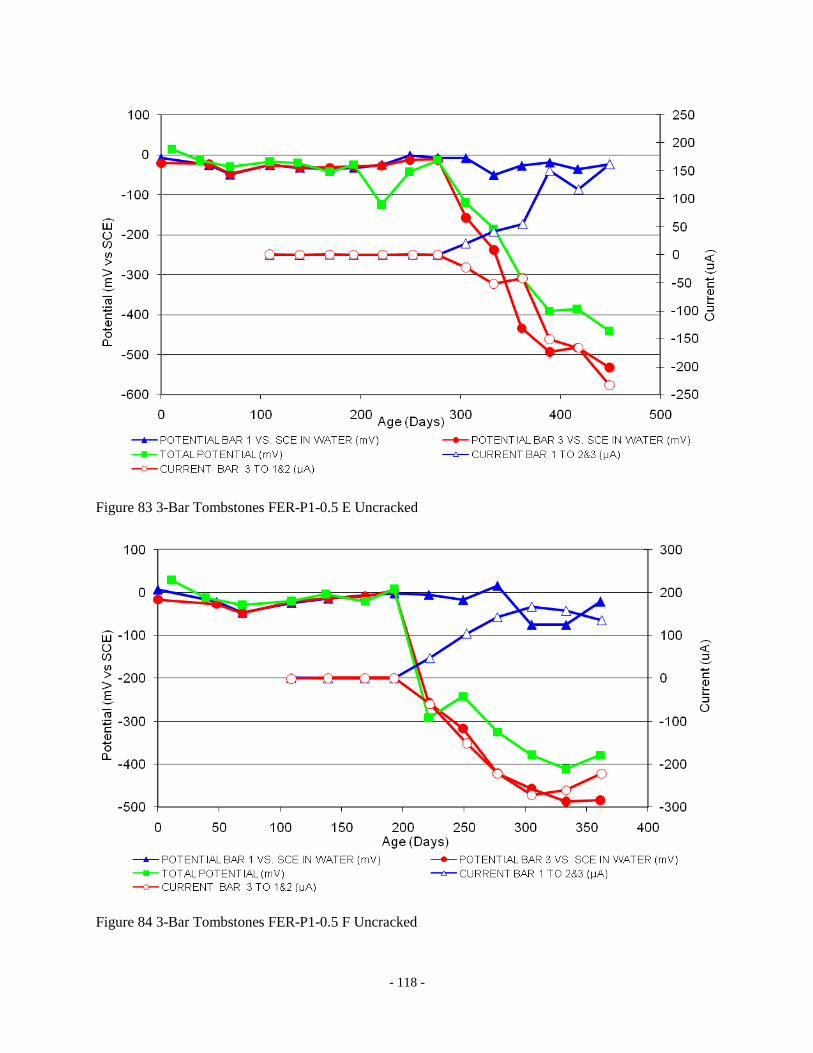
- 118 -
Figure 83 3-Bar Tombstones FER-P1-0.5 E Uncracked
Figure 84 3-Bar Tombstones FER-P1-0.5 F Uncracked
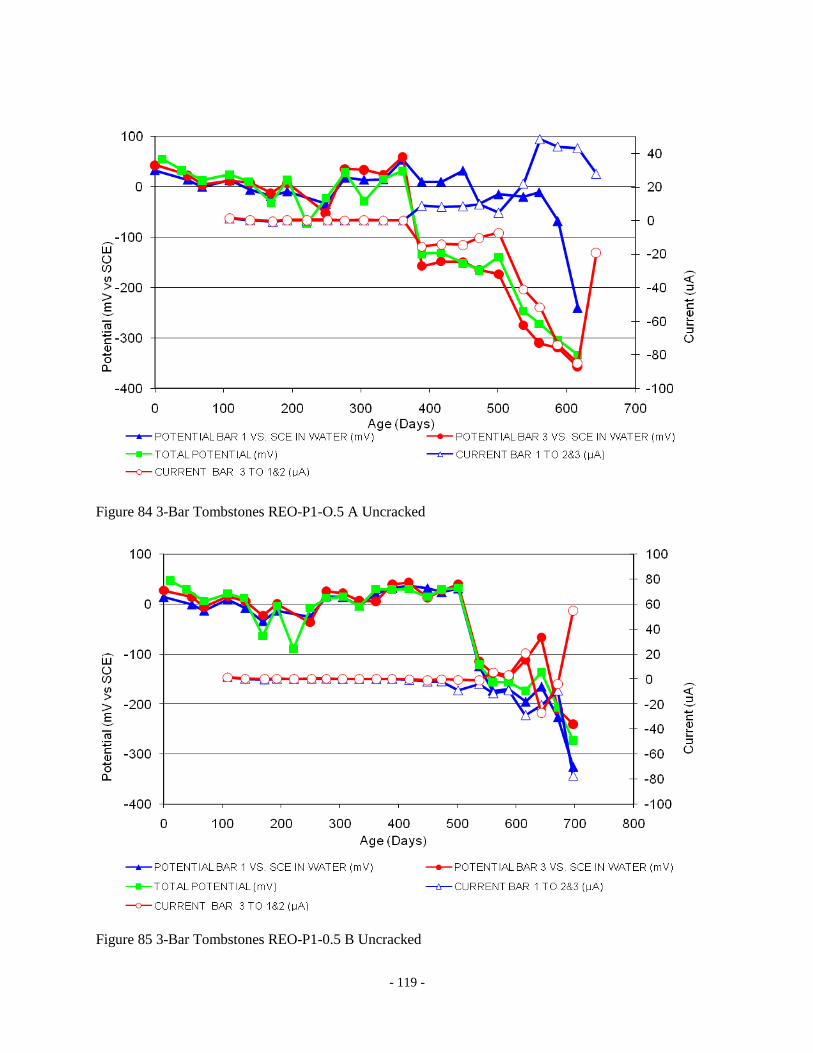
- 119 -
Figure 84 3-Bar Tombstones REO-P1-O.5 A Uncracked
Figure 85 3-Bar Tombstones REO-P1-0.5 B Uncracked
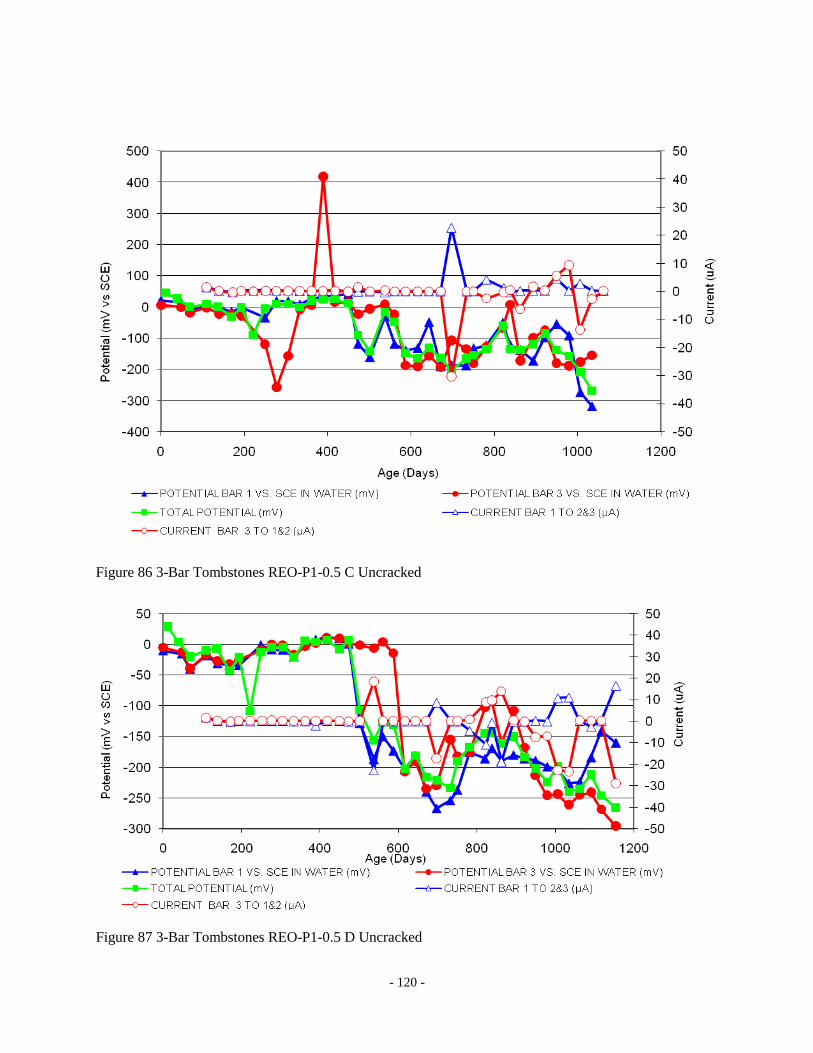
- 120 -
Figure 86 3-Bar Tombstones REO-P1-0.5 C Uncracked
Figure 87 3-Bar Tombstones REO-P1-0.5 D Uncracked

- 121 -
Figure 88 3-Bar Tombstones REO-P1-0.5 E Uncracked
Figure 89 3-Bar Tombstones REO-P1-0.5 F Uncracked
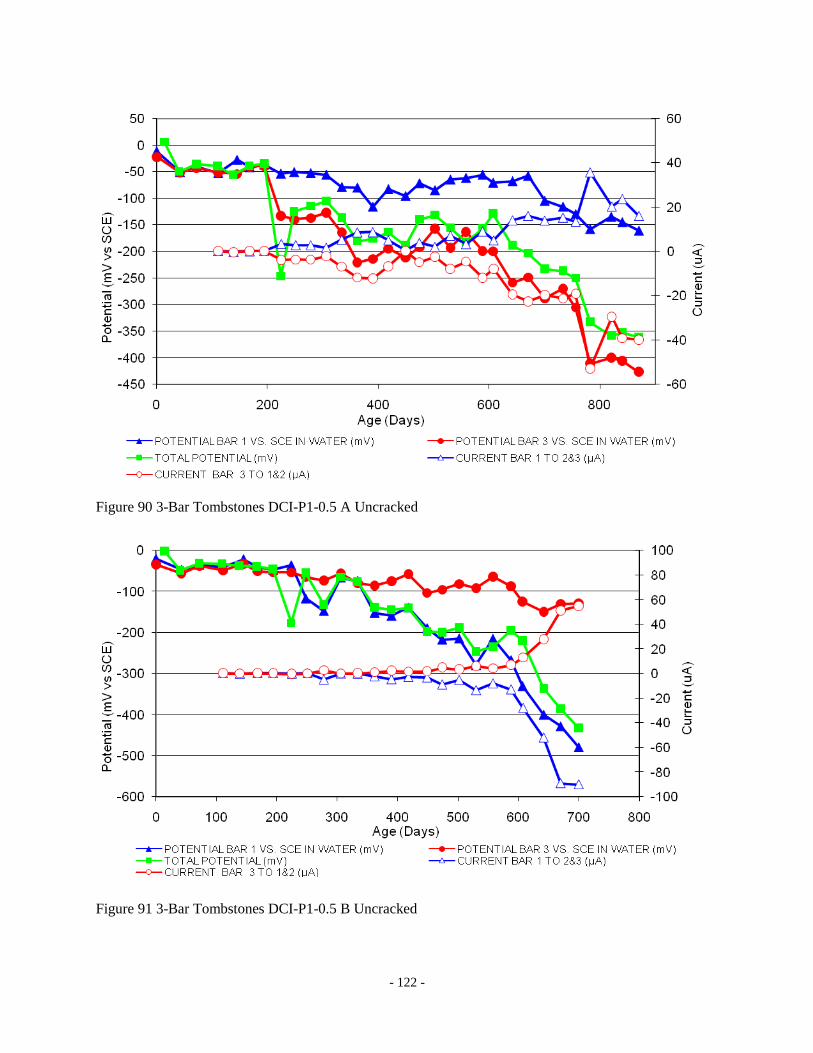
- 122 -
Figure 90 3-Bar Tombstones DCI-P1-0.5 A Uncracked
Figure 91 3-Bar Tombstones DCI-P1-0.5 B Uncracked
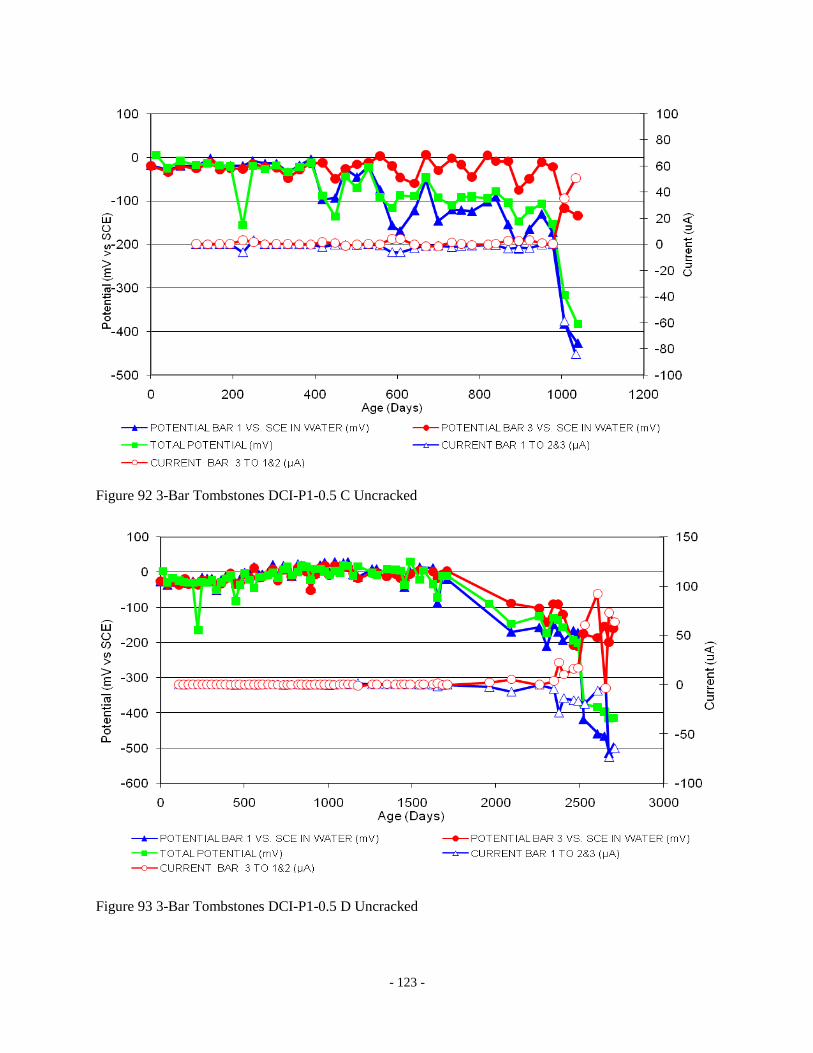
- 123 -
Figure 92 3-Bar Tombstones DCI-P1-0.5 C Uncracked
Figure 93 3-Bar Tombstones DCI-P1-0.5 D Uncracked
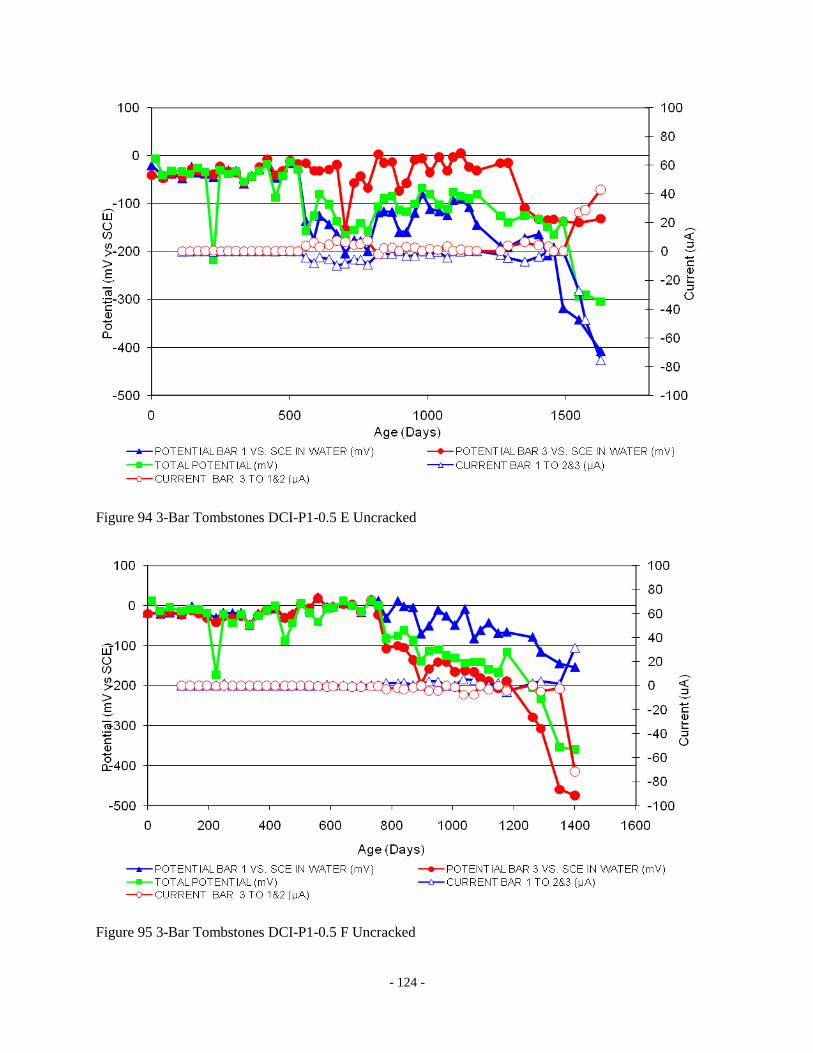
- 124 -
Figure 94 3-Bar Tombstones DCI-P1-0.5 E Uncracked
Figure 95 3-Bar Tombstones DCI-P1-0.5 F Uncracked

- 125 -
Figure 96 3-Bar Tombstones FER-P1-0.5 A Uncracked
Figure 97 3-Bar Tombstones FER-P1-0.5 B Uncracked

- 126 -
Figure 98 3-Bar Tombstones FER-P1-0.5 C Uncracked
Figure 99 3-Bar Tombstones FER-P1-0.5 D Uncracked

- 127 -
Figure 100 3-Bar Tombstones FER-P1-0.5 E Uncracked
Figure 101 3-Bar Tombstones FER-P1-0.5 F Uncracked
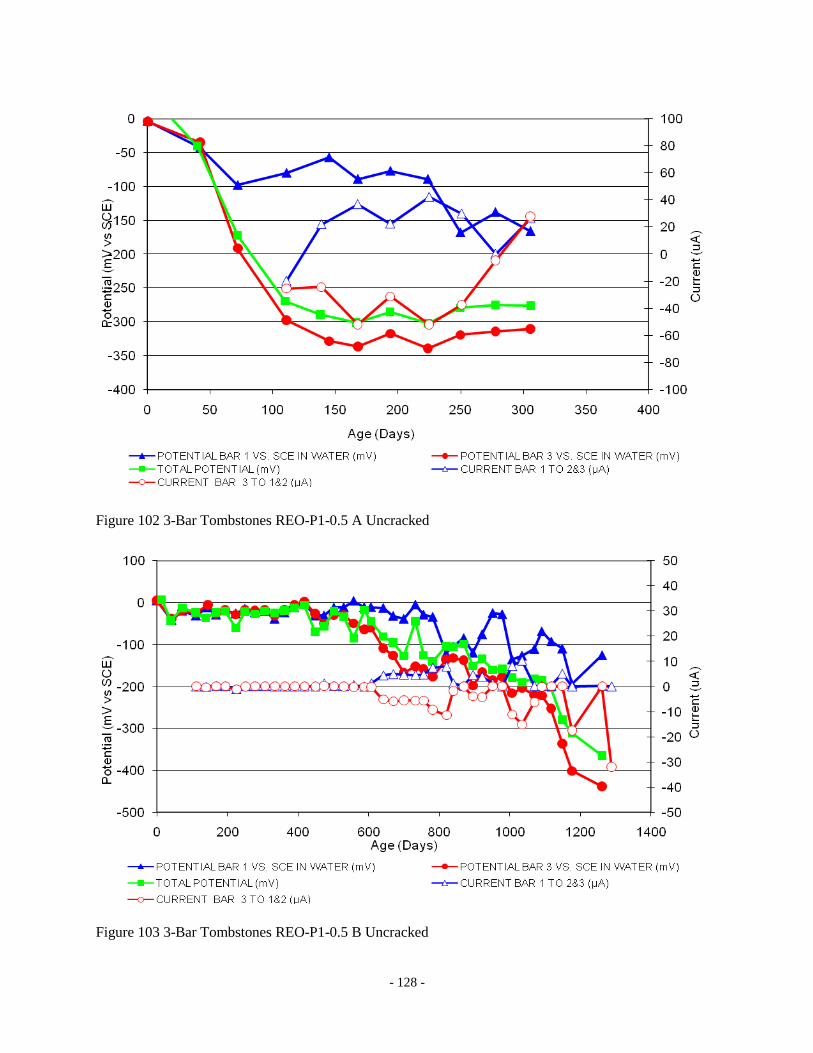
- 128 -
Figure 102 3-Bar Tombstones REO-P1-0.5 A Uncracked
Figure 103 3-Bar Tombstones REO-P1-0.5 B Uncracked
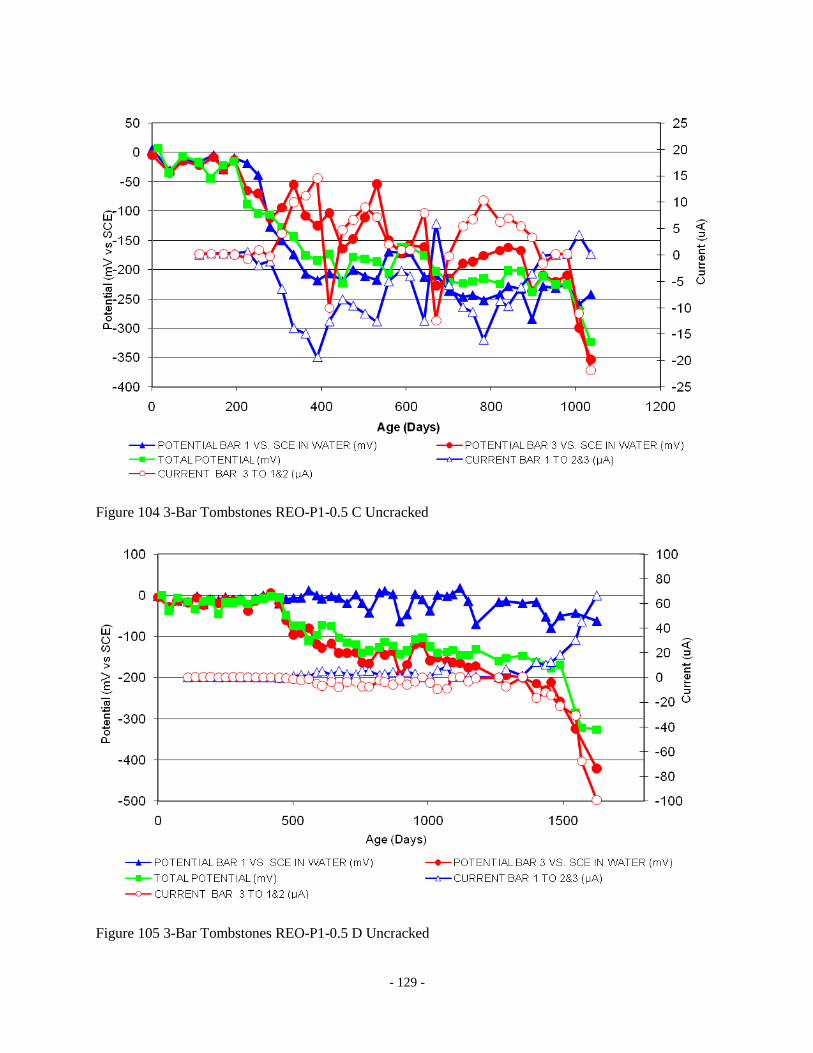
- 129 -
Figure 104 3-Bar Tombstones REO-P1-0.5 C Uncracked
Figure 105 3-Bar Tombstones REO-P1-0.5 D Uncracked
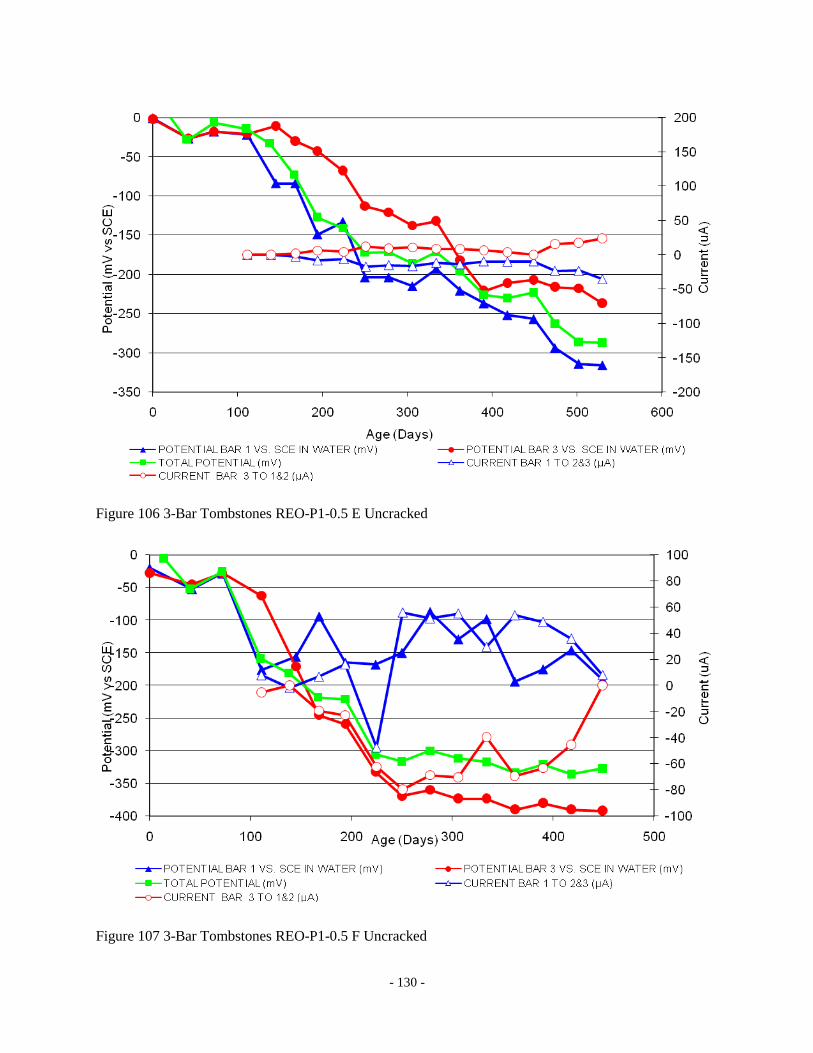
- 130 -
Figure 106 3-Bar Tombstones REO-P1-0.5 E Uncracked
Figure 107 3-Bar Tombstones REO-P1-0.5 F Uncracked

- 131 -
Figure 3-Bar Tombstones CTRL-P1-1.0 A Uncracked
Figure 108 3-Bar Tombstones CTRL-P1-1.0 B Uncracked

- 132 -
Figure 109 3-Bar Tombstones CTRL-P1-1.0 C Uncracked
Figure 110 3-Bar Tombstones CTRL-P1-1.0 D Uncracked
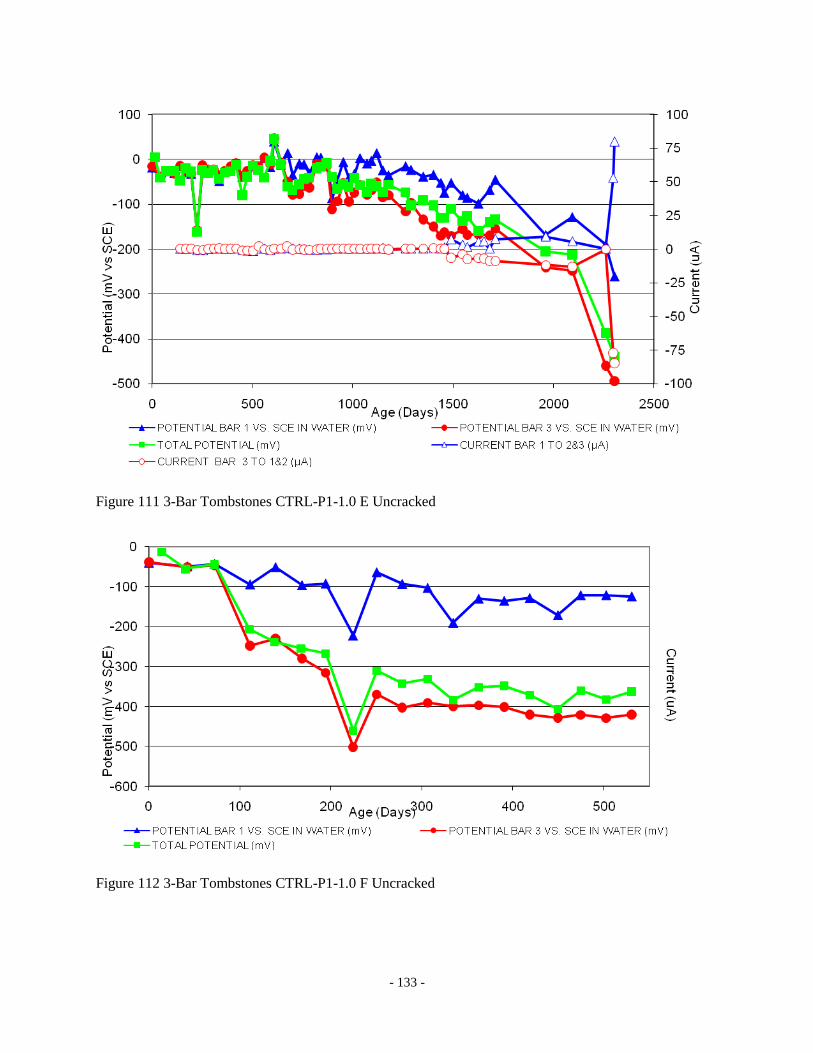
- 133 -
Figure 111 3-Bar Tombstones CTRL-P1-1.0 E Uncracked
Figure 112 3-Bar Tombstones CTRL-P1-1.0 F Uncracked
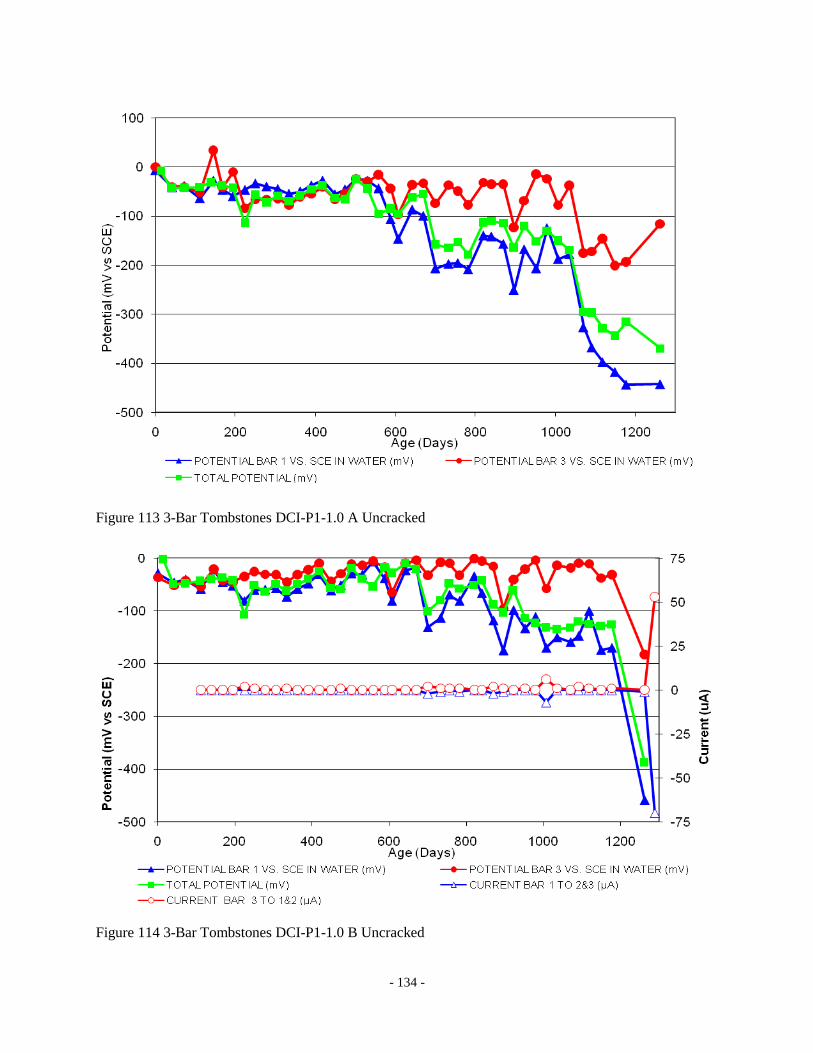
- 134 -
Figure 113 3-Bar Tombstones DCI-P1-1.0 A Uncracked
Figure 114 3-Bar Tombstones DCI-P1-1.0 B Uncracked
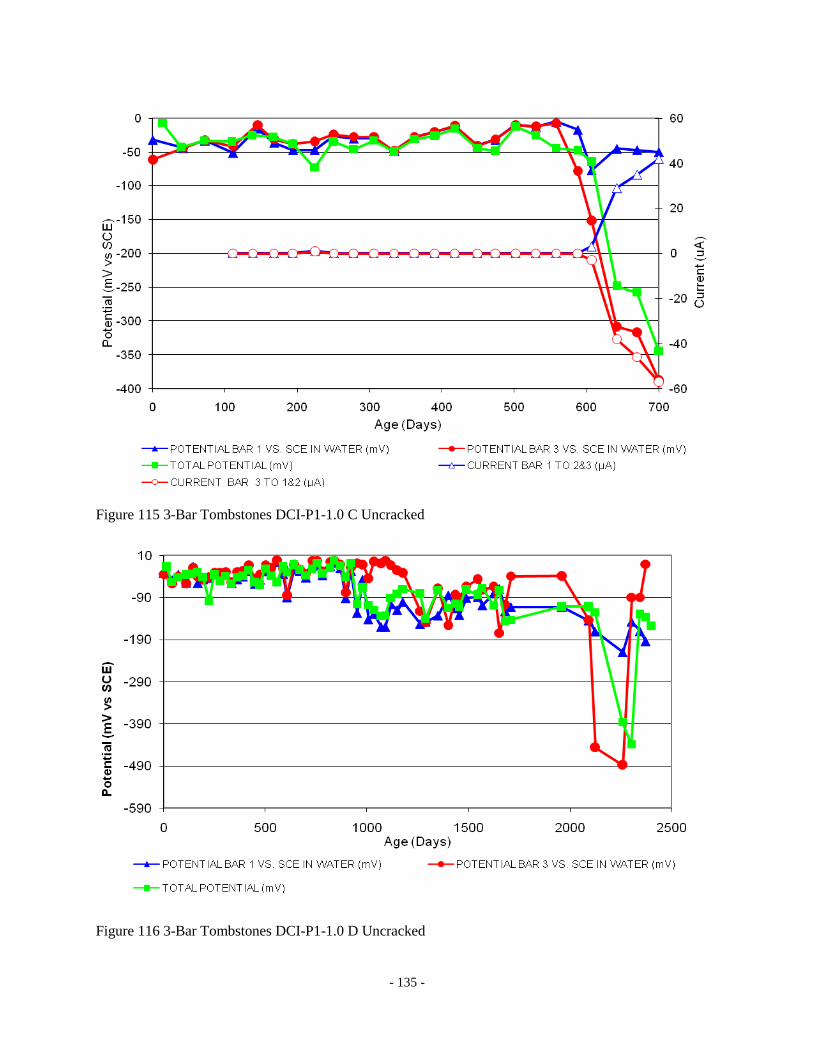
- 135 -
Figure 115 3-Bar Tombstones DCI-P1-1.0 C Uncracked
Figure 116 3-Bar Tombstones DCI-P1-1.0 D Uncracked

- 136 -
Figure 117 3-Bar Tombstones DCI-P1-1.0 E Uncracked
Figure 118 3-Bar Tombstones DCI-P1-1.0 F Uncracked
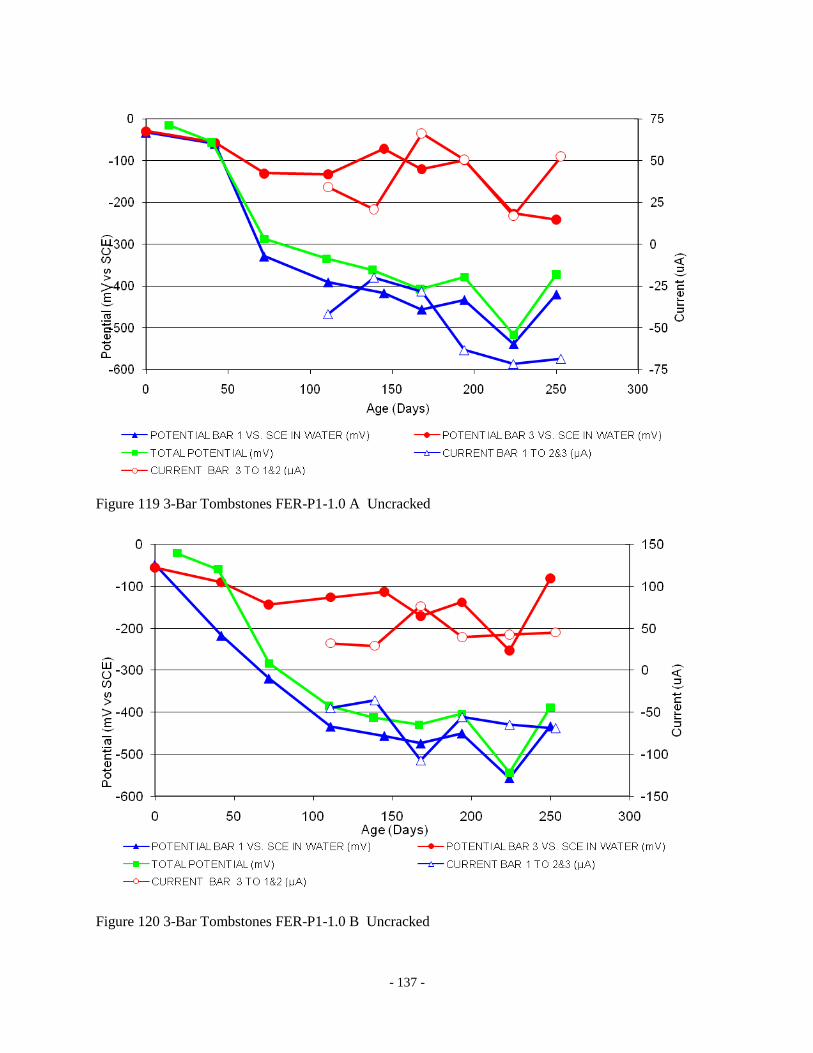
- 137 -
Figure 119 3-Bar Tombstones FER-P1-1.0 A Uncracked
Figure 120 3-Bar Tombstones FER-P1-1.0 B Uncracked
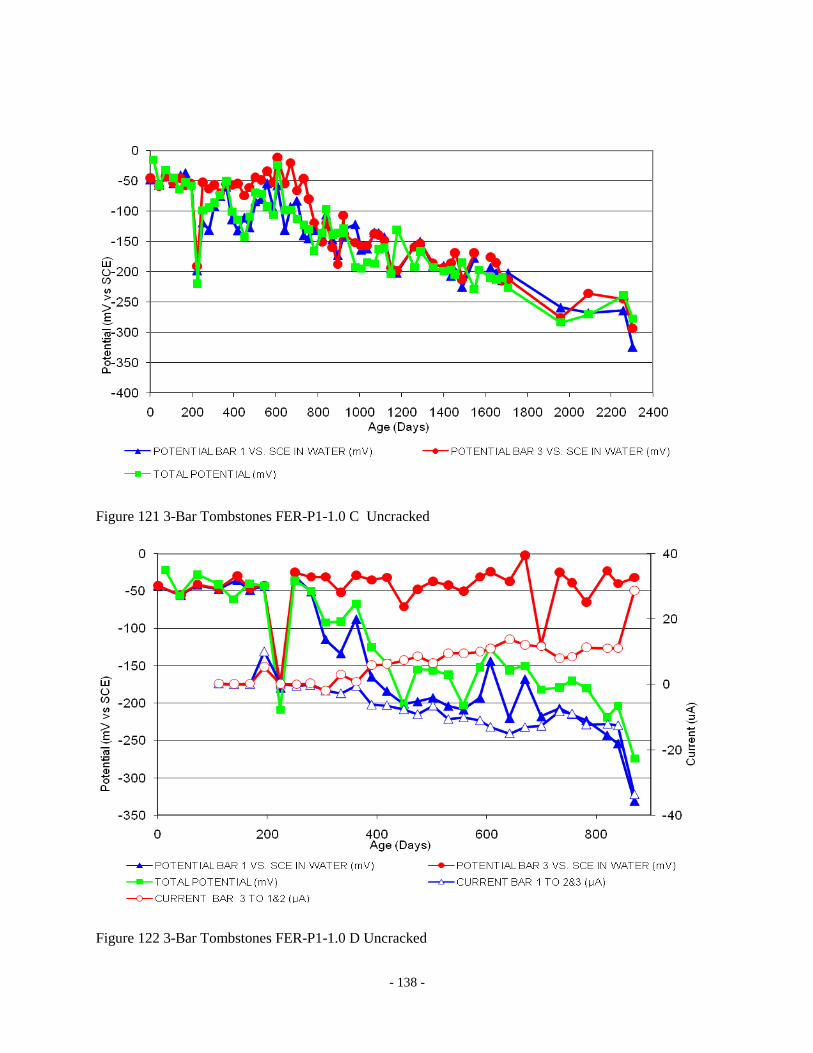
- 138 -
Figure 121 3-Bar Tombstones FER-P1-1.0 C Uncracked
Figure 122 3-Bar Tombstones FER-P1-1.0 D Uncracked

- 139 -
Figure 123 3-Bar Tombstones FER-P1-1.0 E Uncracked
Figure 124 3-Bar Tombstones FER-P1-1.0 F Uncracked
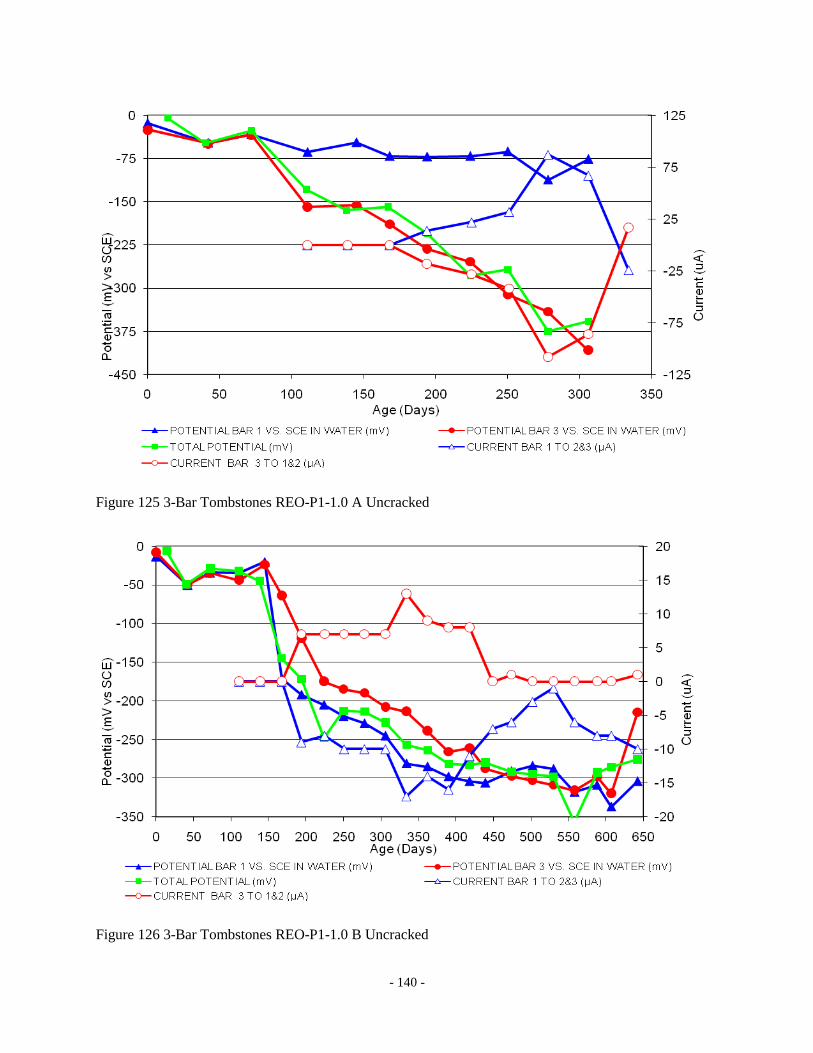
- 140 -
Figure 125 3-Bar Tombstones REO-P1-1.0 A Uncracked
Figure 126 3-Bar Tombstones REO-P1-1.0 B Uncracked
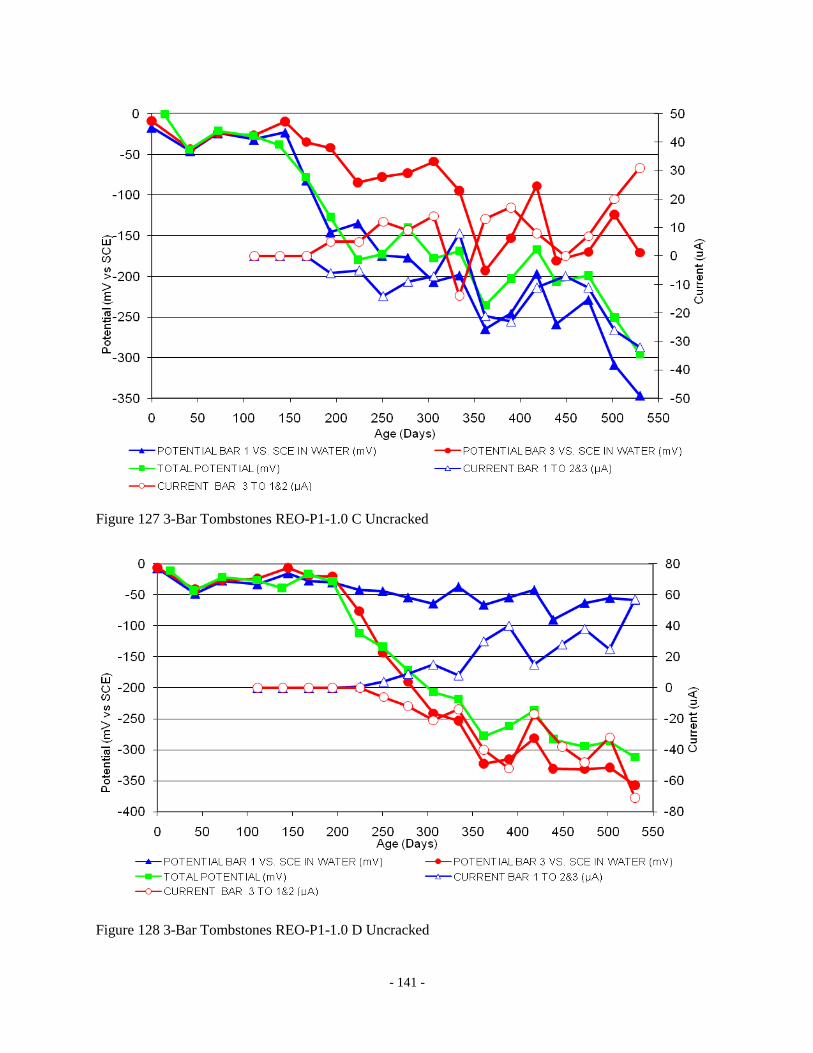
- 141 -
Figure 127 3-Bar Tombstones REO-P1-1.0 C Uncracked
Figure 128 3-Bar Tombstones REO-P1-1.0 D Uncracked

- 142 -
Figure 129 3-Bar Tombstones REO-P1-1.0 E Uncracked
Figure 130 3-Bar Tombstones REO-P1-1.0 F Uncracked
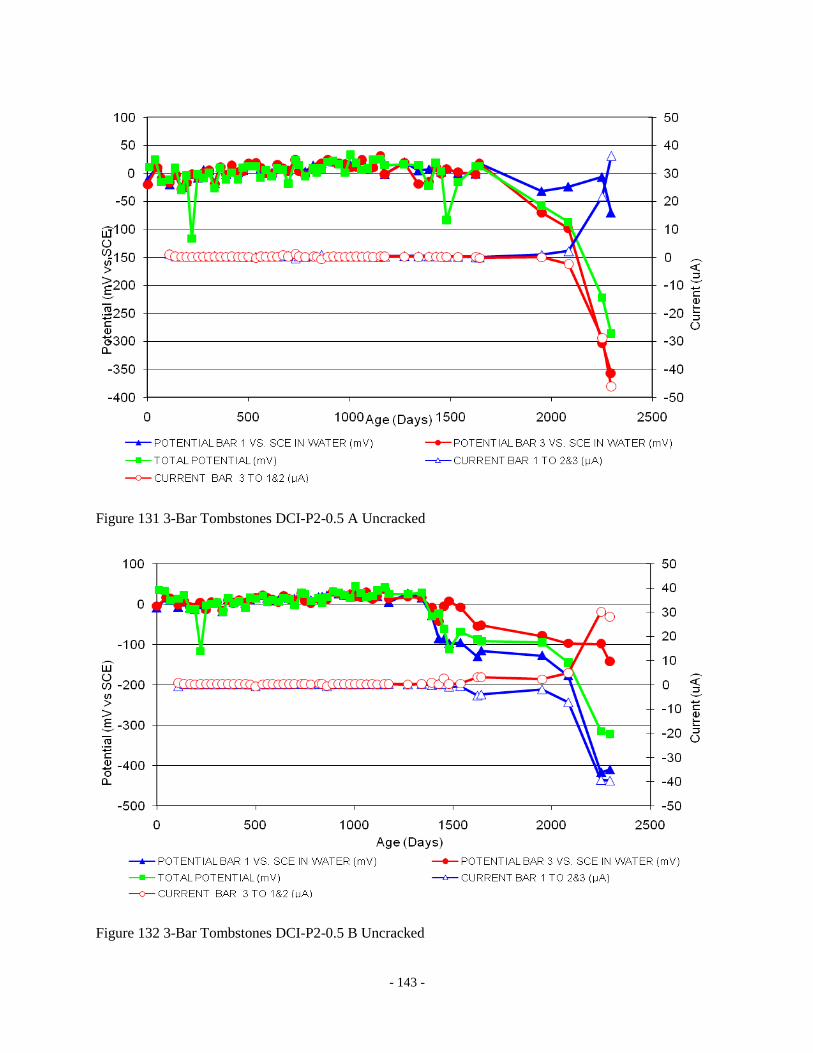
- 143 -
Figure 131 3-Bar Tombstones DCI-P2-0.5 A Uncracked
Figure 132 3-Bar Tombstones DCI-P2-0.5 B Uncracked
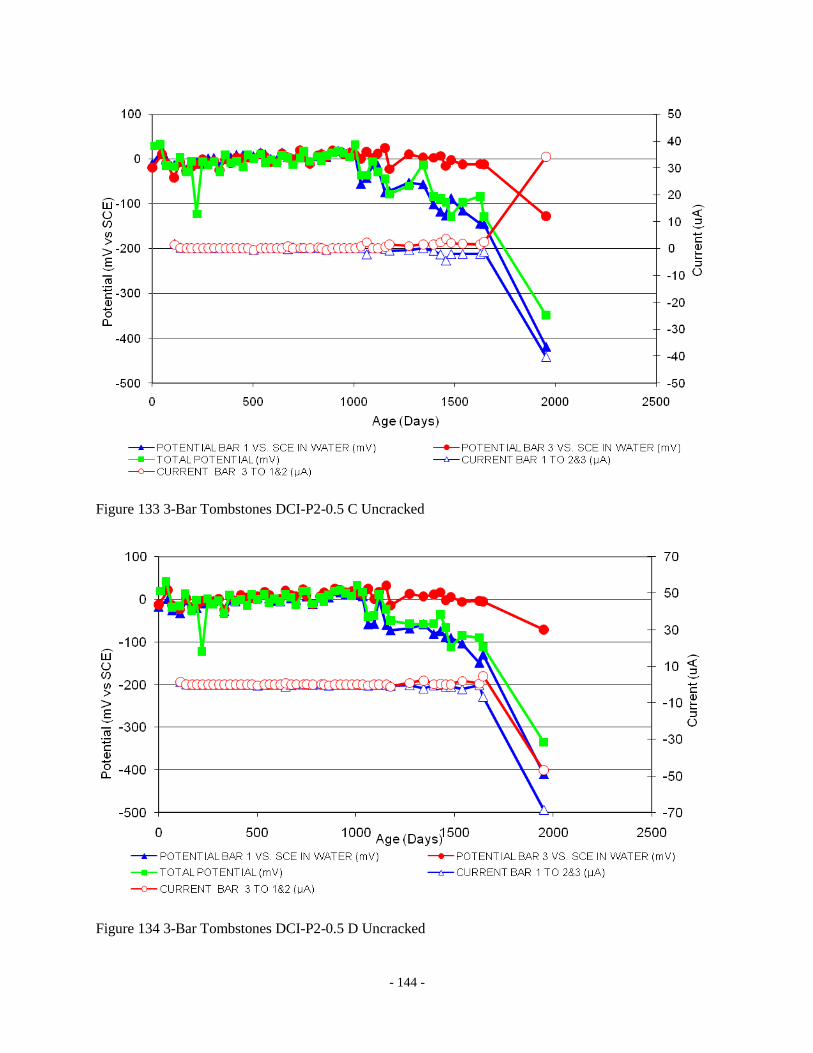
- 144 -
Figure 133 3-Bar Tombstones DCI-P2-0.5 C Uncracked
Figure 134 3-Bar Tombstones DCI-P2-0.5 D Uncracked
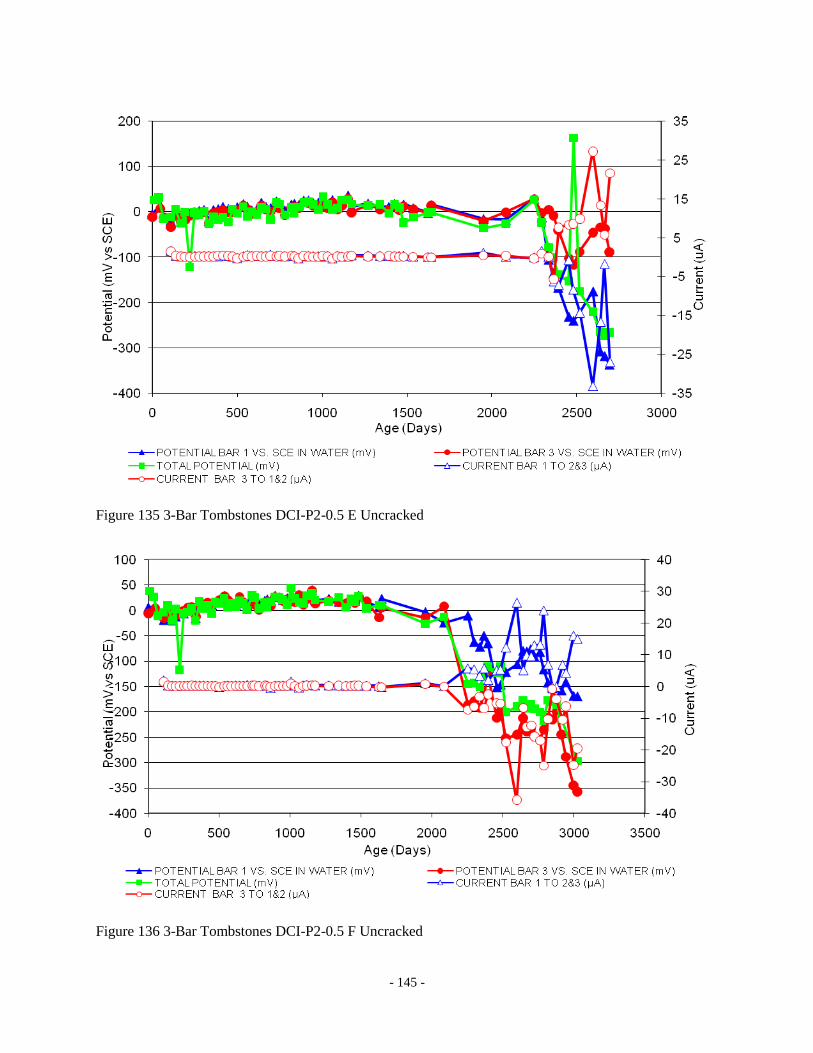
- 145 -
Figure 135 3-Bar Tombstones DCI-P2-0.5 E Uncracked
Figure 136 3-Bar Tombstones DCI-P2-0.5 F Uncracked

- 146 -
Figure 137 3-Bar Tombstones FER-P2-0.5 A Uncracked
Figure 138 3-Bar Tombstones FER-P2-0.5 B Uncracked
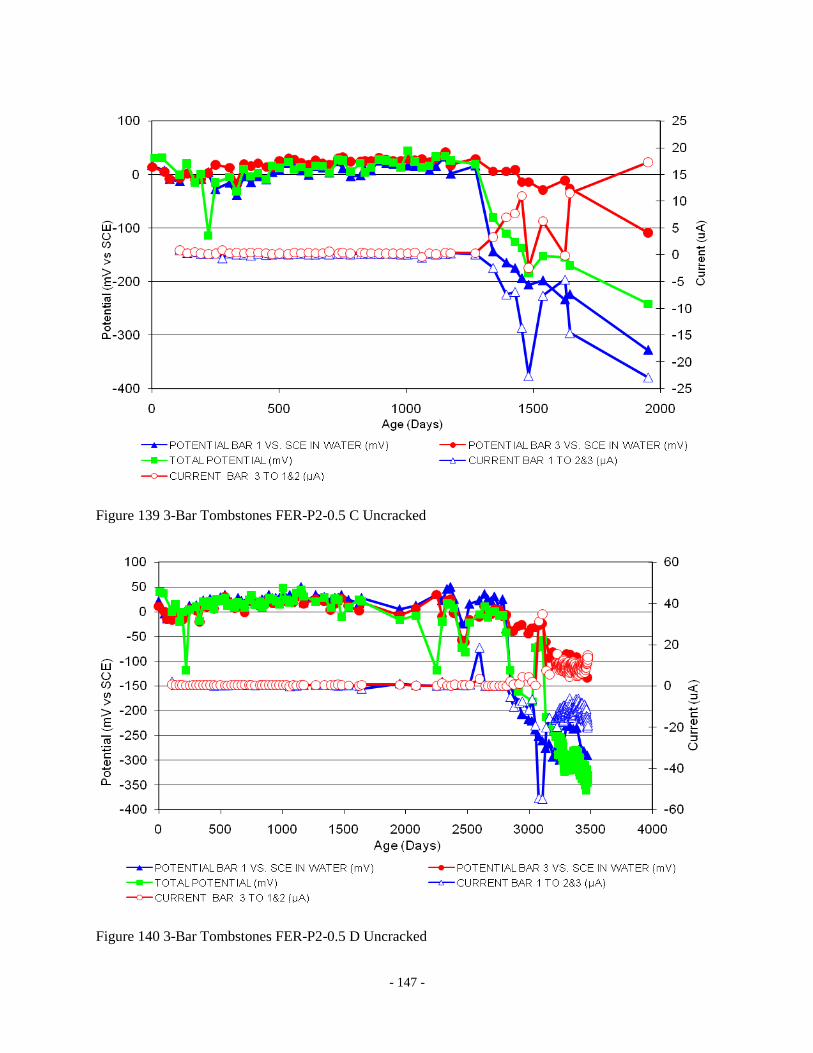
- 147 -
Figure 139 3-Bar Tombstones FER-P2-0.5 C Uncracked
Figure 140 3-Bar Tombstones FER-P2-0.5 D Uncracked

- 148 -
Figure 141 3-Bar Tombstones FER-P2-0.5 E Uncracked
Figure 142 3-Bar Tombstones FER-P2-0.5 F Uncracked

- 149 -
Figure 143 3-Bar Tombstones REO-P2-0.5 A Uncracked
Figure 144 3-Bar Tombstones REO-P2-0.5 B Uncracked
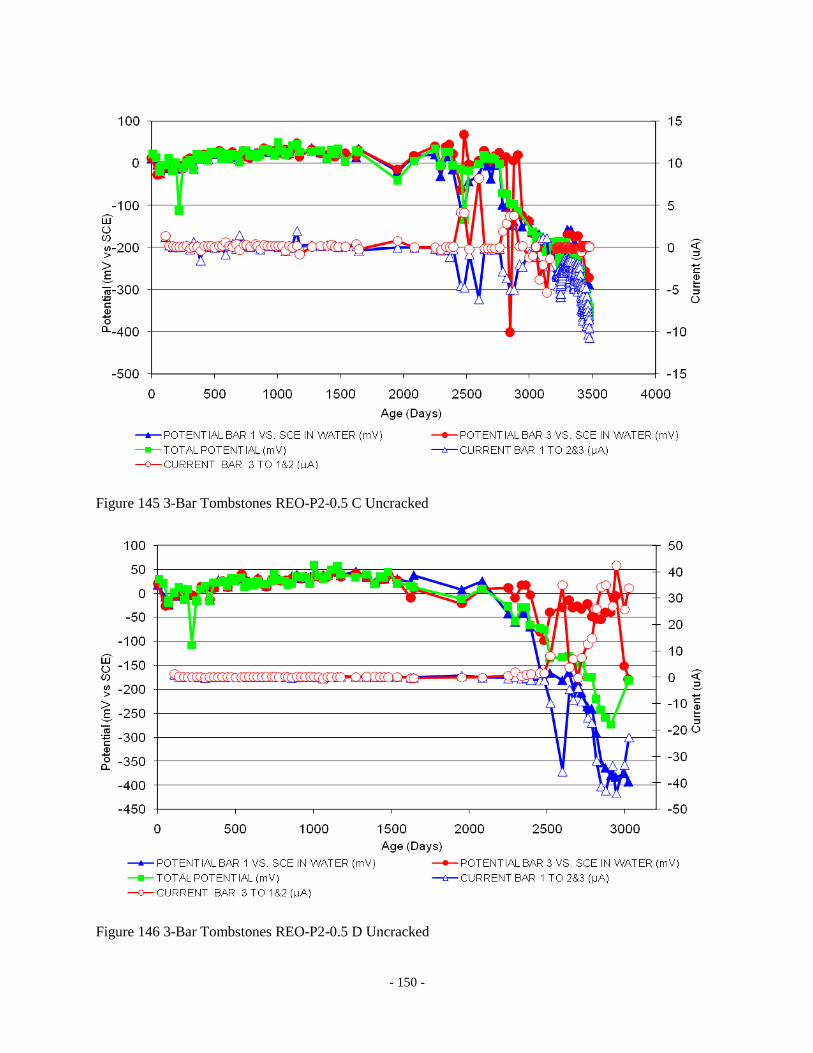
- 150 -
Figure 145 3-Bar Tombstones REO-P2-0.5 C Uncracked
Figure 146 3-Bar Tombstones REO-P2-0.5 D Uncracked
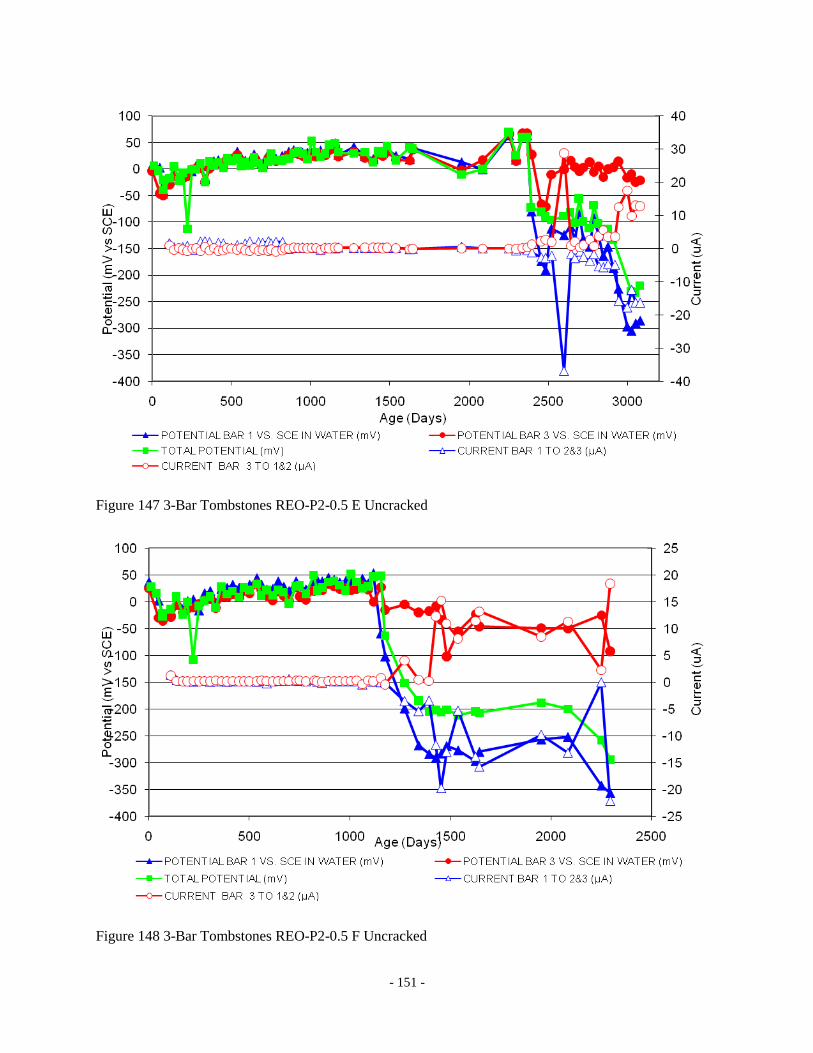
- 151 -
Figure 147 3-Bar Tombstones REO-P2-0.5 E Uncracked
Figure 148 3-Bar Tombstones REO-P2-0.5 F Uncracked
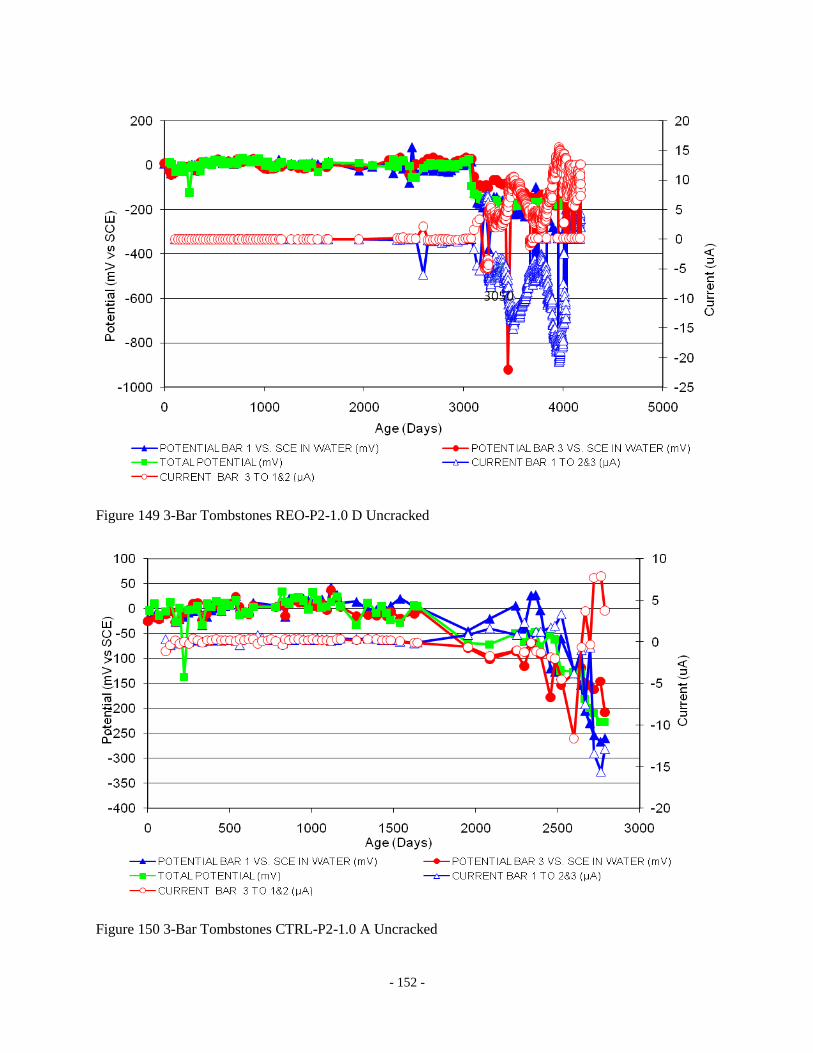
- 152 -
Figure 149 3-Bar Tombstones REO-P2-1.0 D Uncracked
Figure 150 3-Bar Tombstones CTRL-P2-1.0 A Uncracked

- 153 -
Figure 151 3-Bar Tombstones CTRL-P2-1.0 B Uncracked
Figure 152 3-Bar Tombstones CTRL-P2-1.0 C Uncracked
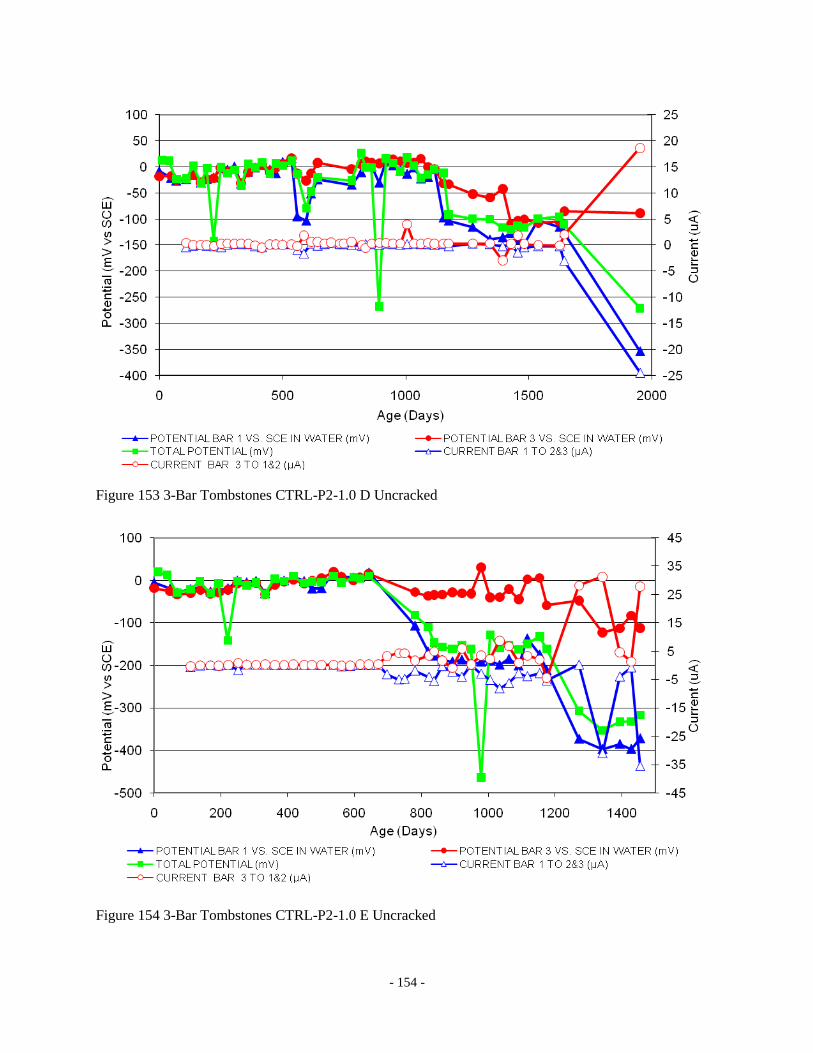
- 154 -
Figure 153 3-Bar Tombstones CTRL-P2-1.0 D Uncracked
Figure 154 3-Bar Tombstones CTRL-P2-1.0 E Uncracked

- 155 -
Figure 155 3-Bar Tombstones CTRL-P2-1.0 F Uncracked
Figure 156 3-Bar Tombstones DCI-P2-1.0 A Uncracked
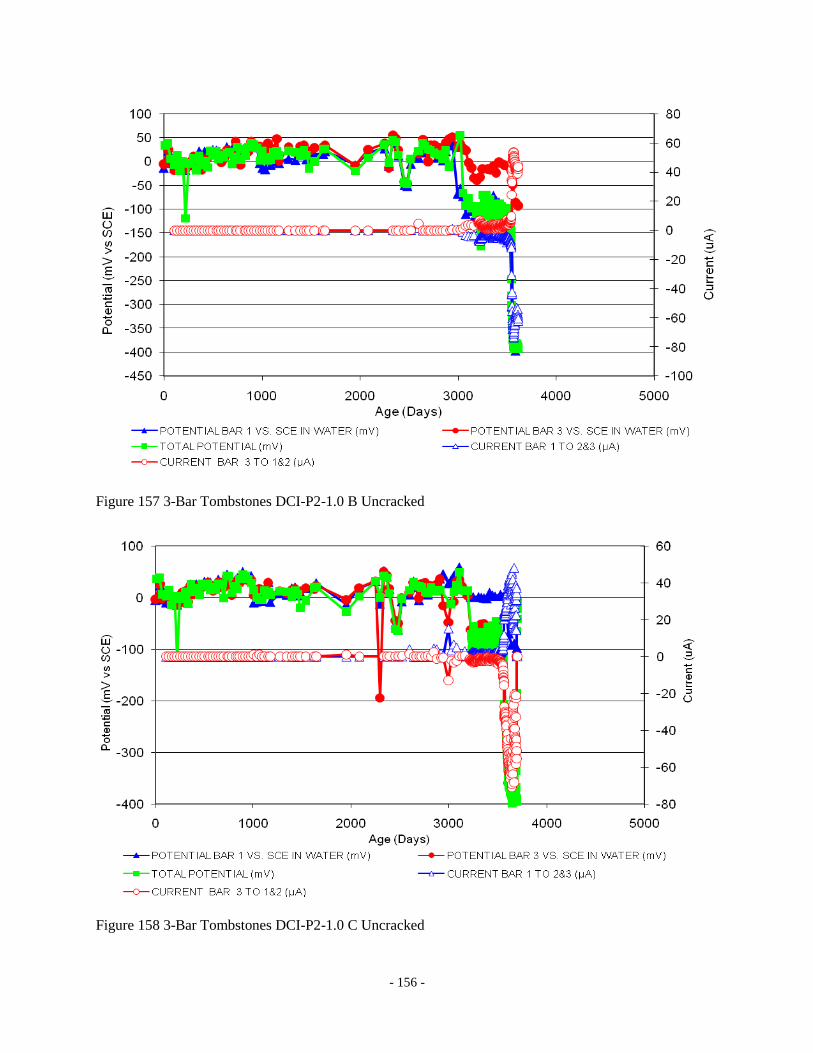
- 156 -
Figure 157 3-Bar Tombstones DCI-P2-1.0 B Uncracked
Figure 158 3-Bar Tombstones DCI-P2-1.0 C Uncracked
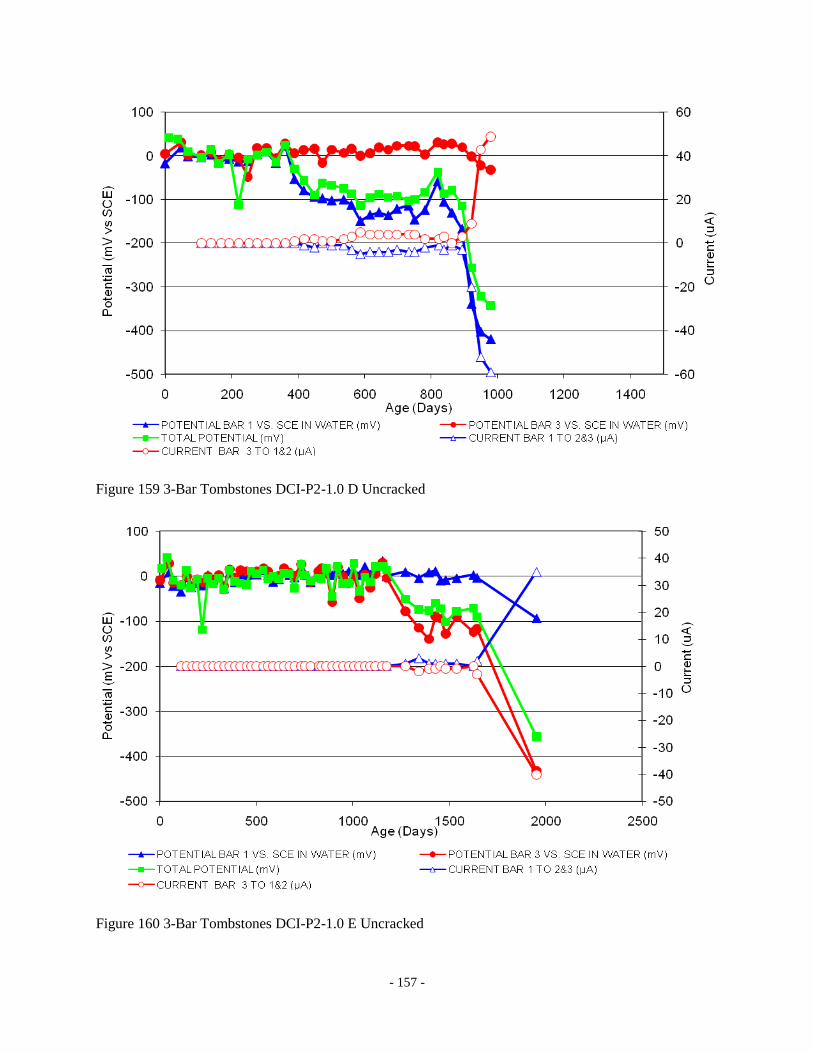
- 157 -
Figure 159 3-Bar Tombstones DCI-P2-1.0 D Uncracked
Figure 160 3-Bar Tombstones DCI-P2-1.0 E Uncracked

- 158 -
Figure 161 3-Bar Tombstones DCI-P2-1.0 F Uncracked
Figure 162 3-Bar Tombstones FER-P2-1.0 A Uncracked

- 159 -
Figure 163 3-Bar Tombstones FER-P2-1.0 B Uncracked
Figure 164 3-Bar Tombstones FER-P2-1.0 C Uncracked
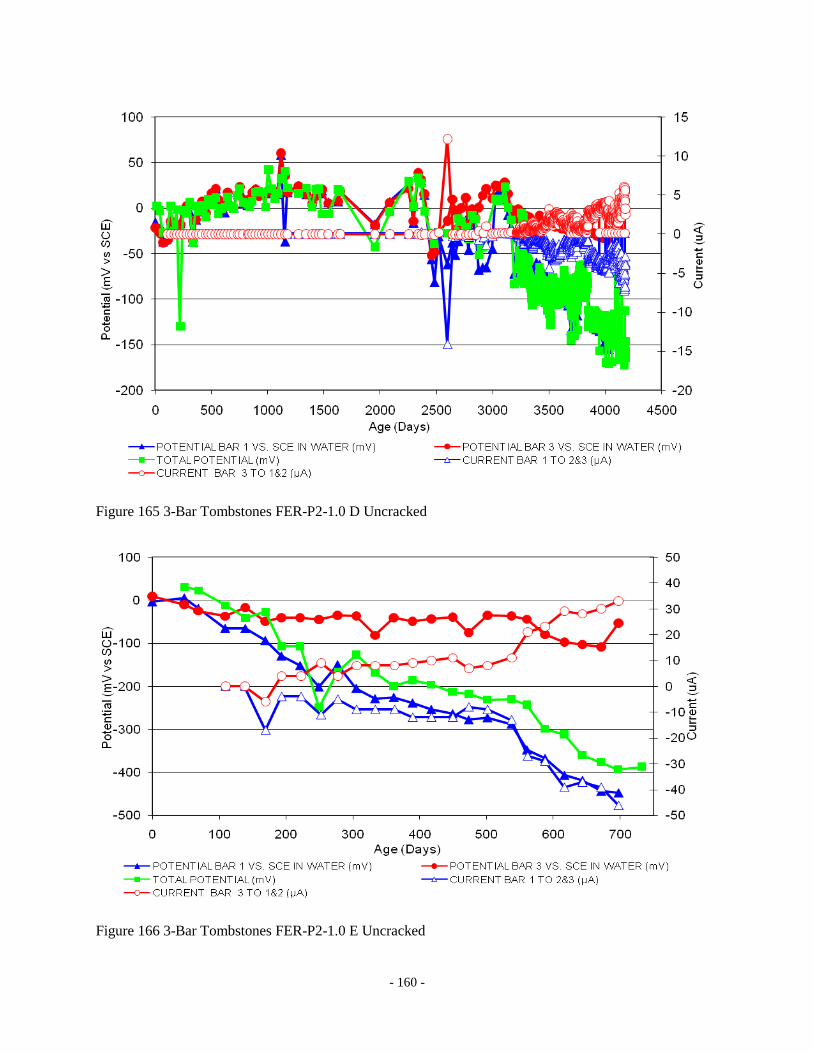
- 160 -
Figure 165 3-Bar Tombstones FER-P2-1.0 D Uncracked
Figure 166 3-Bar Tombstones FER-P2-1.0 E Uncracked
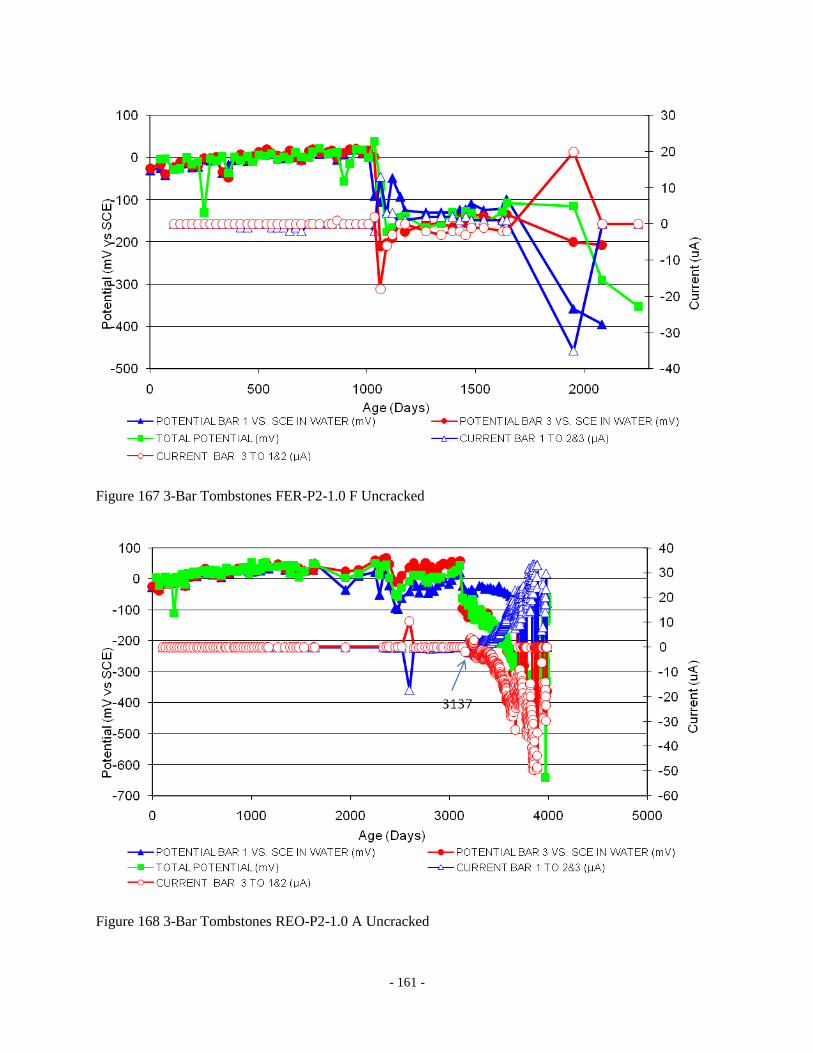
- 161 -
Figure 167 3-Bar Tombstones FER-P2-1.0 F Uncracked
Figure 168 3-Bar Tombstones REO-P2-1.0 A Uncracked
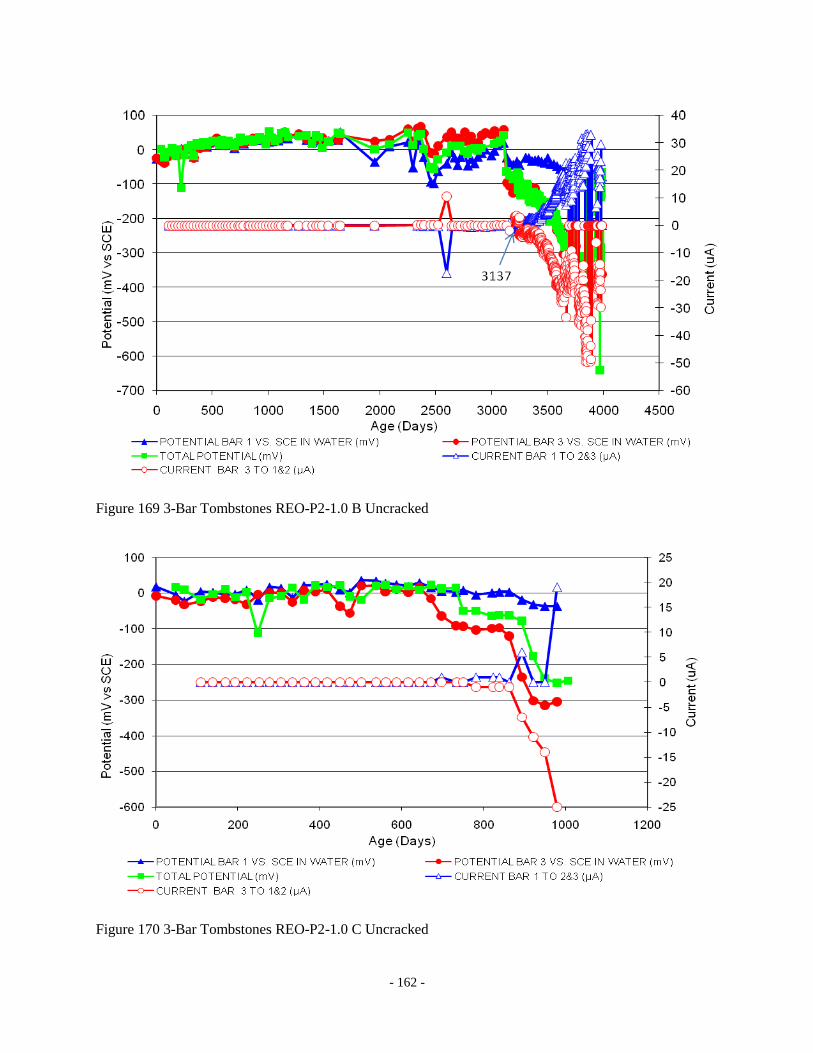
- 162 -
Figure 169 3-Bar Tombstones REO-P2-1.0 B Uncracked
Figure 170 3-Bar Tombstones REO-P2-1.0 C Uncracked
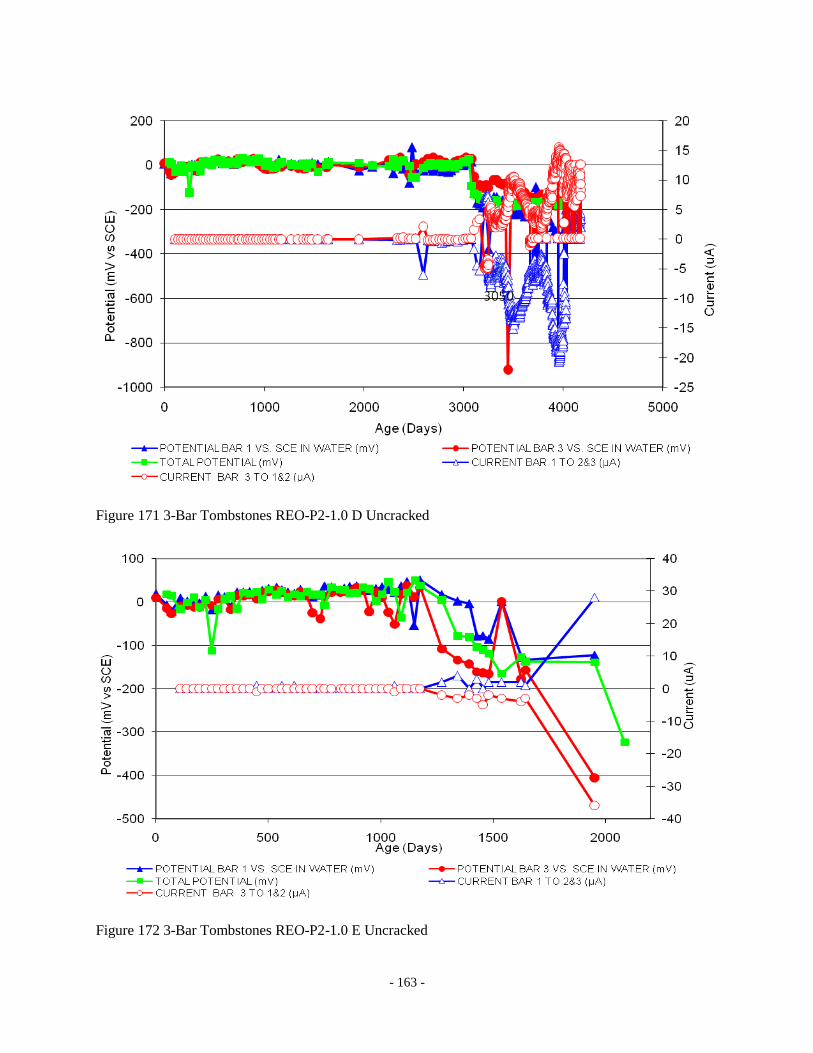
- 163 -
Figure 171 3-Bar Tombstones REO-P2-1.0 D Uncracked
Figure 172 3-Bar Tombstones REO-P2-1.0 E Uncracked
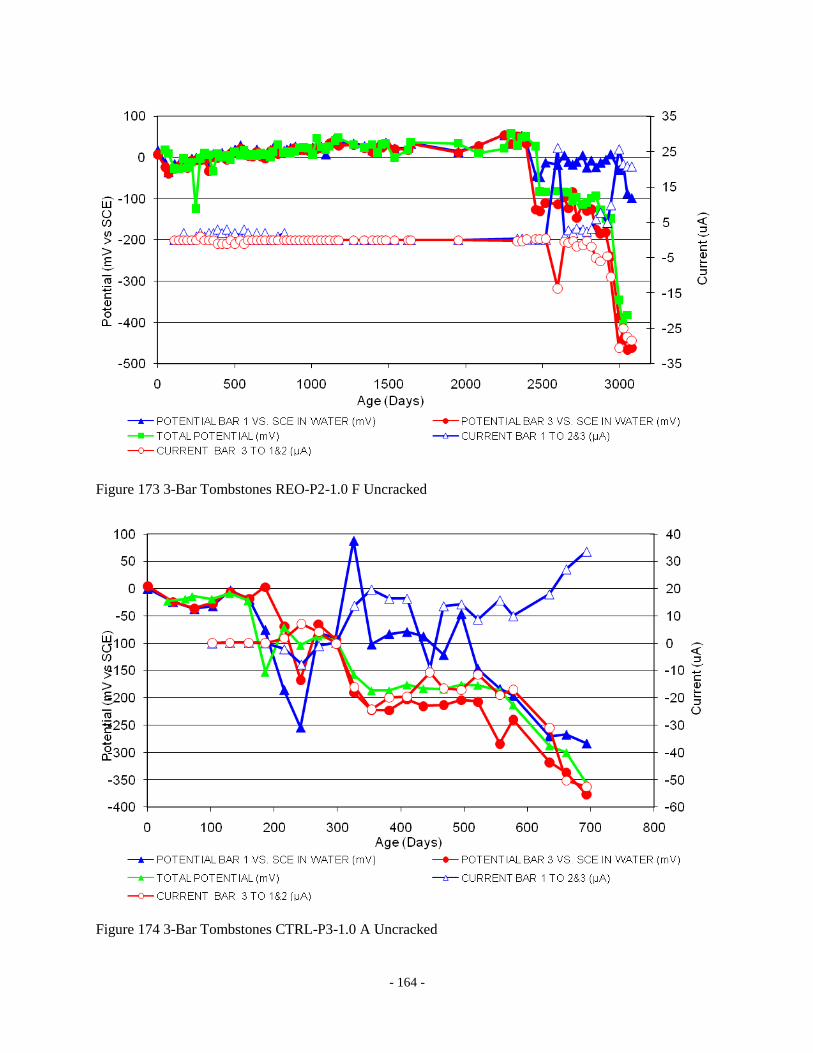
- 164 -
Figure 173 3-Bar Tombstones REO-P2-1.0 F Uncracked
Figure 174 3-Bar Tombstones CTRL-P3-1.0 A Uncracked

- 165 -
Figure 175 3-Bar Tombstones CTRL-P3-1.0 B Uncracked
Figure 176 3-Bar Tombstones CTRL-P3-1.0 C Uncracked
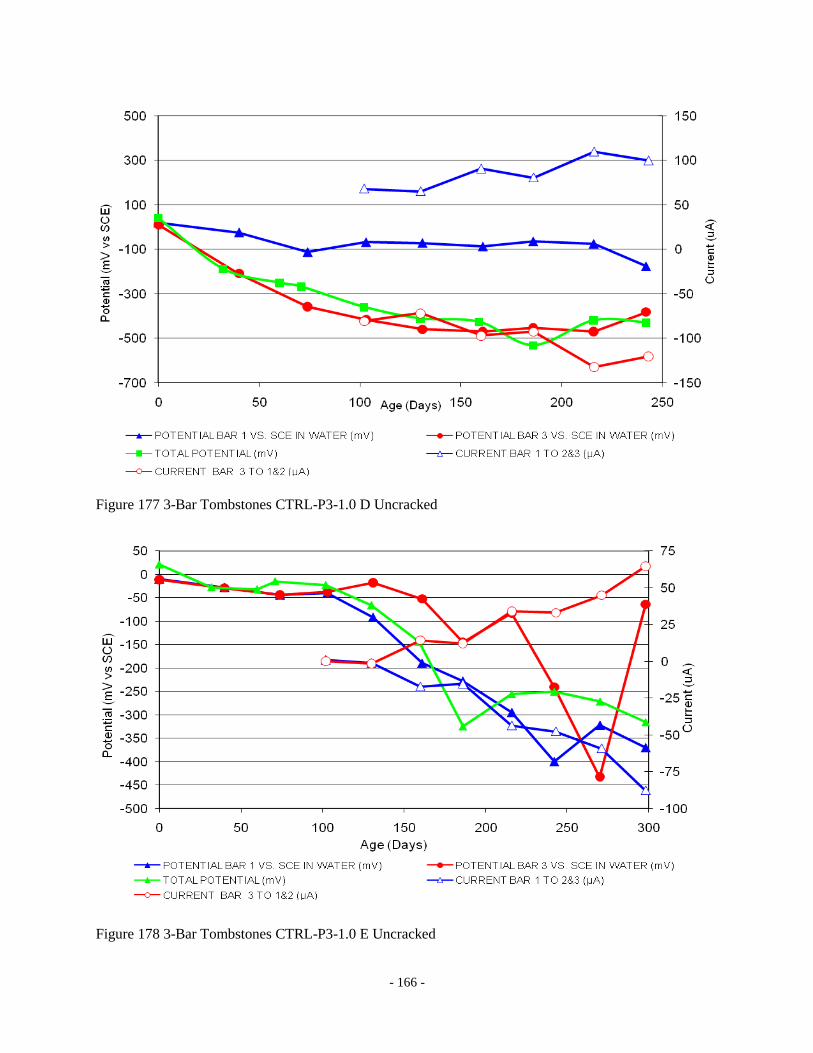
- 166 -
Figure 177 3-Bar Tombstones CTRL-P3-1.0 D Uncracked
Figure 178 3-Bar Tombstones CTRL-P3-1.0 E Uncracked

- 167 -
Figure 179 3-Bar Tombstones CTRL-P3-1.0 F Uncracked
Figure 180 3-Bar Tombstones DCI-P3-1.0 A Uncracked

- 168 -
Figure 181 3-Bar Tombstones DCI-P3-1.0 B Uncracked
Figure 182 3-Bar Tombstones DCI-P3-1.0 C Uncracked
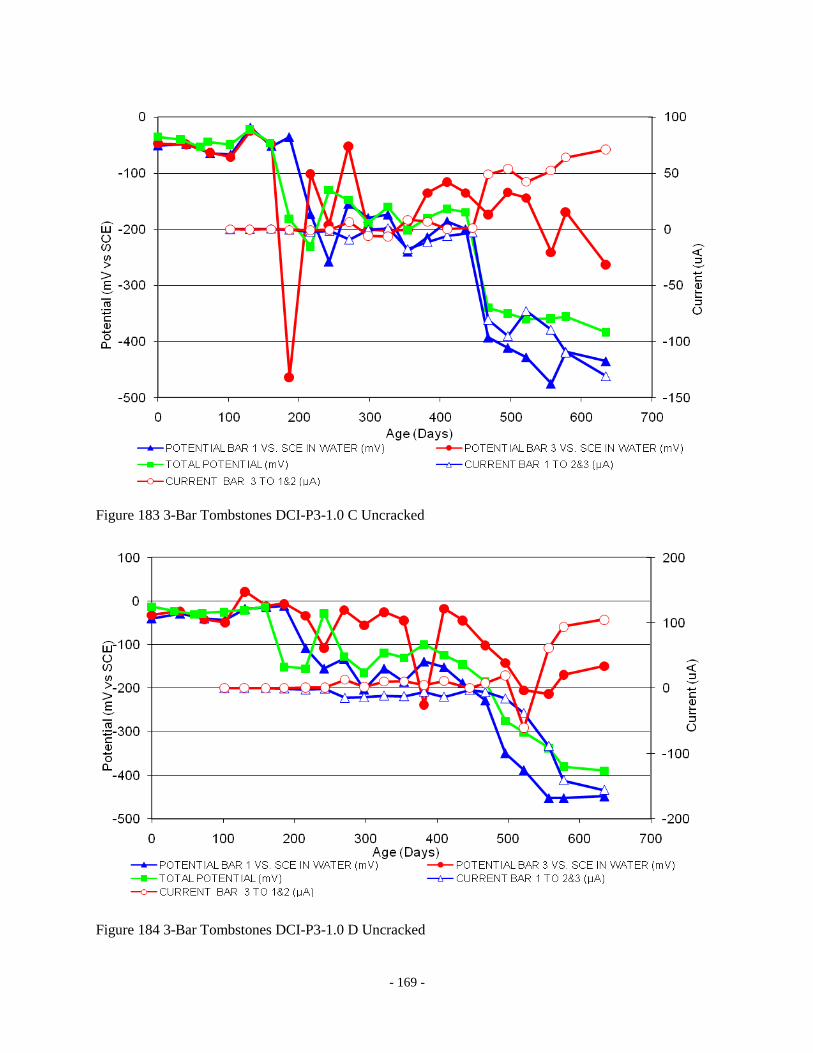
- 169 -
Figure 183 3-Bar Tombstones DCI-P3-1.0 C Uncracked
Figure 184 3-Bar Tombstones DCI-P3-1.0 D Uncracked
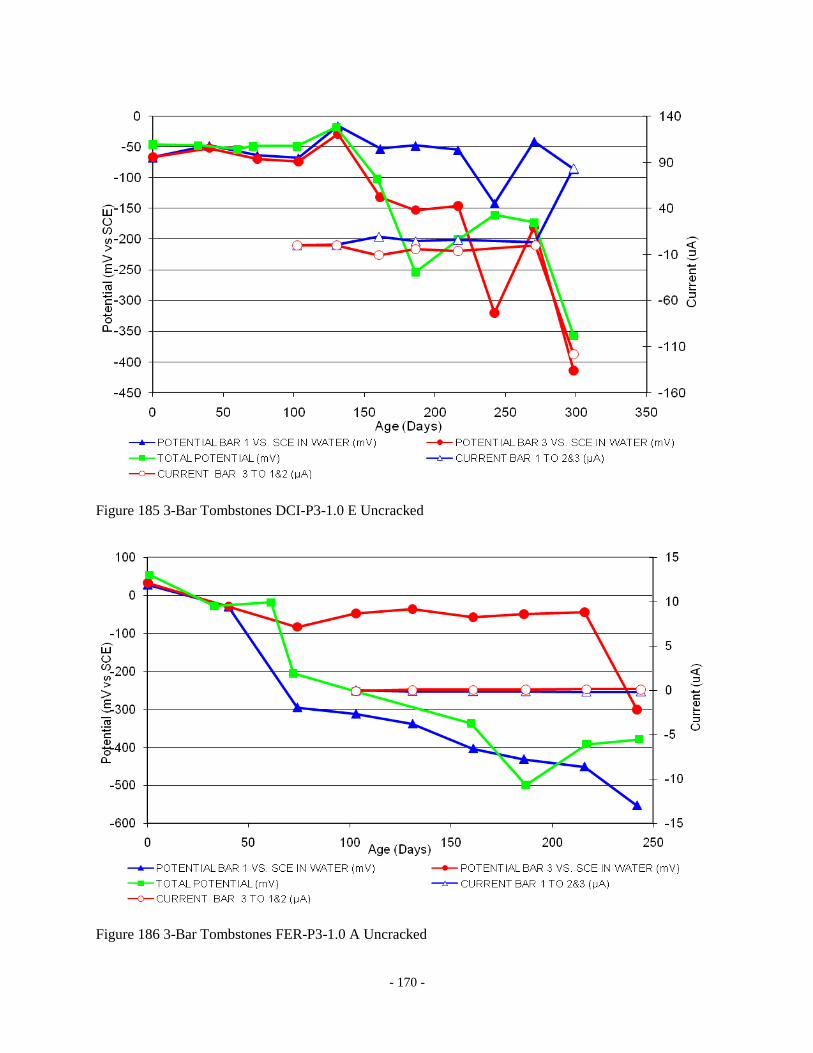
- 170 -
Figure 185 3-Bar Tombstones DCI-P3-1.0 E Uncracked
Figure 186 3-Bar Tombstones FER-P3-1.0 A Uncracked
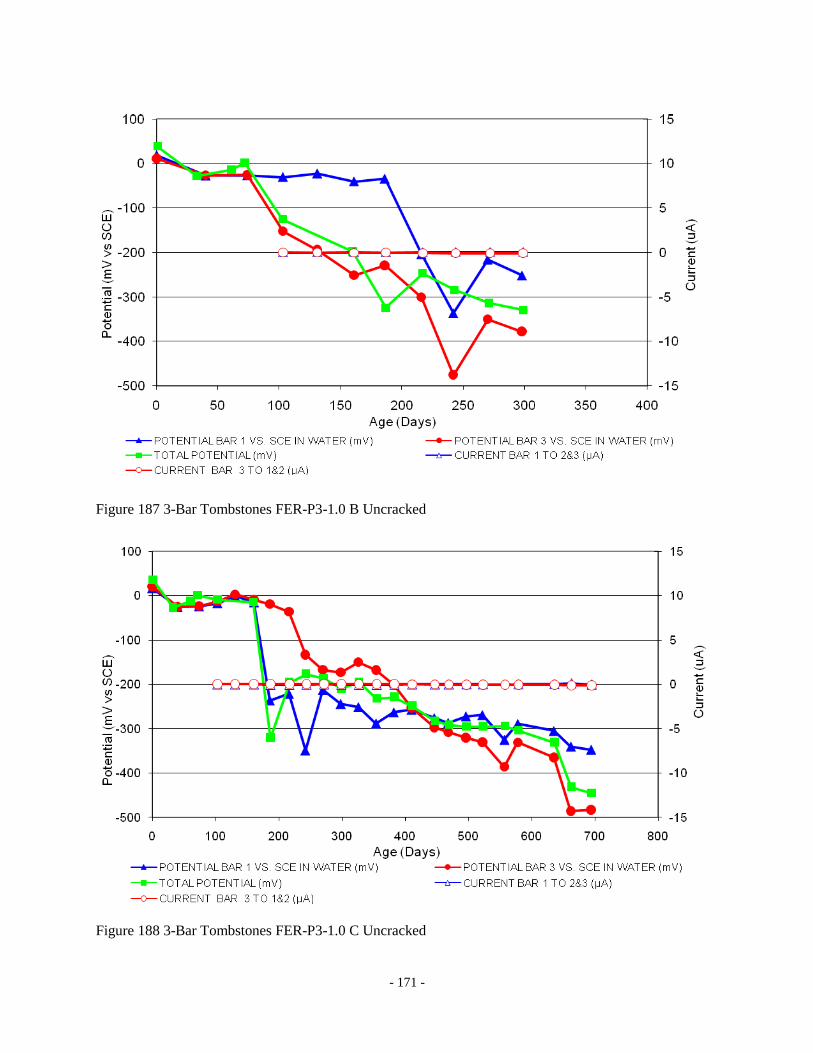
- 171 -
Figure 187 3-Bar Tombstones FER-P3-1.0 B Uncracked
Figure 188 3-Bar Tombstones FER-P3-1.0 C Uncracked
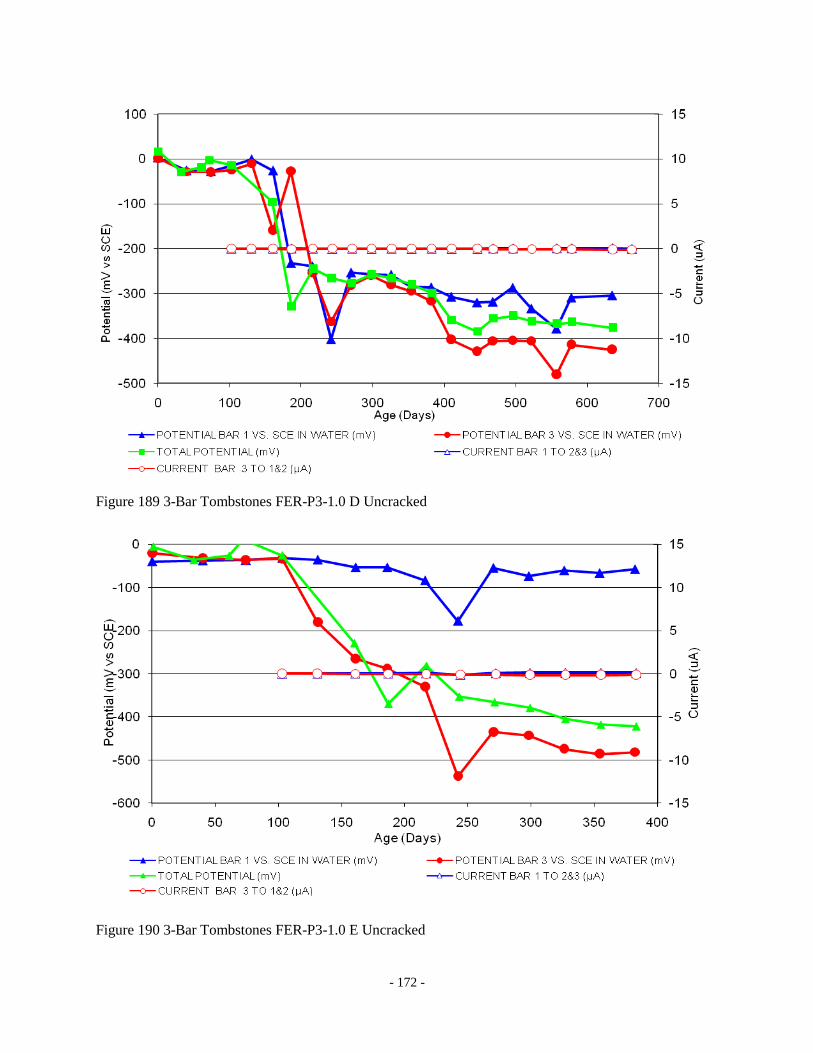
- 172 -
Figure 189 3-Bar Tombstones FER-P3-1.0 D Uncracked
Figure 190 3-Bar Tombstones FER-P3-1.0 E Uncracked
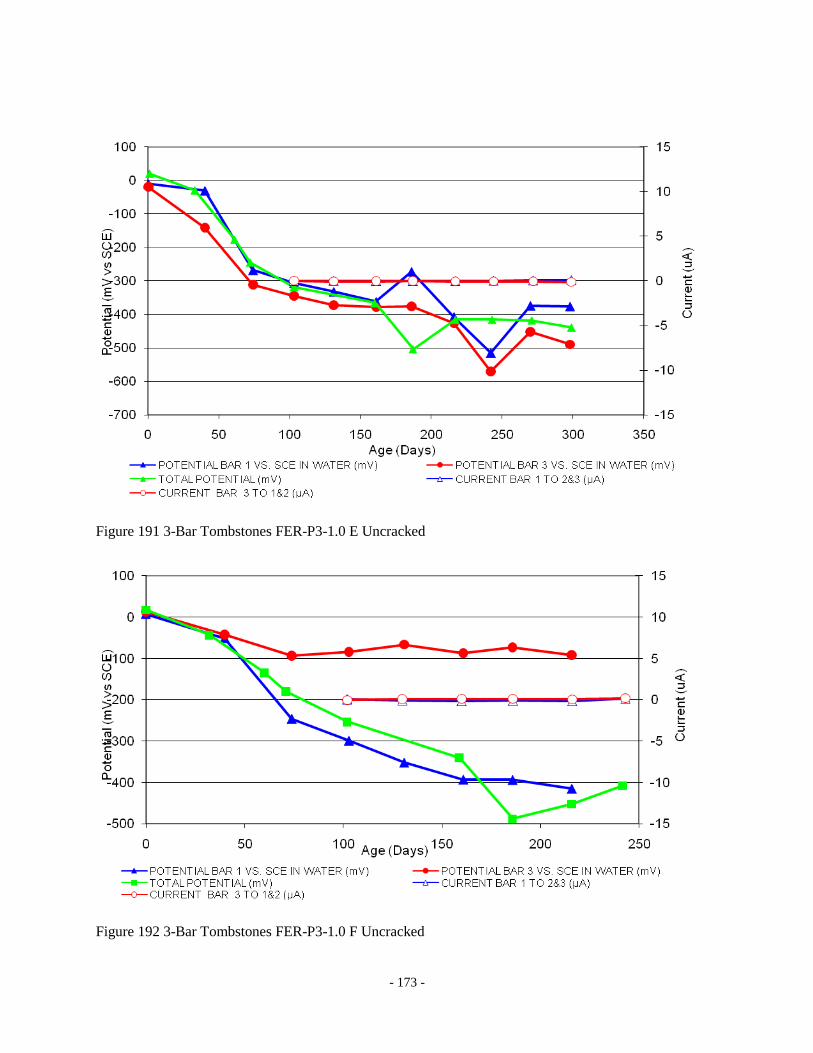
- 173 -
Figure 191 3-Bar Tombstones FER-P3-1.0 E Uncracked
Figure 192 3-Bar Tombstones FER-P3-1.0 F Uncracked
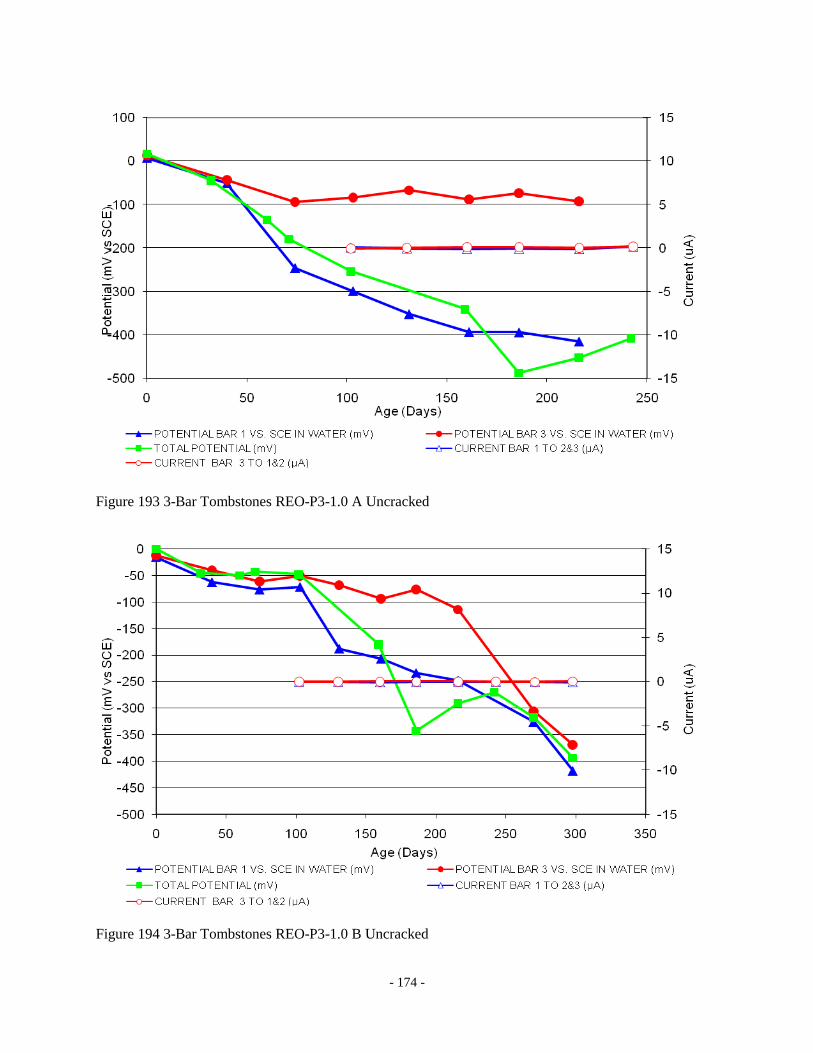
- 174 -
Figure 193 3-Bar Tombstones REO-P3-1.0 A Uncracked
Figure 194 3-Bar Tombstones REO-P3-1.0 B Uncracked
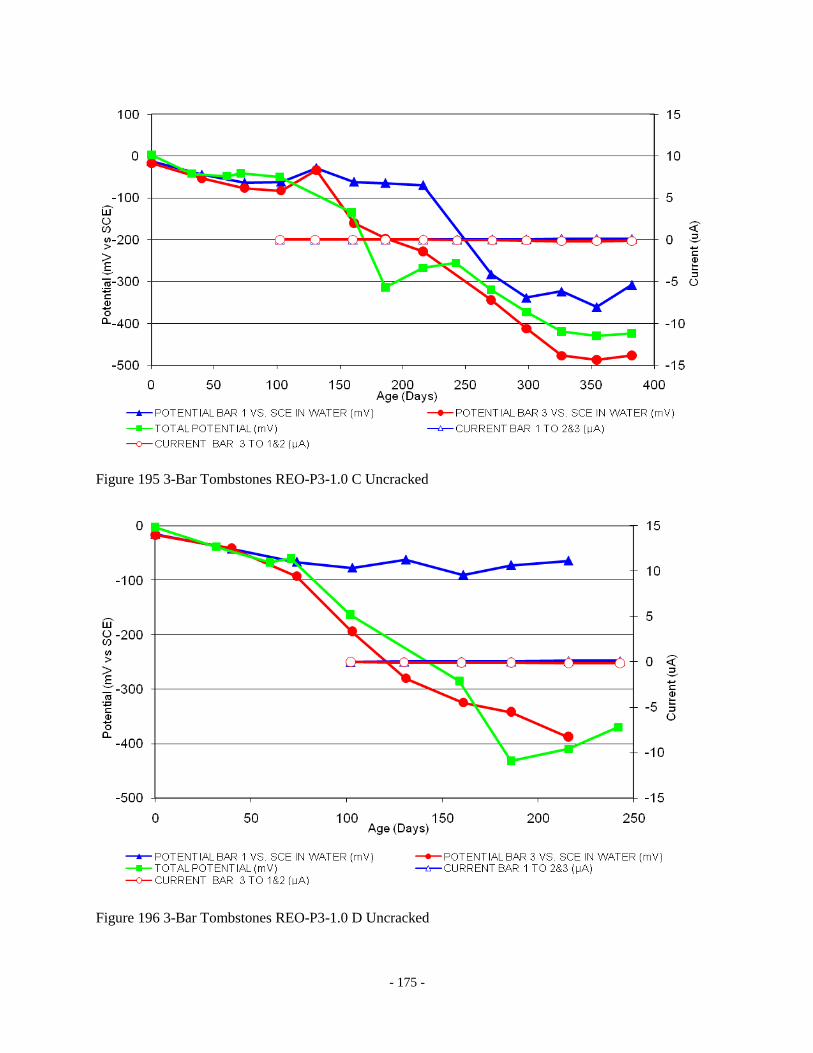
- 175 -
Figure 195 3-Bar Tombstones REO-P3-1.0 C Uncracked
Figure 196 3-Bar Tombstones REO-P3-1.0 D Uncracked
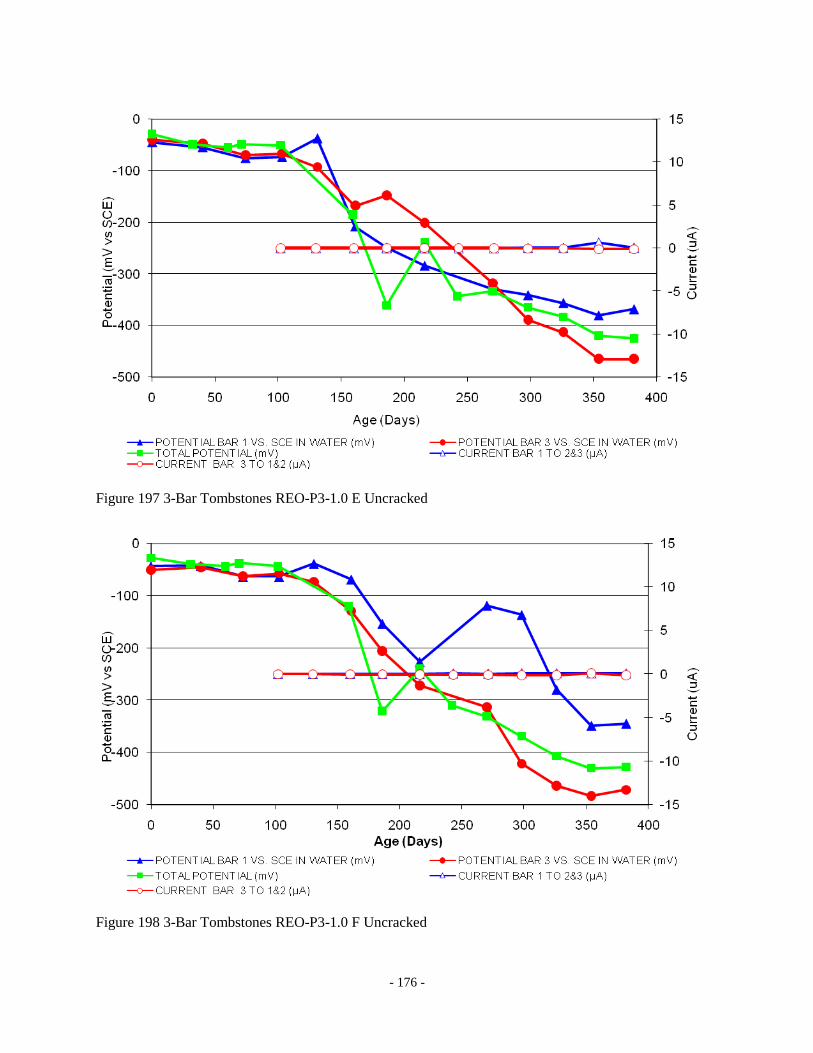
- 176 -
Figure 197 3-Bar Tombstones REO-P3-1.0 E Uncracked
Figure 198 3-Bar Tombstones REO-P3-1.0 F Uncracked

- 177 -
Figure 199 3-Bar Tombstones CTRL-P4-1.0 A Uncracked
Figure 200 3-Bar Tombstones CTRL-P4-1.0 B Uncracked
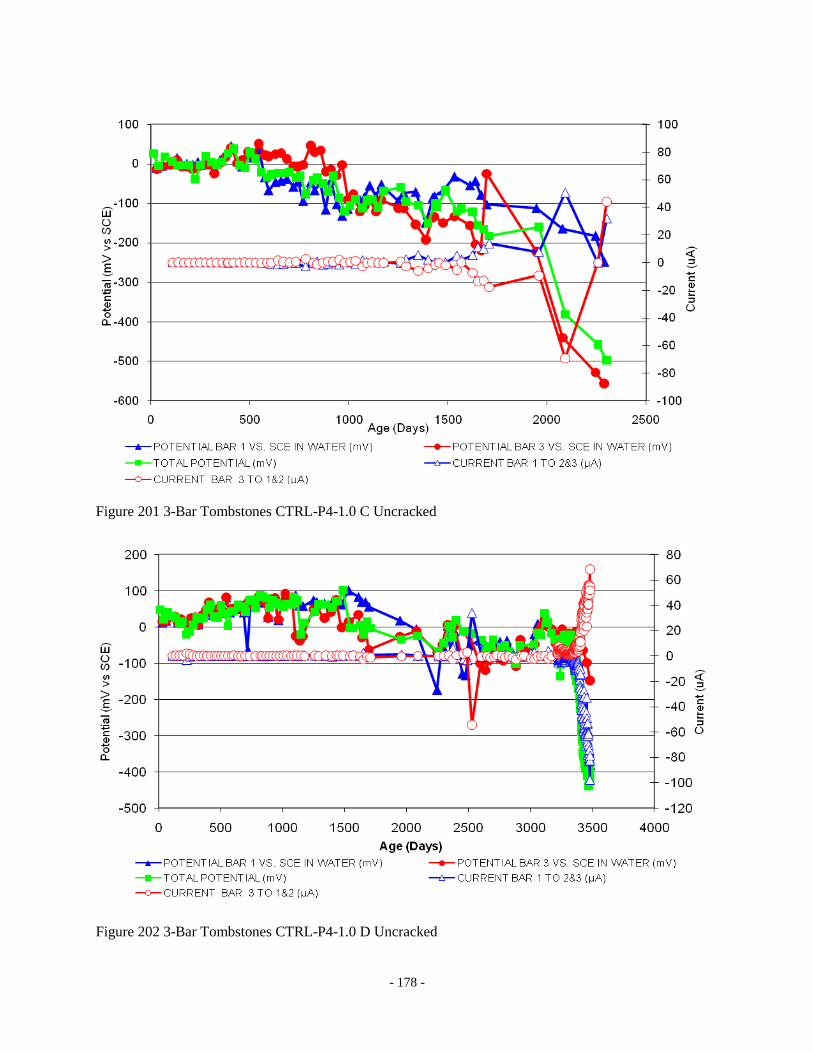
- 178 -
Figure 201 3-Bar Tombstones CTRL-P4-1.0 C Uncracked
Figure 202 3-Bar Tombstones CTRL-P4-1.0 D Uncracked

- 179 -
Figure 203 3-Bar Tombstones CTRL-P4-1.0 E Uncracked
Figure 204 3-Bar Tombstones CTRL-P4-1.0 F Uncracked
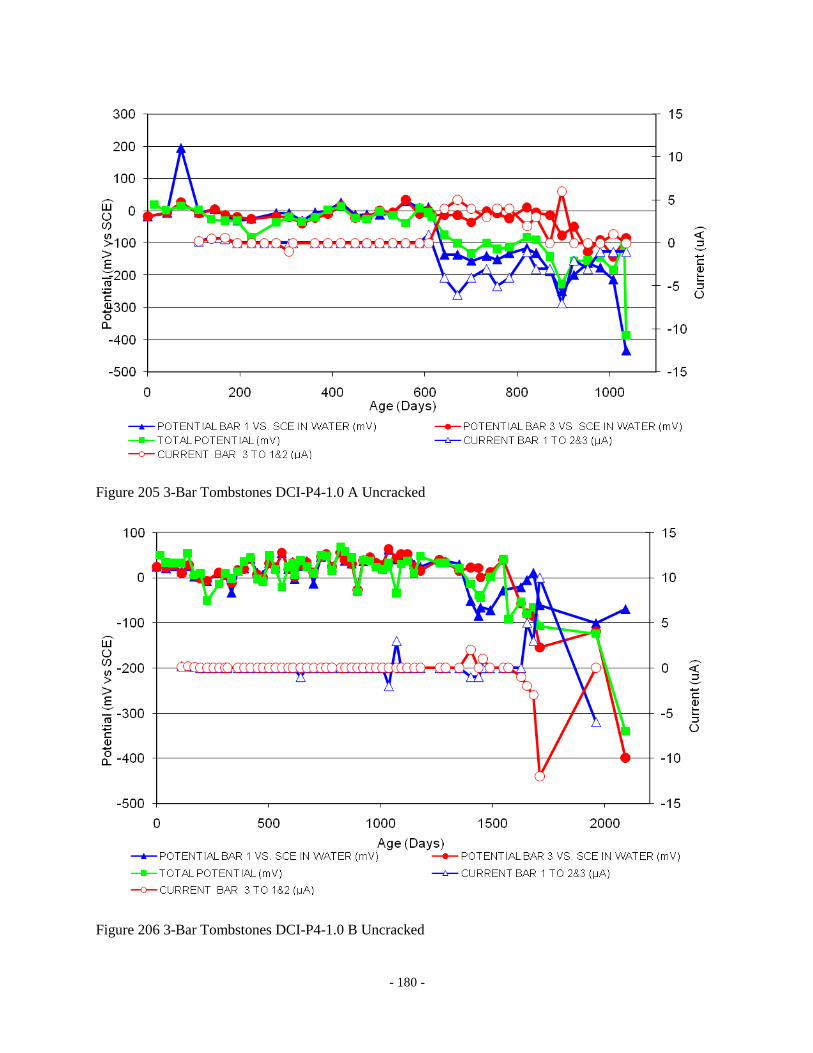
- 180 -
Figure 205 3-Bar Tombstones DCI-P4-1.0 A Uncracked
Figure 206 3-Bar Tombstones DCI-P4-1.0 B Uncracked
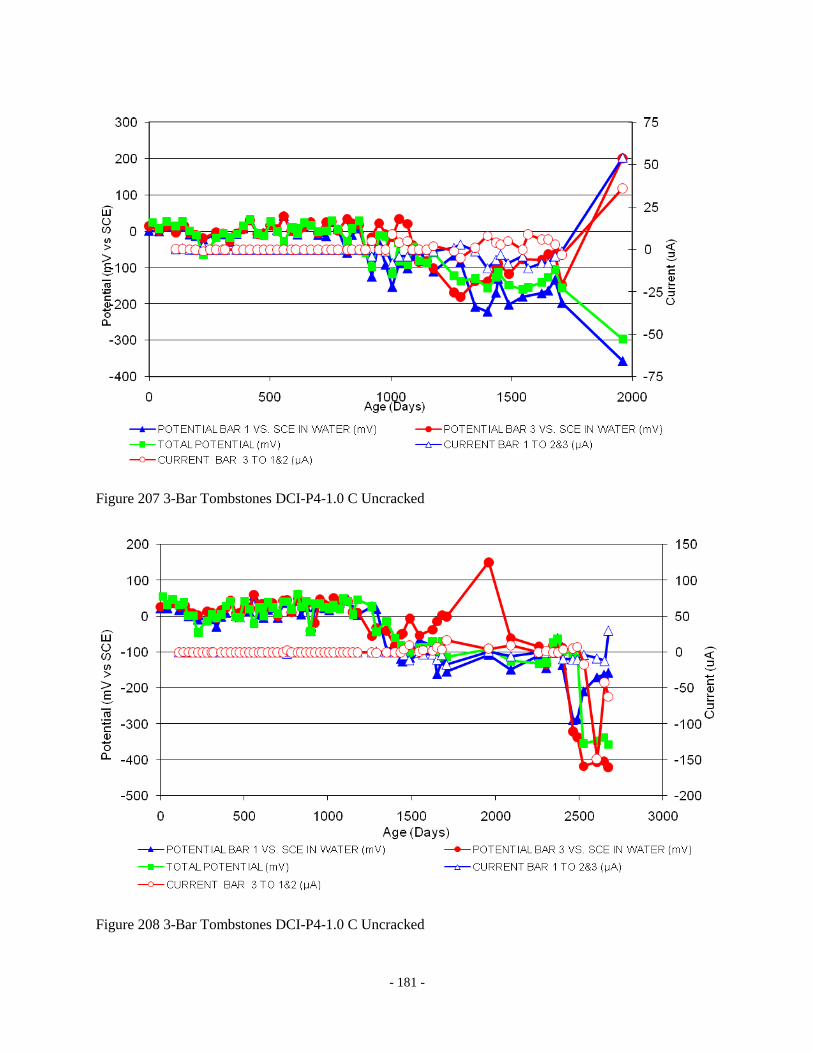
- 181 -
Figure 207 3-Bar Tombstones DCI-P4-1.0 C Uncracked
Figure 208 3-Bar Tombstones DCI-P4-1.0 C Uncracked
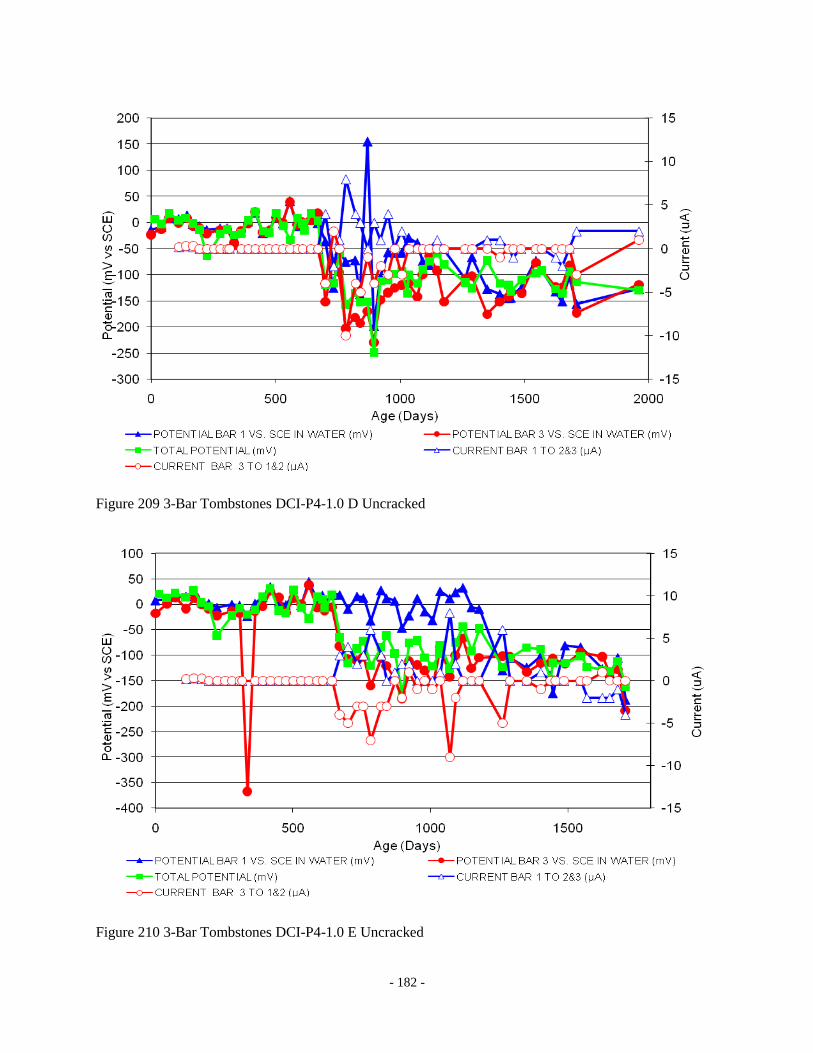
- 182 -
Figure 209 3-Bar Tombstones DCI-P4-1.0 D Uncracked
Figure 210 3-Bar Tombstones DCI-P4-1.0 E Uncracked

- 183 -
Figure 211 3-Bar Tombstones FER-P4-1.0 A Uncracked
Figure 212 3-Bar Tombstones FER-P4-1.0 B Uncracked
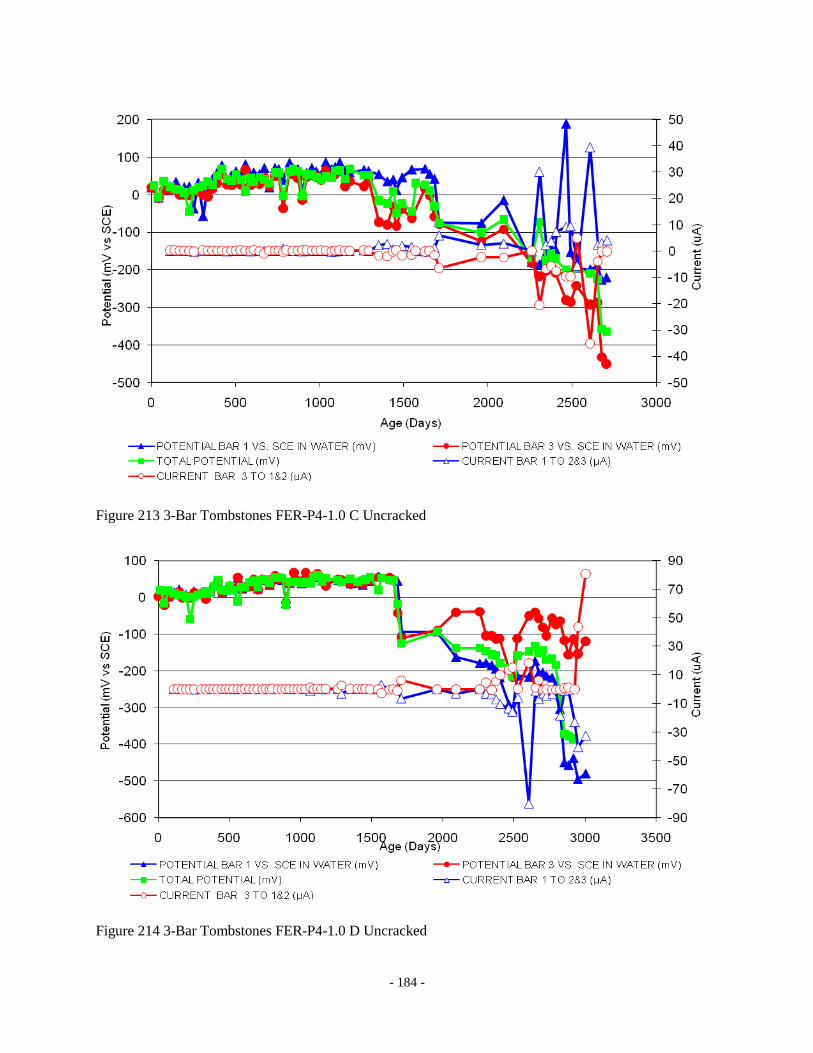
- 184 -
Figure 213 3-Bar Tombstones FER-P4-1.0 C Uncracked
Figure 214 3-Bar Tombstones FER-P4-1.0 D Uncracked
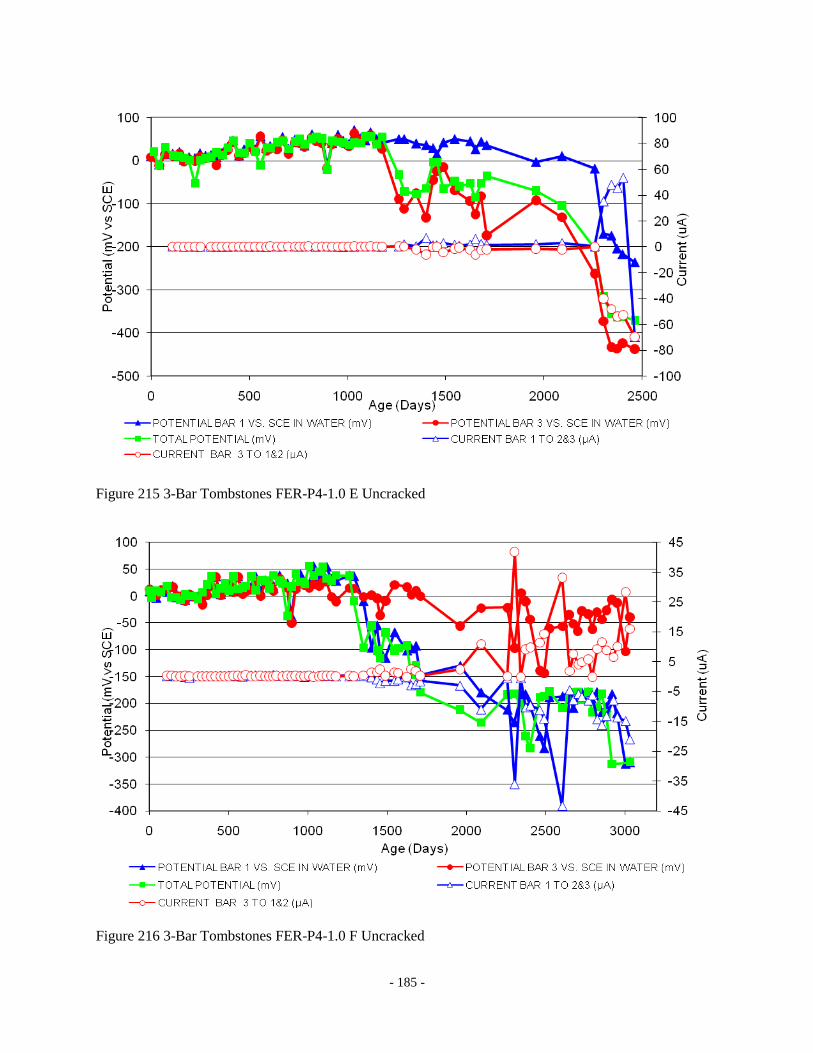
- 185 -
Figure 215 3-Bar Tombstones FER-P4-1.0 E Uncracked
Figure 216 3-Bar Tombstones FER-P4-1.0 F Uncracked

- 186 -
Figure 217 3-Bar Tombstones REO-P4-1.0 A Uncracked
Figure 218 3-Bar Tombstones REO-P4-1.0 B Uncracked
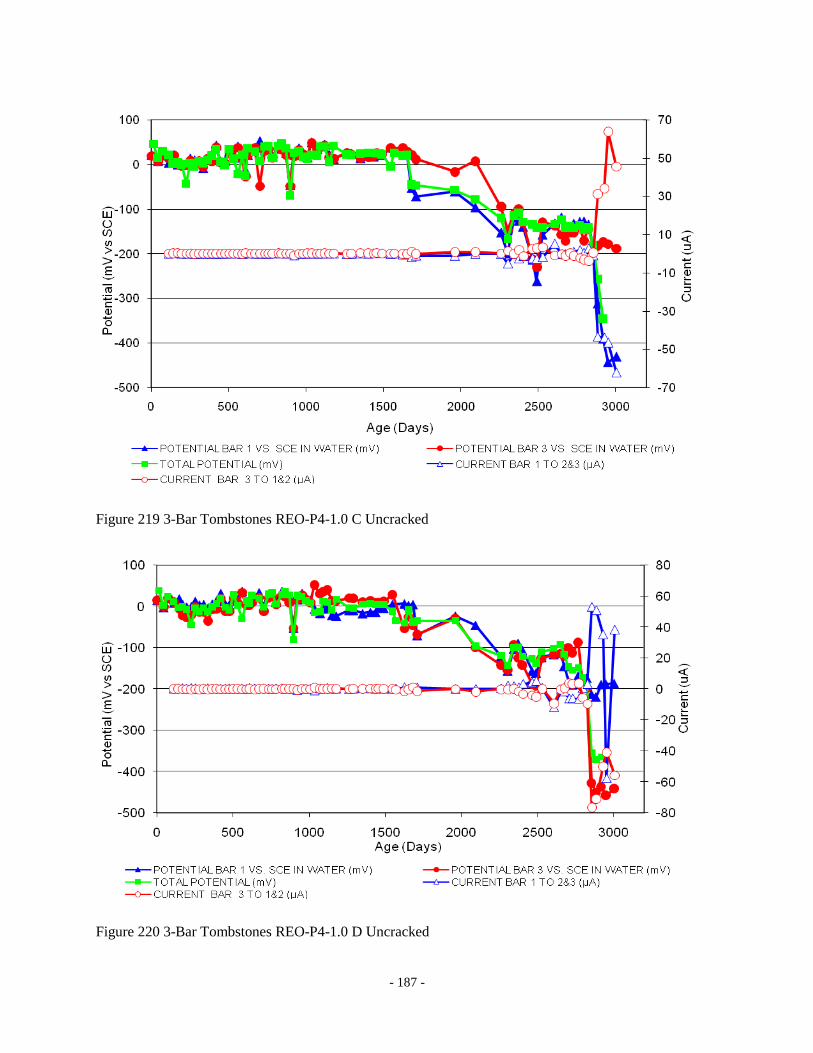
- 187 -
Figure 219 3-Bar Tombstones REO-P4-1.0 C Uncracked
Figure 220 3-Bar Tombstones REO-P4-1.0 D Uncracked
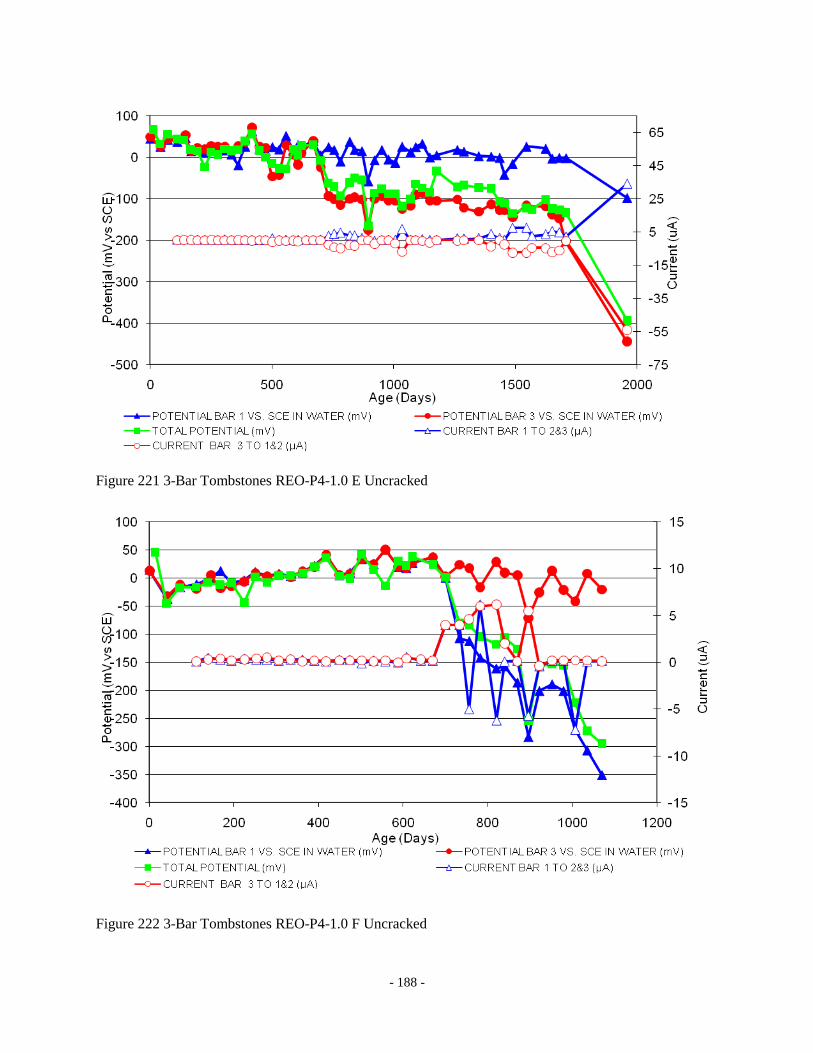
- 188 -
Figure 221 3-Bar Tombstones REO-P4-1.0 E Uncracked
Figure 222 3-Bar Tombstones REO-P4-1.0 F Uncracked

- 189 -
Appendix 1-C
Three-bar Tombstone Specimen Electrochemical Graphs
Bar 1 & 3 Potentials Uncracked

- 190 -
Figure 1 3-Bar Tombstones DCI-C1-0.5 A Uncracked
Figure 2 3-Bar Tombstones DCI-C1-0.5 B Uncracked
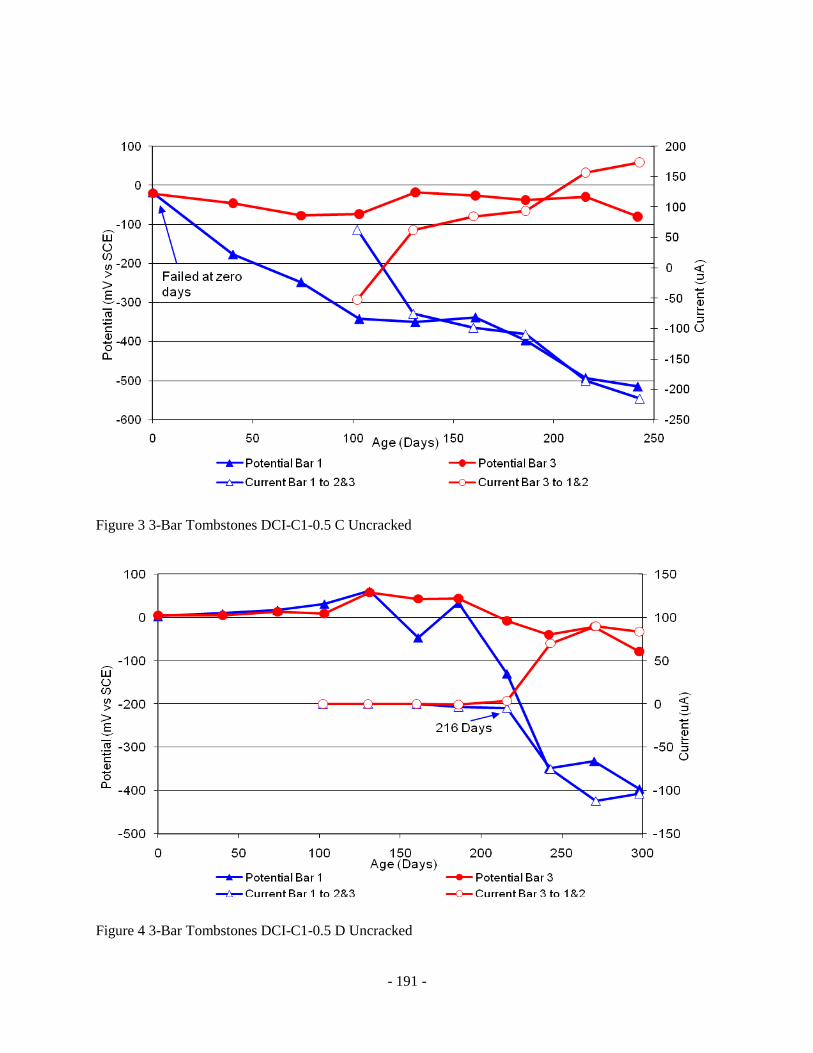
- 191 -
Figure 3 3-Bar Tombstones DCI-C1-0.5 C Uncracked
Figure 4 3-Bar Tombstones DCI-C1-0.5 D Uncracked

- 192 -
Figure 5 3-Bar Tombstones DCI-C1-0.5 E Uncracked
Figure 6 3-Bar Tombstones DCI-C1-0.5 F Uncracked

- 193 -
Figure 7 3-Bar Tombstones FER-C1-0.5 A Uncracked
Figure 8 3-Bar Tombstones FER-C1-0.5 B Uncracked

- 194 -
Figure 9 3-Bar Tombstones FER-C1-0.5 C Uncracked
Figure 10 3-Bar Tombstones FER-C1-0.5 D Uncracked

- 195 -
Figure 11 3-Bar Tombstones FER-C1-0.5 E Uncracked
Figure 12 3-Bar Tombstones FER-C1-0.5 F Uncracked
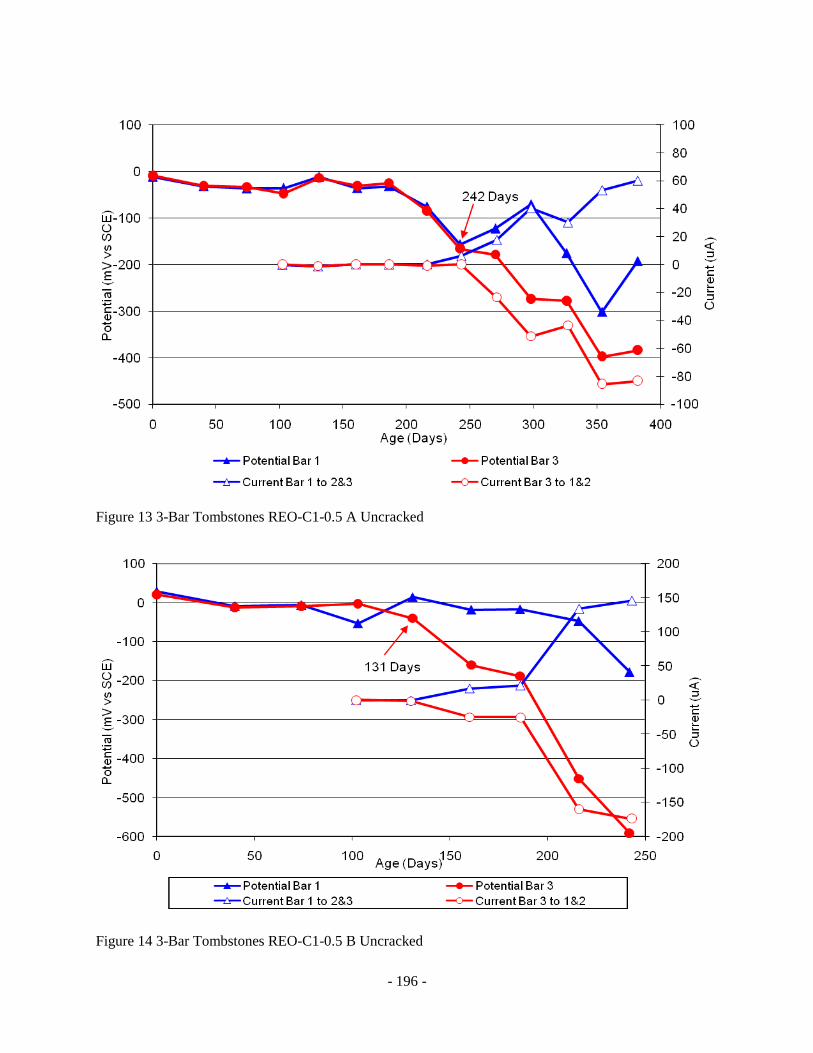
- 196 -
Figure 13 3-Bar Tombstones REO-C1-0.5 A Uncracked
Figure 14 3-Bar Tombstones REO-C1-0.5 B Uncracked
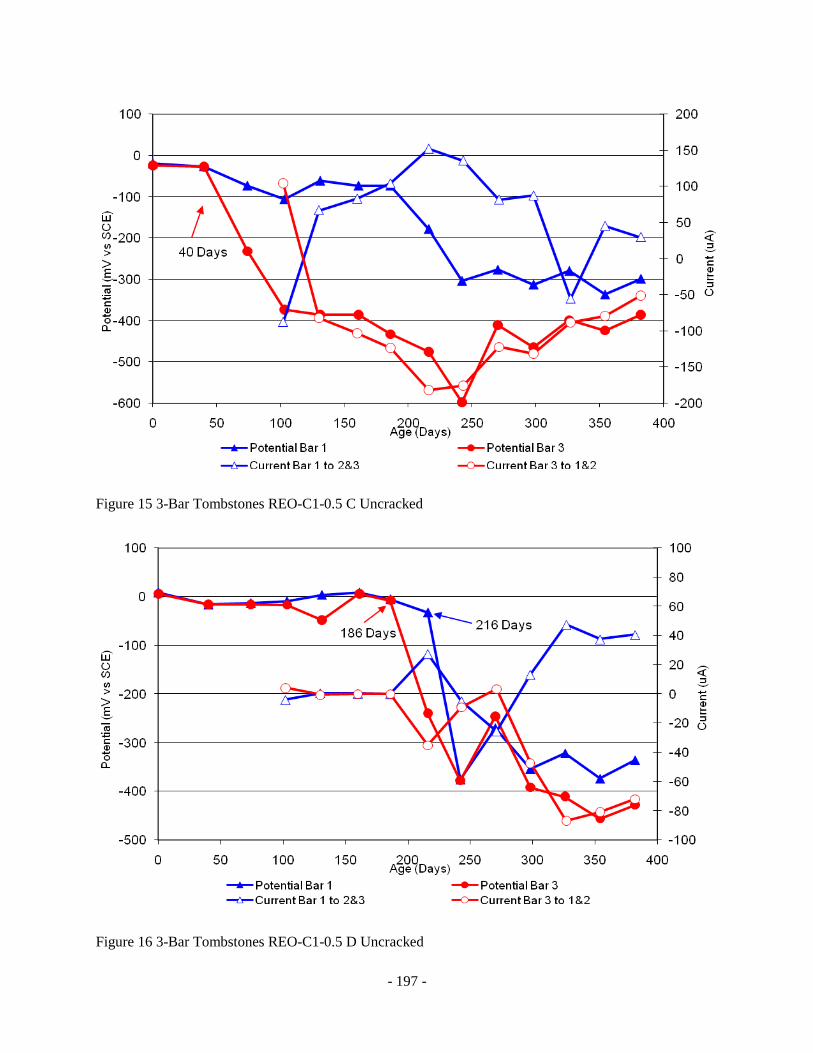
- 197 -
Figure 15 3-Bar Tombstones REO-C1-0.5 C Uncracked
Figure 16 3-Bar Tombstones REO-C1-0.5 D Uncracked
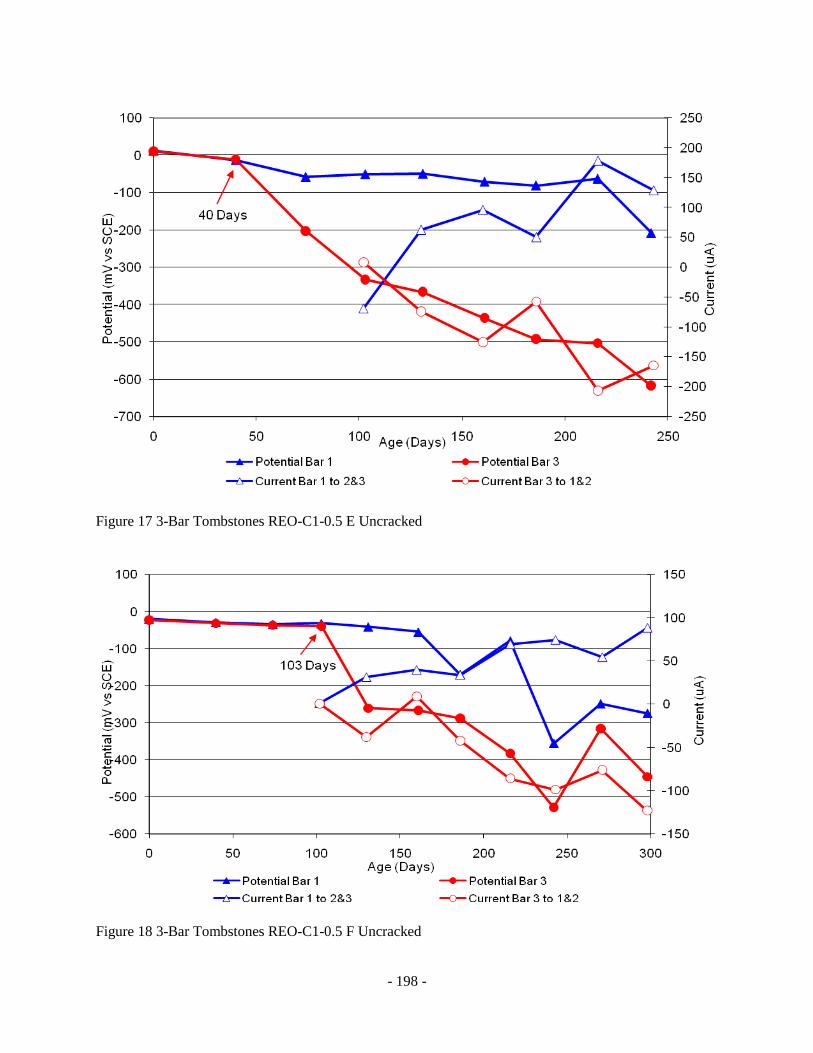
- 198 -
Figure 17 3-Bar Tombstones REO-C1-0.5 E Uncracked
Figure 18 3-Bar Tombstones REO-C1-0.5 F Uncracked

- 199 -
Figure 19 3-Bar Tombstones CTRL-C1-1.0 A Uncracked
Figure 20 3-Bar Tombstones CTRL-C1-1.0 B Uncracked

- 200 -
Figure 21 3-Bar Tombstones CTRL-C1-1.0 C Uncracked
Figure 22 3-Bar Tombstones CTRL-C1-1.0 D Uncracked
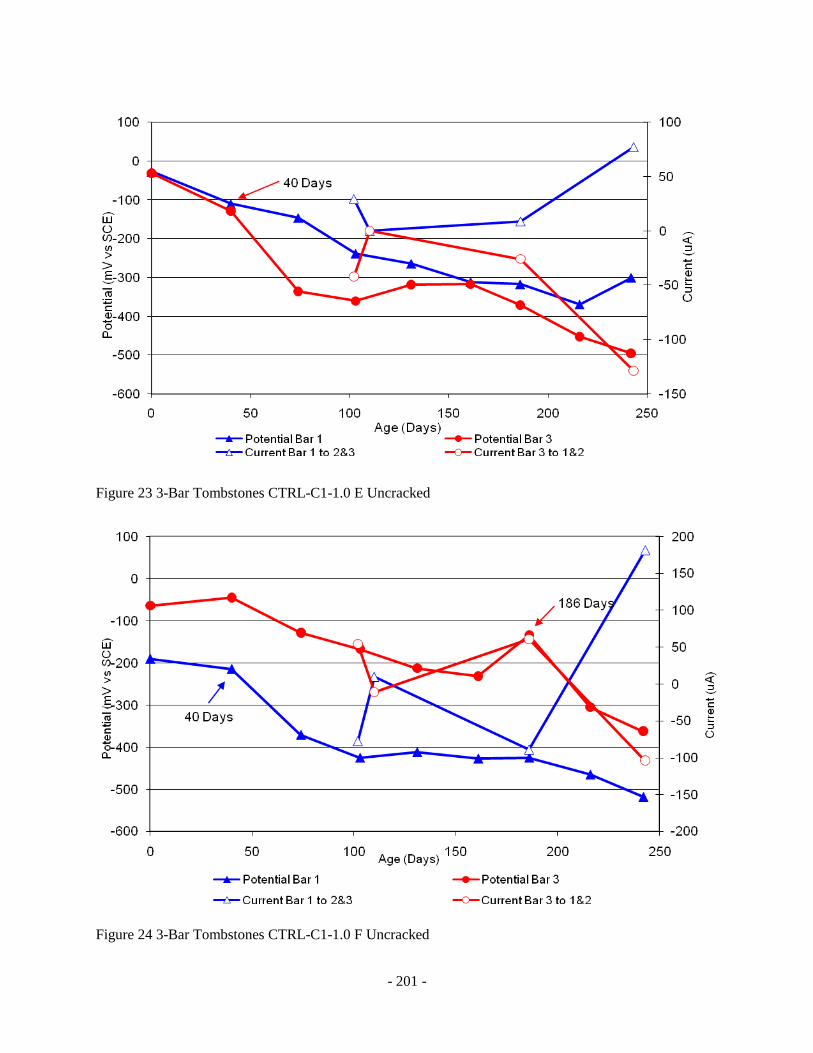
- 201 -
Figure 23 3-Bar Tombstones CTRL-C1-1.0 E Uncracked
Figure 24 3-Bar Tombstones CTRL-C1-1.0 F Uncracked
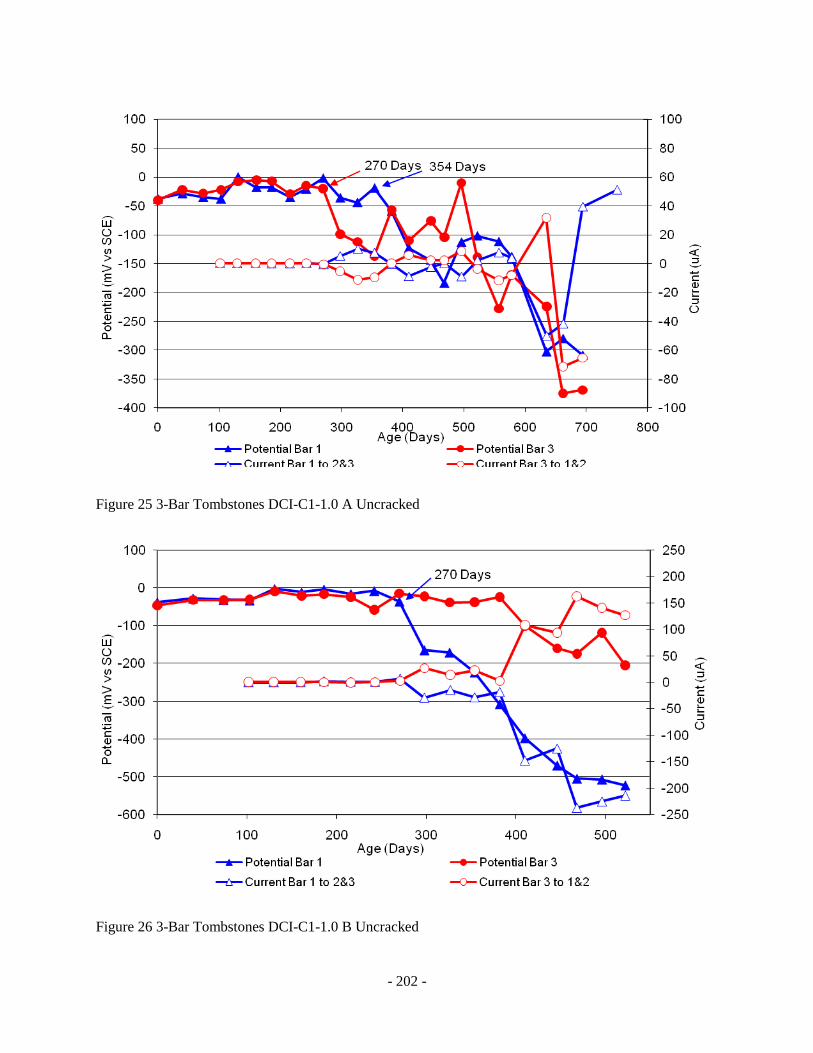
- 202 -
Figure 25 3-Bar Tombstones DCI-C1-1.0 A Uncracked
Figure 26 3-Bar Tombstones DCI-C1-1.0 B Uncracked
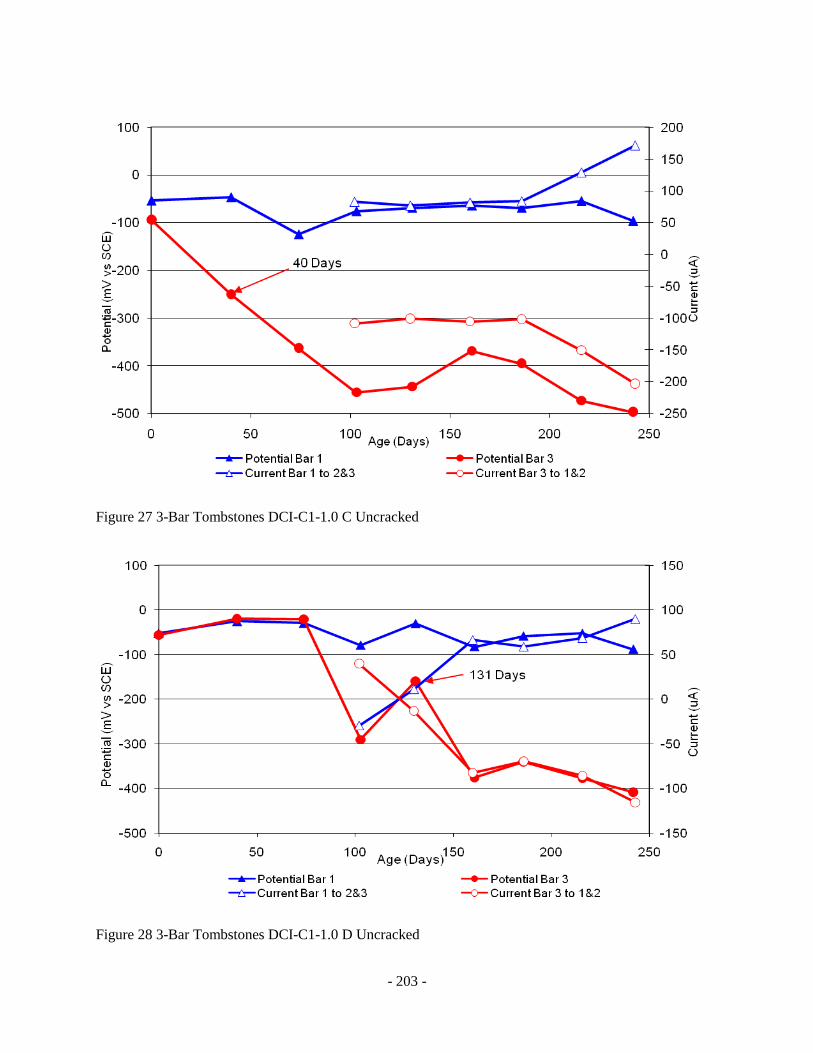
- 203 -
Figure 27 3-Bar Tombstones DCI-C1-1.0 C Uncracked
Figure 28 3-Bar Tombstones DCI-C1-1.0 D Uncracked
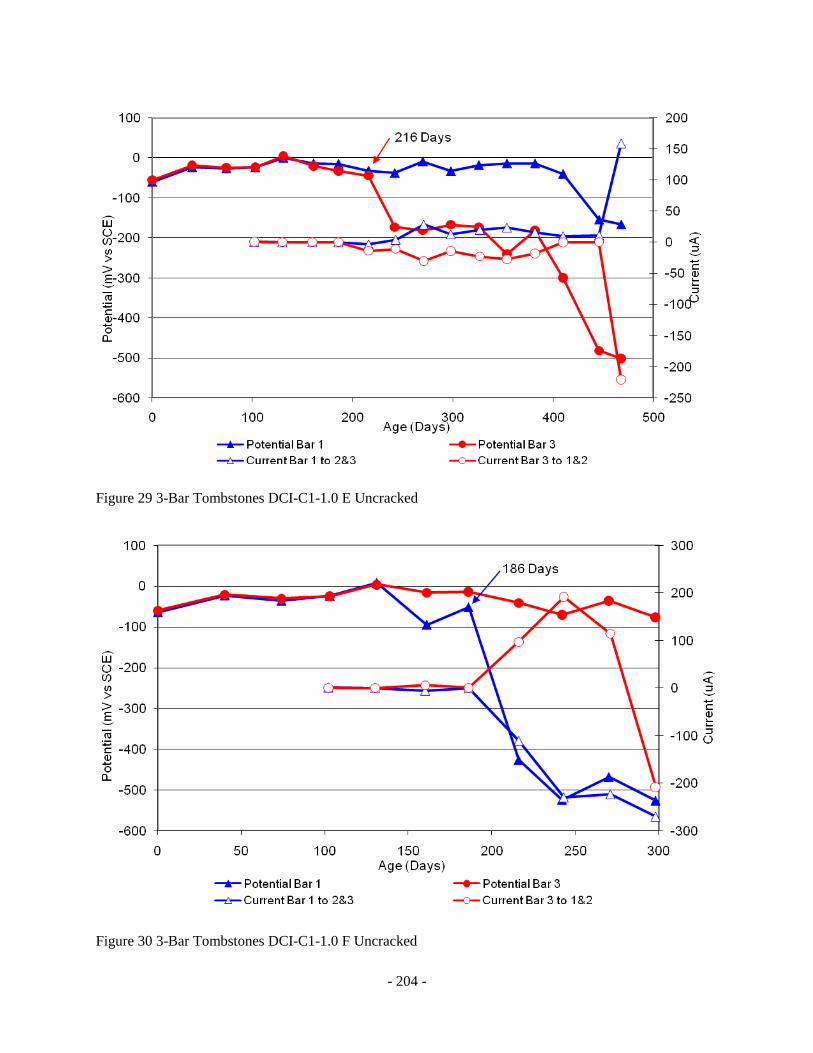
- 204 -
Figure 29 3-Bar Tombstones DCI-C1-1.0 E Uncracked
Figure 30 3-Bar Tombstones DCI-C1-1.0 F Uncracked
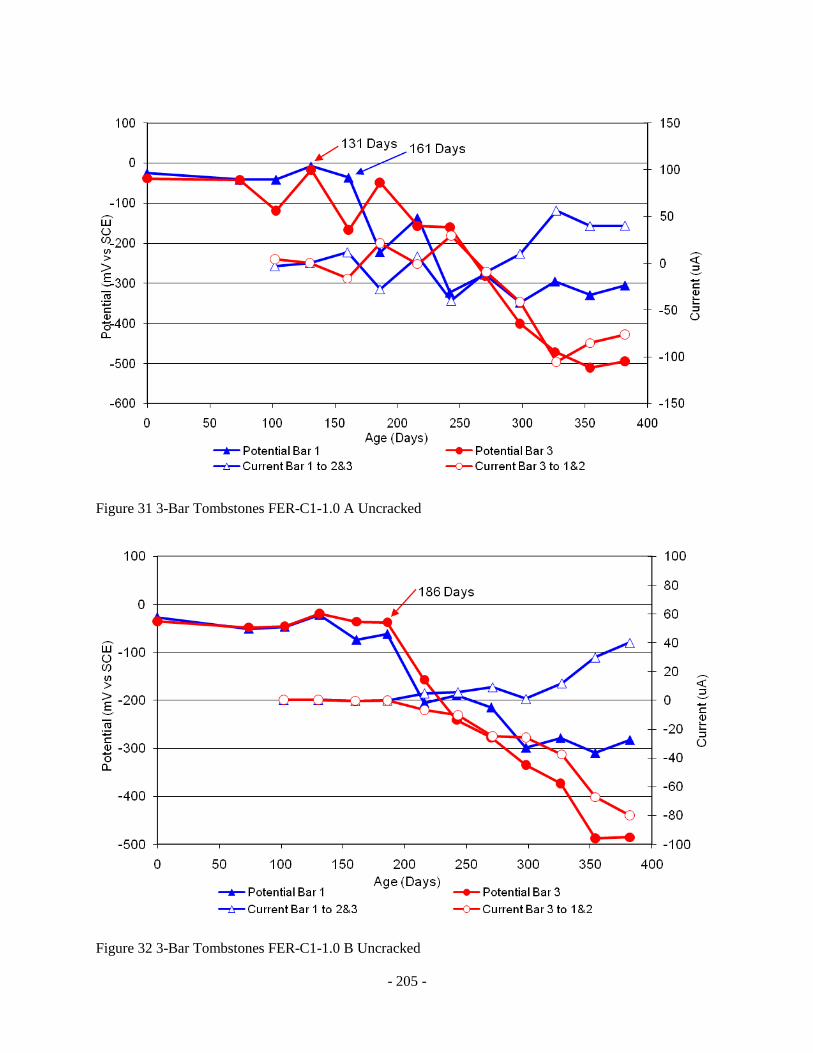
- 205 -
Figure 31 3-Bar Tombstones FER-C1-1.0 A Uncracked
Figure 32 3-Bar Tombstones FER-C1-1.0 B Uncracked

- 206 -
Figure 33 3-Bar Tombstones FER-C1-1.0 C Uncracked
Figure 34 3-Bar Tombstones FER-C1-1.0 D Uncracked
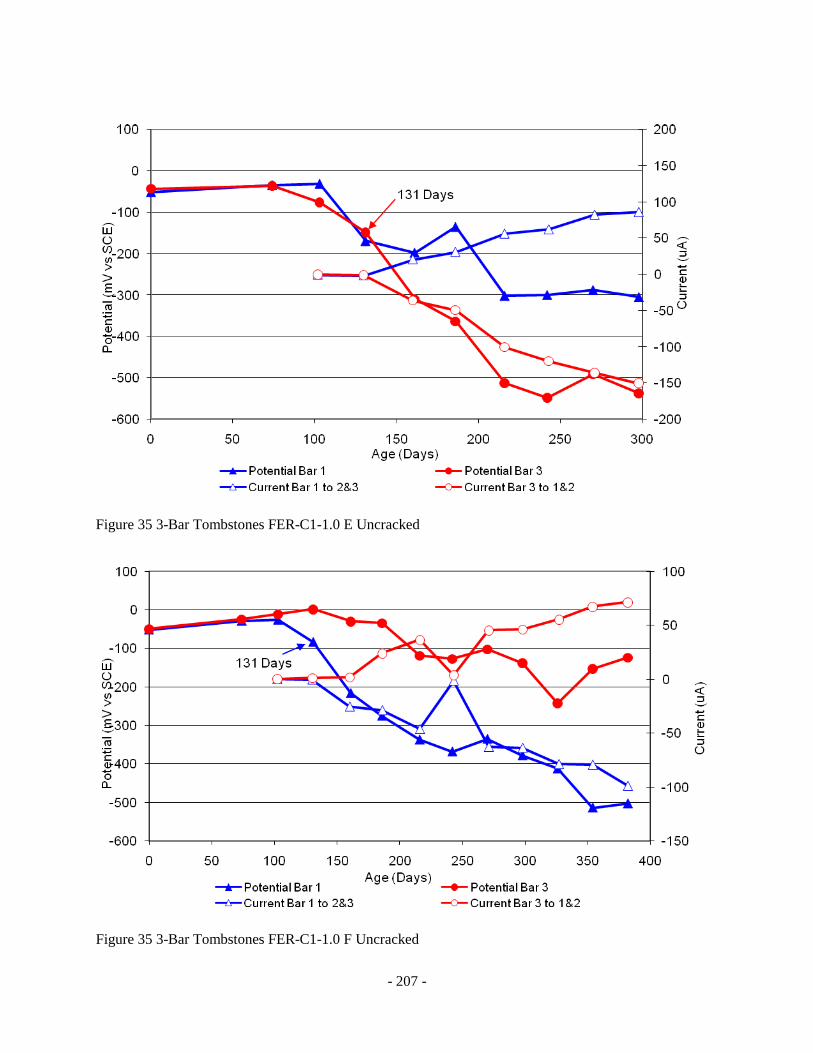
- 207 -
Figure 35 3-Bar Tombstones FER-C1-1.0 E Uncracked
Figure 35 3-Bar Tombstones FER-C1-1.0 F Uncracked
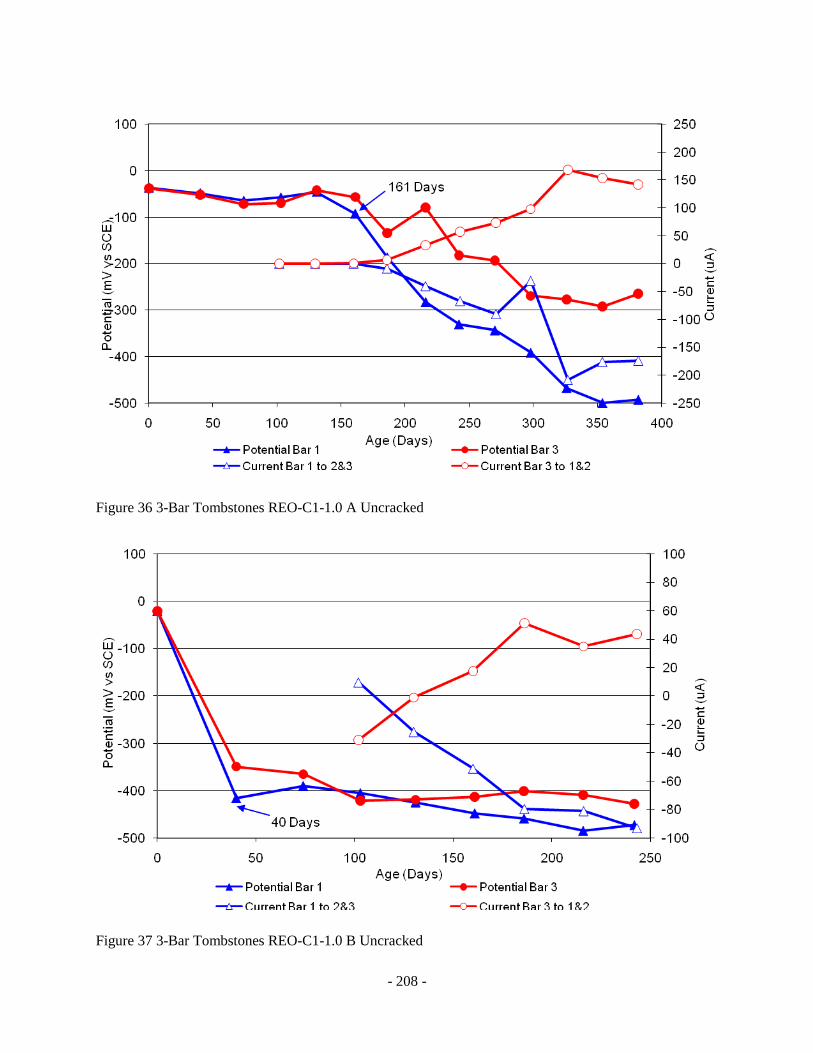
- 208 -
Figure 36 3-Bar Tombstones REO-C1-1.0 A Uncracked
Figure 37 3-Bar Tombstones REO-C1-1.0 B Uncracked
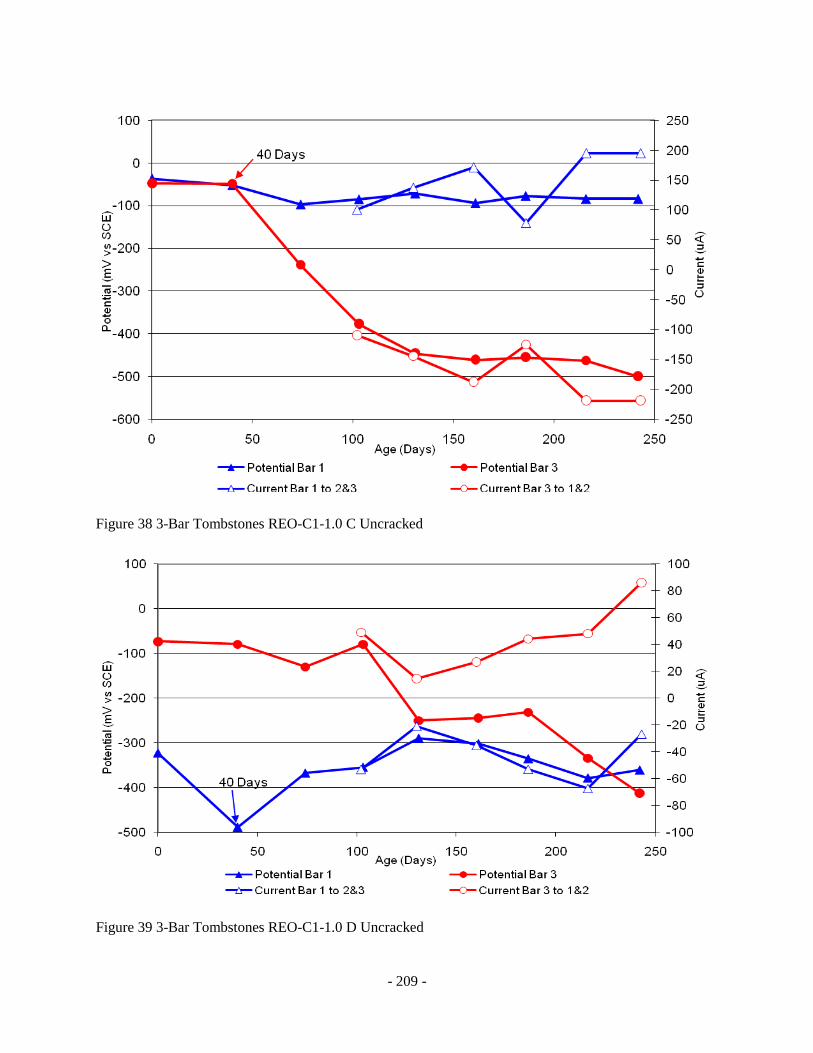
- 209 -
Figure 38 3-Bar Tombstones REO-C1-1.0 C Uncracked
Figure 39 3-Bar Tombstones REO-C1-1.0 D Uncracked
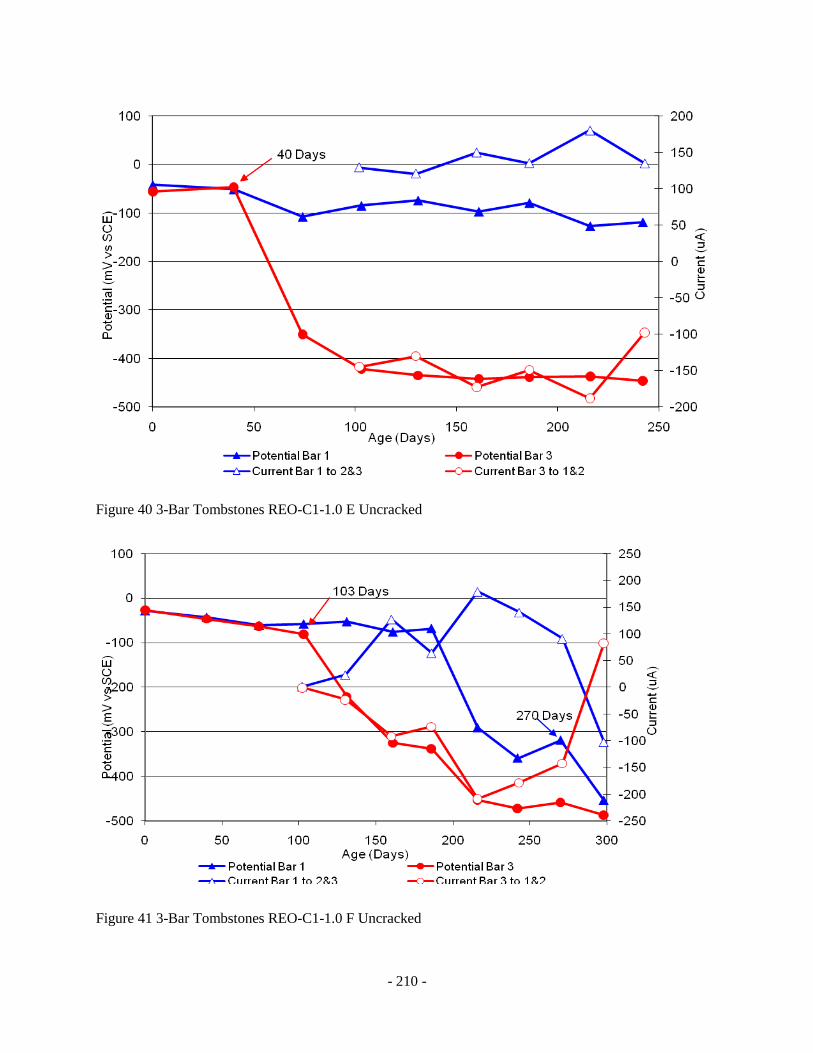
- 210 -
Figure 40 3-Bar Tombstones REO-C1-1.0 E Uncracked
Figure 41 3-Bar Tombstones REO-C1-1.0 F Uncracked

- 211 -
Figure 42 3-Bar Tombstones CTRL-C2-1.0 A Uncracked
Figure 43 3-Bar Tombstones CTRL-C2-1.0 B Uncracked
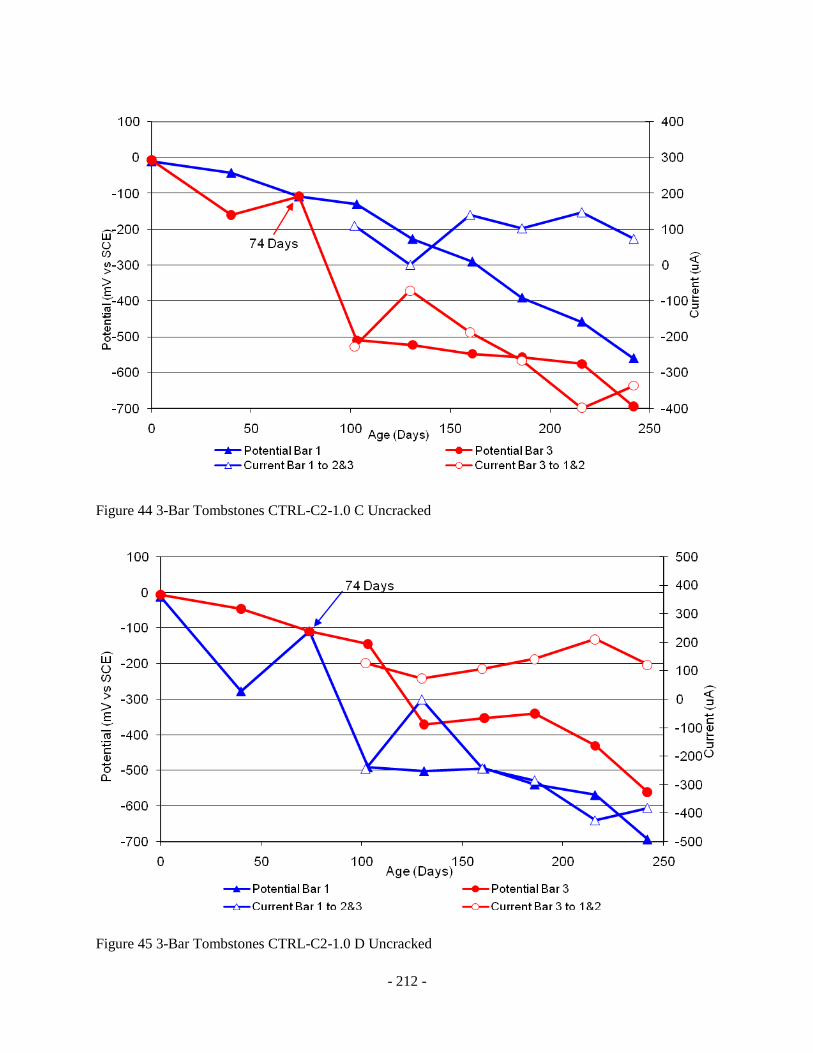
- 212 -
Figure 44 3-Bar Tombstones CTRL-C2-1.0 C Uncracked
Figure 45 3-Bar Tombstones CTRL-C2-1.0 D Uncracked
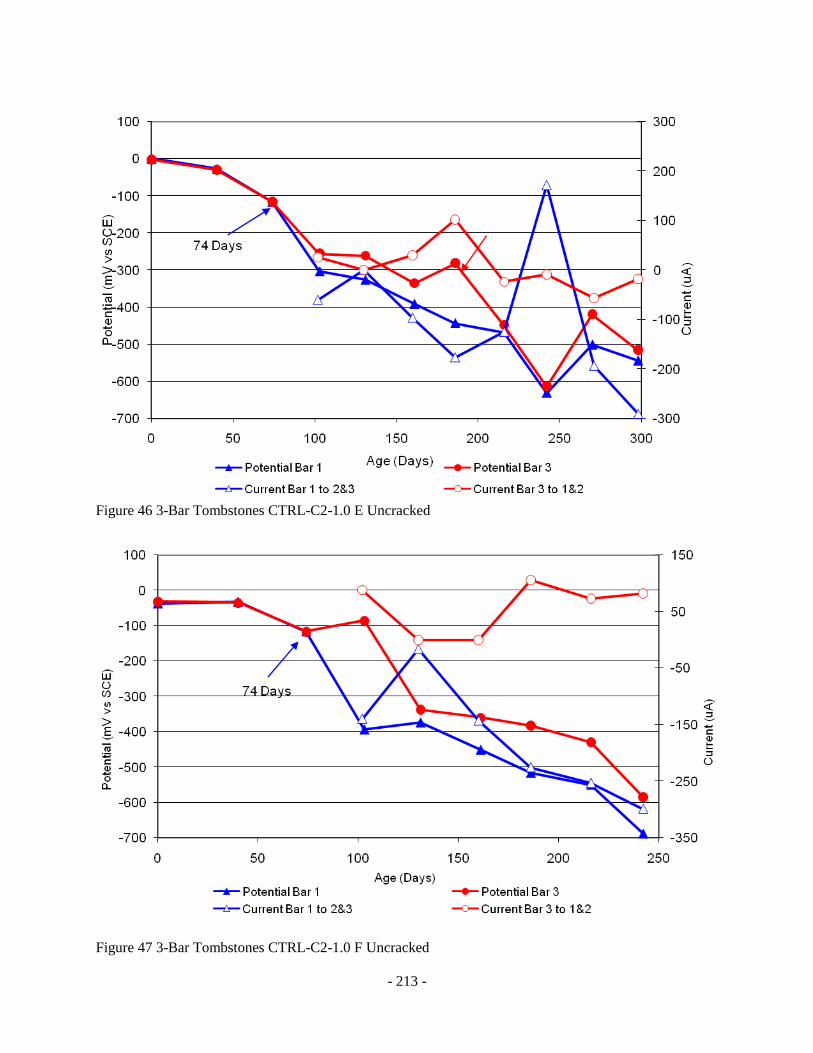
- 213 -
Figure 46 3-Bar Tombstones CTRL-C2-1.0 E Uncracked
Figure 47 3-Bar Tombstones CTRL-C2-1.0 F Uncracked
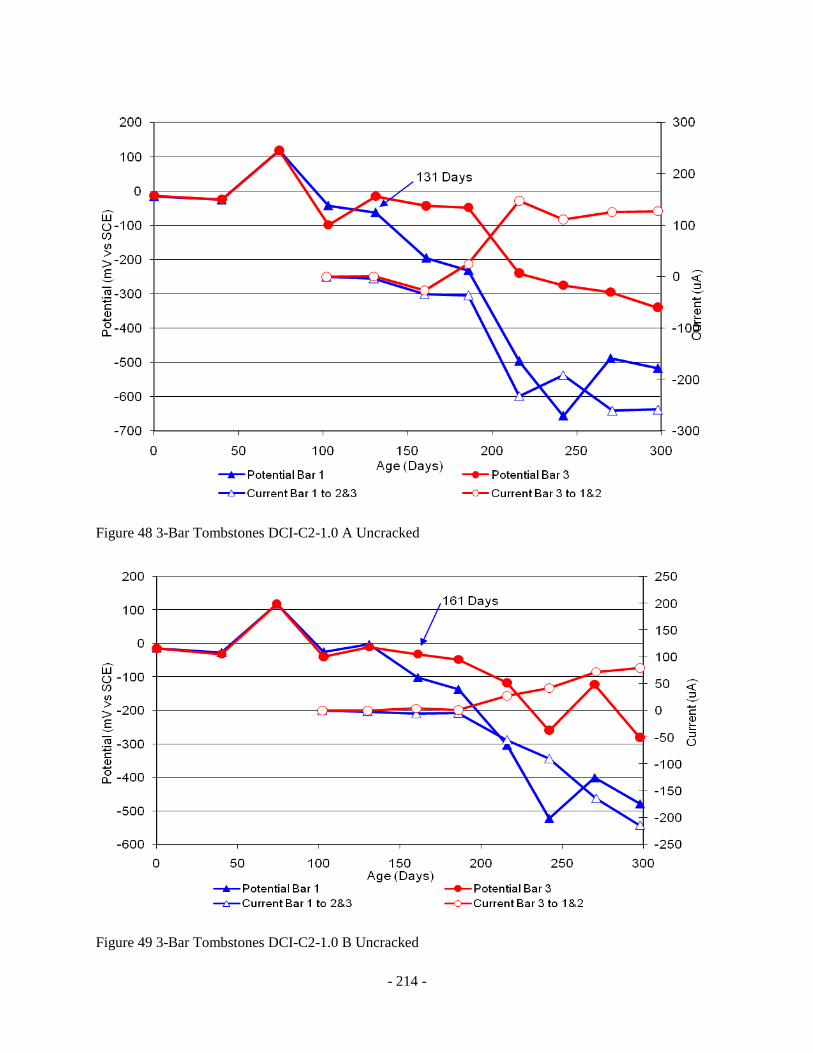
- 214 -
Figure 48 3-Bar Tombstones DCI-C2-1.0 A Uncracked
Figure 49 3-Bar Tombstones DCI-C2-1.0 B Uncracked

- 215 -
Figure 50 3-Bar Tombstones DCI-C2-1.0 C Uncracked
Figure 51 3-Bar Tombstones DCI-C2-1.0 D Uncracked
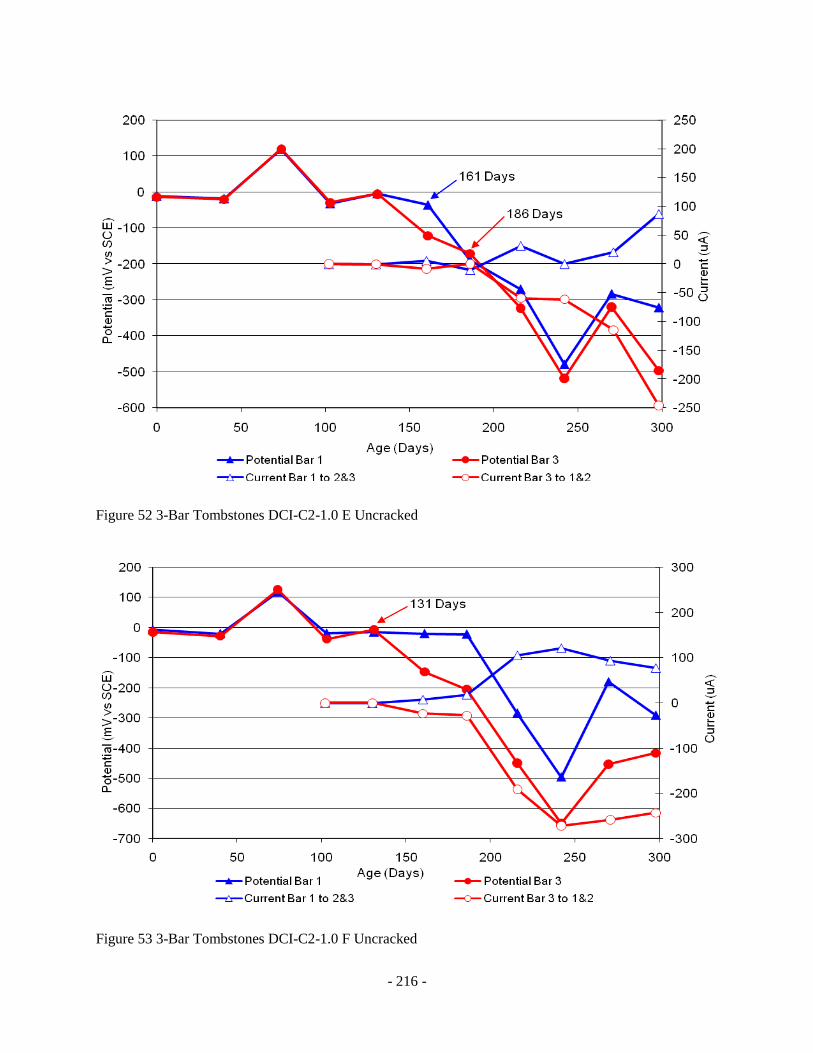
- 216 -
Figure 52 3-Bar Tombstones DCI-C2-1.0 E Uncracked
Figure 53 3-Bar Tombstones DCI-C2-1.0 F Uncracked

- 217 -
Figure 54 3-Bar Tombstones FER-C2-1.0 A Uncracked
Figure 55 3-Bar Tombstones FER-C2-1.0 B Uncracked
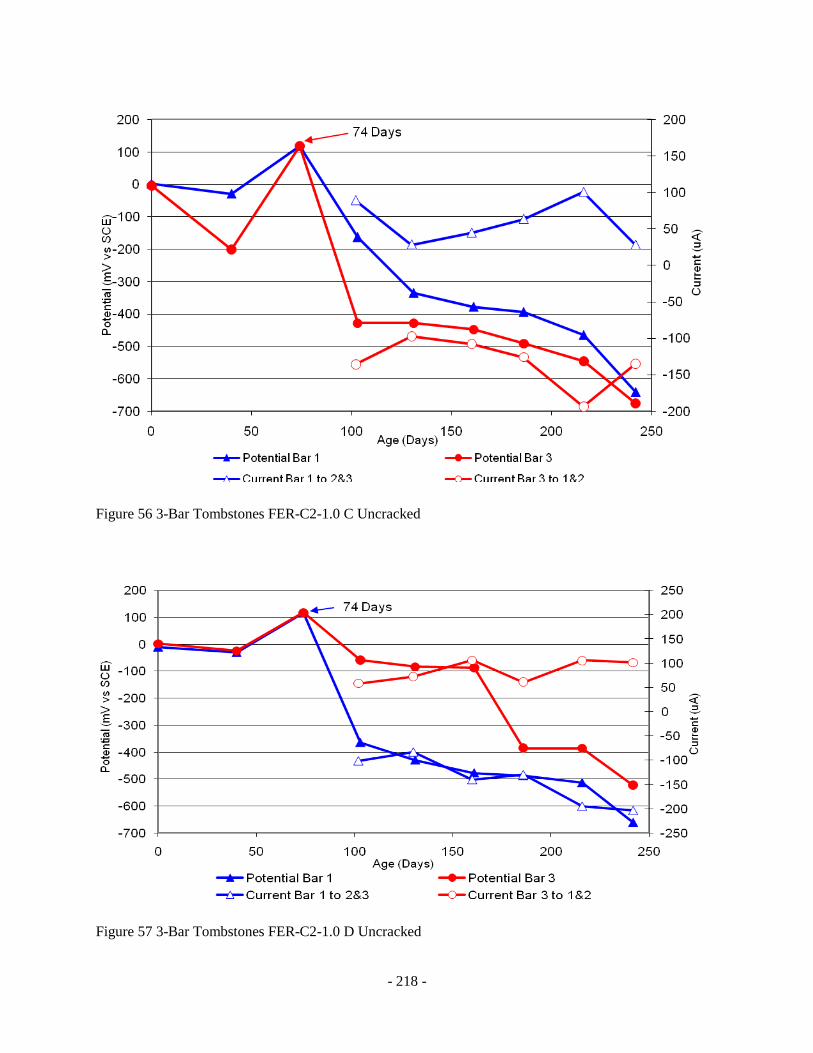
- 218 -
Figure 56 3-Bar Tombstones FER-C2-1.0 C Uncracked
Figure 57 3-Bar Tombstones FER-C2-1.0 D Uncracked
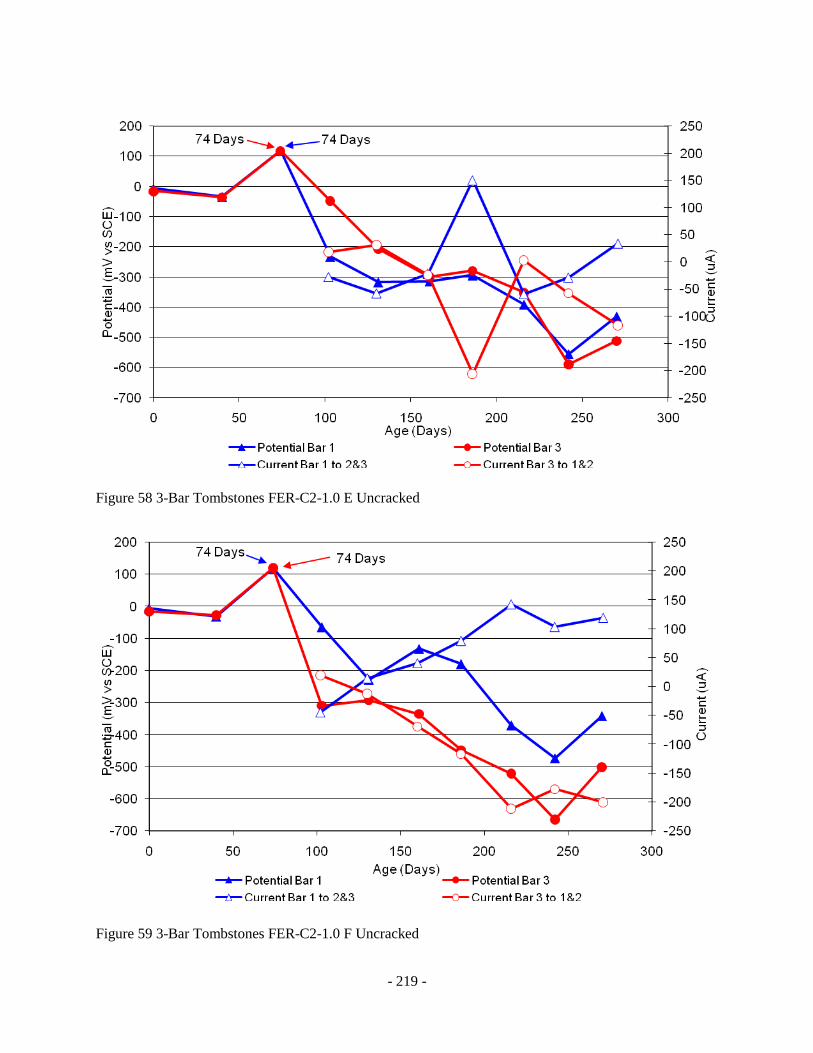
- 219 -
Figure 58 3-Bar Tombstones FER-C2-1.0 E Uncracked
Figure 59 3-Bar Tombstones FER-C2-1.0 F Uncracked
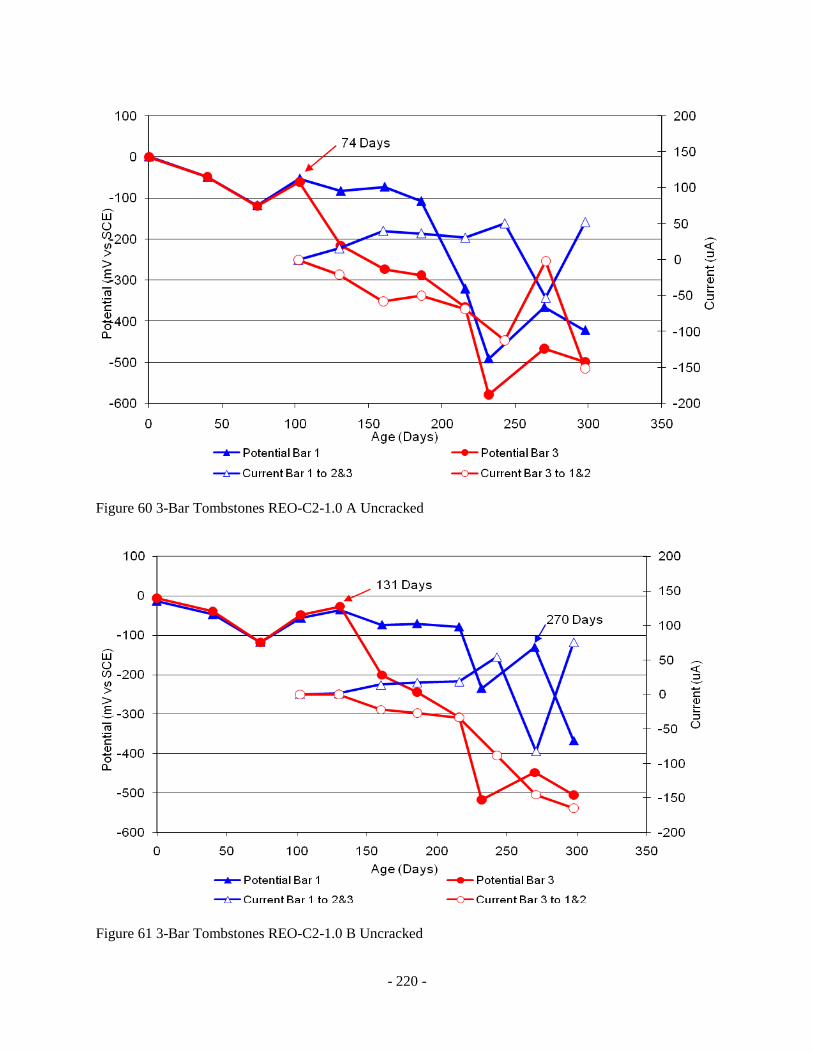
- 220 -
Figure 60 3-Bar Tombstones REO-C2-1.0 A Uncracked
Figure 61 3-Bar Tombstones REO-C2-1.0 B Uncracked

- 221 -
Figure 62 3-Bar Tombstones REO-C2-1.0 C Uncracked
Figure 63 3-Bar Tombstones REO-C2-1.0 D Uncracked

- 222 -
Figure 64 3-Bar Tombstones REO-C2-1.0 E Uncracked
Figure 65 3-Bar Tombstones REO-C2-1.0 F Uncracked
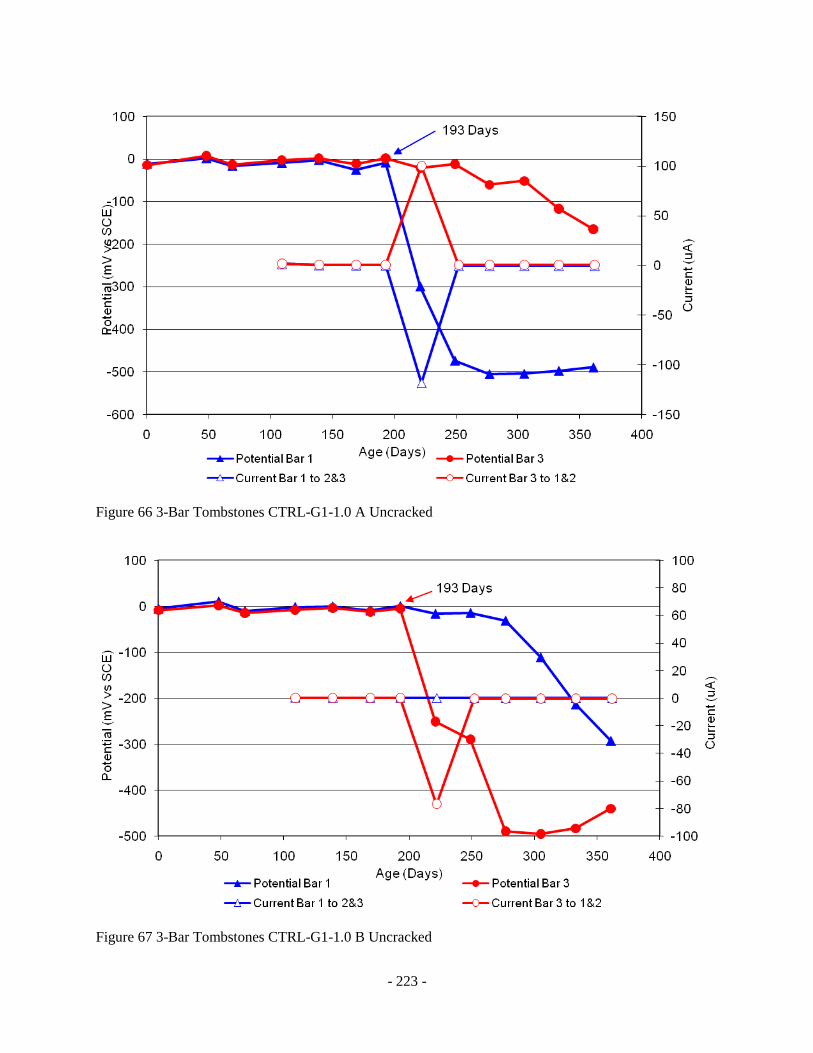
- 223 -
Figure 66 3-Bar Tombstones CTRL-G1-1.0 A Uncracked
Figure 67 3-Bar Tombstones CTRL-G1-1.0 B Uncracked
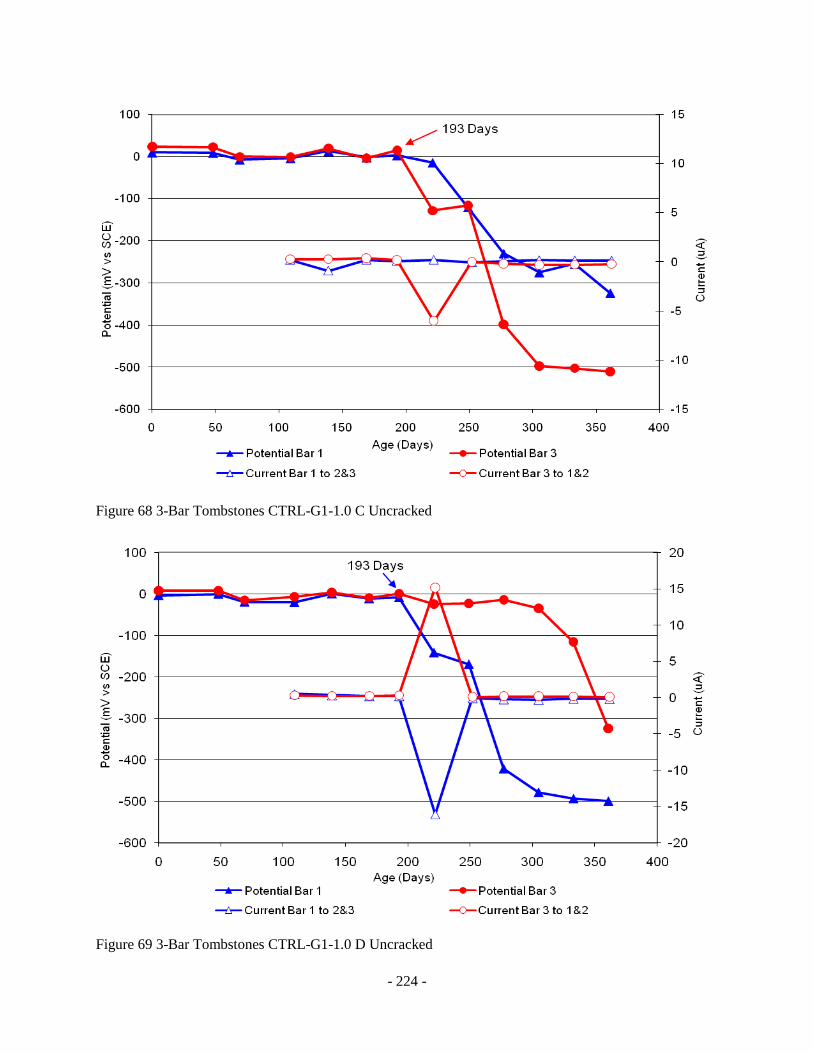
- 224 -
Figure 68 3-Bar Tombstones CTRL-G1-1.0 C Uncracked
Figure 69 3-Bar Tombstones CTRL-G1-1.0 D Uncracked
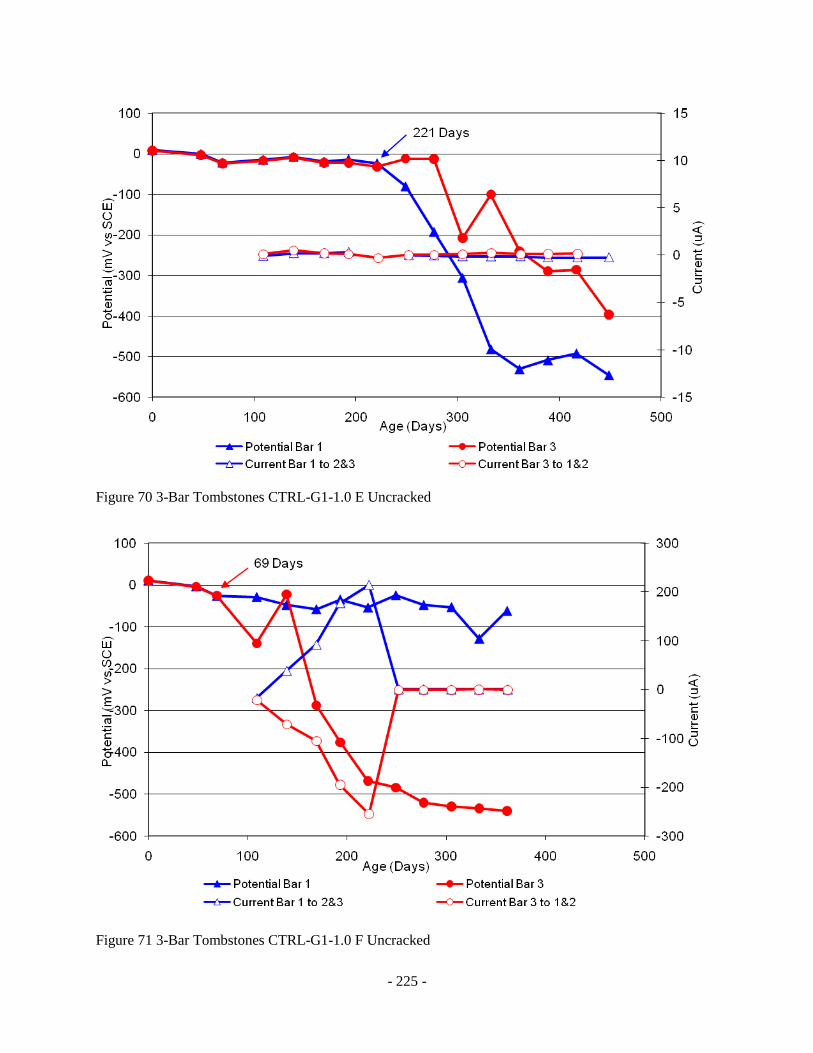
- 225 -
Figure 70 3-Bar Tombstones CTRL-G1-1.0 E Uncracked
Figure 71 3-Bar Tombstones CTRL-G1-1.0 F Uncracked

- 226 -
Figure 72 3-Bar Tombstones DCI-G1-1.0 A Uncracked
Figure 73 3-Bar Tombstones DCI-G1-1.0 B Uncracked

- 227 -
Figure 74 3-Bar Tombstones DCI-G1-1.0 C Uncracked
Figure 75 3-Bar Tombstones DCI-G1-1.0 D Uncracked
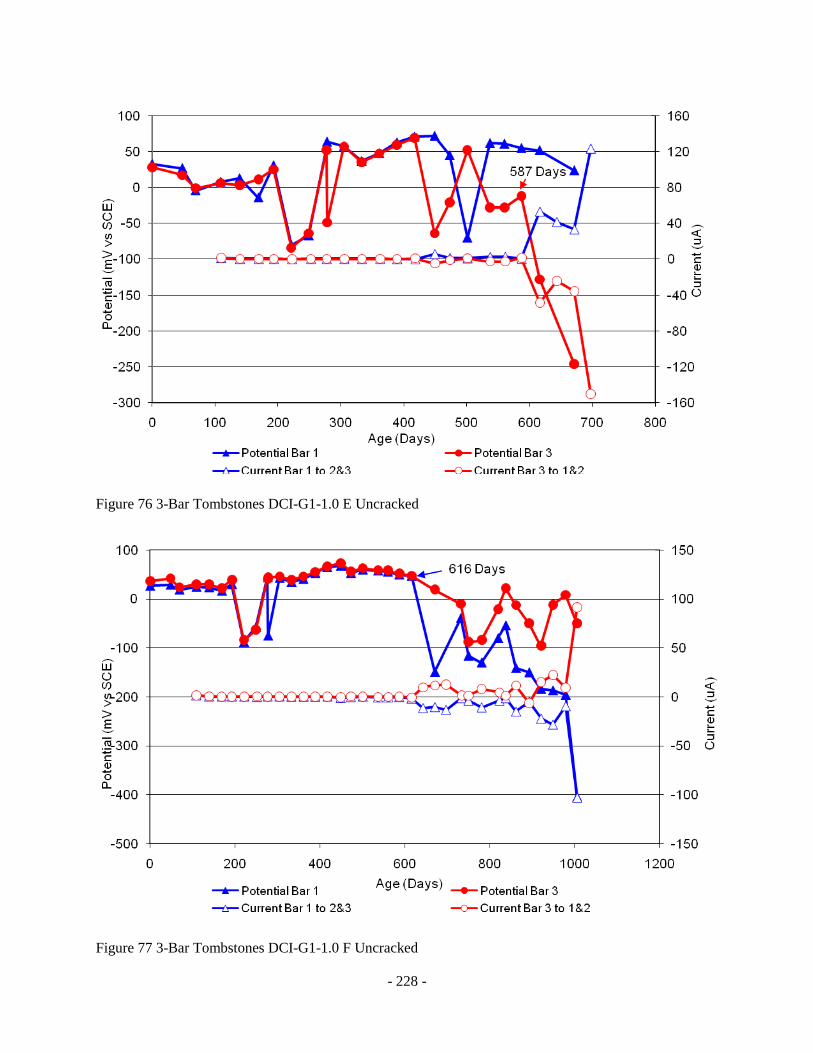
- 228 -
Figure 76 3-Bar Tombstones DCI-G1-1.0 E Uncracked
Figure 77 3-Bar Tombstones DCI-G1-1.0 F Uncracked
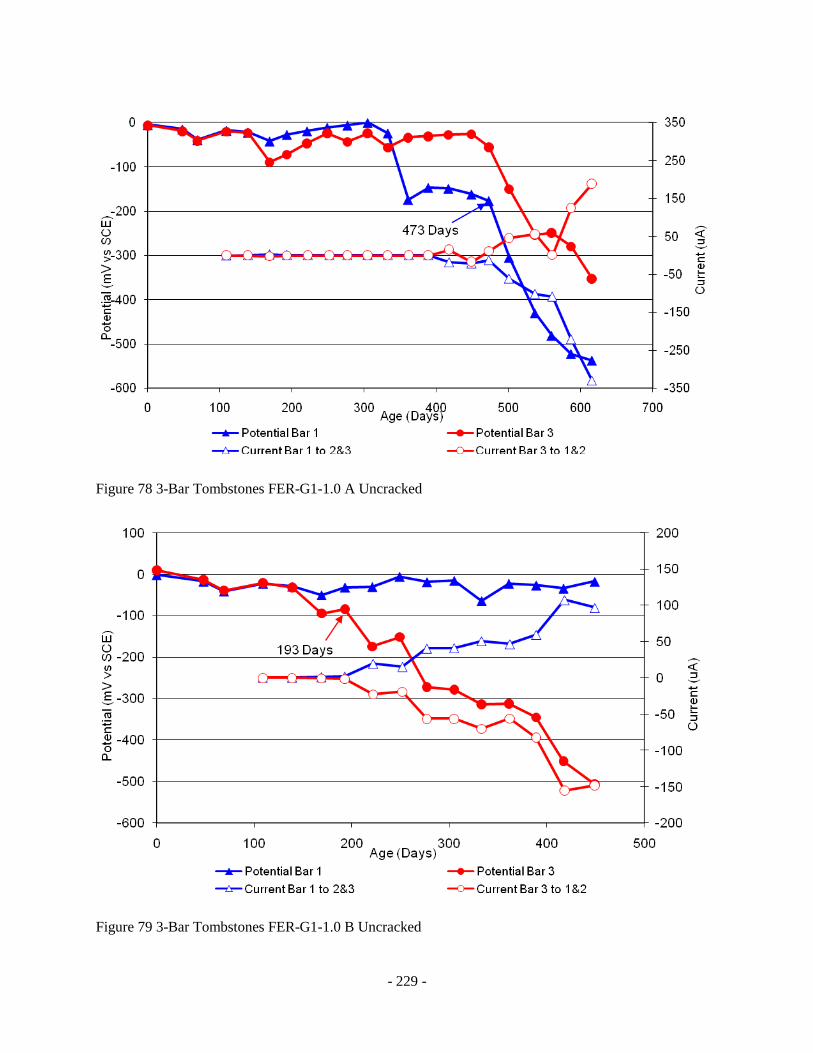
- 229 -
Figure 78 3-Bar Tombstones FER-G1-1.0 A Uncracked
Figure 79 3-Bar Tombstones FER-G1-1.0 B Uncracked

- 230 -
Figure 80 3-Bar Tombstones FER-G1-1.0 C Uncracked
Figure 81 3-Bar Tombstones FER-G1-1.0 D Uncracked

- 231 -
Figure 82 3-Bar Tombstones FER-G1-1.0 E Uncracked
Figure 83 3-Bar Tombstones FER-G1-1.0 F Uncracked

- 232 -
Figure 84 3-Bar Tombstones REO-G1-1.0 A Uncracked
Figure 85 3-Bar Tombstones REO-G1-1.0 B Uncracked

- 233 -
Figure 86 3-Bar Tombstones REO-G1-1.0 C Uncracked
Figure 87 3-Bar Tombstones REO-G1-1.0 D Uncracked

- 234 -
Figure 88 3-Bar Tombstones REO-G1-1.0 E Uncracked
Figure 89 3-Bar Tombstones REO-G1-1.0 F Uncracked
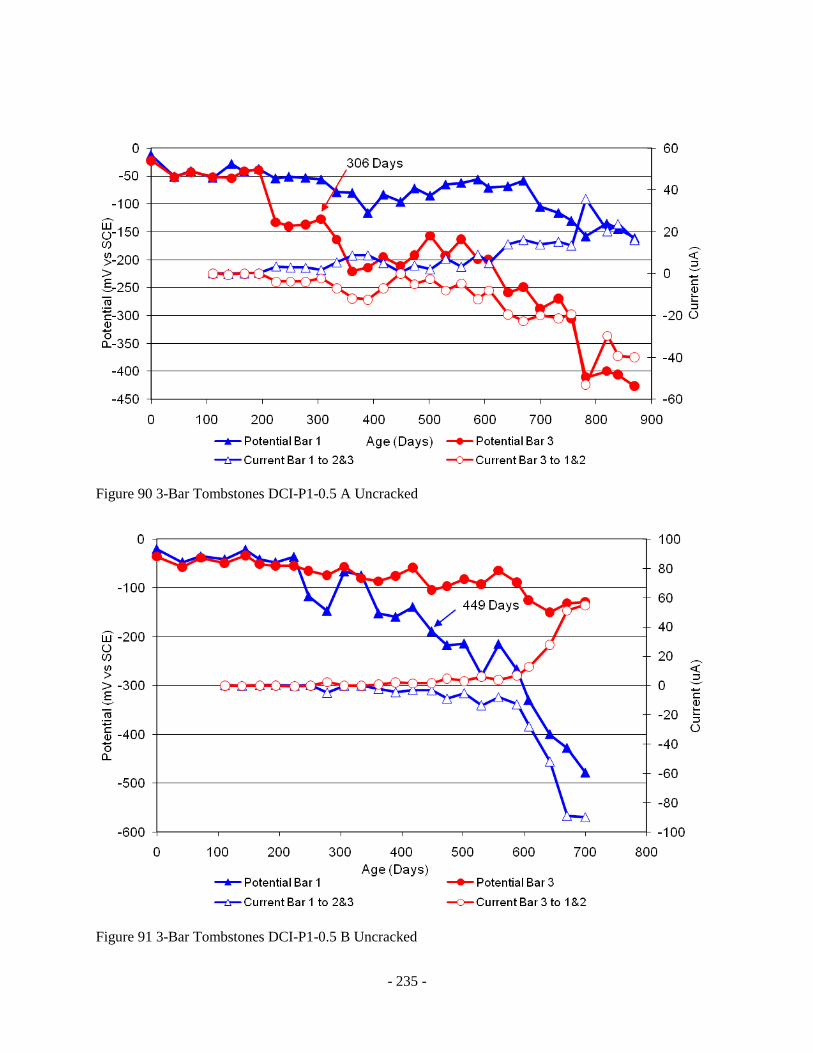
- 235 -
Figure 90 3-Bar Tombstones DCI-P1-0.5 A Uncracked
Figure 91 3-Bar Tombstones DCI-P1-0.5 B Uncracked
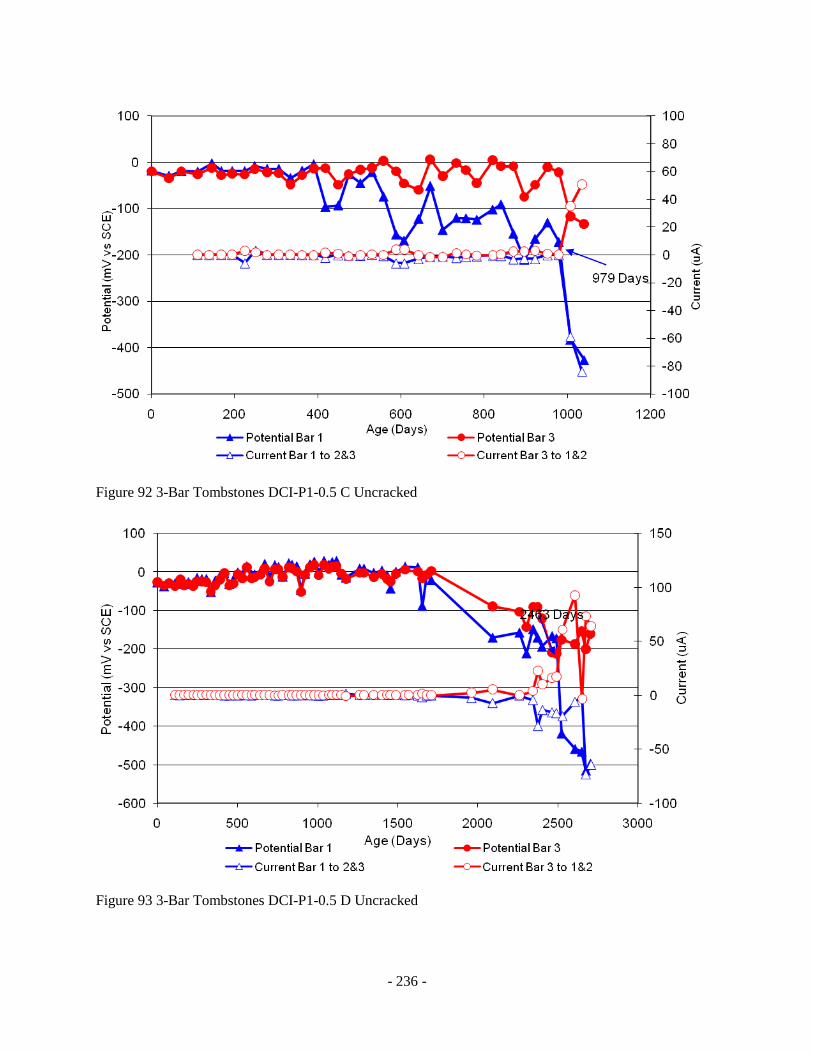
- 236 -
Figure 92 3-Bar Tombstones DCI-P1-0.5 C Uncracked
Figure 93 3-Bar Tombstones DCI-P1-0.5 D Uncracked
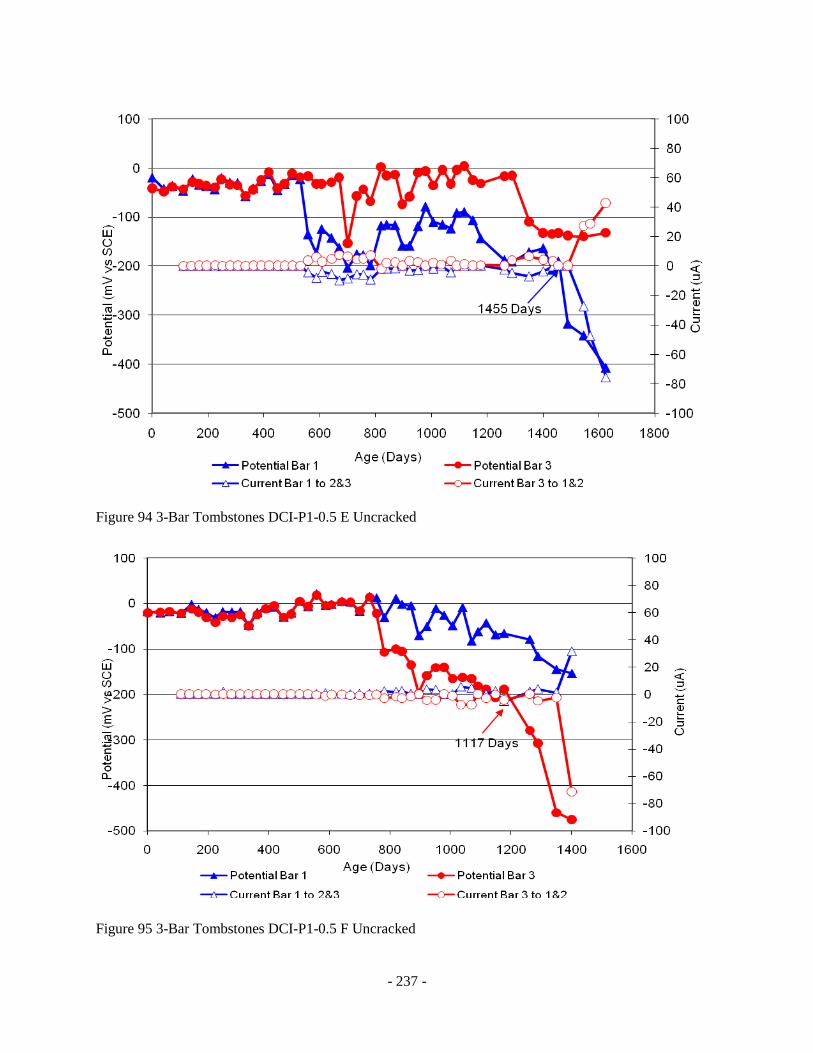
- 237 -
Figure 94 3-Bar Tombstones DCI-P1-0.5 E Uncracked
Figure 95 3-Bar Tombstones DCI-P1-0.5 F Uncracked

- 238 -
Figure 96 3-Bar Tombstones FER-P1-0.5 A Uncracked
Figure 97 3-Bar Tombstones FER-P1-0.5 B Uncracked
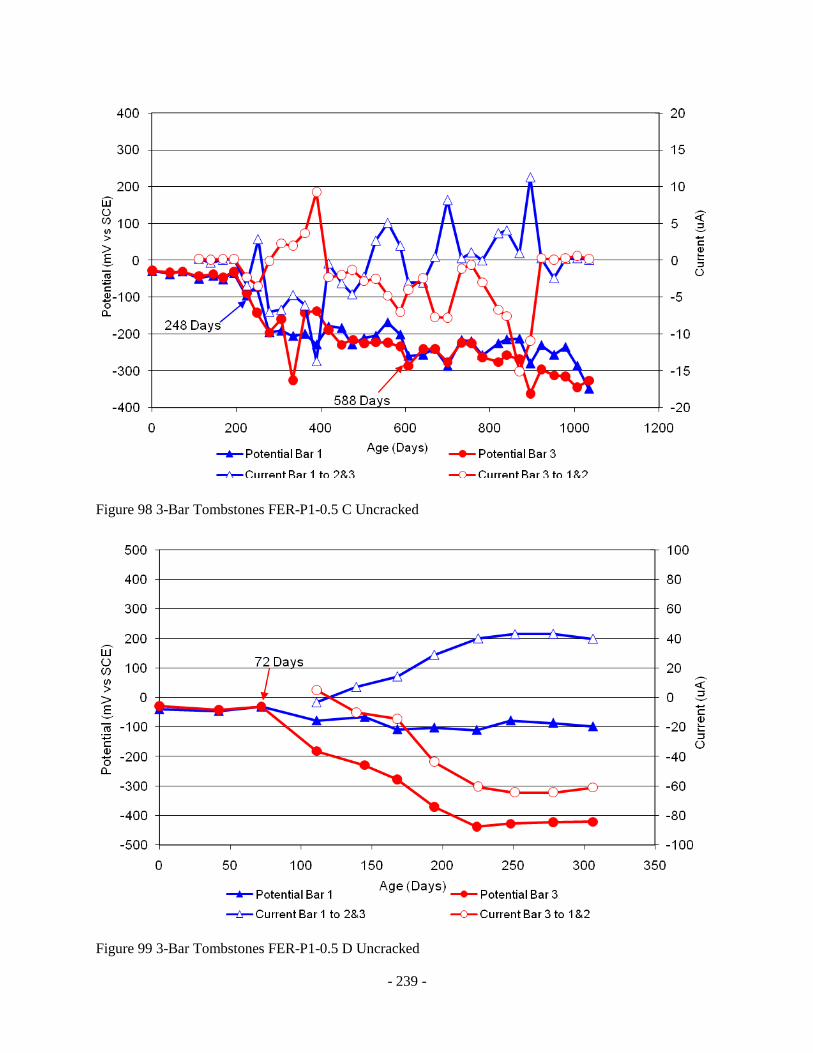
- 239 -
Figure 98 3-Bar Tombstones FER-P1-0.5 C Uncracked
Figure 99 3-Bar Tombstones FER-P1-0.5 D Uncracked
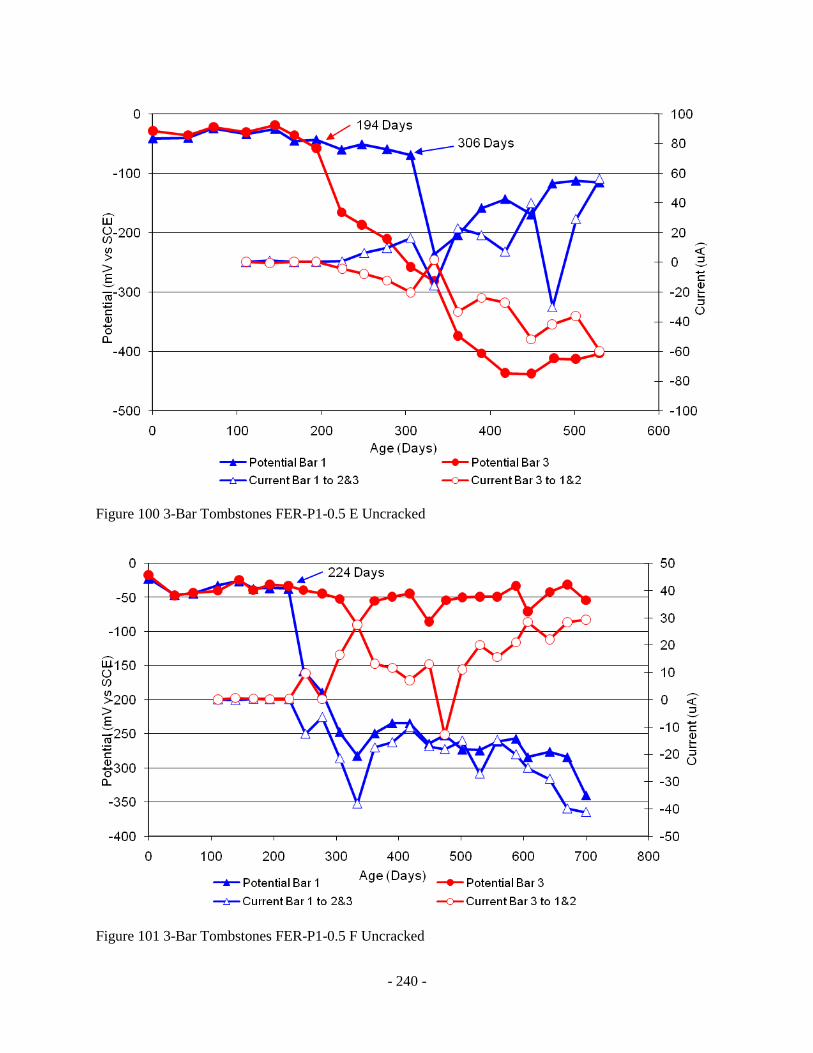
- 240 -
Figure 100 3-Bar Tombstones FER-P1-0.5 E Uncracked
Figure 101 3-Bar Tombstones FER-P1-0.5 F Uncracked
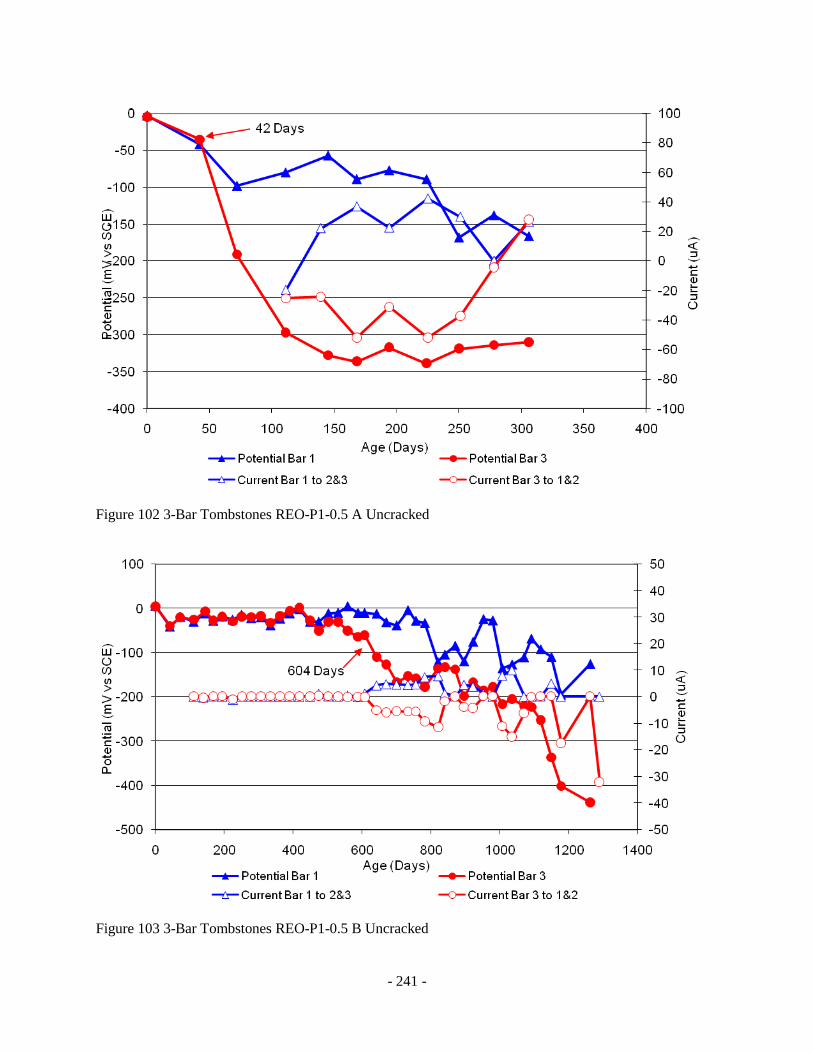
- 241 -
Figure 102 3-Bar Tombstones REO-P1-0.5 A Uncracked
Figure 103 3-Bar Tombstones REO-P1-0.5 B Uncracked

- 242 -
Figure 104 3-Bar Tombstones REO-P1-0.5 C Uncracked
Figure 105 3-Bar Tombstones REO-P1-0.5 D Uncracked
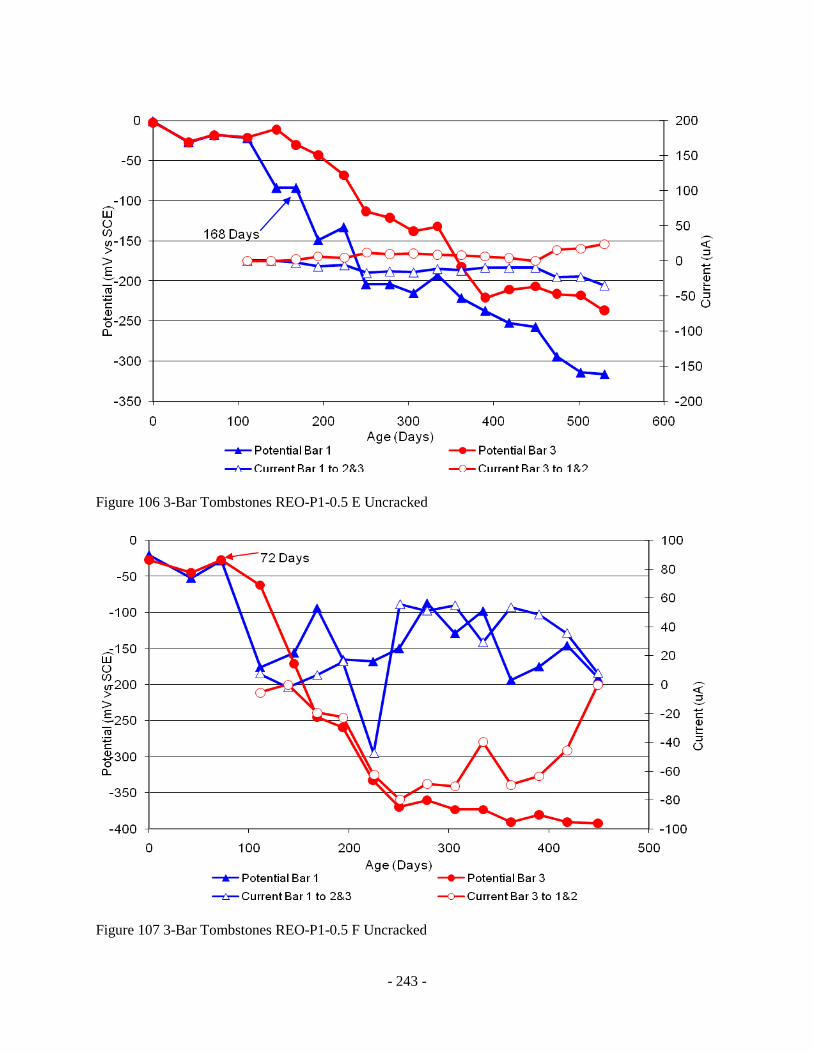
- 243 -
Figure 106 3-Bar Tombstones REO-P1-0.5 E Uncracked
Figure 107 3-Bar Tombstones REO-P1-0.5 F Uncracked
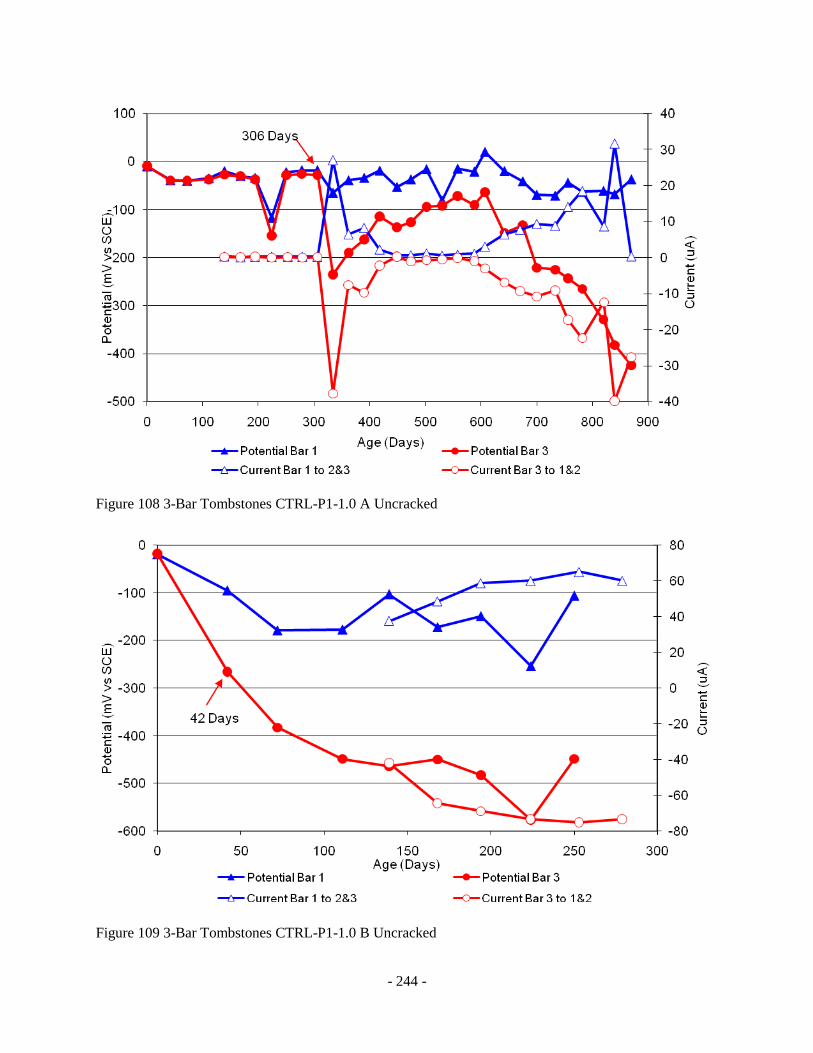
- 244 -
Figure 108 3-Bar Tombstones CTRL-P1-1.0 A Uncracked
Figure 109 3-Bar Tombstones CTRL-P1-1.0 B Uncracked
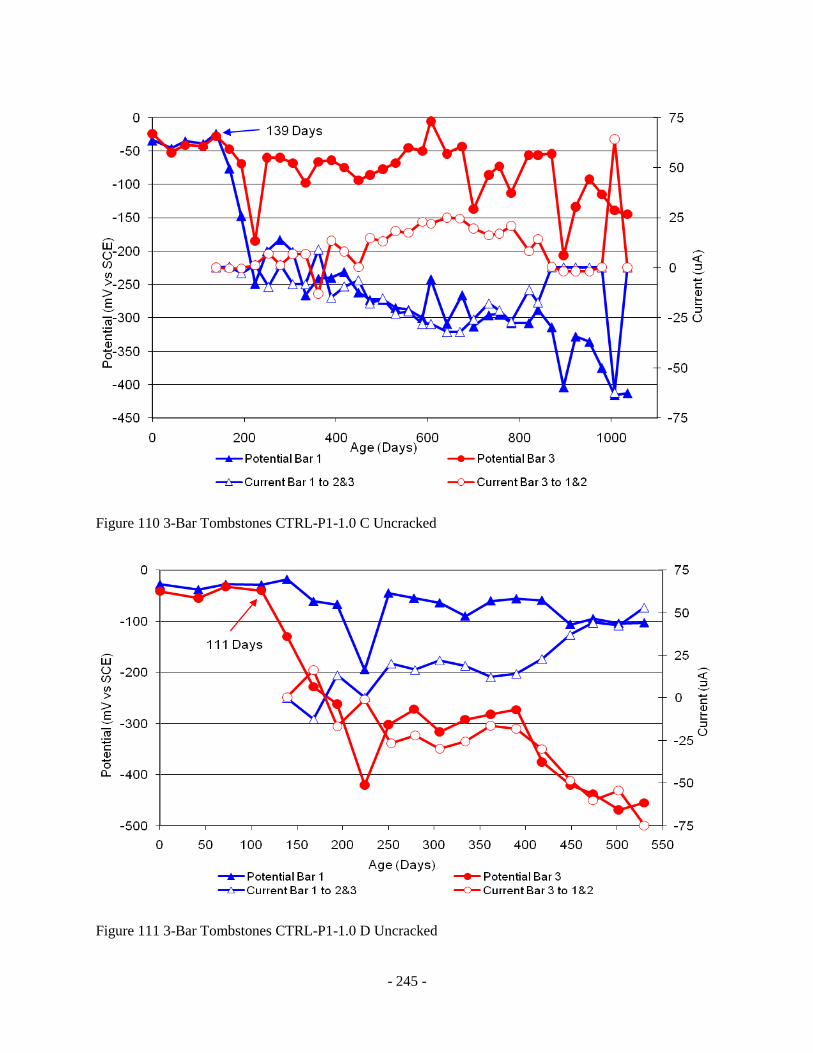
- 245 -
Figure 110 3-Bar Tombstones CTRL-P1-1.0 C Uncracked
Figure 111 3-Bar Tombstones CTRL-P1-1.0 D Uncracked

- 246 -
Figure 112 3-Bar Tombstones CTRL-P1-1.0 E Uncracked
Figure 113 3-Bar Tombstones CTRL-P1-1.0 F Uncracked
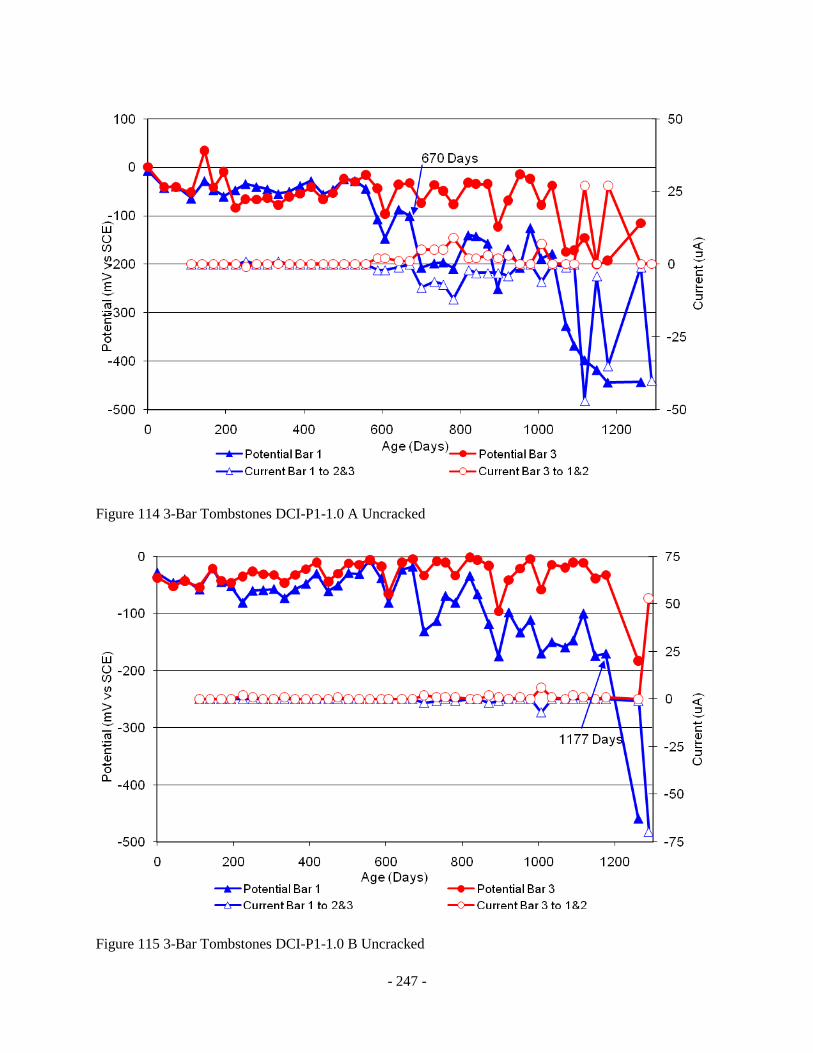
- 247 -
Figure 114 3-Bar Tombstones DCI-P1-1.0 A Uncracked
Figure 115 3-Bar Tombstones DCI-P1-1.0 B Uncracked
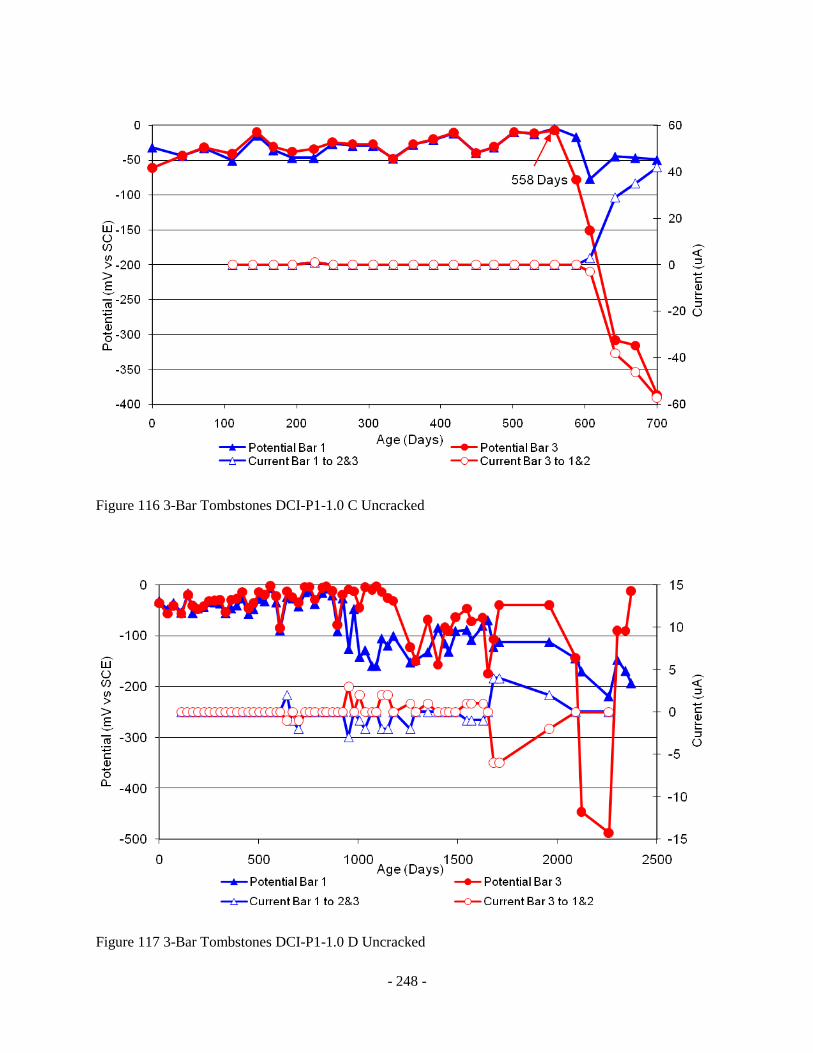
- 248 -
Figure 116 3-Bar Tombstones DCI-P1-1.0 C Uncracked
Figure 117 3-Bar Tombstones DCI-P1-1.0 D Uncracked

- 249 -
Figure 118 3-Bar Tombstones DCI-P1-1.0 E Uncracked
Figure 119 3-Bar Tombstones DCI-P1-1.0 F Uncracked

- 250 -
Figure 120 3-Bar Tombstones FER-P1-1.0 A Uncracked
Figure 121 3-Bar Tombstones FER-P1-1.0 B Uncracked
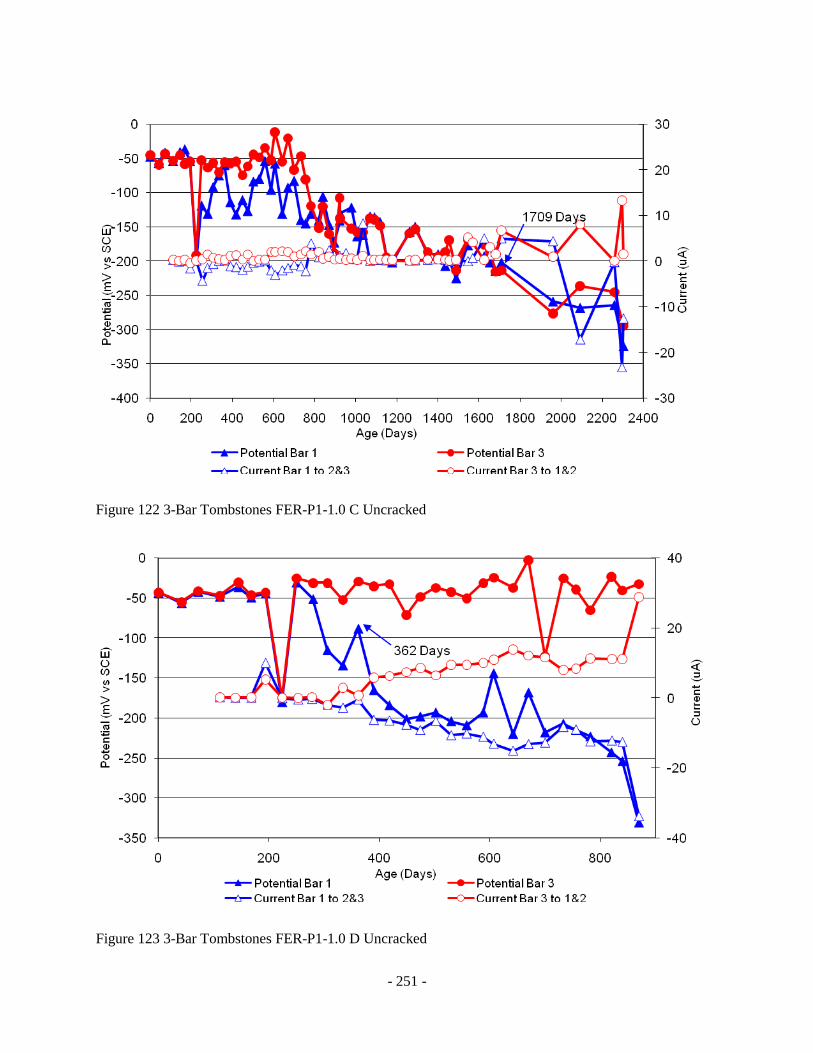
- 251 -
Figure 122 3-Bar Tombstones FER-P1-1.0 C Uncracked
Figure 123 3-Bar Tombstones FER-P1-1.0 D Uncracked
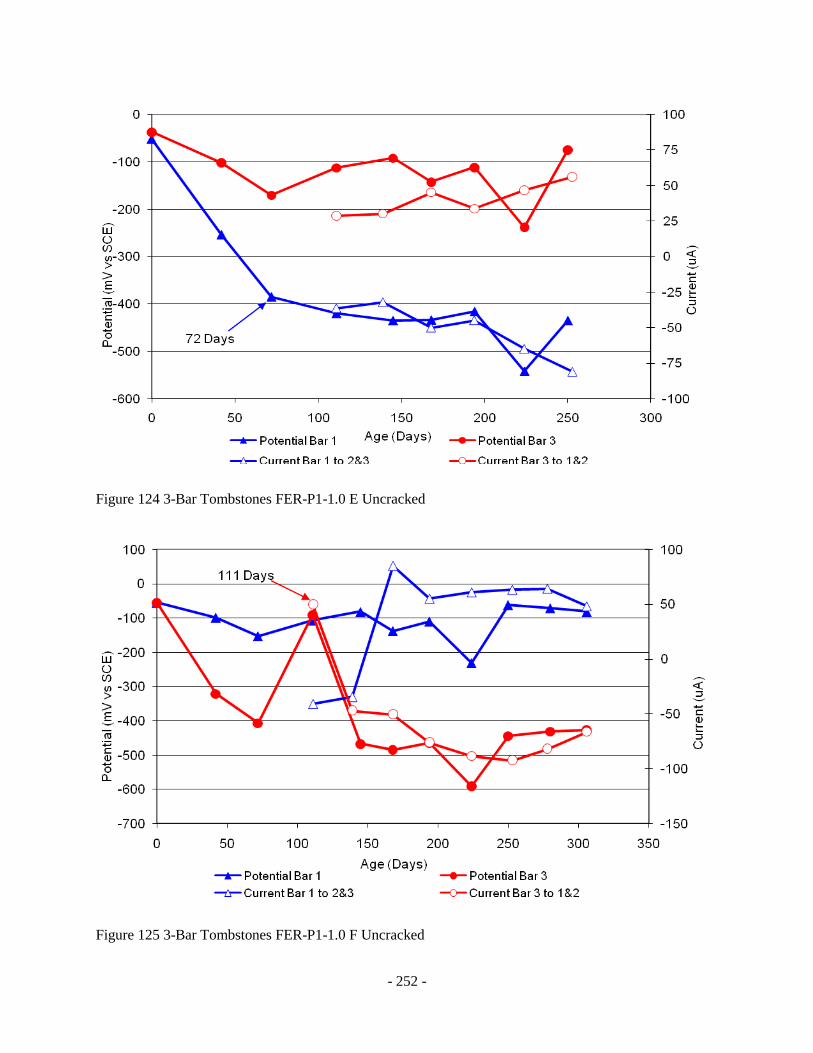
- 252 -
Figure 124 3-Bar Tombstones FER-P1-1.0 E Uncracked
Figure 125 3-Bar Tombstones FER-P1-1.0 F Uncracked

- 253 -
Figure 126 3-Bar Tombstones REO-P1-1.0 A Uncracked
Figure 127 3-Bar Tombstones REO-P1-1.0 B Uncracked
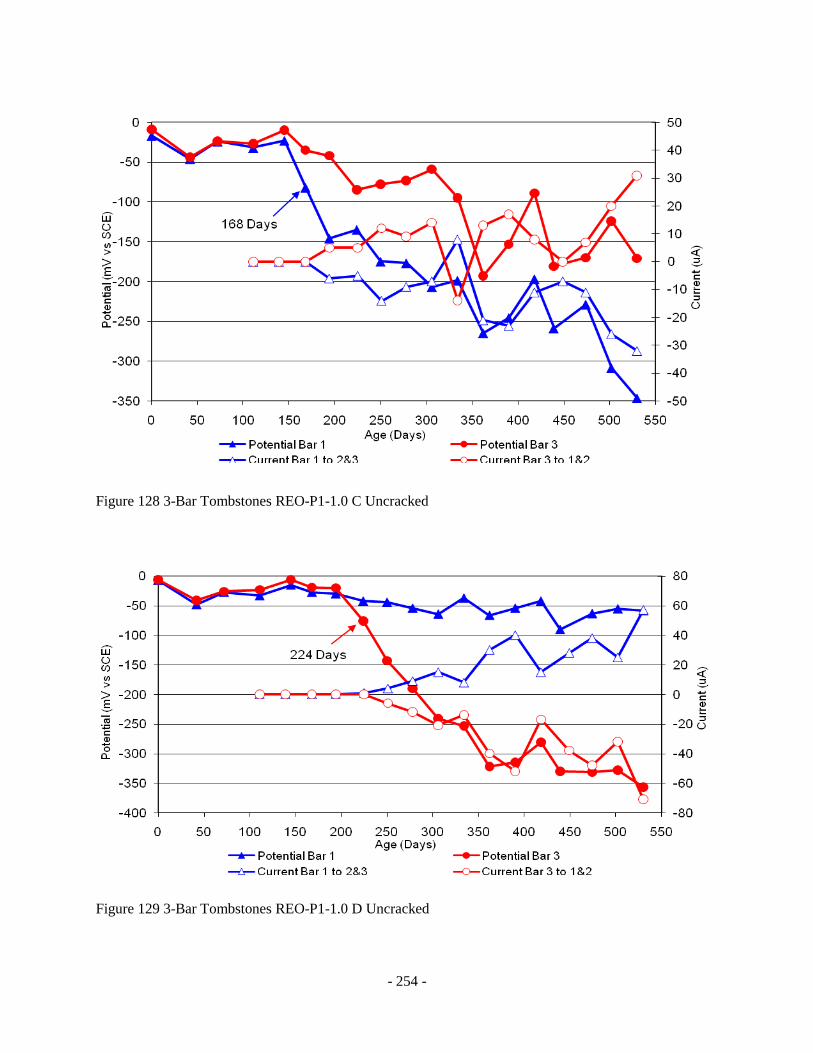
- 254 -
Figure 128 3-Bar Tombstones REO-P1-1.0 C Uncracked
Figure 129 3-Bar Tombstones REO-P1-1.0 D Uncracked
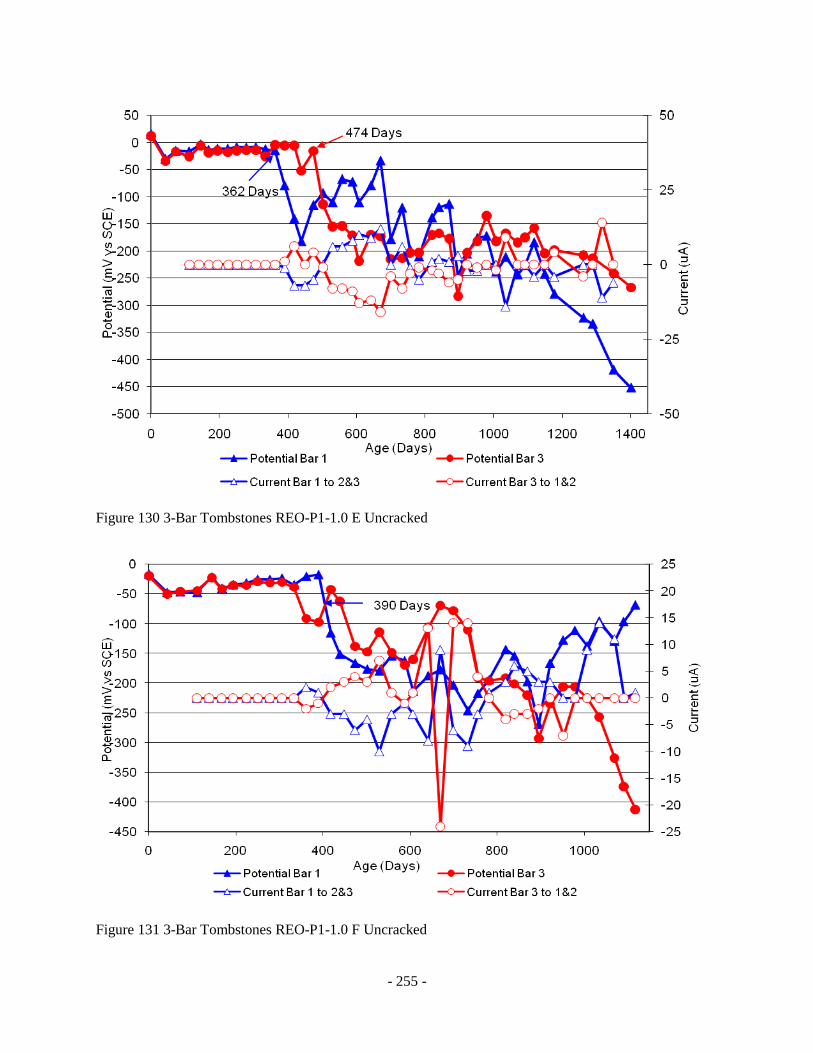
- 255 -
Figure 130 3-Bar Tombstones REO-P1-1.0 E Uncracked
Figure 131 3-Bar Tombstones REO-P1-1.0 F Uncracked
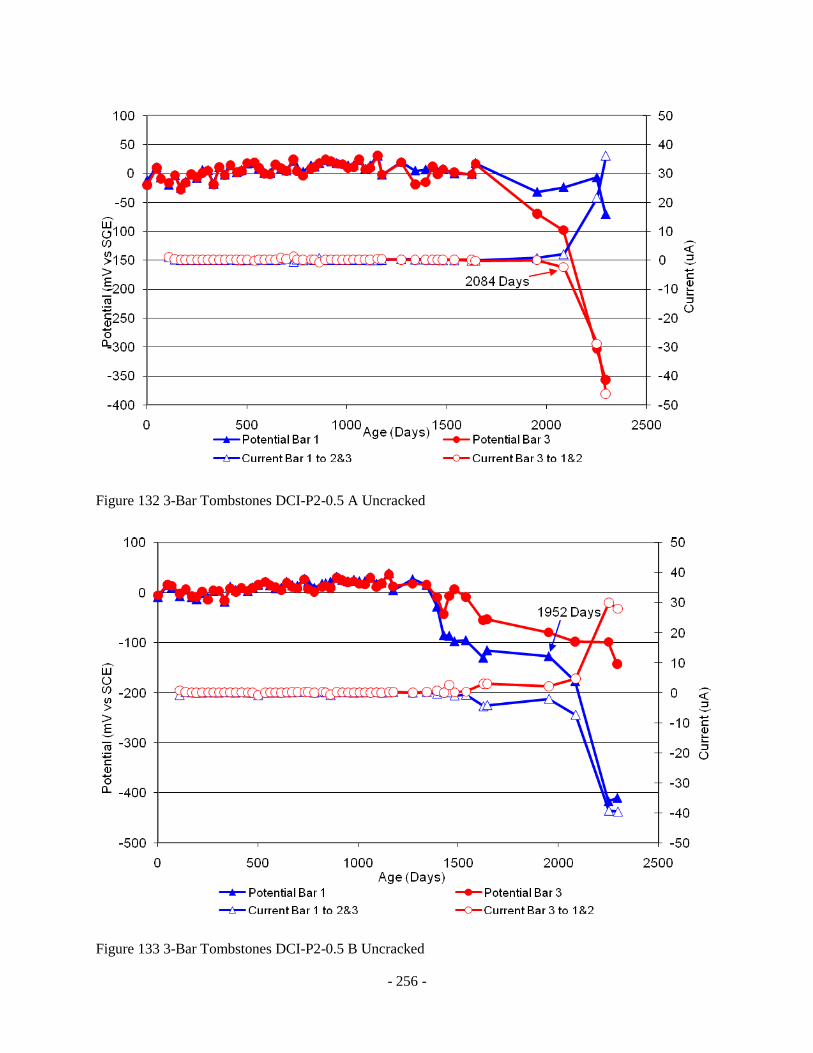
- 256 -
Figure 132 3-Bar Tombstones DCI-P2-0.5 A Uncracked
Figure 133 3-Bar Tombstones DCI-P2-0.5 B Uncracked

- 257 -
Figure 134 3-Bar Tombstones DCI-P2-0.5 C Uncracked
Figure 135 3-Bar Tombstones DCI-P2-0.5 D Uncracked
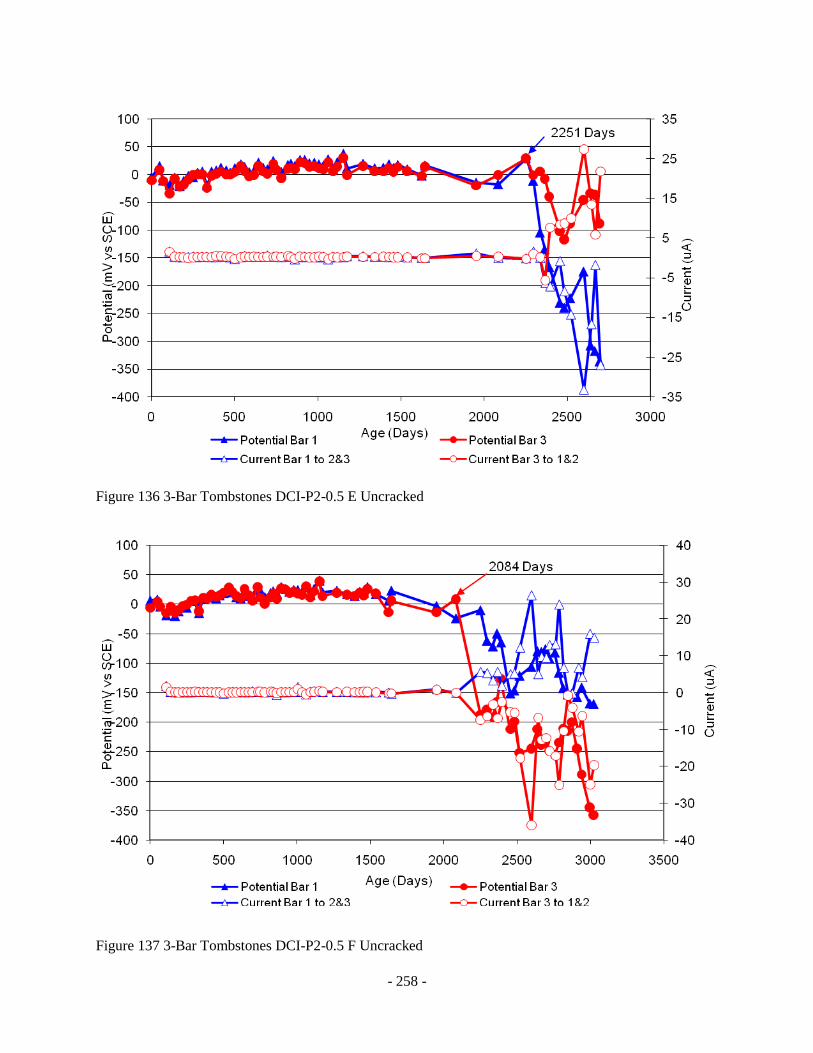
- 258 -
Figure 136 3-Bar Tombstones DCI-P2-0.5 E Uncracked
Figure 137 3-Bar Tombstones DCI-P2-0.5 F Uncracked
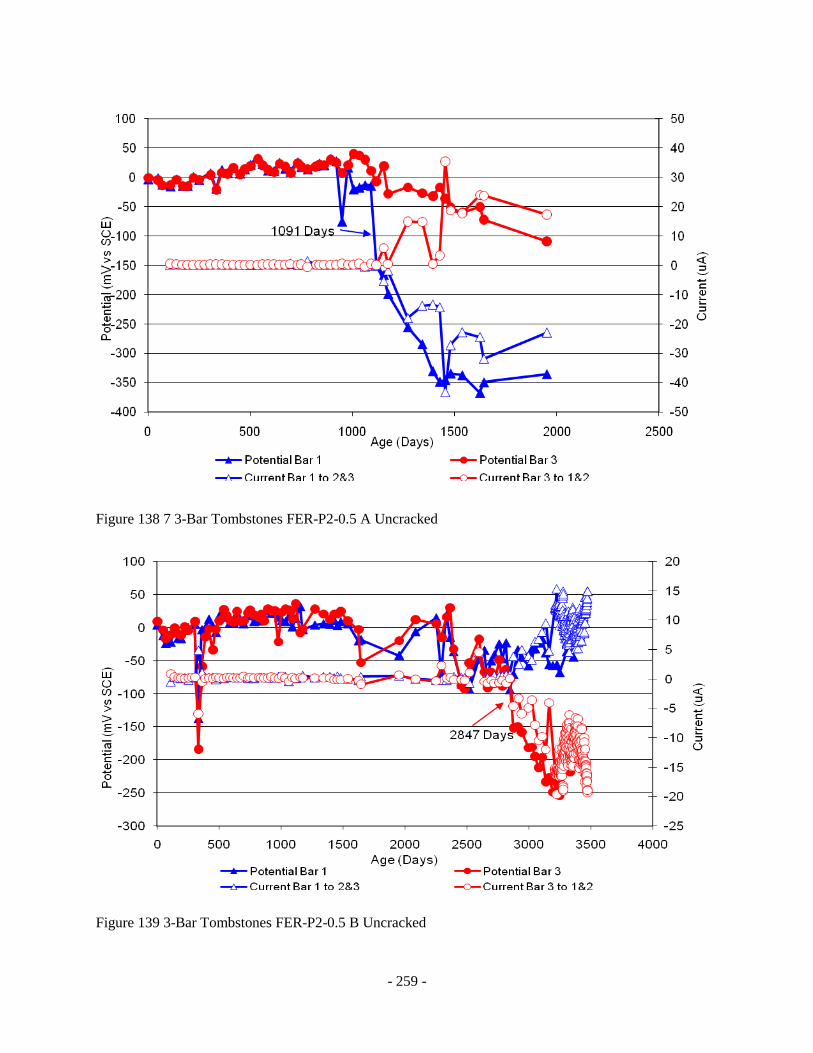
- 259 -
Figure 138 7 3-Bar Tombstones FER-P2-0.5 A Uncracked
Figure 139 3-Bar Tombstones FER-P2-0.5 B Uncracked
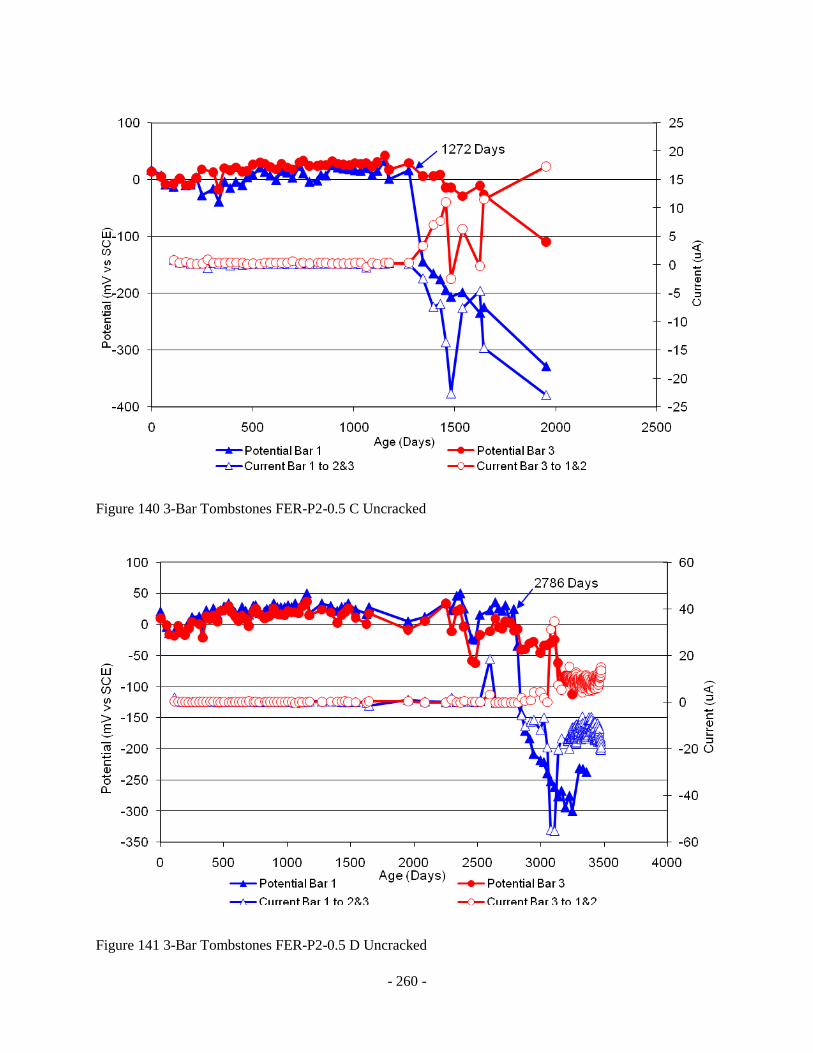
- 260 -
Figure 140 3-Bar Tombstones FER-P2-0.5 C Uncracked
Figure 141 3-Bar Tombstones FER-P2-0.5 D Uncracked

- 261 -
Figure 142 3-Bar Tombstones FER-P2-0.5 E Uncracked
Figure 143 3-Bar Tombstones FER-P2-0.5 F Uncracked
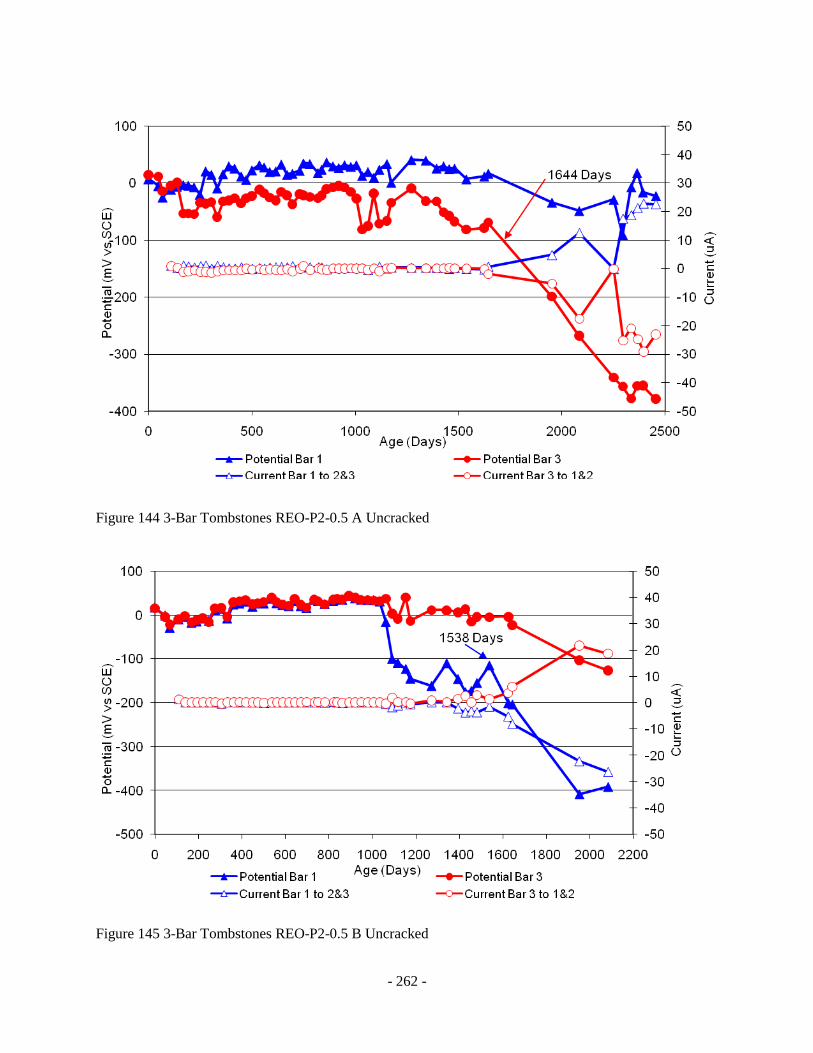
- 262 -
Figure 144 3-Bar Tombstones REO-P2-0.5 A Uncracked
Figure 145 3-Bar Tombstones REO-P2-0.5 B Uncracked
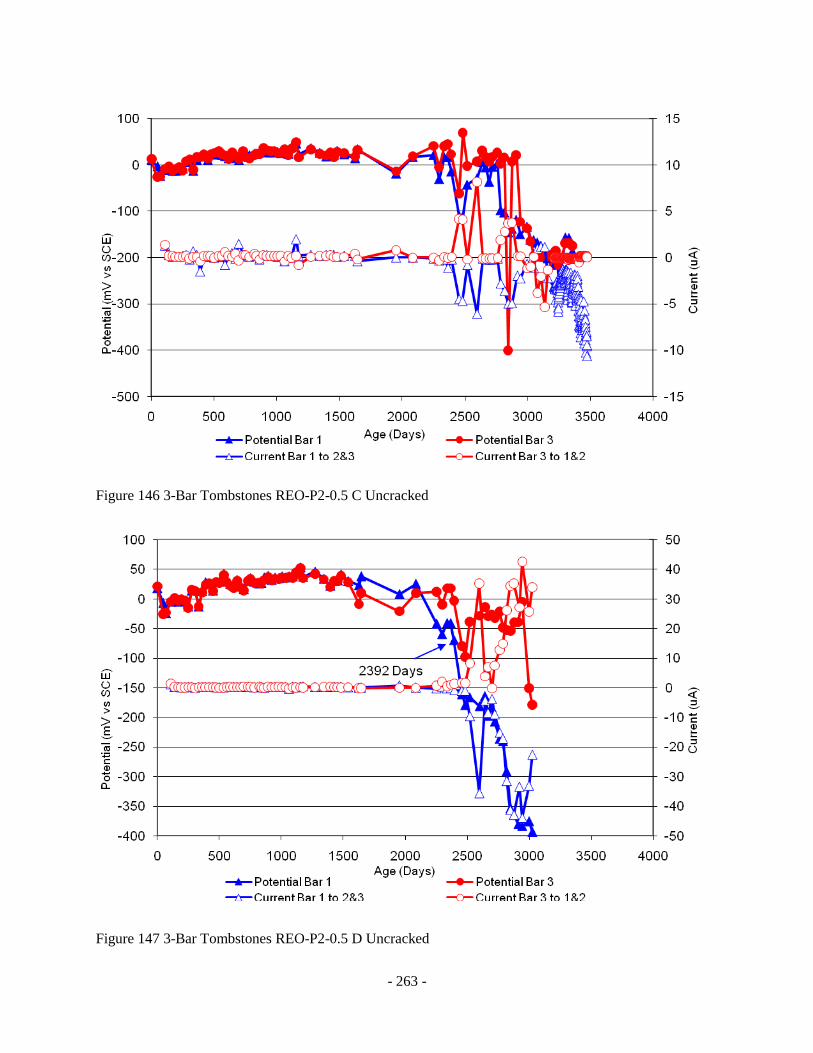
- 263 -
Figure 146 3-Bar Tombstones REO-P2-0.5 C Uncracked
Figure 147 3-Bar Tombstones REO-P2-0.5 D Uncracked

- 264 -
Figure 148 3-Bar Tombstones REO-P2-0.5 E Uncracked
Figure 149 3-Bar Tombstones REO-P2-0.5 F Uncracked
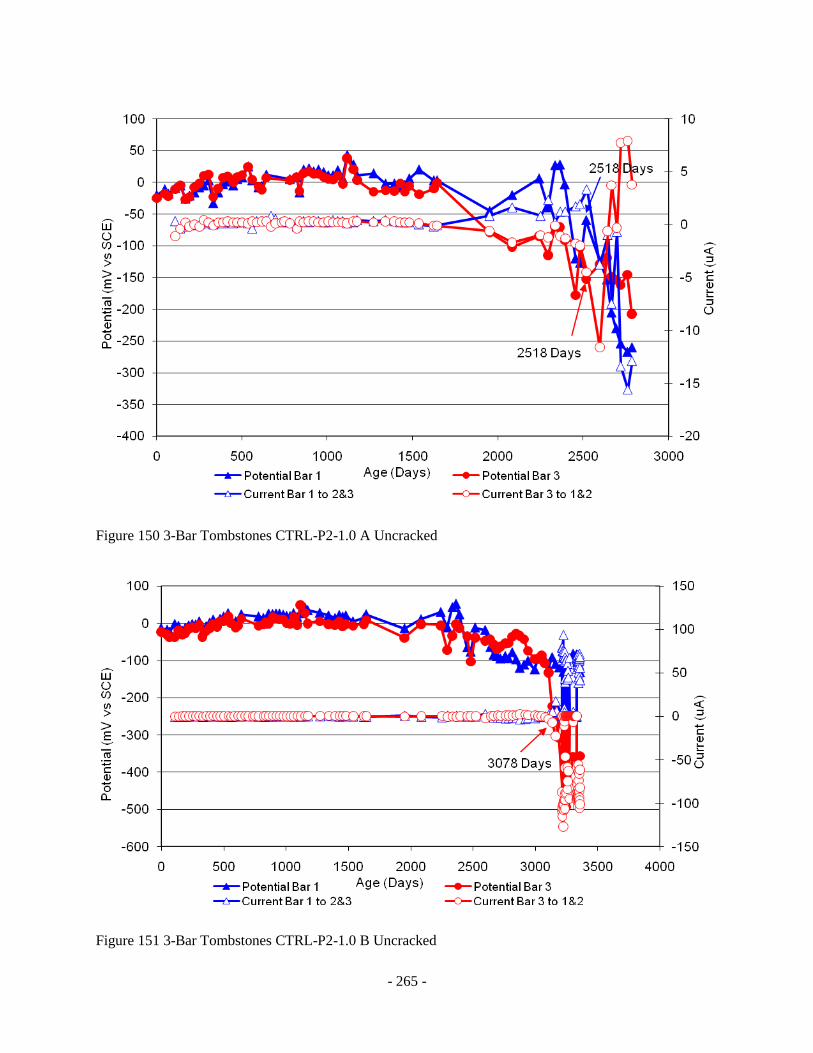
- 265 -
Figure 150 3-Bar Tombstones CTRL-P2-1.0 A Uncracked
Figure 151 3-Bar Tombstones CTRL-P2-1.0 B Uncracked
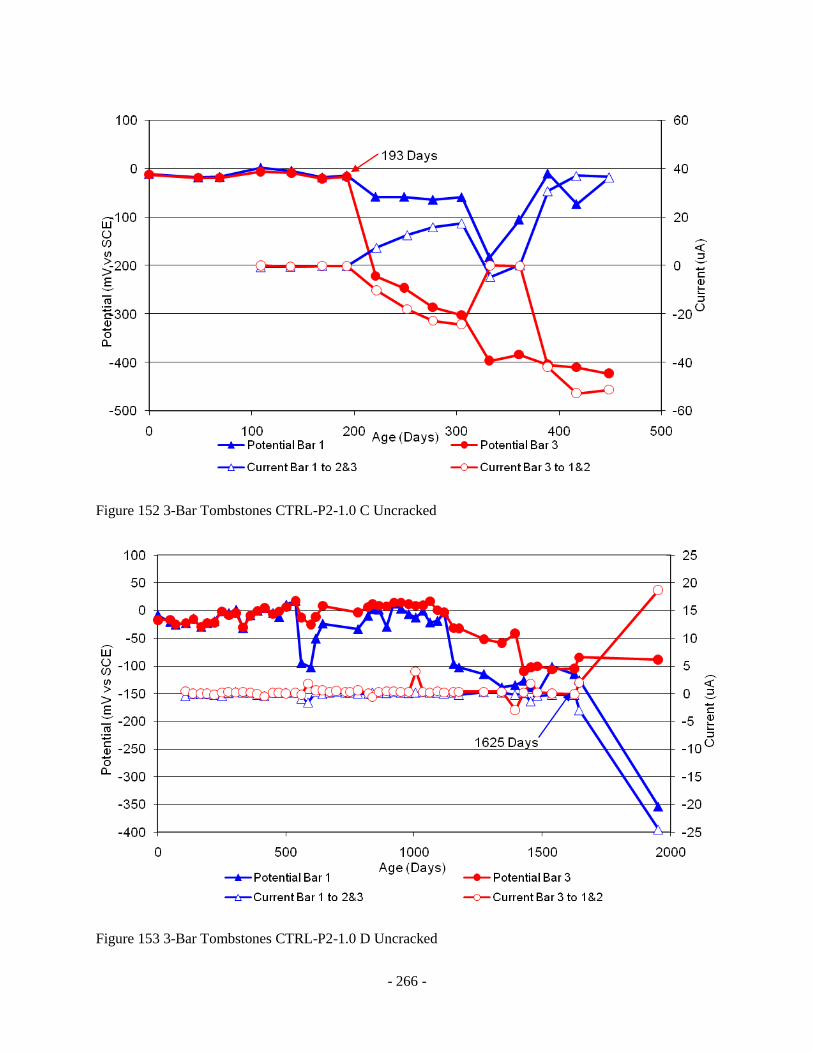
- 266 -
Figure 152 3-Bar Tombstones CTRL-P2-1.0 C Uncracked
Figure 153 3-Bar Tombstones CTRL-P2-1.0 D Uncracked

- 267 -
Figure 154 3-Bar Tombstones CTRL-P2-1.0 E Uncracked
Figure 155 3-Bar Tombstones CTRL-P2-1.0 F Uncracked
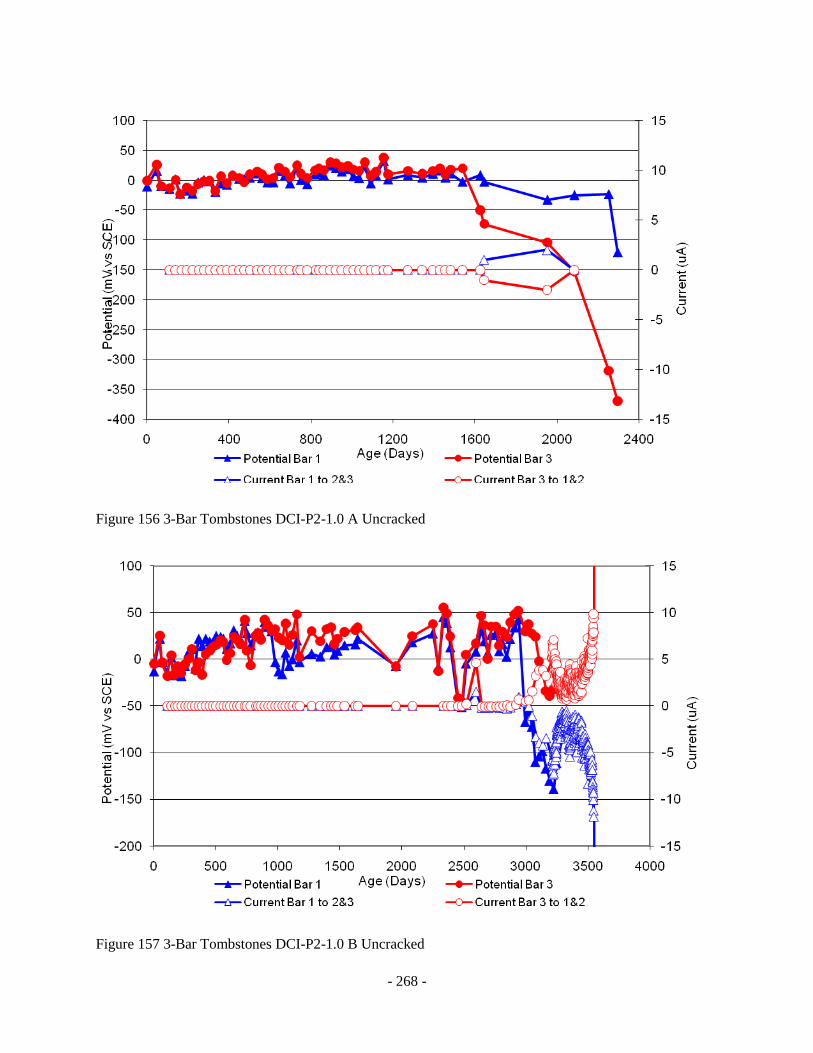
- 268 -
Figure 156 3-Bar Tombstones DCI-P2-1.0 A Uncracked
Figure 157 3-Bar Tombstones DCI-P2-1.0 B Uncracked

- 269 -
Figure 158 3-Bar Tombstones DCI-P2-1.0 C Uncracked
Figure 159 3-Bar Tombstones DCI-P2-1.0 D Uncracked
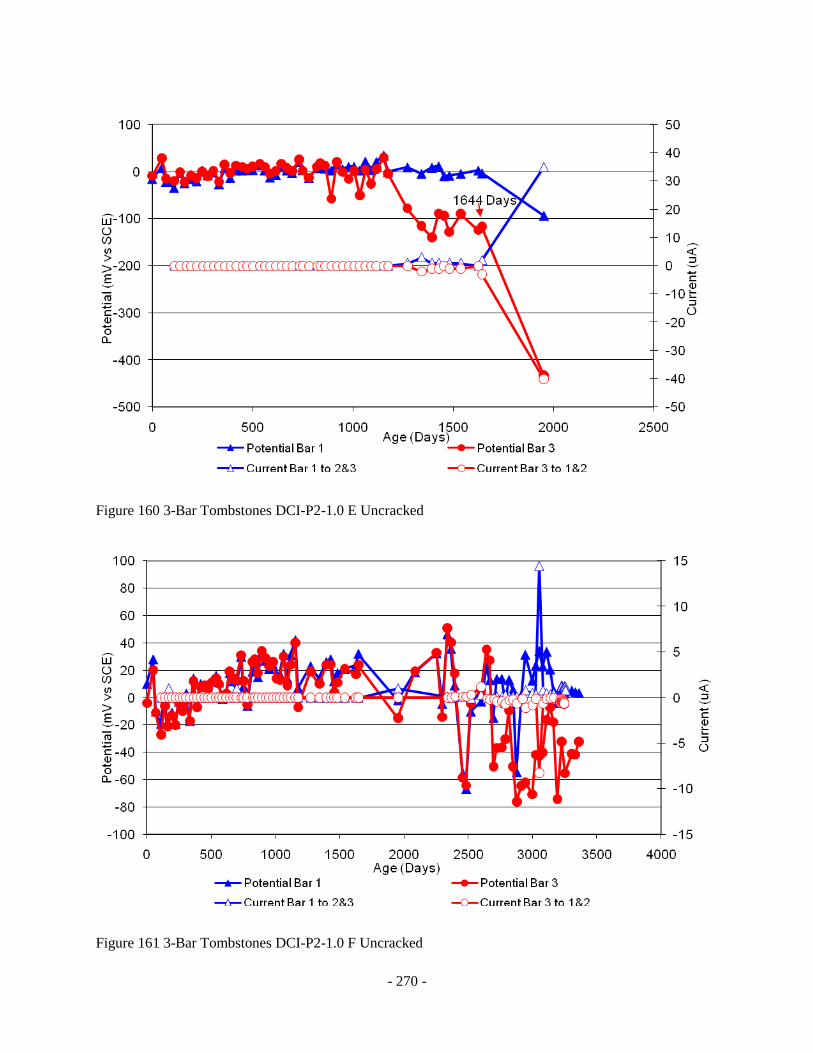
- 270 -
Figure 160 3-Bar Tombstones DCI-P2-1.0 E Uncracked
Figure 161 3-Bar Tombstones DCI-P2-1.0 F Uncracked

- 271 -
Figure 162 3-Bar Tombstones FER-P2-1.0 A Uncracked
Figure 163 3-Bar Tombstones FER-P2-1.0 B Uncracked
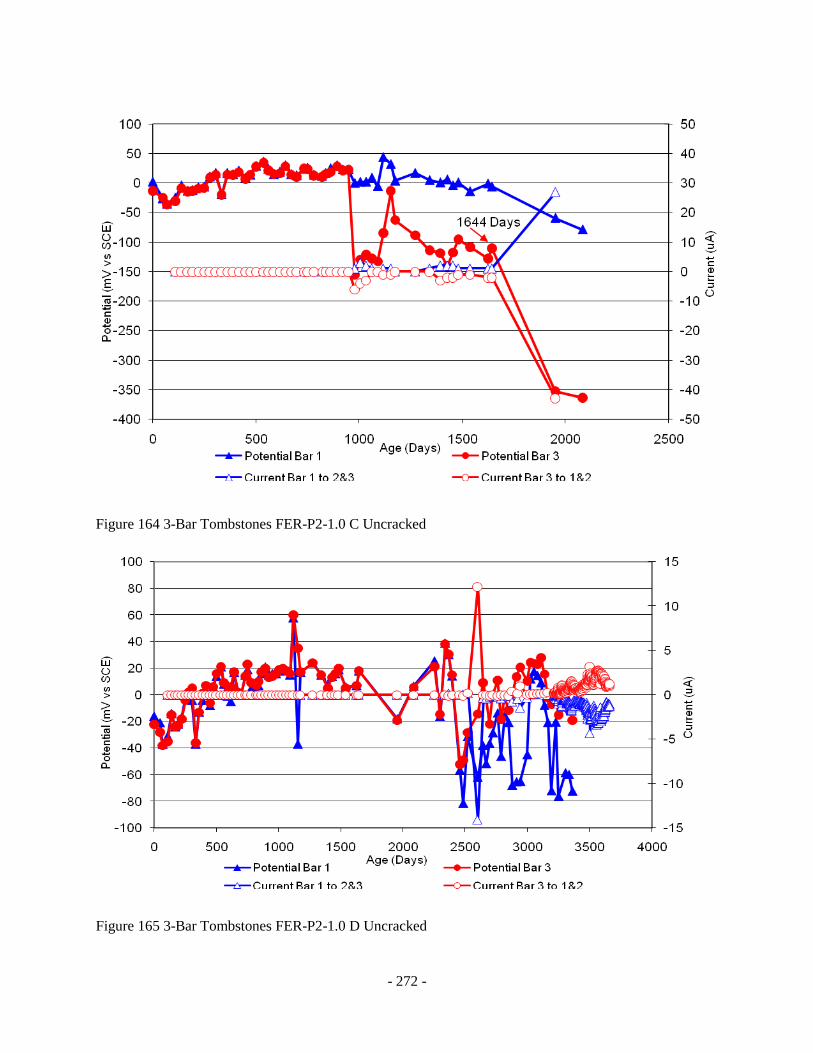
- 272 -
Figure 164 3-Bar Tombstones FER-P2-1.0 C Uncracked
Figure 165 3-Bar Tombstones FER-P2-1.0 D Uncracked

- 273 -
Figure 166 3-Bar Tombstones FER-P2-1.0 E Uncracked
Figure 168 3-Bar Tombstones FER-P2-1.0 F Uncracked

- 274 -
Figure 167 3-Bar Tombstones REO-P2-1.0 A Uncracked
Figure 169 3-Bar Tombstones REO-P2-1.0 B Uncracked
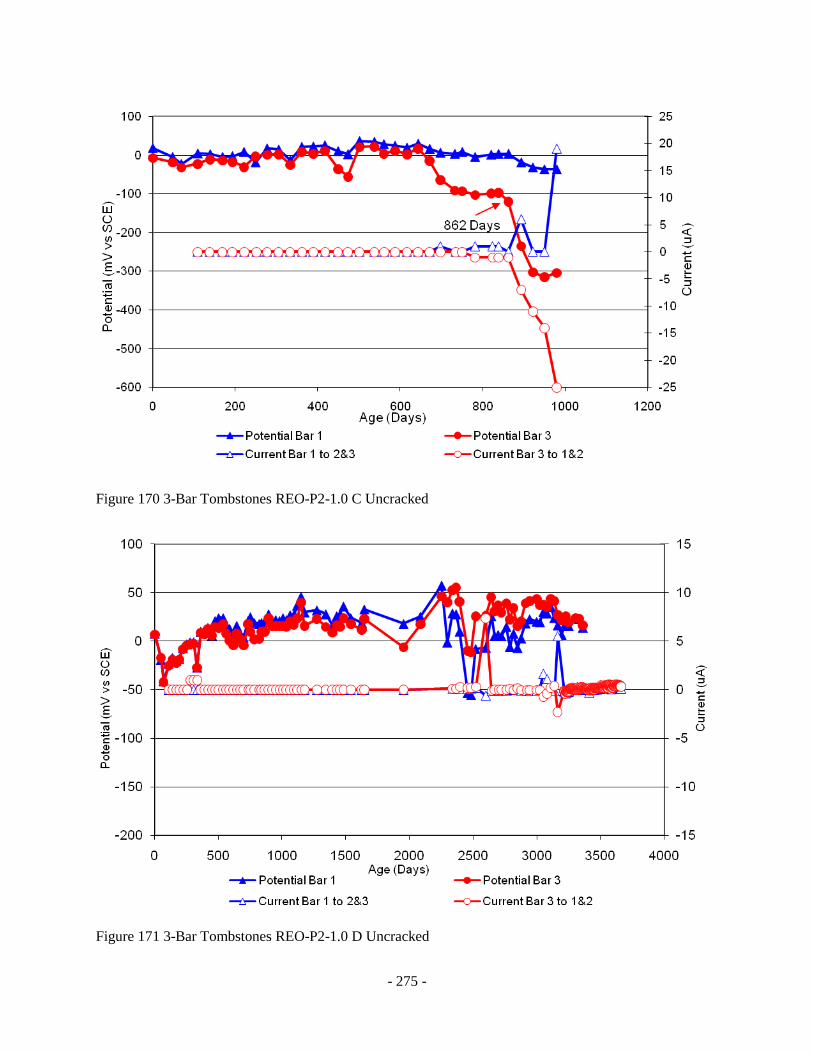
- 275 -
Figure 170 3-Bar Tombstones REO-P2-1.0 C Uncracked
Figure 171 3-Bar Tombstones REO-P2-1.0 D Uncracked

- 276 -
Figure 172 3-Bar Tombstones REO-P2-1.0 E Uncracked
Figure 173 3-Bar Tombstones REO-P2-1.0 F Uncracked
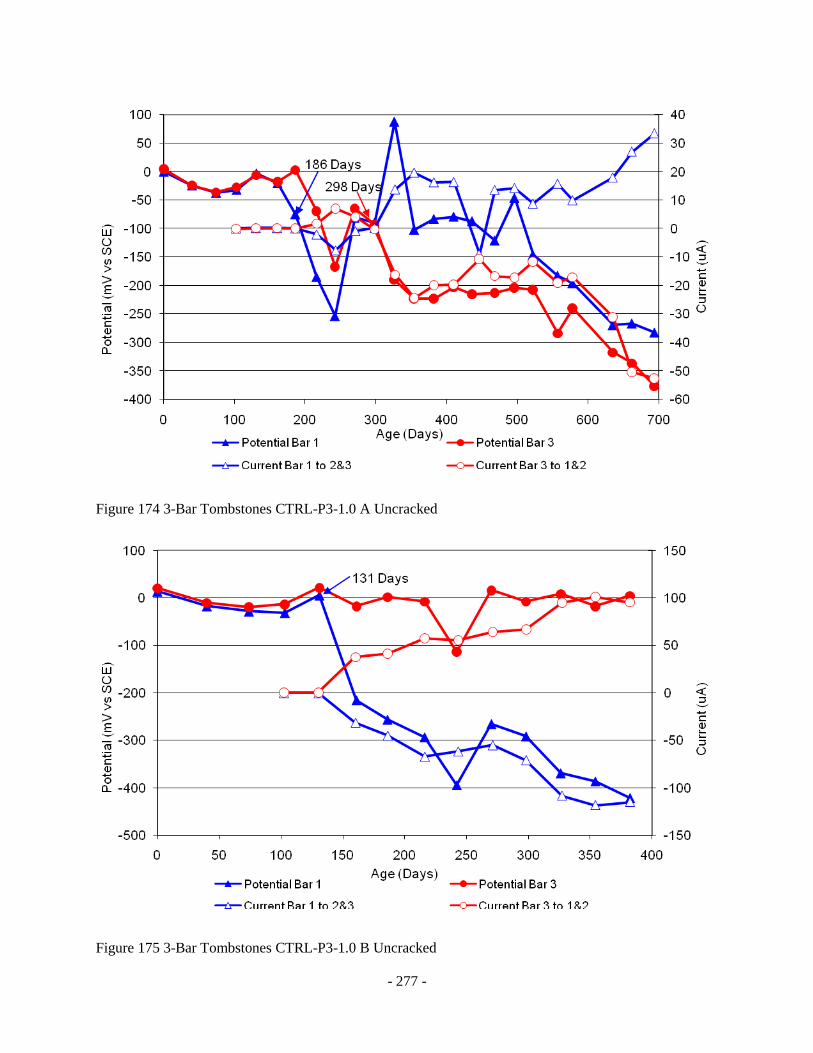
- 277 -
Figure 174 3-Bar Tombstones CTRL-P3-1.0 A Uncracked
Figure 175 3-Bar Tombstones CTRL-P3-1.0 B Uncracked
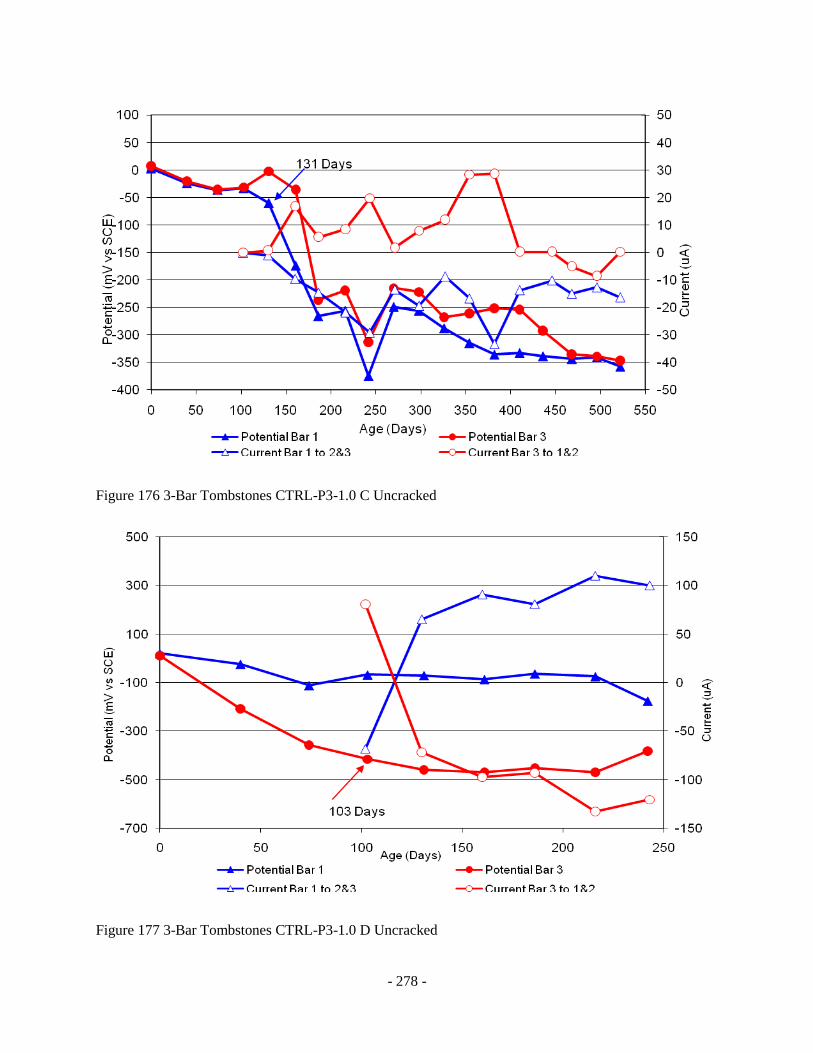
- 278 -
Figure 176 3-Bar Tombstones CTRL-P3-1.0 C Uncracked
Figure 177 3-Bar Tombstones CTRL-P3-1.0 D Uncracked
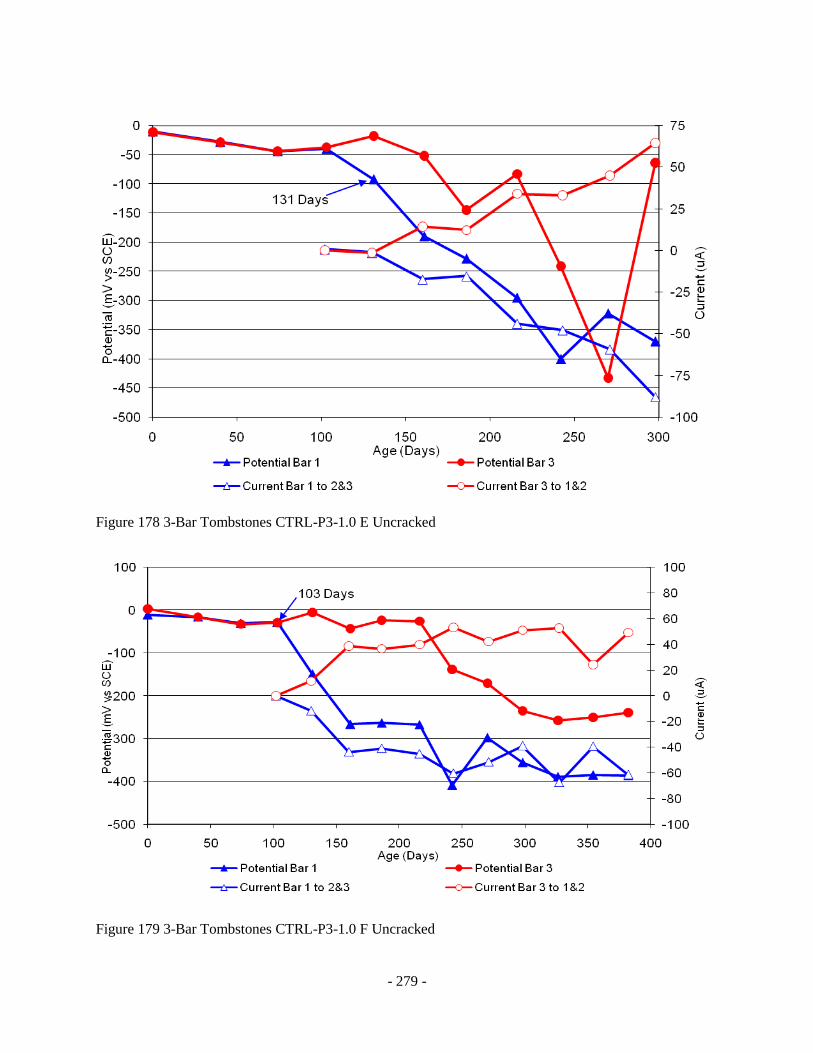
- 279 -
Figure 178 3-Bar Tombstones CTRL-P3-1.0 E Uncracked
Figure 179 3-Bar Tombstones CTRL-P3-1.0 F Uncracked

- 280 -
Figure 180 3-Bar Tombstones DCI-P3-1.0 A Uncracked
Figure 181 3-Bar Tombstones DCI-P3-1.0 B Uncracked

- 281 -
Figure 182 3-Bar Tombstones DCI-P3-1.0 C Uncracked
Figure 183 3-Bar Tombstones DCI-P3-1.0 D Uncracked
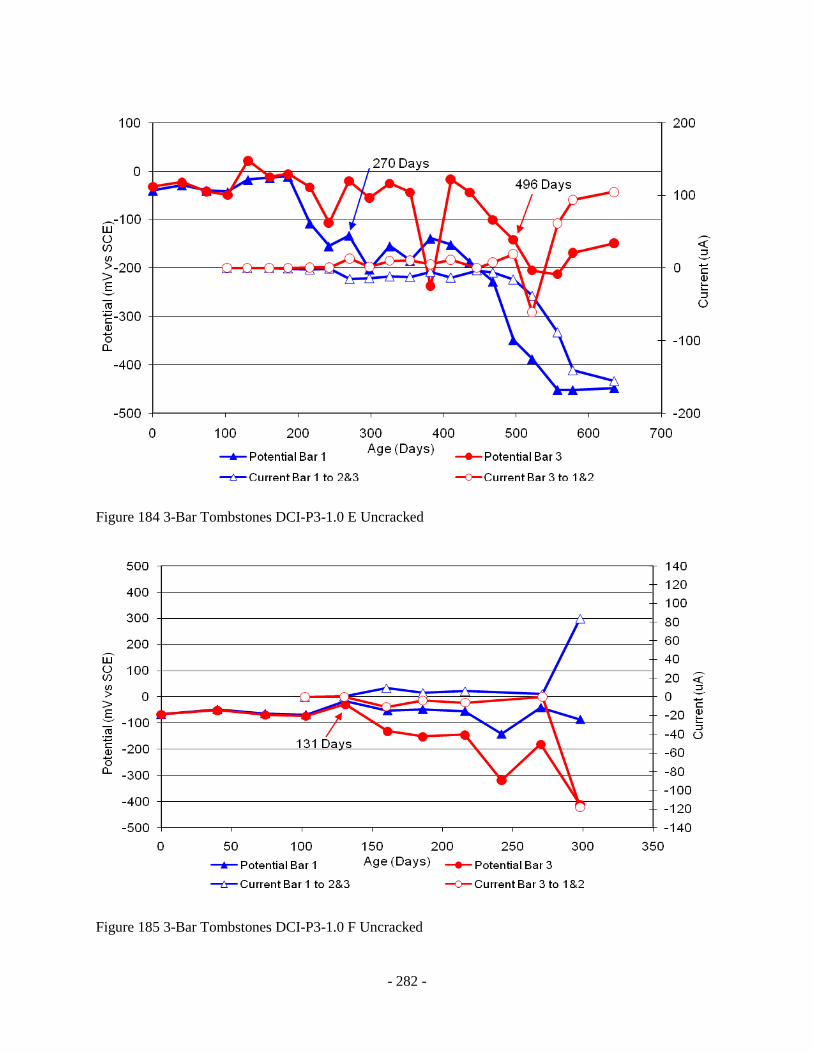
- 282 -
Figure 184 3-Bar Tombstones DCI-P3-1.0 E Uncracked
Figure 185 3-Bar Tombstones DCI-P3-1.0 F Uncracked

- 283 -
Figure 186 3-Bar Tombstones FER-P3-1.0 A Uncracked
Figure 187 3-Bar Tombstones FER-P3-1.0 B Uncracked
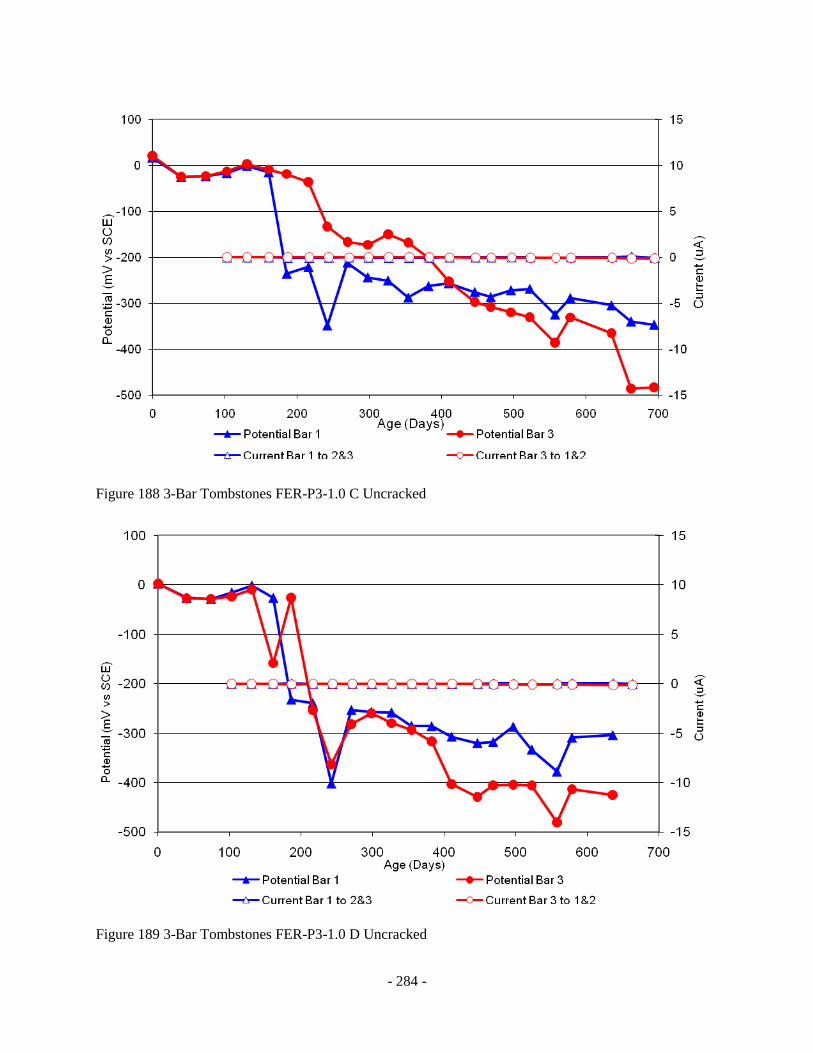
- 284 -
Figure 188 3-Bar Tombstones FER-P3-1.0 C Uncracked
Figure 189 3-Bar Tombstones FER-P3-1.0 D Uncracked
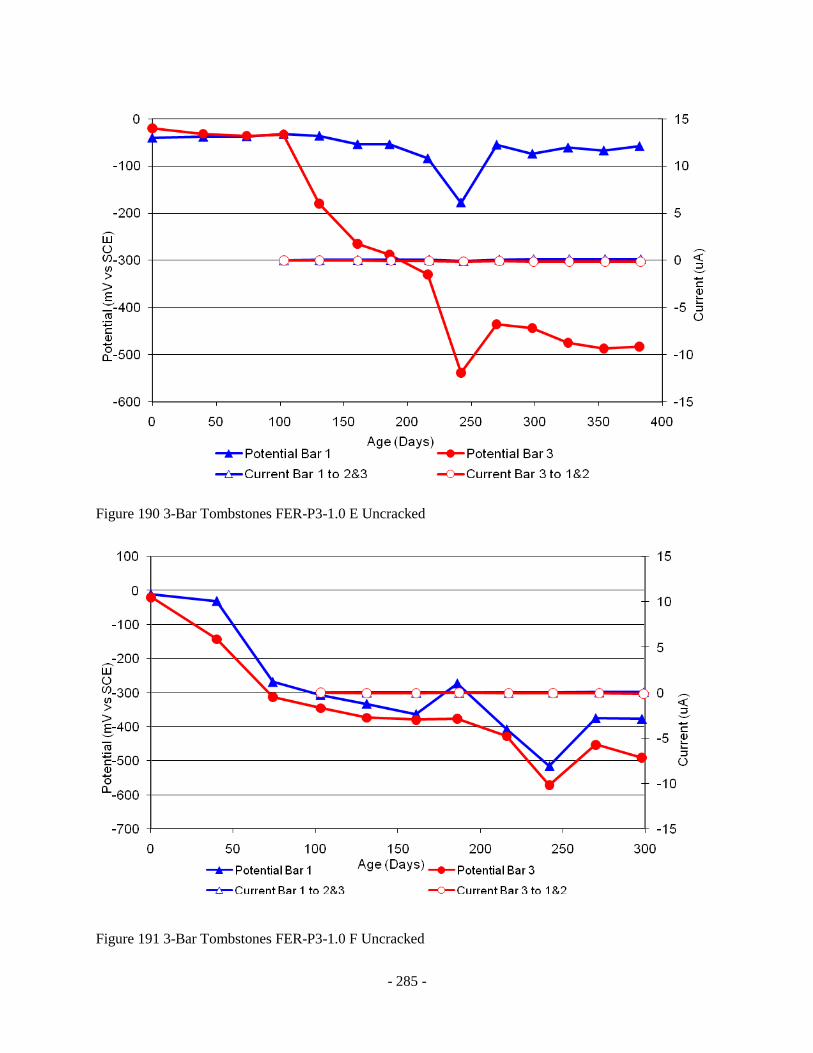
- 285 -
Figure 190 3-Bar Tombstones FER-P3-1.0 E Uncracked
Figure 191 3-Bar Tombstones FER-P3-1.0 F Uncracked
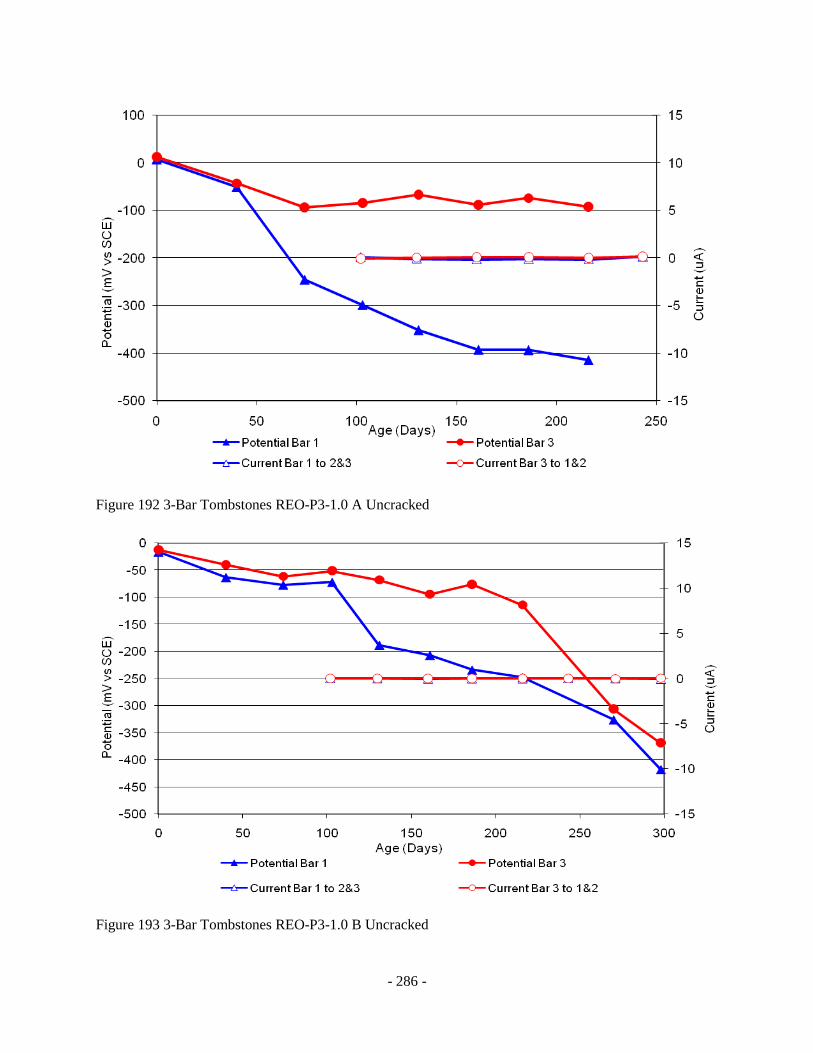
- 286 -
Figure 192 3-Bar Tombstones REO-P3-1.0 A Uncracked
Figure 193 3-Bar Tombstones REO-P3-1.0 B Uncracked

- 287 -
Figure 194 3-Bar Tombstones REO-P3-1.0 C Uncracked
Figure 195 3-Bar Tombstones REO-P3-1.0 D Uncracked
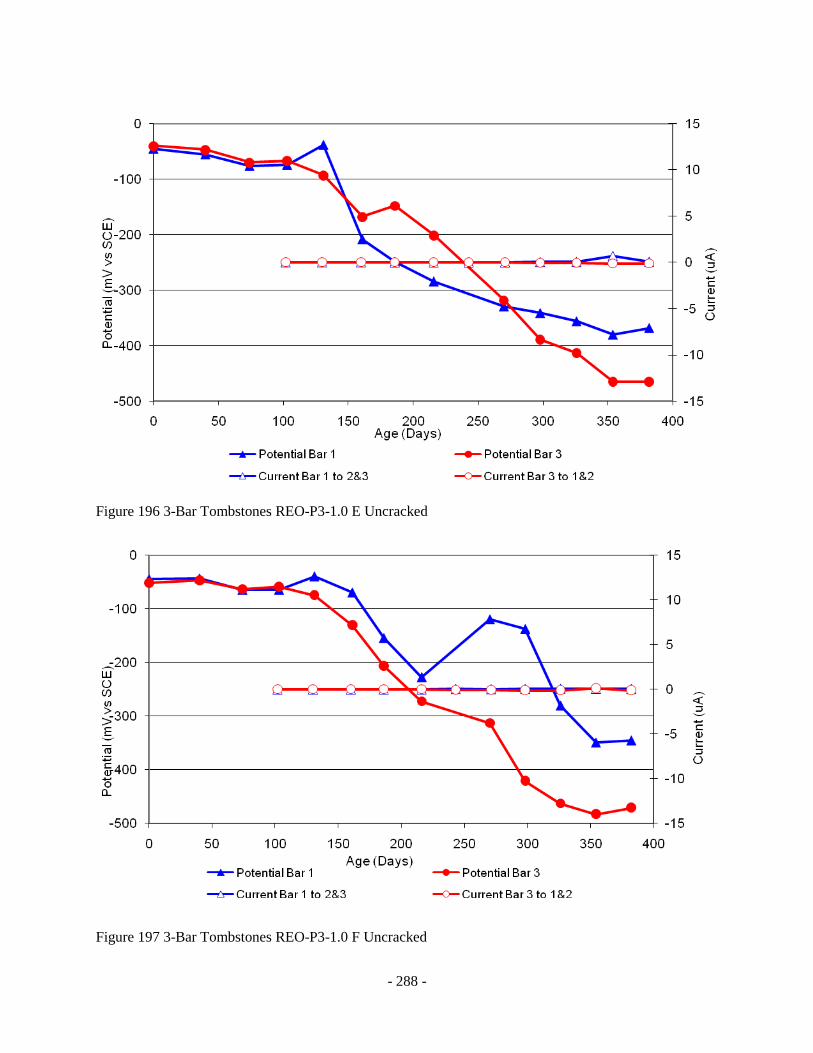
- 288 -
Figure 196 3-Bar Tombstones REO-P3-1.0 E Uncracked
Figure 197 3-Bar Tombstones REO-P3-1.0 F Uncracked
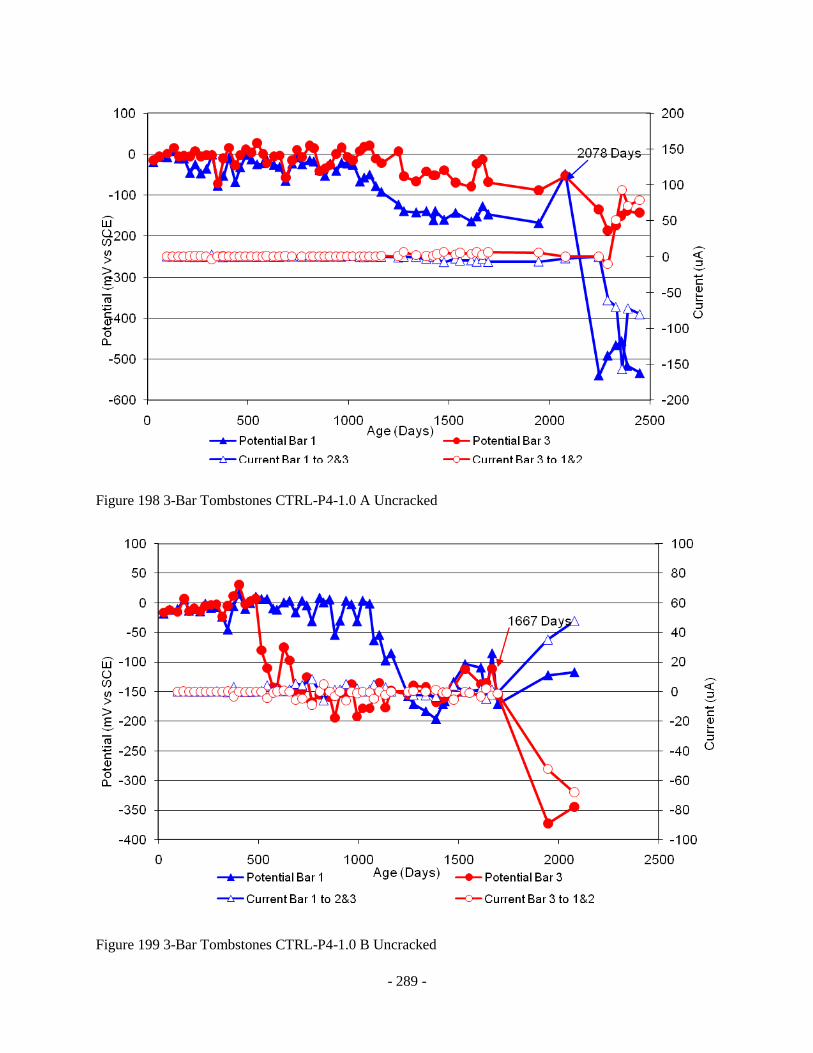
- 289 -
Figure 198 3-Bar Tombstones CTRL-P4-1.0 A Uncracked
Figure 199 3-Bar Tombstones CTRL-P4-1.0 B Uncracked
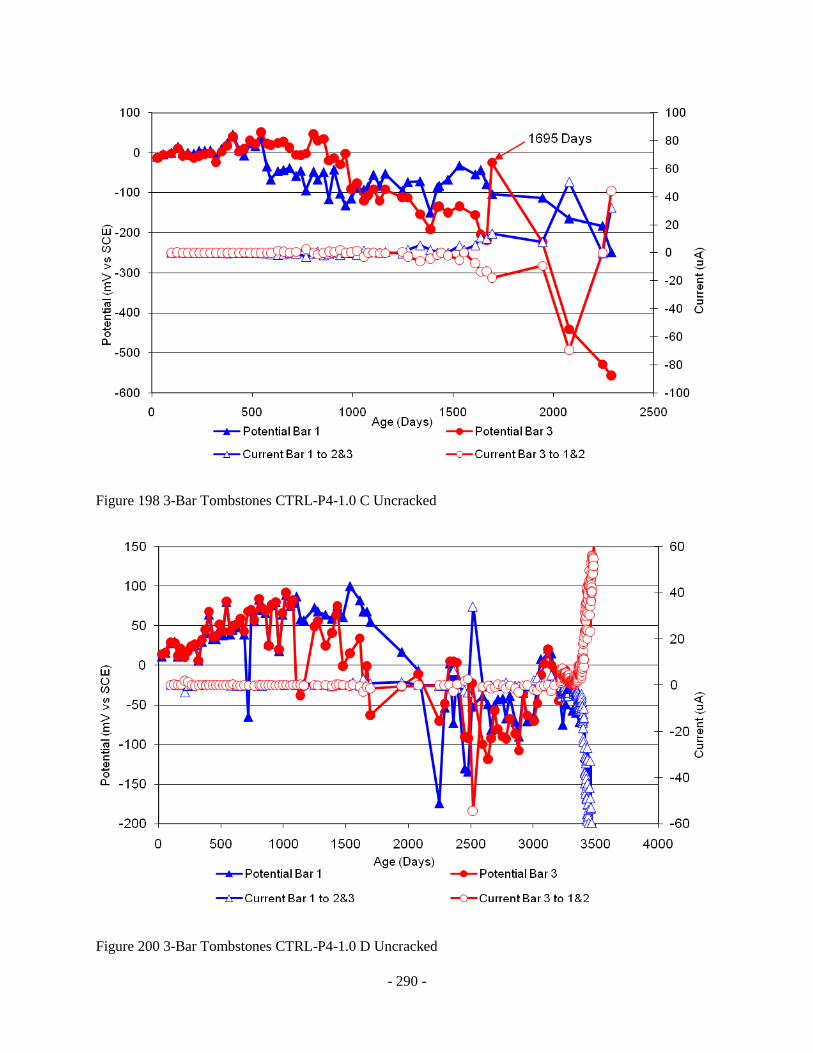
- 290 -
Figure 198 3-Bar Tombstones CTRL-P4-1.0 C Uncracked
Figure 200 3-Bar Tombstones CTRL-P4-1.0 D Uncracked

- 291 -
Figure 201 3-Bar Tombstones CTRL-P4-1.0 E Uncracked
Figure 202 3-Bar Tombstones CTRL-P4-1.0 F Uncracked

- 292 -
Figure 203 3-Bar Tombstones DCI-P4-1.0 A Uncracked
Figure 204 3-Bar Tombstones DCI-P4-1.0 B Uncracked

- 293 -
Figure 205 3-Bar Tombstones DCI-P4-1.0 C Uncracked
Figure 206 3-Bar Tombstones DCI-P4-1.0 D Uncracked
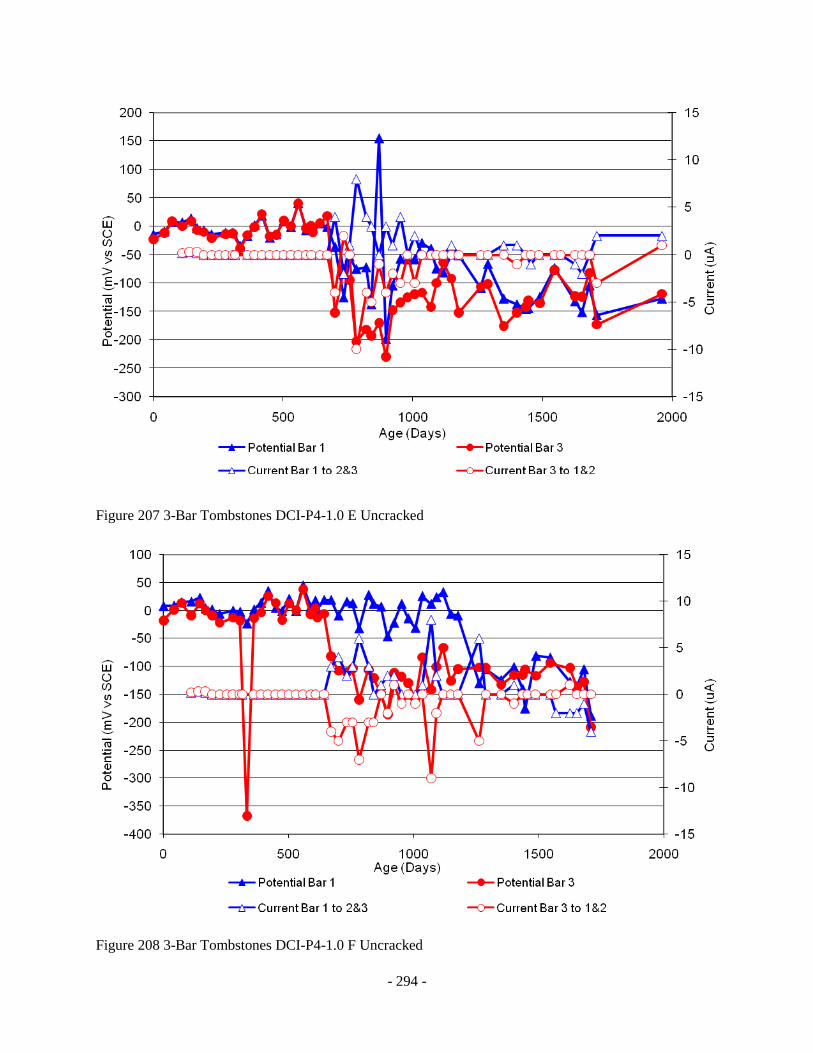
- 294 -
Figure 207 3-Bar Tombstones DCI-P4-1.0 E Uncracked
Figure 208 3-Bar Tombstones DCI-P4-1.0 F Uncracked

- 295 -
Figure 209 3-Bar Tombstones FER-P4-1.0 A Uncracked
Figure 210 3-Bar Tombstones FER-P4-1.0 B Uncracked

- 296 -
Figure 211 3-Bar Tombstones FER-P4-1.0 C Uncracked
Figure 212 3-Bar Tombstones FER-P4-1.0 D Uncracked

- 297 -
Figure 213 3-Bar Tombstones FER-P4-1.0 E Uncracked
Figure 214 3-Bar Tombstones FER-P4-1.0 F Uncracked
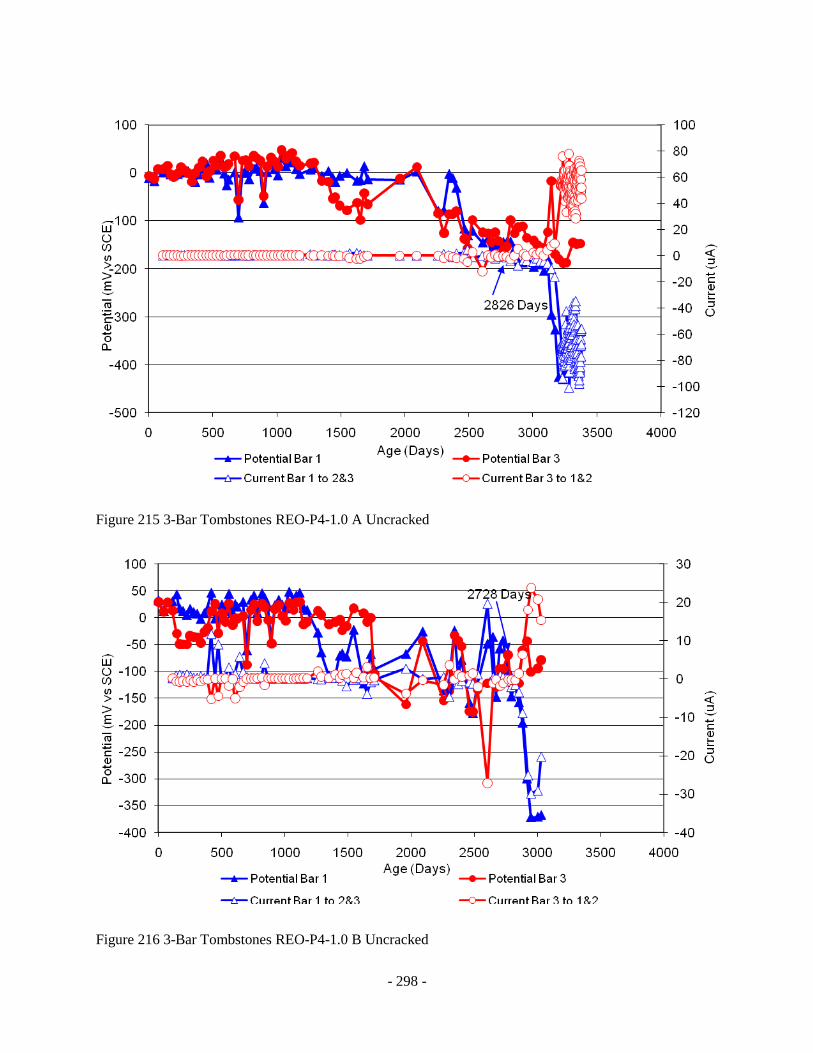
- 298 -
Figure 215 3-Bar Tombstones REO-P4-1.0 A Uncracked
Figure 216 3-Bar Tombstones REO-P4-1.0 B Uncracked
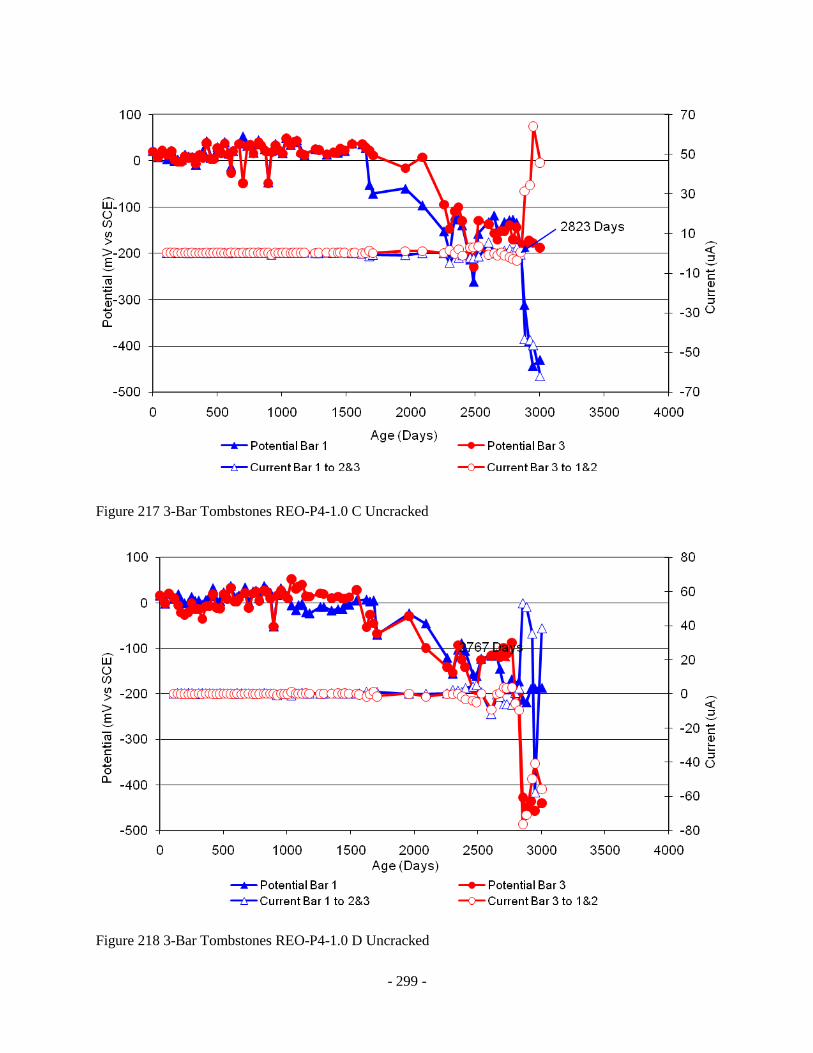
- 299 -
Figure 217 3-Bar Tombstones REO-P4-1.0 C Uncracked
Figure 218 3-Bar Tombstones REO-P4-1.0 D Uncracked

- 300 -
Figure 219 3-Bar Tombstones REO-P4-1.0 E Uncracked
Figure 220 3-Bar Tombstones REO-P4-1.0 F Uncracked

- 301 -
Appendix 2
G109 Specimen Electrochemical Graphs
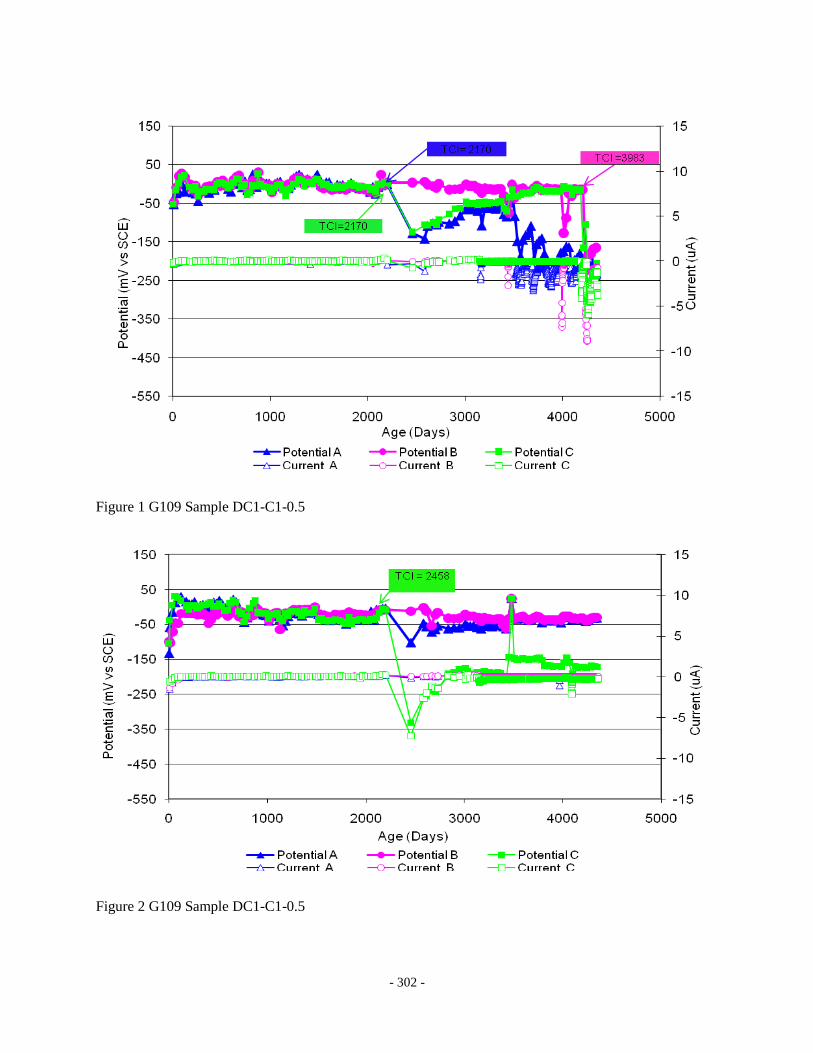
- 302 -
Figure 1 G109 Sample DC1-C1-0.5
Figure 2 G109 Sample DC1-C1-0.5
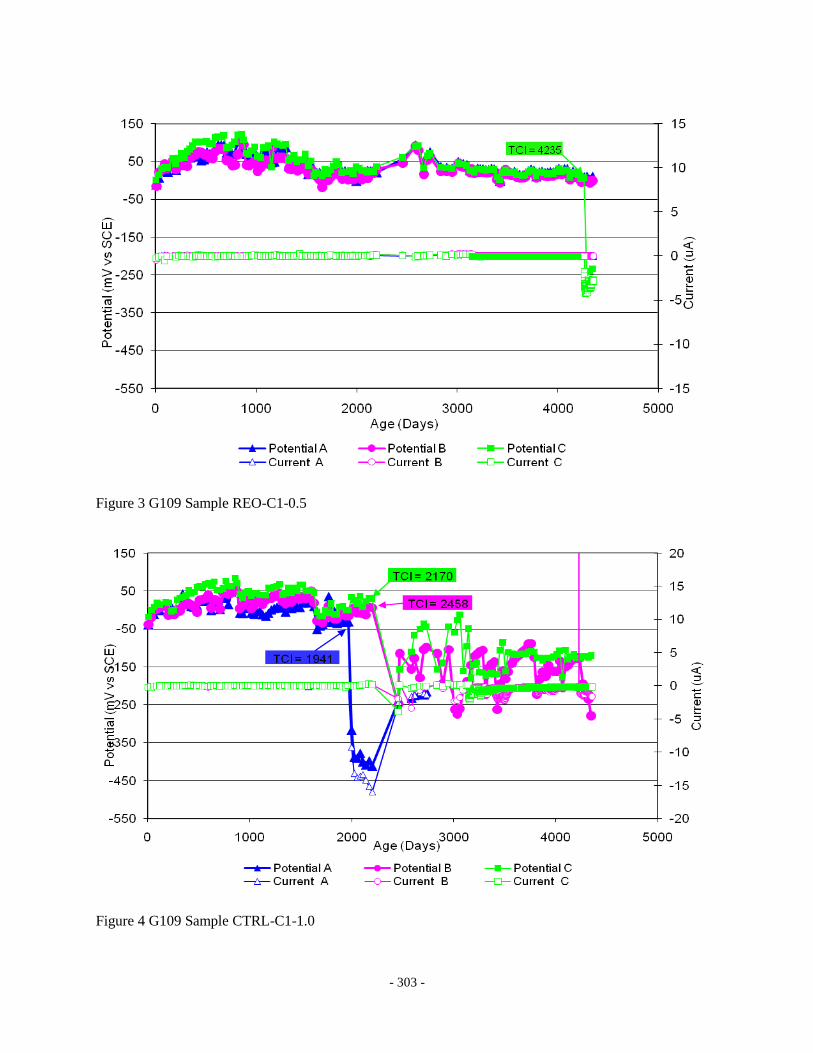
- 303 -
Figure 3 G109 Sample REO-C1-0.5
Figure 4 G109 Sample CTRL-C1-1.0
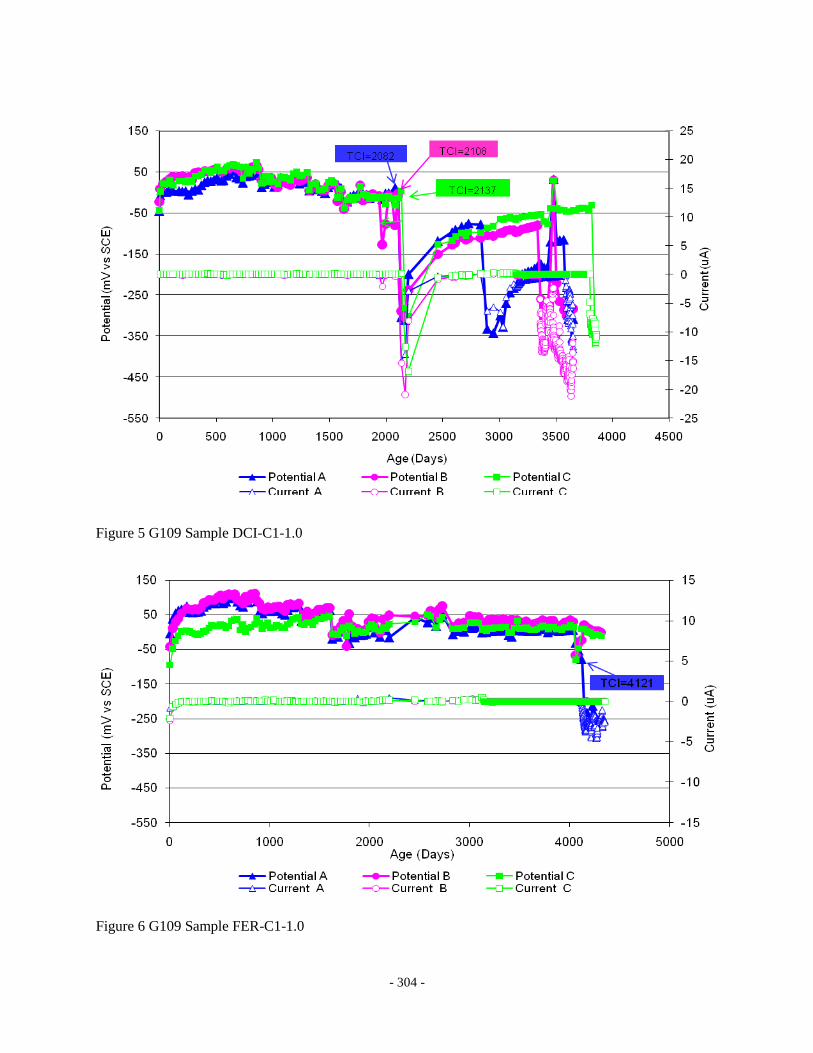
- 304 -
Figure 5 G109 Sample DCI-C1-1.0
Figure 6 G109 Sample FER-C1-1.0
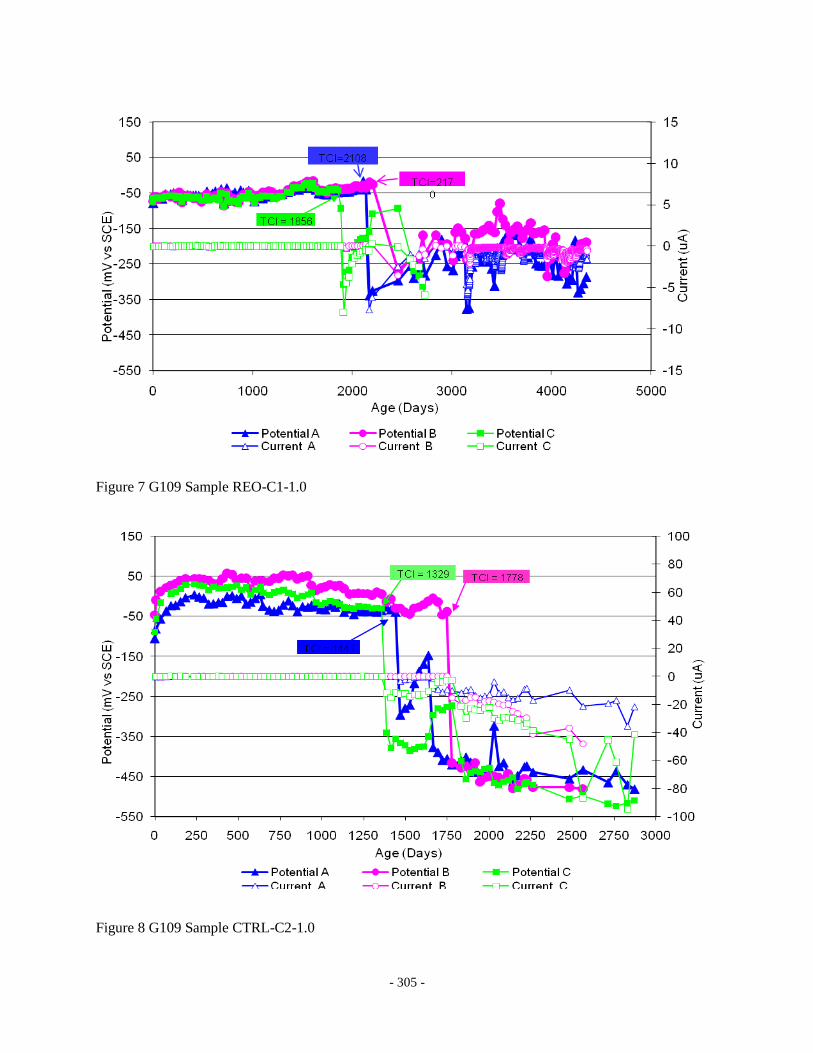
- 305 -
Figure 7 G109 Sample REO-C1-1.0
Figure 8 G109 Sample CTRL-C2-1.0
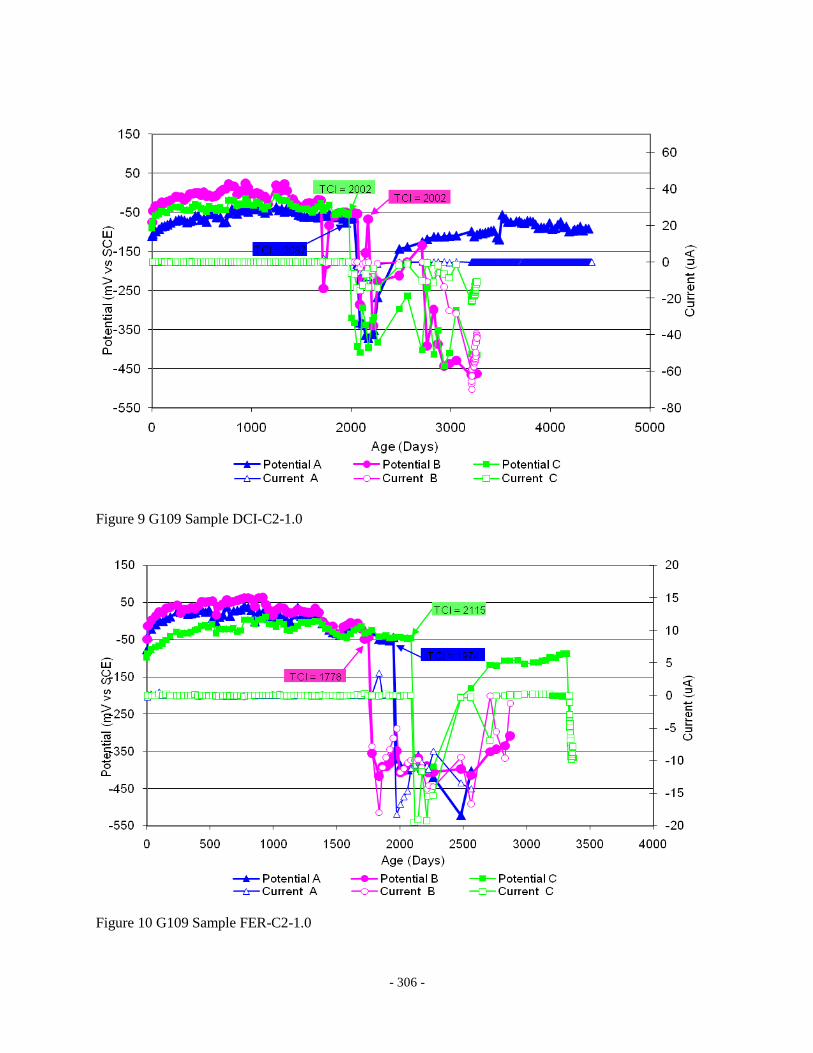
- 306 -
Figure 9 G109 Sample DCI-C2-1.0
Figure 10 G109 Sample FER-C2-1.0
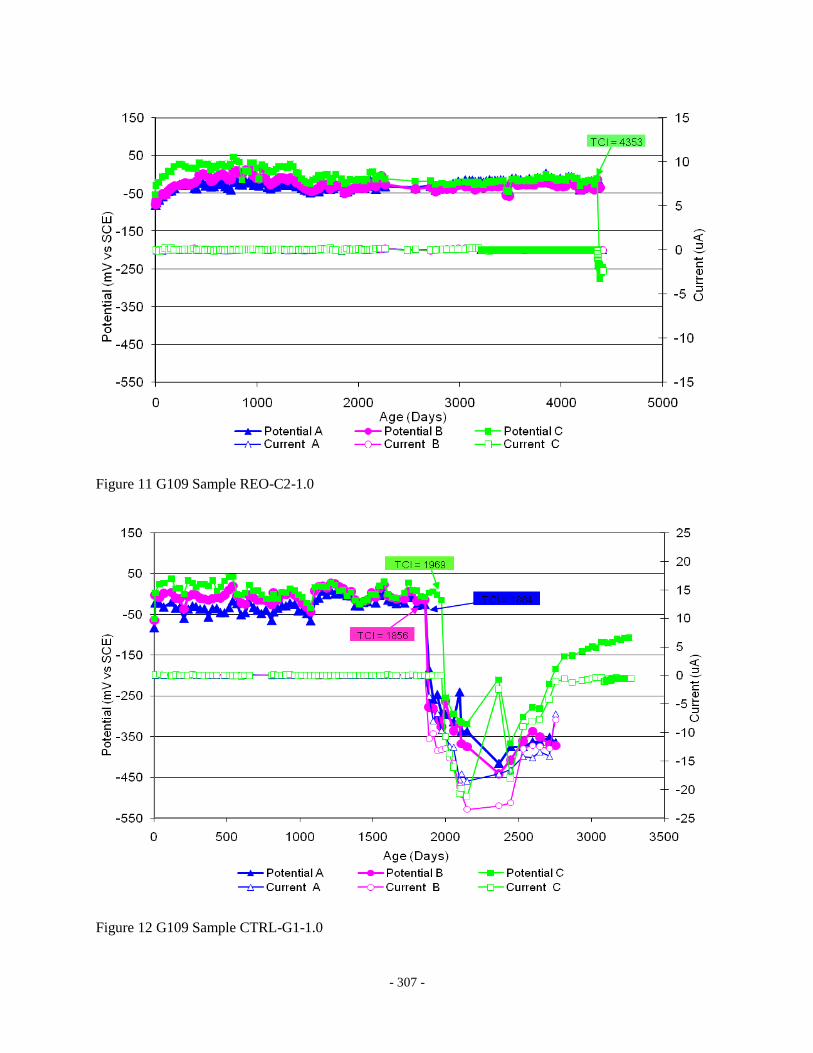
- 307 -
Figure 11 G109 Sample REO-C2-1.0
Figure 12 G109 Sample CTRL-G1-1.0
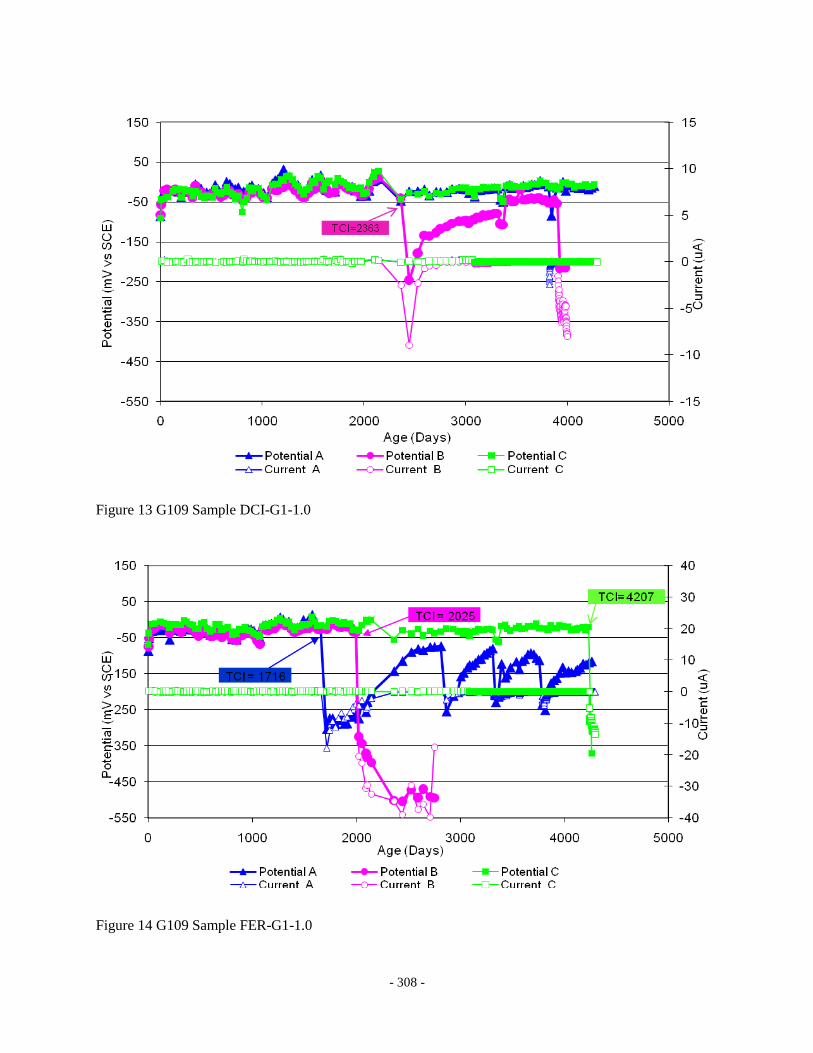
- 308 -
Figure 13 G109 Sample DCI-G1-1.0
Figure 14 G109 Sample FER-G1-1.0
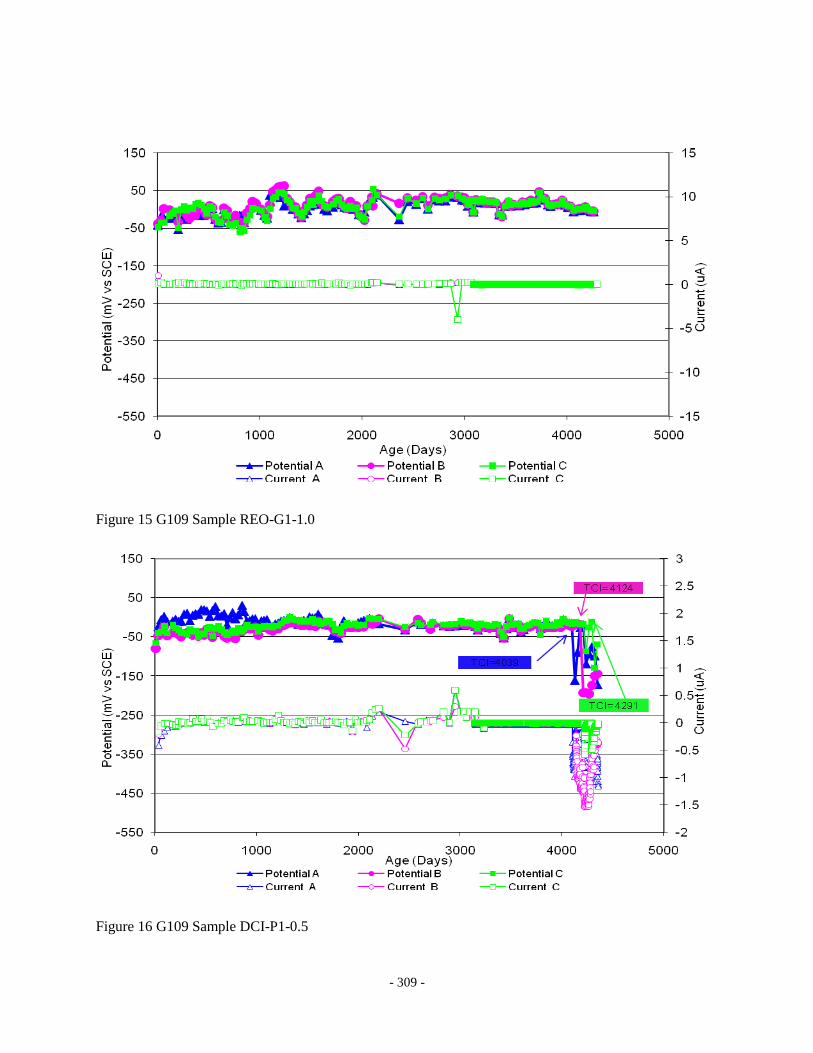
- 309 -
Figure 15 G109 Sample REO-G1-1.0
Figure 16 G109 Sample DCI-P1-0.5
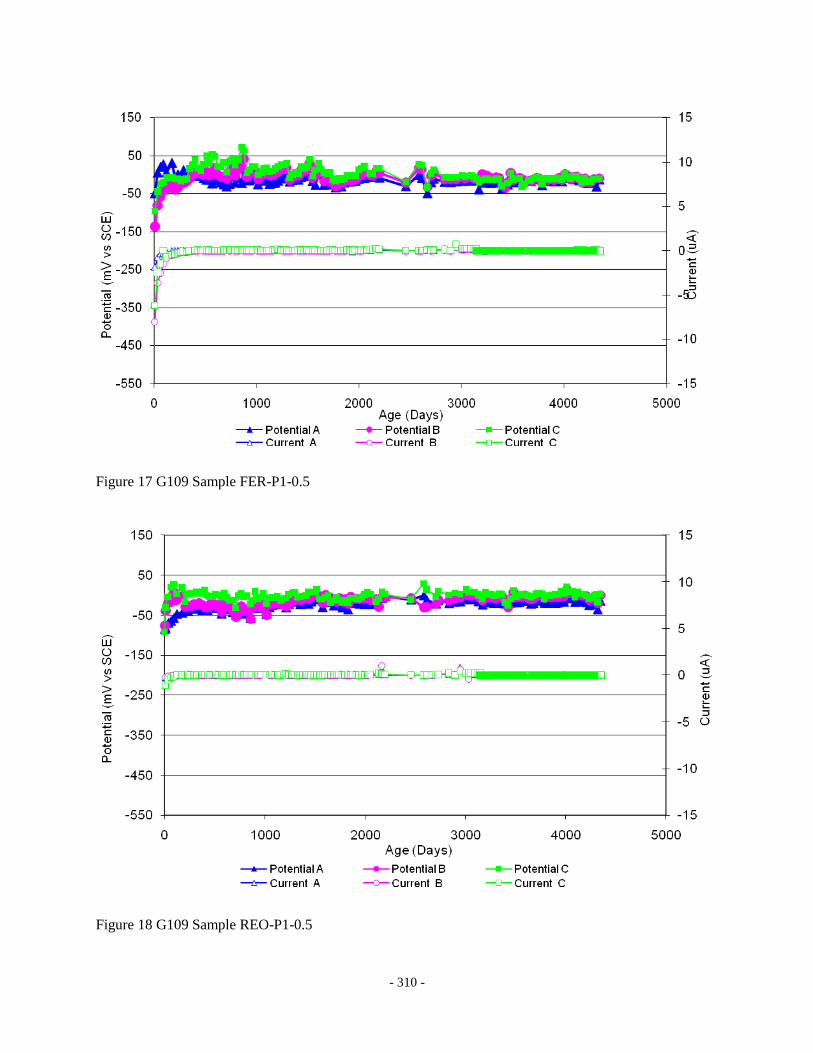
- 310 -
Figure 17 G109 Sample FER-P1-0.5
Figure 18 G109 Sample REO-P1-0.5

- 311 -
Figure 19 G109 Sample CTRL-P1-1.0
Figure 20 G109 Sample DCI-P1-1.0
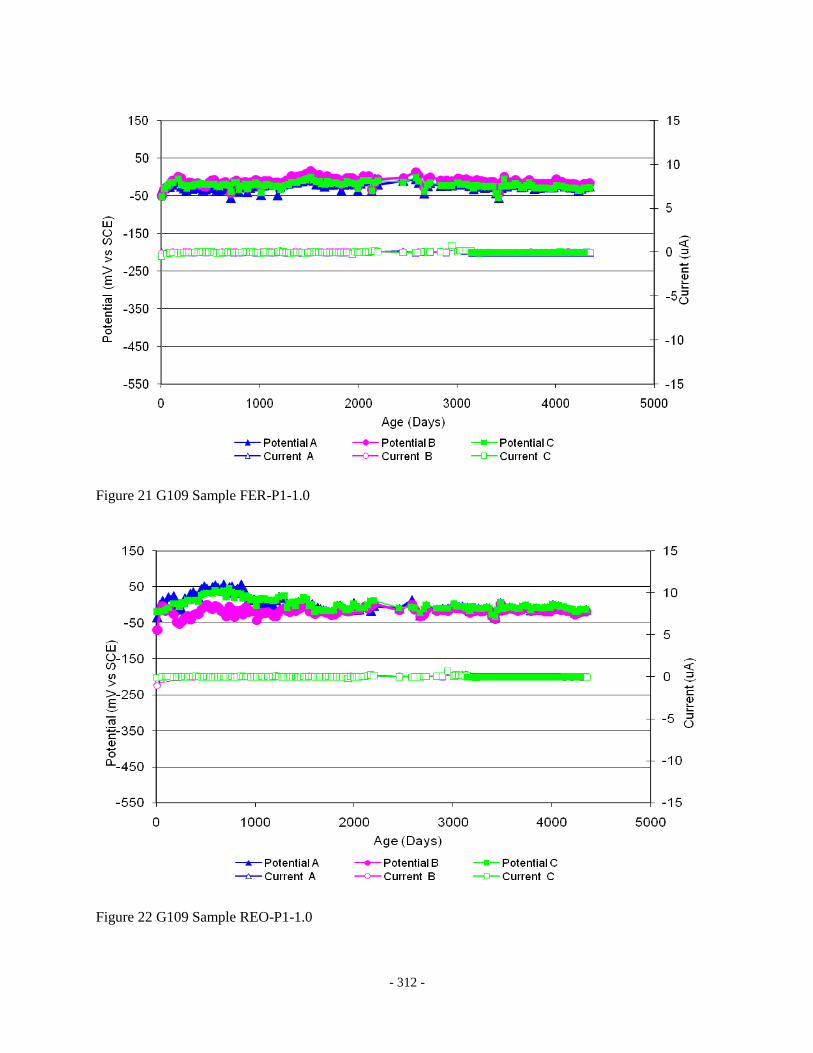
- 312 -
Figure 21 G109 Sample FER-P1-1.0
Figure 22 G109 Sample REO-P1-1.0
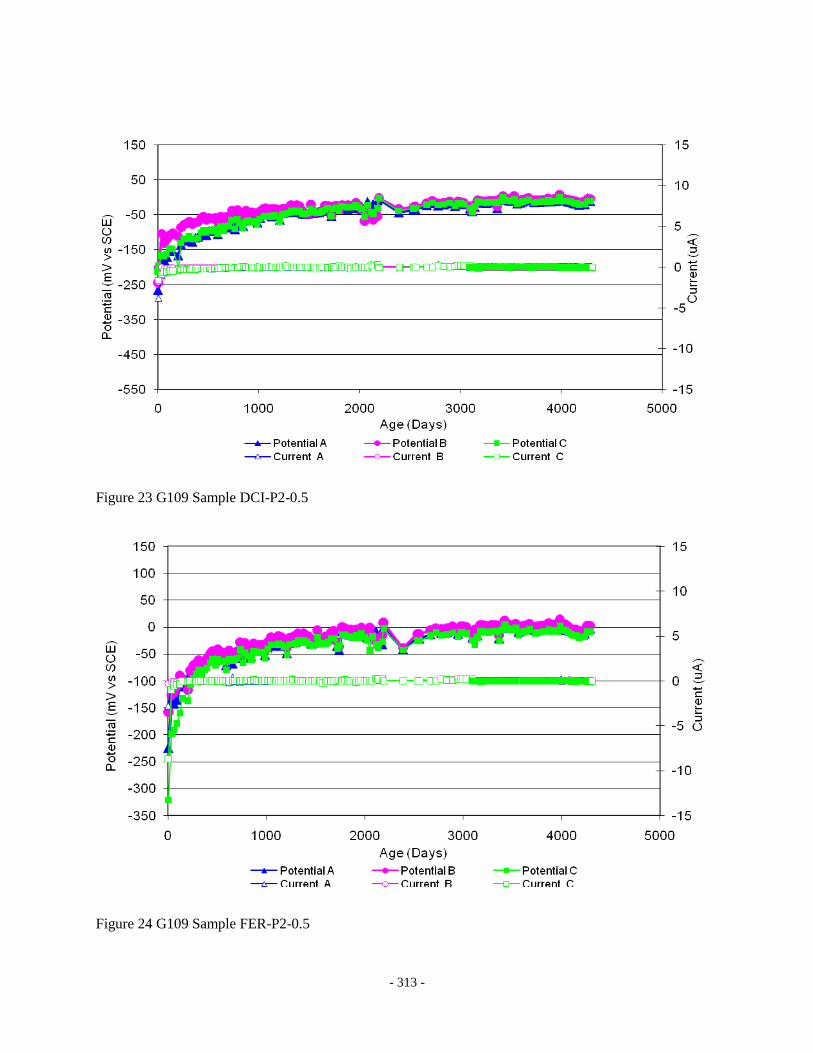
- 313 -
Figure 23 G109 Sample DCI-P2-0.5
Figure 24 G109 Sample FER-P2-0.5
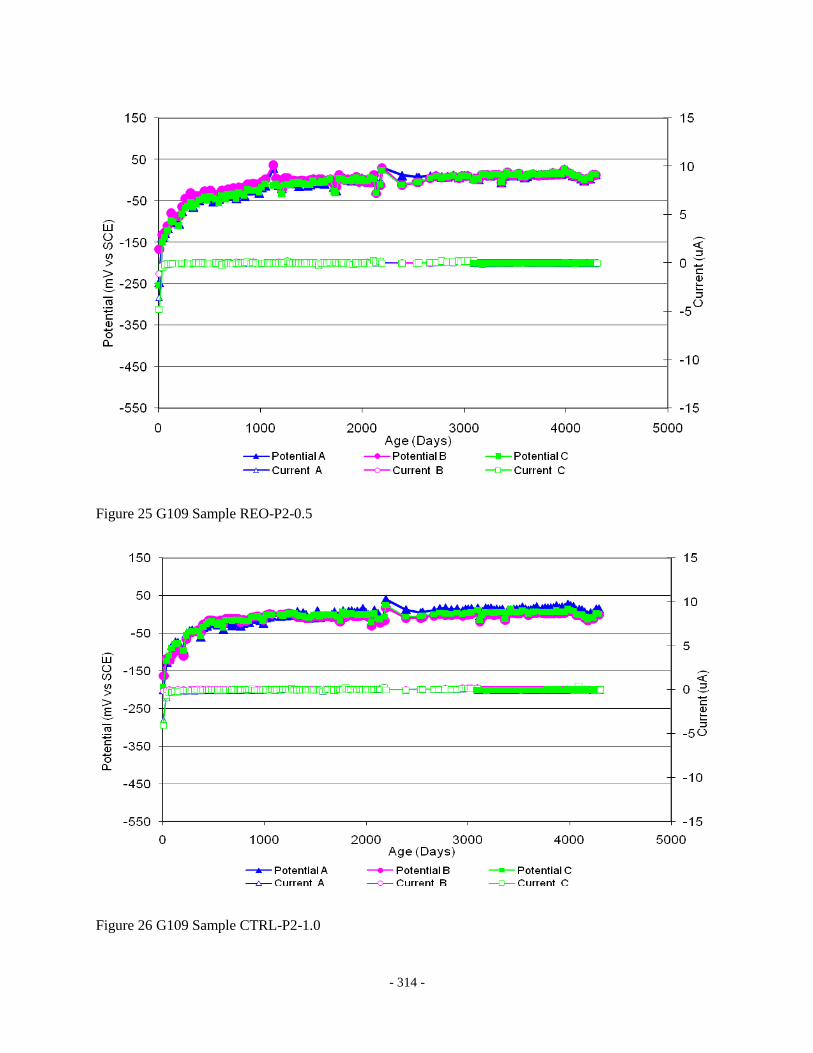
- 314 -
Figure 25 G109 Sample REO-P2-0.5
Figure 26 G109 Sample CTRL-P2-1.0
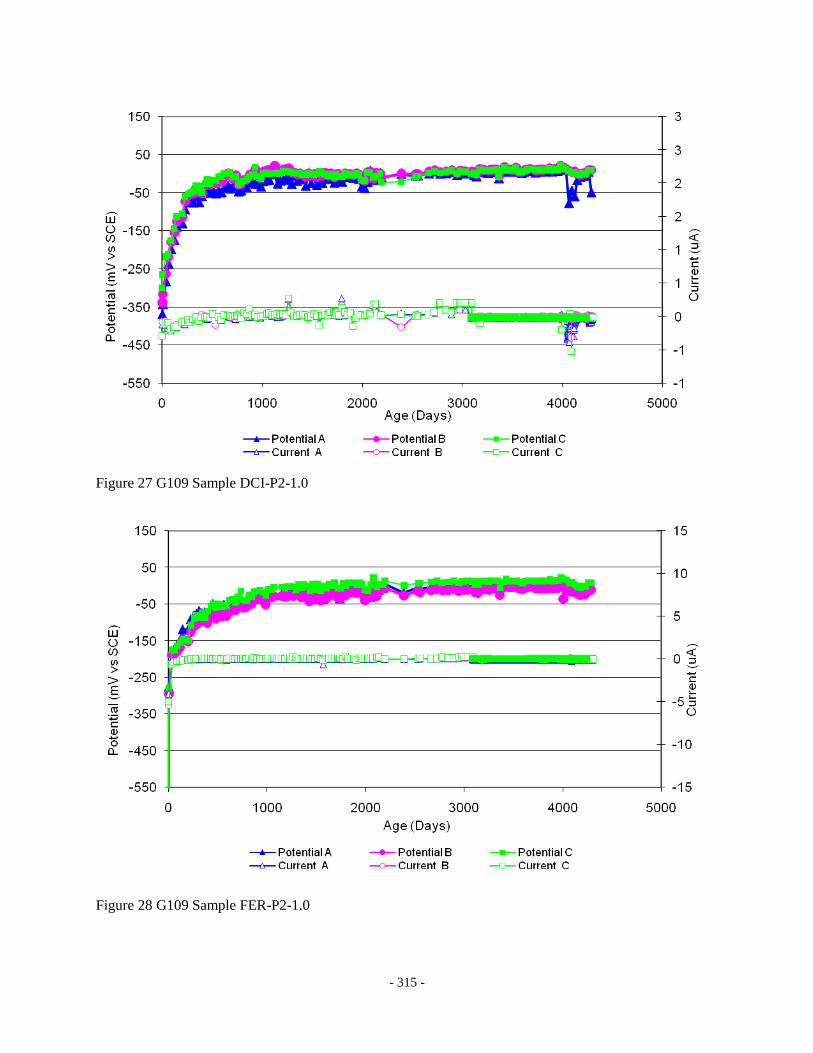
- 315 -
Figure 27 G109 Sample DCI-P2-1.0
Figure 28 G109 Sample FER-P2-1.0

- 316 -
Figure 29 G109 Sample REO-P2-1.0
Figure 30 G109 Sample CTRL-P3-1.0
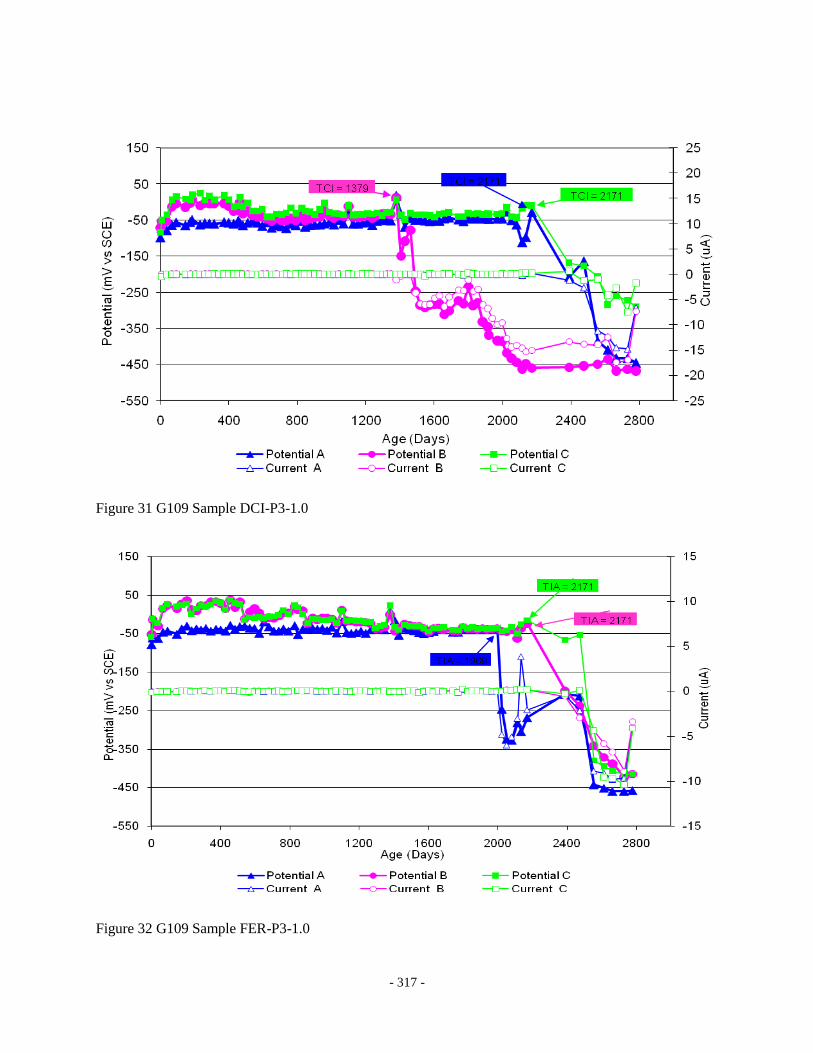
- 317 -
Figure 31 G109 Sample DCI-P3-1.0
Figure 32 G109 Sample FER-P3-1.0

- 318 -
Figure 33 G109 Sample REO-P3-1.0
Figure 34 G109 Sample CTRL-P4-1.0

- 319 -
Figure 35 G109 Sample DCI-P4-1.0
Figure 36 G109 Sample FER-P4-1.0
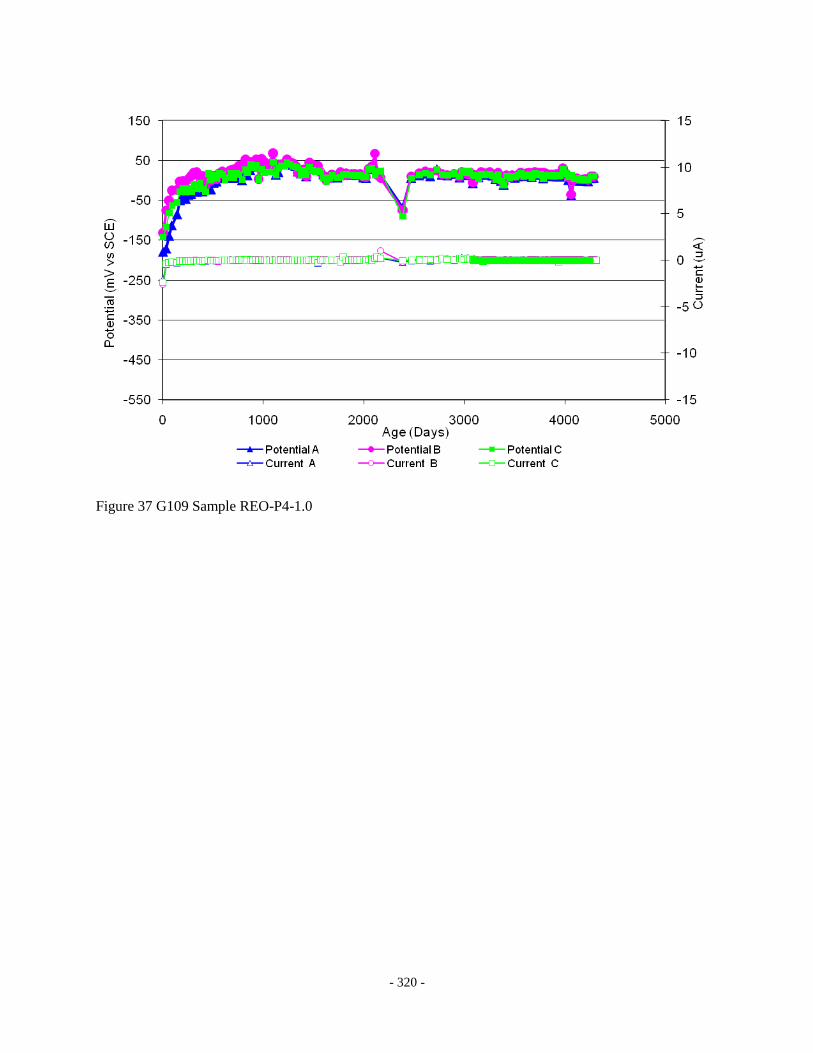
- 320 -
Figure 37 G109 Sample REO-P4-1.0

- 321 -
Appendix 3
Field Specimen Electrochemical Graphs

- 322 -
Figure 1 Field Sample CTRL-C1-A
Figure 2 Field Sample CTRL-C1-B.
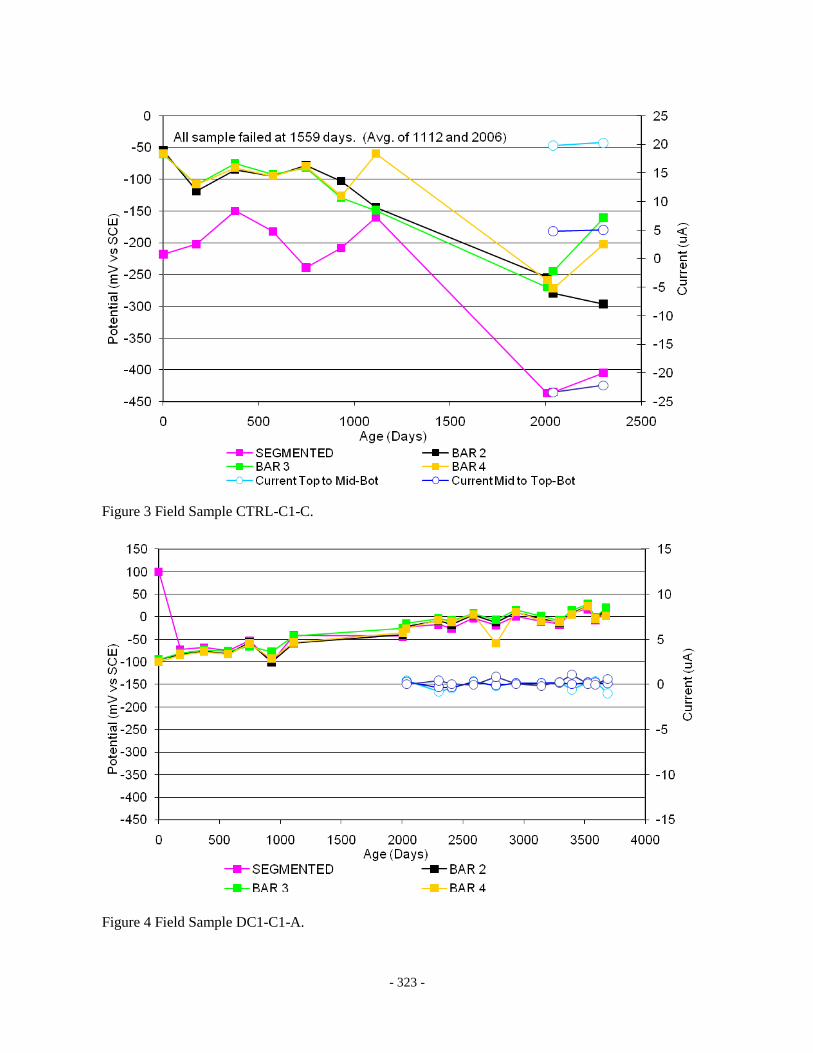
- 323 -
Figure 3 Field Sample CTRL-C1-C.
Figure 4 Field Sample DC1-C1-A.
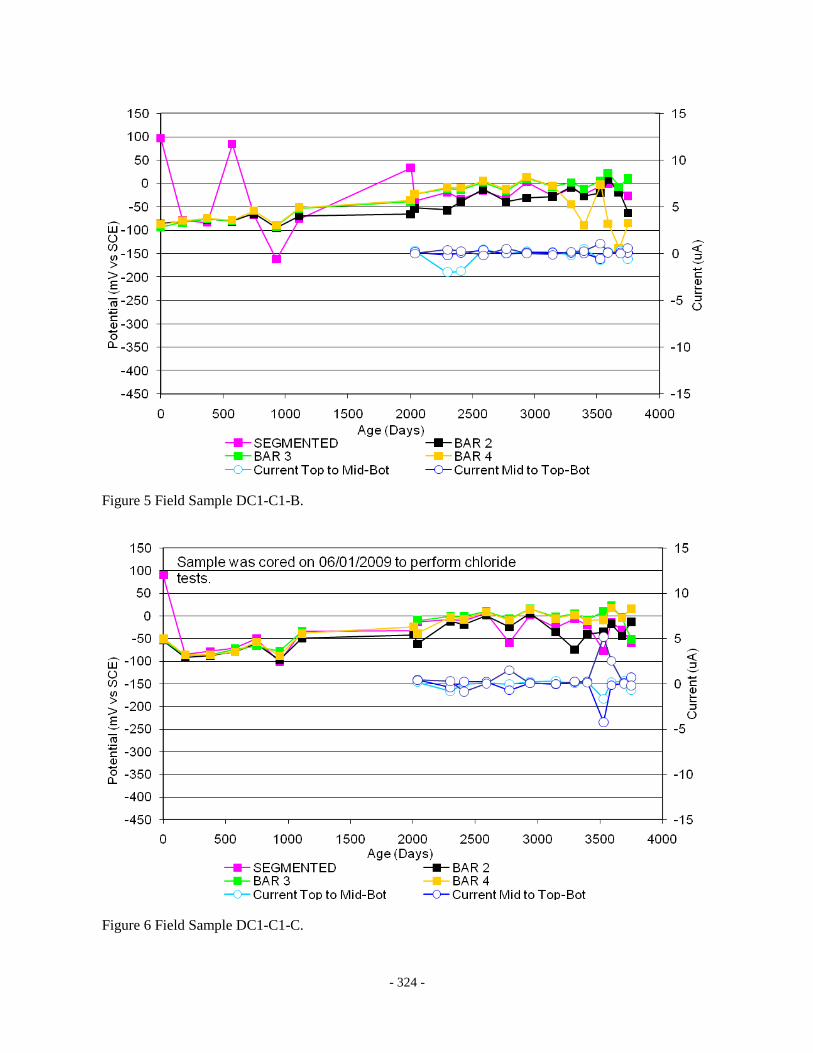
- 324 -
Figure 5 Field Sample DC1-C1-B.
Figure 6 Field Sample DC1-C1-C.
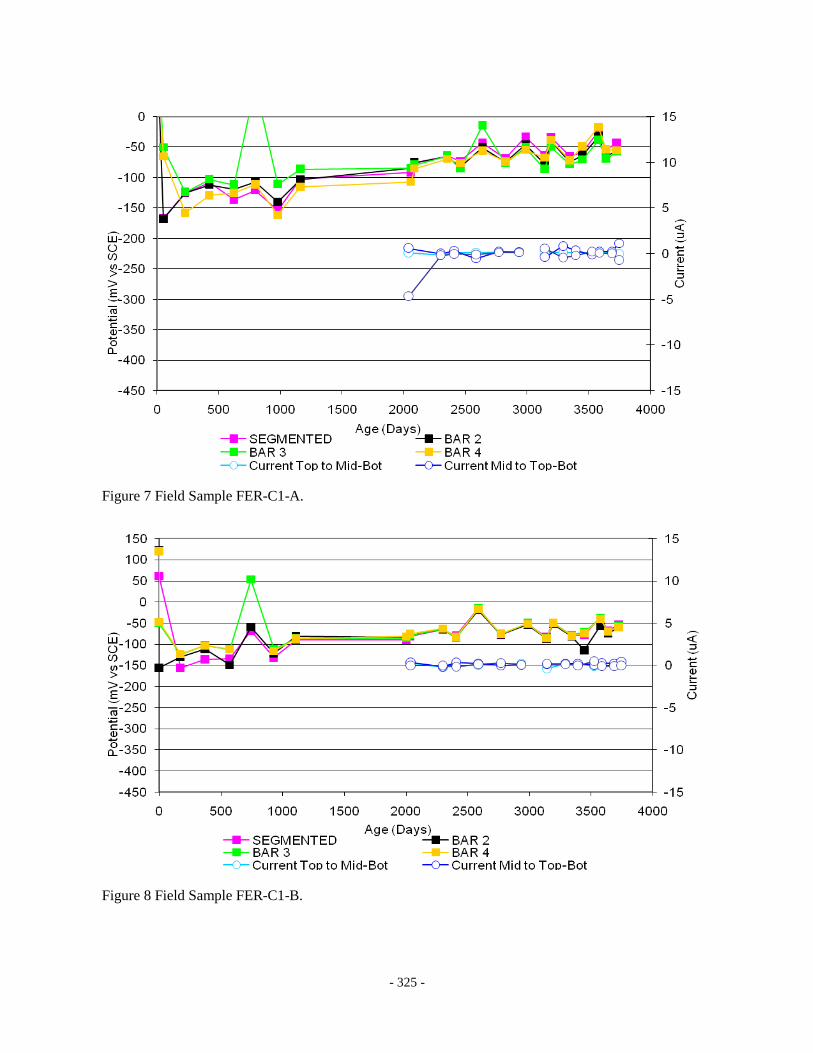
- 325 -
Figure 7 Field Sample FER-C1-A.
Figure 8 Field Sample FER-C1-B.

- 326 -
Figure 9 Field Sample FER-C1-C.
Figure 10 Field Sample REO-C1-A.
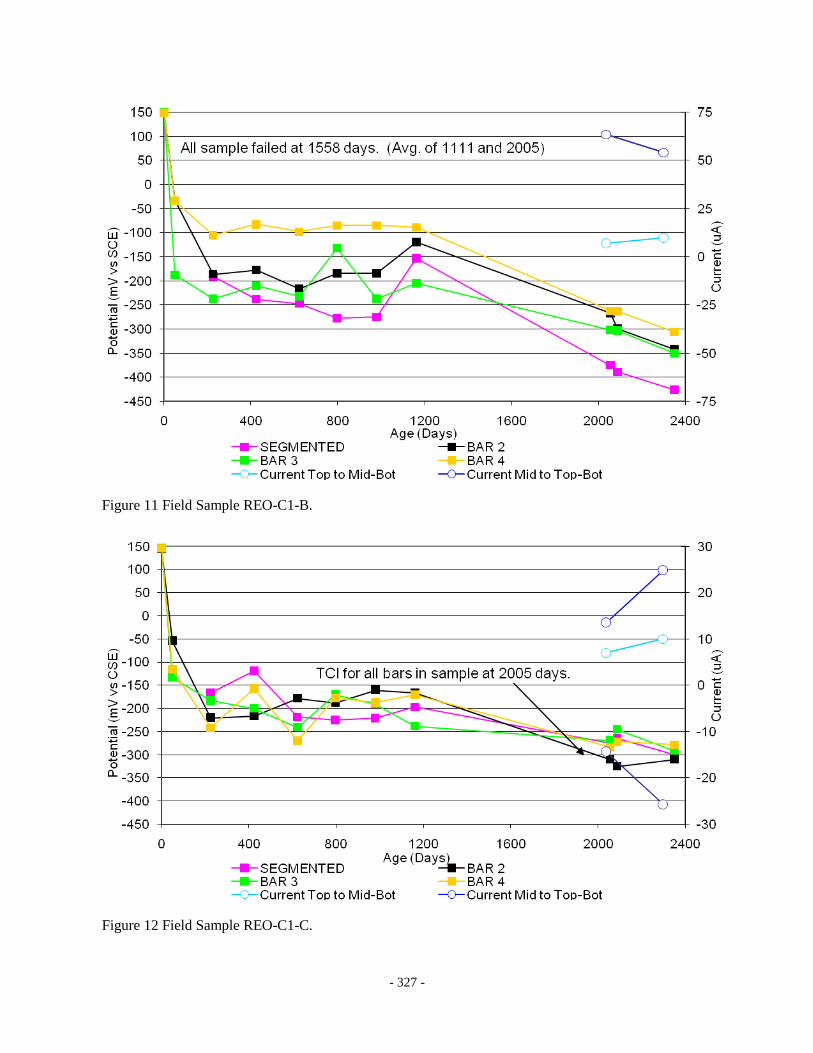
- 327 -
Figure 11 Field Sample REO-C1-B.
Figure 12 Field Sample REO-C1-C.
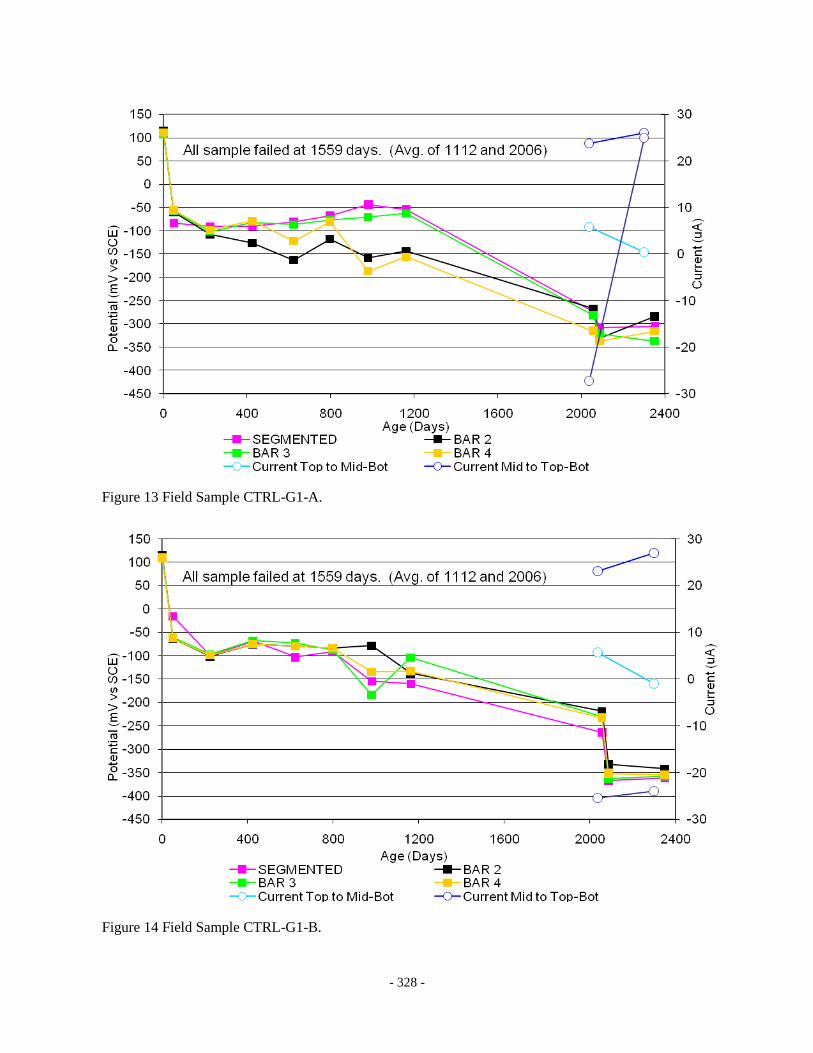
- 328 -
Figure 13 Field Sample CTRL-G1-A.
Figure 14 Field Sample CTRL-G1-B.
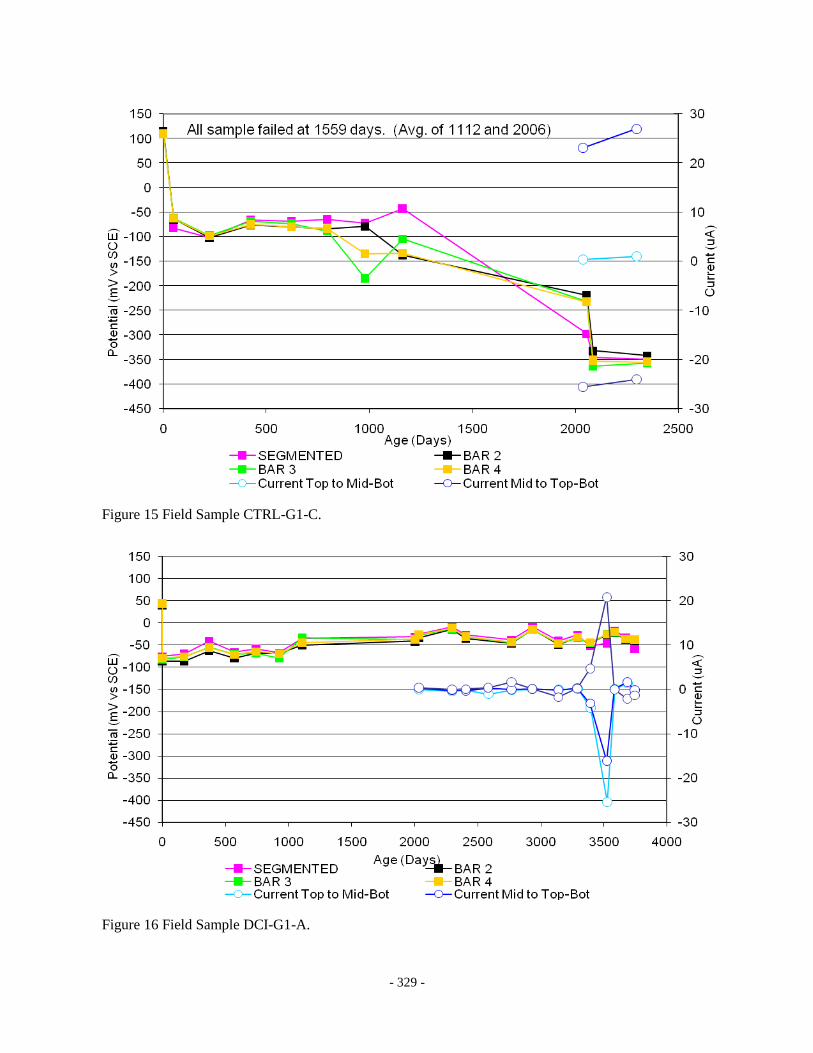
- 329 -
Figure 15 Field Sample CTRL-G1-C.
Figure 16 Field Sample DCI-G1-A.

- 330 -
Figure 17 Field Sample DCI-G1-B.
Figure 18 Field Sample DCI-G1-C.
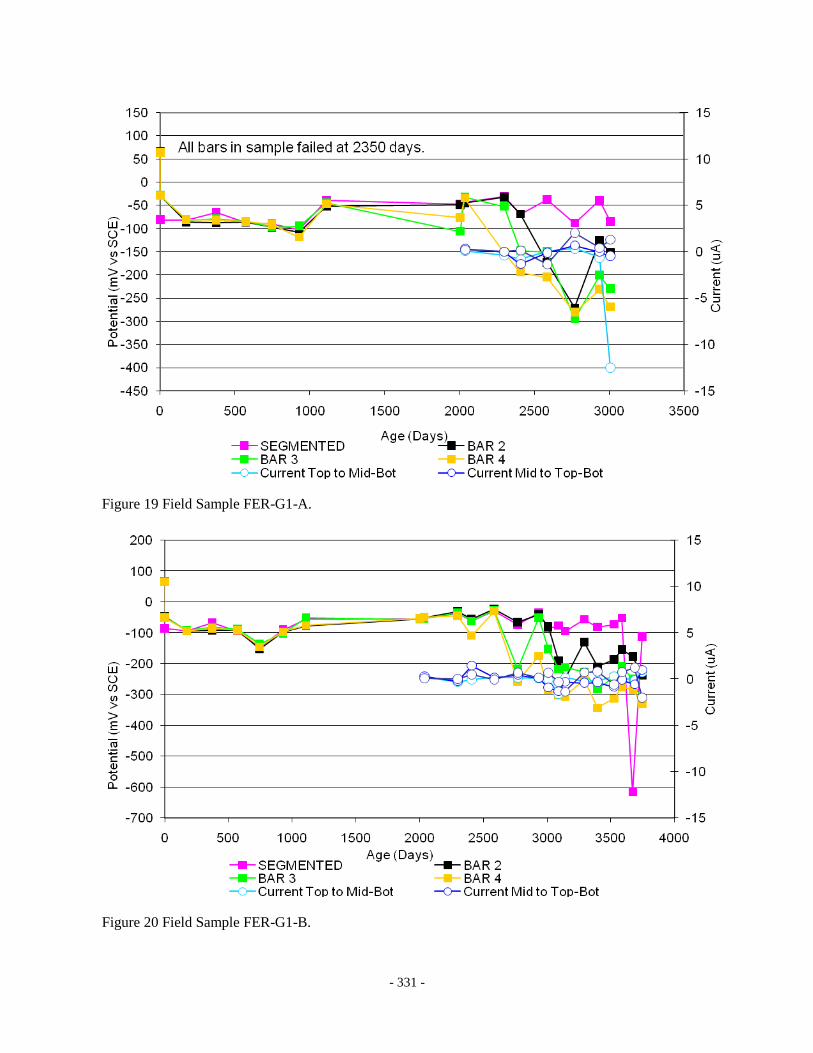
- 331 -
Figure 19 Field Sample FER-G1-A.
Figure 20 Field Sample FER-G1-B.

- 332 -
Figure 21 Field Sample FER-G1-C.
Figure 22 Field Sample REO-G1-A.

- 333 -
Figure 23 Field Sample REO-G1-B.
Figure 24 Field Sample REO-G1-C.
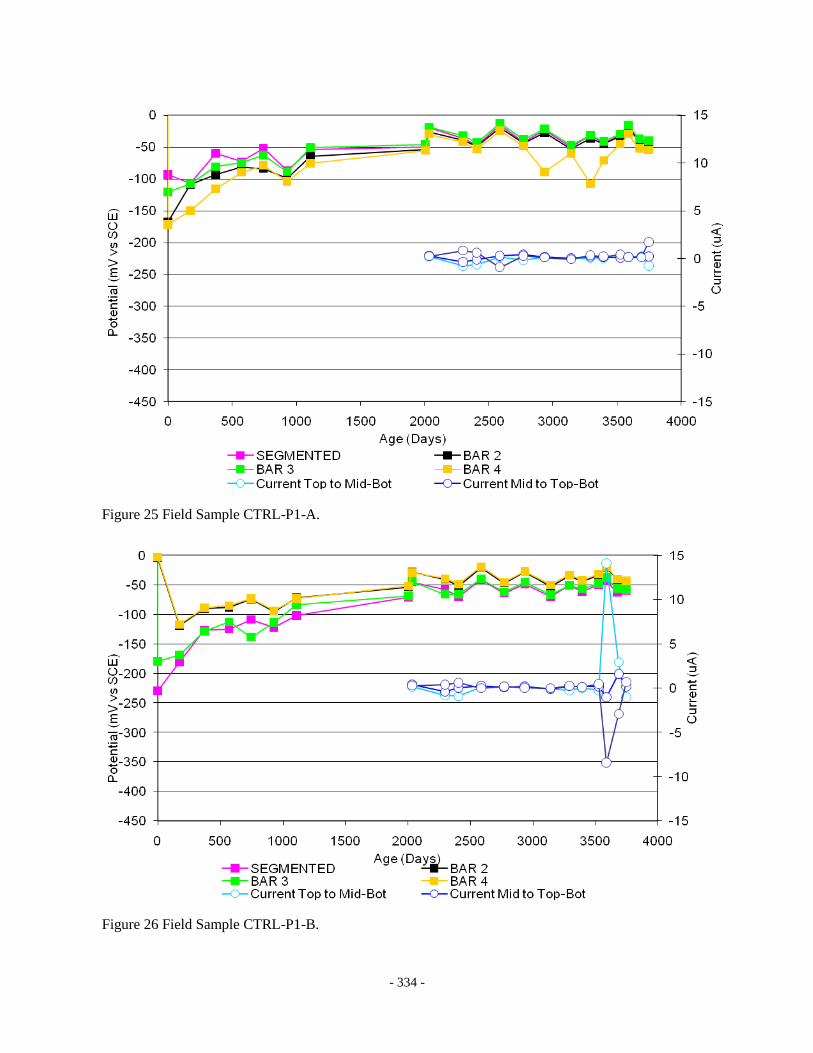
- 334 -
Figure 25 Field Sample CTRL-P1-A.
Figure 26 Field Sample CTRL-P1-B.
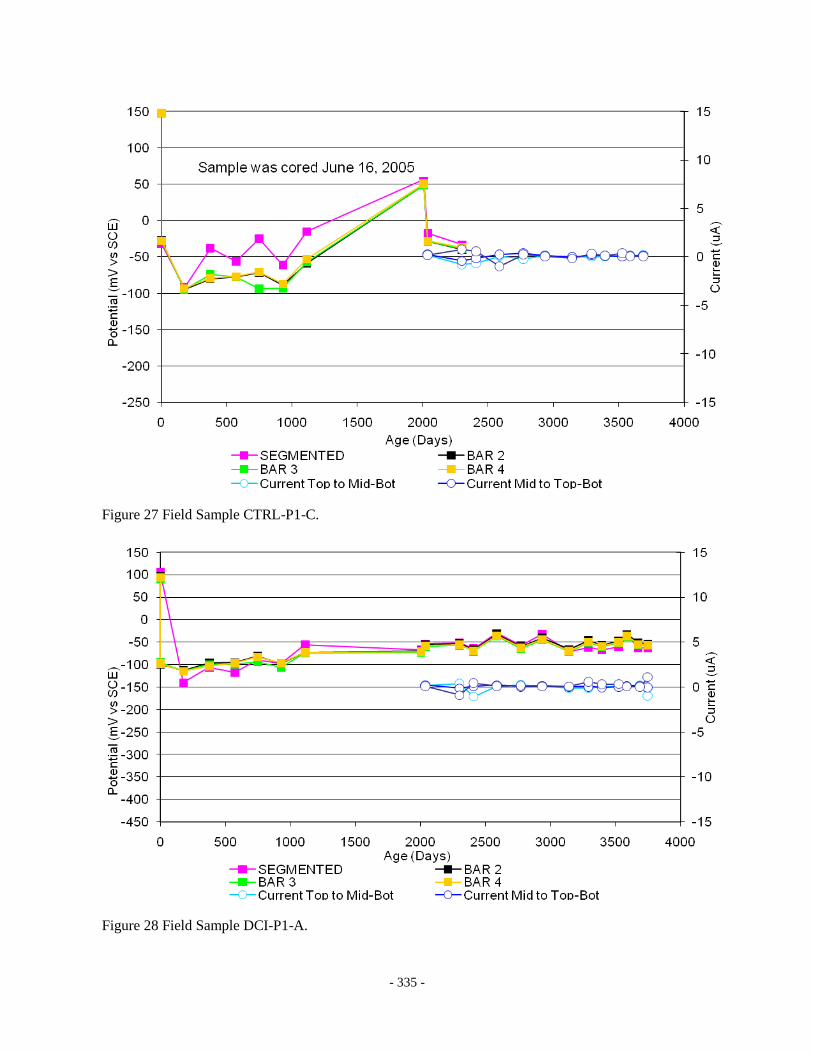
- 335 -
Figure 27 Field Sample CTRL-P1-C.
Figure 28 Field Sample DCI-P1-A.

- 336 -
Figure 29 Field Sample DCI-P1-B.
Figure 30 Field Sample DCI-P1-C.
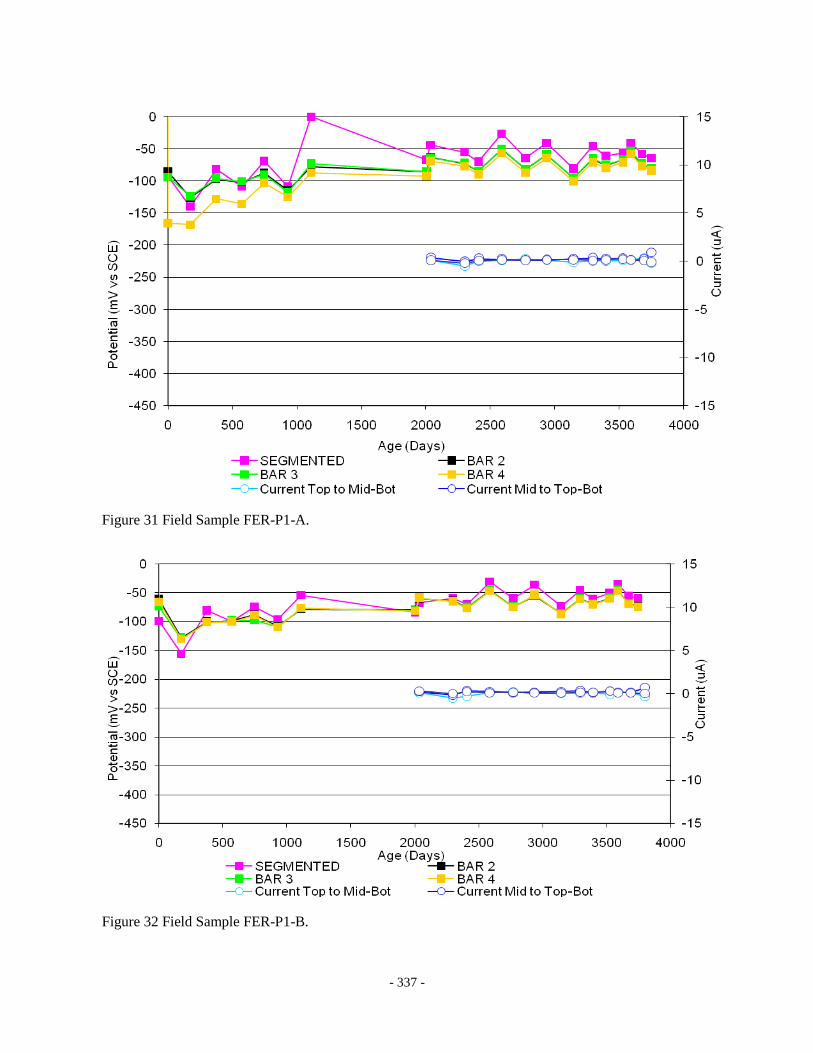
- 337 -
Figure 31 Field Sample FER-P1-A.
Figure 32 Field Sample FER-P1-B.

- 338 -
Figure 33 Field Sample FER-P1-C.
Figure 34 Field Sample REO-P1-A.
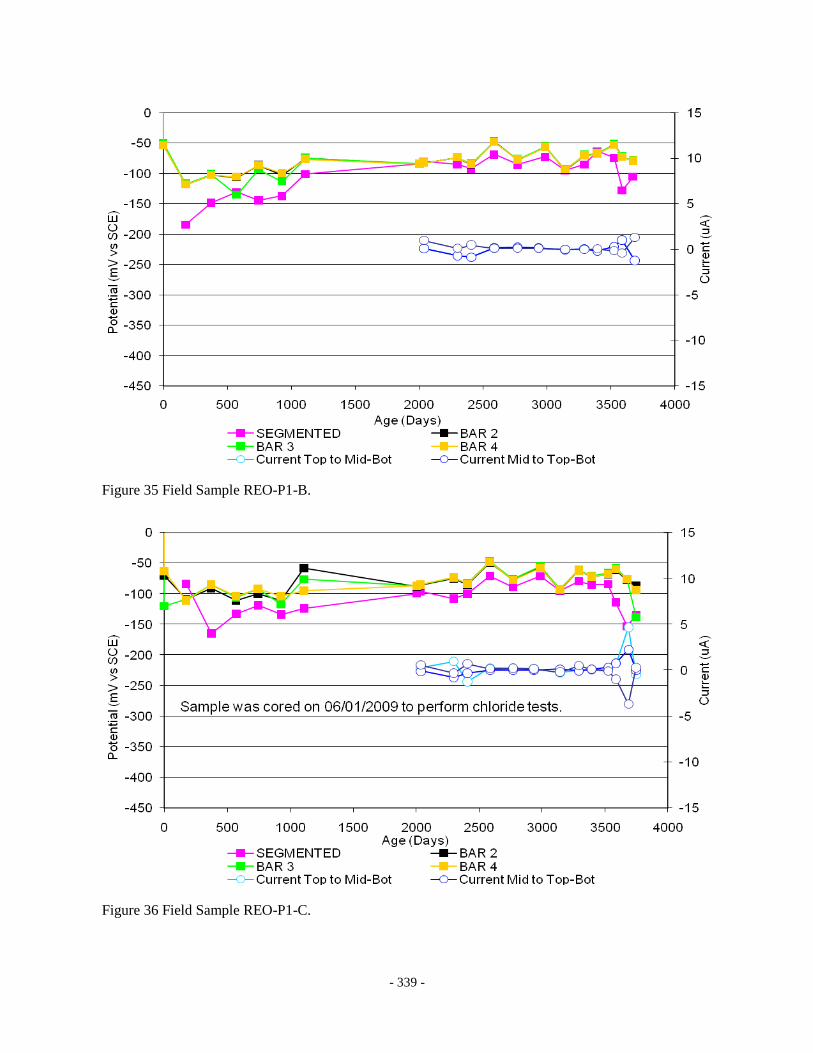
- 339 -
Figure 35 Field Sample REO-P1-B.
Figure 36 Field Sample REO-P1-C.
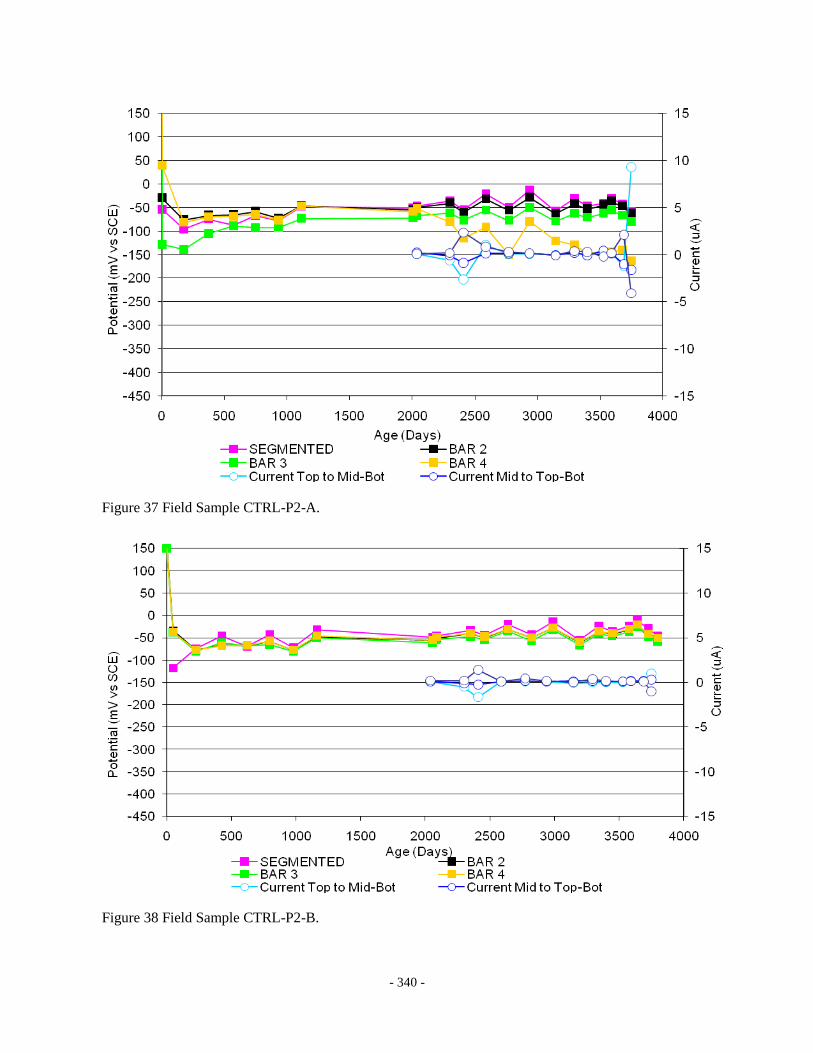
- 340 -
Figure 37 Field Sample CTRL-P2-A.
Figure 38 Field Sample CTRL-P2-B.
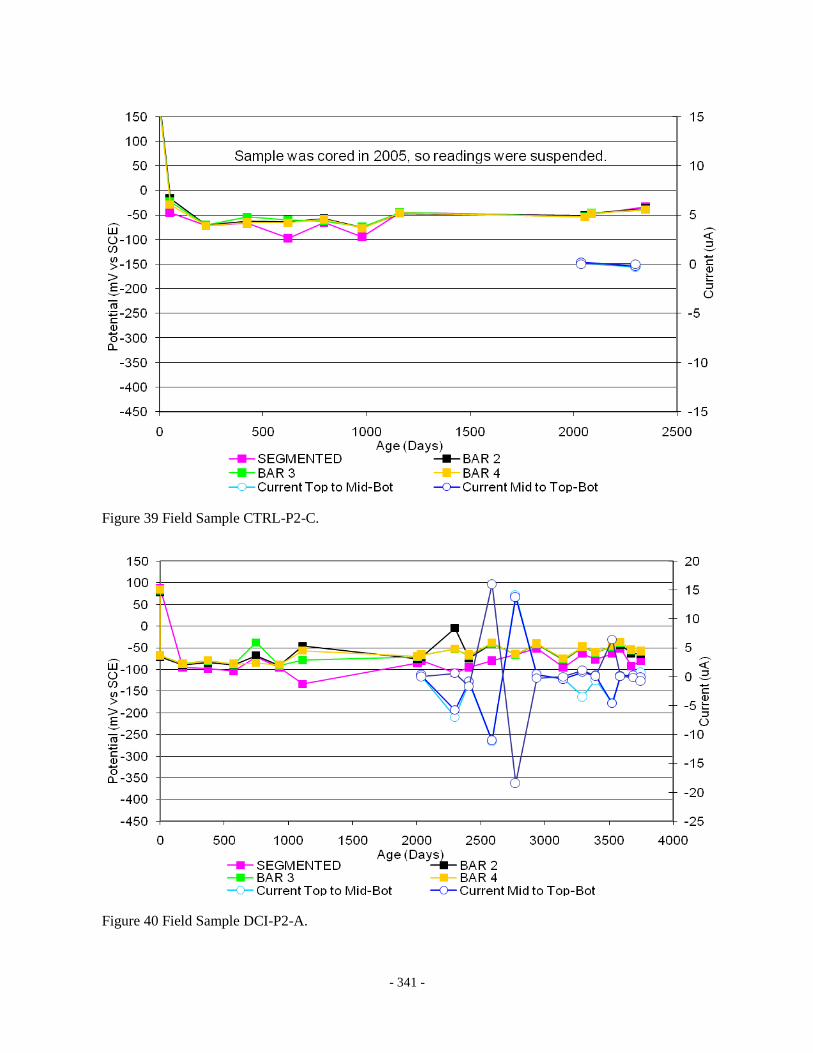
- 341 -
Figure 39 Field Sample CTRL-P2-C.
Figure 40 Field Sample DCI-P2-A.

- 342 -
Figure 41 Field Sample DCI-P2-B.
Figure 42 Field Sample DCI-P2-C.
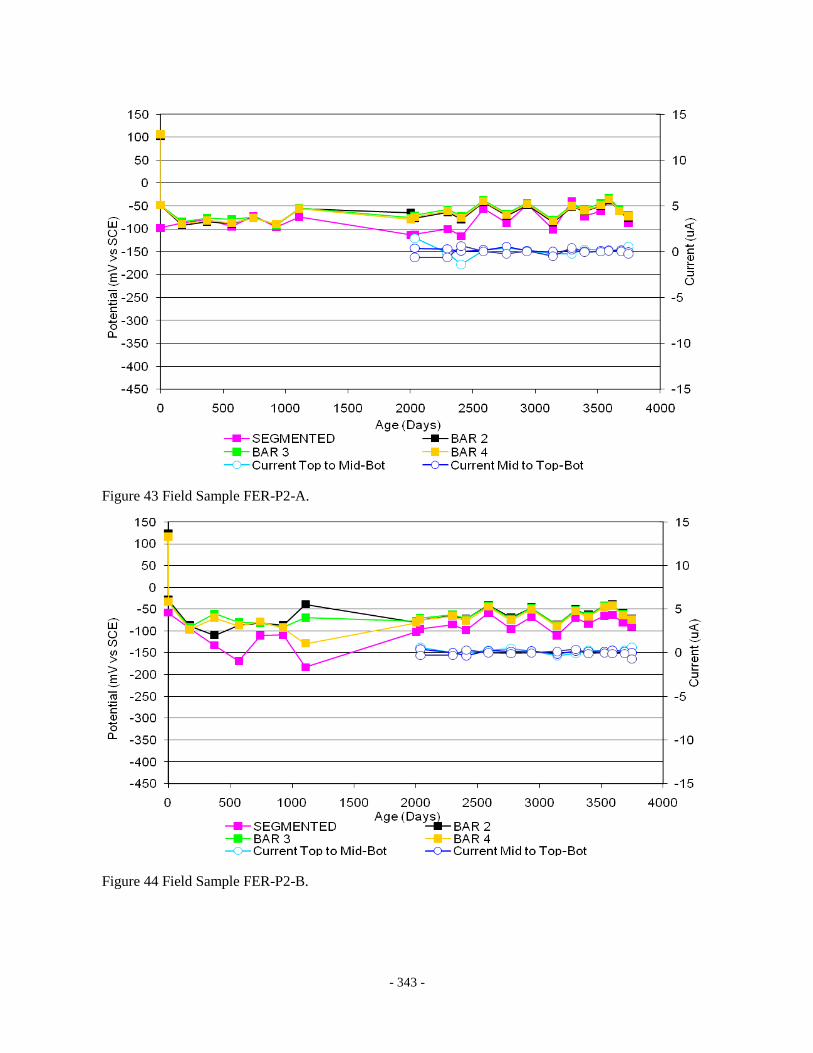
- 343 -
Figure 43 Field Sample FER-P2-A.
Figure 44 Field Sample FER-P2-B.
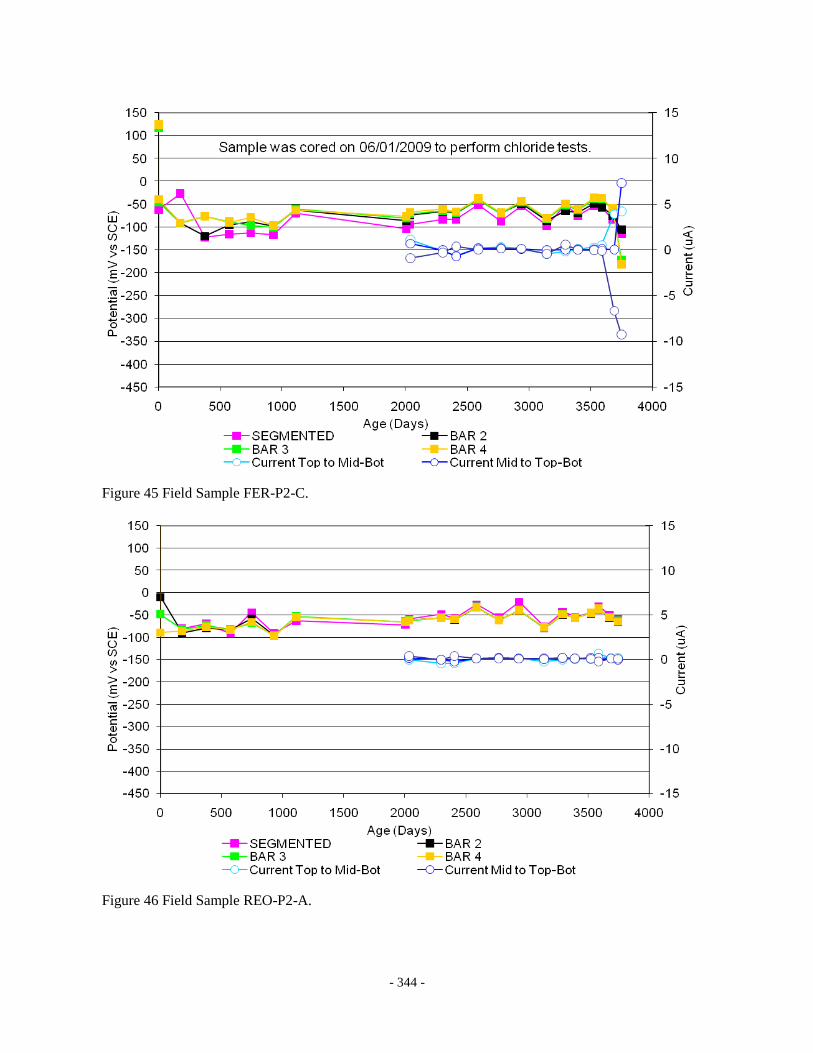
- 344 -
Figure 45 Field Sample FER-P2-C.
Figure 46 Field Sample REO-P2-A.

- 345 -
Figure 47 Field Sample REO-P2-B.
Figure 48 Field Sample REO-P2-C.