report: 1993-06-00 (part 2) determination of key organic
TRANSCRIPT

171
Chapter 5
Road Dust, Tire Debris, and Organometallic Brake
Lining Dust- Roads as Sources and Sinks -
Introduction
A recent inventory of fine particulate (dP :S 2.0 µm) organic carbon (OC)
emissions to the Los Angeles area atmosphere suggests that fine particulate paved
road dust is the third largest source of fine organic carbon particle emissions to
that urban atmosphere, following vehicular exhaust and meat cooking emissions
(1). Traffic on the roads not only contributes particulate emissions from the
tailpipes of vehicles, but also particles worn from tires and brake linings, and
some of these particles are deposited onto the road surface. Dirt is tracked onto
the roads, for example by trucks leaving unpaved construction sites or simply by
the wind blowing garden soil particles onto the streets. Leaves and other plant
materials accumulate in gutters or on the street surface and can be pulverized
by the passing traffic. Hence, fine particulate road dust is an agglomeration of
multiple source contributions. Virtually any anthropogenic and biogenic source
emissions to the urban atmosphere can via atmospheric removal processes ( e.g.,
dry deposition) contribute to the road dust composite. This road dust can be
resuspended into the atmosphere by the passing traffic or wind, followed by
redeposition of some of that material back onto the streets. Consequently, road
Reference: Rogge, W.F.; Mazurek, M.A.; Hildemann, L.M.; Cass, G.R.;
Sim.oneit, B.R.T. Environ. Sci. Technol., 1993, 27, in press.

172
dust bears a dynamic relationship to the ai:i;-bome fine particulate_ matter as will
be shown later in this study. ·
In the present study, the solvent extractable organic compounds found in fine
particulate road dust, brake linin~ wear, and tire attrition particles are charac
terized using gas chromatography/mass spectrometry (GC/MS). The chemical
composition of road dust will be related to that of the brake lining wear and tire
debris, and to the organic compound signatures found in motor vehicle exhaust
and vegetative detritus. Using molecular tracer methods, lower or upper limits
can be placed on the contribution of these fine particle emission sources to the
paved road dust examined here. Finally, the organic chemical composition of this
complex road dust mixture will be compared to the composition of atmospheric
fine particulate samples.
Experimental Methods
Sample Collection
Paved road dust samples were collected using a small vacuum sweeper truck
(Tennant 255, 36HP) from several streets within a residential area in Pasadena,
California, during May 1988 (1). Fine particulate matter (dp :S 2 µm) was sub
sequently collected by placing a portion of the road dust in a clean Teflon bag
and agitating the bag to resuspend the particulate matter. Filtered laboratory
air was blown into the bag to maintain it at a slight positive pressure, and par
ticle laden air was withdrawn from the bag through cyclone separators ( AIHL,
50% cutoff at 2 µm aerodynamic particle diameter) that removed the coarse road
dust particles. The remaining fine particles then were collected on quartz fiber
filters (Pallflex 2500 QAO) and Teflon filters (Gelman Tefl.o, 2.0 µm pore size).

173
All quartz fiber filters were annealed at 750°C for 2-4h before use to ensure low
contamination levels for organic substances.
To sample the chemical composition of tire debris particles, a used radial tire
(195/60R-15 Toyo, 7200 miles) was run on a rolling resistance testing machine •
at a tire-testing laboratory for several days. The tire wear particles accumulated
on the horizontal surfaces of the tire-testing machine were collected as a grab
sample. When resuspended, tire debris became electrically charged and adhered
to the walls of the sampling equipment. As a result, the attempt to resuspend
and collect only fine tire debris particles had to ·be abandoned. Instead, total
particle samples were collected directly consisting mainly of coarse debris par
ticles. Because tire tread is a well mixed industrial material it will be assumed
that there are no compositional differences between the fine and coarse particle
fractions.
Fine particle brake dust was collected by resuspending and then filtering the
brake dust grab sample by the same methods as described for the road dust
sample. The organometallic brake dust was brushed from the inside of the rear
drum brakes of a late-model light truck. Further details of the road dust, tire
debris and brake dust source sampling program are given by Hildemann et al.
(1).
Bulle Chemical Analysis
The bulk chemical composition of the source samples discussed here, includ
ing organic carbon (OC), elemental carbon (EC), ionic species, and trace metals
content has been determined, and these results are published elsewhere (1).

174
Sample Extraction
The extraction procedure applied to these source samples has been presented
in detail elsewhere (2-8) and only a brief description will be given here. Prior
to extraction a measured amount of perdeuterated tetracosane (n.-C24Dso) was. spiked onto the filter samples. The amount added was predetermined for each
sample based on the amount of organic carbon present in that sample according
to the QC-data gained from EC/QC-combustion analysis. The samples collected
on quartz fiber filters were extracted successively in hexane (2 x 15 ml), followed
by benzene/2-propanol (2:1 mixture, 3 x 15 ml). After each extraction step, the
extracts were filtered and combined. A specially designed extract transfer and
filtering line was used as described by Mazurek et al. (2). Using rotary evap
oration and gentle high purity N2-stream evaporation, the total sample extract
was reduced to 200 - 500 µl. The sample extract was divided into two aliquots.
One aliquot was then derivatized by adding freshly produced diazomethane to
convert organic acids to their methyl ester analogues and hydroxy compounds to
their methoxy derivatives. Until analysis by GC/MS, the sample extracts were
stored at -2l°C.
Sample Analysis
The compound identification and quantification was conducted using a Finni
gan 4000 quadrupole mass spectrometer interfaced to a gas chromatograph. The
mass spectrometer data generated were stored and processed with an INCOS
data system. The mass spectrometer was operated in the electron impact mode
(electron energy of70 eV). Sample extracts were injected onto the GC equipped
with a conventional Grob splitless injector which was operated at 300°C. Com
pound separation was performed using a 30-m fused-silica DB-1701 column (J &

175
W Scientific, Rancho Cordova, CA). Sample chromatography was accomplished
using the following temperature program: (1) isothermal hold at 65°C for 10 min,
(2) temperature increase at 10°C/min for 21 min, and (3) isothermal hold at
275°C for another 49 min. Supplemental analyses were performed using a Var
ian 4600 high-resolution gas chromatograph {HRGC) with a FID-detector (9).
More extensive descriptions of this analytical procedure can be found elsewhere
(2, 3, 6, 7).
Compound Identification and Quantification
The identification and quantification process for particle-bound organics is
explained in previous and companion papers that also describe the quality as
surance procedures applied to these samples (6-8). Compound identification
was labeled accordingly: (a) positive, when the sample mass spectrum, authen
tic standard compound mass spectrum and their retention times agreed well;
(b) probable, same as above except no standards were available, but the sample
mass spectrum agreed very well with the National Institute of Standards and
Technology (NIST) Library accessed by the INCOS data system; (c) possible,
same as above except that the sample spectrum contained information from other
compounds but with minor overlap; and ( d) tentative, when the sample spectrum
contained additional information from possibly several compounds (noise) with
overlap.
The compound quantification process was based on the application of ~
C24D50 as internal standard and 1-phenyldodecane as coinjection standard. To
correct for detector response to compounds of different structures and reten
tion times, sets of known standard compounds were injected onto the analytical
system to monitor their specific MS-response.
176
Standard Compounds
Confirmation and quantification of organic compounds was obtained through
the use of more than 150 authentic standards, as described by Rogge et· al. (8).
The following standard mixtures were injected onto the GC/MS-.systems: (1). normal alkanes ranging from n.-C10 to n.-C36 ; (2) normal alkanoic acids as methyl
esters ranging from :g-C6 to :g-C30 ; (3) unsaturated aliphatic acids such as oleic
acid and linoleic acid as methyl esters; ( 4) normal a.lkanols ranging · from :g
C10 to n.-C30 ; (5) several phenolic compounds, benzaldehydes and substituted
aromatic acids; (6) a suite of 39 aromatic and poiycyclic aromatic hydrocarbons
(PAH); (7) 10 polycyclic aromatic ketones and quinones; (8) a set of 8 aromatic
and polycyclic aromatic N- and S-substituted compounds; (9) steroids including
cholesterol and cholestane; (10) a set of 4 phytosterols; (11) several natural resins;
(12) plasticizers; (13) a suite of 11 aliphatic dicarboxylic acids (C3 - C 10) as
methyl esters; (14) one suite of 7 aromatic di- and tricarboxylic acids, all as their
methyl esters; and (15) other compounds.
Results and Discussion
In the following sections, the organic composition of the tire wear and ?rake
dust particles collected here will be examined first. Then, the chemical com
position of fine road dust will be discussed and related to direct and indirect
contributions from other sources. Finally, it will be demonstrated that contri
butions from certain anthropogenic and biogenic sources to the fine particulate
road dust can be traced using organic markers or groups of marker compounds.

177
Mass Balance for Elutable Fine Organic Matter
For all three traffic related particle sources, :material balances were con
structed that describe the chemical composition of the elutable organic mass
as detected by GC/MS and are shown in Figures 5.la-c. For the tire wear sam-·•
ple 44-49% of the organic matter :as determined by EC/QC-combustion analysis
was extracted by the solvents used and eluted from the GC column. For the
fine road dust sample 21-30% of the EC/OC determined organic mass could be
extracted and eluted from the column used. For brake dust, the fraction of or
ganic matter that could be extracted and detected is uncertain because EC/OC
delineation by the thermal-optical method used was a.ffected by light absorption
due to inorganic brake dust materials with a dark pastel-reddish color. There
fore, only a lower bound of 2. 7% can be placed on the fraction of the organic
matter that was extracted and eluted from the GC column used (9). Because
brake linings have to withstand excessive mechanical and heat stress and must
be resistant to possible leaking brake fluid, organic fibers and binders are used
that show high boiling points and resistance to solvents. Hence, it is not surpris
ing that only a small fraction of the brake lining dust can be examined by the
methods used here. Nevertheless, tracer compounds may still be sought in this
solvent extractable fraction.
The extractable and elutable organic mass can be subdivided into resolved
and unresolved organic compounds. For the sources examined here, the chromato
graphically-unresolved organic mass or unresolved complex mixture (UCM) (10)
comprises 65.6% (brake dust) to 77.2% (tire wear debris) of the elutable organic
mass. Of the chromatographically-resolved single compound peaks, 77.3% (road
dust) to 80.4% (brake dust) by mass could be identified as specific organic

(1) OC/MS Elu1.1ble Or1anlc Mui: Tire Weu Putlclu (b) OC/MS l!lullble Ortanlc Mau: Fine Or1anomelllllc Bnlce Dwt
- 100, ·~ AH+ o,y-PAH
S-+H~ '°' II Unldonlll1od N1Ual0<1111101 ll11ln1
Urwuol•l<I Or1anJ01 ft•Allwlolc
AcldJ
I ldeftutlod
°''"'"" I
,..,.It-. lt-i..d Or1anJeo
Olh«t
'°"' ikAdd
M'- 60,i,
Sub, l!tftUl6cbydeo m20!cMldo
40,i, -~ 20,
Unldentlned Oraonia
Untoootv.d Orslnlu
Iclutllllod Or1onlu
ltt1olvod 0r,1111a
I l'ol~I
r,.AJl<.,,.,lc Add.I
Other•
'O elc Add
n-An.-
(c) GC/1,1S Elulll,le Ortauc Mui: Fine Paved Road Dutt I-'
I Olhero
I
Unldenlll\6d 11-Albnll,Or1ll\Ju
Unooi....t Or1enlca
...~le Add<
ldottd/W Or1lftk1
-~od 0rt1111a .,.._
l l
cxJ SW- ♦ Hoc>-• 'AH+ o•y•PAH
All:lftolt IIW>lc Add, •le Add
Fig. 5.1: Mass balance for elutable organic matter from (a) tire wear particles, (b) fine brake lining wear particles, and (c) fine paved road dust.
179
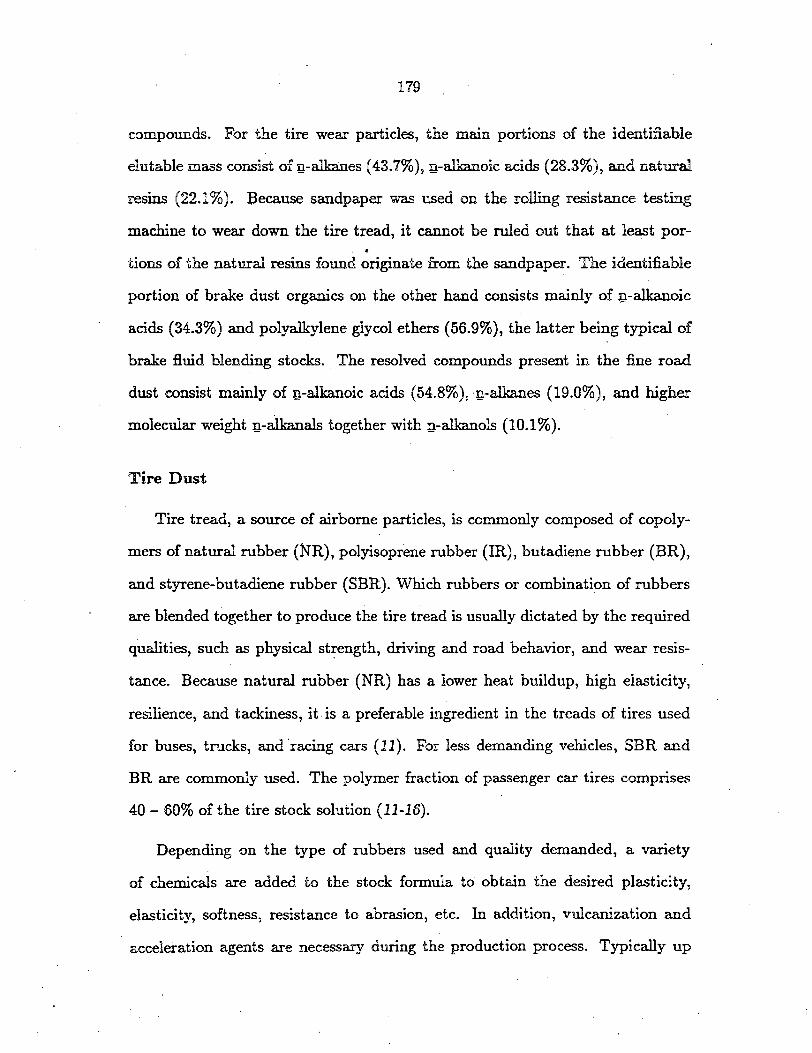
compounds. For the tire wear particles1 the main portions of the identifiable
elutable mass consist of :g,-alkanes (43.7%), ~-alkanoic acids (28.3%), and natural
resins (22.1%). Because sandpaper was used on the rolling resistance testing
machine to wear down the tire tread, it cannot be ruled out that at least por-. tions of the natural resins found originate from the sandpaper. The identifiable
portion of brake dust organics on the other hand consists mainly of n-alkanoic
acids (34.3%) and polyalkylene glycol ethers (56.9%), the latter being typical of
brake fluid blending stocks.. The resolved compounds present in the fine road
dust consist mainly of n-alkanoic acids (54.8%), ·n-alkanes (19.0%), and higher
molecular weight n-alkanals together with n-alkanols (10.1%).
Tire Dust
Tire tread, a source of airborne particles, is commonly composed of copoly
mers of natural rubber (NR), polyisoprene rubber (IR), butadiene rubber (BR),
and styrene-butadiene rubber (SBR). Which rubbers or combination of rubbers
are blended together to produce the tire tread is usually dictated by the required
qualities, such as physical st1:ength, driving and road behavior, and wear resis
tance. Because natural rubber (NR) has a lower heat buildup, high elasticity,
resilience, and tackiness, it is a preferable ingredient in the treads of tires used
for buses, trucks, and ·racing cars (11). For less demanding vehicles, SBR and
BR are commonly used. The polymer fraction of passenger car tires comprises
40 - 60% of the tire stock solution (11-16).
Depending on the type of rubbers used and quality demanded, a variety
of chemicals are added to the stock formula to obtain the desired plasticity,
elasticity, softness, resistance to abrasion, etc. In addition, vulcanization and
acceleration agents are necessary during the production process. Typically up

180
to 1% of the processing stock mass consists of vulcanization accelerators such
as thiazoles, sulphenamides and others (11, 14, 15). In order to accelerate the
curing process further, organic activators such as zinc salts of a mixture of fatty
acids, primary fatty amines, organic and inorganic acetates and other accelerators
are added to the stock solution (11). Rubber scorching can occur during the
curing process when fast accelerators are used. To prevent such side effects,
retarders also can be added. Common retarder additives are terpene-resin acid
blends, benzoic acid, N-nitrosodiphenylamine, and many more (11). Pigments
such as carbon black are used as filling and reinforcing agents, providing the
necessary stability of the tire. About 20 - 30% of the tire stock formula is
made up of carbon black particles having average diameters ranging from 10 to
500 nm (11, 16, 17). In order to adjust the materials' viscosity to the degree
necessary for the dispersion of fillers and to insure lubrication during molding,
softeners are commonly added. Usually, a wide variety of pitches, oils, coal tars,
pine tars, and also synthetic organic materials are added to reach the desired
workability of the rubber co~pounding. Fatty acids ( e.g., stearic acid) are added
(0.5 - 2.0%) as dispersing agents and softeners. Extenders such as aromatic and .
naphthenic oils are used to substitute for part of the more costly rubber material,
and constitute 10 - 20% of the stock formula. Truck tires, exposed to tougher
physical conditions, usually contain small amounts of such organic extender oils
(12, 14, 15). Plasticizers, which are primarily used to reduce the viscosity during
milling of the uncured stock rubber, are added in low amounts (11). To protect
the rubber material during storage and shipment, antioxidants and stabilizers
are needed; depending on the rubbers blended, their concentration levels range
from 1.0 - 2..5%.

181
Ozone is an effective oxidant that can cause severe cracking, especially in
tire rubber under stress. To protect rubber from ozone attack, antiozonants
(e.g., dia.mines, ~axes, etc.) have to be added to the rubber material. Waxes,
consisting of higher u-alkanes (sunproof waxes) are used in quantities ranging
from 0.5% to 1.0% of the rubber material and serve both as softeners and as
UV- and ozone----protecting agents (11, 14, 15). Together with the aromatic
and naphthenic type compounds added as extenders, additional n-alkanes are
introduced into the rubber stock (16).
Due to changing operating temperatures, mechanical wear, oxidant and radi
cal attack combined with the loss of protective rubber ingredients, the tire rubber
is gradually altered during use (18, 19). Therefore, the chemical composition of
tire wear particJes depends not only on the recipe of the rubber stock, but also
might depend on the age and the physical and chemical stress conditions to which
the tire was exposed during use.
Tire wear particles are generated during the rolling shear of the tire tread
against the road surface. Depending on the turbulence ( traffic density, wind
speed) within the air column above the street, some of the tire debris is en
trained into the atmosphere where its removal rate depends among other factors
on the particle size, which influences the particle settling velocity. It has been
reported that the average tread wear rate for a single passenger tire is between
0.006 g/km and 0.09 g/km, depending on the road conditions ( e.g., asphalt vs
concrete), driving conditions (acceleration, abrupt decceleration, speeding etc.),
and tire· conditions (tire type, tire pressure, retreaded vs new tires, vehicle load
etc.) (20-23). Recently, Kim and co-workers (24) showed that 30% of the mass
concentration of tire. wear particles measurable just above the street surface was .

182
still found at 86 m height over a heavily-trafficked area. Although only 10% of
the tire tread particles (by mass) are smaller than 3 µm in aerodynamic diameter .
(22), it was estimated that for the heavily urbanized region of Los Angeles (rep
resenting 6400 km2), fine particulate tire tread organic carbon (OC) is emitted .
to the atmosphere at about 0.4 metric tons per day (1).
Particulate tire tread in urban air has been evaluated by previous investiga
tors, who have used characteristic tire pyrolysis products such as benzothiazole
to trace tire wear debris in the urban atmosphere (12, 24, 25). Pierson and
Brachaczek (22) traced the presence of tire rubb.er particles in the atmosphere
by measuring SBR with infrared absorption spectroscopy. Such analysis tech
niques do not provide any further information about the chemical composition
of the tire wear particles released into the environment. But to study the atm~
spheric interplay of particulate emissions from different urban sources, it is useful
to determine the chemical composition of solvent extracts of the most important
urban sources, so that comparisons can be drawn between source and ambient
samples that are processed identically by GC/MS techniques. Here, tire debris
collected from a Toyo passenger car tire (195/65R-15 Toyo, 7200 miles) has been
analyzed using GC/MS techniques. Despite the fact that tires are produced by
different companies using their own rubber stock recipes, Kim et al. (24) have
shown that different tire brands display similar pyrolysis product distributions.
Truck tires revealed a different composition and additional pyrolysis products
when compared to passenger car tires, but within the class of truck tires varia
tions were also minimal (24). Nonetheless, care should be taken in applying the
results found in this study because tire formulations can vary between manu
facturers, and in particular the ·abrasion products of truck tires are expected to

183
differ from the single passenger car tire studied here.
Considering a tire wear particle as a whole, it consists to an appreciable
extent of styrene and butacliene polymers which can be analyzed by the method of
Pierson and Brachaczek ( 22) but not by the solvent extraction method used here.. Hence, the following discussion of the chemical composition of extractable organic
matter from such rubber particles is mainly concerned with organic compounds
that have been added to the rubber stock or that are formed from agents that
were originally blended with the polymer stock.
Organic Composition of Tire Dust
The chemical composition of the tire wear particle extract is shown in Ta
ble 5.1. The main compound class identified in particulate tire wear extract
consists of u-alkanes ranging from C19 to C.u. u.-Alkanes (sunproof waxes) are
added to the tire sto·ck solution as a protective agent against oxidants and UV
light induced cracking and hence have a function similar to that of natural leaf
surface waxes. As can be seen from Figure 5.2a, the n-alkane mass concentra
tion profile shows increased concentrations for higher molecular weight :g.-alkanes
(~ C3o; peak concentration at C37) with no evidence of the odd-to-even carbon
number predominance that is observed for plant waxes, garden soil or even bio
genically influenced airborne particles ( 4, 7, 26, 27). The n-alkane distribution in
fossil fuels also does not show any odd-to-even carbon number predominance and
generally no enrichment of homologues > n-C35 ( 10, 29, 30). Hence, the :g.-alkanes
added to the tire material are most likely derived from the refined paraffin wax
fraction of crude oils.
Besides wax components such as n-alkanes, :g.-alkanoic acids - labeled as

184
3000 (a)
2700
2400
2100
1800
1500~ :,
1200
900
600
300
0
19 20 212223 24 25 26 27 28 29 30 313233 34 35 36 37 38 39 40 41
n-Alkane Carbon Number
7000 (b)
6300
5600
4900
4200
3500~ :,
2800
2100
1400
700
0 6 8 10 12 14 16 18 20 22 24 26 28 30 32
n-Alkanoic Acid Carbon Number
Fig. 5.2.: Mass concentration distributions for tire wear organic constituents in µg g-1 of total (fine plus coarse) tire wear debris for ( a) n-alkanes and (b) :g-alkanoic acids.

185
'stearic acid' by the manufacturing trade - also are added to the rubb.er stock
formula (12, 15, 31). According to the Merck Index (eleventh edition, (32)), com
mercially used acids labeled as 'stearic acid' under United States Pharmacopoeia
(U.S.P.) consist mainly of stearic acid and palmitic acid. As a mix it is made up . of about 45% palmitic acid, 50% stearic acid, and 5% oleic acid (33).
In the present tire debris sample, stearic acid is the most abundant :g.-alkanoic
acid (more than 6000 µg stearic acid per gram of tire wear debris), followed
by palmitic acid and some myristic acid (see Figure 5.2b ). Oleic acid (C18,i)
and linoleic (C113,2 ) acid, two unsaturated analogues of stearic acid, were also
detected in appreciable amounts (see Table 5.1). Other carboxylic acids identified
include trace amounts of several benzoic acids and diterpenoid acids. The latter
are natural resins (e.g., pine tars) and are added to the formula as softeners
and extenders (17, 33). Dehydroabietic acid, the partially aromatized product
of abietic acid, was the most abundant single organic compound found in this
particular tire.wear extract ( close to 8000 µg/g of _tire wear particles). Abietic acid
and related resinous compounds also were identified ( see Table 5.1 ). The detailed
composition of those resins would be expected to vary between manufacturers as
the resins will depend on the vegetation typical of the area in which the resins
were produced.
Another compound class present in tire wear particles consists of polycyclic
aromatic hydrocarbons (PAR) totalling over 200 µg/g tire dust. Compounds of
this type could have been introduce? into the tire tread, either directly from
organic additives derived originally from fossil fuels (such as extender oils) or as
contaminants contained in the carbon black addition. PAH have been identified
both in fossil fuels (34, 35) and in carbon black products (36, 37). Pyre~e, fluo-

186
ranthene, and phenanthrene are the dominant unsubstituted PAH found in the
tire debris extract studied he~e. Similar results for PAH contained in tire wear
particles have been reported by Wakeham et al. (38). Alkyl-PAR, intermedi
ates that can be formed during combustion and manufacturing processes, where .
aromatization and soot formation is ongoing ( 39), show mass concentrations in
the tire debris extract that are comparable to the unsubstituted PAH.
Benzothiazole is one of the many other compounds identified and listed in
Table 5.1. It originates from the pendant groups of vulcanization accelerators
classified as thiazoles and sulphenamides (11, 14, 33). Applying pyrolysis-gas
chromatography to tire wear particles and ambient samples, Kim and co-workers
(24) showed that benzothiazole is a suitable tracer for tire wear contributions
to the ambient aerosol. Because benzothiazole is of a semi-volatile nature it
must be trapped as a thiazole-type compound within the tire wear particle to
actually serve as a particle-phase tracer. Using chemical extraction techniques,
a benzothiazole signal from . ambient particle samples could reflect both rubber
particle-bound material as well as particle-adsorbed benzothiazole that was orig
inally in the gas-phase.
Brake Dust
During forced deceleration, motor vehicle brake linings are subject to large
frictional heat generation and associated brake lining wear. This mechanically
induced wear generates brake lining particles which under normal conditions are
introduced into the environment. Most passenger cars are equipped with front
disc brakes and rear drum brakes. During the deceleration process, front brakes
have to provide most of the braking power. In ad~tion, front disc brakes have a
smaller friction lining area when compared to rear drum brakes. Consequently,
187
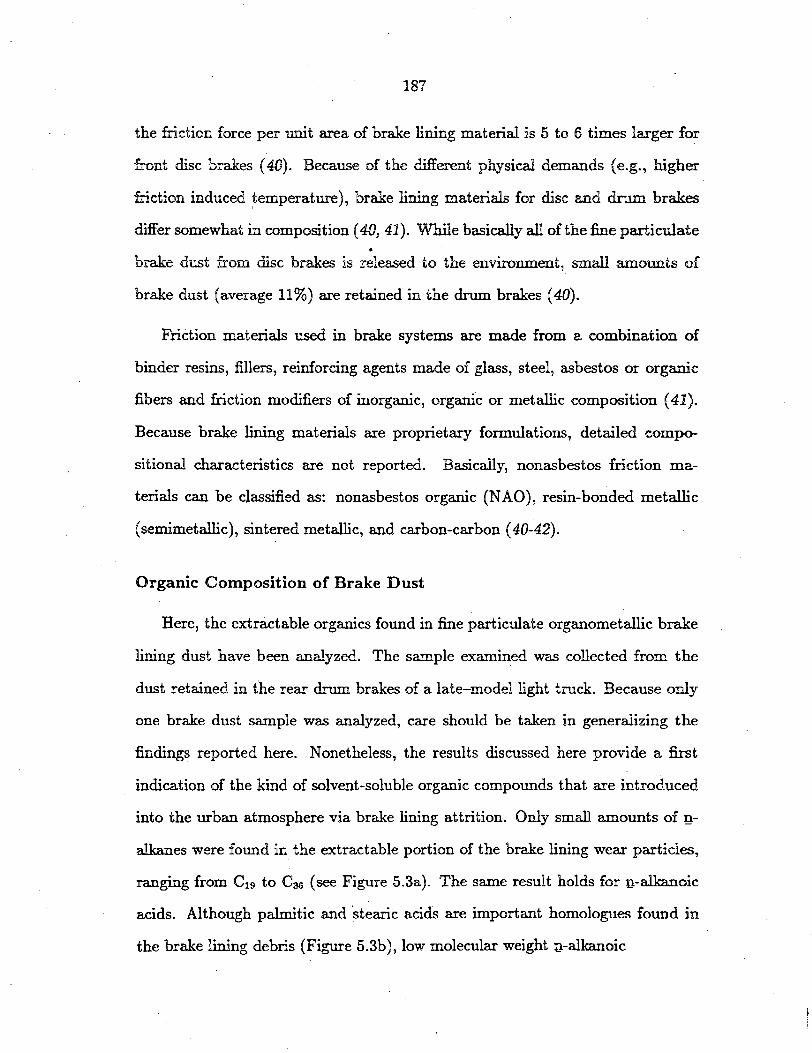
the friction force per unit area of brake lining material is 5 to 6 times larger for
front disc brakes (40). Because of the different physical demands ( e.g., higher
friction induced ,temperature), brake lining materials for disc and drum brakes
differ somewhat in composition ( 40, 41). While basically all of the fine particulate . brake dust from disc brakes is released. to the environment, small amounts of
brake dust ( average 11% ) are retained in the drum brakes (40).
Friction materials used in brake systems are made from a combination of
binder resins, fillers, reinforcing agents made of glass, steel, asbestos or organic
fibers and friction modifiers of inorganic, organic or metallic composition ( 41).
Because brake lining materials are proprietary formulations, detailed compo
sitional characteristics are not reported. Basically, nonasbestos friction ma
terials can be classified as: nonasbestos organic (NAO), resin-bonded metallic
(semimetallic), sintered metallic, and carbon-carbon (40-42).
Organic Composition of Brake Dust
Here, the extractable organics found in fine particulate organometallic brake
lining dust have been analyzed. The sample examined was collected from the
dust retained in the rear drum brakes of a late-model light truck. Because only
one brake dust sample was analyzed, care should be taken in generalizing the
findings reported here. Nonetheless, the results discussed here provide a first
indication of the kind of solvent-soluble organic compounds that are introduced
into the urban atmosphere via brake lining attrition. Only small amounts of!!-
alkanes were found in the extractable portion of the brake lining wear particles,
:ranging from C19 to C36 (see Figure 5.3a). The same result holds for n-alkanoic
acids. Although palmitic and stearic acids are important homologues found in
the brake lining debris (Figure 5.3b ), low molecular weight u.-alkanoic

8.0
7.2
6.4
5.6
4.8
~ 4.0 =t
3.2
2.4
1.6
0.8
0.0
120
108
96
84
72
60~ :::i.
48
36
24
12
0
188
(a)
19 20 21 22 23 24 25 26 27 28 29 30 31 32 33 34 35 36 37 38 39 40 41
(b)
6 8 10 12 14 16 18
n-Alkane Carbon Number
20 22 24 26 28 30 32
n-Alkanoic Acid Carbon Number
Fig. 5.3.: Mass concentratipn distributions for brake lining wear organic constituents in µg g-1 of fine brake lining particles for (a) :g.alkanes ·and (b) u.-alkanoic acids.
189
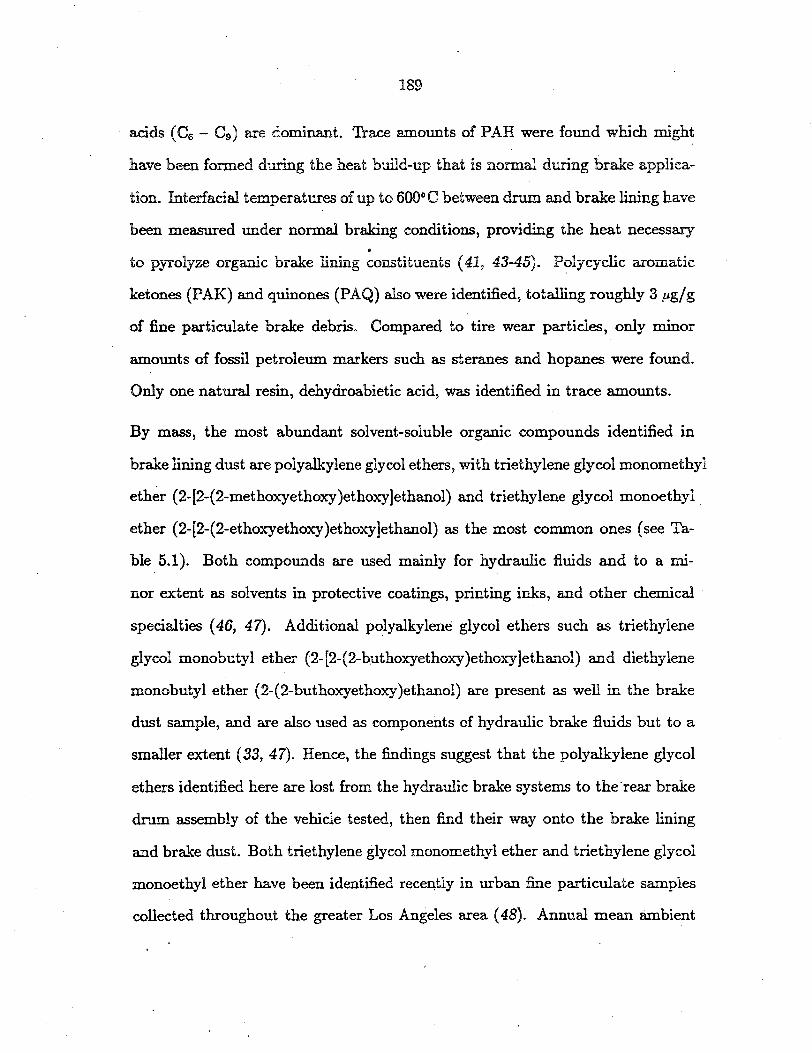
acids ( C6 - C9 ) are dominant. Trace amounts of PAH were found which might
have been formed during the heat build-up that is normal during brake applica
tion. Interfacial temperatures of up to 600° C between drum and brake lining have
been measured under normal bra.king conditions, providing the heat necessary . to pyrolyze organic brake lining constituents (41, 43-45). Polycyclic aromatic
ketones (PAK) and quinones (PAQ) also were identified, totalling roughly 3 µg/g
of fine particulate brake debris. Compared to tire wear particles, only minor
amounts of fossil petroleum markers such as steranes and hopanes were found.
Only one natural resin, dehydroabietic acid, was identified in trace amounts.
By mass, the most abundant solvent-soluble organic compounds identified in
brake lining dust are polyalkylene glycol ethers, with triethylene glycol monomethyl
ether (2-[2-(2-methoxyethoxy)ethoxy]ethanol) and triethylene glycol monoethyl
ether (2-[2-(2-ethoxyethoxy)ethoxy]ethanol) as the most common ones (see Ta
ble 5.1). Both compounds are used mainly for hydraulic fluids and to a mi
nor extent as solvents in protective coatings, printing inks, and other chemical ·
specialties (46, 47). Additional polyalkylene glycol ethers such as triethylene
glycol monobutyl ether (2-[2-(2-b.uthoxyethoxy)ethoxy]ethanol) and diethylene
monobutyl ether (2-(2-buthoxyethoxy)ethanol) are present as well in the brake
dust sample, and are also used as components of hydraulic brake fluids but to a
smaller extent (33, 47). Hence, the findings suggest that the polyalkylene glycol
ethers identified here are lost from the hydraulic brake systems to the ·rear brake
drnm assembly of the vehicle tested, then find their way onto the brake lining
and brake dust. Both triethylene glycol monomethyl ether and triethylene glycol
monoethyl ether have been identified recen,tly in urban fine particulate samples
collected throughout the greater Los Angeles area (48). Annual mean ambient
190
concentrations for 1982 ranged from 7.3 to 9.8 ng m-3 •
Paved Road Dust
Urban street surfaces act as repositories for particulate matter. Because streets . are usually built for vehicles, particulate automobile exhaust, lubricating oil
residues, tire wear particles, weathered street surface particles and brake lining
wear particles are direct contributors to the paved road dust. Biogenic material
such as leaf detritus ( e.g., from street trees, shrubs, lawns), especially epicuticular
wax protrusions having micron and subm.icron dimensions (49, 50) and garden
soil organics also contribute to the street dust. Indirectly, via atmospheric trans
port and fallout, practically any anthropogenic or biogenic source can add to the
dust accumulation on the road surfaces.
Roads and streets also can function as a source of airborne particulate matter
and likewise as a source for toxic compounds washed into drainage systems or
delivered to aquifers. Resuspended by wind and vehicle induced turbulences,
road dust particles are injected into the atmosphere (51~54). In fact, resuspen
sion, fallout, street sweeping, rain, and generation of new particles ( e.g., vehicle
exhaust) drive a dynamic source and sink relationship which can contribute ap
preciable amounts of particulate matter and toxic substances to the atmosphere
and to the hydrosphere. Recent estimates for an 80 x 80 km area centered over
the heavily urbanized Los Angeles area showed that fine particulate organic mat
ter contributions from road surfaces to the urban atmosphere corresponded to
over 2000 metric tons annually, making road dust the third largest source of fine
particle organic emissions to that urban atmosphere (next to vehicular exhaust
emissions and meat-cooking operations) (1). Likewise,· a study concerned wit.h
storm runoff via the Los Angeles River estimated an annual discharge of about

191
5000 metric tons of total extractable organics ( 55, 56). Due to the fact that the
metropolitan Los Angeles rain water is mainly drained by surface streets and
finally by the Los Angeles River system, an appreciable portion of that organic
discharge must have been due to road dust washed off during the rain storms, · .
indicating how significant :road deposits can be.
Here, the findings for the fine particulate road dust sample ( d11 ~ 2µm) will be
discussed first, then the comp0sition of fine particulate road dust will be com
pared with the composition of other anthropogenic and biogenic sources that
could contribute to the road dust deposits ( 6-8, 57). Because very similar sam
pling and analytical techniques have been applied to all of these source samples,
many of the possible obstacles to a direct comparison of such disparate sources
have been excluded.
Organic Composition of Paved Road Dust
In the Pasadena road dust sample, :g.-alkanes ranging from C19 to C39 have been
identified, and their mass concentrations are plotted in Figure 5.4a. The highest
mass concentrations were determined for higher molecular weight odd carbon
numbered ;n-alkanes ( odd: C25 - C33 ) resembling the typical :g.-alkane profiles
found in samples of vegetative detritus (4, 7, 27, 28, 57). The lower molecular
weight range (C19 - C25 ) is typical for vehicle exhaust emissions (8, 10, 58). For
comparison, Figures 5.4b-d show the :g.-alkane distribution for green and dead
leaf abrasion products, vehicular exhaust emissions, and ambient fine particulate
matter. :g.-Alkanoic acids found ·in the road dust sample range from C6 to C32
( see Table 5.1) and have a distribution very similar to that found in airborne
samples ( 7). Stearic acid and pahnitic acid are the dominant hornologues and a
pronounced even-to-odd carbon number predominance is evident; for the higher

12000210 .......------------------,(a) Fine Paved Road Dust 243 '
216
189
162
~m :I.
108
81
S4
27
ol=;:'. ,,,,,, .l,I 19 20 2t 22 23 2-4 25 26 27 28 29 30 31 32 33 3-4 3S 36 37 38 39 .CO 41
n-AU:ane Carbon Number
3000...----------------------, 2700 · (c) Noncau.lyst Autos
Cau.l yst-eq ulpped AUIOIr..2400 Heavy-Duly Diesel Trucks 2100
1800,,5:00 1200
,--900 ···r- ~··1 -
1••• _I ···~ ··~
:· ·. -•- ·1--·e:.A600 • .. - ' -300
ol 19 20 21 22 23 2-4 25 26 27 28 29 30 31 32 33 3-4 35 36 37 38 39 .CO 41
n-A!kane Carbon Number
I
10800 I (b)
9600
a.coo 7200
jfiOOO 4800
3600
2400
1200
0 19 20 212223 2-425 26 27 21129 30313233 3-4 35 36 37 3113940 .Cl
n•Allane Carbon Number
550..------------------, (d)
West LA Down!QWnLA
495'
.«o Pasadena .... co385 ~
330
j 275
220
165
110
I55 I I ~0 I I I
19202122 23 2425 26 27 2! 29 30 313233 3-4 35 36 37 311 39 .CO .Cl
n•Aluno Carl>on Number
Dead Leaf Abrasion Produeu Oreen Leaf Abrasion Prclducu
Fig. 5.4: o-Alkanes mass concentration distributions (in µg g-1 of particulate·matter) for (a) fine paved road dust, (b) fine particulate d~ad and green leaf surface abrasion products, ( c) fine particulate exhaust emissions from noncat.a.lyst and catalyst-equipped autos and heavy-duty die.set trucks, and ( d) ambient fine particulate matter, annual averages for West Los Angeles, downtown Los Angeles, and Pasadena. in 1982.

193
molecular weight ~-alkanoic acids, this predominance is characteristic of vege
tative detritus (7, 28, 48). :g--Alkanals (C2s, C30, C:n) and :i:!-alkanols (C26, C2s)
are likewise found in the road dust sampled. As plant wax constituents, they
a.re most likely lost from nearby trees and plants or from garden soil to the road
surface. Unsaturated fatty acids found in the fine road dust sample have a myr
iad of possible sources, including meat cooking, tire wear, brake lining abrasion,
plant material, and vehicular exhaust emissions ( 4, 6-8, 28). Benzoic acid and its
alkyl substituted homologues also have been found in substantial concentrations
in the road dust (see Table 5.1). In addition to the emissions from tire tread
abrasion and brake lining wear that have been discussed earlier, benzoic acid
type compounds are emitted in the exhaust from gasoline and especially diesel
powered vehicles and might subsequently be deposited onto the road surface ( 8,
58-60). Polycyclic aromatic hydrocarbons, such as PAH and oxy-PAH also have
been identified in the road dust sample.
In addition to biogenic, synthetic and combustion generated compounds, fossil
petroleum markers also have been identified in the road dust sample. Fossil
petroleum markers such as steranes and triterpanes are geologically matured
organic compounds derived from steroids and triterpenoids that were originally
biosynthesized and subsequently deposited in sediments millions of years ago
(35, 61-63). During diagenesis and catagenesis, these biogenic compounds have
been transformed yielding hydrocarbons such as steranes and triterpanes which
are found in crude oils (35, 61), engine oils, and consequently in auto exhaust
aerosol emissions (8, 10, 58). Recently, Rogge et al. (8) used a set of steranes
and pentacyclic triterpanes (hopanes) to trace fine particulate vehicle exhaust in
the greater Los Angeles ambient air. It was shown that these fossil petroleum

194
markers released from noncatalyst autos, ~talyst-equipped autos, and diesel
vehicles contribute about 85% of the fossil petroleum markers emitted to the
Los Angeles atmosphere. In the present study, the same set of fossil petroleum
markers were quantified in the road dust, tire wear, and brake lining dust samples
(see Table 5.1). In Figure 5.5a, the mass concentrations of these fossil petroleum
markers are shown for tire wear particles and road dust.
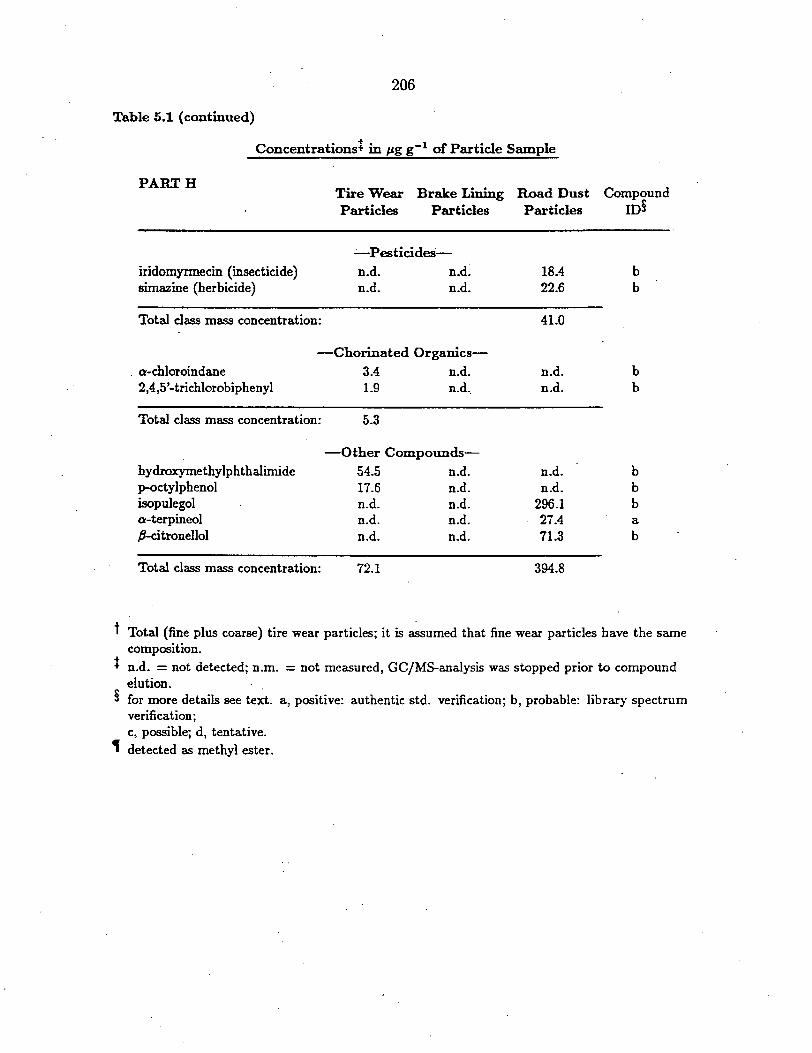
In addition to the compounds already discussed, one insecticide (iridomyrmecin)
and one herbicide ( simazine) have been found in the paved road dust. These
chemicals were most likely applied to gardens bordering the residential streets
swept here. Furthermore, also monoterpenoids such as isopulegol, a-terpineol,
.B-citronellol released from trees and flowers (33, 64) were identified in this road
dust sample.
In the next section, the organic composition of the fine particulate paved road
dust collected will be compared to the composition of related sources that add to
the road dust deposits. A method will be illustrated for estimating source contri
butions to a particular road dust sample utilizing molecular marker compounds
that are characteristic for each of the sources.
260.0
234.0
208.0
182.0
]56.0
~ 130.0 ::I
104.0
78.0
52.0
26.0
0.0
660.0
594.0
528.0
462.0
396.0 . bO
330.0bl) ::i
264.0
198.0
132.0
66.0
0.0
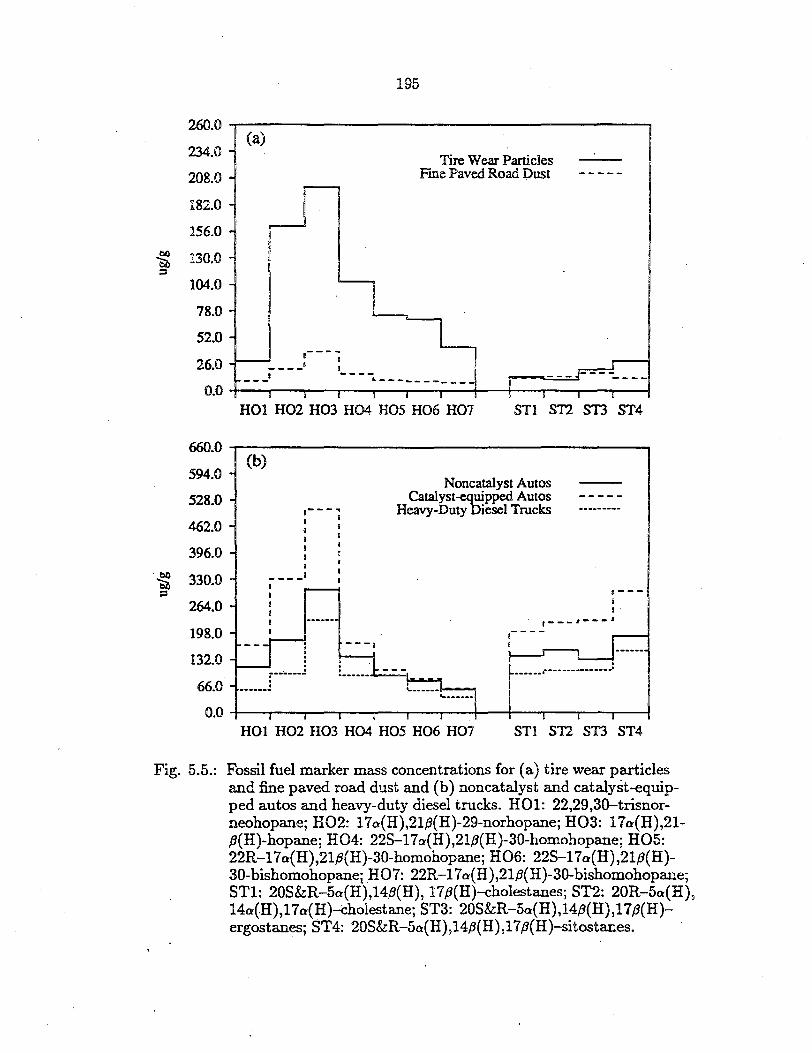
Fig. 5.5.:
195
(a)
Tire Wear Particles Fme Paved Road Dust - - - - -
,---~ ____, 1___ _
--~ ·----------HOl H02 H03 H04 HOS H06 H07 STl ST2 ST3 ST4
(b) Noncatalyst Autos
Catalyst-equipped Autos ,---~ Heavy-Duty Diesel Trucks U I I I I i g I I I
u ____u
. . ...........---------------·' ' ' '
HOl H02 H03 H04 H05 H06 H07 sn ST2 ST3 ST4
Fossil fuel marker mass concentrations for (a) tire wear particles and fine paved road dust and (b) noncatalyst and catalyst-equipped autos and heavy-duty diesel trucks. HOl: 22,29,30-trisnorneohopane; HO2: l 7o(H),21,B(H)-29-norhopane; HO3: 17o(H),21-,8(H)-hopane; HO4: 22S-17a(H),21,B(H)-30-homohopane; HO5: 22R-l7o(H),21,B(H)-30-homohopane; HO6: 22S-l7o(H),21,B(H)-30-bishomohopanei HO7: 22R-l7a(H),21.B(H)-30-bishomohopane; STl: 20S&R-5o(H),14.B(H), 17.B(H)-cholestanes; ST2: 20R-5o(H), 14a(H),l7o(H)--cliolestane; ST3: 20S&R-5o(H),14,B(H),l 7,B(H)ergostanes; ST4: 20S&R-5o:(H),14,B(H),17,B(H)-sitostanes.

196
Source Contributions to Paved Road Dust
Airborne particles that are released on or near the road surface can be expected
to contribute to road dust accumulations. Several obvious sources include con
tributions from tire wear debris, deposited motor vehicle exhaust particles, plant
fragments from nearby vegetation, and deposited soil dust. The soil dust contn
bution to road dust samples can be calculated by comparing the mineral content
of pure soil dust to that of a road dust sample, a problem that h~ been ad
dressed previously by others. Here, we wish to concentrate on organic tracers for
the remaining road dust material.
u-Alkanes ~ C35 are found in appreciable amounts in tire wear particles (see
Figure 5.2a) and in the fine particulate road dust (Figure 5.4a), but are below
the detection limit in ambient samples ( 6-8, 48), which suggests that there are
few other urban emission sources. The contribution from tire wear to the fine
road dust samples can be estimated approximately. Even if all of the n-alkanes
that range from Css to Css in the road dust are contributed by tire dust, no
more than 1.6% of the fine road dust (dp :::; 2.0 µm) could be derived from fine
tire wear particles. Correspondingly, no more than 4.3% of the organics in fine
road dust could originate from tires. The actual tire debris contributions will
be lower than that if asphalt particles removed from the road itself contain any
n-alkanes ~ C35• This estimate assumes that the tire dust sample investigated
here contains amounts of n-alkanes that are typical of tire tread wear debris in
general.
Another possible marker compound for tire wear debris is benzothiazole as dis
cussed earlier. Using the benzothiazole detected in the road dust as a marker for
tire w~ar particles, the fractional contribution of tire wear particl~ to that road
197
dust sample would be estimated to be 3.5%, which is in the neighborhood of the
estimate obtained when using·D.-alkanes ~ C35 only. Because benzothiazole has a
fairly high vapor pressure, we believe that it is a. less reliable marker in this case
than the high molecular weight :g-alkanes.
Our upper limits of 1.6% to 3.5% for the tire tread contribution to the road dust
sample can be used to show that the PAH in road dust are not dominated by the
PAH content of tire wear particles. Instead, the largest quantity of. th~e PAH
probably comes from airborne aerosols that deposit onto the streets and that
originate from the many types of combustion processes typically found in urban
areas (8, 65, 66).
Hopanes and steranes are measured in the road dust sample. Such compounds
have been used previously to trace vehicular emissions to the urban Los Ange
les atmosphere (8). Comparing Figure 5.5a with 5.5b, it can be seen that the
concentration patterns for fossil petroleum markers in the road dust and vehi
cle exhaust show remarkable similarities, with the peak concentration found for
l 7o(H),21P(H)-hopane (H03) and concentrations of single steranes comparable
· to that of single hopanes. The same is true for ambient aerosol samples ( 8). In
contrast, the tire attrition particles show much higher concentrations for single
members of the hopane series than for the sterane series. This indicates that the
crude oil products used in the manufacture of the tire tested here are of different
composition than the petroleum products used for fuels in Southern California.
The fossil petroleum marker concentration levels in the brake lining particles
are very low, suggesting that either only trace amounts of crude oil distillation
fractions that contribute these markers are used for brake lining manufacturing
or that the hopanes and stei"anes detected are carried over from other sources

198
emitting in close proximity to the vehicle brakes ( e.g., vehicle exhaust aerosol
emissions). It is possible to toughly estimate the vehicle exhaust contributions
to the street dust considered here by assuming that at the maximum 1.6% of
the fine particulate road dust is derived from tire wear, and by observing that
nearly all of the remaining hopanes and steranes deposited o_nto the Los Ange
les area streets are contributed from motor vehicle exhaust (8). Based on these
conditions it is found that at the maximum, about 7.6% of the fine particulate
road dust mass collected (both organic and inorganic) originates from vehicu
lar exhaust particles. Considering the organic portion of the road dust sample
(16.2% organics), no more than 32.7% of that organic material is derived from
vehicular emissions. Because some of the road dust hopanes and steranes might
come directly from asphalt abraded off the roads swept, the actual fine partic
ulate exhaust contributions from vehicles to the road dust collected might be
somewhat lower.
Marker compounds that indicate the presence of plant fragments ·in the fine
road dust sample likewise can be identified. The organic composition of waxy
leaf surface abrasion products released to the atmosphere by leaves as they brush
against each other has been documented ( 57). These samples were collected from
a composite of 62 plant species weighted according to their abundance in the Los
Angeles area. Figure· 5.4b shows the mass concentrations of n-alkanes per unit
offine particulate leaf surface matter collected (µg g-1 ). That figure shows the
typical odd carbon number predominance characteristic of plant wax :g.-alkanes.
In the fine road dust sample (Figure 5.4a), :n-nonacosane (C29 ) is the dominant
u-alkane, while in the leaf abrasion samples C31 is the dominant n-alkane. Obvi
ously, the Pasadena area roads swept here are influenced by somewhat different

199
plant communities than are found on the average within the Los Angeles basin.
It has been reported that the composition of leaf waxes can differ greatly from
tree species to tree species ( 67, 68). Garden soil, the decomposition product of
plant material and mineral soil, contains an ~-alkane distribution similar to that
of the epicuticular plant waxes, with a pronounced odd-to-even carbon number
predominance ( 69). Thus, leaf material plus garden soil organics would appear to
make major contributions to the road dust ~-alkanes. In contrast, the signature
for fine particulate u.-alkanes emitted from the exhaust of different vehicle types
shows no obvious carbon number predominance, with the highest concentrations
found for :n-alkanes in the range of C19 to C25 as seen in Figure 5.4c (8). Com
paring the vehicle exhaust :n-alkane distribution to that of the road dust sample,
it is seen that relatively small amounts of the :n-alkanes found in road dust are
in the lower molecular weight range found in vehicle exhaust aerosols.
If all C29 , C31 , and C33 :n-alkanes found in the fine particulate road dust samples
originated from deposited airborne dead or green fine particulate leaf abrasion
products (see Figure 5.4b ), then an estimate for such biogenic contributions to
the fine road dust could be made based on the :n-alkanes content of vegetation
source samples reported by Rogge et al.· ( 57). About 2.2 to 2.3% ( dead vs green
fine leaf abrasion products) of the fine particulate road dust collected here could
be derived from deposited airborne leaf surface debris, which translates to 5.3 to
5.5% of the organic compound mass found in the paved road dust sample.
Unfortunately, such an approach does not consider the likely contribution from
leaves collected on the street surface that are partially pulverized by the passing
vehicles, producing finely ground particulate plant material that contains not
only epicuticular plant wax particles, but also higher concentrations of cutin-

200
and suberin-like leaf fragments than would b.e found in our airborne leaf surface
abrasion products samples. In addition, the above approach does not separate
plant fragment contributions coming directly from garden soil, instead it con
siders only the contributions from ambient fallout. To simultaneously estimate
the biogenic source contributions to the road dust from depos_ited airborne leaf
abrasion products, ground up plant material, and garden soil, one has to model
three source/sink interactions simultaneously. The plant mix that is ground up
by passing traffic and garden soil contain additional organic and inorganic debris
beyond that found in airborne vegetation fragments. Hence, the overall vege
tative detritus contributions to the road dust sample considered here should be
higher than estimated solely from airborne leaf surface abrasion :g.-alkanes. Thus
the estimate given above provides a lower limit for vegetative contributions to
the fine particulate road dust collected.

201
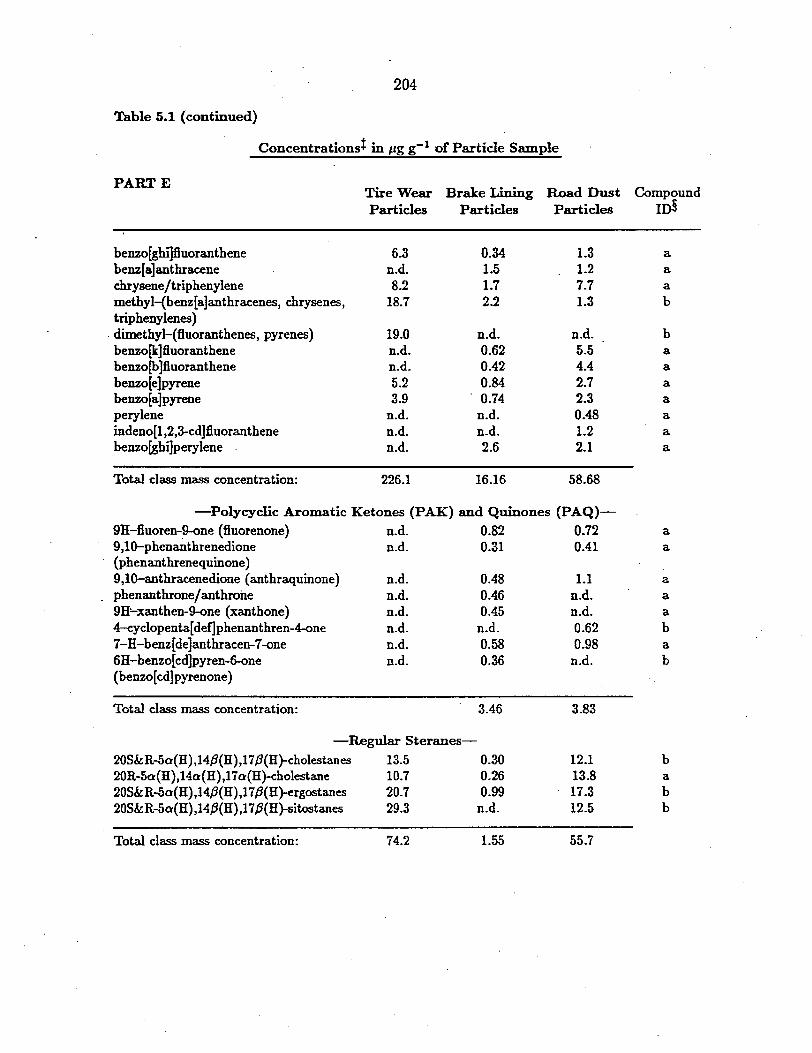
Table 5.1 Mass Concentrations for Organic Compounds found in Tire Wear Particlest, Fine Organometallic Brake Lining Wear Particles, and Fine Paved Road Dust Particles.
Concentrationsi in µg g-1 of Particle Sample
PART A Tire Wear Brake Lining Road Dust Compound Particles Particles Particles 10§
- :g.-Alkanes-nonadecane 40.7 2.0 14.3 a e1cosane 58.3 2.4 15.0 a heneicosane 47.7 1.7 28.8 a docosane 62.5 1.4 35~7 a tricosane 70.7 3.2 34.9 a tetracosane 114.0 1.9 39.5 a pentacosane 175.1 5.7 90.7 a hexacosane 185.9 3.3 51.1 a heptacosane 227.0 2.1 100.8 a octacosane 268.5 2.0 47.1 a nonacosane 389.3 3.3 214.7 a triacontane 546.0 2.1 61.9 a hentriacontane 742.9 2.3 150.7 a dotriacontane 9-69.0 1.6 84.3 a tritriacontane 1229.8 1.6 98.5 a tetratriacontane 1556.2 0.80 42.7 a pentatriacontane 2005.8 0.67 44.l a hexatriacontane 2253.9 0.42 31.3 a heptatriacontane 2301.5 n.d. 34.2 b octatriacontane 2181.2 n.d. 34.4 b nonatriacontane 1428.0 n.d. 20.5 b tetracontane 1157.7 n.m. n.m. b hentetracontane 831.1 n.m. n.m. b
Total class mass concentration: 18842.3 38.47 1275.2
-:g-Alkanoic Acids,_
hexanoic acid 122.0 82.l 71.4 a heptanoic acid 3.0 35.4 28.6 a octanoic acid 31.1 60.5 57.7 a nonanoic acid 90.9 87.4 135.4 a decanoic acid 37.8 18.4 55.4 a undecanoic acid 187.4 41.1 146.9 a dodecanoic acid 136.5 12.5 105.3 a tridecanoic acid 11.6 3.2 33.6 a tetradecanoic acid (myristic acid) 634.5 8.1 171.8 a pentadecanoic acid 86.0 3.2 64.4 a hexadecanoic acid (palmitic acid) 4818.4 83.3 1216.7 a

202
Table 5.1 (continued)
Concentrations+ in µg g-1 of Particle Sample
PARTB Tire Wear Brake Lining Road Dust Compound Particles Particles Particles 10§
heptadecanoic acid octadecanoic acid (stearic acid) nonadecanoic acid eicosanoic acid heneicosanoic acid docosanoic acid tricosanoic acid tetracosanoic acid pentacosanoic acid hexacosanoic acid heptacosanoic acid octacosanoic acid nonacosanoic acid triacontanoic acid hentriacontanoic acid dotriacontanoic acid
150.6 6009.0
16.6 127.0 n.d. n.d. n.d. n.d. n.d. n.d. n.d. n.d. n.d. n.d. n.d. n.d.
4.1 79.5 0.83 1.8 0.87 2.1 1.9 1.6 0.34 0.69 0.36 0.55 n.d. n.d. n.d. n.d.
61.3 689.0 27.0
119.0 20.9 70.2 23.6
116.2 21.9 93.4 20.6
124.0 21.5
120.3 12.5 48.9
a a a a
a a a a a a
a a a a a a
Total class mass concentration: 12197.3 529.74 3677.4
-~-Alkenoic Acids,_ cis-9--octadecenoic acid (oleic acid) 9,12-octadecadienoic acid (linoleic acid) 9,12,15-octadecatrienoic acid (linolenic acid)
1115.5 163.7
n.d.
10.7 n.d.
n.d.
130.9 129.1
17.3
a a
b
Total class mass concentration: 1279.2 10.7 277.3
- n-Alkanals-octacosanal n.d. n.d. 144.4 a triacontanal n.d. n.d. 232.2 a dotriacontanal n.d. n.d. 85.9 a
Total class mass concentration: 462.5
- !!-Alkanolshexacosanol n.d. n.d. 61.7 a octacosanol n.d. n.d. 152.9 a
Total class mass-concentration: 214.6

203
Table 5.1 (continued)
Concentrationsi in µg g-1 of Particle Sample
PARTD Tire Wear Particles
Brake Lining Particles
!load Dust Particles
Compound ID§
- Benzoic Acids1-benzoic acid 74.8 31.9 114.1 b 4-methylbenzoic acid n.d. 2.6 5.2 a 3,4-dimethoxybenzoic acid n.d. n.d. 5.5 a
Total class mass concentration:
2-methylbenzaldehyde 3-methylbenzaldehyde 4-methylbenzaldehyde 3-methoxybenzaldehyde 3,4-dimethoxybenzaldehyde 2-hydroxybenzaldehyde
74.8 34.5
-Substituted Benzaldehydes-
4.1 0.48 1.4 0.11 2.3 ·o.3o
n.d. 13.0 n.d. 0.45 n.d. 4.7
129.8
n.d. n.d. n.d. n.d. n.d. n.d.
b b a b a b
Total class mass concentration: 7.8 19.04
-Polyallcylene Glycol Ethers-2-(2-butoxyethoxy)ethanol n.d. 45.7 2-[2-(2-methoxyethoxy )ethoxy ]ethanol n.d. 248.1 2-[2-( 2-etho.xyethoxy )ethoxy ]ethanol n.d. 403.6 2-[2-(2-bu toxyethoxy )etho.xy ]ethanol n.d. 181.7
n.d. n.d. n.d. n.d.
a b b b
Total class mass concentration: 879.1
-Thiazole--Benzothiazole 124.3 n.d. 4.4 a
Total class mass concentration: 124.3 4.4
___:.Polycyclic Aromatic Hydrocarbons (PAH)-phenanthrene 11.8 0.97 3.9 a anthra.cene n.d. n.d. 0.84 a methyl-(phenanthrenes, anthra.cenes) 23.6 0.67 1.5 b dimethyl-(phenanthrenes, anthracenes) 38.5 0.66 3.1 b fluoranthene 11.1 0.69 6.9 a pyrene 54.l 1.1 9.4 a benzacenaphthylene n.d. n.d. 0.23 b 2-phenylnaphthalene n.d. n.d. 0.16 b 2-benzylnaphthalene n.d. n.d. n.d. b methyl-(fluoranthenes, pyrenes) 24.4 0.89 2.1 b
benzo[a]fluorene/benzo[b]fluorene . 1.3 0.26 0.37 a
204
Table 5.1 (continued)
Concentrationst in µg g-1 of Particle Sample
PARTE Tire Wear Particles
Brake Lining Particles
Road Dust Particles
Compound 10§
benzo[ghi]fluoranthene benz[ a]anthracene chrysene/triphenylene methyl-(benz[a]anthracenes, chrysenes, triphenylenes) dimethyl-(fluoranthenes, pyrenes) benzo[k)fluoranthene benzo[b ]fluoranthene benzo[e]pyrene benzo[a]pyrene perylene indeno(l,2,3-cd]fluoranthene benzo[ghi]perylene
6.3 n.d. 8.2
18.7
19.0 n.d. n.d. 5.2 3.9
n.d. n.d. n.d.
0.34 1.5 1.7 2.2
n.d. 0.62 0.42 0.84 0.74
n.d. n.d. 2.6
1.3 1.2 7.7 1.3
n.d. 5.5 4.4 2.7 2.3 0.48 1.2 2.1
a a a b
b a a a a a a a
Total class mass concentration: 226.1 16.16 58.68
-Polycyclic Aromatic Ketones (PAK) and Quinones (PAQ)-9H-fluoren-9-one (fluorenone) n.d. 0.82 0.72 a 9,10-phenanthrenedione n.d. 0.31 0.41 a (pbenanthrenequinone) 9,10-anthracenedione ( anthraquinone) n.d. 0.48 1.1 a phenanthrone/anthrone n.d. 0.46 n.d. a 9H:...xanthen-9-one (xanthone) n.d. 0.45 n.d. a 4-cyclopenta[def]phenanthren-4-one n.d. n.d. 0.62 b 7-H-benz[de]anthracen-7-one n.d. 0.58 0.98 a 6H-benzo[cd]pyren-6-one n.d. 0.36 n.d. b (benzo[cd]pyrenone)
Total class mass concentration: 3.46 3.83
-Regular Steranes-
20S&R-5a(H),14.B(H),17.B(H}-cholestanes 13.5 0.30 12.1 b 20R-5a(H),14o(H),17a(H)-cholestanc 10.7 0.26 13.8 a
20S&R-5o(H),14,6(H),17,6(H}-crgostancs 20.7 0.99 17.3 b 20S&R-5a(H),14,6(H),17,6(H)-sitostanes 29.3 n.d. 12.5 b
Total class mass concentration: 74.2 1.55 55.7

205
Table 5.1 (continued)
Concentrationst in µg g-1 of Particle Sample
PARTG Tire Wear Particles
Brake Lining Particles
Road Dust Particles
Compound ID§
-Pentacyclic Triterpanes-22,29,30-trisnorneohopane 29.6 0.35 10.l b 17o(H),21.fi(H)-30-norhopane 161.6 0.69 21.2 b 17o(H) ,21,B(H)-hopane 199.2 1.2 38.3 b 22S-l 7 o(H) ,21,B(H)-homohopane 107.4 0.41 16.7 b 22R-l 7 o(H) ,21,B(H)-homohopane 73.9 0.18 10.3 b 22S-17o(H),21,8(H)-bishomohopane 69.8 0.13 9.5 b 22R-17 o(H),21.fi(H)-bishomohopane 42.9 0.10 8.3 b
Total class mass concentration: 684.4 3.06 114.4
-Natural Resins1-dehydroabietic acid 7970.3 10.l 6.8 a abietic acid 69.6 n.d. n.d. b 7-oxodehydroabietic acid 10.1 n.d. n.d. a e.g. 13,8-ethyl-13-methyl-podocarp- 291.3 n.d. n.d. b
-8-en-15-oic acid e.g. 13o-isopropyl-13-methyl-podocarp- 255.8 · n.d. n.d. b
-8-en-15-oic acid e.g. 13,8-isopropyl-13-methyl-podocarp- 916.2 n.d. n.d. b
-8-en-15-oic acid
Total class mass concentration: 9513.3 10.l 6.8
-Amides-4-phenylbenzenamine 12.9 n.d. n.d. b
Total class mass concentration: 12.9
-Pesticides-iridomyrmecin (insecticide) n.d. n.d. 18.4 b simazine (herbicide) n.d. n.d. 22.6 b
Total class mass concentration: 41.0
-Chorinated Organics-
o-chloroindane 3.4 n.d. n.d. b 2,4,5'-trichlorobiphenyl 1.9 n.d. n.d. b
Total class mass concentration: 5.3
206
Table 5.1 (continued)
Concentrationst in µg g-1 of Particle Sample
PARTH Tire Wear Particles
Brake Lining Particles
Road Dust Particles
Compound 10§
-Pesticides-iridomyrmecin (insecticide) n.d. n.d. 18.4 b simazine (herbicide) n.d. n.d. 22.6 b
Total class mass concentration: 41.0
. o-chloroindane 2,4,5'-trichlorobiphenyl
-Chorinated Organics-3.4 n.d. 1.9 n.d..
n.d. n.d.
b b
Total class mass concentration: 5.3
-Other Compounds-hydroxymethylphthalimide 54.5 n.d. n.d. b p--octylphenol 17.6 n.d. n.d. b isopulegol n.d. n.d. 296.1 b o-terpineol n.d. n.d. 27.4 a ,8-citronellol n.d. n.d. 71.3 b
Total class mass concentration: 72.1 394.8
t Total (fine plus coarse) tire wear particles; it is assumed that fine wear particles have the same composition.
i n.d. =not detected; n.m. =not measured, GC/MS-analysis .was stopped prior to compound elution.
§ for more details see text. a, positive: authentic std. verification; b, probable: library spectrum verification; c, possible; d, tentative.
1 detected as methyl ester.

207
Comparison of Road Dust and Ambient Particulate Matter
Figure 5.4d shows the annual average mass concentrations of airborne fine par
ticulate u.-alkanes collected throughout 1982 at 3 urban sites within the greater
Los Angeles area ( 7). The ambient g-alkane signature over the range C29 to C33
follows closely that of the leaf abrasion aerosol samples ( compare Figures 5.4b
with 5.4d), except that C33 is less significant. Compared to the road dust sample,
the ambient aerosol samples are enriched in ~-alkanes in the range contributed by
vehicle exhaust ( compare Figures 5.4a., 5.4c-d). H one thinks of both road dust
and the ambient aerosol as containing a mixture of plant-derived :g-alka.nes and
vehicle exhaust u-alkanes, then this relative enrichment of vehicle exhaust par
ticles in the atmosphere vs plant-derived organics in road dust can be explained
by particle size considerations that are important to particle deposition from the
atmosphere. Exhaust aerosol is emitted primarily in submicron particle sizes cen
tered on particles of 0.1 to 0.2 µm in diameter ( 70) that deposit very slowly from
the atmosphere ( 71). Mechanically-generated leaf dust and soil dust particles are
larger in size, and hence deposit more readily by gravitational sedimentation or
impaction. Thus it is not surprising that the road dust deposits are enriched in
organics characteristic of the mechanically-generated fine particle sources while
the atmospheric samples are more enriched in combustion-generated organics.
Conclusion
The chemical composition of the solvent-extractable organics present in fine par
ticulate road dust, fine particulate organometallic brake lining wear, and partic
ulate tire debris has been evaluated using GC/MS techniques. The mass concen
trations of more than 100 individual organic compounds have been determined for
several compound classes and include the u.-alka.nes, :o-alkanoic acids, u-alkenoic

208
acids, :g.-alkenoic acids, :g.-alkanols, :g.-alkanals, benzoic acids, substituted ben
zaldehydes, polyalkylene glycol ethers, PAH, oxy-PAH, steranes, hopanes, natu
ral resins, pesticides, and others. u-Alkanes and n-alka.noic acids were the dom
inant solvent extractable compound classes identified in both tire wear parti
cles and road dust. Natural resins were found in substantial amounts in tire
debris, and in trace amounts in brake lining dust. Petroleum markers, e.g.,
steranes and hopanes, were :found in all samples, although brake lining wear
contained only small amounts. Polyalkylene glycol ethers, including triethylene
glycol monomethyl- and monoethyl ethers, commonly used in brake fluids, were
the dominant extractable organic compounds identified in the brake dust sam
ples. While none of these glycol ethers could be detected in the residential paved
road dust samples, annual average ambient ~oncentrations in the Los Angeles
area atmospheric fine aerosol (1982) ranged from 7.3 to 9.8 ng m-3 • Benzothia
zole, a product of thiazoles that are used as vulcanization accelerators in rubber
materials, was measured in tire wear particles and also in road dust that contains
tire wear debris.
Molecular concentration patterns found in particulate vehicular exhaust emis
sions, green and dry vegetative detritus, road dust, brake lining wear particles,
and tire debris were compared, and compound classes such as steranes, hopanes,
and higher molecular :g.-alkanes were used to estimate the contribution of tire
dust, vegetative detritus and vehicle exhaust aerosol to the road dust sample
analyzed here. It was found that a maximum of 7.6% of the fine road dust is
derived from vehicular exhaust emissions, which amounts to 32. 7% of the organic
compound mass found in the road dust sample. Even if all of the higher :g.-alkanes
in the fine road dust sample were present due to tire dust, comparison to our tire
209
dust sample shows that no more than 1.6% of the road dust mass corresponding
to 4.3% of the fine organics mass in road dust could be contributed by tire dust.
A lower limit can be placed on biogenic source contributions to the paved road
dust sample, utilizing the odd versus even carbon number predominance of~
alkanes :ranging from C29 to C33, as found in leaf surface abrasion products and in
the paved road dust sample. Vegetative detritus coming from nearby plants and
trees, garden soil, and atmospheric fallout combined was estimated to contribute
a.t the minimum 2.2% to the mass of fine particulate road dust collected here.
Restated, at least 5.3% of the organic portion of that fine particulate road dust
sample was derived from vegetative detritus.
It can be concluded that paved road dust represents an accumulation of contri
butions from a variety of urban source types including vehicle exhaust, tire dust
and vegetative plant fragments, garden soil, and others. The relative contribu
tion of these source types to the paved road dust complex can be studied by
organic molecular marker techniques. Road dust is in many respects chemically
similar to the primary portion of the atmospheric aerosol and indeed bears a
dynamic relationship to the atmospheric aerosol through resuspension into and
redeposition from the atmosphere.
210
REFERENCES
(1) Hildemann, L.M.; Markowski, G.R.; Cass, G.R. Chemical composition of
emissions from urban sources of fine organic aerosol. Environ. Sci. Technol.
1991, 25, 744-759.
(2) Mazurek, M.A.; Simoneit, B.R.T.; Cass, G.R.; Gray, H.A. Quantitative
high-resolution gas chromatography and high-resolution gas chromatogra
phy/mass spectrometry analysis of carbonaceous fine aerosol particles. In
tern. J. Environ. Anal. Chem. 1987, 29, 119-139.
(3) Mazurek, M.A.; Cass, G.R.; Simoneit, B.R.T. Interpretation ofhigh-resolution
gas chromatography and high-resolution gas chromatography /mass spectrom
etry data acquired from atmospheric organic aerosol samples. Aero-,ol Sci.
Technol. 1989, 10, 408-419.
(4) Mazurek, M.A.; Cass, G.R.; Simoneit, B.R.T. Biological input to visibility
reducing aerosol particles in the remote arid Southwestern United States.
Environ. Sci. Technol. 1991, 25, 684-694.
(5) Mazurek, M.A.; Hildemann, L.M.; Cass, G.R.; Simoneit, B.R.T.; Rogge,
W.F. Methods of analysis for complex organic organic aerosol mixtures from
urban sources of particulate carbon. In Sampling and Analysis of Airbone
Pollutants; Winegar, E.D., Keith, L.H., Eds.; Lewis Publisher: Boca Raton,
FL, 1993; pp 178-190.
(6) Rogge, W.F.; Hildemann, L.M.; Mazurek, M.A.; Cass, G.R.; Simoneit, B.R.T.
Sources of Fine Organic Aerosol: 1. Charbroilers and Meat Cooking Opera
tions. Environ. Sci. Technol. 1991, 25, 1112-1125.

211
(7) Rogge, W.F.; Mazurek, M.A.; Hildemann, L.M.; Cass, G.R.; Simoneit, B.R.T.
Quantification of Urban Organic Aerosols at a Molecular Level: Identifica
tion, Abundance, and Seasonal Variations. Atmos. Environ. 1993, in press.
(8) Rogge, W.F.; Hildemann, L.M.; Mazurek, M.A.; Cass, G.R.; Simoneit, B.R.T.
Sources of fine organic aerosol: 2. Noncatalyst and catalyst-equipped auto
mobiles and heavy-duty diesel trucks. Environ. Sci. Technol. 1993, 27,
636-651.
(9) Hildemann, L.M.; Mazurek, M.A.; Cass, G.R.; Simoneit, B.R.T. Quantitative
characterization of urban sources of fine organic aerosol by high-resolution
gas chromatography. Environ. Sci. Technol. 1991, 25, 1311-1325.
(10) Simoneit, B.R.T. Organic matter of the troposphere-III. Characterization
and sources of petroleum and pyrogenic residues in aerosols over the Western
United States. Atmos. Environ. 1984, 18, 51-67.
(11) Chi, C.T.; Hughes, T.W.; Ctvrtnicek, T.E.; Horn, D.A.; Serth, R.W. Source
assessment: Rubber processing, state of the art. Environmental Protec
tion Technology Series: EPA-600/2-78-004j, U.S. Environmental Protection
Agency, Cincinati, OH, 1978, 118 pp.
(12) Cardina, J.A. The determination of rubber in atmospheric dusts. Rubber
Chem. Technol. 1973, 46, 232-241.
(13) Funazukuri, T.; Takanashi, T.; Wakoa, N. Supercritical extraction of used
automotive tire with water. J. Chem. Engineering of Japan 1987, 20, 23-27.
(14) Fraser, D.A.; Rappaport, S. Health aspects of the curing of synthetic rubbers.
Environ. Health Perspec. 1976, 17, 45-53.

212
(15) Rappaport, S.M.; Fraser, D.A. Gas chroro.atographic-mass spectrometric iden
. tification of volatiles released from a rubber stock during simulated vulcan
ization. Anal. Chem. 1976, 48, 476-481.
(16) Storey, E.B. Oil-extended rubbers. Rubber Chem. Technol. 1961, 34, 1402-
1484.
(17) Kirk-Othmer Encyclopedia of Chemical Technology, 3rd Ed., Vol. 24, John
Wiley & Sons, Inc., New York, NY, 1985, 1028-1038.
(18) Kaidou, H.; Ahagon, A. Aging of tire parts during service. II. Aging of belt
skim rubbers in passenger tires. Rubber Chem. Technol. 1990, 63, 698-712.
(19) Ahagon, A.; Kaidou, H. Aging of tire parts during service. I. Types of aging
in heavy-duty tires. Rubber Chem. Technol. 1990, 63, 683-697.
(20) Dannis, M.L. Rubber dust from the normal wear of tires. Rubber Chem.
Technol. 1974, 47, 1011-1037.
(21) Fwa, T.F.; Ang, B.W. Tire-wear characteristics of public buses. J. of 1'ran3-
portation Engineering-ASCE 1991, 117, 298-310.
(22) Pierson, W.R.; Brachaczek, W.W. Airborne particulate debris from rubber
tires. Rubber Chem. Technol. 1974, 47, 1275-1299.
(23) Schuring, D.J.; Clark, J.D. Load, speed, and pressure effects on passenger
car tire rolling-loss distribution. Rubber Chem. Technol. 1988, 61, 669-687.
(24) Kim, M.G.; Yagawa, K.; Inoue, H.; Lee, Y.K.; Shirai, T. Measurement of tire
tread in urban air by pyrolysis-gas chromatography with flame photometric
detection. Atmo3. Environ. 1990, 24A, 1417-1422.
(25) Thompson, R.N.; Nau, C.A.; Lawrence, C.H. Identification of vehicle tire
rubber in roadway dust. J. of Ameri. Ind. Hyg. A330c. 1966, 27, 488-495.

213
(26) Douglas, A.G.j Eglinton, G. The distribution of alkanes. In Comparative
Phyiochemi.stry, Swain T. Ed., Academic Press, London, 1966, 57-77.
(27) Simoneit, B.R. T. ·Organic matter of the troposphere-V. Application of molec
ular marker analysis to biogenic emissions into the troposphere for source
reconciliations. J. Atmo.5. Chem. 1989, 8, 251-275.
(28) Simoneit, B.R.T.; Mazurek, M.A. Organic matter of the troposphere-II. Nat
ural background of biogenic lipid matter in aerosols over the rural Western
United States. Atmos. Environ. 19821 161 2139-2159.
(29) Bray, E.E.; Evans, E.D. Distribution of :g.-paraffins as a clue to recognition
of source beds. Geochim. Co.smochim. Acta 1961, 22, 2-15.
(30) Garza, M.E. Jr.; Muth, J. Characterization of crude, semirefined and refined
oils by gas-liquid chromatography. Environ. Sci. Technol. 1974, 8, 248-255.
(31) Spacht, R.B.; Hollingshead, H.L.; Bullard, H.L.; Wills, D.C. Volatility of
antioxidants and antiozonants. II. Effect on rubber testing. Rubber Chem.
Technol. 1965, 38, 134-139.
(32) Merck Index, 11th ed.; Merck and Co., Inc.: New York, 1989.
(33) Sax, N.I.; Lewis, R.J., Sr. In Hawley's Conden.sed Chemical Dictionary; Van
Nostrand Reinhold, New York; 1987, p. 130.
(34) Blumer, M. Polycyclic aromatic compounds in nature. Sci. Am. 1976, 234,
35----47.
(35) Tissot, B.P.; Welte, D.H. In Petroleum Formation and Occurrence: A New
Approach to Oil and Ga.s Exploration, Springer Verlag, Berlin, 1978, 538 pp.
(36) Falk, H.L.; Steiner, P.E.; Goldfein, S. Carcinogenic hydrocarbons in processed
rubber and in carbon blacks. Cancer Re.s. 1951, 11, 247.

214
(37) Falk, H.L.; Steiner, P.E. The identification of aromatic polycyclic hydrocar
bons in carbon blacks. Cancer Re$. 1952, 12, 30--39._
(38) Wakeham, S.G.; Schaffner, C.; Giger, W. Polycyclic aromatic hydrocar
bons in recent lake sediments-I. Compounds having anthropogenic origins.
Geockim. Co$mockim. Acta 1980, 44, 403-413.
(39) Haynes, B.S. Soot and hydrocarbons in combustion. In Fo$$il Fu.el Comb~
tion: A Source Book Bartock, W. and Sarofun, A.F. Eds., Wiley & Sons,
NY., 1991, 261-326.
(40) Lohrer, W.; Mierheim, H. Substitution of asbestos in friction lining - analysis
of problems and development trends. Staub-Reinhalt. Luft 1983, 43, 78-83.
(41) ·Jacko, M.G.; Tsang, P.H.S.; Rhee, S.K. Automotive friction materials evolu
tion during the past decade. Wear 1984, 100, 503-515.
(42) Fletcher, L.S. Feasibility analysis of asbestos replacement in automobile and
truck brake systems. M eckanical Engineering 1990, 3, 50--56.
(43) Day, A.J. An analysis of speed, temperature, and performance characteristics
of automotive drum brakes. J. Tribology-Tt-an.rnction., of the ASME 1988, 2,
298-305.
(44) Liu, T.; Rhee, S.K. High temperature wear of semimetallic disc brake pads.
Wear 1978, 46, 213-218.
(45) Ramachandra-Rao, V.T.V.S.; Ramasubramanian, H.; Seetharamu, K.N. Mod
elling of temperature distribution in a brake drum using finite element method.
Indian J. of Technology 1989, 27, 417-424.

215
(46) Harvey, J.L.; Milliken, L.T.; Forthofer, R.J. Trends in motor vehicle brake
fluids and their standards. Soc. Automo. Eng. Tech. Pap. 1971, SAE
710251: 1018-:--1036.
( 4 7) SRl International. Directory of chemical producers, United States of Amer
ica, Menlo Park, California, 1989.
(48) Rogge, W.F.; Mazurek, M.A.; Hildemann, L.M.; Cass, G.R.; Simoneit, B.R.T.
Quantification of urban organic aerosols at a molecular level: II. Identifica
tion, abundance, and seasonal variations. in preparation 1993.
( 49) Hall D.H.; Donaldson L.A. The ultrastructure of wax deposits on plant leaf
surfaces, 1. Growth of wax on leaves of Trifolium Repens. Nature 1963, 191,
95-96.
(50) Kolattukudy, P.E.. Plant waxes. Lipids 1970, 5, 259-275.
(51) Braaten, D.A.; Paw, U.; Shaw, R.H. Particulate resuspension in a turbulent
boundary layer - Observed and modeled. J. Aerosol Sci. 1990, 21, 613-628.
(52) Hall, D. The time dependence of particle resuspension. J. Aerosol Sci. 1989,
20, 907-910.
(53) Kulmala, M.; Riihiluoma, V.; Raunemaa, T. Particle emission from gasoline
powered vehicles: emiss1on, deposition and re-emission under different traffic
density situations. J. Aerosol Sci. 1986, 17, 973-983.
(54) Nicholson, K.W.; Branson, J.R. Factors affecting resuspension by road traffic.
Sci. of Total Environ. 1990, 93, 349-358.
(55) Eganhouse, R.P.; Kaplan, I.R. Extractable organic matter in urban stormwa
ter runoff. 1. Transport dynamics and mass emission rates. Environ. Sci.
Technol. 1981, 15, 310-315.
216
(56) Eganhouse, R.P.; Simoneit, B.R. T.; Kaplan, I.R. Extractable organic matter
in urban stormwater runoff. 2. Molecular characterization. Environ. Sci.
Technol. 1981, 15, 315-326.
(57} Rogge, W.F.; Hildemann, L.M.; Mazurek, M.A.; Cass, G.R.; Simoneit, B.R.T.
Sources of fine organic aerosol: 4. Particulate abrasion products from leaf
surfaces of urban plants. Environ. Sci. Technol. 1993, .mbmitted.
(58) Simoneit, B.R.T. Application of molecular marker analysis to vehicular ex
haust for source reconciliations. Intern. J. Environ. Anal. Chem. 1985, 22,
203-233.
(59) Kawamura, K.; Ng. L-L.; Kaplan, I.R. Determination of organic acids (C1
- C10 ) in the atmosphere, motor exhausts, and engine oils. Environ. Sci.
Technol. 1985, 19, 1082-1086.
(60) Simoneit, B.R.T. Characterization of organic constituents in aerosols in re
lation to their origin and transport: A review. Intern. J. Environ. Anal.
Chem. 1986, 23, 207-237.
(61) Hunt, J.M. In Petroleum Geochem~try and Geology. W.H. Freeman & Co.,
San Francisco, 1979.
(62) Johns, R.B. ed. In Biological Marker~ in the Sedimentary Record. Elsevier,
Amsterdam, 1986, 364 pp.
(63) Mackenzie, A.S.; Brassell, G.; Eglinton, G.; Maxwell, J.R. Chemical fossils:
The geological fate of steroids. Science 1982, 217, 491-504.
(64) Simonsen, J.L.; Owen, L.N. The Terpenes. Vol. I. The simpler acyclic and
monocyclic terpenes and their derivatives. Cambridge University Press, 1953,
479 pp.

217
(65) Daisey, J.M.; Cheney, J.L.; Lioy, P.J. Profiles of organic particulate emissions
from air pollution sources: status and needs for receptor source apportion
ment modeling. J. Air Pollut. Control As.,oc. 1986, 36, 17-33.
(66) Grimmer, G.; Hildebrandt, A. Investigation on the carcinogenic burden by
air pollution in man. XIII. Assessment of the contribution of passenger cars
to air pollution by carcinogenic polycyclic hydrocarbons. Zbl. Bakt. Hyg., I.
Apt. Orig. B 1977, 161, 104-124.
(67) Rieley, G.; Collier, R.J.; Jones, D.M.; Eglinton, G. The biogeochemistry of
Ellesmere Lake, U.K.-I: source correlation of· leaf wax inputs to the sedi
mentary lipid record. Org. Geochem. 1991, 17, 901-912.
(68) Eglinton, G.; Gonzalez, A.G.; Hamilton, R.J.; Raphael, R.A. Hydrocarbon
constituents of the wax coatings of plant leaves: A taxonomic survey. Phy
tochemistry 1962, 1, 89-102.
(69) Morrison, R.I.; Blick, W. The wax fraction of soils: separation and determi
nation of some components. J. Sci. Fd. Agne. 1967, 18, 351-355.
(70) Hildemann, L.M.; Markowski, G.R.; Jones, M.C.; Cass, G.R. Submicrometer
aerosol mass distributions of emissions from boilers, fireplaces, automobiles,
diesel trucks, and meat-cooking operations. J. Aerosol Sci. 1991c, 14, 138-
152.
(71) Seinfeld, J;H. In Atmospheric Chemi.5try and Phy.5ics of Air Pollution. Wiley
Interscience; New York, 1986, p. 647.

218
Chapter 6
Particulate Abrasion Products from
Leaf Surfaces of Urban Plants
Introduction
In order to model and predict the chemical composition and concentration
levels of airborne fine particulate organic compounds (dP ~ 2 µm) in an urban
environment, it is necessary to characterize the source profiles of the major an
thropogenic and biogenic sources. It has been observed that appreciable amounts
(23 to 52%) of the "fine" (< 1.7 µm) carbonaceous aerosol consists of contem
porary (non-fossil) carbon in the Los Angeles atmosphere (1-3). Much of these
contemporary carbon emissions are due to anthropogenic activities such as meat
cooking ( 4), fireplace combustion of wood, cigarette smoke, road dust, and the
natural rubber or resin content of vehicle tire wear debris ( 5). There is also strong
evidence that plant leaves contribute an unspecified amount of fine particulate
leaf wax protrusions to the atmosphere ( 6-18).
In order to apportion the contributions of primary fine particulate matter
released to the atmosphere from urban vegetation, a stable tracer compound or
an assemblage of tracer compounds with a distinct pattern is necessary. These
tracers must be quantified in both source and ambient aerosol samples so that
the fractional contribution of the source material present in the ambient samples
can be computed. The first goal of this study is to characterize the organic
Reference: Rogge, W.F.; Hildemann, L.M.; Mazurek, M.A.; Cass, G.R.;
Simoneit, B.R.T. Environ. Sci. Technol., 1991, 3ubmitted. ·

219
composition of fine particulate matter released from leaf surlaces, for example
due to wind induced-mechanical shear, from rubbing of leaves against each other
or due to the aging of the leaves. To accomplish this task and to examine
changes in leaf surface composition as leaves age, both green and dead leaves were
collected and composited according to the actual vegetation variety prevailing in
the Los Angeles basin ( 19, 20). Leaves from 62 different plant species including
broadleaf trees, c~nifers, palms, shrubs and grasses from cultivated and native
plant communities collected during the sampling campaign of Hildemann et al.
(5) were agitated to release particulate matter shed from their surfaces. The
resulting aerosol was collected downstream of cyclone separators ( dp :S: 2 µm), and
the extract was analyzed· by gas chromatography/mass spectrometry (GC/MS)
to identify and quantify the organic compounds emitted. The second goal of this
study is to determine the extent to which specific organic compounds can be used
as tracers for fine particulate leaf abrasion products in the urban atmosphere. To
achieve that goal, the charact~ristics of leaf abrasion aerosol will be compared to
other important direct and indirect emission sources of vegetative detritus, and
then these biogenic source data will be compared to the ambient fine organic
aerosol compounds measured in the Los Angeles area atmosphere.
Experimental Methods
Sample Collection
To collect a representative sample of leaves from the dominant plant com
munities of the Los Angeles area, the studies by Winer et al. (20) and Miller
and Winer (19) were used to determine the actual leaf mass for each important
plant species growing within the Los Angeles air basin. On the basis of the these
studies, leaf samples from 62 individual plant species were collected during the

220
period December 5-8, 1988 (5). Both a green leaf sample and a dead leaf sam
ple was collected separately from each plant species. The harvesting campaign
occurred following a period of rain which perhaps reduced the amount of an
thropogenic particulate matter present due to deposition onto the leaf surfaces
(Rainfall totalling 1.76 inches was observed during November 14 and 23-25).
The two sample sets (one for fresh green leaves and one for dry dead leaves) in
cluded leaves from 51 cultivated ornamental plant types such as broadleaf trees,
conifers, shrubs, palms, grasses, and other ground cover and 10 plant species
indigenous to the area. Leaves from one agricultural crop ( a lemon tree) also
were collected. Leaf samples from the cultivated plants were collected in the Los
Angeles County Arboretum in Arcadia, CA. Leaves from the plant communities
native to the basin were collected from Eaton Canyon Park in Pasadena, CA and
from Rancho Santa Ana in Claremont, CA. For more details including the names
of the actual plant species collected, their leaf mass per unit area of vegetated
land within the Los Angeles basin, and the fractional mass of each species in the
composite samples, see Hildemann et al. (5).
Leaf Aerosol Generation
In past studies, leaf surface structures, such as wax protrusions that might
under suitable conditions detach and become airborne, have been removed by
dipping the complete leaf into solvents such as chloroform or dichloromethane
(12, 16, 21-23) or by selective solvent extraction of the upper and lower leaf
side separately (24). However, under natural environmental conditions, these
crystalline-like leaf surface waxes are dislodged by the wind and/or by the rubbing
motions of leaves against each other. In urban areas, interaction with airborne
pollutants may alter leaf wax coatings in a way that affects the emission rate of

221
leaf surface matter (25). To acquire a chemical fingerprint representative of leaf
surface-derived urban airborne particles, urban leaf material must be sampled
and the typical mechanical removal process has to be simulated.
In two separate experiments, first the green leaf and then the dead leaf com
posites were placed in a Teflon bag. While agitating the leaves, purified labora
tory air was blown into the bag through a HEPA filter. Simultaneously, particle
laden air was withdrawn from the bag through cyclone separators (50% cutoff at
2 µm aerodynamic particle diameter) and collected on quartz fiber filters (Pallflex
2500 QAO) and Teflon filters (Gelman Teflo, 2.0 µm pore size). To ensure that
no unfiltered laboratory air could enter the bag it was operated under slight pos
itive pressure. Prior to sampling, the quartz :filters used were annealed at 750°C
for 2-4 h to guarantee low organic contamination levels. The resuspension and
agitation process for both the green and dead leaf mixtures was performed over
~ 2 h periods.
Sample Extraction
The filter samples collected here were processed according to an extraction
procedure initially developed by Mazurek et al. (26). Detailed descriptions have
also appeared in several subsequent papers, and only a brief discussion will be
provided here ( 4, 9, 10, 27). Prior to extraction, a known amount of perdeuter
a.ted tetracosane (:n.-C24D5o) was spiked onto the filter samples to serve as an
internal standard. The amount added was based on the organic carbon (OC)
content of the samples as determined by a separate analysis performed on fil
ters collected in parallel ( 5, 28). The fine particulate dead and green vegetative
fragments collected on quartz fiber filters each were extracted successively by
mild ultrasonic agitation twice in hexane (2 x 30 ml) and then three times in
222
benzene/2-propanol (2:1 mixture, 3 x 30 ml). After each extraction step, the
extracts were filtered and combined using a specially designed transfer and fil
tering line (26). The total sample extract then was reduced to 200 - 500 µl
using rotary evaporation and gentle high purity N,-stream evaporation. In order
to improve compound separation and detection, the sample extract was divided
into two aliquots. By adding freshly produced dia.zomethane to one aliquot, the
organic acids were derivatized to form their methyl ester analogues and aromatic
hydroxy compounds were derivatized to form their corresponding methoxy ana
logues. Until injection onto the GC/MS system -m~ed here, the sample extracts
were stored at -21°C.
Sample Analysis ·
Compound identification and quantification was conducted using a Finni
gan 4000 quadrupole mass spectrometer interfaced with a gas chromatograph
and an INCOS data system. For compound fragmentation, the mass spec
trometer was operated in the electron impact mode ( electron energy of 70 eV).
Compound separation was accomplished using a 30-m fused-silica DB-1701 col
umn (J & W Scientific, Rancho Cordova, CA). The chromatographic procedure
can be described as follows: (1) sample extract injection in splitless mode at
300°C, (2) isothermal hold at 65°C for 10 min, (3) temperature ramp program
at i0°C/min for 21 min, and ( 4) isothermal hold at 275°C for another 49 min.
For parallel analysis, a Varian 4600 high-resolution gas chromatograph (HRGC)
with Fill-detector system was used ( 28) which was operated with the same tem
perature programming and physical column used for GC/MS-analysis. Further
description of the analytical procedures are available elsewhere ( 4, 10, 26, 27).

223
Compound Identification and Quantification
The identification and quantification process for particle-bound organics is
explained comprehensively in previous and companion papers that also describe
the quality assurance procedures. emphasized in the present study (4, 10, 29).
Confirmation and quantification of the organic compounds present was attained
through the use of more than 150 authentic standards (10, 29), and by compar
ison to the mass spectral library maintained by the National Institute of Stan
dards and Technology (NIST). Compound identification was labeled as follows:
(a) positive, when the sample mass spectrum, authentic standard compound mass
spectrum and their retention times agreed well; (b) probable, same as above ex
cept no standards were available, but the sample mass spectrum agreed very
well with NIST Standard Library accessed by the IN COS data system; ( c) possi
ble, same as above except that the sample spectrum contained information from
other compounds but with minor overlap; (d) tentative, when the sample spec
trum contained additional information from possibly several compounds (noise)
with overlap; ( e) for iJo- and anteiJo-alkanes only: both branched-alkane types
can be distinguished from normal alkanes due to differences in the mass fragmen
tation pattern caused by favored scissions occurring at the C-C-bond adjacent
to the tertiary carbon atoms. As a result, major mass spectral peaks at M-43
( i.w-alkanes) and M-29 (anteiJo-alkanes) are observed allowing - in addition to
the elution time relative to the n-alkanes - their positive identification.
The compound quantification process was based on the application of n
C24D50 as the internal standard and 1-phenyldodecane as the coinjection stan
dard. To correct for detector resp~nse, sets of known standard compounds were
injected onto the analytical system to monitor their specific MS-response.
224
Results and Discussion
Plant Leaves as Source of Airborne Particulate Matter
The leaf surfaces of vascular. plants generally consist of a lipophilic polymer
membrane (cuticle) whose monomers are mostly hydroxy fatty acids (24, ·30-32).
Embedded and growing from the cuticular membrane are waxlike lipids forming
~stalline structures of micron to submicron dimensions and intercrystalline
amorphous zones which together act as a protective barrier between cuticula and
the atmosphere (21, 23, 30, 32, 34-38). These epicuticular plant waxes along with
the stomata (pores for the exchange of CO2 , water vapor, 0 2 , etc.) control the
aspiration and transpiration of gaseous substances, water, and solutes across the
leaf-atmosphere interface. Epicuticular plant waxes consist mainly of aliphatic
compounds such as higher molecular weight n-alkanes, n-alkanals, n-alkanols,
n-al.kanoic acids, and wax esters (16, 21, 23, 24, 30, 32, 39).
Because plant foliage also hosts microorganisms like bacteria, fungi and fun
gal spores, plants contribute to the aerial dispersion of such microorganisms ( 40-
44). Furthermore, leaves act as a sink for anthropogenic and natural airborne
material (e.g., soil particles), which under suitable conditions is reentrained (re
suspended) into the atmosphere. Due to wind-induced mechanical shear and
rubbing of leaves against each other, such epicuticular wax protrusions and leaf
deposits become airborne and have been identified in urban and rural aerosols
(7-11, 14-16, 18, 45-48) .
. In the following sections, the organic composition of fine particulate matter
collected from the agitation of green and dead leaf composites characteristic
of the Los Angeles basin will be discussed. Then these leaf surface emissions
will be related to other ·sources that emit biogenic particulate matter. Finally,

225
comparisons will be made to the organic composition of ambient fine particulate
matter collected from the Los Angeles urban atmosphere.
Mass Balance for Elutable Fine Organic Matter
For both fine particulate green and dead leaf abrasion prod_ucts, material bal
ances were constructed for the extractable and elutable organics mass as detected.
by GC/MS (see F~gures 6.la,b). This organics mass can be divided into chro
matographically resolved and unresolved organic compounds. The total mass
of resolved compounds ranges from 62% (green leaf abrasion products) to 67%
(dead leaf abrasion products). From the resolved organic mass, 76% (green leaf
abrasion products) to 84% (dead leaf abrasion products) could be identified as
individual compounds. The organic compounds identified consist mainly of epi
cuticular leaf wax constituents such as n-alkanes, n-alkanoic acids (both as free
acids and methyl esters), n-alkanols, n-alkanals, and other plant wax related
compounds. For these identi~ed portions, the relative abundance of each com
pound class found in the abraded dead and green leaf surface protrusions can be
compared as follows (see also Table 6.1): (a) the relative abundance of n-alkanes
(98.5 to 98.7% of the total alkanes, the remainder are iso- and anteiso--alkanes)
and n-alkanals increases only slightly when green leaves die and become brit
tle; (b) within the aliphatic acid group where n-alkanoic acids constitute 92.8 to
98.7% of the mass (the remaining portion is comprised of n-alkenoic acids and
others, see also Table 6.1 ), the relative aliphatic acid content in dead leaf abra
sion products is nearly tripled compared to green leaf abrasion particles (16.0%
vs. 5. 7% of the identifiable elutable mass); ( c) the relative amount of n-alkanol
compound mass as a fraction of the whole identified mass is reduced significantly
in the dead leaf abrasion products (green: 31.3% vs. dead: 20.6%);

226
(a) GC/MS Elutable Organic Mass: Green Vegetation Abrasioo Products
Umaolved Organia
Resolved Otganics
Unidentified . Organics
Identified Organics
n-Alkanols
n-Alkanes
(b) GC/MS Elutable Organic Mass: Dead Vegetation Abrasion Products
Tritcpcnoids,00%-
I ' -.
Mlono-&
I Unidentified
SesquilcrpenoidsOrgmics Unresolved
n-AlkanalsO!ganics80%
60%- n-Alkanols
Identified Alifii2tic Orgmics40%- Acids
Resolved Olganics
20%-n-Albncs
Fig. 6.1: Mass balance for elutable or~anic matter contained in the fine leaf · surface particles shed from: {a) green leaf and (b) dead leaf composites.

227
(d) mono- and sesquiterpenoids present in leaf abrasion products are reduced
more than half i.n dead leaf· versus green leaf samples (green: 7 .8% vs. dead:
3.1%); and (e) high molecular weight triterpenoids such as ,B-amyrin, ursolic and
oleanolic acids are even more drastically depleted in the dead leaf surface abrasion
products (green: 4.0% vs. dead: 1.1 %).
Aerosol Composition of Vegetative Origin
The reconstructed total ion current traces for the GC/MS analyses of dead
and green leaf abrasion products are shown in Figures 6.2a,b, which identify the
major resolved compounds present in the sample extracts. The mass concen
trations of the dominant compound classes and their distributions are shown in
Figures 6.3a-c. The organic composition of the resuspended vegetative detritus
samples can be described as follows.
Alkanes
Epicuticular waxes containing n-alkanes ( C20 - C.rn) are found on the surfaces
of plant leaves, seeds, fruits, stems, pollen, fungi, and also on insects (12, 21,
30, 33, 39, 45, 49-54). Waxy n-alkanes also have been detected in seed oils ·
(55). Biosynthesized leaf wax n-alkanes exhibit a strong odd carbon number
predominance with the dominant wax n-alkanes being C29 , Cai, and C33 (16, 21,
23, 30). Beside normal alkanes, i.5o- (2-methyl) and anteiso- (3-methyl) alkanes
also have been reported as part of the leaf waxes, especially in tobacco leaves
with the highest concentrations for C27 to C34 branched alkanes (21, 30, 56-60).
While i.5o-alkanes show a preference for odd carbon number molecules, similar to
n-alkari.es, antei.rn-alkanes favor even carbon number chain-lengths. Leaf surface
wax constituents such as n-alkanes and others reveal a characteristic distribution

228
100 (a) X
C29
c:n
RIC I.S.
Camphor
C33
C271-PD
3 F 3,F 01 Ur
200 600 1000 1400 1800 SCAN
C31 100 (b} C2t
I.S.
X
RIC C33
1-PD
Camphor
.))1 Ur
200 600 1400 1800
Fig. 6.2: Total reconstructed ion current (RIC) chromatogram (GC/MS) for fine leaf surface particulate matter shed from: (a) green leaf and (b) dead leaf composites. Numbers refer to carbon chain length of compounds: C, n-alkanes; F, n-alkanoic acids (detected as methyl esters); Of, oleanolic acid as methyl ester; Ur, ursolic acid as methyl ester; 1-PD, 1-phenyldodecane as coinjection standard; I.S., n-C24D50 as internal standard; X, contaminant.
1000 SCAN

229
12000~------------------,,(11) Dead LeafAbruion Producu -
10800 Gn:en Leaf Abruion Produas --
9600
8400
7200
j 6000
4800
3600
2400
1200
1920212223 24 25 26 2728 29 30313233 3435 36 3738 3940<41
11-Alboe Carbal Number4000..--------------------,(a) Dead LeafAbruioo Products -
3600 Green Leaf AlnsiOQ Produc:u --
3200
2800
2400
~ 2000 ::I.
1600
1200
o,+-..-.--.--.--.-Fl~..;::::;..-,...........,......,,_-1-~--...,.........,__,---1
6 8 10 12 14 16 18 20 22 24 · 26 28 30 32
11-Albnoic Acid Carbon Number18000-.--------------------. (a)
:'
' . O-+-+--i-+-+--+--+-+-1-+...,......,....,.....,......-+-+--+-+-+--f--+-I
24 25 26 27 28 29 303132
n-Alkmol Cuba! NIDDber
16200
14400
12600
10800
~ 9000 ::I.
7200
5400
3600
1800
Dead l,eaf AbruiOll Products -Green Leaf Abrasiai Producu -·
24 2526272829 303132
n-Albnal Carbon Number
Fig. 6.3: Compound conc_entrations per gram of fine particulate matter shed from leaf surfaces: (a) n-alkanes, (b) n-alkanoic acids, and (c) n-alkanols and n-alkanals.

230
for each plant species which additionally can be modified to adapt the plants
to different climatological and geographic conditions, such as temperature and
water supply (24, 32, 61-65). Recently, it has been suggested that pollutant
exposure also might alter the epicuticular wax composition and acceierate ieaf
wax erosion (25, 66-69).
While pollen, fungi, and insect fragments are much too large ( dP > 2 µm) to
be collected with the methods employed here, some of the :fine particulate matter
released from the leaf surfaces may contain bacterial microorganisms and fungal
spores (70). Although bacteria are not known to have a waxlike surface layer,
those bacterial lipids that are soluble in organic solvents and distinct from fats
and phospholipids are termed "waxes" (71). The waxlike lipid fraction of most
bacteria consists mainly of fatty acids(:$ C20), and usually accounts for less than
5% of the bacterial dry weight ( 72). Microbial "wax" alkanes occur as normal,
branched, and monounsaturated homologues. Waxes of photosynthetically active
bacteria predominantly contain medium molecular weight hydrocarbons (CH -
C20), whereas non-photosynthetic bacteria also show small amounts of normal
and branched higher molecular weight alkanes (C26 - C30 ) (50, 71, 73).
Garden soil, a pool for plant degradation, contains n-alkanes with an odd
carbon number preference in about the same carbon range as epicuticular leaf
waxes (74, 75). Despite the fact that soil dust consists mainly of coarse particu
late matter (dp > 2 µm), waxlike compounds from the soil biota might contribute
somewhat to the dead leaves collected from the ground and to a smaller extent
to the green leaves, where deposition of airborne soil dust onto the living plants
and trees might occur.
In contrast to contemporary biomass, n-alkanes found in crude oils and in

231
petroleum-derived products do not show a preference for odd-to-even carbon
number n-alkanes, having lost this feature during the maturation processes on
going within the sedimentary organic material. These maturation processes can
also be accompanied by a shift of n-alkanes to lower carbon numbers, with the
most abundant n-alkane (CMaz) in crude oil falling in the range of C22 to ~s
(76-79).
In the fine particulate leaf abrasion products investigated here, n-alkanes
were identified and quantified ranging from C19 to C36 (Table 6.1 ). The mass
distribution profiles for both green and dead leaf abrasion particles are shown
in Figure 6.3a. The odd carbon number n-alkanes with 29, 31, and 33 carbon
atoms are by far the most prominent wax n-alkanes identified in emissions from
the vegetation of the leaf composites (see also Figures 6.2a,b). The mass con
centrations (µg g-1 of fine particulate leaf surface material emitted) for these
hydrophobic and chemically rather stable compounds do not change significantly
when comparing green with dead leaf abrasion particle samples. This indicates ·
that most of the n-alkanes released during the leaf agitation experiments are in
fact derived from epicuticular plant wax protrusions. Besides n-alkanes, iso- and
anteiso- alkanes (C29 to C34 ) also have been identified in small concentrations.
As a group, the identified iso- and anteiso-alkanes amount only to 1.5 to 1.6% of
the C29 to C34 n-alkanes mass.
Alkanoic and Alkenoic Acids
Another major compound class commonly identified in epicuticular plant
waxes is the group of saturated n-fatty acids {12, 14, 16, 23, 30, 32). Higher
molecular weight n-fatty acid synthesis includes elongation of low molecular
weight homologues yielding predominantly even carbon number n-·alkanoic acids

232
(30). Whereas the synthesis of higher molecular weight n-alkanoic acids is unaf
fected by light, the synthesis of the short-chain n-fatty acids is closely linked to
photosynthesis where Cl6 and C18 are the major n-alkanoic acids produced (30).
n-Alkanoic acids also have be found in the waxlike extracts of fungi (molds),
bacteria, spores, pollen, and algae (37, 71, 72, 80-83). The microorganisms men
tioned above all favor production of branched, normal, and also hydroxy fatty
acids with a carbon length :5 C20 {14, 50, 71, 81, 82, 84) . .Recently, Lee and
coworkers (85) determined the viable bacteria size distribution in the urban at-·
mosphere. The mass median diameter of the airborne bacteria was 7.6 µm. Only
10% of the bacteria show diameters ~ 2 µm. Molds and their spores show exclu
sively diameters > 2 µm ( 86). Consequently bacteria and bacterial spores which
might be found in the particle size range dp ~ 2 µm could possibly contribute
to the fine particulate matter abraded from the leaf surfaces and would contain
n-alka.noic acids ( C ~ 20) that overlap the lower molecular weight range of the
n-alkanoic acids found in leaf surface waxes.
In this study, n-alkanoic acids ranging from octanoic acid (C8 ) to dotria
contanoic acid (C32) have been identified in both green and dead leaf abrasion -
products (see Figures 6.4a,b). Except for nonanoic acid {C9 ), which might be an
oxidation product of palmitoleic (C16,1 ) and oleic (C18,1 ) acids, a strong even-to
odd carbon number predominance is observed with C26 , C28 , C30 , and C32 as the
major homologues usually found in leaf waxes of vascular plants ( e.g., 24, 32) (see
Figure 6.3b). n-Alkanoic acids are often minor compounds in green leaf surface
waxes ( e.g., 24, 32, 87) which agrees with the our data, see Table 6.1. Of the
total amount of n-alkanoic acids quantified, 1.2% (dead leaf abrasion products)
to 5.0% (green leaf abrasion products) was found as methyl esters in the-

100 a)
I ( I16F
J m/z
i X 87 I 74 11 BF9F 24F
10F · 14F 22F 26F 28F
SF I I 1 2 F , ,, n s::I I t 30FI 32F
1000 1200 1400400 600 800 SCAN
100 -, ( b) r16F ~20F 1"
C,,.)24F 28F ~
m/z 1 9F I 30FI I I 26F 14F
74 1 87 I I 1 ~ F I 2~FI I I I 32FBF l10F i12F
400 600 800 1000 1200 1400 SCAN
Fig. 6.4: Selected mass fragmeiltograms for n-alkanoic acids as methyl esters {sum: m/z 74 + 87) found in fine particulate leaf abrasion products: ( a) green leaf and (b) dead leaf composites. Numbers · refer to the carbon c~ain length of the n-alkanoic acids ( detected as methyl esters).

234
underivatized sample extracts. Hence, most of the n-alkanoic acids identified in
the range investigated exist as free acids in the plant surface waxes.
A more than 'four-fold increase in the mass concentration of higher molec
u.lar weight n-alkanoic acids (2: C:24 ) is observed in dead leaf abrasion products
when compared to green leaf abrasion products. Possible explanations include
oxidation of n-alkanols and n-alkanals to form n-alkanoic acids in the dead leaf
material and/or the effect of environmental growth conditions (e.g., temperature)
or leaf age on wax composition (24, 61, 63-65, 88).
Unsaturated n-fatty acids also have been identified and quantified in the
leaf abrasion products of the present study. Oleic (18:1), linolenic (18:2), and
linoleic (18:3) acids are the unsaturated n-fatty acids (n-alkenoic acids) identified
here and are common constituents of the total lipids that can be extracted from
broadleaves and conifer needles ( 37, 84). Unsaturated n-fatty acids are also found
in bacteria, fungal spores, pollen, seeds and seed oils, plant organells and leaf
cells (37, 72, 79, 81, 83, 84). They are uns~able compounds susceptible to radical
and oxidant ( e.g., ozone) attack (47, 89, 90). The n-alkenoic acids concentration
per mass of abraded fine leaf particles is from 35% to 73% lower in the dead leaf
than in the green leaf abrasion products (see Table 6.1), which is consistent with
the expected degradation over time of such unsaturated compounds.
Alkanols and Alkanals
Both compound types are synthetized enzymatically by plants from precursor
n-alkanoic acids (30). Long-chain n-fatty acids are more readily utilized in this
synthesis than shorter ones. The resulting long-chain n-alkanols and n-alkanals
are often the major compound classes identified in leaf waxes and show a prefer-

235
ence for even over odd carbon number homo~ogues (24, 36).
Several long-chain primary n-alkanols (C2s, C26, C2s, C3o, Cs2) and n-alkanals
(C2s, C2s, Cso, Cs2) have been identified in the present study in both green and
dead leaf abrasion detritus (Table 6.1). Even carbon number n-alkanols and n
alkanals dominate the emissions of these compound classes; with the exception of
pentacosanol (C25 ), only the even number homologues were found in this study
( see Figures 6.5a,b ). The most abundant primary n-alkanols in green leaf abra
sion products are C26 and C2t1 (see Figure 6.3c). On the contrary, C30 and C32
n-alkanols are more abundant in dead than in green leaf abrasion products. A
similar trend also was found for n-alkanals (see Figure 6.3c). As discussed be
fore, oxidative alterations, environmental growth conditions ( e.g., temperature)
and/or the effect of leaf age on wax composition might be responsible for the
observed compositional differences seen between green and dead leaf abrasion
products.
Mono-, Sesqui-, and Triterpenoids
Several oxygenated acyclic, monocyclic, bicyclic monoterpenoids, sesquiter
penoids, and pentacyclic triterpenoids ( terpenols, terpenoid acids and ketones)
have been found in both the green and dead leaf abrasion particle samples ( see
Table 6.1 ). Mono- and sesquiterpenoids are released from many plant species,
and their oxygenated forms are known for their pleasant and distinctive odors
(91-99). They are synthetized by the plant communities investigated here and
adhere to the fine particulate leaf abrasion products. Their mass concentration as
a group declines by more than 60% when going from particles abraded from green
leaves to those from dead leaves (see Table 6.1). This decline in concentration
seen in dead leaf surface matter may be the result of evaporative losses

C29 26H 100.(a) C31
28H C: n-alkanes
I
A: n-alkanalsm/z 28A H: n-alkanols6A 82
C3383
30A
30H C35 32A 32H
900 1000 1-100 SCAN 1300 1400 1500
C29 ~ w100.(b)
C31 0)
C: n-alkanes A: n-alkanals
m/z H: n-alkanols 82 C33
I26A83 30A
C27 28A 28H
26H 30H C35 32A
32H25H
900 1000 1100 SCAN 1300 1400· 1500
Fig. 6.5: Selected mass fragmentograms typical for n-alkanols and n-alkanals (sum: m/z 82 + 83) found in fine particulate leaf abrasion products: (a) green leaf and (b) dead leaf composites. Numbers refer to the carbon chain length of the molecules: At n-alkanals; Ct n-alkanes; H, n-alkanols.

237
as well as possible leaf-atmosphere surface chemical reactions. Camphor, a bi
cyclic monoterpenone, is the single most abundant terpenoid in both the green
( ~ 3500 µg g-1) and dead (~ 1600 µg g-1) fine particulate leaf abrasion product
samples studied here.
One triterpenol (.B-amyrin) and two triterpenoic acids ( oleanolic and urso
lic acid) have been identified in the leaf abrasion particle samples studied here.
Triterpenoids previously have been identified as common leaf and fruit wax con
stituents (30, 47, 87, 88, 100, 101). Because of their high molecular weights (MW
~ 426), oxygenated pentacydic triterpenoids have very low vapor pressures and
exist exclusively in the condensed phase. Nevertheless, the mass concentrations
of the three triterpenoids are much lower (by 55 to 75%) in the dead versus
green leaf detritus samples, indicating that these compounds are either suscepti
ble to leaf-atmosphere reactions or microbial degradation. Related findings have
been reported by Simoneit et al. ( 47) based on direct examination of leaf sur
face material and total ambient particle samples. They found that triterpenoids
were more abundant in composited .leaf waxes than were phytosterols, whereas
in ambient aerosol samples, triterpenoids were less abundant than phytosterols.
Kolattukudy (30) reported that certain highly specialized microorganisms ( Pseu
domonas species) can grow on ursolic acid as the sole source of carbon, suggesting
that microorganisms could also be responsible for the observed depletion of the
triterpenoids in the dead leaf surface abrasion products.

238
Table 6.1 Organic Compounds found in Fine Particulate Abrasion Products from Green and Dead Leaves 4
•
Concentrations in µg g-1 of Leaf Abrasion Products6
PARTA Green Leaf Dead Leaf Compound Composite Composite 1ne
--n-Alkanes-
nonadecane 9.0 4.8 a eicosane 13.2 4.8 a heneicosane 14.0 8.6 a docosane 15.3 8.0 a tricosane 33.8 21.4 a tetracosane 44.9 29.6 a pentacosane 220.4 199.9 a hexacoeane 93.5 125.5 a heptacosane 821.9 1035.4 a octacoeane 234.4 328.8 a nonacosane 5958.4 6616.6 a triacontane 433.8 445.2 a hentriaconta.ne 9493.3 9395.8 a dotriacontane 758.7 880.7 a tritriacontane 4635.8 5480.3 a tetratriacontane 90.3 91.9 a pentatriacontane 359.8 651.0 a hexatriacontane 49.0 13.2 a
Total class mass concentration: 23279.5 25341.5
-iao- and anteiao-Alkanes-iso-nonacosane 18.4 20.7 e iso-triacontane 7.7 5.4 e iso-hen triacontane 65.7 67.3 e iso-tritriacontane 123.0 140.4 e
anteiso-triacontane 19.7 19.3 e anteiso-hentriacontane 15.9 · 15.9 e anteiso-dotriacontane 42.7 36.3 e anteiso-tritriacontane 7.2 5.5 e anteiso-tetratriacontane 44.8 28.1 e
Total class mass concentration: 345.l 338.9
--n-Alkanoic Acidsd-
octanoic acid ( caprylic acid) 143.4 249.7 a nonanoic acid (pelargonic acid) 444.7 596.8 a decanoic acid ( capric acid) 183.8 133.0 a undecanoic add 597.6 403.1 a dodecanoic acid (lauric acid) 64.5 91.4 a
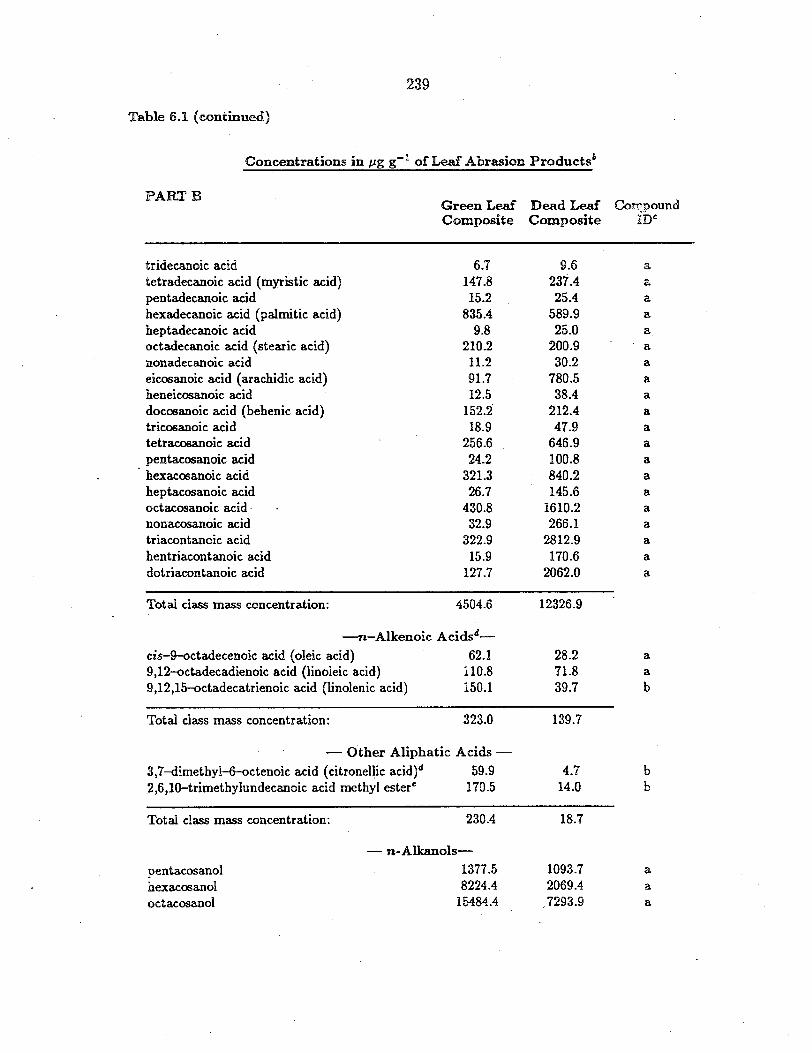
239
Table 6.1 (continued)
Concentrations in µg g- 1 of Leaf Abrasion Productsb
PARTB Green Leaf Composite
Dead Leaf Composite
Corr}pound IDe
tridecanoic acid tetradecanoic acid (myristic acid) pentadecanoic acid hexadecanoic acid (palmitic acid) heptadecanoic acid octadecanoic acid (stearic acid) nonadecanoic acid eicosanoic acid ( arachidic acid) heneicosanoic acid docosanoic acid (behenic acid) tricosanoic acid tetracosanoic acid pentacosanoic acid hexacosanoic acid heptacosanoic acid octacosanoic acid · nonacosanoic acid triacontanoic acid hentriacontanoic acid dotriacontanoic acid
Total class mass concentration:
6.7 147.8 15.2
835.4 9.8
210.2 11.2 91.7 12.5
152.2' 18.9
256.6 24.2
321.3 26.7
430.8 32.9
322.9 15.9
127.7
4504.6
-n-Alkenoic Acidsd-
cis-9-octadecenoic acid ( oleic acid) 62.1 9,12-octadecadienoic acid (linoleic acid) 110.8 9,12,15-octadecatrienoic acid (linolenic acid) 150.l
Total class mass concentration: 323.0
- Other Aliphatic Acids -3,7-dimethyl-6-octenoic acid (citronellic acid)d 59.9 2,6,10-trimethylundecanoic acid methyl estere 170.5
9.6 237.4 25.4
589.9 25.0
200.9 30.2
780.5 38.4
212.4 47.9
646.9 100.8 840.2 145.6
1610.2 266.1
2812.9 170.6
2062.0
12326.9
28.2 71.8 39.7
139.7
4.7 14.0
a a a
a a a a
a a a a a a a a a a
a a a
a a
b
b b
Total class mass concentration: 230.4 18.7
- n-Alkanols-
pentacosanol 1377.5 1093.7 a
hexacosanol 8224.4 2069.4 a
octacosanol 15484.4 7293.9 a
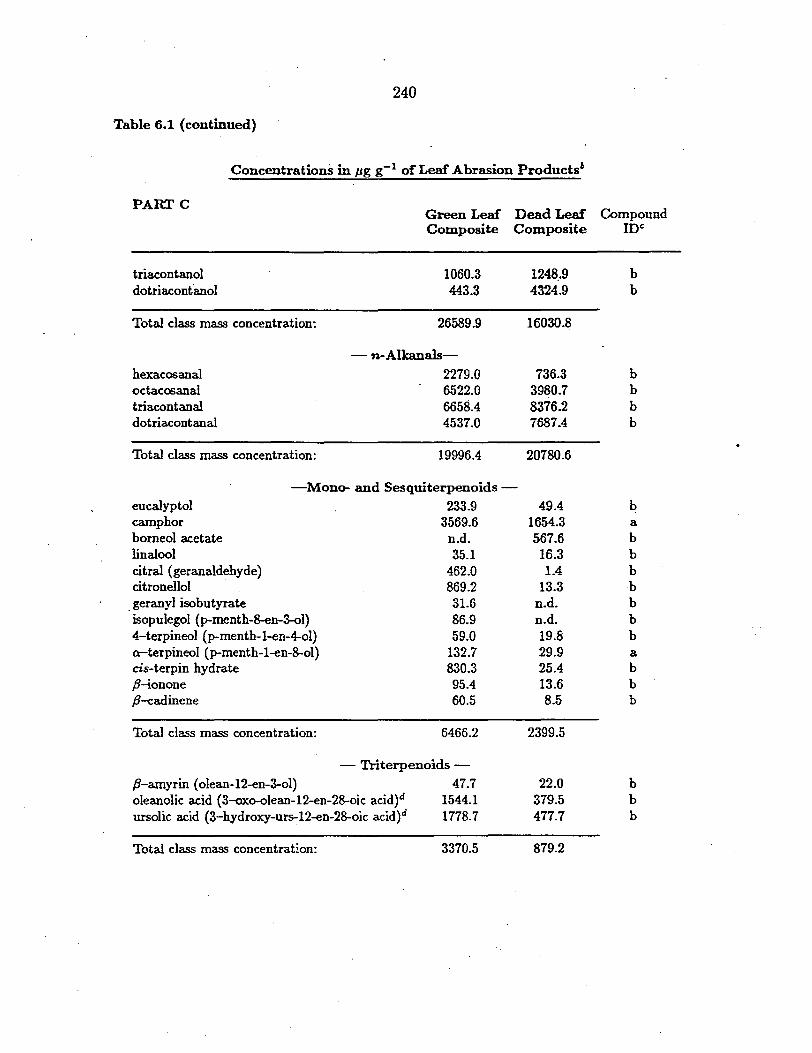
240
Table 6.1 (continued)
Concentrations in µg g-1 of Leaf Abrasion Products6
PARTC Green Leaf Composite
Dead Leaf Composite
Compound Inc:
triacontanol 1060.3 1248..9 b dotriaconta.nol 443.3 4324.9 b
Total class ~ concentration: 26589.9 16030.8
hexacosanal octacooanal triacontanal dotriacontanal
- n-Alkanals-2279.0 6522.0 6658.4 4537.0
736.3 3980.7 8376.2 7687.4
b b b b
Total class mass concentration: 19996.4
-Mono- and Sesquiterpenoids -eucalyptol 233.9 camphor 3569.6 borneol acetate n.d. linalool 35.1 citral (geranaldehyde) 462.0 citronellol · 869.2
. geranyl isobutyrate 31.6 isopulegol (p-rnenth-8-en-3-ol} 86.9 4-terpineol (p-menth-1-en-4-ol) 59.0 a-terpineol (p-menth-1-en-8-ol) 132.7 cis-terpin hydrate 830.3 ,B-ionone 95.4 ,B-cadinene 60.5
20780.6
49.4 1654.3 567.6 16.3 1.4
13.3 n.d. n.d. 19.8 29.9 25.4 13.6 8.5
b a
b b b b b b b a b b b
Total class mass concentration: 6466.2 2399.5
- Triterpenoids -,B-amyrin ( olean-12-en-3-ol) 47.7 oleanolic acid (3-axo-olean-12-en-28-oic acid)d 1544.1 ursolic acid (3-hydroxy-urs-12-en-28-oic acid)d 1778.7
22.0 379.5 477.7
b b b
Total class mass concentration: 3370.5 879.2

241
Table 6.1 (continued)
Concentrations in µg g-1 of Leaf Abrasion Products11 •
PARTD Green Leaf Dead Leaf Compound Composite Composite IDc
-Polycyclic Aromatic Hydrocarbons (PAH)-fluoranthene 1.2 0.47 a. pyrene 2.0 1.1 a chrysene/triphenylene 2.9 1.9 a
Total class mass concentration: 6.1 3.47
-Others-
dibydroactinidiolide 75.6 12.8
Total class mass concentration: 75.6 12.8
0 fine particulate matter (dp $ 2µm) released from the leaves by by resuspension and agitation of the leaf composites.
l> n.d. =not detected. c for more details see text. a, positive: authentic std. verification; b, probable:
library spectrum verification; c, possible; d, tentative; e, iso- and anteiso-alkanes are positively identified by monitoring their major ions at M-43 and M-29 respectively.
d detected as methyl esters in the derivatized sample aliquot. ~. compound detected as methyl ester in the underivatized sample aliquot.

242
Deposition of Airborne Particles onto Vegetatic:mal Foliage
Leaf surfaces are considered to be an important sink for airborne particulate
matter originating from anthropogenic sources (102-104). Assuming that all el
emental carbon (EC) determined in the fine particulate leaf abrasion prodticts
(5) originates from dry deposited fine airborne particulate matter and that the
EC/OC ratio found in Los Angeles ambient fine particulate matter is on the aver
age 2:1 (105) then the organic fraction in the leaf abrasion particles contributed
from airborne particle fallout can be estimated. From those calculations it is
found that less than 5% of the abraded organic matter is due to dry deposited
airborne fine particles .
. Given the small contributions from dry deposited aerosol, it is not surprising
that only small amounts of PAH such as fluoranthene, pyrene or chrysene and
triphenylene have been found in the fine particles abraded from the leaf compos
ites. No fossil fuel markers ( e.g., steranes, hopanes) characteristic for petroleum .
products have been detected (29). Investigations of the organic composition of
fine particulate emissions from diesel and gasoline powered vehicles, road dust
and other traffic-related sources have been completed recently by Rogge et al.
(29, 106). Vehicular n-alkane emissions are most pronounced for n-alkanes ~ C27
with no odd to even carbon number predominance. Although the n-alkane pro
files of ambient fine particle samples reflect such vehicular-derived emis_sions (10),
the n-alkane profiles of green and dead leaf abrasion products studied here do
not reflect significant contributions from motor vehicle exhaust.

243
Molecular Tracers for Vegetative Detritus
To trace the emissions and fate of organic fine particulate leaf abrasion prod
ucts in the urban atmosphere, a stable and distinct molecular marker or an as
semblage of such organic compounds is necessary. When using a group of single
organic compounds or a series of homologues ( e.g., n-alkanes, n-alkanoic acids,
hopanes, etc.) it must be shown that these compounds have a concentration
pattern that is characteristic of the source under consideration. Furthermore,
the potential for interfering contributions to these ambient tracer concentrations
due to other sources must be assessed.
The group of n-alkanes (C27 - C33 with their strong odd carbon number
predominance) might serve as a marker assemblage that could be used to trace
fine particulate vegetative detritus released to the urban atmosphere. For this
to constitute a useful tracer for leaf abrasion products, the extent to which the
biogenic preference for odd carbon number n-alkanes can be found in the fine
particulate emissions of other sources must be determined. '!'he n-alkanoic acids
(C20 - C32 with their strong even carbon number predominance) might also be
examined for 'use as tracers, although their variability between dead and green
leaf abrasion products is greater.
Because gasoline and diesel fuel powered vehicles emit n-alkanes mainly in
the carbon range :S C27 with small amounts of n-alkanes > C2s and virtually no
odd/even carbon number predominance, no interference is expected from these
sources with the plant wax odd/even n-alkane pattern (29, 106, 107). Likewise,
vehicular exhaust emissions contain only n-alkanoic acids < C22 with no prefer
ence for odd or even carbon numbers (29, 106, 107). Similar results for n-alkanoic
acids have been found for tire wear particles and brake lining abrasion products

244
(106). Although tire wear n-alkanes have been identified that range from C19 to
C40 and possibly higher, no odd/even carbon number predominance is observed
for that series (for more details see Rogge et al., 106). Other important_ sources
releasing fine organic particulate matter to the urban Los Angeles atmosphere
include meat cooking operations ( e.g., hamburger frying and charbroiling; 4, 5).
However, meat cooking releases only small a.mounts of n-alkanes that do not
show a pronounced odd/even carbon number dominance over the range -C27 to
C2s, and virtually no n-alkanoic acids > C1s have been found in these fine par
ticulate emissions ( 4). Seed oils used for food preparation also contain small
amounts of n-alkanes that have been dissolved from the waxlike coating of seed
hulls during the oil extraction process ( 55) and that could become airborne dur
ing cooking with such oils. Refined seed oils consist mostly of fatty acids, but also
contain 0.01-0.5% hydrocarbons by mass, including n-alkanes, i3o-alkanes, plus
multi-branched ( e.g., squalene ), and cyclic hydrocarbons ( 55). The n-alkane dis
tributions for many seed oils show the typical plant wax odd/even carbon number
predominance (C27 to C33), which constitutes a potential source of interference
with the use of higher molecular weight n-alkanes as a tracer for airborne plant
debris.
Cigarette smoke, a combustion product from tobacco leaves, exhibits a dis
tribution pattern for higher molecular weight n-alkanes that is similar to that
found for green and dead leaf abrasion products, as shown by comparing Fig
ure 6.3a with 6.6a (108). Likewise, the n-alkanoic acids from cigarette smoke
exhibit an even/odd carbon number predominance similar to that observed for
the leaf abrasion samples ( compare Figures 6.3b with 6.6b ); however palmitic
(C16 ) and stearic (C18 ) acids are relatively more abundant in cigarette smoke

245
SOI..------------------,45 (1) Op!l:IICSmob:
40
!!I
5
o.~::;:;::;;;:::::;:::::::~.;:;....,;..,...,...,-+o~......,........~ ~~nnn~25~v~~30nnn~35~n~~'°~
,..Albne c.ban Nlllllber
40-----------------36 (1) GardcnSoil
32
J : 1j 20 ~ 16 'o ~ 12
II
' O·~.-F~,....,.....,..'T"',....,.....,..~....,.......l~.......--.-~.....l ~~21nn~25~v~~30nnn~35~n~~'°~
D-Alklll; Cmbm Nmnbor
25,-----------------.n (1J MIZ Pmtiall11e Road [)QSI
20
J 111
-< 15 c 13 j ~ IO 'o >I- I!
5
3
01.-..................-.-...-...................-.-...-.-.~----~ 2021 nn ~25 ~v~ ~ 30n nn~35 ~ n~ ~40~
D-Alkanc Cirbaa Nmnbor
701..-------------------. (a)
63
:ij S6
,;! 49
j 42
1 35
! ~ "il 21
I# 1,
7
01-h,..,..,R__,i.... ...... ;:::;..~-l=::-;:::;:::~ ..... ~A,~
, 1 w u M ~ u ~ n ~ ~ ~ ~ n D-A!bDoic Acid Cmbm Nlllllbct
4(11..-----------------36 (1) GlldmSoil
' o+-r-.-~.,...,-,-T""T.....,.........-f~R-+-r-.-T""T..,...,....,.....-4 , a w u ~ ~ u 20 n ~ ~ ~ ~ n
11-All:maic Acid Cmbm Nlllllbof
so-----------------<•> FiDe Pmticala1e Raad Daat,s
:1l 40
~ 35
130
1 25! 20 ~ 15
1' 10
s o,4-,;::::;........;~...;:::;......~~.:=:.--1-1--:=~~,1,,,4.~~.j::.l
, s w u M ~ u 20 n ~ ~ ~ 30 n •Albnaic Acid Carlxm Nam,,er
Fig. 6.6: Relative mass concentration expressed as % of that compound class present in fine particles: (a) ·n-alkanes from cigarette smoke; (b) n-alkanoic acids from cigarette smoke; ( c) n-alkanes from garden soil (from Morrison and Blick, 1967); (d) n-alkanoic acids from garden soil (from Morrison and Blick, 1967); (e) nalkanes from fine particulate paved road dust; and (f) n-alkanoic acids from fine particulate paved road dust.

246
than in the leaf abrasion samples, and n-alkanoic acids 2'. C22 are less pronounced
in the cigarette smoke.
In urban areas, much of the leaf material produced during an annual growing
cycle is deposited in nearby gardens and along streets. In this manner, leaf
waxes may be added to garden soil and to road dust. Wind- or traffic-induced
turbulence can resuspend garden soil and road dust, thus entraining vegetative
detritus particles into the atmosphere. As a consequence, sources .of this kind
also have to be investigated in the course of determining the contribution of plant
material to the atmosphere.
Morrison and Blick (75) analyzed garden soil for several compound classes
including n-alkanes (C21 - C33) and n-alkanoic acids (C20 - C34). Their results
for both compound classes ate shown in Figures 6.6c,d and compare well with
the green and dead leaf abrasion product samples studied here (Figures 6.3a,b).
Fine particulate road dust, which is a composite of atmospheric fallout, de
posited vehicular emissions, soil, and plant detritus, was collected in a residential
area in Pasadena, California during spring 1989 ( 5, 106). The road dust n-alkanes
distribution shows an odd/even carbon number preference over the range from
C25 to C33 , with C29 as the major homologue. By comparison, the leaf abrasion
particle samples have C31 as the major homologue ( compare Figure 6.6e with
6.3a). Because the n-alkane distribution can differ substantially from one plant·
species to another and between seasons, as discussed previously, a combination of
seasonal changes and locally differing vegetation.al composition might be respon
sible for the observed difference. The n-alkanoic acid distribution pattern for the
higher molecular weight homologues found in the road dust closely resembles the
pattern found for the green leaf samples, suggesting that the road dust collected

247
in springtime is influenced especially by green vegetative detritus and garden soil
material ( compare Figures 6.6d,f with 6.3b ).
From the anthropogenic and biogenic source types discussed, it seems promis
ing that odd carbon number n-alkanes as a group ranging from C27 to C33 can
serve as a molecular tracer assemblage for biogenic-derived n-alkane emissions,
but the material being traced in this way includes both the direct and indirect
( resuspension of soil and road dust) release of green, dead, and degraded plant
wax material and may include some processed plant waxes such as are found in
cooking oil. Cigarette smoking, an anthropogenically controlled source of biogeni
cally derived leaf waxes, cannot be discriminated from the other biogenic source
contributions mentioned without using additional modeling tools or cigarette
smoke specific tracers to apportion the emissions from cigarette smoking to the
atmospheric fine particulate organic compound concentrations.
Comparison of Source and Ambient Samples
The organic composition of atmospheric fine particulate samples collected
from the greater Los Angeles area atmosphere throughout the year 1982 recently
has been quantified ( 10). The sampling technique and analytical protocol used
for processing those ambient samples is closely aligned with the procedures used
to analyze the leaf abrasion particle samples discussed here, and the results from
both studies can be compared directly. Many of the compounds identified in the
fine particulate leaf abrasion products also have been quantified in the ambient
samples. Figures 6.7a and 6.7b show the ambient concentration distributions for
the homologous series of n-alkanes and n-alkanoic acids. The ambient n-alkane
concentrations of the higher odd carbon number n-alkanes (C21 - C33 ) show a
pattern that is both similar to that of the leaf abrasion samples (Figure 6.3a)

20.0 (a)
18.0
16.0
14.0
12.0 ... 1 10.0 C
8.0
6.0
4.0
2.0
0.0
248
WestLA DowntownLA
Pasadena
---, ·--, I
I I I
I Ir··-j
I : I
.--,. __ ·---...I I
19 20 21 22 23 24 25 26 27 28 29 30 31 32 33 34
n-Alkane Carbon Nwnber
150.0 (a) r-
1 I WestLA135.0 I I DowntownLA
120.0 --·I Pasadena
105.0
... 90.0
t C 75.0
60.0
45.0
30.0
15.0 c.. • ... _ -
0.0 6 8 10 12 14 16 18 20 22 24 26 28 30 32
n-Alkanoic Acid Carbon Number
Fig. 6.7: Annual average concentration profiles for fine airborne particulate matter in 1982: (a) n-alkanes and (b) n-alkanoic acids.

249
and to the other direct and indirect vegetation-related sources just discussed
(road dust, garden soil, cigarette smoke) (see Figures 6.6a,c,e). Hentriacontane
(Cai) is the dominant n-alkane in all of the biogenic sources mentioned above,
and C29 shows a lower concentration relative to C31 in all these aerosol sources
( except for road dust). Similar trends are seen for the n-alkanes found in airborne
particulate matter (Figure 6.7a). These observations suggest that the distribu
tions of higher molecular weight n-alkanes (C:27 - C33) found in ambient fine
particulate matter are indeed consistent with releases from plant material being
superimposed on a fossil fuel background. Apa.rt from that, the concentrations
of the C33 n-alkane in airborne particulate matter a.re depleted compared to the
vegetative source samples. As mentioned before, local differences in vegetational
composition surrounding the sampling sites might be reflected in the observed
n-alkane pattern.
Comparing the ambient higher molecular weight n-alkanoic acid(~ C24 ) con
centration distribution (Fig. 6.7b) with that of the vegetation-related sources ( see
Figures 6.6b,d,f and 6.3b ), a similar even/odd carbon nwnber predominance ex
ists. While the road dust, green leaf abrasion detritus, cigarette smoke aerosols,
and garden soil show a maximum for the C28 n-alkanoic acid within the higher
molecular weight range (C24 to C32 ), the ambient n-alkanoic acids in that range
instead peak at C24 • Because C24 is the dominant higher molecular weight n
alkanoic acid observed throughout the year at all three ambient sampling sites
shown in Figure 6.7b it has to be assumed that another yet to be investigating
source of fine particles might emit higher molecular weight n-alkanoic acids with
a preference for the C24 member of this homologous series.
Focusing on vegetation-specific terpenoi~ compounds such as mono-, sesqui-,

250
and triterpenoids, only small amounts of some monoterpenoids (camphor, 4-:
terpineol, o-terpineol) have been found at our remote offshore sampling site (San
Nicolas Island) during the summer and autumn months. At the urban sampling
sites only camphor, the most abundant terpenoid compound identified in this
study, was found and then only in trace amounts during the ~nter season.
Conclusions
Fine particle leaf abrasion products shed from dead and green leaf compos
ites representative of the dominant vegetation found in the greater Los Angeles
~ea have been characterized using GC/MS techniques. Surface leaf wax com
pounds such as n-alkanes, n-alkanoic acids, n-alkanals, n-alkanols, and triter
penoids have been identified and quantified. In addition to waxy leaf surface
constituents, semi-volatile compounds such as mono- and sesquiterpenoids also
have been found.
While the relative n-alkane content (µg g-1 of leaf surface abrasion products)
of fine particulate dead and green leaf abrasion particles is more or less invariant,
the relative n-alkanoic acid content, especially for higher molecular weight homo
logues, is drastically increased in the dead leaf abrasion products. In contrast,
all terpenoid compounds, independent of molecular weight, are depleted in the
dead leaf abrasion products indicating their chemically labile nature relative to
the waxy molecular constituents.
In the present work, it has been shown that the concentration pattern of
the higher molecular weight n-alkanes (C:21 - C33), with its pronounced odd/even
carbon number predominance, is a characteristic tracer for those fine particu
late emission sources which redistribute plant waxes including leaf surface frag- .

251
ments, garden soil, road dust, cigarette smoke, and possibly vegetable cooking
oils. Likewise, the n-alkanes measured in atmospheric samples show a pronounced .
odd/even carbon.number predominance within the same n-alkane range. Then
a.lka.ne series (C:29 - C33 ) can be used to identify the presence of biogenic material
in the atmosphere from the source types just discussed. Both natural sources and
anthropogenic activities ( e.g., smoking, cooking, gardening) together are respon
sible for the observed ambient concentration levels. To apportion leaf surface
~brasion particles in ambient air separately from accompanying road dust, gar
den soil, cooking oil and cigarette smoke contributions, more advanced modeling
tools will be needed.

252
REFERENCES
( 1) Berger, R.; McJunkin, D.; Johnson, R. Radiocarbon concentration of Cali
fornia aerosols. Radiocarbon 1986, 28, 661-667.
( 2) Currie, L.A. Contemporary particulate carbon .In Particulate Carbon: At
mo$pheric Life Cycle; Wolff, G.T., Klimisch, R.L., Eds.; Plenum Press: New . ..
York, 1982, pp 245-260.
( 3) Currie, L.A.; Klouda, G.A.; Continetti, R.E.; Kaplan, I.R.; Wong, W.W.;
Dzubay, T.G.; Stevens, R.K. On the origin of carbonaceous particles in
American cities: Results of radiocarbon dating and chemical characteriza
tion. Radiocarbon 1983, 25, 603-614.
( 4) Rogge, W.F.; Hildemann, L.M.; Mazurek, M.A.; Cass, G.R.; Simoneit, B.R.T..
Sources of fine organic aerosol: 1. Charbroilers and meat cooking operations.
Environ. Sci. Technol. 1991, 2·5, 1112-1125.
( 5) Hildemann, L.M.; Mazurek, M.A.; Cass, G.R.; Simoneit, B.R.T. Quantitative
characterization of urban sources of organic aerosol by high-resolution gas
chromatography. Environ. Sci. Technol., 1991b, 25, 1311-1325.
( 6) Arpino, P.; Van Dorsselear, A.; Sevier, K.D.; Ourisson, G. Cires aeriennes
clans une foret de pins. C.R. Acad. Sc. (Pari3), 1972, 275D, 2837-2840.
( 7) Doskey, P.V.; Andren, A.W. Particulate- and vapor-phase n-alkanes in the
northern Wisconsin atmosphere. Atmo$. Environ. 1986, 9, 1735-1744.
( 8) Gagosian, R.B.; Za:firiou, O.C.; Peltzer, E.T.; Alford, J.B. Lipids in aerosols
from the tropical North Pacific: temporal variability. J. Geophy~. Re3. 1982,
87, 11133-11144.

253
( 9) Mazurek, M.A.; Cass, G.R.; Simoneit, B.R.T. Biological input to visibility
reducing particles in the remote arid southwestern United States. Environ.
Sci. Technol. 1991, 25, 684-694.
(10) Rogge, W.F.; Mazurek, M.A.; Hildemann, L.M.i Cass, G.R.; Simoneit, B.R.T.
Quantification of urban organic aerosols at a molecular level: I. Identification,
abundance, and seasonal variations. Atmos. Environ. 1993, in press.
(11) Sicre, M.-A.; Marty, J.-C.; Saliot, A. ~-Alka.nes, fatty acid esters, and fatty
acid salts in size fractionated aerosols collected over the Mediterranean Sea.
J. Geophys. Res. 1990, 95, 3649-3657.
(12) Simoneit, B.R.T. Organic matter in eolian dusts over the Atlantic Ocean.
Mar. Chem. 1977, 5, 443-464.
(13) Simoneit, B.R.T. Characterization of organic constituents in aerosols in rela
tion to their origin and transport. A review. Int. J. Environ. Anal. Chem.
1986, 23, 207-237.
(14) Simoneit, B.R.T. Organic matter of the troposphere-V. Application of molec
ular marker analysis to biogenic emissions into the troposphere for source
reconciliations. J. Atmos. Chem. 1989, 8, 251-275.
(15) Simoneit, B.R.T.; Cardoso, J.N.; Robinson, N. An assessment of the origin
and composition of higher molecular weight organic matter in aerosols over
Amazonia. Chemosphere 1990, 21, 1285-1301.
(16) Simoneit, B.R.T.; Mazurek, M.A. Organic matter of the troposphere-II. Nat
ural background of biogenic lipid matter in aerosols over the rural Western
United States. Atmos. Environ. 1982, 16, 2139-2159.

254
(17) Standley, L.J.; Simoneit, B.R.T. Characterization of extractable plant wax,
resin, and thermally matured components in smoke particles from prescribed
burns. Environ. Sci. Technol. 1987, 21, 163-169.
(18) Wils, E.R.J.; Hulst, A.G.; Hartog, J.C. The occurrence of plant wax con
stituents in airborne particulate matter in an urban area. Chemo~phere 1982,
11, 1087-1096.
(19) Miller, P.R.; Winer, A.M. Composition and dominance hi Los Angeles basin
urban vegetation. Urban Ecology 1984, 8, 29-54.
(20) Winer, A.M.; Fitz, D.R.; Miller, P.R. Investigation of the Role of Natural
Hydrocarbons in Photochemical Smog Formation in California. Final report
to the California Air Resources Board, Sacramento, CA, under Agreement
no. A0-056-032; Statewide Air ::Pollution Research Center, University of Cal
ifornia, CA, 1983.
(21) Eglinton, G.; Gonzalez, A.G.; Hamilton, R.J.; Raphael, R.A.· Hydrocarbon
constituents of the wax coatings of plant leaves: A taxonomic survey. Phy
tochem~try 1962, 1, 89-102.
(22) Mazurek, M.A.; Simoneit, B.R.T. Characterization of biogenic and petroleum.
derived ·organic matter in aerosols over remote, rural and urban areas. In
Identification and Analy-'i-' of Organic Pollutant-' in Air, ACS Symp., Woburn,
MA: Ann Arbor Science/Butterworth Publishers, 1984: 353-370.
(23) Rieley, G.; Collier, R.J.; Jones, D.M.; Eglinton, G. The biogeochemistry of
Ellesmere Lake, U.K.-1: source correlation of leaf wax inputs to the sedi
mentary. lipid record. Org. Geochem. 1991, 17, 901-912.

255
(24) Riederer, M. and Schneider, G. The effect of the environment on the per
meability and composition of Citrus leaf cuticles. II. Composition of soluble
cuticular lipids and correlation with transport properties. Planta 1990, 180,
154-165.
(25) Simoneit, B.R.T.; Mazurek, M.A. Natural background of biogenic organic
matter in aerosols over rural areas. In Proceedings of the Fifth International
Clean Air CongreJJ; Rispoli, J.A, Rodriguez, R.M., Torti, D.D., Eds.; Assoc.
Argentine contra la Contam. del Aire, Buenos Aires, Vol. I, 1982, 332-340 .
. (26) Mazurek, M.A.; Simoneit, B.R.T.; Cass, G.R.; Gray, H.A. Quantitative
high-resolution gas chromatography and high-resolution gas chromatogra
phy/mass spectrometry analysis of carbonaceous fine aerosol particles. In
tern. J. Environ. Anal. Chem. 1987, 29, 119-139.
(27) Mazurek, M.A.; Cass, G.R.; Simoneit, B.R.T. Interpretation of high-resolution
gas chromatography and high-resolution gas chromatography /mass spectrom
etry data acquired from atmospheric organic aerosol samples. A eroJol Sci.
Technol. 1989, 10, 408-419.
(28} Hildemann, L.M.; Mazurek, M.A.; Cass, G.R.; Simoneit, B.R.T. Quantitative
characterization of urban sources of organic aerosol by high-resolution gas
chromatography. Environ. Sci. Technol., 1991b, 25, 1311-1325.
(29) Rogge, W.F.; Hildemann, L.M.; Mazurek, M.A.; Cass, G.R.; Simoneit, B.R.T.
Sources of fine organic aerosol: 2. Noncatalyst and catalyst-equipped auto
mobiles and heavy-duty diesel trucks. Environ. Sci. Technol. 1993, 27,
636-651.
256
(30) Kolattukudy, P.E. Plant waxes. LipidJ 1970, 5, 259-275.
(31) Kolattukudy, P.E. Biopolyester membranes of plants: cutin and suberin. ·
Science 198o', 208,990-1000.
(32) Riederer, M. Die Kutikula als Barriere zwischen terrestrischen Pflanzen und
der Atmosphare. Naturwi3Jemchaften 1991, 78, 201-208. ·
(33) Douglas, A.G.; Eglinton, G. The distribution of alkanes. In Compamtive
Phytochemi3try, Swain T. Ed., Academic Press, London, 1966, 57-77.
(34) Hall, D.H.; Donaldson, L.A. The ultrastructure of wax deposits on plant leaf
surfaces, 1. Growth of wax on leaves of Trifolium repen3. Nature 1963, 191,
95-96.
(35) Giilz, P.-G.;· Miiller, E.; Moog, B. Epicuticular leaf waxes of tilia tomentoJa
Moench. and Tilia times europaea L.,tiliaceae. Z. NaturforJch. 1988, 43C,
173-176.
(36) Giilz, P.-G.; Muller, E.; Prasad, R.B.N. Organ-specific composition of epicu
ticular waxes of beech leaves and seeds. Z. NaturforJch. 1989, 44C, 731-734.
(37) Jamieson, G.R.; Reid, E.H. The leaf lipids of some conifer species. Phyto
chemiJtry 1972, 11, 269-275.
(38) Schreiber, L.; Schonherr J. Uptake of organic chemicals in conifer needles:
surface adsorption and permeability of cuticles. Environ. Sci. Technol. 1992,
26, 153-159.

257
(39) Tulloch, A.P. Chemistry of waxes of higher plants. In Chemi.stry and Bio
chemiJtry of Natural Waxes, Kolattukudy, P.E. Ed., Elsevier, Amsterdam,
1976, 235-287.
(40) Baxter, L.J.; Cookson, J.T. Natural atmospheric microbial conditions in a
typical suburban area. Appl. Environ. Microbiol. 1982, 45, 919-934.
(41) Kolattukudy, P.E.; Podila, G.K.; Mohan, R. Molecular basis of the early
events in plant-fungus interaction. Genome 1989, 31, 342-349.
(42) Lindemann, J.; Constantinidou, H.A.; Barchet, W.R.; Upper, C.D. Plants a.5
sources of airborne bacteria, including ice nucleation-active bacteria. Appl.
Environ. Microbiol. 1982, 44, 1059-1063.
(43) Lindemann, r; Upper, C.D. Aerial dispersion of epiphytic bacteria over bean
plants. Appl. Environ. Microbiol. 1985, 50, 1229-1232.
· (44) Bovallius, A.; Bucht, B.; Roffey, R.; Anas, P. Three-year investigation of
natural airborne bacterial flora at four locations in Sweden. Appl. Environ.
Microbiol. 1978, 35, 847-852.
(45) Simoneit, B.R.T. Biogenic lipids in eolian particulates collected over the
ocean. In Proceedings Carbonaceous Particles in the Atmosphere, Novakov,
T. Ed., NSF and Lawrence Berkeley Laboratory, LBL-9037, 1979, pp. 233-
244.
(46) Simoneit, B.R.T; Cox, R.E.; Standley, L.J. Organic matter of the troposphere-
IV. Lipids in Harmattan aerosols of Nigeria. Atmos. Environ. 1988, 22,
983-1004.

258
(47) Simoneit, B.R. T.; Crisp, P.T.; Mazurek, M.A.; Standley, L.J. Composition of
extractable organic matter of aerosols from the Blue Mountains and southeast
coast of Australia. Environ. lnternat. 1991, 17, 405-419.
(48) ·van Vaeck, L.; Van Cauwenberghe, K. Cascade impactor measurements of
the size distribution of the major classes of organic pollutants in atmospheric
particulate matter. Atmo-'. Environ. 1978, 12, 2229-2239.
(49) Hallgren, B .; Larsson, S. Long-chain hydrocarbons in the pollen of rye. Acta.
Chem. Scand. 1963,. 17, 1822-639.
(50) Han, J.; Calvin, M. Hydrocarbon distribution of algae, bacteria, and micro
biological activity in sediments. Proc. Natl. Acad. Sci. USA 1969, 64,
436-443.
(51) Jackson, L.L.; Blomquist, G.J. Insect waxes. In Chemi.,try and Biochemistry
of Natural Waxe-', Kolattukudy P.E. Ed., Elsevier, Amsterdam, 1976, 201-
233.
(52) McClain, E.; Kok, C.J.; Monard, L.A.G. Reflective wax blooms on black
Namib desert beetles enhance day activity. Naturwi.,.sen.schaften 1991, 78,
40-42.
(53) Or6, J.; Laseter, J.L.; Weber, D. Alkanes in fungal spores. Science 1966, 154,
399-440.
(54) Weete, J .D. Algal and fungal waxes. In Chemi.,try and Biochemi.,try of Nat
ural Waxe-', Kolattukudy P.E. Ed., Elsevier, Amsterdam, 1976, 349-418.
(55) Kuksis, A. Hydrocarbon composition of some crude and refined edible seed
oils. Biochemi.stry 1964, 3, 1086-1093.
259
(56) Carruthers, W.; Johnstone, R.A.W. Nature 1959, 184, 1131-1132.
(57) Mold, J.D.; Stevens, R.K.; Means, R.E., Ruth, J.M. The paraffin hydrocar
bons of tobacco; normal-, iso-, and anteiso-homologues. Biochemi.3try 1963,
2, 605--610.
(58) Stedman, R.L. The chemical composition of tobacco a11d tobacco smoke.
Chem. Rev. 1968, 68, 153-207.
(59) Severson, R.F.; Arrendale, R.F.; Chortyk, O.T.; Snook, M.E. A method for
determining the transfer of lipids from tobacco to smoke. Tob. Sci. 1978,
22, 130-133.
(60) Spears, A.W.; Lassiter, C.W.; Bell, J.H. Quantitative determination of alka
nes in cigarette smoke. J. Gas Chromatogr. 1963, 1, 34-37.
(61) Baker, E.A. The influence of environment on leaf wax development in Bras•
.sica oleracea var. Gemmifera. New Phytolog~t 1974, 73, 955-966.
(62) Giilz, P.-G.; Muller, ·E.; Prasad, R.B.N. Developmental and seasonal vari
ations in the epicuticular waxes of Tilia tomento.5a leaves. Phytochemistry
1991, 30, 769-773;
(63) Prasad, R.B.N.; Giilz, P.-G. Development and seasonal variations in the epi
cuticular waxes of beech leaves Fagm .5y[vatica L., Z. Naturforsch. 1990a,
45C, 805-812.
(64) Schutt, P.; Schuck, H.J. Jahreszeitliche Schwankungen in der Zusammenset
zung der Cuticularwachse von Pinus sylvestris. Flora, 1973i 162, 206-214.

260
(65) Schuck, H.J. Quantitative Variation der Wachsau:Hage und der cuticularen
Kohlenwasserstoffe bei Pi~ea abie3-Nadeln. Flora, 1976, 165, 303--314.
(66) Gullva.g, B.M.; 0stensen, H. Wax layer in spruce needles - an indicator of
air-borne pollution. J. Ultr6.$tru.cture & Molecular Structure Re.,earch 1986,
3, 280-280.
(67) Sauter, J.J; Kammerbauer, H.; Pambor, L.; and Hock, B. Evidence for the
accelerated micromorphological degradation of epistomatal waxes in Norway
spruce by motor vehicle emissions. Eur. J. For. Path. 1987, 17, 444-448.
· (68) Tulloch, A.P. Chemistry of waxes of higher plants. In Chemi.,try and Bio
chemi3try of Natural Waxe-', Kolattukudy, P.E. Ed., Elsevier, Amsterdam,
1976, 235-287 ..
(69) Turunen, M.; Huttunen, S. A Review of the response of epicuticular wax of
conifer needles to air pollution. J. Environ. Qu.al. 1990, 19, 35-45.
(70) Pasanen, A.L.; Pasanen, P.; Jantunen, M.J.; Kalliokoski, P. Significance of
air humidity and air velocity for fungal spore release into the air. Atmo~.
Environ. 1991, 25A, 459-462.
(71) Albro, P.W. Bacterial Waxes. In Chemi.,try and. biochemi.,try of natural
waxe.,; Kolattukudy, P.E, Ed.; Elsevier, Amsterdam, New York, Chap. 10,
1976, 419-445.
(72) Lechevalier, M.F. Lipids in bacterial taxonomy-a taxonomist's view. CRC
Grit. Rev. Microbiol., 1977, ·5, 109-210.

261
(73) Shiea, J.; Brassell, S.C.; Ward, D.M. Comparative analysis of extractable
lipids in hot spring microbial mats a.nd their component photosynthetic bac
teria. Org. Geochem. 1991, 17, 309-319.
(74) · Meinschein, W.G.; Kenny, G.S. Analyses of a chromatographic fraction of
organic extracts of soils. Anal. Chem. 1957, 29, 1153-1161.
(75) Morrison, R.I.; Blick, W. The wax fraction of soils: separation and determi
nation of some components. J. Sci. Fd. Agric. 1967, 18, 351-355.
(76) Bray, E.E.; Evans, E.D. Distribution of :g-para.ffins as a clue to recognition
of source beds. Geochim. Cosmochim. Acta 1961, 22, 2-15.
(77) Cooper, J.E.; Bray, E.E. (1963) A postulated role of fatty acids in petroleum
formation. Geochim. Cosmochim. Acta 1963, 27, 1113-1127.
(78) Kvenvolden, K.A.; Weiser, D. A mathematical model of a geochemical pro
cess: normal paraffin formation from normal fatty acids. Geochim. Cos
mochim. Acta 1967, 31, 1281-'-1309.
(79) Simoneit, B.R.T. The organic chemistry of marine sediments. In Chemical
Oceanography; Riley, J.P., Chester, R. Eds.; Academic Press, NY, Vol. 7,
Chap. 39, 1978, 233-311.
(80) Ching, T.M.; Ching, K.K. Fatty acids in pollen of some coniferous species.
Science 1962, 138, 890-891.
(81) Kaneda, T. Fatty acids in the Genus Bacillus. Journal of Bacteriology 1967,
Mar., 894-903.

262
(82) Laseter, J.L.; Valle, R. Organics associated with the outer surface of airborne
urediospores. Environ. Sci. Technol. 1971, 5, 631-634.
(83) Shaw N. Lipid composition as a guide to the classification of bacteria. Adv.
Appl. Microbial. 1974, 17, 63-108.
(84) Hitchcock, C.; Nichols, B.W. The lipid and fatty acid composition of specific
tissu_es. In Plant Lipid Biochemistry, Academic Press, London, 1971, 59-80.
(85) Lee, R.E.; Harris, K.; Akland, G. Relationship between viable bacteria and
air pollutants in an urban atmosphere. J. Ar,:i. Ind. Hyg. A.5.5oc., 1973, 34,
164-170.
(86) Owen, M.K.; Ensor, D.S. Airborne particle sizes and sources in indoor air.
Atmo.5. Envimn., 1992, 26A, 2149-2162.
(87) Giilz, P.-G.; Hemmers, H.; Bodden, J.; Marner, F.J. Epicuticular leaf waxes
of Euphorbia dendroide., L., euphorbiaceae. Z. Naturfor.sch. 1987, 42, 191-
196.
(88) Prasad, R.B.N.; Giilz, P.-G. Surface structure and chemical composition of
leaf waxes from QuercU-' robur L., Acer p.5eudoplatamL.5 L. and Ju.glans regia
L. Z. Naturfor.5ch. 1990b, 45C, 813-817.
(89) Kawamura, K.; Gagosian, R.B. Implication of w-oxocarboxylic acids in the
remote marine atmosphere for photo-oxidation of unsaturated fatty acids.
Nature 1987, 325, 330-332.

263
(90) Killops, S;D. Action of ozone on methyl octadec-9-enoate in polar solvents.
Water Res. 1986, 20, 167~171.
(91) Burns, W.F.; Tingey, D.T. GC/MS analysis ofbiogenic volatile hydrocarbons
on a chemically-bonded fused silica column. J. Chromatogr. Sci. 1983, 21,
341-345.
(92) Graedel, T.E. Terpenoids in the atmosphere. Rev. Geophys. Space Phys.
1979, 17, 937-947.
(93) Holdren, M.W.; Westberg, H.H.; Zimmerman, P.R. Analysis of monoterpene
hydrocarbons in rural atmospheres. J. Geophys. Res. 1979, 84, 5083-5088.
(94) Kotzias, D.; Fytianos, K.; Geiss, F. Reaction of monoterpenes with ozone,
sulphur dioxide and nitrogen dioxide - gas-phase oxidation of S0 2 and for
mation of sulphuric acid. Atmos. Environ. 1990, 24A, 2127-2132.
(95) Lamb, B.; Westberg, H.; Allwine, G.; Quarles, T. Biogenic hydrocarbon emis
sions from deciduous and coniferous trees in the United States. J. Geophys.
Res. 1985, 90, 2380-2390.
(96) Rasmussen, R.A. Isoprene: identified as a forest-tpye emission to the atmo
sphere. Environ. Sci. Technol. 1970, 4, 667-671.
(97) Rasmussen, R.A. What do the hydrocarbons from trees contribute to air
pollution? J. Air Pollut. Control Assoc. 1972, 22, 537-543.
(98) Van Genderen, H.H.; Jaarsma, J. Triterpenes and alkanes in developing var
iegated and albino leaves of flex aquifolium L. (Aquifoliaceae). Plant Science
1990, 72, 165-172.
(99) Yokouchi, Y.; Okaniwa, M.; Ambe, Y.; Fuwa, K. Seasonal variation of monoter-

264
penes in the atmosphere of a pine forest. Atmo.,. Environ. 1983, 17, 743-750.
(100) Baker, E.A. Chemistry and morphology of plant epicuticular waxes. In The
Plant Cuticle; Cutler, ·D.F., Alvin, K.L, Price, C.E. Eds.; Academic Press,
London, 1982, 139-165.
(101) Hemmers, H.; Giilz, P.-G. Triterpenoid compounds in epicuticular leaf waxes
of euphorbia characia.! and Euphorbia dendroide., L., euphorbiaceae. Plant
Lipid., 1988, 369, 15-16.
(102) Hosker, R.P.; Lindberg, S.E. Review: atmospheric deposition and plant as
similation of gases and particles. Atmo.,. Environ. 1982, 16, 889-910.
(103) Shanley, J.B. Field measurements of dry deposition to Spruce foliage and
petri dishes in the Black Forest, F.R.G. Atmo.,. Environ., 1989, 23, 403-414.
(104) Wu, Y.-1.; Davidson, C.I.; Dolske, D.A.; Sherwood, S.I. Dry deposition of at
. mospheric contaminants: The relative importance of aerodynamic, boundary
layer, and surface resistance. Aero.,ol Sci., 1992, 16, 65-81.
(105) Gray, H.A.; Cass, G.R.; Huntzicker, J.J.; Heyerdahl, E.K.; Rau, J.A. Charac
teristics of atmospheric organic and elemental carbon particle concentrations
in Los Angeles. Environ. Sci. Technol., 1986, 20, 580-589.
(106) Rogge, W.F.; Hildemann, L.M.; Mazurek, M.A.; Cass, G.R.; Simoneit, B.R.T.
Sources of fine organic aerosol: 3. Road dust, tire debris, and organometallic
brake lining abrasions - roads as sources and sinks. Environ. Sci. Technol.,
1993, in pre.,.,.
(107) Simoneit, B.R.T. Organic matter of the troposphere--III. Characterization
and sources of petroleum and pyrogenic residues in aerosols over the Western
United States. Atmo.,. Environ., 1984, 18, 51-67.
265
(108) Rogge, W.F.; Hildemann, L.M.; Mazurek, M.A.; Cass, G.R.; Simoneit, B.R.T.
Sources of fine organic aerosol: 6. Cigarette smoke in the urban atmosphere.
in preparation, 1993.

266
Chapter 7
Natural Gas Home Appliances
Introduction
To evaluate the origin and fate of airborne fine particulate organic mat
ter, the emissions from common urban sources have to be characterized on a
molecular level, and their source emission strengths determined. Natural gas
is burned in utility and industrial boilers, in industrial process heaters, and by
residential and commercial customers. In the Los Angeles area, residential and
commercial natural gas combustion is the largest of these uses; here natural gas is
commonly used for space and water heating and for cooking purposes (1). Res
idential sources contribute to indoor and outdoor fine particle concentrations.
Several studies have been conducted in the past to evaluate indoor air quality for
· particulate and gaseous matter released from natural gas-fired home appliances
(2-_10). Fine particle emission rates from natural gas-fired home appliances have
been measured for unvented and vented space heaters (6 - 300 ng/kJ), ovens ( <
50 ng/kJ), and stovetop burners (240 - 620 ng/kJ) (4, 6, 8). Except for fine par
ticulate organic matter measured in the indoor air that includes source emissions
from other activities, no chemical characterization of the fine particulate organic
matter emitted from natural gas,-fired home appliances has been reported to date
(11-13).
Reference: Rogge, W.F.; Hildemann, L.M.; _Mazurek, M.A.;· Cass, G.R.;
Simoneit, B.R.T. Environ. Sci. Technol., 1993, ~u.bmitted.
267
In order to evaluate the chemical composition and emission strength of partic
ulate emissions formed during natural gas combustion in residential appliances,
exhaust emissions must be sampled under near ambient conditions. In this study,
a vented natural gas-fired space heater and a water heater that were ducted to
gether were tested to characterize the organic matter formed during combustion
and to determine emission rates for individual organic compounds. The results
of this study can be used to estimate the release of such emissions .
to . the ur-
ban atmosphere, and also may be useful in guiding future studies of indoor air
pollution.
Experimental Methods
Sources Tested
Fine particulate emissions ( dp :$ 2 µm) released from a natural gas-fired water
heater (American Standard, Model G-531-H: 44,000 Btu/hr) and a natural gas
fired space heater (Western Gravity Heat, Model 8Gl00; 100,000 Btu/hr) were
collected from a common exhaust duct using a dilution sampling system.
Dilution Sampling
The dilution source sampling device used in this study also has been used to
test several other anthropogenic sources (14-17). Since it is described in detail
by Hildemann et al. (18), only a short description will be provided here. The di
lution sampling device is designed to collect fine particulate matter (cl,, :$ 2 µm),
including vapor-phase organic compounds that naturally would condense onto
preexisting particulate matter in the atmosphere as the plume downwind of the
source is diluted and cooled to ambient temperatures. During fine particle sam
pling, hot particle-laden exhaust emissions are drawn via a cyclone separator_
268
(10 µm size-cut) into a dilution tunnel. ro dilute and cool the emissions as
would occur in the atmosphere, precleaned and cooled dilution air (activated
carbon-filtered and HEPA-filtered) is mixed with the exhaust emissions in the
dilution tunnel. From the dilution tunnel, a constant fraction of the diluted
exhaust is then diverted into a residence ti.me chamber ( residence time about
2 min) to allow gas phase constituents -which under ambient conditions would
condense onto preexisting particles - to condense onto the available exhaust
particles. From the chamber, suspended particulate matter is continually with
drawn through six AIBL-design cyclone separators. The cyclone separators are
operated in parallel at a flow rate of 27.9 ± 0.3 L/min each with an aerodynamic
cut off diameter of 2.0 µm. Fine particulate matter is collected downstream of
each cyclone separator using three 4 7-mm-diameter filter holders. Of the 18 sep
arate fine particle samples acquired per experiment, 16 are collected on quartz
fiber filters (Pallflex 2500 QAO), and the remaining 2 on Teflon filters (Gelman
Teflo, 2.0-µm pore size). All quartz fiber filters are annealed at 750°C for 2-4h
before use to ensure low contamination levels for organic substances.
Source Testing Procedure
The source sampling experiments were conducted in a vacant single family
home located in Pasadena, northeast of Los Angeles. The exhaust ducts of both
the space and water heater tested were connected to a single square 23 x 23-
cm duct. The exhaust duct from the water heater was an open design so that
ambient air could be entrained into the duct. Exhaust emissions were withdrawn
from five different horizontal positions within the common exhaust duct. The
gas velocity in the duct was measured using a hot wire anemometer, to facilitate
isokinetic sampling and to determine flow rates. Stade gas temperatures ranging
269
on the average from 69 to 78°C were measured. Because only a small amount of . .
particulate matter is generated during natural gas combustion, each of the three
sampling experiments was conducted for 8 to 12-h. To simulate cyclic operation,
the heaters were turned off for 1 to 3-min approximately twice per hour. In
order io monitor gas phase adsorption or desorption of organic compounds on
the filters (front filter set), quartz fiber backup filters were placed behind each
of the 18 front filters for the third experiment.
Although the dilution air of the dilution sampling system was filtered using
both activated carbon and a HEPA filtering system, the filtered dilution air was
tested to ensure that the dilution air was clean and that any contaminants could
be traced. This precaution is especially crucial when conducting experiments
involving sources with low emission rates.
Bulk Chemical Analysis
The bulk chemical characterization of the source emissions included ionic
species, trace metals, organic carbon (OC), and elemental carbon (EC). The
results, which have been reported elsewhere by Hildemann et al. (14), show that
most of the fine aerosol emissions consists of organic matter.
Sample Extraction
The sample extraction procedure followed was developed by Mazurek et al.
(19), and also has been described in several subsequent publications (16, 20-22).
Briefly, the extraction protocol can be described as follows: immediately prior
to sample extraction, a predetermined amount of perdeuterated tetracosane (:n
C24D50) used as an internal standard was spiked onto the filter composites. To
ensure that the amount of u.-C24D50 added was in a concentration range com-

270
parable to the organic compound concentrations in "the sample, the amount to
be added was estimated based on the OC concentrations measured by EC/OC
combustion analysis. The particle samples collected on 39 quartz fiber filters {13
filters from each experiment) were composited and sequentially extracted using
hexane (2 x 80 ml) followed by benzene/2-propanol (2:1 mixture, 3 x 80 ml).
Each of the five extraction steps was assisted by mild ultrasonic agitation for
10 min. The sample extracts were filtered and combined using a specially de
signed transfer and filtering device (19). The combined sample extract volume
then was reduced to 200 - 500 µl using (1) a two step rotary evaporation scheme,
followed by (2) gentle high purity Nrstream evaporation. One aliquot of the
sample extract was exposed to freshly produced diazomethane to convert organic
acids to their methyl ester analogues and other susceptible hydroxy functionali
ties to their methoxy analogues. The sample extracts were stored in the dark at
-21 °C until GC/MS analysis.
Sample Analysis
A Finnigan 4000 quadrupole mass spectrometer coupled with a gas chro
matograph and interfaced with an INCOS data system was used for compound
identification and quantification. Sample extracts were injected onto a conven
tional Grob splitless injector (300°C) which was connected to a 30-m fused-silica
DB-1701 column (J & W Scientific,.Rancho Cordova, CA). Gas chromatography
of the injected sample extract was conducted using the following temperature
program: (1) isothermal hold at 65°C for 10 min, (2) temperature increase at
l0°C/min for 21 min, and (3) isothermal hold at 275°C for another 49 min. The
mass spectromet~c data were acquired while operating the mass spectrometer in . .
the electron impact mode ( electron energy of 70 e V). For a related study of the

271
same samples, a Varian 4600 high-resolution gas chromatograph (HRGC) with
FID-detector was used that was operated with the identical capillary column and
iemperature program as used during GC/MS-analysis (15). Additional informa
tion describing the analytical procedure can be found elsewhere (16, 19-22).
Quality Assurance
A series of quality control and monitoring steps were followecL The ma
jor steps included field and laboratory blank testing, solvent testing to monitor
possible contaminants, recovery experiments for a large set of polar and non
polar standard compounds, and dilution air testing. For a detailed discussion,
the reader is referred to accompanying source and ambient fine organic particle
studies published earlier ( 16, 17, 19-22).
Compound Identification and Quantification
Compound identification was conducted using the National Institute of Stan
dards and Technology (NIST) mass spectral library accessed by the INCOS
Data System, the NIST/EPA/NIH ~ass spectral database (PC Version 4.0) dis- .
tributed by NIST, and by reference to authentic standards injected onto the
GC/MS system used here. Compound identification was conducted accord
ingly: (a) positive - sample mass spectrum and authentic standard mass spec
trum compared well and showed comparable retention times; (b) probable -
same as before, except no authentic standards were available, but the NIST or
NIST/EPA/NIH library mass spectrum and the sample mass spectrum agreed
very well; ( c) possible, same as above except that the sample spectrum contained
information from other compounds but with minor overlap; and ( d) tentative,
when the sample spectrum contained additional information from possibly sev-

272
era! compounds (noise) with overlap.
The compound quantification process was based on the application of :g_
C2-4D50 as internal standard and 1-phenyldodecane as coinjection standard. To
correct for varying detector response to compounds having different structures
and retention times,_ sets of known standard compounds were injected onto the
analytical system to monitor their specific GC retention and MS-response. For
more information, the interested reader is referred to Rogge .et al. (16,-22).
Standard Compounds
Confirmation and quantification of organic compounds was obtained through
the use of more than 150 authentic standards, see Rogge et al. (17). The follow
ing standard mixtures were injected onto the GC/MS-system: (1) normal alkanes
ranging from u-C10 to u-C36i (2) normal alkanoic acids as methyl esters ranging
from :g_-C6 to !!--C30; (3) unsaturated aliphatic acids such as oleic acid and linoleic
acid as methyl esters; ( 4) normal alkanols ranging from :g_-C10 to :g.-C3oj (5) sev
eral phenolic compounds, benzaldehydes and substituted aromatic acids; (6) a
suite of 39 aromatic and polycyclic aromatic hydrocarbons (PAH); (7) 10 poly
cyclic aromatic ketones and quinones; (8) 8 aromatic and polycyclic aromatic N
and S-substituted compounds; (9) steroids including cholesterol and cholestane;
(10) a set of 4 phytosterols; (11) several natural resins; (12) plasticizers; (13) a . suite of 11 aliphatic dicarboxylic acids (C3 - C10) as metyl esters; (14) a suite
of 7 aromatic di- and tricarboxylic acids, all as methyl esters; and (15) other
compounds.

273
Results and Discussion
The results of the natural gas home appliance source tests are shown in Ta
ble 7.1. Three data sets are presented: (1) HEPA-filtered dilution air sa.n:1ple, (2)
the fine particle sample collected on the first series of filters within the samplers,
and (3) a sample collected on the backup filters downstream of the particle filters.
Samples (1) and (3) listed above are of specific importance for the natural gas
source tests. Because the fine particle emissions from natural gas. combustion
are very low, the sampling experiments have to be conducted for 8 to 12-h. For
such low emission rates, the knowledge of the HEPA-filtered dilution air quality
is crucial. The backup filter samples also are of particular interest because the
combustion of natural gas leads to extremely low emissions of solid particulate
matter. Instead sem,i-volatile compounds are emitted that partition between the
gas phase and the particle phase.
Under typical operational conditions, the hot exhaust from the natural gas
combustion is released to the atmosphere and upon atmospheric dilution and
cooling, organic compounds having a low vapor pressure condense onto preex
isting particulate matter, while gaseous organic compounds having somewhat
higher vapor pressures partition between the vapor and particle phase (23-25).
This gas/particle phase partitioning can be disturbed during filter sampling with
the result that a second filter placed behind a prefilter will still collect some
organic material even after aerosol removal on the upstream prefi.lter. This col
lection on the second filter is· either due to adsorption of gaseous semi-volatile
compounds onto the second filter, or due to volatilization of aerosol material
collected on the front filter followed by adsorption onto the backup filter (26-28).
The backup filter results are presented such that the magnitude of these effects

274
can be judged approximately.
Mass Balance for Elutable Fine Organic Matter
A material balance for the elutable organic matter as collected on the front
filters and detected by GC/MS has been constructed and is sh_own in Figure 7.1.
The extractable and elutable organic mass can be divided into chromatograph
ically resolved and unresolved organic mass. The unresolved organic mass (un
resolved complex mixture: UCM) comprises 46.8% of the elutable organic mass.
Of the mass fraction that is chromatographically resolved as single peaks, 67.3%
can be identified, which then accounts for 26.4% of the gravimetrically deter
mined aerosol mass emitted. The overwhelming majority of the elutable organic
mass that can be identified as single compounds consists of polycyclic aromatic
hydrocarbons (PAH) plus oxygenated PAH (oxy-PAH) such as polycyclic aro
matic ketones (PAK) and polycyclic aromatic quinones (PAQ). Smaller amounts
of aza- and thia-arenes, n-alkanes, and n-alkanoic acids also are found, as shown
in Figure 7.1. A quantitative assessment of individual compounds and compound
classes is given in Table 7 .1.
Exhaust Aerosol Composition
Figures 7.2a,b show the total reconstructed ion current (RJC) plots for (a)
front filter particle samples, and (b) backup filter samples. From the RIC-plots
it can be seen that PAH and oxy-PAH dominate the identified organic compound
mass released from the natural gas home appliances. A discussion of each of the
compound classes found in the emissions from the residential space and water
heaters follows, including comparisons of the front vs backup filter measurements.

100%- IAza-& Thla-Arcnei;
Unidentified Organics
80%- Unresolved Organics
60%-
~40%- -.J 0,Identified
OrganicsResolved Organics
20%-
oxy-PAH
PAH
n-Alkanoic Acids
n-Alkanes -
Fig. 7.1: Mass balance for elutable organic matter in the fine particle emissions (front filters only) of natural gas-fired home appliances.
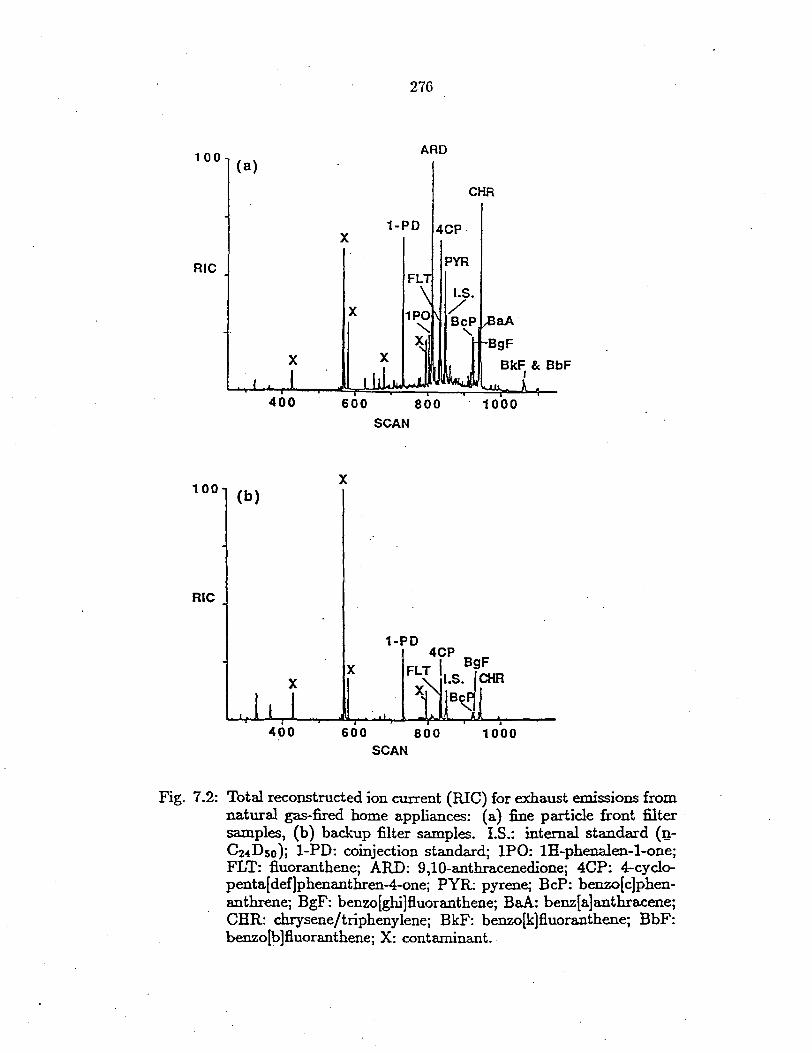
276
ARD100
(a)
CHR
1-PD 4CP-X
PYRRIC
X
X
400 600 800 1000 SCAN
X100 (b)
RIC
X X
400 600 800 1000 SCAN
Fig. 7.2: Total reconstructed ion current (RIC) for exhaust emissions from natural gas-fired home appliances: (a) fine particle front filter samples, (b) backup filter samples. LS.: internal standard (~CuDso); 1-PD: coinjection standard; lPO: lH-phenalen.-1-one; FLT: fiuoranthene; ARD: 9,10-anthracenedione; 4CP: 4-cyclopenta[def]phenanthren-4-one; PYR: pyrene; BcP: benzo[c]phenanthrene; BgF: benzo[ghi]fiuoranthene; BaA: benz[a]anthracene; CHR: chrysene/triphenylene; BkF: benzo[k]fluoranthene; BbF: benzo[b]fluoranthene; X: contaminant.

277
Alkanes
Although natural gas does not contain any higher molecular weight n-alkanes,
compounds of this class have been identified (range C19 to C33) in the exhaust
samples collected from the space and water heater tested here (see Table 7.1).
This indicates that either :n-alkanes exist as contaminants within the natural
gas pipeline system, or are synthesized during the combustion process, or that
they are introduced with unfiltered combustion air, or are entrained .through the
vents in the exhaust duct serving the water heater. Figure 7.3a shows the lJ.
alkane concentrations measured in the dilution a.fr, front particle filter samples,
and on the backup filter samples. From Figure 7 .3a it can be seen that only
small amounts (8.8% compared to the front filter sample) consisting mainly of
lower molecular weight :g-alkanes ( max: C21 ) are introduced into the sampling
system with the activated carbon and HEPA-filtered dilution air. Considering
the length (8 to 12-h) of the source testing experiments necessary, the dilution
air-related artifacts are minor. The backup quartz fiber filters also collected
small amounts of semi-volatile o.-alkanes with C22 as the dominant homologue.
Virtually no :g.-alkanes 2:'.: C2i were found on the backup filters, indicating that
they are predominantly found in the particle phase collected on the front filter.
From the D.-alkan(! concentration profile (2:'.: C21) found on the front filter
set it can be seen that the odd carbon numbered n-alkanes (C21, C2g, and Ca1 )
dominate compared to the even numbered homologues. Because such an odd
carbon number predominance for higher molecular n-alkanes has been found
in urban and remote ambient particle samples (22, 29-31) and is thought to
be contributed from airborne fine particulate vegetative detritus (31-33), it can
be concluded that at least a portion of th~ n-alkanes identified in the exhaust

200 (a)
180
160
140
120
i 100 C.
80
60
40
20
0
278
Fust Ftltc:ts Backup Filtc:ts Dilution Air
.---, II ---.
··---. I I------.
......"'l::."::.':::.J
19 20 21 22 23 24 25 26 27 28 29 30 31 32 33
n-Alkane Carbon Number
600
540
480
420
360
i 300 C.
240
180
120
60
0 8 10 12 i4 16 18 20 22 24 26 28 30
n-Alkanoic Acid Carbon Number
Fig. 7.3: Emission profiles for natural gas-fired home appliances: (a) n-alkanes and (b) n-alkanoic acids.
(b) Frrst Filters Backup Filters
I Dilution Air I I
-· ...... -: I 1
.... t
279
emissions are contributed from organic matter introduced with either the un
filtered combustion air or with the air entrained through the vent above the
water heater. Be~ause the domestic natural gas heaters tested here are operated
with unfiltered combustion and entrainment air, such pollutant recycling pro
cesses have to be included in source testing experiments because they might be
a source for additional newly formed or altered organic compounds emitted to
the urban atmosphere. The extent to which the :g.-alkanes measured in the ex
]:iaust emissions are contributed from unfiltered indoor air influenced by outdoor
pollutant concentrations will be discussed in a later section.
Alkanoic Acids
Normal alkanoic acids ranging from Cs to C1s have been identified in the
emissions of the natural gas home appliances tested with trace amounts of C26 ,
C2s, and C30 :g.-alkanoic acids only found on the front particle filter samples, as
shown in Figure 7.3b. In the dilution air sample, only small amounts (6.5% com
pared to the front filters particle sample) ·of Cs to C1s n-alkanoic acids have been
found, with the lower Cs and C9 :n-alkanoic acids dominating, again indicating
that the HEPA-filtered dilution air is low in contaminants.
In contrast to the n-alkane findings discussed above, semi-volatile :n-alkanoic
acids (Cs - C1s) have been found on the backup filter sets that amount to 79%
of the :g.-alkanoic acid mass measured on the front filters. Using the GC-elution
time for the :g.-alkanes and :g-alkanoic acids as a measure of their volatility ( 34)
(nonadecane elutes close to hexadecanoic acid methyl ester (C16-acid)), it is not
surprising that for the more volatile u.-alkanoic acids ~ C14, appreciable amounts
are found on the backup filte~. From Figure 7.3b it can be seen that nonanoic
acid (C9 ) and to a smaller extent decanoic acid (C10) are more pronounced on the

280
backup filters than on the front filters. While the backup filter findings represent
the third source test only, the results for the fine particle samples collected on
the front filters are the average of three consecutive experiments. Hence, it is
possible that the third experiment released higher C9 and C1o :g-alkanoic acid
concentrations then found on average.
The dominant :g.-alkanoic acids identified in the particle samples are hexade
canoic (C16 ) and octadecanoic (C18) acids. In addition, traces of higher molecular
weight n-alkanoic acids (C26, C28 , C30) have been found on the front filter only.
This predominance of even carbon numbered :g.-alkanoic acids (;?: C16) is again
attributable to sources of recent biogenic origin (31-33), and is typically found in
ambient fine particle samples (22), suggesting that part of the exhaust emissions
are due to uncombusted organic matter introduced into the furnaces or furnace
stack vents from ambient air.
Polycyclic Aromatic Hydrocarbons
During the course of the present study, 18 individual PAH and alkyl-PAR
have been quantified in the exhaust emissions from the natural gas home appli
ances. PAR as a class contribute nearly half of the total elutable organic mass
that could be identified as single compounds, with emission rates for individual
compounds that range from a few up to nearly 2000 pg/kJ of natural gas burned.
Except for trace amounts of lower molecular weight PAR, the HEPA-filtered di
lution air is free of any detectable PAH (see Table 7.1). Total PAR found on the
backup filters equal 21% of the total PAH collected with the particle sample on
the front filters. Figures 7.4a and 4b show the PAH emission rates as determined
for the front particle filters and backup filters for low exhaust concentration P AH
(Figure 7.4a) and high exhaust concentration PAH (Figure 7.4b).

281 150
135
120
105
90
75
60
45
30
15
0
-------
Dilution Air --------
-- 1-----I
(a) mt Filters --Backup Filters -----
1----~----- '- - - - I-----, _-- -I I I ' I I '
PIIT ATR PNT BAN MFP BaF DFP MBA BeP
FLT PYR BgF BcP BaA CHR BIN BkF BbF
2800
2520
2240
1960
1680
i1400 i:i..
1120
840
5(j()
280
0
(b)
----n----- .. ____
First Fil tels
Backup Filters Dilution Air
Fi.g. 7.4: Emission profiles for natural gas-fired home appliances: ( a) low concentration PAH and (b) high concentration PAH. PHT: phenanthrene; ATR: anthracene; PNT: 2-phenylnaphthalene; BAN: benzacenaphthylene; MFP: methyl(fluoranthenes, pyrenes); BaF: benzo[a]fluorene; DFP: dimethyl-(fluoranthenes, pyrenes); MBA: methyl-(benz[a]anthracenes, chrysenes, triphenylenes); BeP: benzo[e]pyrene; FLT: fluoranthene; PYR: pyrene; BcP: benzo[c]phenanthrene; BgF: benzo[ghi]fluoranthene; BaA: benz[a]anthracene; CHR: chrysene/triphenylene; BIN: Binaphthalenes; BkF: benzo[k]fluoranthene; BbF: benzo[b]fluoranthene.

282
The dominant PAR identified were chrysene and/or triphenylene, which are
emitted at a rate of greater than 1900 pg/kJ of fuel burned. These two PAH
show identical mass fragmentation patterns and elution times ( for the chromato
graphic conditions used here); therefore, they are reported together. Chry
sene/triphenylene, fluoranthene, pyrene, and benzo[ghi]fluoranthene show ele
vated particle phase concentrations as well as substantial filter adsorbed gas
phase concentrations on the backup filters. Higher molecular weight_ PAR, such
as binaphthalenes, benzo[k]- and benzo[b]fluoranthene, and benzo[e]pyrene, were
found in smaller amounts and were collected predominantly with the particulate
matter on the front filter.
Polycyclic Aromatic Ketones and Quinones
Oxygenated polycyclic aromatic hydrocarbons ( oxy-PAH) are the second im
portant compound class identified in the exhaust emissions of the natural gas
fired combustion sources tested here (see Figure 7.5a). The total amount of oxy
PAH found on the backup filters accounts for 19% of the overall oxy-PAH mass
measured on the front filters·. Anthraquinone (9,10-anthracenedione), a poly
cyclic aromatic quinone (PAQ), was emitted at a rate of nearly 2000 pg/kJ of fuel
burned, making it the most abundant particle phase compound found on the front
filter. The second most abundant oxy-PAH was 4-cyclopenta[def]phenanthren-4-
one, emitted at a rate of more than 900 pg/kJ of fuel burned. Although both oxy
PAH show similar retention times for the column used (implying similar vapor
pressures) anthraquinone was almost exclusively found on the front filter (front:
1976.8 vs. backup: 39.l pg/kJ), whereas 4-cyclopenta[def]phenanthren-4-one was
relatively enriched on the backup filters (front: 920.2 vs. backup: 501.9 pg/kJ).
In general, not all of the oxy-PAH that show comparable retention times
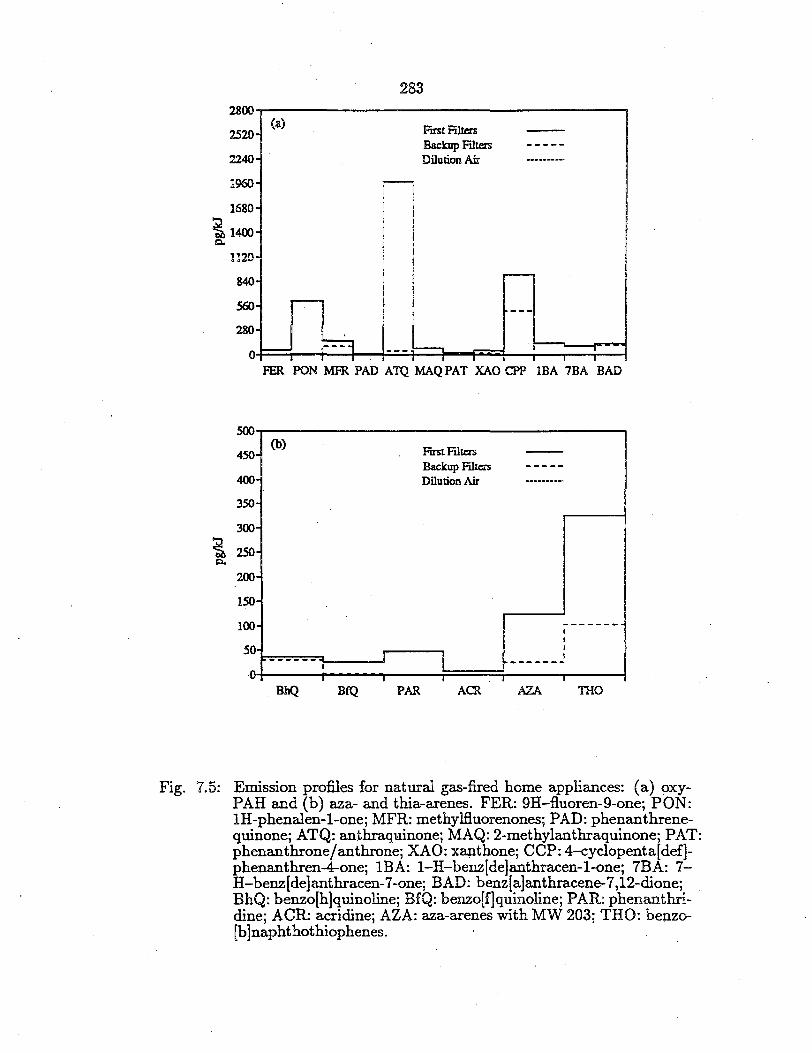
283
uoo----------------------,(a)
First Filters2520
2240 Backup Ftltels Dilution Air
1960
i Q,
1680
1400
1120
840
560
280
o-1===;i---+-.+--.f.:-=:.=..;.-4---F-=..:i---.--..-----,i---l FER PON MFR PAD ATQ MAQPAT XAO CPP lBA 7BA BAD
500
i s::,.
450
400
350
300
---
-
(b) First Filtcrs -Backup Filters -----Dilution Air --------·
250-200-150
100
-
50
0 ------ i
'
-------I I I
I i I
I-------I I I
BhQ BfQ PAR ACR AZA THO
Fig. 7.5: Emission profiles for natural gas-fired home appliances: (a) oxyPAH and (b) aza- and thia-arenes. FER: 9H-fluoren-9-one; PON: lH-phenaJ.en-1-one; MFR: methylfiuorenones; PAD: phenanthrenequinone; ATQ: anthraquinone; MAQ: 2-methylanthraquinone; PAT: phenanthrone/anthrone; XAO: xa.µthone; CCP: 4-cyclopenta[def]phenanthren-4-one; IBA: l-H-benz(de)anthracen-1-one; 7BA: 7-H-benz[de]anthracen-7-one; BAD: benz(a]anthracene-7,12-dione; BhQ: benzo[h]quinoline; BfQ: benzo[f]quinoline; PAR: phenanthridine; ACR: acridine; AZA: aza-arenes with MW 203; THO: benzo[b]naphthothiophenes.

284
(comparable vapor pressures) show similar front/backup filter concentration ra
tios. Oxy-PAH such as lH-phenalen-1-one, anthraquinone, l-H-benz[de]antha
cen-1-one, and 7-H-benz[de]anthracen-7-one show a high front/backup filter con
centration ratio, whereas 4-cyclopenta[def]phenanthren-4-one, benz[a]anthracene-
7,12-dione show relatively high backup filter concentrations. For benz[a]anthra
cene-7,12-dione, the oxy-PAH with the highest molecular weight, a nearly equal
distribution between the front and backup filters was detected.
It has been observed that nitro-PAH can be converted to oxy-PAH due to
photochemical reactions (35). Likewise, PAR conversion to oxy-PAH was ob
served during ozonolysis experiments ( 36). In the present experiments, the fine
particulate matter was collected in the dark (sampler), thereby excluding photo
chemical convers1on reactions involving P AH. Although the combustion air was
unfiltered, 03 should have been depleted either during combustion or by reac
tion with NO in the exhaust as well as diluted in the dilution tunnel (24 x) so
that · ozonolysis reactions involving the organic .matter collected on both filter
sets appear unlikely. Should filter substrate specific reactions occur, then these
reactions should be similar for front and backup filters. At this point it is not
clear what causes the observed differences for compounds with similar molecular
mass when comparing front and backup filter concentrations.
Nitrogen- and Sulfur-Containing Polycyclic Aromatic Hydrocarbons
In addition to PAH and oxy-PAH, nitrogen- ( aza-arenes) and sulfur-containing
( thia-arenes) heterocyclic polyaromatic hydrocarbons have been identified in the
natural gas exhaust emissions (see Figure .7.5b ). Compound classes like these
have been identified before in the urban atmosphere ( e.g., 37-39) and in the ex
haust emissions from several sources (40, 41 ). Aza-arenes as well as thia-arenes

285
have tested positive in Ames bacterial mutagenicity assays and in animal car
cinogenicity tests (42-46).
Aza- and thia-heterocyclic polyaromatic compounds are formed during the
combustion of fossil fuels in a manner similar to PAH formation by incorpo
rating N- and S-atoms into their ring structures. In this study, several aza
arenes and thia-arenes have been identified in the particle samples as well as in
the backup filter samples (see Table 7.1). Benzo[h)quinoline, benzo[f]quinoline,
phenanthridine, and acridine could be assigned to individual peaks in the re
constructed ion-chromatogram. Three chromatographic peaks also are found
that show mass fragmentation patterns very similar to those of indeno[l,2,3-
i,i]isoquinoline, acenaphtho[l,2-b]pyridine, and 4-azapyrene. Be~ause the elution
order for these aza-arenes on the column used is not known to us, the three peaks
are reported together as aza-arenes with a molecular weight of 203 daltons. Like
wise, three thia-arene isomers commonly known as benzo[h]naphthothiophenes
have been identified. Together, aza-arenes and thia-arenes are present . at a mass
concentration roughly 10% as high as that of the PAH or oxy-PAH.

286
Table 7.1 Fine Particle Emission Rates for Organic Compounds released from Natural Gas Home Appliances0
•
Emission Rates in pg/kJoule
:PARTA HEPA-filtered Space & Water Heater Compound
Dilution Air First Backup ID6
Filter Filter
-g-Alkanes-
nonadecane 3.2 n.d. 4.6 a e1cosane 8.4 13.3 12.0 a heneicosane 16.8 50.9 28.6 a docooane 13.1 108.4 39.8 a tricosane 7.1 164.6 28.8 a tetracosane 3.2 112.4 6.2 a pentacosane 1.4 55.2 2.9 a hexacooane 1.2 23.8 1.5 a heptacosane 0.75 32.2 n.d. a octacosane 0.84 12.7 n.d. a nonacosane 0.61 50.2 n.d. a triacontane 0.24 6.6 n.d. a hentriacontane 0.26 16.6 n.d. a dotriacontane n.d. 1.1 n.d a tritriacontane n.d. 0.70 n.d. a
Total class mass concentration: 57.1 648.2 124.4
-g-Alkanoic Acids"-
octanoic acid 16.2 152.0 116.9 a nonanoic acid 32.6 225.2 482.6 a decanoic acid 2.9 li9.5 131.3 a undecanoic acid n.d. 43.2 19.4 a dodecanoic acid (Iauric acid) 6.9 120.7 56.2 a tridecanoic acid n.d. 16.0 4.8 a tetradecanoic acid (myristic acid) 3.7 59.6 29.9 a pentadecanoic acid 0.96 14.3 8.5 a hexadecanoic acid (palmitic acid) 9.7 310.4 56.8 a heptadecanoic acid n.d. 12.5 4.1 a octadecanoic acid (stearic acid) 2.6 81.8 n.d. a nonadecanoic acid n.d. n.d. n.d. a eicosanoic acid n.d. n.d. n.d. a heneicosanoic acid n.d. n.d. n.d. a docosanoic acid n.d. n.d. n.d. a tricosanoic acid n.d. n.d. n.d. a tetracosanoic acid n.d. n.d. n.d. a pentacosanoic acid n.d. n.d. n.d. a hexacosanoic acid n.d. 5.3 n.d. a heptacosanoic acid n.d. n.d. n.d. a

287
Table 7.1 (continued)
Emission Rates in pg/kJoule
PARTB HEPA-filtered
Dilution Air
Space & Water Heater
First Backup Filter Filter
Compound
ID6
octaccsano1c ac1d n.d. 4.0 n.d. a nonacosanoic acid triacontanoic acid
n.d. n.d.
n..d. 1.4
n.d. n.d.
a a
Total class mass concentration: 75.56 1165.3 910.5
-Polycyclic Aromatic Hydrocarbons (PAH)-phenanthrene 0.20 6.3 3.2 a anthracene 0.22 1.9 0.26 a fluoranthene 0.19 685.3 251.7 a pyrene 0.58. 759.3 146.0 a benzacenaphthylene n.d. 1.6 n.d. b 2-phenylnaphthalene n.d. 13.6 6.1 b methyl-{fl.uoranthenes, pyrenes) n.d. 49.3 10.5 b benzo[ a]fl uorene /benzo[b]fluorene n.d. 13.3 1.1 a benzo[ghi]fluoranthene n.d. 397.7 130.7 b benzo[c]phenanthrene n.d. 125.5 48.9 a benz [ a]anthracene n.d. 497.7 6.7 a chrysene/triphenylene n.d. 1922.7 524.8 a methyl-{benz[a]a.nthracenes, n.d. 75.8 5.6 b chrysenes, triphenylenes) dimethyl-(fluoranthenes, pyrenes) n.d. 10.6 n.d. b 1,2'-; 2,1 '-; 2,2'-binaphthalenes n.d. 139.7 9.0 b benzo[k ]fluoranthene n.d. 393.8 6.0 a benzo[b ]fl.uoranthene n.d. 284.4 5.4 a benzo[e]pyrene n.d. 116.0 1.9 a
Total class mass concentration: 1.19 5494.5 1157.86
-Polycyclic Aromatic Ketones (PAK) and Quinones (PAQ)-
9H-fluoren-9-one {fluorenone) n.d. 55.l 49.2 a
lH-phenalen-1-one n.d. 618.4 3.0 a methylfluorenones n.d. 159.5 93.9 b 9,10-pbenanthrenedione n.d. 12.1 4.5 a (phenanthrenequinone) 9, 10-antbracenedione ( anthraquinone) n.d. 1976.8 39.1 a 2-methyl-9,10-anthracenedione n.d. 69.7 0.47 a
(2-methylanthraquinone) phenanthrone/anthrone n.d. 2i.4 1..2 a
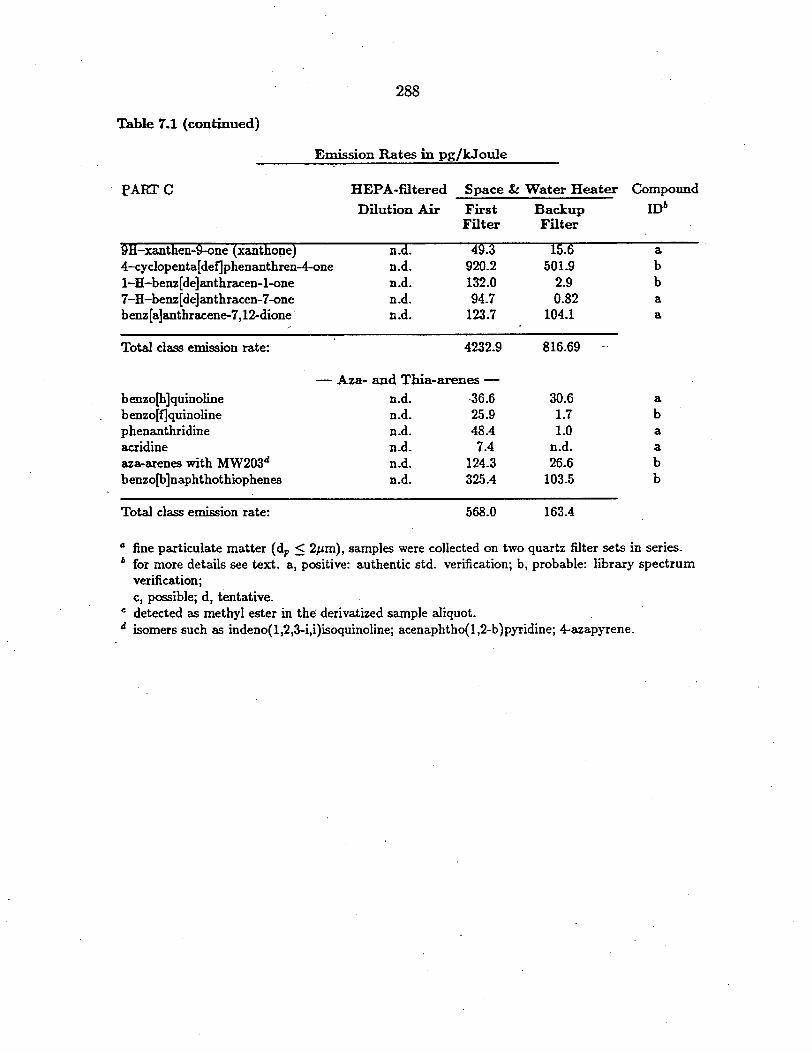
288
Table 7.1 (continued)
Emission Rates in pg/kJoule
PARTC HEPA-filtered Space & Water Heater Compound
Dilution Air First Backup 1D6
Filter Filter
9H-xanthen-9--one (xanthone) n.d. 49.3 15.6 a 4-cyclopenta[def]phenanthren-4-one n.d. 920.2 501.9 b 1-H-benz[ de]anthracen-1-one n.d. 132.0 2.9 b 7-H-benz[de]anthracen-7-one n.d. 94.7 0.82 a benz[a]anthracene-7,12-dione n.d. 123.7 104.1 a
Total class emission rate: 4232.9 816.69
- Aza- and Thia-arenes -benzo[h]quinoline benzo[f]quinoline phenanthridine acridine aza-arenes with MW203d benzo[b ]naphthothiophenes
n.d. n.d. n.d. n.d. n.d. n.d.
-36.6 25.9 48.4 7.4
124.3 325.4
30.6 1.7 1.0
n.d. 26.6
103.5
a b a a b b
Total class emission rate: 568.0 163.4
0 fine particulate matter (dp ::; 2µm), samples were collected on two quartz filter sets in series. 6 for more details see text. a, positive: authentic std. verification; b, probable: library spectrum
verification; c, possible; d, tentative.
e detected as methyl ester in the derivatized sample aliquot. d isomers such as indeno(l,2,3--i,i)isoquinoline; acenaphtho(l,2-b )pyridine; 4-azapyrene.

289
Influence of Combustion Air o:rr Stack Vent Air on Exhaust Emissions
As mentioned earlier, the concentration distribution found for the higher
molecular weight :g-alkanes in the natural gas combustion emissions shows an
odd-to-even carbon number predominance which is not typical of combustion
or fossil fuel derived u-alkanes (17, 22, 31, 47) but is typical of urban atmo
spheric fine particulate matter that contains vegetative detritus (32). These
higher molecular weight n-alkanes probably entered the gas-fired heaters either
with the combustion air or through the air vent above the water heater, and can
be used to evaluate the contributions of ambient aerosol to the natural gas source
test results.
Figure 7.6 shows the annual averaged n-alkane concentration distribution
measured in 1982 at three urban sites within the greater Los Angeles area (22).
Comparing the ambient :n.-alkane concentration distributions (Figure 7.6) with
the natural gas appliances :n.-alkane emission profiles (Figure 7.3a), it can be seen
that even if all the :g_-alkanes? C2; were to have come from ambient air, that most
. of the lower molecular weight :g_-alkanes ::; C26 in the natural gas exhaust must
haye been released from the natural gas-fired appliances themselves. Similar
arguments hold for the :g_-alkanoic acids found in the exhaust emissions based on
the use of higher molecular weight :g_-alkanoic acids ( C26 , C2s, C30 ) as indicators
for the presence of entrained urban air.
Fine particle PAH concentrations have been measured throughout 1982 in
the Los Angeles area (22). Comparing the ambient fine particle PAH concen
tration distribution with the PAH emissions from the natural gas-fired home
appliances tested, it is observed that none of the higher molecular weight PAR
( e.g., benzo[ghi]perylene, coronene) found in relatively large amounts in the

- - -
--------
20 West LA18 -
Downtown LA - - - -16- Pasadena --------14-
I - - -1 12- I IM
~ - - -I I I IE
------
---~ r
I I . bl} 10- I Ii-5·---,C:
I- - - - I I I I I I
- - ... -8-i,,- - - - i-
I --I .:.... .:.,6-I-••----, ........
4- r------· ·------· I I
.. - - -2- l ---0 I I I I I I I I I I I
23 24 25 26 27 28 29 30 31 32 33 34
n-Alkane Carbon Number
t'-' <O 0
Fig. 7.6: Ambient g.-alkane fine particle concentrationsj annual averages for West Los Angeles, downtown Los Angeles, and Pasadena in 1982 (from reference 22).

291
ambient samples are detected in the natur~ gas combustion exhaust emissions.
Thus, it can be concluded that the PAH measured in the exhaust effluents of
natural gas home appliances are almost exclusively due to the natural gas com
bustion in the space heater and water heater tested and are not dominated by
entrained ambient air. Similar arguments hold for oxy-PAH, aza-arenes, and
thia-arenes.
Source Contributions to the Ambient Aerosol
Hildemann et al. (14) estimated that natural gas combustion at residences
and small commercial establishments within an 80 x 80 km urbanized area cen
tered over Los Angeles emits on the average 30 kg of fine particulate organic
carbon (OC) per day, which translates to about 0.1% of the daily total fine par
ticulate organic carbon (OC) mass emitted to that area for the year 1982. At
those area-wide emission rates, such natural gas appliances do not contribute
significant amounts of particle mass to the urban fine particle burden. Perform
ing a similar calculation for PAH and oxy-PAH compound classes only ( the use
of natural gas by residential and high priority commercial customers within that
80 x 80 km geographic area has been estimated to be 760 x 109 kJ in 1982 (1))
it can be estimated that 4.2 kg/day of PAH and 3.2 kg/day of oxy-PAH may
be released from natural gas-fired small combustors (front filter only). Recently,
Rogge et al. (17) determined fine particle-associated vehicular emissions to the
Los Angeles atmosphere for 1982. Compared to the emissions from natural gas
fired home appliances and small commercial natural gas users, catalyst-equipped
autos emit about twice as much PAH (7.4 kg/day) and oxy-PAH (6.2 kg/day).
PAH and oxy-PAH emissions from all types of diesel vehicles (3.4 kg/day and
3.3 kg/day, respectively) are comparable to the emissions from natural gas-fired
292
home appliances and high priority commercial natural gas users. Hence, natural
gas combustion in residential.homes and commercial establishments could con
tribute amounts of PAR and oxy-PAH to the urban atmosphere that are similar
to other urban emission sowceS.
Conclusions
Organic aerosol compounds present in the combined exhaust from a space
heater and a water heater burning natural gas have been measured using a di
lution source sampling system. It has been found that the fine .particulate mass
emission rates are low ( 45.8 ng/kJ ± 17.4; average of three experiments). The
exhaust particles consisted mainly of organic matter. Of the gravimetrically de
termined particle mass, 26% was attributed to single organic compounds. The
overwhelming majority of the identified organic compounds in turn consisted of
PAR, oxy-PAH, aza-arenes, and thia-arenes, which together account for 22.5%
of the fine aerosol mass. Although the contribution to the outdoor aerosol bur- •
den is small, residential and high priority commercial natural gas combustion is
estimated to contribute amounts _of PAR and oxy-PAH to the Los Angeles area
atmosphere in 1982 that are comparable to that emitted from diesel vehicles,
and that are about half as much as released from catalyst-equipped automobiles.
The emissions of mutagenic organics from motor vehicles have been a matter
of intense study in recent years. If regional emissions of P AH and related com
pounds from natural gas combustion are comparable to those from vehicles, then
natural gas combustion aerosol likewise should be examined to determine its
mutagenicity.

293
REFERENCES
( 1) Gray, H.A. Control of atmospheric fine carbon particle concentrations. Ph.D.
Thesis, California Institute of Technology; Pasadena, 1986.
( 2) Bromly, J.H.; Barnes, F.J.; Johnston, R.C.R.; Little, L.H. The effect of vitia
tion on trace pollutants from domestic gas appliances. J. ln3t. Energy 1985,
58, 188-196.
( 3) Cote, W.A.; Wade, W.A., III, Yocum, J. In A study of indoor air qual
ity. EPA 650/4-74-042, U.S. Environmental Protection Agency: Washington,
DC, 1974.
( 4) Girman, J.R.; Apte, G.W.; Traynor, J.R.; Allen, J.R.; Hollowell, C.D. Pol
lutant emission rates from indoor combustion appliances and sidestream
. cigarette smoke. Environ. Int. 1982, 8, 213-221.
( 5) Himmel, R.L.; Dewerth, D.W. In Evaluation of the pollutant emi33ion3 from
gas-fired ranges. Report No. 1492, American Gas Association Laboratories:
Cleveland, OH, 1974.
( 6) Muhlbaier, J.L.; Williams, R.L. In Particulate Carbon: Atmospheric Life
Cycle; Wolff, G.T., Klimisch, R.L., Eds.; Plenum Press: New York, 1982, pp
185~198.
( 7) Palmes, E.D.; Tomczyk, C.; DiMattio, J. Average NO 2 concentration m
dwellings with gas or electric stoves. Atmos. Environ. 1977, 11, 869-872.
( 8) Traynor, G.W.; Anthon, D.W.; Hollowell, C.D. Technique for determining
pollutant emissions from a gas-fired range. Atmo_,_ Environ. 1982, 16, 2979-
. 2987.

294
( 9) Traynor, G.W.; Apte, M.G.; Dillworth, J.F.; Hollowell, C.D.; Sterling, E.M.
The effects of ventilation on residential air pollution due to emissions from a
gas-fired stove. Environ. Int. 1982, 8, 447-452.
(10) Yamanaka, S.; Hirose, H.; Takada, S. Nitrogen oxides emissions for domestic
kerosene-fired and gas-fired appliances. Atmo.s. Environ. 1979, 13, 407-412.
(11) Chuang, J.C.; Gregory, A.M.; Kuhlman, M.R. Polycyclic aromatic hydrocar
bons and their derivatives in indoor and outdoor air in an eight-home study.
Atmo.5. Environ. 1991, 25B, 369-380.
· (12) Risner, C.H.; Conner, J.M. The quantification of 4- to 6-ring polynuclear aro
matic hydrocarbons in indoor air samples by high-performance liquid chro
matography. J. Liquid Chromato. 1991, 13, 437-463.
(13) Sexton, K.; Spengler, J.D.; Treitman, R.D. Personal exposure to respirable
particles: A case study in Waterbury, Vermont. Atmo,5. Environ. 1984, 18,
1385-1398.·
(14) Hildemann, L.M.; Markowski, G.R.; Cass, G.R. Chemical composition of
emissions from urban sources of fine organic aerosol. Environ. Sci. Technol.
1991, 25, 744-759.
(15) Hildemann, L.M.; Mazurek, M.A.; Cass, G.R.; Simoneit, B.R.T. Quantitative
characterization of urban sources of organic aerosol by high-resolution gas
chromatography. Environ. Sci. Technol. 1991, 25, 1311-1325.
(16) Rogge, W.F.; Hildemann, L~M.; Mazurek, M.A.; Cass, G.R.; Simoneit, B.R.T.
Sources of fine organic aerosol: 1. Charbroilers and meat cooking operations.
Environ. Sci. Technol. 1991, 25, 1112-1125.

295
(17) Rogge, W.F.; Hildemann, L.M.; Mazurek, M.A.; Cass, G.R.; Simoneit, B.R.T.
Sources of fine organic aerosol: 2. Noncatalyst and catalyst-equipped auto
mobiles and heavy-duty diesel true.ks. Environ. Sci. Technol. 1993, 27,
636-651.
(18) Hildemann, L.M.; Cass, G.R.; Markowski, G.R. A dilution stack sampler
for collection of organic aerosol emissions: design, characterization and field
tests. Aero.sol Sci. Technol. 1989, 10, 193-204.
(19) Mazurek, M.A.; Simoneit, B.R.T.; Cass, G.R.; Gray, H.A. Quantitative
high-resolution gas chromatography and high-resolution gas chromatogra
phy/mass spectrometry analysis of carbonaceous fine aerosol particles. Int.
J. Environ. Anal. Chem. 1987, 29, 1~9-139.
(20) Mazurek, M.A.; Cass, G.R.; Simoneit, B.R.T. Interpretation of high-resolution
gas chromatography and high-resolution gas chromatography /mass spectrom
etry data acquired from atmospheric organic aerosol samples. Aero.sol Sci.
Technol. 1989, 10, 408-419.
(21) Mazurek, M.A.; Hildemann, L.M.; Cass, G.R.; Simoneit, B.R.T.; Rogge,
W.F. Methods of analysis for complex organic aerosol mixtures from urban
emission sources of particulate carbon. In Proceeding.s A CS Sympo.sium on
M ea.mrements of Airborne Compound.s: 3ampling, analy.sis, and data inter
pretation, August 26-31, 1990, Washington, DC, 1990, Winegar, E., Keith,
L.H.; ACS: Washington, DC, 1992, in press.
(22) Rogge, W.F.; Mazurek, M.A.; Hildemann, L.M.; Cass, G.R.; Simoneit, B.R.T.
Quantification of urban organic aerosols at a molecular level: I. Identification,
abundance, and seasonal variations. Atmos. Environ. 1993, in press.

296
(23) Bidleman, T.F.; Foreman, W.T. Vapor-:particle partitioning <>f semivolatile
. organic compounds. In The Chemi3try of Aquatic Pollutant.,, Hites, R.A.,
Eisenreich, S.J., Eds.; ACS Advances in Chemistry Series, ACS: New York,
-1987, pp 27-56.
(24) Cautreels W. and Van Cauwenberghe K. Experiments on the distribution of
organic pollutants between airborne particulate matter and the correspond
ing gas phase. Atmo.s. Environ. 1978, 12, 1133-1141.
(25) Pankow, J.F. Review and comparative analysis of the theories on partitioning
between the gas and aerosol particulate phases in the atmosphere. Results
and Discussion. Atmo.s. Environ. 1987, 21, 2275-2283.
(26) Fitz, D.R. Reduction of the positive organic artifact on quartz filters. Aero.sol
Sci. Technol. 1990, 12, 142-148.
(27) Ligocki, M.P.; Pankow, F. Measurements of the gas/particle distributions of
atmospheric organic compounds. Environ. Sci. Technol. 1989, 23, 75-83.
{28) McDow, S.R.; Huntzicker, J.J. Vapor adsorption artifact in the sampling of
organic aerosol: Face velocity effects. Atmo.s. Environ. 1990, 10, 2563-2571.
(29) Mazurek, M.A.; Cass G.R.; Simoneit, B.R.T. Biological input to visibility
reducing particles in the remote arid southwestern United States. Environ.
Sci. ·Technol. 1991, 25, 684-694.
(30) Mazurek, M.A.; Simoneit, B.R. T. Characterization ofbiogenic and petroleum
derived organic matter in aerosols over remote, rural and urban areas. In
Identification and Analy.su of Organic Pollutant., in Air, ACS Symp., Ann
Arbor Science/Butterworth Publishers: Woburn, MA, 1984, pp 353-370.
297
(31) Simoneit, B.R.T.; Mazurek, M.A. Organi~ matter of the troposphe~II. Nat
ural background of biogenic lipid matter in aerosols over the :rural Western
United States. Atmo.s. Environ. 1982, 16, 2139-2159.
(32) Rogge, W.F.; Hildemann, L.M.; Mazurek, M.A.; Cass, G.R.; Simoneit, B.R.T.
Sources of fine organic aerosol: 4. Particulate abrasion products from leaf
surfaces of urban plants. Environ. Sci. Technol. 1993, .submitted.
(33) Rogge, W.F.; Hildemann, L.M.; Mazurek, M.A.; Cass, G.R.; Simoneit, B.R.T.
Sources of fine organic aerosol: 3. Road dust, tire debris, and organometallic
brake lining dust - roads as sources and sinks. Environ. Sci. Technol. 1993,
in press.
(34) Hinckley, D.A.; Bidleman, T.F.; Foreman, W.T.; Tuschall, J.R. Determina
tion of vapor pressures for ·nonpolar and semipolar organic compounds from
gas chromatographic retention data. J. Chem. Eng. Data 1990, 35, 232-237.
(35) Jenkins, P.L.; Phillips, T.J.; Mulberg, E.J.; Hui, S.P. Activity patterns of
Californians: Use of and proximity to indoor pollution sources. Atmos. En
viron. 1992, 26A, 2141-2148.
(36) Chapman, 0.L.; Heckert, D.C.; Reasoner, J.W.; Thackaberry, S.P. Photo
chemical studies on 9-nitroanthracene. J. Am. Chem. Soc. 1966, 88, 5550-
5554.
(37) Van Cauwenberghe, K.; Van Vaeck, L.; Pitts, J.N.Jr. Chemical transforma
tions of organic pollutants during aerosol sampling. Adv. Mass Spectrom.,
1979, 8, 1499-1507.
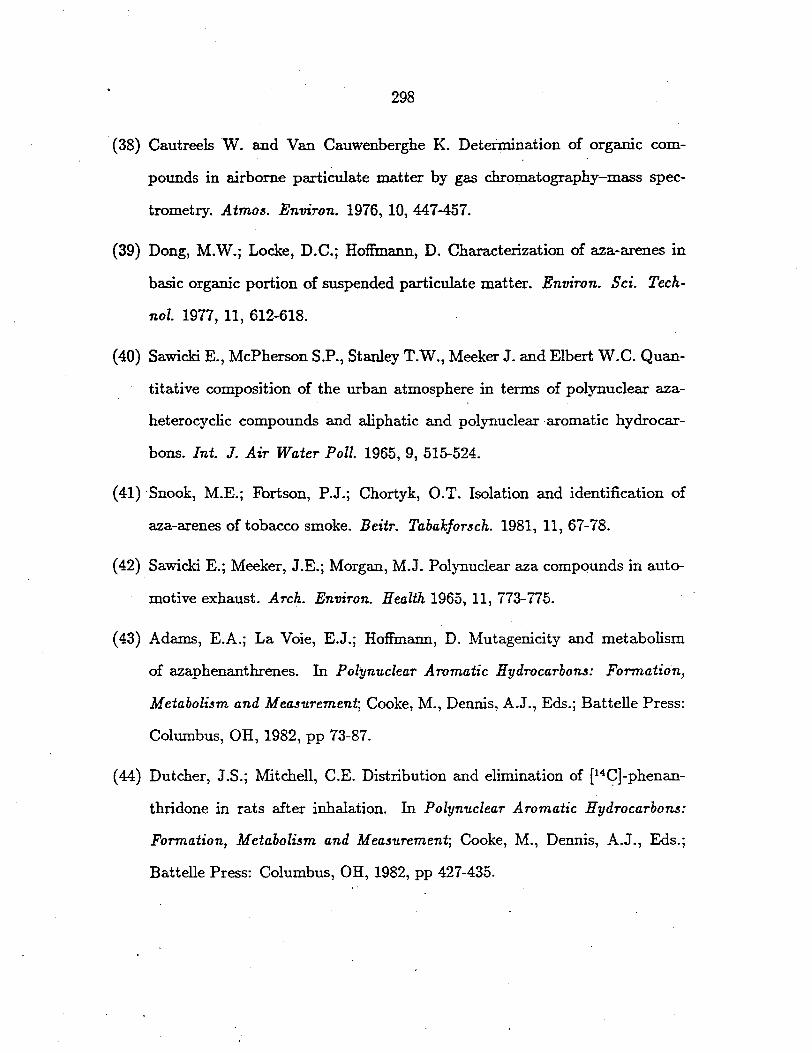
298
· (38) Cautreels W. and Van Cauwenberghe K. Determination of organic com
pounds in airborne particulate matter by gas chromatography-mass spec
trometry. Atmo3. Environ. 1976, 10, 447-457.
(39) Dong, M.W.; Locke, D.C.; Hoffmann, D. Characterization of aza-arenes in
basic organic portion of suspended particulate matter. Environ. Sci. Tech
nol. 1977, 11, 612-618.
(40) Sawicki E., McPherson S.P., Stanley T.W., Meeker J. and Elbert W.C. Quan
titative composition of the urban atmosphere in terms of polynuclear aza
heterocyclic compounds and aliphatic and polynuclear aromatic hydrocar
bons. Int. J. Air Water Poll. 1965, 9, 515-524.
(41) Snook, M.E.; Fortson, P.J.; Chortyk, 0.T. Isolation and identification of
aza-arenes of tobacco smoke. Beitr. Tabakfor3ch. 1981, 11, 67-78.
(42) Sawicki E.; Meeker, J.E.; Morgan, M.J. Polynuclear aza compounds in auto
motive exhaust. Arch. Environ. Health 1965, 11, 773-775.
(43) Adams, E.A.; La Voie, E.J.; Hoffmann, D. Mutagenicity and metabolism
of azaphenanthrenes. In Polynu.clear Aromatic Hydrocarbon3: Formation,
Metaboli3m and Mea3u.rement; Cooke, M., Dennis, A.J., Eds.; Battelle Press:
Columbus, OH, 1982, pp 73-87.
(44) Dutcher, J.S.; Mitchell, C.E. Distribution and elimination of [1 4 9)-phenan
thridone in rats after inhalation. In Polynu.clear Aromatic Hydrocarbo~:
Formation, Metaboli3m and Mea3u.rement; Cooke, M., Dennis, A.J., Eds.;
Battelle Press: Columbus, OH, 1982, pp 427-435.

299
(45) Grimmer, G.; Jacob, J.; Naujack, K.-W.; Dettbarn, G.; Brune, H.; Deutsch
Wenzel, R.i Misfeld, J.; Tiimn, J. Contribution of polycyclic aromatic com
pounds to the carcinogenicity of flue gas from hard-coal-fired residential
furnaces and characterization of arenes (PAH), azaarenes, oxaarenes, and
ihiaarenes. in Polynuclear Aromatic Hydrocarbon.3: Chemistry, Chara.cier
ization and Carcinogene3is; Cooke, M., Dennis, A.J., Eds.; Battelle Press:
Columbus, OH, 1984, pp 359-370.
(46) La Voie, E.J.; Shigematsu, A.; Adams, E.A.; Geddie, N.G.; Rice, J.E. Quino
lines and benzoquinolines: studies related to their metabolism, mutagenicity,
tumor-initiating activity, and carcinogenicity. In Polynuclear Aromatic Hy
drocarbon,.,: A Decade of Progress; Cooke, M., Dennis, A.J., Eds.; Battelle
Press: Columbus, OH, 1985, pp 503-518.
(47) Willey, C; Pelroy, R.A.; Stewart, D.L. Comparative analysis of polycyclic
aromatic sulfur heterocycles isolated from four shale oils. In Polynuclear Aro
matic Hydrocarbons: Physical and Biological Chemistry.; Cooke, M., Dennis,
A.J., Fisher, G.L., Eds.; Battelle Press: Columbus, OH, 1981, pp 907-917.
(48) Simoneit, B.R.T. Organic matter of the troposphere-III. Characterization
and sources of petroleum and pyrogenic residues in aerosols over the Western
United States. Atmos. Environ. 1984, 18, 51-67.

300
Chapter 8
Cigarette Smoke in the Urban Atmosphere
Introduction
Cigarette smoke has been intensively researched in the last three decades.
Studies that focus on the gaseous and particulate smoke constituents have been
numerous, and substantial literature is available on both the chemical compo
sition and possible health risks due to tobacco smoke (e.g., Balcer, 1981; IARC
Monographs, 1986; Johnstone and Plimmer, 1959; Katzenstein, 1992; Repace
and Lowrey, 1990; Stedman, 1968; U.S. Dept. of Health and Human Services,
1989).
Previous investigations have developed nicotine, solanesol, n-alkanes, poly
cyclic aromatic hydrocarbons (PAH) and other organic constituents as marker
compounds for the presence of cigarette smoke in indoor air ( e.g., Benner et al.,
1989; Chuang et al., 1991; Eatough et al., 1989; Girman et al., 1982; Grimmer
et al., 1977; Hammond et al., 1987; Lofroth et al., 1989; Klus and Kuhn, 1982;
Mitra et al., 1992; Ogden and Maiolo, 1989; Ramsey et al., 1990; Tang et al.,
1990). The purpose of the present study is not to add additional knowledge to
the extensive literature available for cigarette smoke composition and indoor air
quality. Instead, in this study, tobacco smoke is viewed as one of the many sources
contributing organic fine particulate matter to the outdoor urban atmosphere.

301
To trace cigarette smoke in outdoor ambient air, cigarette smoke constituents
are examined to evaluate their use as possible tobacco smoke markers in the urban
atmosphere. To be useful, such tracers must be fairly stable in the atmosphere
and must not be confounded by fine aerosol emissions from other anthropogenic
or biogenic sources. Likely tracer compow7.ds that appear to meet these :require-
men.ts first are identified. Then utilizing an emission inventory for fine particulate
organic matter released to the Los Angeles area atmosphere from all major ur
ban sources (for 1982), combined with average cigarette consumption data and
compound emission rates per cigarette smoked, estimates are made of ambient
tobacco smoke marker concentrations. These estimates are then verified by com
parison to actual marker concentration levels measured outdoors at several sites
within that metropolitan area.
Experimental Methods
Cigarettes Tested
Four different cigarette types - including regular (nonfilter), filtertip, light,
and menthol cigarettes - have been tested and the resulting aerosol samples
composited to closely represent the market share in the U.S. in 1981 for each
of these cigarette types. For each cigarette type, one of the five most popular
cigarette brands has been employed for this study including products carrying
the Camel, Merit, Winston, and Benson & Hedges brand names. For more details
see Hildemann et al. (1991a).
Sampling
A specially designed vertically oriented dilution tunnel :was used to collect the
exhaled mainstream and sidestream smoke generated by human smokers (Hilde-

302
mann et al. 1991a). The size of the dilution tunnel and flow rate through the
tunnel ( residence time of circa 30sec) provided sufficient time for cigarette smoke
to cool to ambient temperatures, allowing condensible organic compounds emit
ted in the vapor phase, to condense onto the smoke particles prior to sampling.
Five AIHL-design cyclone separators were mounted at the d~wnstream end of
the dilution tunnel. Two of the cyclone separators was operated at a flow rate of
27.9 ± 0.3 L min- 1 , removing particles with an aerodynamic diameter> 2.0 µm
from the air stream. Fine particulate matter (dp $ 2.0 µm)" next was collected
by filtration downstream of each cyclone separator using three to four parallel
47-mm-diameter filter assemblies per cyclone, for a total of 7 filter samples per
cigarette type. The cigarette smoke particles were collected on quartz fiber fil
ters (Pallflex 2500 QAO) and Teflon filters (Gelman Teflo, 2.0-µm pore size). All
quartz fiber filters were annealed before use (750°C for 2-4h) to guarantee low
contamination levels for organic compounds. Additional details of the experi
mental protocol are elsewhere (Hildemann et al., 1991a).
Bulk Chemical Analysis
Trace elements, ionic species, organic carbon ( OC), and elemental carbon
(EC) emission rates have been previously quantified in the cigarette smoke sam
ples (Hildemann et al., 1991a).
Sample Extraction
Organic compounds present in the cigarette smoke aerosol samples were ex
tracted using the procedure developed for ambient fine particulate matter by
Mazurek et al. (1987) that subsequently has been used in several studies con
cerned with organic aerosol emissions and ambient airquality (Mazurek et al.,


303
1989, 1991; Hildemann et al., 1991b; Rogge et al., 1991, 1993a-d). The extrac
tion protocol can be best described briefly as follows: Before sample extraction,
fine aerosol cigarette smoke samples were composited according to their market
share. Perdeuterated tetracosane {n-C24D5o), which serves as an internal stan
dard, next was spiked onto the filter composites. The composited quartz fiber
filter samples were extracted in a sequential procedure that utilized with hexane
(2 x 30 ml) followed by benzene/2-propanol {2:1 mixture, 3 x 30 ml). Each
extraction step was conducted for 10-min and supported by mild ultrasonic ag
itation. Following each extraction step, the extracts were filtered and combined
using a transfer and filtering device that is described in detail by Mazurek et al.
(1987). A two step rotary evaporation scheme followed by gentle high purity Nr
stream evaporation was employed to reduce the combined sample extract volume
to 200-500 µl. One portion of the sample extract was then processed with freshly
produced diazomethane to convert organic acids to their methyl ester analogues
and other compounds with susceptible hydroxy functionalities to their methoxy
analogues. The sample extracts were stored prior to GC/MS analysis in the dark
at -21°C.
Sample Analysis
A Finnigan 4000 quadrupole mass spectrometer connected to a gas chro
matograph and interfaced with an INCOS data system was used for compound
identification and quantification. Sample extracts were injected onto a conven
tional Grob splitless injector {300°C) which was connected to a 30-m fused-silica
DB-1701 column (J & W Scientific, Rancho Cordova, CA). Gas chromatography
of the injected sample extract was carried out using the following temperature
program: (1) isothermal hold at 65°C fo~ 10 min, {2) temperature increase at

301
To trace cigarette smoke in outdoor ambient air, cigarette smoke constituents
are examined to evaluate their use as possible tobacco smoke markers in the urban
atmosphere. To be useful, such tracers must be fairly stable in the atmosphere
and must not be confounded by fine aerosol emissions from other anthropogenic
or biogenic sources. Likely tracer compounds that appear to meet these require
ments first are identified. Then utilizing an emission inventory for fine particulate
organic matter released to the Los Angeles area atmosphere from all major ur
ban sources (for 1982), combined with average cigarette consumption data and
compound emission rates per cigarette smoked, estimates are made of ambient
tobacco smoke marker concentrations. These estimates are then verified by com
parison to actual marker concentration levels measured outdoors at several sites
within that metropolitan area.
Experimental Methods
Cigarettes Tested
Four different cigarette types - including regular (nonfilter), filtertip, light,
and menthol cigarettes - have been tested and the resulting aerosol samples ·
composited to closely represent the market share in the U.S. in 1981 for each
of these cigarette typ~s. For each cigarette type, one of the five most popular
cigarette brands has been employed for this study including products carrying
the Camel, Merit, Winston, and Benson & Hedges brand names. For more details
see Hildemann et al. (1991a).
Sampling
A specially designed vertically oriented dilution tunnel was used to collect the
exhaled mainstream and sidestream smoke generated by human smokers (Hilde-

302
mann et al. 1991a), The size of the dilution tunnel and flow rate through the
tunnel ( residence time of circa 30sec;) provided sufficient time for cigarette smoke
to cool to ambient temperatures, allowing condensible organic compounds emit
ted in the vapor phase, to condense onto the smoke particles prior to sampling.
Five AIHL-design cy~lone separators were mounted at the downstream end of
the dilution tunnel. Two of the cyclone separators was operated at a flow rate of
27.9 ± 0.3 L min-1, removing particles with an aerodynamic diameter> 2.0 µm
from the air stream. Fine particulate matter (dp ~ 2.0 µm) next was collected
by filtration downstream of each cyclone separator· using three to four parallel
47-mm-diameter filter assemblies per cyclone, for a total of 7 filter samples per
cigarette type. The cigarette smoke particles were collected on quartz fiber fil
ters (Pallflex 2500 QAO) and Teflon filters (Gelman Teflo, 2.0-µm pore size). All
quartz £her filters were annealed before use (750°C for 2-4h) to guarantee low
contamination levels for organic compounds. Additional details of the experi
mental protocol are elsewhere (Hildemann et al., 1991a).
Bulk Chemical Analysis
Trace elements, ionic species, organic carbon ( OC), and elemental carbon
(EC) emission rates have been previously quantified in the cigarette smoke sam
ples (Hildemann et al., 1991a).
Sample Extraction
Organic compounds present in the cigarette smoke aerosol samples were ex
tracted using the procedure developed for ambient fine p_articulate matter by
Mazurek et al. (1987) that subsequently has been used in several studies con
cerned with organic aerosol e~ssions and ambient airquality (Mazurek et al.,-

303
1989, 1991; Hildemann et al., 1991b; Rogge et al., 1991, 1993a-d). The extrac
tion protocol can be best described briefly as follows: Before sample extraction, .
fine aerosol cigarette smoke samples were composited according to their market
share. Perdeutera.ted tetracosane ( n-C24D50), which serves as an internal stan
dard, next was spiked onto the filter composites. The composited quartz fiber
filter samples were extracted in a sequential procedure that utilized with hexane
(2 x 30 ml) followed by benzene/2-propanol (2:1 mixture, 3 x 30 ml). Each
extraction step was conducted for 10-min and supported by mild ultrasonic ag
itation. Following each extraction step, the extracts were filtered and combined
using a transfer and filtering device that is described in detail by Mazurek et al.
(1987). A two step rotary evaporation scheme followed by gentle high purity Nr
stream evaporation was employed to reduce the combined sample extract volume
to 200-500 µI. One portion of the sample extract was then processed with freshly
produced diazomethane to convert organic acids to their methyl ester analogues
and other compounds with susceptible hydroxy functionalities to their methoxy
analogues. The sample extracts were stored prior to GC/MS analysis in the dark
at -21 °C.
Sample Analysis
A Finnigan 4000 quadrupole mass spectrometer connected to a .gas chro
matograph and interfaced with an INCOS data system was used for compound
identification and quantification. Sample extracts were injected onto a conven
tional Grob splitless injector (300°C) which was connected to a 30-m fused-silica
DB-1701 column (J & W Scientific, Rancho Cordova, CA). Gas chromatography
of the injected sample extract was carried out using the following temperature
program: (1) isothermal hold at 65°C for 10 min, (2) temperature increase at
304
l0°C/min for 21 min, and (3) isothermal hold at 275°C for another 49 min. The
mass spectrometric data were acquired while operating the mass spectrometer in
the electron impact mode ( electron energy of 70e V). For supplemental studies a
Varian 4600 high-resolution gas chromatograph (HRGC) with Fill-detector was
used and operated with the same physical column and temperature program as
used during these GC/MS-analyses (Hildemann et al., 1991b ). Additional infor
mation describing the analytical procedure can be found elsewhere (Mazurek et
al., 1987, 1989, 1993; Rogge et al., 1991, 1993a,b ).
Quality Assurance
A series of quality control and monitoring steps were followed. The ma
jor steps include: field and laboratory blank testing; solvent testing to monitor
possible contaminants; recovery experiments in which a large set of polar and
non.polar standard compounds were spiked onto test :filters and then extracted;
and dilution air testing. For · a more detailed discussion, the reader is referred
to accompanying source and ambient fine organic particle studies published else
where (Mazurek et al., 1989, 1993; Rogge et al., 1991, 1993a,b ).
Compound Identification and Quantification
Compound identification was labeled using the National Institute of Stan
dards and Technology (NIST) mass spectral library accessed by the INCOS
Data System, the NIST/EPA/NIH mass spectral database (PC Version 4.0)
distributed by NIST, and by reference to authentic standards injected onto the
GC/MS system used here. Compound identification was labeled accordingly: (a)
positive - sample mas_s spectrum and authentic standard mass spectrum com
pared well and showed identical retention times; (b) probable - sam.e as before,
305
except no authentic standards were available, but the NIST or NIST/EPA/NIB
library mass spectrum and the sample mass spectrum agreed well; ( c) possi
ble, same as above except that the sample spectrum contained information from
other compounds but with minor overlap; ( d) tentative, when the sample spec
t~ contained additional information from possibly several compounds (noise)
with overlap.
The compound quantification process was based on the application of n
C24Dso as internal standard and 1-phenyldodecane as coinjection standard. To
correct for detector response to compounds having different structures and reten
tion times, sets of known standard compounds were injected onto the analytical
system to monitor their specific MS-response. For more information, the inter
ested reader is referred to Rogge et al. (1991, 1993a).
Standard Compounds
Confirmation and quantification of organic compounds was obtained through
the use of more than 150 authentic standards, see Rogge et al. (1993b ). The
following standard mixtures were injected onto the GC/MS-system: (1) normal
alkanes ranging from n-C10 to n-C36 ; (2) normal alkanoic acids as methyl esters
ranging from n-C6 to n-C30 ; (3) unsaturated aliphatic acids such as oleic acid and
linoleic acid as methyl esters; ( 4) normal alkanols ranging from n-C10 to n-C30 ;
(5) several phenolic compounds, benzaldehydes and substituted aromatic acids;
(6) a suite of 39 aromatic and polycyclic aromatic hydrocarbons (PAH); (7) 10
polycyclic aromatic ketones and quinones; (8) a set of 8 aromatic and polycyclic
aromatic N- and S-substituted compounds; (9) steroids including cholesterol
and cholestane; (10) a set of 4 phytosterols; (11) several natural :resins; (12)
plasticizers; (13) a suite of 11 aliphatic dicarboxylic acids (C3 - C10); and (14) a

306
suite of 7 aromatic di- and tricarboxylic acids, all as their methyl ester analogues;
(15) nicotinic acid, nicotine , myosmine, and other compounds characteristic of
cigarette smoke. ·
Results and Discussion
Mass Balance for Elutable Fine Cigarette Smoke Organic Aerosols
A material balance has been constructed for the elutable and_ extractable
portion of the organic matter associated with cigarette smoke particles and is
shown in Figure 8.1. Of the extractable and elutable organic ma:ss, 38.3% could
be resolved chromatographically as single compound peaks. The remainder is
made up of organic compounds eluting closely together forming, an unresolvable
accumulation of compounds known as the unresolved complex mixture (UCM)
and present in the GC/MS-chromatograms as a "hump" (Simoneit, 1989). Us
ing GC/MS-techniques, 71.6% of the resolved organic mass could be identified
and attributed to known single organic compounds. As seen from Figure 8.1,
the major portion (35.6%) is made up of N-heterocyclic compounds, especially
alkaloids such· as pyridines, pyrrolidines, and pyrroles. Nicotine, the most com
mon pyridine alkaloid in cigarette smoke, constitutes close to 69% of the N
heterocyclic compound class (see also Table 8.1). Phytosterols (10.7%), pheno
lic compounds (8.2%), n-alkanols (6.6%), carboxylic acids (19.0%), plus normal
(11.6%), branched (6.1%), and isoprenoid (1.7%) alkanes have been identified
and quantified in the fine aerosol collected from exhaled main- plus sidestream
cigarette smoke.
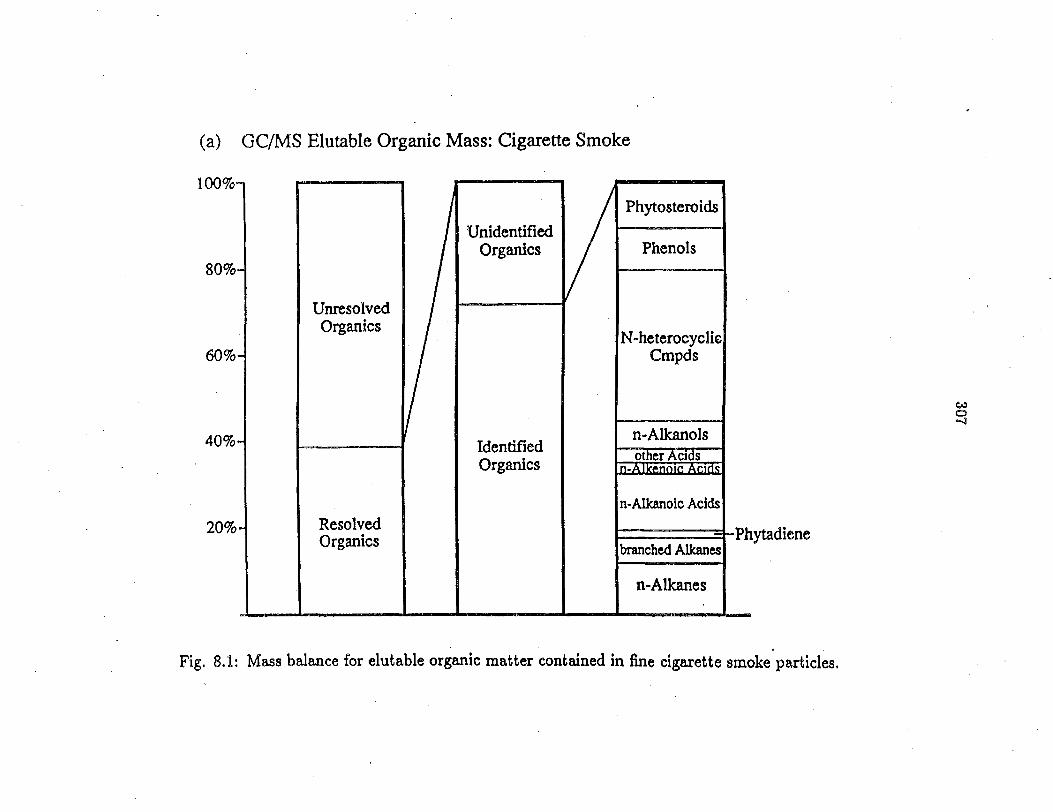
(a) GC/MS Elutable Organic Mass: Cigarette Smoke
I I I /I" Phytosteroids / I
Unidentified
100% I
I
I
Organics I I I Phenols 80%
I I Unresolved Organics IN-heterocyclk
Cmpds60%~ I I / I I
1 n-Alkanols40%~ I I Identified' Organics
I I n-Alkanoic Acids
Resolved20%-4 I I I I I :I-PhytadieneOrganics branched Alkanes
n-Alkanes
I ~ 0 ..._J
Fig. 8.1: Mass balance for elutable organic matter contained in fine cigarette smoke particles.

308
In the following sections, the organic compound emission rates per cigarette
smoked will be discussed first and then compared to previous findings. This ap
proach is crucial to validate our findings before relating cigarette smoke emissions
to the urban atmosphere.
Alkanes and Alkenes
n-Alkanes ranging from C20 to C35 have been identified and quantified (see
Table 8.1). The emission rate profile (µg/cigarette; exhaled mainstream plus
sidestream smoke aerosol) reflects the typical leaf surlace wax n-alkanes distri
bution commonly found in the leaf surlace waxes of vascular plants (Douglas
and Eglinton, 1966; Eglinton et al., 1962; Kolattukudy, 1970; Mazurek and Si
moneit, 1984; Mazurek et al., 1991; Nishimoto, 1974a; Riederer, 1991; Riederer
and Schneider, 1990; Rieley et al., 1991; Rogge et al., 1993a,d; Simoneit and
Mazurek, 1982) with a pronounced odd-to-even carbon number predominance as
shown in Figure 8.2a. The highest emission rates were found for the C21, C29,
Cai, and C33 n-alkanes with C:i1 as the dominant n-alkane, closely resembling
results from prior studies (Mold et al., 1963; Severson et al., 1978; Spears et al.,
1963; Ramsey et al., 1990; Wynder and Hoffmann, 1967); see Table 8.1 for the
companson.
i.5o- (2-methyl-) and anteiJo- (3-methyl-) Alkanes are leaf wax constituents
that are preferentially found in tobacco leaf surlace waxes (Carruthers and John
stone, 1959; Mold et al., 1963; Newell et al., 1978; Stedman, 1968; Severson et al.,
1978; Spears et al., 1963; Wynder and Hoffmann, 1967). They are also found to
a much lesser degree in leaf waxes. typical of urban vegetation, as will be shown
in a later section (Baker, 1982;· Eglinton and Hamilton, 1967; Eglinton et al.,
1962; Kolattukudy, 1970; Rogge et al., 1993d; Simoneit and Mazurek, 1982;

309
;J;--u ' ~ u...., la a ~ .... 0
~
40
36
32
28
24
20
16
12
8
4
(a) Cigarette Smoke (This Study)
Tobacco Leaf Waxes (Mold ct al. (1963))
n25 n26 n27 n28 n29 n30 n31 n32 n33 a28 i29 a30 i31 a32 i33 a34
Alkane Carbon Nwnber
400-r-----------------------. 360 (b) Cigarette Smoke
320
280
II)
240 CQ
~200 :1. 160
120
80
40
O-l=~"""F::::;-h--.--.-......4---l-~~:=:;..4-i:;:::::i-4-~~F""'4---I-~
10 12 14 16 18 20 22 24 26 28 30 32 34
n-Alkanoic Acid Carbon Number·
Fig. 8.2: Concentration distributions for cigarette smoke constituents: (a) n-alkanes in cigarette smoke ( this study) compared to the tobacco leaf wax data of Mold et al. (1963) (in mass % relative to total alkanes in the r~ge from C2~ to CJG), and (b) n-alkanoic acids in cigarette smoke ( this study).

310
Nishimoto, 1974a,b). i.,o-Alkanes found in the cigarette smoke aerosol show a
preference for odd carbon numbered homologues, whereas antei3o-alkanes are
present at the highest concentrations for even numbered homologues, a result
that is closely linked to the route of their biosynthesis in the plant leaves (Ko
lattukudy, 1970; Mold et al., 1963). In Figure 8.2a, the normal and branched
alkane profiles (C25 - C34 ) obtained from cigarette smoke during the present
study are compared to the results published by Mold et al. (1963) for direct
extraction of leaf waxes from unburned tobacco leaves. The n-alkane, i.,o-, and
antei.,o-alkane concentration profiles of both studies agree rather well indicating
that each alkane-type compound is transferred at about the same rate from the
tobacco leaf waxes into the cigarette smoke aerosol. This observation concurs
with prior studies in which the transfer of these and other organic tobacco con
stituents into the cigarette smoke aerosol has been investigated ( Carruthers and
Johnstone, 1959; Mold et al., 1963; Severson et al. 1978; Stedman, 1968).
Acyclic isoprenoid-type alkenes (unsaturated and branched) constitute an
other compound class commonly found in tobacco and tobacco smoke (!ARC,
1986; Matsushima et al., 1979; Sakuma et al., 1984a; Severson et al., 1978; Sted
man, 1968). Several isoprenoid compounds are tobacco-specific and often are also
found in cigarette smoke (!ARC, 1986; Stedman, 1968; Wynder and Hoffmann,
1967).. Here, neophytadiene ( a diunsaturated and branched alkene) has been
identified, and its concentration is comparable to that found in earlier studies,
see Table 8.1 (Sakuma et al., 1984a; Severson et al., 1978).
Carboxylic Acids
n-Alkanoic acids an9- their unsaturated homologues are found in the leaf sur
face waxes of vascular plants, including tobacco leaves (Douglas and Eglinton,

311
1966; Elmenhorst, 1972; Jamieson and Reid, 1972; Kolattukudy, 1970; Mazurek
and Simoneit, 1984; Mazurek et al., 1991; Riederer, 1991; lliederer and Schneider,
1990; Simoneit and Mazurek, 1982; Rieley et al., 1991; Rogge et al., 1993a,d). As
a result of their biosynthesis, n-alkanoic acids show a preference for even carbon
numbered homologues, as shown in Figure 8.2b. In this study aerosol-phase,
n-alkanoic acids have been identified ranging from Cs to C34 • In contrast to leaf
surface waxes of other vascular plants that typically show increased_ concentra
tions of the higher molecular weight n-alkanoic acids > C201 cigarette smoke is
exclusively enriched in lower molecular weight C1-11, C16 , and C18 n-alkanoic acids
(Johnstone and Plimmer, 1959; Rogge et al., 1993d; Simoneit and Mazurek,
1982; Kolattukudy, 1970; Mold et al., 1966; Van Duuren and Kosak, 1958). Of
the three unsaturated fatty acids identified, linolenic acid (C18:3 ) is most abun
dant, which agrees with prior published data (Carruthers and Johnstone, 1959;
Hoffmann and Woziwodzki, 1968).
Dicarboxylic acids also have been identified in our cigarette smoke samples,
of which succinic acid is most abundant. Likewise, cyclic acids such as furan
carboxylic acids, phenylacetic acid, and nicotinic acid have been quantified. For
comparison to the results of other researchers, see Table 8.1.
Alkanols
Several acyclic alcohols have been identified in the exhaled mainstream plus
sidestream tobacco smoke particles investigated here, and the results are included
in Table 8.1. n-Alkanols are often the major compound class identified in leaf ..
waxes and commonly show a preference for even carbon number homologues
(Giilz et al., 1989; Kolattukudy, 1970; Mazurek and Simoneit, 1984; Riederer
an'.d Schneider, 1990; Rogge et al., 1993d; ,Simoneit, 1989; Simoneit et al., 1990).
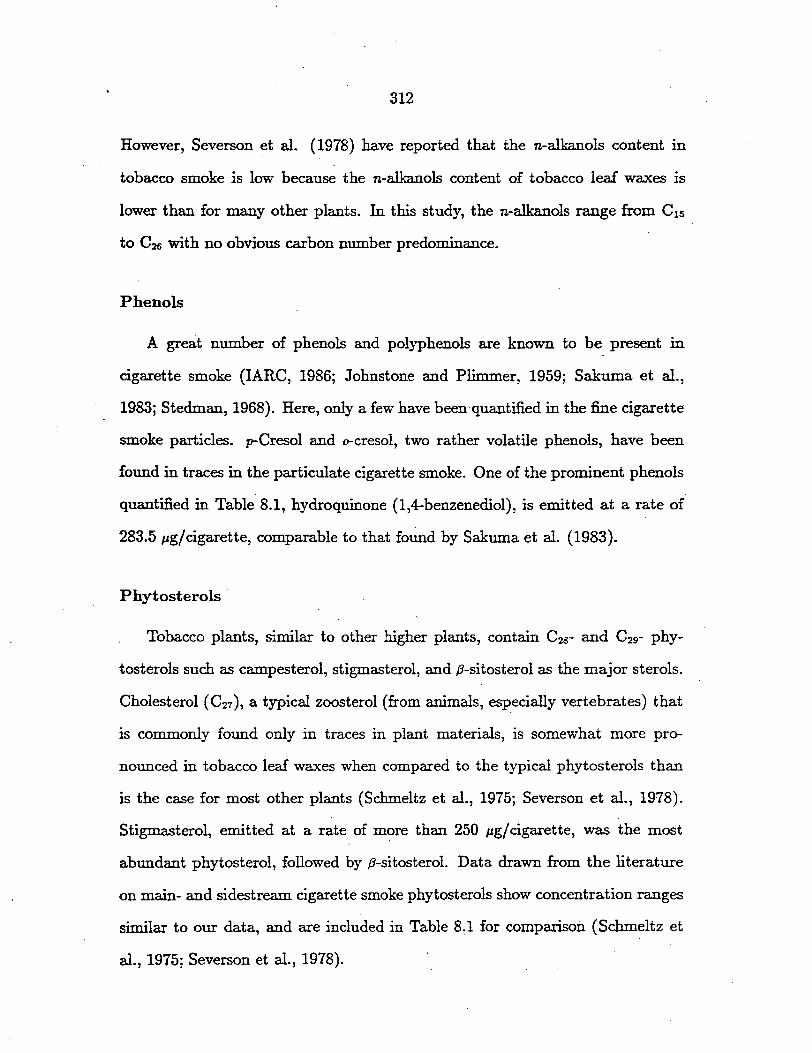
312
However, Severson et al. (1978) have reported that the n-alkanols content in
tobacco smoke is low because the n-alkanols content of tobacco leaf waxes is
lower than for many other plants. In this study, the n-alkanols range from C1s
to C26 with no obvious carbon number predominance.
Phenols
A great number of phenols and polyphenols are known to be present in
cigarette smoke (!ARC, 1986; Johnstone and Plimmer, 1959; Sakuma et al.,
1983; Stedman, 1968). Here, only a few have been-quantified in the fine cigarette
smoke particles. p-Cresol and o-cresol, two rather volatile phenols, have been
found in traces in the particulate cigarette smoke. One of the prominent phenols
quantified in Table 8.1, hydroquinone (1,4-benzenediol), is emitted at a rate of
283.5 µg/cigarette, comparable to that found by Sakuma et al. (1983).
Phytosterols ·
Tobacco plants, similar to other higher plants, contain C28- and C29- phy
tosterols such as campesterol, stigmasterol, and ,8-sitosterol as the major sterols.
Cholesterol (C21 ), a typical zoosterol (from animals, especially vertebrates) that
is commonly found only in traces in plant materials, is somewhat more pro
nounced in tobacco leaf waxes when compared to the typical phytosterols than
is the case for most other plants (Schmeltz et al., 1975; Severson et al., 1978).
Stigmasterol, emitted at a rate of m?re than 250 µg/ cigarette, was the most
abundant phytosterol, followed by ,8-sitosterol. Data drawn from the literature
on main- and sidestream cigarette smoke phytosterols show concentration ranges
similar to our data, and are included in Table K1 for comparison ( Schmeltz et
al., 1975; Severson et al., 1978).

313
N-containing Compounds
When burning a cigarette, about 60% of the nicotine in tobacco undergoes
degradation and conversion (Schmeltz et al., 1979). Portions of the tobacco
alkaloids are converted to pyridines, indoles, quinolines, arylnitriles, aromatic
hydrocarbons, and other compounds (Schmeltz and Hoffmann, 1977; Baker ,
1981; Johnstone and Plimmer, 1959; Stedman, 1968). Due to its volatility, nie<r
tine is mainly found in the gas-phase and then primarily in sidestream smoke
(Browne et al., 1980; Eatough et al., 1989; Matsushima et al., 1979; Nelson
et al., 1992; Sakuma et al., 1984a,b ). Nonetheless, the most abundant single
compound identified in the fine particle-associated cigarette smoke emissions is
nicotine, which was emitted at a rate of 1159 µg/cigarette. Comparable nicotine
concentrations in the particle phase also have been measured by Browne et al.
(1980) (see also Table 8.1). Besides nicotine, several other alkaloids commonly
found in cigarette smoke (Schmeltz and Hoffmann, 1977; Baker, 1981; Johnstone
and Plimmer, 1959; Stedman, 1968) have been identified and are summarized in
· Table 8.1. While most of these N-containing compounds are partitioned between
the gas and the particle phase, the N'-acylalkaloids have a high enough molecular
weight to be found exclusively in the aerosol phase (Snook et al., 1984) and thus
might serve as a potential tracer for particle-phase cigarette smoke. One of the
more abundant members of this compound class, N'-i.,o-octanoylnornicotine, was
identified in our cigarette smoke samples, but in fairly low concentrations (see
Table 8.1).
Polycyclic Aromatic Hydrocarbons
While most of the compounds discussed so far are released mainly b~ distil
lation the tobacco during combustion (with some accompanying partial degra-
314
dation), the polycyclic aromatic hydrocarbons (PAH) are typical pyrolysis prod
ucts formed during combustion in zones of relatively low oxygen content (Baker,
1981; Grimmer et· al., 1987; Schmeltz et al., 1979; Lee et al., 1976; Severson et
al., 1977). In Table 8.1, the PAR identified in, this study are listed and compared
to results from a study by Grimmer et al. (1987) in which PAR emission I'.3.tes
were reported for the particle and gas phase in main- as well as in sidestream
cigarette smoke separately. From their experimental data (see also Table 8.1) . -.
Grimmer and coworkers concluded that most of the PAR are formed between
puffs and consequently are found primarily in the sidestream smoke aerosol. To
tal particle-phase PAH concentrations of 13.5µg/ cigarette were measured in this
study, which compares well with the measurements of Grimmer et al. (1987).
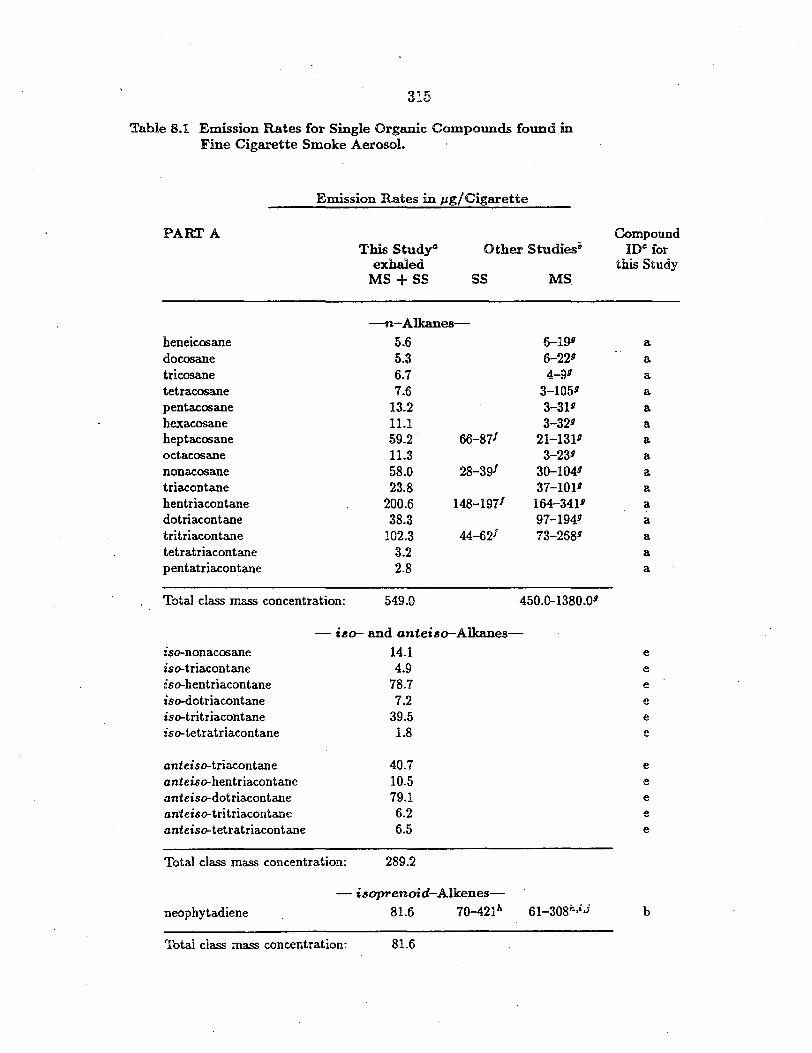
315
Table 8.1 Emission Rates for Single Organic Compounds found in Fine Cigarette Smoke Aerosol.
Emission Rates in µg/Cigarette
PART A Compound This Study0 Other Studies0 IDc: for
exhaled this Study MS+ SS ss MS.
heneicosane docosane tricosane tetracosane pentacosane hexacosane heptacosane octacosane nonacosane triacontane hentriacontane dotriacontane tritriacontane tetratriacontane pentatriacontane
--n-Alkanes-
5.6 5.3 6.7 7.6
13.2 11.1 59.2 66-87/ 11.3 58.0 28-3g/ 23.8
200.6 148-1971 38.3
102.3 44-621 3.2 2.8
6-lgg a 6-22g a 4-9g a
3-1059 a 3-319 a 3-32g a
21-131g a 3-23g a
30-1049 a 37-1011 a
164-3411 a 97-194g a 73-268g a
a a
Total class mass concentration: 549.0 450.0-1380.0g
- iiw- and antei.so-Alkanes-iso-nonacosane 14.1 e iso-triacontane 4.9 e
iso-hentriacontane 78.7 e
iso-dotriacontane 7.2 e
iso-tritriacontane 39.5 e
iso-tetratriacontane 1.8 e
anteiso-triacontane 40.7 e
anteiso-hentriacontane 10.5 e anteiso-dotriacontane 79.1 e
anteiso-tritriacontane 6.2 e
anteiso-tetratriacontane 6.5 e
Total class mass concentration: 289.2
- i.saprenoid-Alkenes-neophytadiene 81.6 7Q-421h 61-3081>,ij b
Total class mass concentration: 81.6
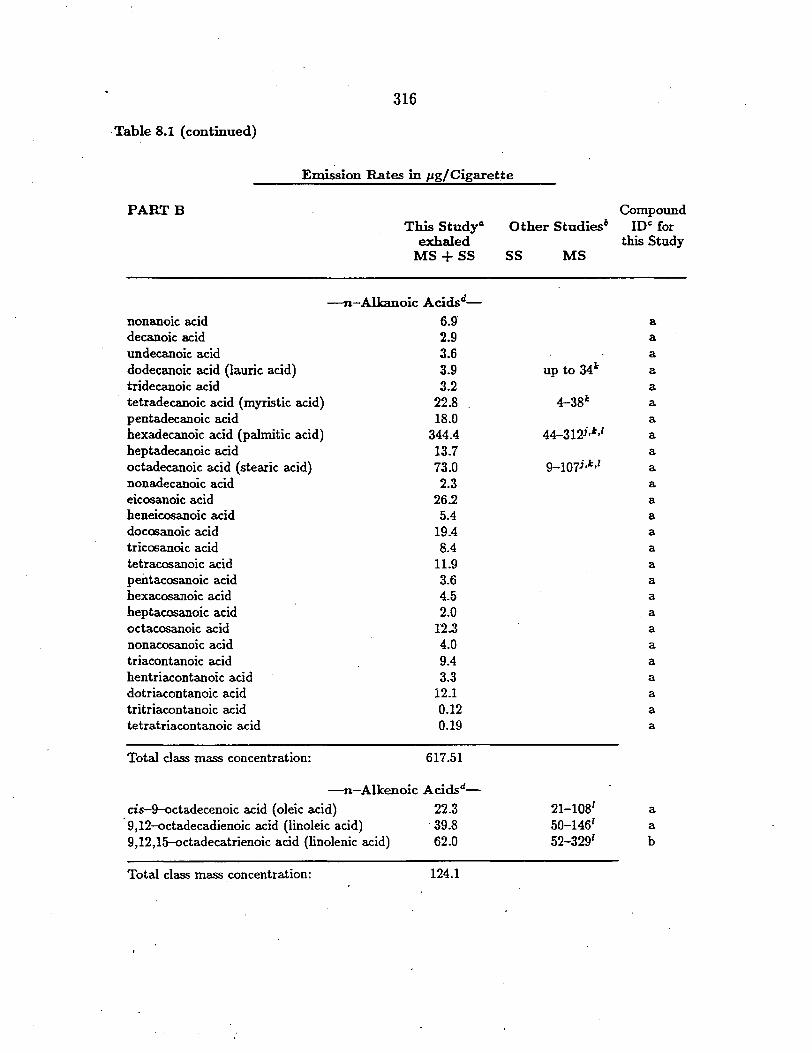
316
Table 8.1 (continued)
Emission Rates in µg/ Cigarette
PARTB Compound This Study" Other Studies6 IDc for
exhaled this StudyMs+ss ss MS
-n-Alkanoic Acids0-
nonanoic acid 6.9· a decanoic acid 2.9 a undecanoic acid 3.6 a dodecanoic acid (!auric acid) 3.9 up to 34t a tridecanoic acid 3.2 a tetradecanoic acid (myristic acid) 22.8 4....:381: a pentadecanoic acid 18.0 a hexadecanoic acid (palmitic acid) 344.4 44-312j,k,l a heptadecanoic acid 13.7 a octadecanoic acid (stearic acid) 73.0 9-107j,k,l a nonadecanoic acid 2.3 a eicosanoic acid 26.2 a heneicosanoic acid 5.4 a docasanoic acid 19.4 a tricasanoic acid 8.4 a tetracosanoic acid 11.9 a pentacosanoic acid 3.6 a hexacosanoic acid 4.5 a heptacosanoic acid 2.0 .a octacosanoic acid 12.3 a nonacosanoic acid 4.0 a
triacontanoic acid 9.4 a hentriacontanoic acid 3.3 a dotriacontanoic acid 12.1 a tritriacontanoic acid 0.12 a tetratriacontanoic acid 0.19 a
Total class mass concentration: 617.51
-n-Alkenoic Acidsd-
cis-9-octadecenoic acid (oleic acid) 22.3 9,12-octadecadienoic acid (linoleic acid) ·39.8 9,12,15-octadecatrienoic acid (linolenic acid) 62.0
21-1081
50-1461
52-3291
a a b
Total class mass concentration: 124.1

317
Table 8.1 (continued)
Emission Rates in µg/Cigarette
PAR.TC Compound This Study0 Other Studies6 1oe for
exhaled this Study MS+ SS SS MS
- Dicarboxylic Acidsd -
butanedioic acid (succinic acid) 30.7 65-70m u2-153m a
methylbutanedioic acid 3.6 1-13m 4-2om a
(methylsuccinic acid) pentanedioic acid (glutaric acid) 3.7 10-ssm a
1,2-benzenedioic acid 0.35 a
Total class mass concentration: 38.35
- Other Aliphatic and Cyclic Acidsd -4-oxopentanoic acid 11.1 furancarboxylic add (furoic acid) 15.5 25-60m 2-methyl-2-furancarboxylic acid 1.0 benzeneacetic acid (phenylacetic acid) 46.5 nicotinic acid 42.6
44-1071:,m b b
a
b b
Total class mass concentration: 116.6
- n-Alkanols-pentadecanol 21.4 b hexadecanol 24.8 b heptadecanol 38.8 a octadecanol 28.3 a nonadecanol 23.7 a eicosanol 21.6 1.7-3.7; a. heneicosanol 26.8 b docosanol 23.8 5.6-12 . .V a tricosanol 12.7 b tetracosanol 36.7 0.6-1.oi a pentacosanol 39.4 a
hexacosanol 12.7 a
Total class mass concentration: 310.7
-Phenolse -
1-ethenyl-4-hydroxybenzene 1,2-benzenediol ( catechol) 1,4-benzenediol (hydroquinone)
16.3 12.7
283.5 138-292m 91-285m
148-362m 114-300m
b a b
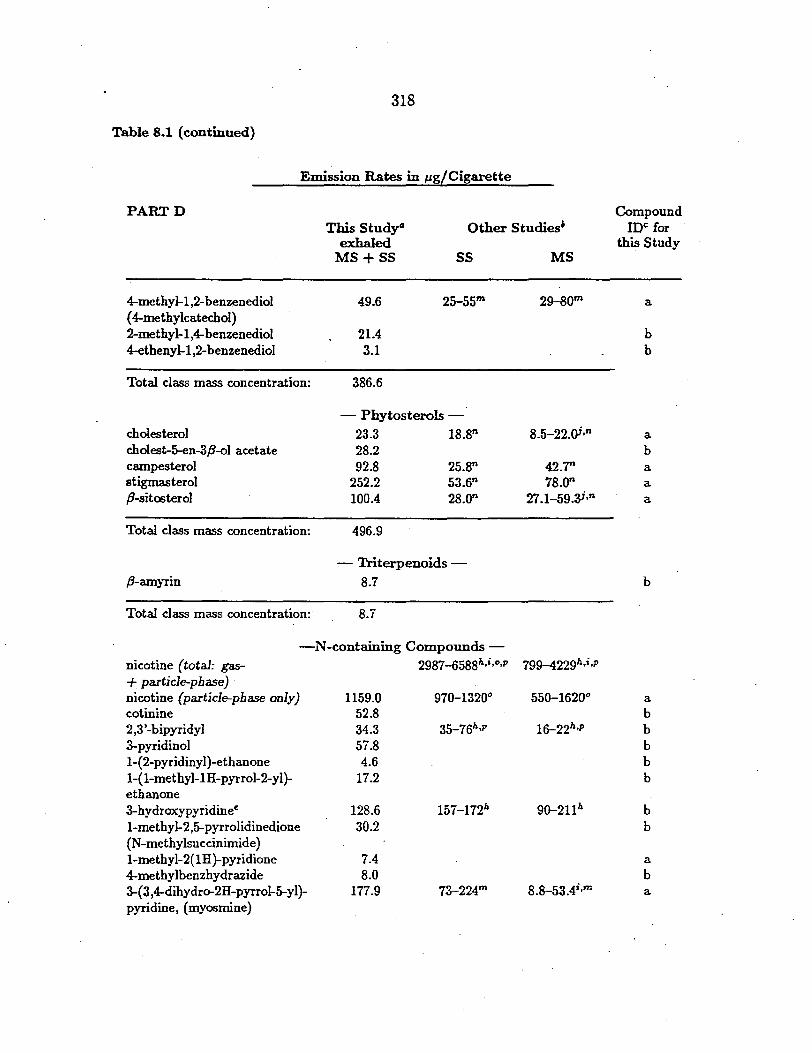
318
Table 8.1 (continued}
Emission Rates in µg/Cigarette
PARTD Compound This Study4 Other Studies6 !De for
exhaled this StudyMs+ss ss MS
4-methyl-1,2-benzenediol 49.6 25-55m 29-aom a ( 4-methylcatechol} 2-methyl-1,4-benzenediol 21.4 b 4-ethenyl-1,2-benzenediol 3.1 b
Total class mass concentration: 386.6
- Phytosterols -cholesterol 23.3 18.8" 8.5-22.CV·" a cholest-5-en-3,B-ol acetate 28.2 b campesterol 92.8 25.8" 42.7" a stigmasterol 252.2 53.6" 78.0" a .8-sit06terol 100.4 28.0" 27.1-59.:¼i•n a
Total class mass concentration: 496.9
- 'Iriterpenoids -.8-amyrin 8.7 b
Total class mass concentration: 8.7
-N-containing Compounds -nicotine (total: gas- 2987-658Sh,i,o,p 799-4229h,i,p + particle-phase) nicotine (particle-phase only) 1159.0 970-1320° 550-1620° a cotinine 52.8 b 2,3'-bipyridyl 34.3 35-76h,p 16-22h,p b 3-pyridinol 57.8 b 1-(2-pyridinyl)-ethanone 4.6 b 1-(1-methyl-lH-pyrrol-2-yl)- 17.2 b ethanone 3-hydroxypyridinee 128.6 157-172h 90-21lh b 1-methyl-2,5-pyrrolidinedione 30.2 b (N-methylsuccinimide) 1-methyl-2(1H)-pyridione 7.4 a 4-methylbenzhydrazide 8.0 b 3-(3,4-dihydrer2H-pyrrol-5-yl)- 177.9 73-224m 8.8-53.4i,m a pyridine, (myoomine)

319
Table 8.1 (continued)
Emission Rates in µg/ Cigarette
PARTE Compound This Study0 Other Studiesh IDc_ for
exhaled this Study MS+ SS SS MS
1-methyl-9H-pyrido[3,4-b]indole 4.9 1.9-3.59 1.1-3.1 11 b (barman) N'-is<H>ctanoylnornicotine 8.5 b
Total class mass concentration: 1691.2
-Polycyclic Aromatic Hydrocarbons (PAH)-
phenanthrene anthracene methyl-{phenanthrenes, anthracenes) fluoranthene pyrene benzacenaphthylene 2-phenylnaphthalene methyl-{fluoranthenes, pyrenes) benzo[a]ftuorene/benzo[b]ftuorene benz[a)anthracene chrysene/triphenylene methyl-(benz[a)anthracenes,
chrysenes, triphenylenes) dimethyl-(fluoranthenes, pyrenes)
2.6 .2.1r 0.76 0.67r
. 3.5 0.95 0.61r 1.0 o.47r 0.30 0.37 1.3 0.54 0.27 0.67 0.69
o.015r a o.024r a 0.16" b
0.06lr a 0.043r a
b b
O.lP b o.021r a o.o13r a
a
b
0.55 r: particle phase only b
Total class mass concentration: 13.5
-Others-6,7-dihydroxy-2H-1-benzopyran-2-one 7.3 Vitamin E 0.88
b b
Total class mass concentration: 8.18
0 This study: exhaled MS+ SS (exhaled mainstream and sidestream fine particulate matter). 6 Other studies: if not otherwise indicated the measurements include particle plus gas phase
components together (condensate); data for references j,!:,n are reported in µg per 1 g of tobacco smoked (depending on the cigarette type the tobacco content ranges on average from 0.6 to 1.lg per cigarette).
c for more details see text. a, positive: authentic std. verification; b, probable: library spectrum verification; c, possible; d, tentative; e, iso- and anteiso-alkanes are positively identified by monitoring their major ions a.t M-43 and M-29 respectively.

320
d detected as methyl ester in the derivatized sample aliquot. e compound detected as methoxy homologue in the derivatized sample aliquot,
f Ramsey et al. {1990), sidestream particulate matter of different filter cigarettes was collected using a
dilution sampler. 1 Spears et al. (1963), mainstream condensate of nonfilter cigarettes. h Sakuma et al. (1984a), main- and sidestream condensate of nonfilter cigarettes. i Matsushima et al. (1979), mainstream particulate matter from nonfilter cigarettes. ; Severson et al. (1978), mainstream condensate of nonfilter cigarettes (cone. in µg/g ofto
bacco). 1: Elmenhorst (1972), mainstream condensate ofnonfilter cigarettes (cone. in µg/g of tobacco). 1 Hoffmann and Woziwodzki {1968), mainstream condensate of nonfilter cigarettes.
m Sakuma et al. (1983), main- and sidestream condensate of nonfilter cigarettes. " Schmeltz et al. {1975), main- and sidestream condensate of nonfilter cigarettes (cone. in µg/g
of tobacco). · 0 Browne et al. {1980), main- and sidestream particulate and gaseous nicotine. P Sakuma et al. {1984b), main- and sidestream condensate of nonfilter cigarettes. f Klus and Kuhn (1982), main- and sidestream condensate ·of filter and nonfilter cigarettes. r Grimmer et al. (1987), main- and sidestream particle samples of nonfilter cigarettes (gas phase
PAH also were measured and usually consisted of 1% of the amount was found for the particle phase).
• Lee et al. (1976), mainstream condensate of standard cigarettes.

321
Tracing Cigarette Smoke Aerosol in Urban Atmospheres
Because people spend on average most of their time indoors ( e.g., Jenkins
et al., 1992) where restricted airflow limits the indoor/outdoor air exchange,
cigarette smoke expos11re stuclies in the pa.st have been concerned mainly with
elevated indoor pollutant concentrations ca.used by cigarette smoking (Brnnekreef
and Boleij, 1982; Girman et a.l., 1982; IARC, 1986; Ka.tzenstein, 1992; Repace
and Lowrey, 1990; US Dept. of Health and Hu.man Services, 1989). To apportion
the tobacco smoke contributions to an indoor environment with several potential
indoor air pollution sources, a number of organ1c marker compounds such as
nicotine, 3-ethylenepyridine, solanesol, PAH, and n-alkanes have been utilized
in the past (Benner et al., 1989; Chuang et al., 1991; Hammond et al., 1987;
Leaderer and Hammond, 1991; Ogden and Maiolo, 1989; Mitra and Wilson,
1992; Ramsey et al., 1990; Tang et al., 1990).
In order to trace tobacco smoke particles in a reactive outdoor urban at
mosphere that is influenced by a great number of different emission sources,
organic marker compounds for tobacco smoke must meet several requirements:
The tracer compounds must be (1) source specific; (2) detectable in urban air;
(3) exclusively in the particle phase; and ( 4) chemically stable over transport
times between the source and the atmospheric measurement sites.
Nicotine, a possible tobacco smoke tracer, is known to partition between the
gas and particle phase. Because nicotine is primarily associated with the gas
phase (Benner et al., 1989; Eatough et al., 1989; Ogden and Maiolo, 1992; Tang et
al., 1990) and is susceptible to photodegradation (Eatough et al., 1989), it is not a
reliable quantitative tracer for cigarette smoke particles in the urban atmosphere,
although it might be useful as a qualitative tracer for whole cigarette smoke if

322
both gas- plus particle-phase constituents were of interest. 3-Ethylenepyridine,
a combustion product of nicotine, also is mainly found in the gas phase but is
more stable in the presence of UV-radiation than nicotine (Eatough et al., 1989;
Heavner et al., 1992; Nelson et al., 1992).
Solanesol, a long chain (C..45H7◄ 0) trisesquiterpenoid alcohol, is characteristic
of cigarette smoke and completely in the particle phase under normal condi
tions; hence it has been suggested as an indoor cigarette smoke tracer (Ogden
and Maiolo, 1989; Tang et al., 1990). Because solanesol is an isoprenol with
nine double bonds, the probability that it will degrade rapidly in a photochem
ically reactive atmosphere is high (e.g., d~e to 0 3 or photodegradation). Tang
an~ coworkers (1990) have shown that tobacco smoke-associated solanesol reacts
rapidly when exposed to UV-light simulating midday solar radiation. Hence,
although it may be suitable to trace tobacco smoke in indoor environments,
solanesol probably is not suitable as a tobacco smoke tracer in the outdoor ur
ban atmosphere.
P AH have been used as well in indoor environments to assess the contribution
of cigarette smoke to indoor air pollution (e.g., Chuang et al., 1991; Grimmer et
al., 1977; Mitra and Wilson, 1992; llisner and Conner, 1991). In the absence of
indoor heating sources such as wood burning stoves or kerosene heaters, indoor
PAH concentrations may track the exposure to tobacco smoke. In .the urban
atmosphere, PAH are contributed by virtually all combustion sources and are
known to degrade photochemically in the presence of UV light ( e.g., Rogge et
al., 1993a,b,f; Kamens et al., 19~0; Pitts et al., 1969, 1980). Consequently, PAH
are not suitable as tracers for cigarette smoke in the urban atmosphere.
, Higher molecular weight n-alkanes (C21, C29 , Cai, and C33 ) have· been used to
323
monitor tobacco smoke particles in indoor environments (Ramsey et al., 1990).
While the odd carbon numbered n-alkane concentration pattern in a smoker's
home might be mainly due to tobacco smoke, the outdoor odd-tereven carbon
numbered n-alkane concentration pattern found in ambient suspended fine par
ticulate matter is mainly controlled by the release of vegetative detritus in the
form of abraded waxy leaf surface particles shed by outdoor plants (Mazurek
and Simoneit, 1984; Simoneit 1 1989; Simoneit and Mazurek, 1982; Rogge et al., . - .
1993b). Hence, the high molecular weight odd carbon n-alkanes cannot be used
to identify cigarette smoke in outdoor air.
A more promising compound class that shows properties similar to the n
alkanes consists of the branched alkanes such as iso- (2-methyl-) and anteiso
(3-methyl-) alkanes .. These ·iso- and antei.,o-alkanes show a characteristic concen
tration pattern in tobacco leaf surfa".ce waxes and consequently in tobacco smoke
(see Figure 8.2a). To serve as cigarette smoke markers in the urban atmosphere,
the i"o- and antei.,o-alkane c~ncentration patterns in tobacco smoke aerosol must
be distinctly different from those found in the leaf surface abrasion products of
urban plants such that tobacco smoke derived i"o- and antei.,o-alkanes will dom
inate the outdoor concentrations of such compounds. The latter requirement, if
met, would guarantee.that possible interferences due to iso- and antej.,o-alkane
release from urban vegetation to the atmosphere are minor.
In order to determine whether cigarette smoke particles dominate the emis
sions of iso- and anteiso-alkanes to the urban environment, it is first necessary
to characterize the emissions of such compounds from plants growing outdoors.
Release of fine particulate leaf surface abrasion products from plants typical
to the Los Angeles area have been characterized on a molecular level by Rogge et

324
al. (1993b). Green and dead leaves from the 62 common plant species growing
in the Los Angeles area, including broadleaf trees, conifers, palms, shrubs, and
grasses, were collected during a harvesting campaign in 1988 (Hildemann et al.,
1991a). The collected green and dead leaves were each composited according
to the mass fraction of leaf material attributed to each species in the Los An
geles area as determined by Miller and Winer (1984) and Winer et al. (1983).
The green leaf and the dead leaf composites were separately agitated to release
particulate matter shed from their surfaces when the leaves brush against each
other as would occur naturally by the wind. The -abraded waxy leaf surface ma
terial was subsequently collected as fine particulate matter on quartz fiber filters
downstream of cyclone separators, and the samples then were extracted by the
same methods used i?, the present _study (Hildemann et al., 1991b; Rogge et al.,
1993b ). Additional information on the sampling campaign including the plant
species collected is summarized by Hildeman:n et al. (1991a).
Organic compounds present in these Los Angeles dead and green leaf abrasion
product samples were analyzed by GC/MS (Rogge et al., 1993b ). It was found
that then-, i3o-, and antei3o-alkane concentrations present in the fine particulate
leaf surface abrasion products were very similar when comparing green with dead
leaf surface abrasion products. This in turn indicates that the wax type alkanes
are rather stable in the urban environment, since the dead leaf material had aged
for quite some time between the end of wax synthesis by the leaf and the time that
particular samples were collected. i.,o- and antei3o-Alkanes were found in the leaf
abrasion products in the range from C29 to C34 • Comparing the amount of i.,o
and antei.,o-alkanes to the amount of n-alkanes in the same carbon range (C29 -
C34), such i3o- and antei.,o-a.lkanes together only amount· to 1.5 to 1.6% of the

325
respective n-alkanes found in the dead or green leaf surface abrasion products.
Similar results also have been reported by other researchers for several plants
species (e.g., Eglinton et al., 1962; Eglinton and Hamilton, 1967; Waldron et al.,
1961).
In contrast, the same branched alkanes in the tobacco smoke samples inves
tigated here comprise dose to 68% of the respective n--alkane mass (C29 - C34 )
found in the smoke particles, a 40 times higher abundance than found for the
leaf abrasion products of urban vegetation. Similar results have been found for
tobacco leaves (Benner et al., 1989; Carruthers and Johnstone, 1959; Mold et
al., 1963; Severson et al., 1978; Spears et al., 1963; Stedman, 1968) and tobacco
smoke (Carruthers and Johnstone, 1959; Kolattu.kudy, 1970; Mold et al., 1963;
Severson et al. 1978;.Stedman, 1968). Typical ion-chromatograms characteristic
of the alkanes are shown in Figures 8.3a and 8.3b for green leaf surface abra
sion products and tobacco smoke particles. These figures clearly demonstrate
enrichment in iJo- and antei.rn-alkanes relative to n-alkanes in the tobacco smoke
samples when compared to Los Angeles green leaf surface abrasion products.
Figures 8.4a and 8.4b show the concentration of i.,o- and anteiJo-alkanes mea
sured in green and dead leaf abrasion products (µg/ g of fine particulate abraded
leaf surface material) and fine tobacco smoke particles (µg/cigarette). On com
paring these two graphs it can be seen that: (1) iJo-hentriacontane (iJo-C31 ) in
the cigarette smoke samples is found at about the same concentration level as
anteiso-dotriacontane (anteiJ<>-7C32 ), which differs noticeably from the Los An
geles area vegetative leaf composite surface waxes (iJo-Cs1 > anteiJo-C32 ); (2)
while iso-tritriacontane ( iso-C33) is the dominant branched alkane in the Los
Angeles leaf surface wax composites, antei.w-dotriacontane ( anteiso-C32 ) is the
326
dominant alkane in tobacco smoke followed closely by i.,o-C31 • These characteris
tic tobacco leaf surface £,o- and antei.,o-alkane concentration patterns, preserved
in the cigarette smoke particles, might be useful to trace such emissions in the
atmosphere of urban areas.
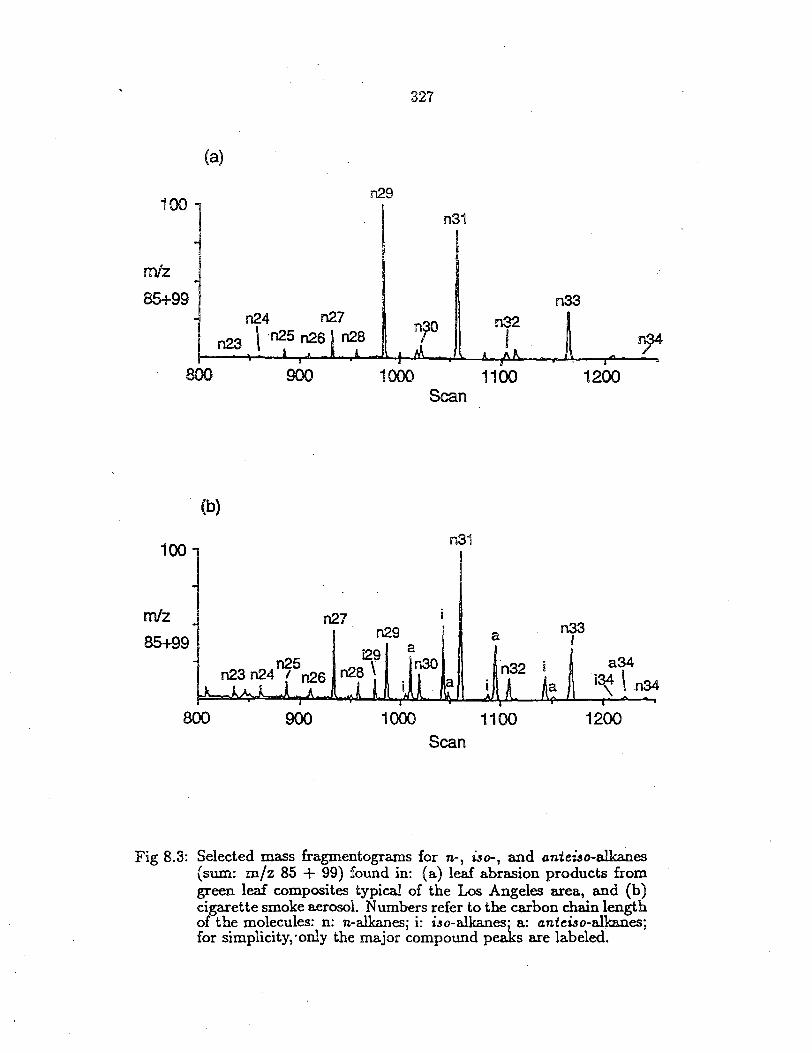
327
(a)
n29100
m/z
85+99 n24 n27
n23 \ ·n25 n26 1128
n3i
i n33
n32 I nJ4
800 900 1000 1100 1200 Scan
(b)
n3i100
m/z n27 n331129 a I85+99 a a34n25 n30
n23 n24 I n26 .,·34 \ n34
800 900 1000 1100 1200 Scan
Fig 8.3: Selected mass fragmentograms for n-, iJo-, and antei.,o-alkanes (sum: m/z 85 + 99) found in: (a) leaf abrasion products from green lea.f composites typical of the Los Angeles area., and (b) cigarette smoke aerosol. Numbers refer to the carbon cha.in length of the molecules: n: n-alka.nes; i: i.rn-alkanes· a: antei.,o-a.llouies; for simplicity, ·only the major compound peJcs a.re labeled.

328
200
180
160
140
.120
~ 100 :::I.
80
60
40
20
0
(a) Green Leaf Abrasion Products a Dead Leaf Abrasion Products □
iC29 iC30 aC30 iC31 aC31 iC32 aC32 iC33 aC33 iC34 aC34
120
108
96
84
Cl) 72 =: ~ 60 co
~ 48 :::I..
36
24
12
0
(b) Cigarette Smoke Ii
iC29 iC30 aC30 iC31 aC31 iC32 aC32 iC33 aC33 iC34 aC34
Fig. 8.4: iso- and anteiso-Alkane concentrations measured in(a) leaf surface abrasion products from green and dead leaf composites typical of the Los Angeles area, and (b) cigarette smoke aerosol collected in this study.
329
Emission Source Interferences
Before these characteristic tobacco leaf iso- and antei.5o-alkane concentration
patterns can be applied to trace cigarette smoke in the outdoor environment, it
must be determined that other sources do not emit such higher molecular weight
iso- and antei.50-aJkanes with a similar concentration pattern.·
The fine particulate emissions from gasoline and diesel powered vehicles have
been characterized by Rogge et al. {1993a) using methods essentially identical
to those employed in the present study. None of the iso- and antei.rn-alka.nes
discussed here could be detected in that or other studies ( e.g., Simoneit, 1984).
This result agrees well with the observation that long chain alkanes from higher
plants are typically not found in crude oils as a result of the diagenic and catagenic
processes ongoing during crude oil formation (Albrecht et al., 1976; Tissot and
Welte, 1984). Kissin (1987) reported that monomethyl-substituted alkanes found
in crude oils are the result of chemical processes occurring during catagenesis,
with methyl groups approximately equally substituted in all positions of the
alkane molecules, primarily b~low C20 • Biogenically-derived or human-controlled
biogenic sources, such as meat cooking, wood combustion, aerial dispersion of
bacteria or resuspension of insect fragments, likewise need to be examined to see
if they interfere with these possible cigarette smoke tracers. Meat cooking (Rogge
et al., 1991) does not produce detectable amounts of higher molecular weight
branched alkanes. Wood combustion, already very low in n-alkane emissions,
also does not emit any branched alkane type compounds (Rogge et al., 1993g).
Likewise, bacteria that might become airborne and that are smaller than 2.0 µm
in diameter do not contain the higher molecular weight i.5o- and anieiso-alkanes
· studied here (C:ui - C34 ). Instead such bacte'ria do contain complex mixtures of

330
unsaturated and branched ( i.,o- and antei.,o-) alkenes in the range from C23 to
C29 (Albro, 1976; Tornabene et al., 1970), and i~o- and antei.,o-alkan.oic acids
(C12 - C11) (Kaneda, 1967).
The cuticula of insects are usually covered with a thin layer of waxy com
pounds including n-alkanes, and mono-, di-, and trimethyla.lkanes ranging from
C26 to about C43 (Bonavita-Cougourdan, 1991; Lockey, 1988, 1992; Lockey and
Metcalf, 1988; Nelson, 1978; Nelson et al., 1981). The series of i.5o- and antei.,o
alkanes in the carbon range of interest ( C28 - C34 ) is typically incomplete. The
members of these series are usually minor compared to n-alkanes and dimethy
lalkanes, and typically show a different concentration pattern then is found in
tobacco leaf waxes and consequently in cigarette smoke (Bonavita-Cougourdan,
1991; Lockey, 1988, 1992; Lockey and Metcalf, 1988; Nelson, 1978; Nelson et
al., 1981). Further, it is unlikely that insect debris contributes much to airborne
particulate matter in particle sizes smaller than 2.0 µmin diameter.
Estimated Emission Rates for Cigarette Smoking in Los Angeles
Whether or not cigarette smoke particles can be traced in the urb~ at
mosphere depends in part on the total emission rates for cigarette smoke con
stituents. Consequently, the first step is to estimate the emission rates of particle
associated cigarette smoke constituents that have been released during indoor
and outdoor activities combined. Using total cigarette sales data for the entire
United States in 1982 (IARC, 1986) together with population data for the same
year (U.S. Bureau of the Census, 1991), the average number of cigarettes per
capita smoked in the U.S. in 1982 was determined to be 2700. In this study,
total cigarette smoke compound emissions during 1982 were estimated for an
80 x 80 km study area centered over downtown Los Angeles ( see map in Rogge

331
et al. (1991)). Any subsequent year could have been chosen. However, the
present study is part of a larger investigation that encompasses measurements of
emission rates from the major primary fine particle emission sources (Hildemann
et al., 1991a), creation of emission inventories for primary fine particulate organic
carbon (OC) and elemental carbon (EC) (Gray, 1986; Hildem~ et al., 1991a),
ambient OC and EC data (Gray et al., 1986), ambient fine particulate organic
compound concentrations determined at several sites within that Los Angeles
area during 1982 (Rogge et al., 1992a,e), a..TJ.d characterization of the organic
chemical composition of the source emissions (Rogge et al., 1991, 1993b-d,f).
The data base available for testing proposed organic tracer techniques during
1982 is the most advanced data set available.
Fine particle-associated organic compound class emission rates from cigarette
combustion during 1982 within our Los Angeles study area as computed from
cigarette sales plus the source test data of Table 8.1 are given in Table 8.2.
Many of these cigarettes, of course, are smqked inside of buildings. Much of that
cigarette smoke, however, reaches the outdoor atmosphere as air is exchanged
between buildings ~d the outdoors. Considerable effort has been expended to
characterize the penetration of particulate matter present in the outdoor atmer
sphere into the indoor air of buildings in Los Angeles (Nazaroff et al., 1990;
Ligocki et al., 1993). It has been found that fine particle levels inside Sepul
veda House, a well-ventilated former private residence in downtown Los Angeles
that lacks any deliberate particle filtration system, are virtually as high as those
outdoors (Ligocki et al., 1993). Experiments and modeling calculations that ex
amine the fate of fine particles present in that building show that they are vented
back to the outdoor atmosphere with greater than 90% efficiency (Nazaroff et

332
al., 1990). Hence, cigarette smoke would easily escape from such buildings over
time.
Buildings with conventional commercial air conditioning systems with low
efficiency particle filters (single pass efficiency of roughly 15-35% for removing
particles of 0.1-0.5 µm diameter, accompanied by several passes of air recircu
lated through the filters for each pass of outdoor makeup air) have indoor fine
particle levels in the range of 20--60% as high as those outdoors (Ligocki et al.,
1993; Nazaroff and Cass, 1991). Only a very small fraction of the fine particles
present inside such buildings are collected by deposition on indoor surfaces: in
stead, nearly all fine particles are either collected by the ventilation system filters
or are exhausted to the outdoor atmosphere (Nazaroff and Cass, 1991 ). For a
standard commercial building with 25% of its ventilation system flow contributed
by outdoor makeup air and 75% of its air flow contributed by indoor air recircu
lated through filters with a single pass removal efficiency for fine particles of circa
35% per pass, roughly half o~ the fine particle cigarette smoke emitted inside that
building will be exhausted to the outdoor atmosphere ( see Nazaroff and Cass,
1991 ). H the single pass filtration efficiency for fine particles is only 15%, then
approximately two thirds of any fine cigarette smoke particles generated indoors
will be exhausted to the outdoor air. The daily compound class emission rates
in the Los Angeles study area given in Table 8.2 thus represent upper limits on
their release to the outdoor atmosphere, with the actual release being smaller
by the amount of cigarette smoke removed by the ventilation system filters in
mechanically-vented buildings.
It can be. seen from Table 8.2 that the dominant compound class in cigarette
· smoke emitted to the Los· Angeles atmosphere in 1982 consists of semi-volatile

333
pyridine alkaloids (e.g., nicotine) and other N-containing compounds. Because
nicotine is rather volatile and unstable in the urban atmosphere, ambient :fine
particle-associated nicotine concentrations, if measurable, may not be found in
the atmosphere in known proportions to whole tobacco smoke particle concen
trations. Up to 19 kg of i.,o- and anteiJo-alkanes were emitt_ed per day to the
atmosphere of the 80 x 80km. Los Angeles study area from cigarette smoking in
1982. For the two most prominent branched allmnes ( i.1o-Ca1 , anteiJo-C33) alone,
the daily emission rates totaled 10.4 kg day-1 •
Using the emission inventory for fine particulate organic carbon (OC) for
the 80 x 80 km area centered over Los Angeles that was compiled for 1982
(Gray, 1986; Hildemann et al., 1991a), the emissions of primary aerosol organic
carbon (OC) from all sources combined was estimated to total 29820 kg day-1 •
Expressed as total organic compound mass ( organic compounds ~ 1.2 x organic
carbon) this amounts to 35800 kg day-1 of equivalent organic compound mass.
Thus, the two branched alkanes considered, when combined, account for 0.029%
of the fine particulate organic compound emissions.
Gray et al. (1986) published annual mean ambient fine particulate QC data
for the area of interest. These data can be used to compute the annual mean fine
particle-associated total organic compound concentrations, yielding 6.94 µg m-3
at West Los Angeles, 8.63 µg m-3 at downtown Los Angeles, and 8.06 µg m-3 at
Pasadena during 1982. If 0.029% of that ambient fine particulate componnd mass
at each of the three sampling sites were present as the iJo-C31 plus the anteiJo
C33 alkane, then the ambient fine particle concentrations of these two branched
alka.nes together would account for: West Los Angeles 2.0 ng m-3 , downtown Los
Angeles 2.5 ng m-3 , and ,Pasadena 2.3 ng m-3 during 1982.
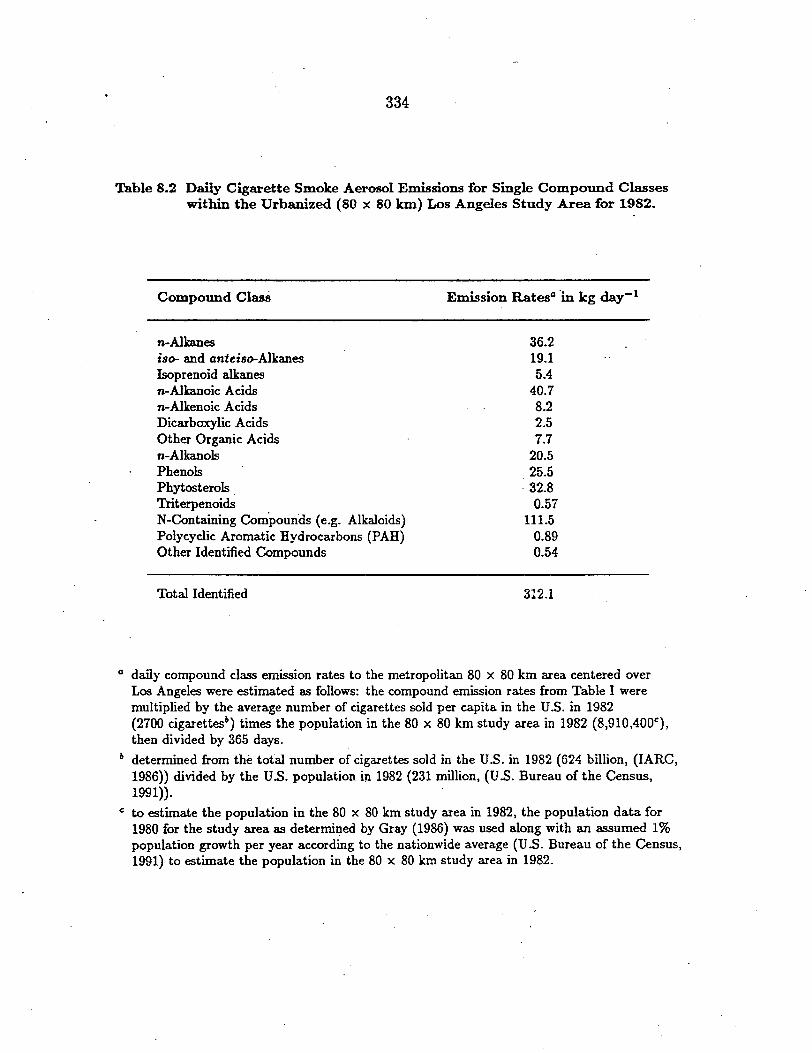
334
Table 8.2 Daily Cigarette Smoke Aerosol Emissions for Single Compound Classes within the Urbanized (80 x 801cm) Los Angeles Study Area for 1982.
Compound Class Emission Rates0 "in kg day-1
n-Alkanes iso- and anteiso-Alkanes lsoprenoid alkanes n-Alkanoic Acids n-Alkenoic Acids Dicarboxylic Acids Other Organic Acids n-Alkanols Phenols Phytosterols . Triterpenoids N-Containing Compounds ( e.g. Alkaloids) Polycyclic Aromatic Hydrocarbons (PAH) Other Identified Compounds
36.2 19.1 5.4
40.7 8.2 2.5 7.7
20.5 25.5
· 32.8 0.57
111.5 0.89 0.54
Total Identified 312.1
a daily compound class emission rates to the metropolitan 80 x 80 km a.rea centered over Los Angeles were estimated as follows: the compound emission rates from Table I were multiplied by the average number of cigarettes sold per capita in the U.S. in 1982 (2700 cigarettesh) times the population in the 80 x 80 km study a.rea in 1982 (8,910,400e), then divided by 365 days.
b determined from the total number of cigarettes sold in the U.S. in 1982 (624 billion, (IARC, 1986)) divided by the U.S. population i11 1982 (231 million, (U.S. Bureau of the Census, 1991)).
e to estimate the population in the 80 x 80 km study area in 1982, the population data for 1980 for the study area as determined by Gray (1986) was used along with an assumed I% population growth per year according to the nationwide average (U.S. Bureau of the Census, 1991) to estimate the population in the 80 x 80 km study area in 1982.

335
Cigarette Smoke Aerosol in the Los Angeles Atmosphere
Fine aerosol organic compound concentrations during the year 1982 have been
measured at sites within the 80 x 80 km greater Los Angeles study area discussed
earlier. Sampling techniques, analytical protocols, and compound identification
procedures were essentially the same as those applied to the source samples
described in the present study, except that samples were drawn directly from the
atmosphere. Figures 8.5a,b show the ambient concentration pattern .for iso- and
antei!io-alkanes measured at West Los Angeles and Pasadena during October and
November 1982. Because the minor i.5o- and ante£,o-alkanes were below detection
limits during the summer months, the annual average ambient concentrations for
such branched alkanes were determined only for the more abundant C31 iso-alkane
and for the C32 anteiso-alkane as shown in Figure 8.5c.
Comparing the ambient iso- and anteiso-alkane concentration patterns (Fig
ures 8.5a-c) wit_h the concentration pattern found for cigarette smoke (Figure 8.4b ),
and similarly with green and dead vegetative detritus (Figure 8.4a), the follow
·ing observations can be made: (1) the relative concentrations of both the iso-C31
and anteiso-C32 alkanes in the ambient sample are comparable, which is also
the case for cigarette smoke aerosol; (2) anteiso-C32 > iso-C33 in both cigarette
smoke and ambient fine particle samples, whereas iso-C33 > anteiso-C32 in the
vegetative leaf surface abrasion products typically released to the Los Angeles
atmosphere. Consequently, the ambient i.5o- and anteiso-alkane concentration
profile does not match that of leaf surface abrasion products from the plant com
munities growing in Los Angeles. Instead it compares well to the concentration
profile found in cigarette smoke aerosol. Further, the measured ambient annual
average concentration of the iso-C31 plus anteis~C32 alkanes during 1982 ·totals

336
2.4 ng m-3 at West Los Angeles, 2.8 ng m-3 at downtown Los Angeles, and
2.2 ng m-3 at Pasadena. This is very close to the 2.0 - 2.5 ng m-3 concentration
range estimated earlier in this paper based on previously published emissions _and
ambient organic aerosol concentrations. Working backward, an ambient i.5o-C31
plus antei.,o-C32 alka.ne concentration of 2.2 - 2.8 ng m-3 would correspond to
an ambient fine particle contribution from cigarette smoke of 0.57 to 0. 72 µg m-3
(or 2.0 to 2.5% of the total fine ambient particle mass).
To test the hypothesis that urban plants are not the major source of urban
atmospheric i.5o- and antei.,o-alkane concentrations in Los Angeles, the follow
ing consistency check can be performed. Assume for a moment that all i.,o
and antei.,o-alkanes (C29 - C34) measured in this urban atmosphere were com
pletely due to the leaf surface abrasion products of common vegetation typical
of the Los Angeles area. Then it would be possible to estimate from the ambient
i.,o- and antei.,o-alkane concentrations the hypothetical ambient n-alkane con
centration contributions that must be present from vegetative detritus using the
ratio between branched vs. n-alkanes found in the leaf surface abrasion product
composites discussed earlier. It was found from these calculations ( using i3o-C31 -
alkane plus C29-C34 n-alkane) that the urban C29 - C34 n-alkane concentrations
measured on average in the greater Los Angeles area would have to be roughly
20-fold higher than actually observed, if all iJo- and anteiJo-alkanes found in the
airborne fine particulate matter were solely due to urban vegetation. Conversely,
the contribution from urban plant detritus to the measured Los Angeles atmo-'-..
spheric i3o- and antei.,o-alkane concentrations must be 5% or less based on the
upper limit posed by the ambient C29-:--C34 n-alkane concentration. Under such
circumstances the iJo- ,and antei.5o-alkanes concentration pattern characteristic

337 4.0
3.6
3.2
2.8
24 "' 2.0I
1.6
1.2
0.8
0.4
0.0
3.0
2.7
2.4
21
u .., 1.5!
C 1.2
0.9
0.6
0.3
0.0
2.4
2.2
1.9
1.7
IA ... 1.2!
C
1.0
0.7
0.5
0.2
0.0
(a) West iLos Angeles O::lcbo-1982 •Novc:mbcr 1982 □
iC'l9 iC30 .00 iC31
(b) Pasadena
iC29 iC30 aC:30 iCH
(c) Wat Los Angela •Downtown Los Angela □
Pasadena ~
iC'29 iC'30 aC30 iC31
aC31 iC32 aC32 iC33 aC33 iC34 aC34
Octoba- 1982 •November 1982 □
aC3I iC32 aC32 iC33 aC33 iC34 a04
aC31 iC32 aC32 iC33 aC33 iC34 a04
Fig. 8.5: Ambient iso- and anteiso-alkane concentrations measured at (a) West Los Angeles and (b) Pasadena, both in October and November 1982, and (c) annual average concentrations measured at West Los Angeles, downtown Los Angeles, and Pasadena during 1982.

338
of cigarette smoke can be used as a marker assemblage to accurately trace
cigarette smoke aerosol in the urban atmosphere.
Conclusions
A study has been conducted to identify marker compounds that can be used
to trace cigarette smoke particles in the outdoor Los Angeles urban atmosphere.
The organic compounds present in cigarette smoke aerosol samples from exhaled
mainstream plus sidestream smoke were examined by gas chromatography/mass
spectrometry. The compound emission rates agree with literature values, thereby
validating the sampling and analytical methods applied here. It was shown that
the i.~o- and antei.rn-alkanes concentration pattern characteristic of tobacco leaf
surface waxes is preserved in cigarette smoke aerosol. To verify whether or not
this i3o- and antei..,o-alkane concentration pattern found in the cigarette smoke
aerosol is sufficiently unique that it can be used to trace cigarette smoke emis
sions in the urban atmosphere, common .anthropogenic and biogenic emission
sources likewise have been investigated. Particulate matter dislodged from the
waxy leaf surfaces of urban plants by wind and weather show on average an i3o
and antei..,o-alkane concentration pattern that is different than that was found
for the cigarette smoke_ aerosol. Other major emission sources ranging from ve
hicular emissions to meat cooking do not show any detectable amounts of i3o
and antei..,o-alkanes in the carbon range from C29 to C34 , when analyzed by the
same methods as used for the cigarette smoke and leaf surface waxes.
Using cigarette sales and population data for Los Angeles in 1982, ambi
ent cigarette smoke branched alkane tracer concentrations were estimated that
closely resemble concentrations measured in ·ambient air throughout the greater
Los Angeles area. Considering all avenues investigated, the i"'o- and antei3o-
339
alkane concentration pattern found in cigarette smoke aerosol is unique, and is
preserved in the urban atmosphere. It can be concluded that cigarette smoke
aerosol can indeed be traced in the u:rban atmosphere and the tracer assemblage
can be used to quantitatively etimate the ambient cigarette smoke concentrations
outdoors. On average in 1982 in the Los Angeles area, the out~oor ambient fine
particle cigarette smoke concentration determined by this technique averaged
approximately 0.57 to 0.72 µg m-3 •

. 340
REFERENCES
Albrecht, P.; Van,denbroucke, M.; Mandengue, M. Geochemical studies on the
organic matter from the Douala Basin (Cameroon)-!. Evolution of the
extractable organic matter and the formation of petroleum. Geochim.
Co.,mochim. Acta 1976, 40, 791-799.
Albro, P:w. Bacterial Waxes. In Chemi.,try and Biochemi.,try of Natural Waxe.5;
Kolattukudy, P.E, Ed.; Elsevier, Amsterdam, New York, Chap. 10, 1976,
419-445.
Baker, E.A. Chemistry and morphology of plant epicuticular waxes. In The
Plant Cuticle.; Cutler, D.F., Alvin, K.L., Price, C.E., Eds.; Academic
Press, London, 1982, pp. 139-165.
Baker, R.R. Product formation mechanisms inside a burning cigarette. Prog.
· Energy CombU.5t. Sci. 1981, 7, 135-153.
Benner, C.L.; Bayona, J.M.; Cake, F.M.; Tang, H.; Lewis, L.; Crawford, J.;
Lamb, J.D.; Lee, M.L.; Lewis, E.A.; Hansen, L.D.; Eatough, D.J. Chem
ical composition of environmental tobacco smoke. 2. Particulate-phase
compounds. Environ. Sci. Technol. 1989, 23, 688-699.
Bonavita-Cougourdan, A.; Theraulaz, G.; Bagneres, A.-G.; Roux, M.; Pratte,
M.; Provost, E.; Clement, J.-1. Cuticular hydrocarbons, social organi
zation and ovarian development in a polistine wasp: Poli.,te., Dominulru
Christ. Comp. Biochem. Phy.,iol. 1991, l00B, 667-680.
Browne, C.L.; Keith, C.H.; Allen, R.E. The effect of filter ventilation on the yield. .
and composition of mainstream and sidestream smokers. Beitr. Tabak
for.,ch. 1980, 10, 81-90.

341
Brunekreef, B.; Boleij, J.S.M. Long term average suspended particulate concen
trations in smokers' homes. Int. Arch. Occup. Environ. Health 1982, 50,
299-302.
CR:rruthers, W.; Jol,nstone, A.W. Composition of a pa.ra:ffin wax fraction from
tobacco leaf and tobacco smoke. Nature 1959, 184, 1131-1132.
Chuang, J.C.; Gregory, A.M.; Kuhlman, M.R. Polycyclic aromatic hydrocarbons
and their derivatives in indoor and outdoor air in an eight-home study.
Atmos. Environ. 1991, 25B, 369-380.
Douglas, A.G.; Eglinton, G. The distribution of alkanes. In Comparative Phyto
chemistry, Swain T. Ed., Academic Press, London, 1966, 57-77.
Eatough, D.J.; Benner, C.L.; Bayona, J.M.; Richards, G.; Lamb, J.D.; Lee,
M.L.; Lewis, E.A.; Hansen, L.D. Chemical composition of environmental
tobacco smoke. 1. Gas-phase acids and bases. Environ. Sci. Technol.
1989, 23, 679-687.
·Eglinton, G.; Gonzalez, A.G.; Hamilton, R.J.; Raphael, R.A. Hydrocarbon con
stituents of the wax coatings of plant leaves: A taxonomic survey. Phy
tochem. 1962, 1, 89--102.
Eglinton, G.; Hamilton, R.J. Leaf epicuticular waxes. Science 1967, 156, 1322-
1335.
Elmenhorst, H. Sauren and phenole in der "semi-volatile"-fraction des rauches
von blend-, virginia-, burley-, und orient..,cigaretten. Beitr. Tabakforsch.
1972, 6, 182-188.
342
Girman, J.R.; Apte, G.W.; Traynor, J.R.; Allen, J.R.; Hollowell, C.D. Pollutant
emission rates from indoor combustion appliances and sidestream cigarette
smoke. Environ. Int. 1982, 8, 213-221.
Gray, H.A. Control of atmospheric fine carbon particle concentrations. Ph.D.
Thesis, California Institute of Technology, Pasadena, 1986, 317pp.
Gray, H.A.; Cass, G.R.; Huntzicker, J.J.; Heyerdahl, E.K,; Rau, J.A. Character
istics of atmospheric organic and elemental carbon particle concentrations
in Los Angeles. Environ. Sci. Technol. 1986, 20, 580-589.
Grimmer, G.; Bohnke, H. ; Harke, H.-P. Zum proben des passivrauchens: konzen
trationsmessungen · von polycyclischen aromatischen kohlenwasserstoffen
in innenraumen nach dem machinellen abrauchen von zigaretten. Int.
Arch. Occu.p. Environ. Hlth. 1977, 40, 83-92.
Grimmer, G; Naujack, K.-W.; Dettbarn, G. Gas chromatographic determination
of polycyclic aromatic ·hydrocarbons, aza-arenes, and aromatic amines
in the particle and vapor phase of mainstream and sidestream smoke of
cigarettes. Toxicol. Lett. 1987, 35, 117-124.
Giilz, P.-G.; Muller, E.; Prasad, R.B.N. Organ-specific composition of epicuticu
lar waxes of beech leaves and seeds. Z. Naturfor.,ch. 1989, 44C, 731-734.
Hammond, S.K.; Leaderer, B.P.; Roche, A.C.; Schenker, M. Collection and anal
ysis of nicotine as a marker for environmental tobacco smoke. Atmo'.,.
Environ. 1987, 21, 457-462.
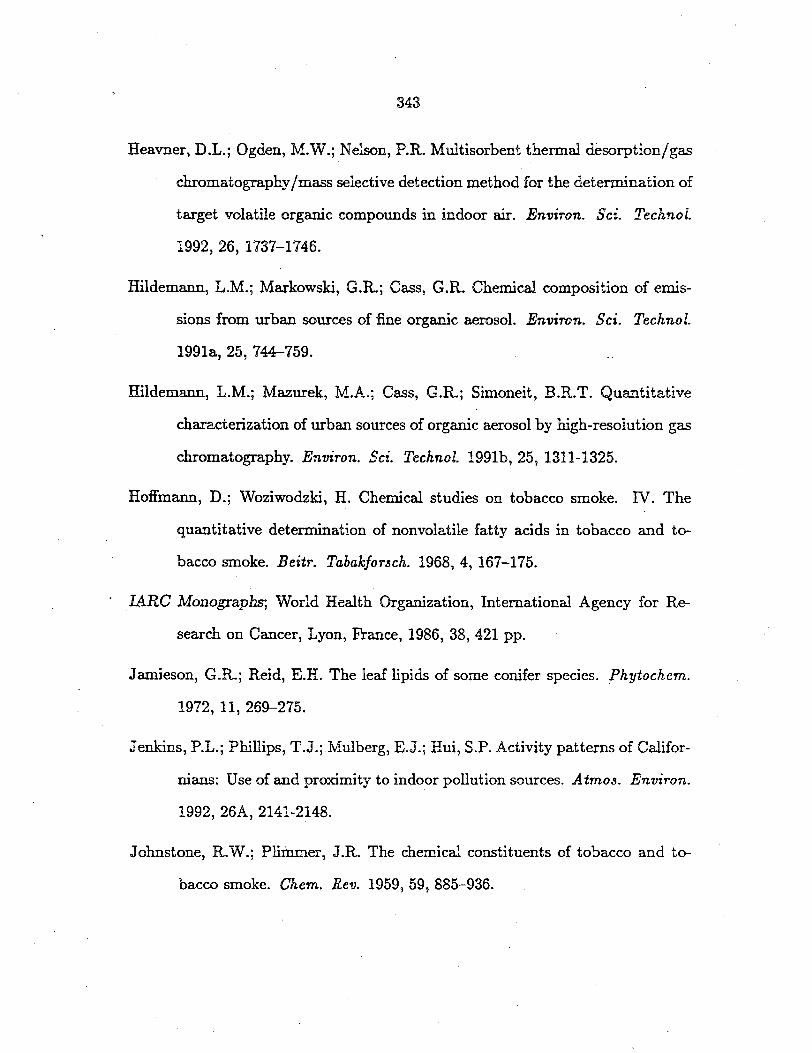
343
Heavner, D.L.; Ogden, M.W.; Nelson, P.R. Multisorbent thermal desorption/gas
chromatography/mass selective detection method for the determination of
target volatile organic compounds in indoor air. Environ. Sci. Technol.
1992, 26, 1737-1746.
Hildemann, L.M.; Markowski, G.R.; Cass, G.R. Chemical composition of emis
sions from urban sources of fine organic aerosol. Environ. Sci. Technol.
1991a, 25, 744-759.
Hildemann, L.M.; Mazurek, M.A.; Cass, G.R; Simoneit, B.R.T. Quantitative
characterization of urban sources of organic aerosol by high-resolution gas
chromatography. Environ. Sci. Technol. 1991b, 25, 1311-1325.
Hoffmann, D.; Woziwodzki, H. Chemical studies on tobacco smoke. IV. The
quantitative determination of nonvolatile fatty acids in tobacco and to
bacco smoke. Beitr. Tabakforsch. 1968, 4, 167-175.
IARC Monographs; World Health Organization, International Agency for Re
search on Cancer, Lyon, France, 1986, 38, 421 pp.
Jamieson, G.R.; Reid, E.H. The leaf lipids of some conifer species. Phytochem.
1972, 11, 269-275.
Jenkins, P.L.; Phillips, T.J.;.Mulberg, E.J.; Hui, S.P. Activity patterns of Califor
nians: Use of and proximity to indoor pollution sources. Atmos. Environ.
1992, 26A, 2141-2148.
Johnstone, R.W.; Pliinmer, J.R. The chemical constituents of tobacco and to
bacco smoke. Chem. Rev. 1959, 59, 885-936.

344
Kamens, R.M.; Guo, J.; Guo, Z.; McDow, S.R. Polynuclear aromatic hydrocar
bon degradation by heterogeneous reactions with N2 0 5 on atmospheric
particles. Atmo.!I. Environ. 1990, 24A, 1161-1173.
Kaneda T. Fatty acids in the Genus Bacillus. J. Bacteriology 1967, Mar., 894-
903.
Katzenstein, A.W. Environme?,tal tobacco smoke and lung cancer risk: epidemi
ology in relation to confounding factors. Environ. Int. 1992, 18, 341-345.
Kissin, Y.V. Catagenesis and composition of petroleum: origin of n-alkanes and
isoalkanes in petroleum crudes. Geochim. Co.!lmochim. Acta 1987, 51,
2445-2457.
Kolattukudy, P.E. Plant waxes. Lipid" 1970, 5, 259-275.
Klus, .H.; Kuhn, H. Verteilung verschiedener tabakrauchbestandteile auf haupt
und nebenstromrauch ( eine iibersicht ). Beitr. Tabakfor.!lch. 1982, 11,
229-265.·
Leaderer, B.P.; Hammond, S.K. Evaluation of vapor-phase nicotine and res
pirable suspended particle mass as markers for environmental tobacco
smoke. Environ. Sci. Technol. 1991, 25, 770-7TT.
Lee, M.L.; Novotny, M.; Bartle, K.D. Gas chromatographic/mass spectromet
ric and nuclear magnetic resonance spectrometric studies of carcinogenic
polynuclear aromatic hydrocarbons in tobacco and marijuana smoke con
densates. Analyt. Chem. 1976, 48, 405-4_16.
Ligocki, M.P.; Salmon, L.G.; Fall, T.; Jones, M.C.; Nazaroff, W.W.; Cass, G.R.
Characteristics of airborne particles insid~ Southern California Museums
Atmo.!I. Environ. 1993, in pre""·

345
Lockey, K.H. Lipids of the insect cuticle: ongm, composition and function.
Comp. Biochem. Physiol. 1988, 89B, 595--645.
Lockey, K.H. Insect hydrocarbon chemotaxonomy: cuticular hydrocarbons of
adult and larval Epiphysa species blanchard and adult Onymacru Un
guicu.laris (Haag) (Tenebrionidae: Coleoptera). Comp. -Biochem. Physiol.
1992, 102B, 451-470.
Lockey, K.H.; Metcalfe, N .B. Cuticular hydrocarbons of adult HimatMmtl.3 species
and a comparison with 21 other species of adult tenebrionid beetle using
multivariate analysis. Comp. Biochem. Physiol. 1988, 91B, 371-382.
Lofroth, G.; Burton, R.M.; Forehand, L.; Hammond, S.K.; Seila, R.L.; Zwei
dinger, R.B.; Lewtas, J. Characterization of environmental tobacco smoke.
Environ. Sci. Technol. 1989, 23, 610-614.
Matsushima, S.; Ishiguro, S.; Sugawara, S. Composition studies on some varieties
of tobacco and their smoke. Beitr. Tabakforsch. 1979, 10, 31-38.
Mazurek, M.A.; Cass, G.R.; Simoneit, B.R.T. Interpretation of high-resolution
gas chromatography and high-resolution gas chromatography/mass spec
trometry data acquired from atmospheric organic aerosol samples. Aerosol
Sci. Technol. 1989, 10, 498-419.
Mazurek, M.A.; Cass G.R.; Simoneit, B.R.T. Biological input to visibility-reducing
particles in the remote arid southwestern United States. Environ. Sci.
Technol. 1991, 25, 684-694.

346
Mazurek, M.A.; Simoneit, B.R.T. Characterization of biogenic and petroleum.
derived organic matter in aerosols over remote, rural and urban areas. ·
In Identifi~ation and Analy.,i., of Organic Pollu.tani.5 in Air, ACS Symp.,
Woburn, MA: Ann Arbor Science/Butterworth Publishers, 1984: 353-370.
Mazurek, M.A.; Simoneit, B.R.T.; Cass, G.R.; Gray, H.A. Quantitative high
r~olution gas chromatography and high-resolution gas chromatogra-
phy/mass spectrometry analysis of carbonaceous fine aerosol particles.
Int. J. Environ~ Anal. Chem. 1987, 29, 119-139.
Mazurek, M.A.; Hildemann, L.M.; Cass, G.R.; Simoneit, B.R.T.; Rogge, W.F.
Methods of analysis for complex organic aerosol mixtures from urban emis
sion sour~es of particulate carbon. In Sampling and Analy.,i., of Airborne
Pollutani.5; Winegar, E.D.; Keith, L.H.; Eds.; Lewis Publishers: Boca
Raton, FL, 1993; pp 178-190.
Mitra, S.; Wilson, N .K. Pattern of polynuclear aromatic hydrocarbons in indoor
air: exploratory principal component analysis. Environ. Int. 1992, 18,
477-487.
Mold, J.D.; Stevens, R.K.; Means, R.E., Ruth, J.M. The paraffin hydrocarbons
of tobacco; normal-, iso-, and anteiso-homologues. Biochemi.,try 1963, 2,
605-610.
Mold, J.D.; Means, R.E.; Ruth, J.M. The higher fatty acids of flue-cured tobacco.
Methyl and cyclohexyl branched acids . .Phytochem. 1966, 5,59-66.
Miller, P.R.; Winer, A.M. Composition and dominance in Los Angeles basin
urban vegetation. Urban Ecology 1984, 8, 29-54.

347
Nazaroff, W.W.; Cass, G.R. Protecting museum collections from soiling due to
the deposition of airborne particles. Atmos. Environ. 1991, 25A, 841-852.
Nazaroff, W.W.; Salmon, L.G.; Cass, G.R. Concentration and fate of airborne
particles in museums Environ, Sci. Technol. 1990, 24, 66-77.
Nelson, D.R. Long-chain methyl-branched hydrocarbons: occurrence, biosynthe
sis, and function. Adv. Inuct Physiol. 1978, 13, 1-33.
Nelson, D.R.; Dillwith, J.W.; Blomquist, G.J. Cuticular hydrocarbons of the
house fly, Musca Dome.stica Insect Bioche.m. 1981, 11, 187-197.
Nelson, P.R.; Heavner, D.L.; Collie, B.B.; Maiolo, K.C.; Ogden, M.W. Effect of
ventilation and sampling time on environmental tobacco smoke component
ratios. Environ. Sci. Te.chnol. 1992, 26, 1915-1921.
Newell, M.P.; Heckman, R.A.; Moates, R.F.; Green, C.R.; Best, F.W.; Schu
macher, J.N. Isolation and identification of new components in the ether
soluble portion of cigarette smoke condensate. Tob. Sci. 1978, 22, 6-11.
Nishimoto, S. A chemotaxonomic study of n-alkanes in leaf surface waxes of
terrestrial plants. J. Sci. Hiroshima Univ., Ser. A, 1974a, 38, 151-158.
Nishimoto, S. Branched chain alkanes in surface waxes of waxy wheats and
nowaxy wheats. J. Sci. Hiroshima Univ., Ser. A, 1974b, 38, 165-174.
Ogden, M.W.; Maiolo, K.C. Collection and detennination of solanesol as a tracer
of environmental tobacco smoke in indoor air. Environ. Sci. Te.chnol.
1989, 23, 1148-1154.
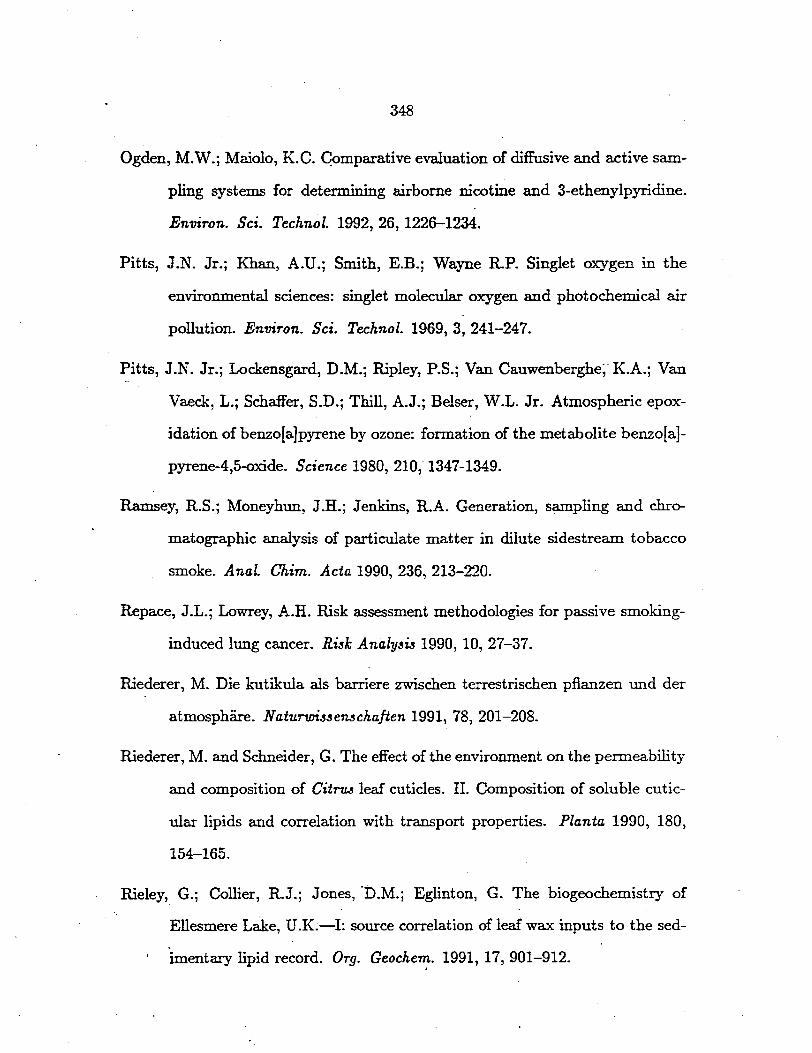
348
Ogden, M.W.; Maiolo, K.C. Qomparative evaluation 0£ diffusive and active sam
pling systems for determining airborne nicotine and 3-ethenylpyridine.
Environ. Sci. Techn~l. 1992, 26, 1226--1234.
Pitts, J.N. Jr.; Khan, A.U.; Smith, E.B.; Wayne RP. Singlet oxygen in the
environmental sciences: singlet molecular oxygen and photochemical air
pollution. Environ. Sci. Technol. 1969, 3, 241-247.
Pitts, J.N. Jr.; Lockensgard, D.M.; llipley, P.S.; Van Cauwenberghe;· K.A.; Van
Vaeck, L.; Schaffer, S.D.; Thill, A.J.; Belser, W.L. Jr. Atmospheric epox
idation of benzo[a)pyrene by ozone: formation of the metabolite benzo[a]
pyrene-4,5-oxide. Science 1980, 210, 1347-1349.
Ramsey, R.S.; Moneyhun, J.H.; Jenkins, R.A. Generation, sampling and chro
matographic analysis of particulate matter in dilute sidestream tobacco
smoke. Anal. Chim. Acta 1990, 236, 213-220.
Repace, J.L.; Lowrey, A.H. Risk assessment methodologies for passive smoking
induced lung cancer. Ri"k Analy"i3 1990, 10, 27-37.
Riederer, M. Die kutikula als barriere zwischen terrestrischen pfl.anzen und der
atmosphare. Natu.rwi33enuhaften 1991, 78, 201-208.
Riederer, M. and Schneider, G. The effect of the environment on the permeability
and composition of Citru..5 leaf cuticles. II. Composition of soluble cutic
ular lipids and correlation with transport properties. Planta 1990, 180,
154-165.
llieley, G.; Collier, R.J.; Jones, ·n.M.; Eglinton, G. The biogeochemistry of
Ellesmere Lake, U .K.-I: source correlation of leaf wax inputs to the sed...
imentary lipid record. Org. Geochem. 1991, 17, 901-912.
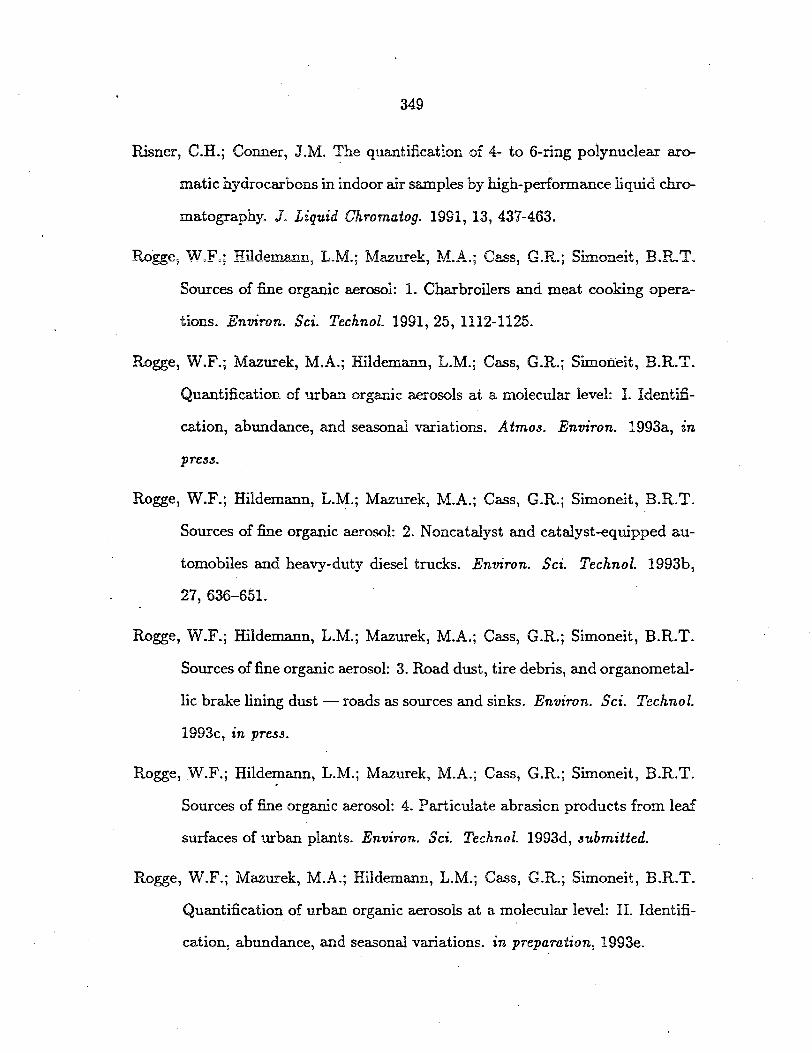
349
llisner, C.H.; Conner, J.M. The quantification of 4- to 6-ring polynuclear aro
matic hydrocarbons in indoor air samples by high-performance liquid chro
matography. J. Liquid Chromatog. 1991, 13, 437-463.
Rogge, W.F.; Hildernann; L.M.; Mazurek, M.A.; Cass, G.R.; Sim.oneit, B.R.T.
Sources of fine organic aerosol: 1. Charbroilers and meat cooking opera
tions. Environ. Sci. Technol. 1991, 25, 1112-1125.
Rogge, W.F.; Mazurek, M.A.; Hildemann, L.M.; Cass, G.R.; Simoneit, B.R.T.
Quantification of urban organic aerosols at a molecular level: I. Identifi
cation, abnndance, and seasonal variations. Atmos. Environ. 1993a, in
pre.s.s.
Rogge, W.F.; Hildemann, L.M.; Mazurek, M.A.; Cass, G.R.; Simoneit, B.R.T.
Sources of fine organic aerosol: 2. Noncatalyst and catalyst-equipped au
tomobiles and heavy-duty diesel trucks. Environ. Sci. Technol. 1993b,
27, 636-651.
Rogge, W.F.; Hildemann, L.M.; Mazurek, M.A.; Cass, G.R.; Simoneit, B.R.T.
Sources of fine organic aerosol: 3. Road dust, tire debris, and organometal
lic brake lining dust - roads as sources and sinks. Environ. Sci. Technol.
1993c, in press.
Rogge, W.F.; Hilde1;11ann, L.M.; Mazurek, M.A.; Cass, G.R.; Simoneit, B.R.T.
Sources of fine organic aerosol: 4. Particulate abrasion products from leaf
surfaces of urban plants. Environ. Sci. Technol. 1993d, .5ubmitted.
Rogge, W.F.; Mazurek, M.A.; Hildemann, L.M.; Cass, G.R.; Simoneit, B.R.T.
Quantification of urban organic aerosols at a molecular level: II. Identifi
cation, abnndance, and seasonal variations. in preparation, 1993e.

350
Rogge, W.F.; Hildemann, LM.; Mazurek, M.A.; Cass, G.R.; Simoneit, B.R.T.
Sources of fine organic aerosol: 5. Natural gas home appliances. Environ.
Sci. Technol. 1993f, 3ubmitted.
Rogge, W.R.; Hildemann, L.M.; Mazurek, M.A.; Cass, G.R.; Simoneit, B.R.T.
Sources of Fine Organic Aerosol: 9. Fireplace Wood Smoke. in preparo
tiof!., 1993g.
Sakuma, H.; Kusama, M.; Muankata, S.; Ohsumi, T.; Sugawara, S. The distribu
tion of cigarette smoke components between mainstream and sidestream
smoke. I. Acidic components. Beitr. Tabakfor3ch. 1983, 12, 63-71.
Sakuma, H.; Kusama, M.; Yamaguchi, K.; Matsuki, T.; Sugawara, S. The distri
bution of cigarette smoke components between mainstream and sidestream
smoke. III. Middle and higher boiling components. Beitr. Tabakforuh.
1984a, 12, 251-258.
Sakuma, H.; Kusama, M.; Yamaguchi, K.; Matsuki, T.; Sugawara, S. The distri
bution of cigarette smoke components between mainstream and sidestream
smoke. II. Bases. Beitr. Tabakfor3ch. 1984b, 12, 199-209.
Schmeltz, I.; De Paolis, A.; Hoffmann, D. Phytosterols in tobacco: quantitative
analysis and fate in tobacco combustion. Beitr. Tabakfor3ch. 1975, 8,
211-218.
Schmeltz, I.; Hoffmann, D. Nitrogen-containing compounds in tobacco and to
bacco smoke. Chem. Rev. 1977, 77, 295-.311.
Schmeltz, I.; Wenger, A.; Hoffmann, D.; Tso, T.C. Chemical studies on tobacco
smoke. 63. On the fate of nicotine dutjng pyrolysis and in a burning
cigarette. J. Agric. Food Chem. 1979, 27, 602-608.
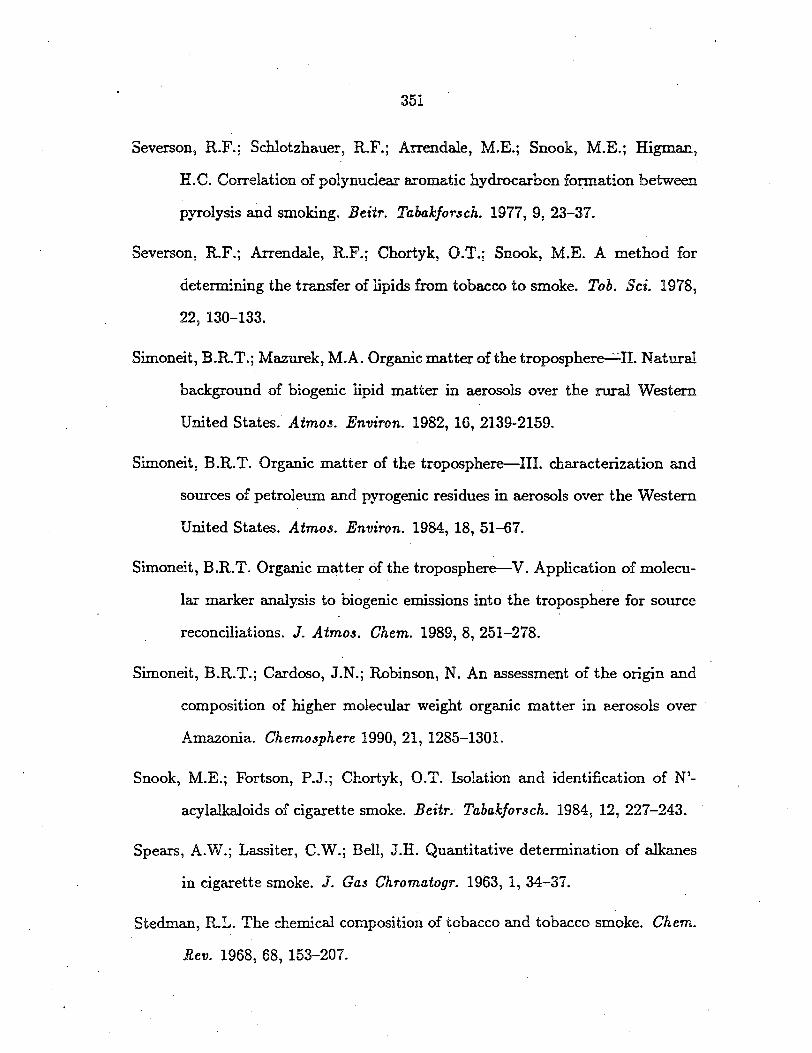
351
Severson, R.F.; Schlotzhauer, R.F.; Arrendale, M.E.; Snook, M.E.; Higman,
H.C. Correlation of polynuclear aromatic hydrocarbon formation between
pyrolysis and smoking. Beitr. Tabakforsch. 1977, 9, 23-37.
Severson, R.F.; Arrendale, R.F.; Chortyk, O.T.; Snook, M.E. A method for
determining the transfer of lipids from tobacco to smoke. Tob. Sci. 1978,
22, 130-133.
Simoneit, B.R.T.; Mazurek, M.A. Organic matter of the troposphe~II. Natural
background of biogenic lipid matter in aerosols over the :rural Western
United States. Atmos. Environ. 1982, 16, 2139-2159.
Simoneit, B.R.T. Organic matter of the troposphere-III. characterization and
sources of petroleum and pyrogenic residues in aerosols over the Western
United States. Atmo.5. Environ. 1984, 18, 51-67.
Simoneit, B.R.T. Organic matter of the troposphere-V. Application of molecu
lar marker analysis to biogenic emissions into the troposphere for source
reconciliations. J. Atmo3. Chem. 1989, 8, 251-278.
Simoneit, B.R.T.; Cardoso, J.N.; Robinson, N. An assessment of the origin and
composition of higher molecular weight organic matter in aerosols over
Amazonia. Chemo3phere 1990, 21, 1285-1301.
Snook, M.E.; Fortson, P.J.; Chortyk, 0.T. Isolation and identification of N'
acylalkaloids of cigarette smoke. Beitr. Tabakforsch. 1984, 12, 227-243.
Spears, A.W.; Lassiter, C.W.; Bell, J.H. Quantitative determination of alkanes
in cigarette smoke. J. Ga.., Chromatogr. 1963, 1, 34-37.
Stedman, R.L. The chemical composition of tobacco and tobacco smoke. Chem.
Rev. 1968, 68, 153-207.

352
Tang, H.; Richards, G.; Benner, C.L.; Tuominen, J.P.; Lee, M.L.; Lewis, E.A.;
Hansen, L.D.; Eatough, D.J. Solanesol: A tracer for environmental to
bacco smoke particles. Environ. Sci. Te.chnol. 1990, 24, 848-852.
Tissot, B.P.; Welte, D.H. In Petroleum Formation and Occurrence.: A New Ap
proach to Oil and Ga.3 Exploration, Springer Verlag, Berlin, 2nd ed., 1984,
699 pp.
Tornabene, T.G.; Morrison, S.J.; Kloos, W.E. Aliphatic hydrocarbon·contents of
various members of the family Micrococcaceae. Lipid., 1970, 5, 929-937.
U.S. Bureau of the Census, Statistical Abstract of the United States, 1991, (llPh
edition), Washington, DC, 1991, U.S. Government Printing Office, Wash
ington, DC 20402.
U.S. Dept. of Health and Human Services. Reducing the Health Consequences
of Smoking: 25 Years of Progress: A Report to the Surgeon General.
Washington, DC, 1989, DHHS publication (CDC) 89-8411.
Van Duuren, B.L.; Kosak, A.I. Isolation and identification of some components
of cigarette smoke condensate. J. Org. Chem. 1958, 23, 473--475.
Waldron, J.D.; Gowers, D.S.; Chibnall, A.C.; Piper, S.H. Further observations
on the paraffins and primary alcohols of plant waxes. J. Biochem. 1961,
78, 435--442.
Wynder, E.L.; Hoffmann, D. Eds. In Tobacco and Tobacco Smoke. Studie3 in
Experimental Carcinogene3~, New York, Academic Press, 1967, 365-371.

353
Winer, A.M.; Fitz, D.R.; Miller, P.R. Investigation of the Role of Natural Hydro
carbons in Photochemical Smog Formation in California. Final report to
the California Air Resources Board, Sacramento, CA, under Agreement
no. A0-056-032; Statewide Air Pollution Research Center, University of
California, CA., 1983.