· annual report _____ 2 c o n t e n t s company information ... financial summary 2016 2015 2014...
TRANSCRIPT

_______________________________________________________________________
1

Annual Report ___________________________________________________________
2
C O N T E N T S
COMPANY INFORMATION …………………………………..
3
MISSION ………………………………………………………..
4
NOTICE OF ANNUAL GENERAL MEETING ……………….
5-6
DIRECTORS’ REPORT ……………………………………….
7-8
FINANCIAL SUMMARY ……………………………………….
9
STATEMENT OF ETHICS AND BUSINESS PRACTICES..
10
AUDITORS’ REPORT TO THE MEMBERS …………………
11
BALANCE SHEET …………………………………………….
12-13
PROFIT AND LOSS ACCOUNT ……………………………..
14
STATEMENT OF COMPREHENSIVE INCOME …………..
15
CASH FLOW STATEMENT ………………………………….
16
STATEMENT OF CHANGES IN EQUITY ………………….
17
NOTES TO THE FINANCIAL STATEMENTS ………………
18-45
PATTERN OF SHAREHOLDING ………………………………….
46
FORM OF PROXY …………………………………………….

_______________________________________________________________________
3
COMPANY INFORMATION
CHIEF EXECUTIVE OFFICER : Mr. Muhammad Arshad Saeed BOARD OF DIRECTORS : Ch. Rahman Bakhsh
Mrs. Salma Aziz Mr. Muhammad Musharaf Khan Ms. Kiran A. Chaudhry
Mr. Kamran Ilyas Mr. Muhammad Ali Chaudhry
CHIEF FINANCIAL OFFICER : Mr. Muhammad Ali Chaudhry COMPANY SECRETARY : Mr. Muhammad Javed AUDITORS : M/s EY Ford Rhodes Chartered Accountants Lahore AUDIT COMMITTEE : Mr. Kamran Ilyas Chairman Mrs. Salma Aziz Member Mr. Muhammad Musharaf Khan Member HR - COMMITTEE : Mr. Kamran Ilyas Chairman Mr. Muhammad Ali Chaudhry Secretary Ms. Kiran A. Chaudhry Member BANKERS : National Bank of Pakistan Bank Alfalah Limited
Askari Bank LImited Al Baraka Bank (Pakistan) Ltd. Faysal Bank Limited SHARE REGISTRAR : Corplink (Pvt.) Ltd. LEGAL ADVISORS : Mr. Shaukat Haroon (Advocate) Barrister Salman Rahim (Advocate High Court) Yousaf Islam Associates REGISTERED OFFICE : 36-A, Lawrence Road, Lahore UAN : (042) 111-767-676 WEBSITE : www.reshamtextile.com
MILLS : 1.5 Kilometer Habibabad, Chunian Road, Tehsil Chunian, District Kasur.

Annual Report ___________________________________________________________
4
MISSION
The management is committed to excellence in operations with the aim of achieving
highest standards in product quality, customer satisfaction, Company growth, employees
welfare and social responsibilities and is constantly striving to meet these objectives.

_______________________________________________________________________
5
NOTICE OF ANNUAL GENERAL MEETING
Notice is hereby given that the 27th Annual General Meeting of the Shareholders of Resham Textile
Industries Limited will be held on Monday 31st October, 2016 at 10:00 a.m. at the Registered Office of the
Company i.e. 36-A Lawrence Road, Lahore to transact the following business.
A. Ordinary Business:
1. To confirm the minutes of the last Meeting.
2. To receive and adopt the audited accounts of the Company for the year ended 30 June 2016 and
reports of the Directors’ and Auditors’ thereon, as recommended by the Audit Committee.
3. To appoint auditors and fix their remuneration for the year ending June 30, 2017. The auditors M/s EY
Ford Rhodes, Chartered Accountants, Lahore retire and being eligible, offer themselves for reappointment.
Company is also inviting quotations from top ten chartered accountant firms on SBP panel for selection
of one firm on merit, expertise and cost.
B. Special Business:
Resolution for Amendments to Articles of Association
RESOLVED as Special resolution following amendments be and are hereby made, with or without
modification, to the Articles of Association of the Company:
a. First para of existing Article 47 of Articles of Association of the Company be substituted as following:
“A General Meeting, as its annual general Meeting, shall in accordance with the provisions of
Section 158 of the Ordinance be held once at least in every calendar year within a period of four
months following the close of its financial year and not more than fifteen months after the holding
of its last preceding annual general meeting.:”
b. First para of existing Article 110 of Articles of Association of the Company be substituted as
following:
“Once at least in every year the Directors shall lay before the Company in General Meeting a profit
and loss account for the period since the preceding account, made up to a date not more than four
months before such meeting.”

Annual Report ___________________________________________________________
6
STATEMENT UNDER SECTION 160 OF THE COMPANIES ORDINANCE, 1984
Articles 47 & 110 of Articles of Association of the company are proposed to be amended by the above
said resolution so as to bring the same in conformity with the requirements of the Companies
Ordinance, 1984.
4. To transact such other business as may be placed before the meeting with the permission of the Chair.
By Order of the Board
(Muhammad Javed)
Lahore: 08 October, 2016 Company Secretary
NOTES:
1. The Share Transfer Books of the Company will remain closed from 25 October 2016 to 31 October
2016 (both days inclusive).
2. A member entitled to attend and vote at the meeting may appoint another member of the Company
as a proxy to attend and vote instead of him. A proxy form duly signed and stamped must be
deposited at the Registered Office of the Company not less than 48 hours before the time fixed for
holding the meeting.
3. Account holders and sub-account holders, holding book entry securities of the Company in CDS of
Central Depository Co. of Pakistan Ltd., who wish to attend the Annual General Meeting are
requested to please bring original National Identity Card with copy thereof duly attested by their
Bankers for identification purpose.
4. In case of corporate entity, the Board of Directors resolution / power of attorney with specimen
signature shall be submitted (unless it has been provided earlier) along with proxy form of the
Company.
5. Members who have not submitted copy of valid CNIC are once again advised to submit the same
without further delay to ensure compliance with the Securities and Exchange Commission of
Pakistan (SECP) Notification S.R.O. 19(I)/2014 dated January 10, 2014 read with Notification
S.R.O. 831(I)/2012 dated July 5, 2012.
6. The financial statements for the year ended June 30, 2016 shall be uploaded on the Company's
website as soon as the same are approved by the Board of Directors i.e October 8, 2016.
7. Shareholders are requested to promptly notify the company of any change in their address, if any.

_______________________________________________________________________
7
DIRECTORS’ REPORT
It is my pleasure to present the Directors’ Report and the audited accounts for the year ended June 30, 2016. Performance Review
The year under review was a very difficult year. While sales at Rs.3,132,476,189 decreased by nominal 7.75% as compared with Rs.3,395,806,830 (s.p.l.y.) and cost of sales also declined by 4.10% to Rs.3,019,779,907 from Rs.3,148,835,353 (s.p.l.y.), the gross profit decreased significantly to Rs.112,696,282 as compared to Rs.246,971,477 (s.p.l.y.) by 54.37%. It was primarily on account of lower demand for yarn due to which the production of yarn decreased to 13,842,874 kgs as compared to 14,025,493 kgs of yarn produced previous year (1.3%) on account of dumping of Indian yarn and fabric through legal and illegal routes and production capacity of mill could not be used to the full. Administrative expenses increased to Rs.53,624,523 from Rs.48,708,987 (s.p.ly.) by 10.09% due to mandatory increase in salaries and company’s policy of honest implementation of laws. On account of better and micro management, other operating expenses reduced to Rs.2,405,871 from Rs.12,287,790 (s.p.l.y.) i.e. by 80.42%.
Moreover, due to a more efficient procurement of raw material and injection of interest free Directors’ loan, financial cost decreased by 36.7% to Rs.22,805,351 from Rs.36,029,698 (s.p.l.y.). However, the profit before taxation decreased by 87.42% to Rs.17,395,588 from Rs.138,316,060 (s.p.l.y.) and the end result profit after tax to Rs.3,354,205 from Rs.103,246,188 (s.p.l.y.) by 96.75%.
Arbitrary and unjust taxation laws and increase in RLNG prices, major failure of cotton crop, dumping of Indian yarn and other cotton and polyester products and unfriendly policies of the Government despite protests and advertisements by APTMA, the situation worsened. A number of good mills have been closed down and if the present policies are continued, the day is not far when country will become net importer of yarn and other cotton products as the entire cotton chain particularly the growers are under a lot of pressure due to step motherly attitude of Government and most of them are now switching over to other crops such as maize while India is subsidizing their growers and also facilitating exporters of yarn and other goods. With the trade balance heavily in favour of India, our Government is doing nothing for reasons not-understandable to counter the potential threat and disaster for country’s economy specially for the poor and once the industry is shut down there will be no need of load shedding because there will be no users of electricity and gas and the money spent on new power and other mega projects will become a liability for the nation, particularly in view of the external loans on which these are being built.
The effects of global warming, unpredicted rains and floods, effects of various kinds of pest attacks, change in temperatures and other factors also need to be looked at by Agriculture University, NIAB, Pakistan Agriculture Research Council and Ministry of Food and Agriculture, to whom copies of this report are being sent. It is also strange that our Agriculture, which has maximum input/output ratio everywhere in the world, is still in cave age while advanced countries such as Holland, Germany, Australia and New Zealand export Agriculture products such as milk and its products worldwide. It is a matter of shame for the nation and institutions working with Agriculture. If we can ensure turn around in Agriculture the destiny of the country and poor as also lower middle class would change but the vested interests would not want it. Agriculture must also be a mandatory subject in primary and secondary education. It is painful to see that Pakistan, which was exporting cotton to India in early 90’s, has become an importer of cotton and most of

Annual Report ___________________________________________________________
8
the industrialists who are successful to some extent are big groups and it is likely that cartels would emerge just like cement, power, sugar and other industries and the smaller entities will disappear or die their own death.
The good news for the shareholders is the start of new division namely Garment Division and its brand ANAYA by Kiran Chaudhry is making good progress and the demand cannot be met. Towards further cost cutting the company stands delisted w.e.f. 6 September 2016. It is not understandable that electricity units produced at the cost of Rs. 4 are being sold to the consumers upto Rs.18.71 and in some cases more than this and taxation laws are also arbitrary and unjust and mainly fleecing the honest tax payers who will be forced to shut down operations and the Indian dreams will be fulfilled particularly our Nation having become addicted to consumerism. Let’s hope and pray that day does not come, Ameen The financial results in tabulated form are given below and details may be perused in other sections of this report:-
2016 2015
Rupees('000)
Sales-net 3,132,476 3,395,806
Cost of sales 3,019,780 3,148,835
Gross profit 112,696 246,971
Distribution cost 21,847 19,255
Administrative expenses 53,625 48,709
Other operating expenses 2,406 12,288
77,878 80,252
Operating profit 34,818 166,721
Other income 5,382 7,626
40,200 174,345
Finance cost 22,805 36,029
Profit before taxation 17,395 138,316
Taxation 14,041 35,070
Profit after taxation 3,354 103,246
Earnings per share - basic and diluted (Rupees) 0.09 2.87
Acknowledgements The Directors take this opportunity to thank the Company’s Bankers, particularly National Bank of Pakistan, Bank Alfalah Limited, NIB bank Limited, Faysal Bank Limited, Al Baraka Bank (Pakistan) Limited and other financial Institutions for their confidence in the Company and strong financial support. The Directors would also like to particularly mention the dedication and devotion displayed by the employees in performing their duties.
For and on behalf of the Board Lahore: 08 October, 2016 Muhammad Arshad Saeed (Chief Executive Officer)

_______________________________________________________________________
9
Financial Summary
2016 2015 2014 2013 2012 2011
BALANCE SHEET
(Rupees in thousand)
Paid up Share Capital 360,000 360,000 360,000 360,000 360,000 360,000
Un-appropriated Profit 535,330 539,159 446,894 376,336 203,967 154,507
Total Equity 895,330 899,159 806,894 736,336 563,967 514,507
Surplus on Revaluation of Fixed Assets 218,156 236,394 257,360 132,850 144,907 156,914
Long Term Liabilities - - - - 120,184 166,327
Liabilities against assets subject to finance lease
- - - - - 30,325
Deferred Liabilities 280,672 296,914 316,511 257,398 236,588 210,580
Long Term Advances 76 131 235 389 269 143
Current Liabilities 207,974 326,909 436,630 672,317 275,740 487,665
1,602,208 1,759,507 1,817,630 1,799,290 1,341,655 1,566,461
Represented by:
Fixed Assets 1,156,630 1,218,378 1,289,573 1,019,514 893,579 925,417
Capital work in progress 2,526 5,746 3,669 1,420 8,431 -
Other Assets 3,698 3,698 3,698 3,678 3,669 3,667
Current Assets 439,354 531,685 520,690 774,678 435,976 637,377
1,602,208 1,759,507 1,817,630 1,799,290 1,341,655 1,566,461
PROFIT AND LOSS
Sales 3,132,476 3,395,806 4,051,203 3,501,701 3,245,032 3,704,951
Cost of Sales 3,019,780 3,148,835 3,775,254 2,994,130 2,867,911 3,409,780
Gross Profit 112,696 246,971 275,948 507,571 377,121 295,171
Operating Profit 40,200 166,721 194,539 410,689 318,221 249,585
Profit Before Taxation 17,395 138,316 140,176 349,455 232,531 142,334
Profit After Taxation 3,354 103,246 90,901 251,079 147,927 65,792
EPS 0.09 2.87 2.53 6.97 4.11 1.83
Dividend % - 12 15 20 20 15
PERCENTAGE TO SALES
Gross Profit % age 3.60 7.27 6.81 14.49 11.62 7.97
Profit Before Taxation % age 0.56 4.07 3.46 9.98 7.17 3.84
Profit After Taxation % age 0.11 3.04 2.24 7.17 4.56 1.78
Admin & Selling Expenses % age 2.41 2.05 1.71 2.07 1.82 1.23

Annual Report ___________________________________________________________
10
STATEMENT OF ETHICS AND BUSINESS PRACTICES
This Statement of Ethics and Business Practices is intended to document the principles of conduct and ethics to be followed by Resham Textile Industries Limited (the "Company") and its employees, officers and directors. Its purpose is to promote honest and ethical conduct, including the ethical handling of actual or apparent conflicts of interest. CONFLICTS OF INTEREST - Directors, officers and employees of the Company shall act at all times honestly and ethically, and shall avoid situations where their personal or outside business interests could conflict with the interests of the Company and its shareholders. DEALING WITH BUSINESS PARTNERS - All purchases of goods and services by the Company will be made exclusively on the basis of price, quality, service and suitability to the Company's needs and in the interest of the Company alone. Directors, officers and employees are prohibited from accepting gifts from sellers or buyers in any form whatsoever. DISCLOSURE - Each senior executive officer must provide full, fair, accurate and understandable information whenever communicating with the Company's stockholders or the general public. COMPLIANCE WITH LAWS, RULES AND REGULATIONS - All directors, officers and employees must conduct Company business in compliance with all applicable laws, rules and regulations. HEALTH, SAFETY, AND ENVIRONMENTAL PROTECTION - It is the Company's policy to ensure the safety of its employees, be extra careful in protecting Company property from fire and other hazards, and to maintain the state of environment. REPORTING OF VIOLATIONS - It is each employee's responsibility to notify promptly his or her supervisor regarding any actual or potential violation of this Code and any applicable laws, rules and regulations by anyone in the Company. FAIR DEALING - It is our policy that each director, officer and employee will endeavor to deal fairly with the Company's customers, suppliers, competitors and employees. CONFIDENTIALITY - All directors, officers and employees are prohibited from revealing confidential information of the Company acquired by virtue of their association with the Company or in any other manner, disclosure of which may hurt the interests of the Company. This does not apply to disclosures required by laws, rules and regulations. PROPER USE OF COMPANY ASSETS - All Directors, officers and employees should protect the Company's assets and ensure their efficient use. Employees must not participate in, or arrange, any activity that is not commensurate with Company interests.

_______________________________________________________________________
11
AUDITOR’S REPORT TO THE MEMBERS We have audited the annexed balance sheet of Resham Textile Industries Limited (“the Company”) as on 30 June 2016 and the related profit and loss account, statement of comprehensive income, cash flow statement and statement of changes in equity together with the notes forming part thereof, for the year then ended and we state that we have obtained all the information and explanations which, to the best of our knowledge and belief, were necessary for the purpose of our audit. It is the responsibility of the Company’s management to establish and maintain a system of internal control and prepare and present the above said statements in conformity with the approved accounting standards and the requirements of Companies Ordinance, 1984. Our responsibility is to express an opinion on these statements based on our audit. We conducted our audit in accordance with the auditing standards as applicable in Pakistan. These standards require that we plan and perform the audit to obtain reasonable assurance about whether the above said statements are free of any material misstatement. An audit includes, examining on a test basis, evidence supporting the amounts and disclosures in the above said statements. An audit also includes assessing the accounting policies and significant estimates made by the management, as well as, evaluating the overall presentation of the above said statements. We believe that our audit provides a reasonable basis for our opinion and, after due verification, we report that: a) in our opinion, proper books of accounts have been kept by the Company as required by the
Companies Ordinance, 1984;
b) in our opinion;
i) the balance sheet and profit and loss account together with the notes thereon have been drawn up in conformity with the Companies Ordinance, 1984, and are in agreement with the books of account and are further in accordance with accounting policies consistently applied except for the changes as stated in Note 2.2 of these financial statements, with which we concur;.
ii) the expenditure incurred during the year was for the purpose of the Company’s business; and
iii) the business conducted, investments made and the expenditure incurred during the year were in accordance with the objects of the Company;
c) in our opinion and to the best of our information and according to the explanations given to us, the
balance sheet, profit and loss account, statement of comprehensive income, cash flow statement and statement of changes in equity together with the notes forming part thereof conform with approved accounting standards as applicable in Pakistan, and, give the information required by the Companies Ordinance, 1984 in the manner so required and respectively give a true and fair view of the state of the Company's affairs as at 30 June 2016 and of the profit, comprehensive income, its cash flows and changes in equity for the year then ended; and
d) in our opinion, Zakat deductible at source under the Zakat and Ushr Ordinance, 1980 (XVIII of 1980), was deducted by the Company and deposited in the Central Zakat Fund established under section 7 of that Ordinance. (EY FORD RHODES) CHARTERED ACCOUNTANTS Audit Engagement Partner: Naseem Akbar Lahore: 08 October, 2016

Annual Report _____________________________________________________________________________
BALANCE SHEET AS
2016 2015
EQUITY AND LIABILITIES Note Rupees Rupees
Share capital and reserves
Authorized share capital
36,000,000 (2015: 36,000,000) ordinary shares
of Rs. 10/- each360,000,000 360,000,000
Issued, subscribed and paid up share capital 5 360,000,000 360,000,000
Unappropriated profit 535,329,811 539,159,162
Total equity 895,329,811 899,159,162
Surplus on revaluation of fixed assets 6 218,156,350 236,393,980
Non-current liabilities
Long term deposits 7 75,548 130,748
Deferred liabilities 8 280,671,949 296,914,442
280,747,497 297,045,190
Current liabilities
Trade and other payables 9 106,476,149 178,718,547
Balances with statutory authorities 10 8,242,614 1,641,270
Mark-up accrued on short term borrowings 4,478,124 5,153,641
Short term borrowings 11 28,579,472 55,745,482
Provision for taxation 60,197,535 85,649,670
207,973,894 326,908,610
Total liabilities 488,721,391 623,953,800
TOTAL EQUITY AND LIABILITIES 1,602,207,552 1,759,506,942
CONTINGENCIES AND COMMITMENTS 12 - -
The annexed notes from 1 to 39 form an integral part of these financial statements.
(Chief Executive Officer)
12

__________________________________________________________________
AT 30 JUNE 2016
2016 2015
ASSETS Note Rupees Rupees
Non-current assets
Property, plant and equipment 13 1,159,156,289 1,224,124,423
Long term deposits 14 3,697,560 3,697,560
1,162,853,849 1,227,821,983
Current assets
Stores and spare parts 15 43,893,393 37,360,227
Stock in trade 16 259,590,878 270,966,529
Trade debts 17 76,128,783 115,572,506
Advances 18 4,261,254 2,532,386
Trade deposits and short
term prepayments 19 3,461,513 2,377,508
Advance income tax 27,377,815 63,455,130
Cash and bank balances 20 24,640,067 39,420,673
439,353,703 531,684,959
TOTAL ASSETS 1,602,207,552 1,759,506,942
(Director)
13

Annual Report _____________________________________________________________________________
2016 2015
Note Rupees Rupees
Sales 21 3,132,476,189 3,395,806,830
Cost of sales 22 3,019,779,907 3,148,835,353
Gross profit 112,696,282 246,971,477
Distribution cost 23 21,847,060 19,255,123
Administrative expenses 24 53,624,523 48,708,987
Other operating expenses 25 2,405,871 12,287,790
77,877,454 80,251,900
Other income 26 5,382,111 7,626,181
Operating profit 40,200,939 174,345,758
Finance costs 27 22,805,351 36,029,698
Profit before taxation 17,395,588 138,316,060
Taxation 28 14,041,383 35,069,872
Profit for the year 3,354,205 103,246,188
Earnings per share - basic and diluted (Rupees) 29 0.09 2.87
The annexed notes from 1 to 39 form an integral part of these financial statements.
(Chief Executive Officer) (Director)
PROFIT AND LOSS ACCOUNT
FOR THE YEAR ENDED 30 JUNE 2016
14

__________________________________________________________________
2016 2015
Rupees Rupees
Profit for the year 3,354,205 103,246,188
Other comprehensive income:
Items to be reclassified to profit or loss in subsequent periods - -
Items not to be reclassified to profit or loss in subsequent periods:
18,016,444 23,396,171
Actuarial gain on defined benefit plans - net of deferred tax - 1,623,024
Total other comprehensive income - net of deferred tax 18,016,444 25,019,195
Total comprehensive income for the year 21,370,649 128,265,383
The annexed notes from 1 to 39 form an integral part of these financial statements.
(Chief Executive Officer)
Transfer from surplus on revaluation of fixed assets on
account of incremental depreciation - net of deferred tax
(Director)
STATEMENT OF COMPREHENSIVE INCOMEFOR THE YEAR ENDED 30 JUNE 2016
15

______________________________________________________________________________________
2016 2015
CASH GENERATED FROM OPERATING ACTIVITIES Note Rupees Rupees
Profit before taxation 17,395,588 138,316,060
Adjustments for non-cash items:
Depreciation 73,498,054 80,864,363
(Gain) / Loss on disposal of property, plant and equipment (1,136,785) 756,123
Provision for gratuity 16,419,665 17,711,165
Finance costs 22,805,351 36,029,698
Profit on bank deposits (2,521,239) (640,912)
Creditors written back (27,000) (21,393)
Provision for Workers' Welfare fund 1,415,798 4,039,281
Provision for Workers' Profit Participation Fund 990,073 7,492,386
111,443,917 146,230,711
Cash flows from operating activities before working capital changes 128,839,505 284,546,771
Working capital changes
(Increase) / decrease in current assets:
Stores and spare parts (6,533,166) 282,499
Stock in trade 11,375,651 (2,512,079)
Trade debts 39,443,723 (13,764,601)
Advances (1,728,868) 3,719,786
Trade deposits and short term prepayments (1,084,005) 992,496
Increase / (decrease) in current liabilities:
Balances with statutory authorities 6,601,344 3,296,890
Trade and other payables (67,128,883) (19,660,036)
(19,054,204) (27,645,045)
Cash generated from operations 109,785,301 256,901,726
Finance cost paid (23,480,868) (44,469,178)
Workers' profit participation fund paid (7,492,386) (7,951,817)
Income tax paid (23,335,947) (59,470,141)
Gratuity paid (12,742,414) (10,751,928)
Net cash generated from operating activities 42,733,686 134,258,662
CASH FLOWS FROM INVESTING ACTIVITIES
Capital expenditure incurred (10,542,725) (16,171,620)
Profit on bank deposits 2,521,239 640,912
Proceeds from disposal of property, plant and equipment 2,928,404 3,669,127
Net cash used in investing activities (5,093,082) (11,861,581)
CASH FLOWS FROM FINANCING ACTIVITIES
Decrease in short term borrowings - net (27,166,010) (89,010,126)
Dividend paid (25,200,000) (36,267,275)
Decrease in long term deposits (55,200) (104,693)
Net cash used in financing activities (52,421,210) (125,382,094)
Net decrease in cash and cash equivalents (14,780,606) (2,985,013)
Cash and cash equivalents at the beginning of the year 39,420,673 42,405,686
Cash and cash equivalents at the end of the year (20) 24,640,067 39,420,673
The annexed notes from 1 to 39 form an integral part of these financial statements.
(Chief Executive Officer) (Director)
CASH FLOW STATEMENT
FOR THE YEAR ENDED 30 JUNE 2016
16
Annual Report _____________________________________________________________________________
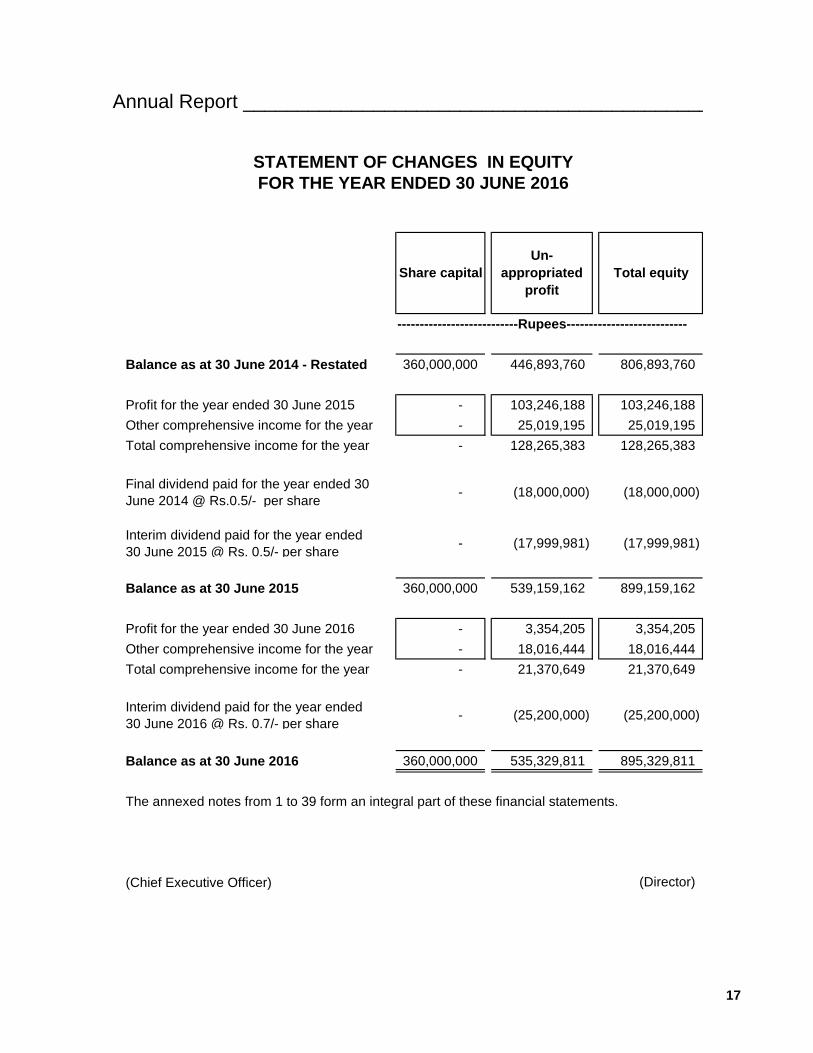
---------------------------Rupees---------------------------
Balance as at 30 June 2014 - Restated 360,000,000 446,893,760 806,893,760
Profit for the year ended 30 June 2015 - 103,246,188 103,246,188
Other comprehensive income for the year - 25,019,195 25,019,195
Total comprehensive income for the year - 128,265,383 128,265,383
Final dividend paid for the year ended 30
June 2014 @ Rs.0.5/- per share- (18,000,000) (18,000,000)
Interim dividend paid for the year ended
30 June 2015 @ Rs. 0.5/- per share- (17,999,981) (17,999,981)
Balance as at 30 June 2015 360,000,000 539,159,162 899,159,162
Profit for the year ended 30 June 2016 - 3,354,205 3,354,205
Other comprehensive income for the year - 18,016,444 18,016,444
Total comprehensive income for the year - 21,370,649 21,370,649
Interim dividend paid for the year ended
30 June 2016 @ Rs. 0.7/- per share- (25,200,000) (25,200,000)
Balance as at 30 June 2016 360,000,000 535,329,811 895,329,811
The annexed notes from 1 to 39 form an integral part of these financial statements.
(Chief Executive Officer)
Share capital
Un-
appropriated
profit
Total equity
(Director)
STATEMENT OF CHANGES IN EQUITY
FOR THE YEAR ENDED 30 JUNE 2016
17

Annual Report _____________________________________________________________________________
1. THE COMPANY AND ITS OPERATIONS
1.1
1.2
2. STATEMENT OF COMPLIANCE
2.1
2.2 New, amended standards and interpretations become effective
IFRS 12 – Disclosure of Interests in Other Entities
Improvements to Accounting Standards Issued by the IASB
18
The Company has adopted the following revised standard, amendments and interpretation
of IFRSs which became effective for the current year:
NOTES TO THE FINANCIAL STATEMENTSFOR THE YEAR ENDED 30 JUNE 2016
Resham Textile Industries Limited (the Company) is a public limited company incorporated
in Pakistan on 06 June 1990 under the Companies Ordinance, 1984. The registered office
of the Company is situated at 36 - A, Lawrence Road, Lahore. The Company is principally
engaged in the business of manufacturing and selling of yarn.
The Company was listed on Pakistan Stock Exchange Limited (PSX) (formerly Karachi
Stock Exchange, in which the Lahore and Islamabad Stock Exchanges have merged).
However, the Board of Directors of the Company in its meeting held on February 25, 2016
decided to voluntarily delist the Company from PSX. The purchase price of Rs. 51.02/- per
share was approved by the PSX, which was also agreed by the shareholders in the Extra-
Ordinary General Meeting, held on May 04, 2016. Resultantly, the Company was delisted
from PSX with effect from September 6, 2016. In accordance with letter NO.
EMD/233/177/02-308 dated September 21, 2016 from SECP, financial statements for the
year ended June 30, 2016 has been prepared as a public non listed Company.
These financial statements of the company have been prepared in accordance with
approved accounting standards as applicable in Pakistan. Approved accounting standards
comprise of such International Financial Reporting Standards (IFRS) issued by the
International Accounting Standards Board (IASB) and Islamic financial accounting
standards (IFAS) issued by Institute of Chartered Accountants of Pakistan (ICAP) as are
notified under the Companies Ordinance, 1984, provisions of and directives issued under
the Companies Ordinance, 1984. Whenever, the requirements of the Companies
Ordinance, 1984 or directives issued by the Securities and Exchange Commission of
Pakistan (SECP) differ with the requirement of these standards, the requirements of
Companies Ordinance, 1984 or the requirements of the said directives take precedence.
IFRS 10 – Consolidated Financial Statements
IFRS 11 – Joint Arrangements
IFRS 13 – Fair Value Measurement
IAS 27 – Separate Financial Statements – (Amended)
IAS 28 – Investment in Associates and Joint Ventures – (Amended)
The adoption of the above accounting standards did not have any effect on the financial
statements.

____________________________________________________________________
3. BASIS OF MEASUREMENT
3.1 Basis of preparation
3.2 Presentation currency
3.3 Critical accounting estimates and judgments
- Employee benefits (Note 4.4);
- Taxation (Note 4.7);
- Provisions (Note 4.5);
- Useful lives and residual value of property, plant and equipment (Note 4.10);
- Impairment (Note 4.16)
4. SUMMARY OF SIGNIFICANT ACCOUNTING POLICIES
4.1 Surplus on revaluation of fixed assets
19
These financial statements have been prepared under the historical cost convention, except
for recognition of certain employee benefits at present value and certain items of property,
plant and equipment which are measured at revalued amounts.
The preparation of financial statements in conformity with the approved accounting
standards requires the use of certain critical accounting estimates. It also requires the
management to exercise its judgment in the process of applying the Company's accounting
policies. Estimates and judgments are continually evaluated and are based on historical
experience, including expectation of future events that are believed to be reasonable under
the circumstances. The areas where various assumptions and estimates are significant to
the Company's financial statements or where judgments were exercised in application of
accounting policies are as follows:
The accounting policies adopted in the preparation of these financial statements are
consistent with those of the previous financial year.
This represents the surplus arising on the revaluation of operating property, plant and
equipment of the Company. Revaluation surplus is credited to the "surplus on revaluation of
fixed assets" presented below equity (in accordance with the requirements of the section
235 of companies ordinance, 1984) except to the extent that it reverses a revaluation
decrease of the same asset previously recognized in profit and loss account. An annual
transfer from the surplus on revaluation of property, plant and equipment (net of deferred
tax) through other comprehensive income is made for the difference between depreciation
based on the revalued carrying amount of the assets and depreciation based on the assets'
original cost. Additionally, accumulated depreciation as at the revaluation date is eliminated
against the gross carrying amount of the asset and the net amount is restated to the
revalued amount of the asset.
These financial statements are presented in Pak Rupee, which is the Company's functional
currency.

Annual Report _____________________________________________________________________________
i) to the extent actually realized on disposal of the assets which are revalued;
ii) to the extent of incremental depreciation arising out of revaluation of property, plant and equipment; or
iii)
4.2 Interest bearing loans and borrowings
4.3 Ijarah assets
4.4 Employee benefits
4.5 Provisions
4.6 Dividend
4.7 Taxation
Current
20
setting-off or in diminution of any deficit arising from the revaluation of any other
property, plant and equipment of the Company.
This surplus is not free for setting-off or reducing any deficit of the Company. However, it
can only be utilized:
All loans and borrowings are initially recognized at the fair value of the amount received
less directly attributable transaction costs. After initial recognition, long term interest-bearing
loans and borrowings are measured at amortized cost using the effective interest method
while short term borrowings are measured at fair value. Gains and losses are recognized in
profit and loss account when the liabilities are derecognized as well as through the
amortization process.
The Company recognizes ijarah payments under an ijarah agreement as an expense in the
profit and loss account on a straight line basis over the ijarah term.
The Company operates an unfunded gratuity scheme for its permanent employees. The
latest valuation was carried out as at 30 June 2015 using the projected unit credit method.
The future contribution rates of this plan include allowances for deficit and surplus.
Provisions are recognized in the balance sheet when the Company has legal or
constructive obligation as a result of past events, it is probable that outflow of economic
benefits will be required to settle the obligation and a reliable estimate of the amount can be
made. However, provisions are reviewed at each balance sheet date and adjusted to reflect
current best estimate.
Dividend distribution to the Company's shareholders and appropriation to reserve are
recognized in the period in which these are approved.
Provision for current tax is based on taxable income for the year determined in accordance
with the prevailing law for taxation of income. The charge for current tax is calculated using
current rate of tax after taking into account rebates and tax credits, if any. The charge for
current tax also includes adjustments, where considered necessary, to provision for tax
made in previous years arising from assessments framed during the year for such years.

____________________________________________________________________
Deferred
4.8 Trade and other payables
4.9 Operating segments
4.10 Property, plant and equipment
4.10.1 Operating fixed assets and depreciation
a) Cost
21
Operating fixed assets except land, building and plant and machinery are stated at cost less
accumulated depreciation and accumulated impairment losses, if any. Such cost includes
the cost of replacing a part of such assets when that cost is incurred if the recognition
criteria are met. Building and plant and machinery are stated at revalued amount less
accumulated depreciation and accumulated impairment losses if any, while land is stated at
revalued amount. Capital work in progress is stated at cost less accumulated impairment
losses, if any.
Subsequent costs are included in the asset's carrying amount or recognized as a separate
asset, as appropriate, only when it is probable that future economic benefits associated with
the item will flow to the Company and the cost of the item can be measured reliably. All
other repair and maintenance costs are charged to profit and loss account during the year in
which they are incurred.
Operating segments are reported in a manner consistent with the internal reporting
provided to the chief operating decision maker. The chief operating decision maker, who is
responsible for allocating resources and assessing performance of the operating segments,
has been identified as the Board of Directors that makes strategic decisions. The Board of
Directors has determined that the Company has two reportable segments namely Yarn and
Garments Division.
Deferred tax is accounted for by using the liability method on all timing differences between
carrying amounts of assets and liabilities in the financial statements and their tax base.
Deferred tax liabilities are recognized for all taxable temporary differences. The Company
recognizes deferred tax assets on all deductible temporary differences to the extent it is
probable that future taxable profits will be available against which these deductible
temporary differences can be utilized.
Deferred tax asset is also recognized for the carry forward of unused tax losses and unused
tax credits to the extent it is probable that future taxable profits will be available against
which the unused tax losses and unused tax credits can be utilized. Deferred tax is charged
to / credited in the profit and loss account except in case of items credited or charged to
other comprehensive income.
The carrying amount of all deferred tax assets is reviewed at each balance sheet date and
adjusted to the appropriate extent, if it is no longer probable that sufficient taxable profits
will be available to allow all or part of the deferred tax assets to be utilized.
Deferred tax assets and liabilities are measured at the tax rates that are expected to apply
to the year when the asset is realized or liability is settled, based on the tax rates that have
been enacted or substantively enacted at the balance sheet date.
Liabilities for trade and other amounts payable are initially recognized at fair value which is
normally the transaction cost.

Annual Report _____________________________________________________________________________
b) Depreciation
c) Derecognition
4.11 Stores and spare parts
4.12 Stock in trade
Raw material -
Raw material in transit - Invoice value plus other charges paid thereon
Packing material Moving average
Work in process - Average manufacturing cost
Finished goods - Average manufacturing cost
Waste - Net realizable value
22
The carrying values of plant and equipment are reviewed for impairment when events or
changes in circumstances indicate that the carrying value may not be recoverable.
Depreciation is charged to profit and loss account on reducing balance method to write off
the cost of operating fixed assets less their residual values over their expected useful lives
at the rates mentioned in Note 14.1 to these financial statements.
Depreciation on assets is charged from the month in which an asset is acquired while no
depreciation is charged for the month in which the asset is disposed off.
The assets’ residual values, useful lives and methods of depreciation are reviewed, and
adjusted if appropriate, at each financial year end.
An item of property, plant and equipment is derecognized upon disposal or when no future
economic benefits are expected from its use or disposal. Any gain or loss arising on
derecognition of the asset (calculated as the difference between the net disposal proceeds
and carrying amount of the asset) is included in profit and loss account in the year the asset
is derecognized.
These are valued at lower of moving average cost and net realizable value. Items in transit
are valued at cost comprising invoice value plus other charges paid thereon. Provision is
made for slow moving items based on management estimate.
First in first out (FIFO) i.e. the cost of raw material reported on the
balance sheet represents the cost of the raw material most
recently purchased.
Average manufacturing cost in relation to work in process and finished goods signifies cost
including a portion of related direct overheads.
Net realizable value signifies the estimated selling price in the ordinary course of business
less costs necessary to be incurred in order to make such sale.
These are valued at lower of cost and net realizable value. Basis of determining cost is as
follows:

____________________________________________________________________
4.13 Trade debts
4.14 Cash and cash equivalents
4.15 Financial assets and liabilities
4.16 Impairment
23
Financial assets are derecognized when the Company loses control of the contractual rights
that comprise the financial asset. The Company loses such control if it realizes the rights to
benefits specified in contract, the rights expire or the Company surrenders those rights.
Financial liabilities are derecognized when the obligation specified in the contract is
discharged, cancelled or expired.
Trade debts originated by the Company are recognized and carried at original invoice
amount less an allowance for any uncollectible amounts. Specific bad debts are written off
and provision is made against debts considered doubtful when collection of the full amount
is no longer probable.
Cash and cash equivalents comprise cash in hand, cash at banks in current and deposit
accounts and other short term highly liquid instruments that are readily convertible into
known amounts of cash and which are subject to an insignificant risk of changes in value.
Financial assets and liabilities comprise long term deposits, trade debts, other receivables,
cash and bank balances, long term financing, short term borrowings and trade and other
payables.
Financial assets and liabilities are recognized at the time the Company becomes a party to
contractual provisions of the instruments.
The particular recognition methods adopted are disclosed in the individual policy statements
associated with each item.
Financial assets and liabilities are offset when the Company has a legally enforceable right
to offset and intends to settle either on a net basis or to realize the asset and settle the
liability simultaneously.
The carrying amounts of the Company's assets are reviewed at each balance sheet date to
determine whether there is any indication of impairment. If such indication exists, the
recoverable amount of such asset is estimated. An impairment loss is recognized wherever
the carrying amount of the asset exceeds its recoverable amount. Impairment losses are
recognized in profit and loss account. A previously recognized impairment loss is reversed
only if there has been a change in the estimates used to determine the asset's recoverable
amount since the last impairment loss was recognized. If that is the case, the carrying
amount of the asset is increased to its recoverable amount. That increased amount cannot
exceed the carrying amount that would have been determined, net of depreciation, had no
impairment loss been recognized for the asset in prior years. Such reversal is recognized in
profit and loss account.

Annual Report _____________________________________________________________________________
4.17 Revenue recognition
a) Sale of goods
b) Interest income
4.18 Borrowing costs
4.19 Foreign currencies
4.20 Related party transactions
4.21
Standard or Interpretation
24
beginning on or after)
Revenue is recognized when the significant risks and rewards of ownership of the goods
have passed to the buyer which generally coincides with the delivery of goods to
customers. Export goods are considered dispatched when shipped on board.
Profit on bank deposit is recognized when accrued.
Borrowing costs directly attributable to the acquisition, construction or production of
qualifying assets, which are assets that necessarily take a substantial period of time to get
ready for their intended use or sale, are added to the cost of those assets, until such time as
the assets are substantially ready for their intended use or sale. All other borrowing costs
are charged to profit and loss account whenever incurred.
Transactions in foreign currency are initially recorded in the functional currency at the rate
prevailing at the date of transaction. Monetary assets and liabilities denominated in foreign
currencies are retranslated at functional currency rate of exchange prevailing at the balance
sheet date. All differences are taken to the profit and loss account.
Transactions and contracts with related parties are carried out at arms length prices
determined in accordance with comparable uncontrolled price method. Parties are said to
be related if they are able to influence the operating and financial decisions of the Company
and vice versa.
Standards, interpretations and amendments to published approved accounting
standards that are not yet effective
The following standards, amendments and interpretations with respect to the approved
accounting standards as applicable in Pakistan would be effective from the dates
mentioned below against the respective standard or interpretation:
Effective date
(accounting periods
01 January 2018IFRS 2 Share-based Payments – Classification and
Measurement of Share-based Payments Transactions
(Amendments)

____________________________________________________________________
Standard
25
IFRS 10 Consolidated Financial Statements, IFRS 12
Disclosure of Interests in Other Entities and IAS 28
Investment in Associates – Investment Entities:
Applying the Consolidation Exception (Amendment)
01 January 2016
IFRS 10 Consolidated Financial Statements, IFRS 12
Disclosure of Interests in Other Entities and IAS 28
Investment in Associates – Investment Entities:
Applying the Consolidation Exception (Amendment)
Not yet finalized
Further, following new standards have been issued by IASB which are yet to be notified by
the SECP for the purpose of applicability in Pakistan.
IASB effective date
(Annual periods
beginning on or after)
IFRS 9 - Financial Instruments: Classification and
Measurement01 January 2018
IAS 16 Property, Plant and Equipment IAS 41
Agriculture - Agriculture: Bearer Plants (Amendment)
01 January 2016
IAS 27 Separate Financial Statements – Equity
Method in Separate Financial Statements
(Amendment)
01 January 2016
The above standards and amendments are not expected to have any material impact on
the Company's financial statements in the period of initial application.
IAS 12 Income Taxes – Recognition of Deferred Tax
Assets for Unrealized losses (Amendments)
01 January 2017
IAS 16 Property, Plant and Equipment and IAS 38
intangible assets - Clarification of Acceptable Method
of Depreciation and Amortization (Amendment)
IFRS 15 - Revenue from Contracts with Customers 01 January 2018
IFRS 16 – Leases 01 January 2019
IFRS 14 - Regulatory Deferral Accounts 01 January 2016
01 January 2016
IFRS 11 Joint Arrangements - Accounting for
Acquisition of Interest in Joint Operation (Amendment)
01 January 2016
IAS 1 Presentation of Financial Statements -
Disclosure Initiative (Amendment)
01 January 2016
IFRS 7 Financial Instruments: Disclosures -
Disclosure Initiative - (Amendment)
01 January 2017

Annual Report _____________________________________________________________________________
2016 2015
Note Rupees Rupees
5.ISSUED, SUBSCRIBED AND PAID UP SHARE
CAPITAL
36,000,000 (2015 : 36,000,000) Ordinary shares of
Rs. 10 each fully paid in cash 360,000,000 360,000,000
6. SURPLUS ON REVALUATION OF FIXED ASSETS
Surplus on revaluation of fixed assets as at 01 July 334,302,798 369,029,180
Surplus on revalued assets disposed off (289,354) (1,334,873)
Surplus relating to incremental depreciation charged on related
assets - transferred to other comprehensive income (29,871,617) (33,391,509)
Surplus on revaluation of fixed assets as at 30 June 304,141,827 334,302,798
Less: Related deferred tax liability on:
- Balance as at 01 July (97,908,818) (111,669,765)
- Fixed assets disposed off during the year 89,700 435,530
- Incremental depreciation charged during the year 9,260,201 10,894,681
- Increase due to change in proportionate local sales (200,285) (628,915)
- Decrease due to change in tax rate 2,773,725 3,059,651
(85,985,477) (97,908,818)
218,156,350 236,393,980
7. LONG TERM DEPOSITS
8. DEFERRED LIABILITIES
Deferred liabilities (8.1) 244,647,555 264,567,299 Gratuity - unfunded (8.2) 36,024,394 32,347,143
280,671,949 296,914,442
8.1 Deferred taxation
Taxable temporary differencesSurplus on revaluation of fixed assets 85,985,477 97,908,818 Accelerated tax depreciation 169,829,640 178,169,275
255,815,117 276,078,093 Deductible temporary differences
Unapproved gratuity (11,167,562) (11,510,794)
244,647,555 264,567,299
26
The Company had revalued its freehold land, factory building, office building and plant and
machinery on 31 December 2013. The revaluation exercise was carried out by M/s Harvest
(Private) Limited to replace the carrying amount of freehold land with current market value
and other assets with their depreciated market values. The surplus arisen on the revaluation
aggregating to Rs. 211,186,148 was credited to this account to comply with the requirements
of section 235 of the Companies Ordinance, 1984.
These represent deposits taken from employees against future transfer of company owned
vehicles to them and carry no mark-up.

____________________________________________________________________
2016 2015Note Rupees Rupees
8.2 Movement in net liability
Liability at the beginning of the year 32,347,143 28,883,564
Charge for the year (8.2.1) 16,419,665 17,711,165
48,766,808 46,594,729
Paid during the year (12,742,414) (10,751,928)
Actuarial gain - (3,495,658)
Liability at the end of the year 36,024,394 32,347,143
8.2.1 Charge for the year
Current service cost 14,148,532 14,596,408
Interest cost 2,271,133 3,114,757
16,419,665 17,711,165
8.2.2 The charge for the year has been allocated as follows:
Cost of sales (22) 13,464,125 14,523,155
Distribution cost (23) 985,180 1,062,670
Administrative expenses (24) 1,970,360 2,125,340
16,419,665 17,711,165
8.2.3 Sensitivity analysis
Discount rate +100 bps 31,812,865
Discount rate -100 bps 32,906,365
Salary increase +100 bps 33,042,469
Salary increase -100 bps 31,670,197
2015
Expected rate of increase in salary 8.75%
Discount rate 9.75%
Average expected remaining working life of employees 2 years
27
The sensitivity analyses below have been determined based on reasonably possible
changes of the respective assumptions, while holding all other assumptions constant.
Significant assumptions for the determination of the defined obligation are discount rate and
expected salary increase based on the last year actuary valuation. Following significant
assumptions were used for valuation of this scheme. Current year charge has been
calculated based on the projected figures in 2015 actuary report.

Annual Report _____________________________________________________________________________
2016 2015
Note Rupees Rupees9. TRADE AND OTHER PAYABLES
Creditors 11,961,148 14,172,583
Accrued liabilities 75,289,449 137,614,521
Advances from customers (9.1) 7,776,456 7,532,178
Advance from brokers against customers (9.2) 1,554,860 1,733,860
Unclaimed Workers' Profit Participation Fund 7,140,623 5,824,898
Workers' Profit Participation Fund (9.3) 990,073 7,492,386
Workers' Welfare Fund (9.4) 1,415,798 4,039,281
Unclaimed dividend 232,342 208,840
Others 115,400 100,000
106,476,149 178,718,547
9.1
9.2
9.3 Workers' Profit Participation Fund
Balance at the beginning of the year 7,492,386 7,951,817 Charge for the year (25) 990,073 7,492,386
8,482,459 15,444,203 Less: Payments made during the year 7,492,386 7,951,817
990,073 7,492,386
9.4 Workers' Welfare Fund
Balance at the beginning of the year 4,039,281 3,984,988 Charge for the year (25) 1,415,798 4,039,281
5,455,079 8,024,269 Less: Payments made during the year 4,039,281 3,984,988
1,415,798 4,039,281
10. BALANCES WITH STATUTORY AUTHORITIES
This represents sales tax payable to government.
11. SHORT TERM BORROWINGS
From banking companies - secured:
Cash finance (11.1) 26,564,037 7,962,967
Running finance (11.1) 369,312 19,430,920
Salam 800,000 3,000,000
27,733,349 30,393,887
Unsecured:
Book overdrawn (11.2) 846,123 1,327,747
Loan from directors (11.3) - 24,023,848
846,123 25,351,595
28,579,472 55,745,482
28
These represent advances against sale of yarn.
These represent advances from brokers against sale of yarn.

____________________________________________________________________
11.1
11.2
11.3
12. CONTINGENCIES AND COMMITMENTS
12.1 Contingencies:
12.1.1
12.1.2
12.2 Commitments:
29
The Company based on the opinion of its legal advisor has not recorded any provision for
the above in these financial statements as the Company is confident that outflow of
economic resources is not probable.
Bank guarantees aggregating to Rs. 47,742,200 (2015: Rs. 43,582,200) issued on behalf of
the Company were outstanding on balance sheet date.
This represents the book overdrawn balance due to unpresented cheques issued near the
balance sheet date. However, the bank statement shows a favourable balance of Rs.
681,127 (2015: Rs. 238,972).
Order under section 122(5A) of the Income Tax Ordinance, 2001 (ITO 2001) for the tax year
2005 (Oct - June) was issued by ACIR, who raised a demand amounting Rs. 6,801,138
against the Company. On appeal of the company, the CIR(A) set aside the order and
directed the assessing officer to recalculate the amount of demand raised according to the
rules ,vide order dated 31 March 2012. The department has now filed an appeal against the
order of CIR(A) before the ATIR which is pending adjudication.
This represents interest free loan from a director and have maturity of less than 12 months.
Order under section 122(5A) of the Income Tax Ordinance, 2001 (ITO 2001) for tax year
2005 (July - September) was issued by Additional Commissioner Inland Revenue (ACIR),
who raised a demand amounting to Rs. 74,047,800 against the Company. On application by
the Company for rectification to ACIR, he reduced the amount to Rs. 54,892,444. The
Company filed an appeal before Commissioner Inland Revenue Appeals (CIR(A)), who set
aside the order and directed the assessing officer to decide the case on merit in the light of
the submissions of the Company's lawyers, vide order dated 24 November 2011 and the
decision was taken in favour of the Company. The department has now filed an appeal
against the order of CIR(A) before the Appellate Tribunal Inland Revenue (ATIR) which is
pending adjudication. The appeal has been heard by the Tribunal, while decision regarding
thereto has not been issued as yet.
The aggregate facility of short term finances from commercial banks available at year end
was Rs. 1,065,000,000 (2015: Rs. 1,275,000,000). The rates of mark-up range from 3
months KIBOR plus 1% to 2% (2015: 3 months KIBOR plus 1% to 2.75%) per annum.
These facilities are secured against pledge of cotton bales with 10% margin for cotton, 25%
margin for yarn bags, first pari passu charge of Rs.159,000,000 on all current assets of the
Company, first pari passu charge of Rs. 337,000,000 on fixed assets of the Company, trust
receipts duly executed by the Company and personal guarantee of the directors of the
Company.

Annual Report ____________________________________________________________________________________________________
2016 2015
Note Rupees Rupees
13. PROPERTY, PLANT AND EQUIPMENT
Operating fixed assets - Owned (13.1) 1,156,629,818 1,218,378,299
Capital work in progress (13.2) 2,526,471 5,746,124
1,159,156,289 1,224,124,423
13.1 Operating fixed assets - Owned
Free hold land
Building on
freehold land -
Factory
Building on
freehold land -
Residential
Plant and
machinery
Electric
installations
Mills
equipment
Office
equipment
Furniture and
fixturesVehicles
Arms and
ammunition
Total
Assets
--------------------------------------------------------------------------------------------------------------------------- R u p e e s -------------------------------------------------------------------------------------------------------------------------------
At 01 July 2015
Cost 139,153,296 186,561,368 30,636,655 935,660,840 28,584,644 38,939,618 2,960,717 1,129,360 12,890,531 43,620 1,376,560,649
Accumulated Depreciation - 26,904,211 2,179,112 92,396,963 15,289,325 14,166,434 1,126,429 697,025 5,397,033 25,818 158,182,350
Net book value 139,153,296 159,657,157 28,457,543 843,263,877 13,295,319 24,773,184 1,834,288 432,335 7,493,498 17,802 1,218,378,299
Movement during the year
Opening net book value 139,153,296 159,657,157 28,457,543 843,263,877 13,295,319 24,773,184 1,834,288 432,335 7,493,498 17,802 1,218,378,299
Additions - cost - - - - - 128,000 767,918 224,640 5,741,555 - 6,862,113
Transferred from CWIP - - 6,900,265 - - - - - - - 6,900,265
Disposals
Cost - - - 405,498 - - - 2,878,098 - 3,283,596
Depreciation - - - 116,144 - - - 1,154,647 - 1,270,791
- - - 289,354 - - - - 1,723,451 - 2,012,805
Depreciation for the year - 15,965,716 1,652,887 52,033,015 168,133 2,083,226 191,246 29,270 1,372,781 1,780 73,498,054
Closing net book value 139,153,296 143,691,441 33,704,921 790,941,508 13,127,186 22,817,958 2,410,960 627,705 10,138,821 16,022 1,156,629,818
Depreciation rate (%) - 10 5 10 10 10 10 10 20 10
30
2016

________________________________________________________________________________________________________________________________________________
Free hold land
Building on
freehold land -
Factory
Building on
freehold land -
Residential
Plant and
machinery
Electric
installations
Mills
equipment
Office
equipment
Furniture and
fixturesVehicles
Arms and
ammunition
Total
Assets
--------------------------------------------------------------------------------------------------------------------------- R u p e e s -------------------------------------------------------------------------------------------------------------------------------
At 01 July 2014
Cost 128,395,241 186,561,368 29,547,210 937,410,840 28,584,644 38,816,908 2,675,917 1,129,360 14,748,913 43,620 1,367,914,021
Accumulated Depreciation - 9,164,527 738,680 34,897,093 13,707,665 13,265,732 936,263 670,073 4,935,957 24,689 78,340,679
Net book value 128,395,241 177,396,841 28,808,530 902,513,747 14,876,979 25,551,176 1,739,654 459,287 9,812,956 18,931 1,289,573,342
Movement during the year
Opening net book value 128,395,241 177,396,841 28,808,530 902,513,747 14,876,979 25,551,176 1,739,654 459,287 9,812,956 18,931 1,289,573,342
Additions - cost 10,758,055 - 1,089,445 - - 122,710 284,800 - 1,839,560 - 14,094,570
Disposals
Cost - - - 1,750,000 - - - 3,697,942 - 5,447,942
Depreciation - - - 353,030 - - - 669,662 - 1,022,692
- - - 1,396,970 - - - - 3,028,280 - 4,425,250
Depreciation for the year - 17,739,684 1,440,432 57,852,900 1,581,660 900,702 190,166 26,952 1,130,738 1,129 80,864,363
Closing net book value 139,153,296 159,657,157 28,457,543 843,263,877 13,295,319 24,773,184 1,834,288 432,335 7,493,498 17,802 1,218,378,299
Depreciation rate (%) - 10 5 10 10 10 10 10 20 10
31
2015

Annual Report ____________________________________________________________________________________________________
2016 2015
Note Rupees Rupees
13.1.1 Depreciation charge for the year has been allocated as follows:
Cost of sales (22) 71,902,977 79,515,378
Administrative expenses (24) 1,595,077 1,348,985
73,498,054 80,864,363
13.1.2
Owned Assets:
Freehold land 112,383,975 - 112,383,975 112,383,975 - 112,383,975
Building on freehold land:
Factory 171,940,415 137,515,127 34,425,288 171,940,415 133,690,095 38,250,320
Residential 27,993,594 11,087,384 16,906,210 21,093,329 10,318,641 10,774,688
Plant and machinery 1,222,340,872 615,049,129 607,291,743 1,222,861,119 548,041,027 674,820,092
1,534,658,856 763,651,640 771,007,216 1,528,278,838 692,049,763 836,229,075
32
Had there been no revaluation, the related figures of freehold land, building and plant and machinery at 30 June would have been as follows:
Particulars
Balance As at 30 June 2016 Balance As at 30 June 2015
CostAccumulated
depreciation Net book value Cost
Accumulated
depreciation Net book value
---------------------------------------------------------------------------------------Rupees --------------------------------------------------------------------------------------------

____________________________________________________________________
2016 2015
Note Rupees Rupees
13.2 Capital work in progress
Opening 5,746,124 3,669,074
Additions during the year 11,809,489 3,192,016
Less: transfer to operating fixed assets (6,900,265) -
Less: Transfer to stores (8,128,877) (1,114,966)
2,526,471 5,746,124
13.2.1
14. LONG TERM DEPOSITS
15. STORES AND SPARE PARTS
Stores in transit 50,975 37,915
Stores 4,910,946 5,874,942
Spare parts 38,931,472 31,447,370
43,893,393 37,360,227
16. STOCK IN TRADE
Raw material 213,242,376 211,598,536
Work in process 18,897,018 18,980,136
Finished goods (16.1) 19,228,567 31,302,878
Packing material 5,281,963 5,990,047
Waste 2,940,954 3,094,932
259,590,878 270,966,529
16.1 This includes garments stock of Rs. 3,872,581 (2015: Rs. Nil).
17. TRADE DEBTS
These are unsecured but considered good by the management of the Company.
18. ADVANCES- unsecured
Advances to suppliers:
Considered good 2,679,852 2,325,692
Considered doubtful - 743,604
2,679,852 3,069,296
Less: provision for doubtful advances (18.1) - 743,604
2,679,852 2,325,692
Advances to employees - considered good (18.2) 1,581,402 206,694
4,261,254 2,532,386
18.1 Provision for doubtful advances
Opening balance 743,604 743,604
Provision made during the year - -
Advances written off (743,604) -
Closing balance - 743,604
33
This represents expenses incurred and advances given in relation to office building.
These includes interest free deposits made for guarantees and security deposits to utility companies.

Annual Report _____________________________________________________________________________
18.2
18.3
2016 2015
Note Rupees Rupees
19. TRADE DEPOSITS AND SHORT TERM PREPAYMENTS
Bank guarantee margin 2,511,565 1,511,565
Short term prepayments 949,948 865,943
3,461,513 2,377,508
20. CASH AND BANK BALANCES
Cash in hand 671,954 407,935
Cash at bank:
Current accounts 9,412,887 29,154,785
Deposit accounts (20.1) 14,555,226 9,857,953
23,968,113 39,012,738
24,640,067 39,420,673
20.1
21. SALES - net
Local 3,169,743,503 3,406,809,202
Waste 57,220,934 55,375,724
3,226,964,437 3,462,184,926
Less: Sales tax 94,488,248 66,378,096
3,132,476,189 3,395,806,830
22. COST OF SALES
Raw materials:
Opening 211,598,536 181,312,119
Purchases 2,344,538,708 2,393,384,505
Closing stock (16) (213,242,376) (211,598,536)
Raw material consumed 2,342,894,868 2,363,098,088
Salaries, wages and other benefits (22.1) 208,691,133 207,669,128
Fuel and power 282,162,328 358,004,322
Packing material consumed 43,040,947 45,089,769
Stores and spare parts consumed 46,030,642 55,991,392
Insurance 5,448,502 5,192,946
Repairs and maintenance 4,894,045 3,873,581
Depreciation (13.1.1) 71,902,977 79,515,378
Others 2,403,058 1,500,004
3,007,468,500 3,119,934,608
Work in process:
Opening stock 18,980,136 17,168,014
Closing stock (16) (18,897,018) (18,980,136)
83,118 (1,812,122)
Cost of goods manufactured 3,007,551,618 3,118,122,486
Finished goods and waste:
Opening stock 34,397,810 65,110,677
Closing stock (16) (22,169,521) (34,397,810)
12,228,289 30,712,867
3,019,779,907 3,148,835,353
34
These represent interest free advances to employees for the purpose of the expenses.
No advances were given to the Chief Executive Officer, Directors and Executives of the Company.
These carry interest at the rate ranging from 4% to 6% (2015: 4% to 6%) per annum.

____________________________________________________________________
22.1
2016 2015
Note Rupees Rupees
23. DISTRIBUTION COST
Salaries and other benefits (23.1) 6,412,124 6,283,562
Commission on sales 14,593,875 12,421,334
Freight and forwarding - 103,550
Other expenses 841,061 446,677
21,847,060 19,255,123
23.1
24. ADMINISTRATIVE EXPENSES
Directors' remuneration 5,927,903 5,750,416
Salaries and other benefits (24.1) 20,654,738 17,095,302
Charity and donations (24.2) 7,910,000 15,035,000
Depreciation (13.1.1) 1,595,077 1,348,985
Fee and subscription 1,092,657 951,041
Postage, telephone and telex 1,282,847 819,126
Auditors' remuneration (24.3) 655,000 680,000
Rent, rates and taxes 141,690 625,422
Electricity, gas and water 1,697,266 540,183
Legal and professional 760,375 599,620
Entertainment 1,033,548 720,826
Repairs and maintenance 2,344,701 455,312
Vehicle running and maintenance 1,174,407 1,015,272
Printing and stationery 397,759 318,386
Insurance 311,497 156,017
Traveling and conveyance 180,218 144,585
Advertisement 1,105,134 131,855
Advances written off 1,738,327 -
Others 3,621,379 2,321,639
53,624,523 48,708,987
24.1
24.2 None of the directors had any interest in any of the donees.
24.3 Auditors' remuneration
Statutory audit 550,000 550,000
Half yearly review 75,000 75,000
Other certifications - 25,000
Out of pocket expenses 30,000 30,000
655,000 680,000
35
This includes an amount of Rs. 985,180 (2015: Rs.1,062,670) representing gratuity expense for the
year.
This includes an amount of Rs. 1,970,360 (2015: Rs. 2,125,340) representing gratuity expense for
the year.
This includes an amount of Rs. 13,464,125 (2015: Rs.14,523,155) representing gratuity expense for
the year.

Annual Report _____________________________________________________________________________
2016 2015
Note Rupees Rupees
25. OTHER OPERATING EXPENSES
Workers' Profit Participation Fund (9.3) 990,073 7,492,386
Workers' Welfare Fund (9.4) 1,415,798 4,039,281
Loss on disposal of property, plant and equipment - 756,123
2,405,871 12,287,790
26. OTHER INCOME
Income from financial assets:
Interest on bank deposits 2,521,239 640,912
Subsidy on finance lease due to subsidized rate - 1,034,934
2,521,239 1,675,846
Income from assets other than financial assets:
Gain on disposal of property, plant and equipment 1,136,785 -
Scrap sales 1,697,087 5,928,942
Creditors written back 27,000 21,393
2,860,872 5,950,335
5,382,111 7,626,181
27. FINANCE COSTS
Interest / mark-up on:
Short term borrowings 20,493,229 33,451,384
Loans from directors - 278,425
Mark up on Workers' Profit Participation Fund 527,553 741,924
21,020,782 34,471,733
Bank charges and commission 1,784,569 1,557,965
22,805,351 36,029,698
28. TAXATION
Current :
For the year 32,740,560 61,030,747
Prior year 1,220,567 (3,458,523)
33,961,127 57,572,224
Deferred:
For the year (19,919,744) (22,502,352)
(28.1) 14,041,383 35,069,872
28.1 Relationship between tax expenses and accounting profit
Profit before taxation 17,395,588 138,316,060
Current Taxation:
Tax at applicable tax rate of 1% minimum tax (2015: 33%) 31,324,762 45,644,300
Tax effect of change in prior year 1,220,567 (3,458,523)
Tax effect of expenses that are not deductible in
determining taxable income charged to profit and loss account (18,503,946) 17,247,355
Tax effect of expenses that are deductible in
determining taxable income not charged to profit and loss account - (20,078,831)
Effect of tax credits - (4,284,429)
14,041,383 35,069,872
36

Annual Report _____________________________________________________________________________
2016 2015
Note Rupees Rupees
29. EARNINGS PER SHARE - BASIC AND DILUTED
Profit for the year Rupees 3,354,205 103,246,188
Weighted average number of shares Number 36,000,000 36,000,000
Basic earnings per share Rupees 0.09 2.87
YarnGarments
DivisionTotal
30. SEGMENT RESULTS Rupees Rupees Rupees
Sale 3,225,743,852 1,220,585 3,226,964,437
Less: Sales tax 94,427,216 61,032 94,488,248
3,131,316,636 1,159,553 3,132,476,189
Cost of sale
Raw material consumed 2,337,357,655 5,537,213 2,342,894,868
Salaries, wages and other benefits 208,263,557 427,576 208,691,133
Fuel and power 282,162,328 - 282,162,328
Packing material consumed 42,979,114 61,833 43,040,947
Stores and spare parts consumed 46,030,642 - 46,030,642
Insurance 5,448,502 - 5,448,502
Repairs and maintenance 4,706,613 187,432 4,894,045
Depreciation 71,902,977 - 71,902,977
Others 2,262,475 140,583 2,403,058
3,001,113,863 6,354,637 3,007,468,500
Work in process:
Opening stock 18,980,136 - 18,980,136
Closing stock (18,897,018) - (18,897,018)
83,118 - 83,118
Cost of goods manufactured 3,001,196,981 6,354,637 3,007,551,618
Finished goods and waste:
Opening stock 34,397,810 - 34,397,810
Closing stock (18,296,940) (3,872,581) (22,169,521)
16,100,870 (3,872,581) 12,228,289
3,017,297,851 2,482,056 3,019,779,907
Gross profit / (loss) 114,018,785 (1,322,503) 112,696,282
37
29.1 No figure for diluted earnings per share has been presented as the Company has not issued any
instrument carrying options which would have an impact on the basic earnings per share, when
exercised.

____________________________________________________________________
YarnGarments
DivisionTotal
Rupees Rupees Rupees
Distribution cost
Salaries and other benefits 5,942,436 469,688 6,412,124
Commission on sales 14,593,875 - 14,593,875
Other expenses 387,158 453,903 841,061
20,923,469 923,591 21,847,060
Administrative expenses
Directors' remuneration 5,927,903 - 5,927,903
Salaries and other benefits 19,223,773 1,430,965 20,654,738
Charity and donations 7,910,000 - 7,910,000
Depreciation 1,594,455 622 1,595,077
Fee and subscription 1,092,657 - 1,092,657
Postage, telephone and telex 1,272,430 10,417 1,282,847
Auditors' remuneration 655,000 - 655,000
Rent, rates and taxes 141,690 - 141,690
Electricity, gas and water 1,219,317 477,949 1,697,266
Legal and professional 760,375 - 760,375
Entertainment 1,033,548 - 1,033,548
Repairs and maintenance 1,480,173 864,528 2,344,701
Vehicle running and maintenance 1,159,407 15,000 1,174,407
Printing and stationery 397,759 - 397,759
Insurance 311,497 - 311,497
Traveling and conveyance 180,218 - 180,218
Advertisement 226,400 878,734 1,105,134
Advances written off 1,738,327 - 1,738,327
Others 3,557,750 63,629 3,621,379
49,882,679 3,741,844 53,624,523
Other operating expenses 2,405,871 - 2,405,871
52,288,550 3,741,844 56,030,394
Other income 5,382,111 - 5,382,111
Operating profit / (loss) 46,188,877 (5,987,938) 40,200,939
Finance costs 22,802,809 2,542 22,805,351
Profit / (loss) before taxation 23,386,068 (5,990,480) 17,395,588
38

Annual Report _____________________________________________________________________________
31. REMUNERATION OF CHIEF EXECUTIVE OFFICER, DIRECTORS AND EXECUTIVES
2,150,000 1,761,935 7,328,960 1,671,113 2,162,500 6,753,889
Utilities 215,000 176,194 732,896 167,111 216,249 675,389
House rent 860,000 704,774 2,931,585 668,444 864,999 2,701,555
3,225,000 2,642,903 10,993,441 2,506,668 3,243,748 10,130,833
1 1 4 1 3 4
31.1 In addition, the above persons have been provided with the Company maintained cars.
31.2 No fee is paid to the Chief Executive Officer or any director of the Company for attending the meetings.
32. TRANSACTIONS WITH RELATED PARTIES
2016 2015
Rupees Rupees
Directors Loan received during the year 24,500,000 91,212,848
48,523,848 67,189,000
- 278,425
- 635,915
33. FINANCIAL RISK MANAGEMENT
33.1 Financial risk factors
39
2015
Directors Executives
Chief
Executive
Officer
Directors Executives
2016
Chief
Executive
Officer
----------------------Rupees-------------------
Nature of transaction
Loan repaid during the year
Interest on loans
The related parties include directors of the Company and key management personnel. Amounts due
from and to related parties are shown under respective notes to the financial statements.
Remuneration of directors and key management personnel is disclosed in note 31. Other significant
transactions with related parties are as below:
-------------------------Rupees----------------------
Managerial
remuneration
Number of
persons
Relationship with the
Company
Rent paid during the year
The Company's financial liabilities mainly comprise short term borrowings and trade and other
payables. The main purpose of these financial liabilities is to raise finances for Company's operations.
The Company has trade debts, trade deposits, short term advances and short term bank deposits that
arrive directly from its operations. The Company's activities expose it to a variety of financial risks:
market risk (including currency risk, price risk and interest rate risk), credit risk and liquidity risk. The
Company's overall risk management program focuses on the unpredictability of financial markets and
seeks to minimize potential adverse effects on the financial performance.
Risk management is carried out by the Board of Directors (the Board). The Board provides principles
for overall risk management, as well as policies covering specific areas such as currency risk, price
risk, interest rate risk, credit risk and liquidity risk.

____________________________________________________________________
a)Market risk
i)Currency risk
ii)Other price risk
iii)Interest rate risk
2016 2015
Floating rate instruments Rupees Rupees
Financial assets
Bank balances - deposit accounts 14,555,226 9,857,953
Financial liabilities
Short term borrowings 28,579,472 55,745,482
Cash flow sensitivity analysis for variable rate instruments
40
Currency risk is the risk that the fair value or future cash flows of a financial instrument will fluctuate
because of changes in foreign exchange rates. Currency risk arises mainly from future commercial
transactions or receivables and payables that exist due to transactions in foreign currencies. The
Company has no significant transactions in foreign currency therefore, it is not exposed to currency
risk.
Other price risk represents the risk that the fair value or future cash flows of a financial instrument
will fluctuate because of changes in market prices (other than those arising from interest rate risk or
currency risk), whether those changes are caused by factors specific to the individual financial
instrument or its issuer, or factors affecting all similar financial instruments traded in the market.
The Company is not exposed to commodity price risk since it has diverse portfolio of commodity
suppliers. The Company is also not exposed to equity price risk.
This represents the risk that the fair value or future cash flows of a financial instrument will fluctuate
because of changes in market interest rates.
The Company has no significant interest-bearing assets other than bank balances in deposit
accounts. The Company's interest rate risk mainly arises from short term borrowings. Borrowings
obtained at variable rates expose the Company to cash flow interest rate risk. Borrowings obtained
at fixed rate expose the Company to fair value interest rate risk.
The following analysis demonstrates the sensitivity to a reasonably possible change in interest
rates, with all other variables held constant, of the Company's profit before tax. This analysis is
prepared assuming the amounts of floating rate instruments outstanding at balance sheet dates
were outstanding for the whole year.
At the balance sheet date the Company was not exposed to fair value interest rate risk, however
the interest rate profile of the Company’s floating interest bearing financial instruments was:

Annual Report _____________________________________________________________________________
Changes in
Interest
Rate
Effects on
Profit
Before Tax
Bank balances - deposit accounts +1.00 (145,552)
-1.00 145,552
+1.00 (98,580)
-1.00 98,580
Short term borrowings +1.50 (428,692)
-1.50 428,692
+1.50 (836,182)
-1.50 836,182
b)Credit risk
2016 2015
Rupees Rupees
Long term deposits 3,697,560 3,697,560
Trade debts 76,128,783 115,572,506
Trade deposits 2,511,565 1,511,565
Bank balances 23,968,113 39,012,738
106,306,021 159,794,369
Rupees Rupees
Banks
Habib Bank Limited A-1+ AAA JCR - VIS 945,414 495,079
Al-Baraka Bank A A1 PACRA 82,617 -
MCB Bank Limited A-1+ AAA PACRA 148,796 10,037,439
National Bank of Pakistan A-1+ AAA JCR - VIS 676,667 4,122,320
Faysal Bank Limited A1+ AA PACRA 11,039,427 5,858,854
Askari Bank Ltd AA+ A1+ PACRA 581,190 19,941
Bank Alfalah Limited A1+ AA PACRA 2,756,136 3,628,281
Bank of Punjab AA- A1+ PACRA 29,612 29,683
Habib Metropolitan Bank Ltd AA+ A1+ PACRA 7,668,136 14,780,473
NIB Bank Limited AA- A1+ PACRA 40,118 40,668
23,968,113 39,012,738
41
2015
Credit risk represents the risk that one party to a financial instrument will cause a financial loss to
the other party by failing to discharge an obligation. The carrying amount of financial assets
represents the maximum credit exposure. The maximum exposure to credit risk at the reporting
date was as follows:
The credit quality of financial assets that are neither past due nor impaired can be assessed by
reference to external credit ratings or to historical information about counterparty default rate. The
table below shows the bank balances held with counterparties at the balance sheet date:
Rating2016 2015
Short
Term
Long
termAgency
2015
2016
2016

____________________________________________________________________
Trade debts
2016 2015
The age of trade receivables at balance sheet date was: Rupees Rupees
Not past due 75,817,417 115,301,945
Past due 1- 6 months 618,406 13,391
Past due 7- 12 months 220,330 6,027
1 - 2 years 238,675 251,143
2 - 3 years 79,877 -
Above 3 years 91,223 -
77,065,928 115,572,506
-
-
c)Liquidity risk
Carrying
Amount
Contractual
cash flows
Less than
1 year
Between
1 and 5
years
Over 5 years
30 June 2016
12,308,890 12,308,890 12,308,890 - -
4,478,124 4,478,124 4,478,124 - -
36,024,394 36,024,394 - 36,024,394 -
Short term borrowings 28,579,472 28,579,472 28,579,472 - -
81,390,880 81,390,880 45,366,486 36,024,394 -
42
At 30 June 2016, Company had 9 customers (2015: 13 customers) that owed the Company more
than Rs. 1 million each and accounted for approximately 95% (2015: 98%) of all receivables owing.
Due to the Company's long standing business relationships with these counterparties and after
giving due consideration to their strong financial standing, management does not expect non-
performance by these counter parties on their obligations to the Company. Accordingly the credit
Liquidity risk is the risk that an entity will encounter difficulty in meeting obligations associated with
financial liabilities.
Post employment benefits -
gratuity
The Company's approach to managing liquidity is to ensure, as far as possible, that it will always
have sufficient liquidity to meet its liabilities when due, under both normal and stressed conditions,
without incurring unacceptable losses or risking damage to the Company's reputation. The
management believes the liquidity risk to be low.
Mark-up accrued on short
term-borrowings
---------------------------------------------------------------------------------Rupees----------------------------------------------------------------------------------
Trade and other payables
The table below analyses the Company's financial liabilities into relevant maturity groupings based
on the remaining period at the balance sheet to the contractual maturity date. The amounts
disclosed in the table are the contractual undiscounted cash flows. Balances due within 12 months
equate to their carrying balances as the impact of discounting is not significant:
Credit risk related to trade receivables is managed by established policies, procedures and controls
relating to customers credit risk management. Outstanding receivables are regularly monitored.

Annual Report _____________________________________________________________________________
Carrying
Amount
Contractual
cash flows
Less than
1 year
Between
1 and 5
years
Over 5 years
30 June 2015
14,481,423 14,481,423 14,481,423 - -
5,153,641 5,153,641 5,153,641 - -
32,347,143 32,347,143 - 32,347,143 -
Short term borrowings 55,745,482 55,745,482 55,745,482 - -
107,727,689 107,727,689 75,380,546 32,347,143 -
33.2 Fair values of financial assets and liabilities
33.3 Financial instruments by categories
Loans and
receivablesTotal
As at 30 June 2016
Financial assets as per balance sheet
Long term deposits - 3,697,560 3,697,560
Trade debts - 76,128,783 76,128,783
Trade deposits - 2,511,565 2,511,565
Cash and bank balances 24,640,067 - 24,640,067
24,640,067 82,337,908 106,977,975
Financial liabilities as per balance sheet Rupees
Trade and other payables 12,308,890
Mark-up accrued on short term borrowings 4,478,124
Post employment benefits- Gratuity 36,024,394
Short term borrowings 28,579,472
81,390,880
43
---------------------------------------------------------------------------------Rupees----------------------------------------------------------------------------------
The contractual cash flows relating to the above financial liabilities have been determined on the
basis of mark-up rates effective as at 30 June. The rates of mark up have been disclosed in
respective notes to the financial statements.
The carrying values of all financial assets and liabilities reflected in financial statements approximate
their fair values. Fair value is determined on the basis of objective evidence at each reporting date.
Cash and
cash
equivalents
Trade and other
payables
Mark-up accrued on
short term-borrowings
Post employment
benefits - gratuity
---------------------------------------------------Rupees------------------------------------------------
Financial
liabilities at
amortized cost

____________________________________________________________________
Loans and
advancesTotal
As at 30 June 2015
Financial assets as per balance sheet
Long term deposits - 3,697,560 3,697,560
Trade debts - 115,572,506 115,572,506
Trade deposits - 1,511,565 1,511,565
Cash and bank balances 39,420,673 - 39,420,673
39,420,673 120,781,631 160,202,304
Financial liabilities as per balance sheet Rupees
Liabilities against assets subject to finance lease -
Trade and other payables 14,481,423
Mark-up accrued on financing 5,153,641
Post employment benefits 32,347,143
Short term borrowings 55,745,482
107,727,689
33.4 Capital risk management
2016 2015
Note Rupees Rupees
The gearing ratio as at year end is as follows:
(12) 28,579,472 55,745,482
1,113,486,161 1,135,553,142
Total capital employed 1,142,065,633 1,191,298,624
3% 5%
44
No changes were made in the objectives, policies or processes from the previous year. The Company
monitors capital using gearing ratio, which is debt divided by equity plus net debt. Debt represents short
term borrowings obtained by the Company as referred to in note 12. Total capital employed includes
‘total equity’ as shown in the balance sheet plus debt. The Company’s strategy, which was unchanged
from last year, was to maintain optimal capital structure in order to minimize cost of capital.
Debt
Equity
Gearing ratio
The Company’s objectives when managing capital are to safeguard the Company’s ability to continue
as a going concern in order to provide return for shareholders and benefits for other stakeholders and to
maintain healthier capital ratios in order to support its business and maximize shareholders' value. The
Company manages its capital structure and makes adjustments to it, in the light of changes in economic
conditions. To maintain or adjust the capital structure, the Company may adjust dividend payments to
the shareholders or issue new shares.
Cash and
cash
equivalents
---------------------------------------------------Rupees------------------------------------------------
Financial
liabilities at
amortized cost

Annual Report _____________________________________________________________________________
2016 2015
34. PLANT CAPACITY AND ACTUAL PRODUCTION
Spindles installed / worked No. 38,448 38,448
Production at normal capacity in 20/S count
based on 3 shifts per day Kgs 14,102,609 14,102,609
Actual production converted to 20/S count
based on 3 shifts per day Kgs 12,052,742 11,718,371
34.1 Reason for low production
35. NON ADJUSTING EVENTS AFTER THE BALANCE SHEET DATE
2016 2015
36. NUMBER OF EMPLOYEES
Number of employees at the end of the year 878 899
Average number of employees during the year 917 942
37. DATE OF AUTHORIZATION FOR ISSUE
38. CORRESPONDING FIGURES
39. GENERAL
45
(Director)(Chief Executive Officer)
Under utilization of available capacity is due to change over in production mix and normal maintenance
down time.
Figures in these financial statements have been rounded off to the nearest rupee, unless otherwise
stated.
The Board of Directors of the Company in its meeting held on 08 October 2016 has proposed a cash
dividend of Rs. NIL per share (2015: Rs. 0.7 per share) in respect of the year ended 30 June 2016. The
appropriation will be approved by the members in the forthcoming Annual General Meeting. These
financial statements do not include the effect of these appropriations which will be accounted for
subsequent to the year end.
These financial statements were authorized for issue by the Board of Directors of the Company on 08
October 2016 .
Corresponding figures have been re-arranged or reclassified wherever necessary, for better and fair
presentation. However, no significant reclassifications / restatements have been made in these financial
statements.

_______________________________________________________________________
46
PATTERN OF SHAREHOLDING
1. Incorporation Number 0021882
2. Name of the Company RESHAM TEXTILE INDUSTRIES LIMITED
3. Pattern of holding of the shares held by the shareholders as at 30 June 2016
------Shareholding------
4. No. of Shareholders From To Total Shares Held
28 1 100 139
34 101 500 16,286
5 501 1,000 4,015
6 1,001 5,000 12,000
1 5,001 10,000 10,000
1 15,001 20,000 19,419
1 25,001 30,000 29,100
1 30,001 35,000 32,299
2 50,001 55,000 101,185
1 65,001 70,000 66,000
1 80,001 85,000 82,164
1 100,001 105,000 100,500
1 140,001 145,000 143,846
1 150,001 155,000 153,968
1 165,001 170,000 166,452
1 195,001 200,000 200,000
3 285,001 290,000 863,073
1 345,001 350,000 346,000
1 440,001 445,000 444,620
1 550,001 555,000 553,991
1 585,001 590,000 589,300
1 650,001 655,000 650,746
1 735,001 740,000 738,350
1 765,001 770,000 765,481
1 840,001 845,000 843,481
1 1,140,001 1,145,000 1,140,515
1 1,250,001 1,255,000 1,254,021
1 1,555,001 1,560,000 1,558,998
1 1,665,001 1,670,000 1,668,814
1 2,955,001 2,960,000 2,957,752
1 3,085,001 3,090,000 3,089,560
1 17,395,001 17,400,000 17,397,925
104 36,000,000
5. Categories of shareholders Shares held Percentage
5.1 Directors, Chief Executive Officers and their spouse and minor children
26,974,211 74.928%
5.2 Banks Development In Financial Institutions, Non-Banking Financial Institutions.
119 0.000%
5.3 Shareholders holding 10% or more 23,870,956 66.308%
5.4 General Public 9,005,565 25.015%
5.5 Others (to be specified)
1- Joint Stock Companies 5 0.000%
2- Pension Funds 19,419 0.054%
3- Others 681 0.002%

27 Monday 31st October 2016
2016
th
10.00 a.m.
R E S H A
Annual Report
36-A, Lawrence Road, Lahore.