report 2 financial planning for transportation asset management€¦ · · 2015-09-022 financial...
TRANSCRIPT

J U N E 2 0 1 5
ASSET MANAGEMENT FINANCIAL REPORT SERIES
Financial Planning for Transportation Asset Management:Components of a Financial Plan
REPORT 2

Notice
This document is disseminated under the sponsorship of the U.S. Department of Transportation in the interest of information exchange. The U.S. Government assumes no liability for the use of the information contained in this document.
The U.S. Government does not endorse products or manufactur-ers. Trademarks or manufacturers’ names appear in this report only because they are considered essential to the objective of the document.
Quality Assurance Statement
The Federal Highway Administration (FHWA) provides high-quality information to serve Government, industry, and the public in a manner that promotes public understanding. Standards and policies are used to ensure and maximize the quality, objectivity, utility, and integrity of its information. FHWA periodically reviews quality issues and adjusts its programs and processes to ensure continuous quality improvement.

Table of Contents
1. Introduction and Overview to Report Series . . . . . . . . . . . 1
2. Report Outline . . . . . . . . . . . . . . . . . . . . . . . . . . . . . . . . . . . . 3
3. Components of a Financial Plan to Support Sustainable Transportation Asset Management . . . . . . . . . . . . . . . . . . . . 5
Uses of Funds . . . . . . . . . . . . . . . . . . . . . . . . . . . . . . . . . . . 6
Historical Trends for the Uses of Funds . . . . . . . . . . . . . 9
Transportation Agency Examples . . . . . . . . . . . . . . . . . . 17
Projected Uses for the Financial Plan Period . . . . . . . 22
Examples from Minnesota and Colorado DOT TAMPs . . . . . . . . . . . . . . . . . . . . . . . . . . . . . . . . . . . . 29
Sources of Revenue . . . . . . . . . . . . . . . . . . . . . . . . . . . . . . 31
Future Projections for Revenues . . . . . . . . . . . . . . . . . . 36
Risks and Assumptions . . . . . . . . . . . . . . . . . . . . . . . . . . 37
Estimates of Projected Funding for Plan Period . . . . 38
Gaps and Surpluses . . . . . . . . . . . . . . . . . . . . . . . . . . . . . . 41
Alternative Investment and Funding Scenarios with Consequences . . . . . . . . . . . . . . . . . . . . . . . . . . . . . . . . . 44
Additional Scenarios . . . . . . . . . . . . . . . . . . . . . . . . . . . . 50
4. Final Plan . . . . . . . . . . . . . . . . . . . . . . . . . . . . . . . . . . . . . . . . . 51
State Agency Examples . . . . . . . . . . . . . . . . . . . . . . . . . 52
5. Summary and Conclusions . . . . . . . . . . . . . . . . . . . . . . . . . 60
6. References . . . . . . . . . . . . . . . . . . . . . . . . . . . . . . . . . . . . . . . 62

ii Financial Planning for Transportation Asset Management
Figures
Figure 1. Example of Uses of funds from Colorado DOT’s 2013 Annual report . . . . . . . . . . . . . . . . . . . . . . . . . . . . . 8
Figure 2. Historical OCR and Pavement Budgets . . . . . . . . 18
Figure 3. Historical Bridge Budgets and Performance . . . . 19
Figure 4. Historical Pavement Conditions in Colorado . . . 20
Figure 5. Historical Pavement Conditions and Costs incurred in Utah . . . . . . . . . . . . . . . . . . . . . . . . . . . . . . . . . . . . . 21
Figure 6. Overall Historical OCI and Breakdown of Pavement Conditions . . . . . . . . . . . . . . . . . . . . . . . . . . . . . . . . 21
Figure 7. MN Construction Cost Index vs Consumer Price Index (All Items) . . . . . . . . . . . . . . . . . . . . . . . . . . . . . . . . . . . . . . . . . . 24
Figure 8. Minnesota Historical Road Construction Expenditures with and without Inflation . . . . . . . . . . . . . . . 25
Figure 9. The Estimated Impact of Inflation on Projected Pavement Program Costs and PCR for a sample DOT . . . 25
Figure 10. Conceptual Model of Pavement Deterioration . . . . . . . . . . . . . . . . . . . . . . . . . . . . . . . . . . . . . . . 29
Figure 11. Highway Trust Fund Balances and Projected Shortfalls . . . . . . . . . . . . . . . . . . . . . . . . . . . . . . . . . . . . . . . . . . 34
Figure 12. Relative Distribution of funds between State, Federal and Local Sources for a Sample State DOT for the 10 Year Plan Period . . . . . . . . . . . . . . . . . . . . . . . . . . . . . . 40

Report 2: Components of a Financial Plan iii
Figure 13. Aggregate Gap between Needs and Available Funding for Colorado DOT (2016-2040) . . . . . . . . . . . . . . . 44
Figure 14. Sample State DOT—Impact on Overall PCR due to Reduction in Investment (Scenario 2) . . . . . . . . . . . 48
Figure 15. Sample State DOT—Impact on Structural Deficiency of Bridges due to Reduction in Investment (Scenario 2) . . . . . . . . . . . . . . . . . . . . . . . . . . . . . . . . . . . . . . . . 48
Figure 16. Sources and Uses for MnDOT . . . . . . . . . . . . . . . 52
Tables
Table 1. CDOT Inventory and Asset Conditions on State System . . . . . . . . . . . . . . . . . . . . . . . . . . . . . . . . . . . . . . . . . . . . . 12
Table 2. Illustrative Example of Historical Uses of Funds for Sample State DOT . . . . . . . . . . . . . . . . . . . . . . . . . . . . . . . . 16
Table 3. Illustrative Example of Projected Uses of Funds for Sample State DOT to meet “Aspirational” Targets. . . . 27
Table 4. MnDOT Asset Management Targets and Related Investment Needs . . . . . . . . . . . . . . . . . . . . . . . . . . . . . . . . . . . 31
Table 5. Colorado DOT Projected 10 Year Asset Management Investments and Estimated Revenues . . . . 32
Table 6. Historic Sources of Funds for Sample State DOT . . . . . . . . . . . . . . . . . . . . . . . . . . . . . . . . . . . . . . . . . 35
Table 7. Projected Sources of Funds for Sample State DOT for 10 Year Plan Period . . . . . . . . . . . . . . . . . . . . 39
Table 8. Gap between Projected Sources and Aspirational Needs for Sample DOT . . . . . . . . . . . . . . . . . . . . . . . . . . . . . . 42
Table 9. Gaps between Needs and Available Funding for Operations and Maintenance for MnDOT . . . . . . . . . . . . . . 43
Table 10. Gaps between Needs and Available Funding for various categories for Colorado DOT (2016-2025) . . . . . . 43
Table 11. Expenditures Reduced with Lower Asset Goals to Address the Gaps . . . . . . . . . . . . . . . . . . . . . . . . . . . . . . . . 47
Table 12. MnDOT—Existing and Recommended Pavement Condition Targets . . . . . . . . . . . . . . . . . . . . . . . . . . . . . . . . . . . 49
Table 13. MnDOT—Existing and Recommended Bridge Condition Targets . . . . . . . . . . . . . . . . . . . . . . . . . . . . . . . . . . . 50
Table 14. Summary View Showing Sources and Uses of 10 Year Financial Plan for Sample State DOT along with Key Targeted Performance Metrics for Bridges and Pavements . . . . . . . . . . . . . . . . . . . . . . . . . . . . . . . . . . . . . 55
Table 15. 10 Year Asset Management Planned Funding and Investment . . . . . . . . . . . . . . . . . . . . . . . . . . . . . . . . . . . . . 57
Table 16. CDOT Objectives and Targets as detailed in its TAMP . . . . . . . . . . . . . . . . . . . . . . . . . . . . . . . . . . . . . . . . . . . . . 59
iv Financial Planning for Transportation Asset Management

Report 2: Components of a Financial Plan 1
1. Introduction and Overview to Report Series
Transportation agencies have the responsibility and the challenging task to maintain, preserve and improve infra-structure assets (assets) for current and future generations. While maintaining existing assets is an overriding concern for transportation agency officials, most agencies are grappling with funding issues. Considering the fact that assets such as pavements and bridges have long useful lives, a sound asset management practice will necessitate the development of long-term asset management plans. Practices and experi-ences from other countries with mature asset management processes and also from transportation agencies within the U.S. show that implementing and sustaining the performance and condition of assets requires long-term financial plans that support and are linked to long-term asset management strategies. Comprehensive transportation asset management plans (TAMP) could show the expected and desired projec-tions of asset performance and condition for ten or more years in to the future. A pragmatic TAMP would address the amount of investment required each year for the rehabilita-tion, preservation and maintenance of assets during their useful life. The associated financial plan can be linked to the targeted performance and conditions of the assets identified in the TAMP.
The financial plan can show the expected and desired fund-ing projected for the future, often for ten or more years. To be useful to decision-makers, the financial plan can establish how the agency will address the resources needed to achieve and sustain the long-term asset management objectives. It could clearly illustrate the financial state of the agency and express the financial needs for the plan period, shedding light on the gaps, and the funds needed to bridge the gaps between the current conditions and those established in the

2 Financial Planning for Transportation Asset Management
asset management plan to sustain and cost effectively extend the useful life of the assets. The elements of the financial plan can succinctly highlight the actions that need to be taken over the long-term to maintain the health, per-formance and condition of the assets. The financial plan also can address financial risks. It could enable the agency to monitor and compare the funding available to the expected funding projections throughout the life of the plan, make tradeoffs, and take corrective actions to accomplish the agency’s asset management objectives. The financial plan is thus critical to the successful implementation of the agency’s TAMP. Finally, well developed financial plans would allow agencies to communicate with the public and the stakehold-ers, the value of transportation assets, the current, projected and desired performance and condition of assets, the fund-ing required to support the projected and desired perfor-mance and condition targets, the financial risks, and the level of performance and condition that stakeholders can expect. It also can summarize any changes in strategy that may be required to address changing financial realities.
This second report in the five part financial report series discusses the main components of a financial plan and shows how they can support a sustainable asset management plan for a transportation agency.

Report 2: Components of a Financial Plan 3
2. Report OutlineThis report discusses the various components of a financial plan prepared to support an agency’s transportation asset management plan. TAMPs will detail how a state agency intends to maintain, preserve and keep its bridges, pave-ments and other assets at certain condition and performance levels over the long-term. Given the long lives of transporta-tion assets and the strategic nature of TAMPs, this report considers a ten-year period for the financial plan. Agencies may change the period of the financial plan based on their TAMP and other considerations. However, a period shorter than 10 years is not recommended.
In the simplest form, the financial plan and the investment strategies detailed therein should support achieving the agency’s needs and objectives for the condition of assets detailed in the TAMP. By its very nature, the exercise of asset management planning and the related financial planning, is interactive and iterative. Realistically, the political, economic, environmental and other internal and external factors that are expected to impact the decisions relating to the agency’s long range plan will be reflected in the TAMP. While a long range plan will address additional issues such as safety and capacity needs, the TAMP will provide details and summarize the existing condition and state of the assets. The current and projected economic conditions, freight movement, environ-mental and other factors in the long range plan including risks associated with each, will influence the TAMP. Funding amounts for those programs will not be developed by the TAMP financial plan but the TAMP financial plan will illustrate how funds for those other needs “come off the top” and are not available for achieving asset condition targets. Significant influencing factors relate to current and future costs of maintaining targeted system conditions and the availability of funds to meet those costs. These factors will translate into strategies for 1) the preservation and maintenance of existing

4 Financial Planning for Transportation Asset Management
assets, and 2) rehabilitation and reconstruction. The financial plan will address various financial elements that support how the agency plans to achieve the objectives in the TAMP.
This report will also provide context for the need to include various elements of the financial plan. It uses common accounting terminology of “sources and uses” because of its wide acceptance in financial practice.
This report will describe an approach to be followed in prepar-ing projections of investments or “Uses” and available funding, or “Sources” for the plan period. It will show how a financial plan can help an agency communicate externally and inter-nally, it’s funding needs, projected revenues and gaps (if any). Such a communication can be facilitated by the inclusion of a summary that provides a quick view of the financial state and ability (or inability) of an agency to meet its long-term TAM needs. It can allow an agency to communicate to the stake-holders and the public, the future state of the system and what services they should expect from the agency and its transpor-tation assets based on the projections of available funding. It can also allow the agency to succinctly communicate the implications of the level of funding available, the related sustainability of its transportation assets, and as a result, what financial burden, if any, they will leave for future generations.
DefinitionsSOURCES represent what funding will be available to an agency and include the actual source (federal funds, tax revenues, etc.) and the amount.
USES represent the amounts an agency projects it will spend (purpose and amount)
SOURCES AND USES provide a summary of where the capital used to fund an agency’s projects, operations and activities will come from (the sources), and what this capital will purchase (the uses).

Report 2: Components of a Financial Plan 5
3. Components of a Financial Plan to Support Sustainable Transportation Asset Management
A comprehensive financial plan that supports long-term transportation asset management (TAM) will at a minimum include the following primary components:
1. The various uses of funds based on forecasted system conditions and performance targets. It will include assumptions related to future projections.
2. Projected revenues from all available and anticipated sources of funds including related assumptions.
3. Projected gaps or surpluses based on the above.
4. Scenarios reflecting adjustments necessary to address gaps, if any, along with related consequences.
5. Final proposed financial plan to support the agency’s asset management plan
Discussing each of these areas in the financial plan should help an agency provide a realistic picture of its projected future financial health. The plan will also present the agen-cy’s financial ability to meet its long-term performance and condition goals and sustain its assets in the future. In addi-tion, providing a summary of the highlights of the financial plan and the related implications to the state of an agency’s transportation system and assets can help to convey the performance and conditions that can be expected from the TAMP.
6 Financial Planning for Transportation Asset Management
Uses of Funds
Though the details of specific uses will vary from state to state, there are many common areas of expenditure across transportation agencies relative to asset management activities. The uses encompass the assets being addressed and the investment needs associated with maintaining those assets at some desirable condition levels as established by the agency’s TAMP. The amount of funds needed for various categories and their relative proportions will vary across agencies and will depend on the agencies’ approach to asset management. State and local transportation agencies are organized differently and they differ in how they operate and manage the preservation and maintenance of their assets. Some agencies perform most of their maintenance of assets using in-house personnel, while others contract out these activities. Some do significant amount of preser-vation activities in-house while others contract out such work. Also, the way work is contracted differs across states. Some agencies combine maintenance and preservation activities in the contracts while others keep them separate. These differences have a bearing on how the uses are reflected in the financial plan. The examples used in this report are for illustrative purposes and agencies should apply their own perspectives and variances as appropriate as they develop their plans. Following are some of the example categories of uses of funds compiled from the DOTs in Colorado, Ohio and Rhode Island:
1. Pavement preservation and maintenance (These can be further detailed into interstate system, priority system, urban, rural, etc.)
2. Pavement rehabilitation and replacement

Report 2: Components of a Financial Plan 7
3. Bridge preservation and maintenance
4. Major bridge construction
5. New capital program (construction/expansion)
6. Traffic engineering and maintenance
7. Drainage maintenance
8. Rest areas
9. Operations and maintenance (winter operations, ditching, pothole patching)
10. Safety/guardrail, cable barriers, signs, intelligent transportation systems (ITS)
11. Noise walls
12. Slides, slip remediation
13. Tunnels
14. Program delivery/administration
15. Payroll and other administrative expenses
16. Pass through funds
17. Debt service and bond payments
18. Emergencies and contingencies to cover unplanned expenditures

8 Financial Planning for Transportation Asset Management
Figure 1 shows the primary categories of uses of funds from the Colorado DOT.
Figure 1. Example of uses of funds from Colorado DOT’s 2013 Annual reportSOURCE: COLORADO DOT

Report 2: Components of a Financial Plan 9
For illustrative purposes, this report will summarize the activities into the following major categories of uses. For simplicity, this report combines maintenance and preserva-tion activities specific to bridges and pavements. Agencies can add categories and details as may be applicable to them.
1. Bridge preservation and maintenance
2. Rehabilitation and replacement of bridges
3. Pavement preservation and maintenance
4. Pavement rehabilitation and replacement
5. Safety (Traffic engineering, signs, signals, ITS)
6. Other Assets (culverts, rest areas)
7. Operations & Maintenance (snow maintenance, ditching, pot hole patching)
8. Debt service
9. Local projects (includes pass-through to local and other agencies)
10. Administrative and Payroll
Historical Trends for the Uses of FundsIf past expenditures were based on strategic funding decisions, then the historical performance and condition of assets, the amount of funds invested each year in relation to those assets, and the trends related to these parameters can provide valuable information that can be useful in estimating the investment needed in the future. Strategic asset manage-ment deals with addressing the life-cycle of assets through

10 Financial Planning for Transportation Asset Management
timely maintenance and preservation. They help to cost effectively extend the useful life of assets. If past expendi-tures resulted in acceptable asset condition levels then they can be benchmarks for extrapolating future needs, however, care should be taken because past performance is no guar-antee of future results. To the contrary, if past conditions declined, historic expenditures may not have been adequate and may need to be increased in the future. Irrespective, a review of the past conditions and performance trends for assets and the investments made to support various preser-vation and maintenance programs, help to provide context to the realistic state of repair of those assets. It provides impor-tant insight into future long-term treatments needed to cost effectively extend their useful life. The historic trends also shed light on trade-offs that can be made to maximize the use of limited resources. Such information will be very helpful in developing the related long term treatments and the financial plan that details the amount of funds that will be needed to support the long-term asset management plan.
Historical information can be critical for three reasons. First, it can illustrate whether past expenditures were adequate, and if not they need to be increased. Second, state agencies operate under scrutiny of state budgeters, who will want to know why the agency is indicating it needs to substantially change asset expenditures, and not rely on more traditional incremental growth in those budget categories. Third, the more historic trend line information an agency has regarding past investments and the asset conditions achieved, the more confidence it will have on forecasting future investment needs and the resulting asset conditions.
Many state agencies track the expenditure and performance of their assets by category. State agencies vary in how they categorize their roadway network and other assets. For example, Utah DOT categorizes the pavements as being on the National Highway System (NHS), or as Level 1 or Level 2,

Report 2: Components of a Financial Plan 11
based on the number of vehicles or trucks that travel on the system each day. Colorado DOT categorizes the system when discussing investments as Interstate, NHS, On-State System-Non-NHS, and On-state highway system[1]. The performance goals that states establish for such categories can vary, with higher performance and condition goals for the NHS and for more used parts of the network. States also may combine treatments related to pavements differently.
Most states track at least their high value assets and the performance achieved by the investments made into those assets. Typically, state agencies track the investments made, and the performance and condition improvements achieved in the following categories:
��� Pavements
��� Bridges
���Other Assets
���Maintenance
��� Safety
Historical information is integral to making future projections and such information on the asset conditions, performance and related investments for these categories along with other information can be used as valuable input in estimating:
a. The condition targets pursuant to the TAMP,
b. The needed investments to meet those condition targets, and
c. The implications on performance if those investments are not made at the desired levels.

12 Financial Planning for Transportation Asset Management
Table 1 summarizes the performance in 2013 of various categories in the Colorado DOT’s state system and shows how it tracks the condition and performance of its assets.
Asset Inventory Unit 2013 Inventory
Performance Measure
2013 Performance
Pavement Lane-miles 23,024Percent with high or moderate drivability life
82%
Bridge Number of bridges 3,438
Percent deck area on bridges classified as structurally deficient
6.3%
Maintenance N/A N/A Level of service B-
Fleet Number of vehicles 3,299 Percent of useful life 96%
ITS Equipment
Number of devices 2,024 Percent of useful life 143%
Buildings Building 1,174 Letter grade C or Better
Tunnels Length in miles 6.9 Condition of manned
tunnels Good
Culverts Number of culverts 6,668 Percent critical 4.4%
Rockfall Sites/ Corridors 760/38 Percent risk reduction
of occurrence TBD
Table 1. CDOT Inventory and Asset Conditions on State SystemSOURCE: COLORADO DOT, DECEMBER, 2013 TAMP
In addition, states will also track expenses incurred on new construction, administrative categories and debt service payments such as bond payments.
The asset conditions, treatments and the related investments of the past can provide insight into the amount of funds that will need to be expended by the agency in future years. The information can thus be used as input to estimate the invest-ment needs to meet desired targets for future years.
States differ in the amount of funds that have historically been expended on asset management activities. Most states have not been able to invest the funds that they deemed

Report 2: Components of a Financial Plan 13
necessary to meet desired system conditions in the past several years. This typically results in a downward revision of the performance targets that they try to achieve. With aging infrastructure and limitations in funding, agencies have typically had to prioritize and make decisions on where to invest the limited funds available and how much to expend by category. States differ in the size and inventory of various assets and programs and the priority given to various assets. Some states have more aging bridges and pavements than others. For some states, floods are a priority, whereas for others tunnels, slips and slides and rock-falls may be a priority. The programs, the budgets and the historic budget trends will reflect these differences amongst states. Appro-priate utilization of the historical data about asset expendi-tures and the resulting conditions in projecting for the future can thus help set expectations for the performance and conditions that can be achieved in future years. Based on the historical data and forecasted asset condition, long-term preservation techniques and appropriate levels of and main-tenance can be programmed to maximize the performance of priority assets.
Table 2 (see page 16) summarizes the various historical uses of funds for a sample state DOT for the 2010-2014 period as an illustrative example. The budget established by that state for 2015 is also shown. It is to be noted that the specific amounts and trends shown in this table do not bear resem-blance to any state DOT and are shown purely for illustrative purposes. To help provide context and to facilitate compara-tive analysis involving the preparation of a financial plan, illustrative data for this sample DOT is presented through other sections of this report.
The expenditures in Table 2 are broken down by some of the major asset and expense categories common to most DOTs. These categories will of course vary across states. The categories in Table 2 for the sample State DOT include:

14 Financial Planning for Transportation Asset Management
1. Pavement program
2. Bridge Program
3. Maintenance
4. ITS
5. Safety
6. Other assets
7. New Construction
8. Local Projects
9. Debt Servicing
10. Programming/Project Delivery
11. Administrative Expenses.
The example shows that the total uses of funds for 2010 through 2014 averaged $626 million each year and totaled approximately $3.13 billion for the five year period. By contrast, the total funds allocated for 2015 is $620 million.
The presentation of the historic expenditures in a summary table as used in Table 2 can be valuable to decision makers. Pavements and bridges are typically the highest valued assets for transportation agencies. Maintaining and preserv-ing these assets take a significant portion of agency funds and are therefore the highest priority. Agencies will focus their analysis on the performance, condition and age of these high-value assets and devise plans for replacing, preserving and maintaining them. In view of the importance of these two categories, they have been specifically highlighted in

Report 2: Components of a Financial Plan 15
Table 2 which provides an at-a-glance financial view of the historic uses of funds and the overall performance that was achieved for the two major asset categories. Table 2 also shows the Dollar amounts that were used to fund mainte-nance activities, new construction, local programs, adminis-trative and other obligations that were accrued by the agency to meet its needs.
As can be observed from Table 2, the sample state DOT spent an average of $54 million annually for the rehabilitation and replacement of pavements and an average of $58 million on preservation and maintenance activities between 2010 and 2014. For 2015, the DOT allocated $60 million and $45 million respectively for these two categories. It shows that the overall (system-wide) percentage of pavements in “good” condition achieved during that period varied between 78 and 74 percent. It also shows that for 2015, the sample DOT expects to improve its overall pavement condition rating to 78 percent with the allocated budget of $105 million.
Table 2 shows the amounts expended for rehabilitation and replacement of bridges and for their maintenance during the 2010-2014 period. It also shows the percent of structural deficiency of bridges that the agency was able to achieve as a result of the investments made. Showing the condition and performance information alongside the investments provides a quick view of the correlation between the two parameters. This also provides perspective and sets expectation on future investment needs and related achievable asset performance. The impact of inflation is not displayed as a separate line item in the example. However, the performance achieved for pavements and bridges inherently reflects the declining purchasing power of the dollar as a result of inflation.
The third major category depicted in Table 2 is Maintenance, which is further broken down into traffic, drainage, and winter related maintenance separately. The remaining

16 Financial Planning for Transportation Asset Management
Uses of Funds 2010 2011 2012 2013 2014 2015 Total Average
(2010-2014) Overall (NHS + Non-NHS) Pavement Condition Rating (%) 78% 76% 77% 76% 74% 78% N/A N/A
Pavement Rehab & Replace 60 51 55 53 51 60 330 54
Pavement Preservation 27 39 36 37 35 27 201 35
Pavement Maintenance 18 26 24 25 23 18 134 23
Subtotal Pavement Program 105 116 115 115 109 105 665 112
Bridge Structural Deficiency– NHS and Non-NHS (%) 20% 17% 19% 17% 16% 20% N/A N/A
Bridge Rehab & Replace 60 70 78 72 75 60 415 71
Bridge Maintenance 45 45 49 48 43 45 275 46
Subtotal Bridge Program 105 115 127 120 118 105 690 117
Traffic Maintenance 10 15 12 11 9 10 67 11
Drainage Maintenance 5 5 8 7 5 5 35 6
Winter Maintenance 25 25 26 22 23 25 146 24
Other Maintenance 50 40 33 45 42 55 265 42
Subtotal Maintenance 90 85 79 85 79 95 513 84
ITS 5 5 5 5 5 5 30 5
Safety 10 11 13 12 9 10 65 11
Other Assets 23 25 19 22 15 25 129 21
New Construction 89 94 81 81 77 65 487 84
Local Projects 24 19 22 30 33 40 168 26
Debt Svc. Existing obligations 132 130 131 123 122 125 763 128
Debt Svc. New State Bonds – – – – – – – –
Subtotal Debt Servicing 132 130 131 123 122 125 763 128
Programming/Project Delivery 17 17 18 18 19 20 109 18
Administrative Expenses 20 21 22 24 24 25 136 22
TOTAL USES 620 638 632 635 610 620 3,755 627
Table 2. Illustrative Example of Historical Uses of Funds for Sample State DOT (All figures in $ Millions)

Report 2: Components of a Financial Plan 17
maintenance items combined under a line item called “other”. The specific line items under the Maintenance category will vary across states. States that do not have to address winter maintenance activities may not have a line item for it. Simi-larly agencies that have to address flooding, or the remedia-tion of slips, slides and rock-falls may have specific line items in their version of the table.
Other categories include Safety, Intelligent Transportation Systems, Other Assets, New Construction and Local Pro-grams. States have specific obligations and goals for safety and many have been addressing mobility through ITS activi-ties. In the sample DOT the budget for all assets not specifi-cally listed has been combined and presented as “Other Assets”. Although the state agency may have specific goals for each of these categories, for convenience, the summary view in Table 2 does not show the performance conditions achieved for them.
State agencies may choose to depict information in greater detail than shown in Table 2. They may have prioritized their assets based on valuation and/or on critical function. They may be tracking detailed information on performance as well as budget levels for each of these assets and may choose to show detailed information related to them. Providing the budget levels and the performance achieved highlights the importance of these assets. In the end, the analysis of the condition, the treatments and budget trends provides valu-able insight into future investments needed.
Transportation Agency Examples
The following are examples of reporting by various transpor-tation agencies of performance of specific assets versus historic budgets.

18 Financial Planning for Transportation Asset Management
Colorado DOTFigures 2 and 3 provide historical information from the Colorado DOT. Figure 2 shows the relationship between historical budgets and overall roadway conditions (OCR). Figure 3 similarly shows the historical budgets for bridges and the performance achieved versus the goals established for the percent of bridge deck area not structurally deficient. The agency also publishes an overall budget for asset management activities by asset class.
Figure 2. Historical OCR and Pavement Budgets SOURCE: COLORADO DOT
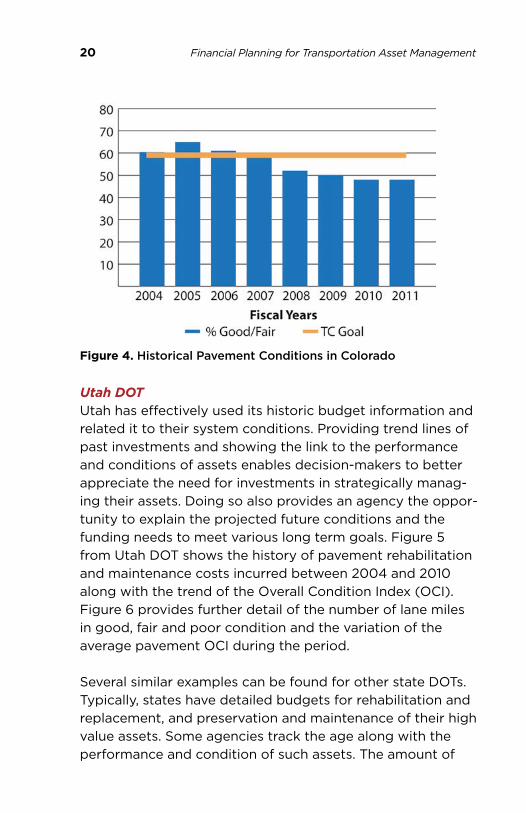
Colorado DOT’s Transportation Commission (TC) had established a goal to maintain 60 percent of the DOT’s 23,000 lane miles in good or fair condition due to financial constraints. The chart in Figure 4 (see page 20) from the DOT’s 2012 Transportation Deficit Report shows the

Report 2: Components of a Financial Plan 19
Figure 3. Historical Bridge Budgets and PerformanceSOURCE: COLORADO DOT
pavement conditions in 2011 finishing with 48 percent in Good/Fair condition. The report states that system condi-tion declined from a high in 2005 due to the decline in program budget and rising resurfacing cost resulting in system-wide deterioration. The report notes that a budget of $159.7 million was allocated in FY 2013 to the Surface Treatment Program. The DOT’s 2013 Transportation Deficit Report shows the network pavement condition dropping further to 47 percent in 2012 stating that the downward slide in pavement condition “portends a costly backlog of repair”. It also states that to make a measurable long-term difference in the pavement surface-treatment quality, addi-tional significant and consistent funding is required over many years. The report also provides projections of future system conditions based on projected funding and justifies the case for increased funding. Such information is very useful in establishing realistic future targets and budgets that would be important for financial planning purposes.
20 Financial Planning for Transportation Asset Management
Figure 4. Historical Pavement Conditions in Colorado
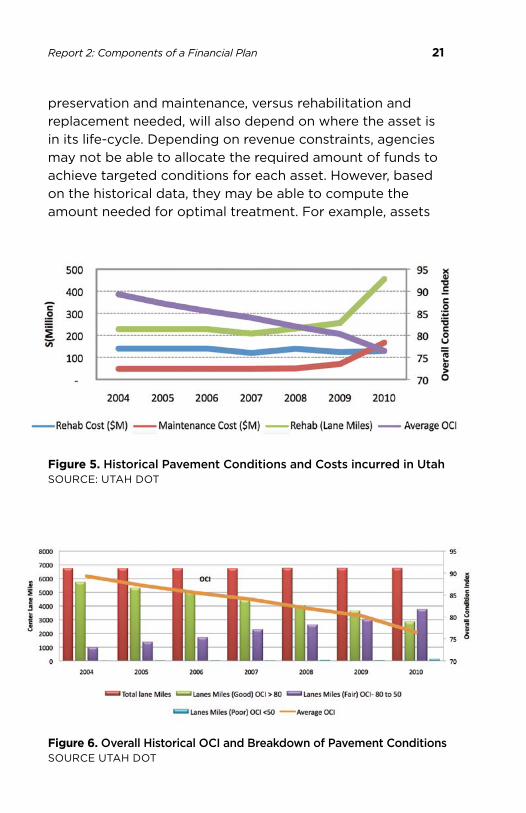
Utah DOTUtah has effectively used its historic budget information and related it to their system conditions. Providing trend lines of past investments and showing the link to the performance and conditions of assets enables decision-makers to better appreciate the need for investments in strategically manag-ing their assets. Doing so also provides an agency the oppor-tunity to explain the projected future conditions and the funding needs to meet various long term goals. Figure 5 from Utah DOT shows the history of pavement rehabilitation and maintenance costs incurred between 2004 and 2010 along with the trend of the Overall Condition Index (OCI). Figure 6 provides further detail of the number of lane miles in good, fair and poor condition and the variation of the average pavement OCI during the period.
Several similar examples can be found for other state DOTs. Typically, states have detailed budgets for rehabilitation and replacement, and preservation and maintenance of their high value assets. Some agencies track the age along with the performance and condition of such assets. The amount of
Report 2: Components of a Financial Plan 21
preservation and maintenance, versus rehabilitation and replacement needed, will also depend on where the asset is in its life-cycle. Depending on revenue constraints, agencies may not be able to allocate the required amount of funds to achieve targeted conditions for each asset. However, based on the historical data, they may be able to compute the amount needed for optimal treatment. For example, assets
Figure 5. Historical Pavement Conditions and Costs incurred in UtahSOURCE: UTAH DOT
Figure 6. Overall Historical OCI and Breakdown of Pavement Conditions SOURCE UTAH DOT

22 Financial Planning for Transportation Asset Management
in “good” to “fair” condition would normally benefit from proactive maintenance and preservation strategies. Such strategies of long-term maintenance and preservation can result in substantial savings for the DOT. In the end, decisions will almost always have to be made on how best to allocate limited resources available to the agency.
Projected Uses for the Financial Plan Period
As can be seen from the discussion above, historical trends provide valuable information and context on the state of the system and the changes to the system conditions that result from the levels of investment made, be they for preservation and maintenance, or rehabilitation and replacement. In combination with needs/gap analysis, assets whole life analysis, risk management analysis, financial obligations, and system condition targets, historical information can be effectively utilized when projecting the investment needs for the future.
The needs of the users serviced by a DOT dictates the capacity, levels of service, and state of the transportation system that the agency must strive to provide. As seen from the agency examples shown above, state DOTs track perfor-mance measures and establish targets relating to those measures that they aim to achieve. Targeted capacity and performance can be further influenced by many other factors, including economic changes, population changes, changes in forecasted freight shippers using the system, environmental factors, political considerations, etc. These parameters are typically dealt with in considerable detail during the asset management planning effort and each transportation agency will have detailed information relative to the level of effort needed and the resultant costs to achieve such targets. In addition to the basic costs of achiev-ing capacity and condition targets, each agency may want to consider the impact to those costs from various types of

Report 2: Components of a Financial Plan 23
risks and uncertainties that might exist. Agencies may also consider that unknown factors such as extreme weather (floods, excessive snowfall, hurricanes, tornadoes, earth-quakes, etc.) can also have an impact on the funds needed to meet and maintain the system within targeted conditions. Inclusion of an extreme weather cost category could have a significant impact on a financial plan as it may result in adjusting targets for other categories included in the plan. Many agencies will also incur financing costs, such as debt service payments on bonds, which must be included in estimating the projected needs.
Management systems can provide valuable information about assets. They typically have information about asset age, historic investments and treatments, and about performance and condition achieved. They also provide information about asset deterioration, and performance and condition trend-lines. These are important inputs for forecasting condition and performance achievable with different levels of invest-ments each year and over the useful life of the asset. The information provided by management systems can help an agency project the appropriate level of investment needed for timely treatments to cost effectively extend the useful life of assets.
Inflation can have a significant impact on the ability of an agency to deliver the program of projects it plans to imple-ment in future years. The long-range plan and the TAMP set the expectation of the program that an agency will deliver. The TAMP also sets expectations on the asset condition that the legislators, public and other stakeholders expect from the agency. Over time, unless accounted for, inflation can significantly diminish the value of the funds available to the agency. Alternatively, inflation can be viewed as an increase in the cost of labor, materials and construction. A financial plan that shows increasing amounts but has not taken into consideration such risks will not reasonably reflect the

24 Financial Planning for Transportation Asset Management
amount of work that can be completed with the funds indicated. Without showing the impact of inflation it may appear that an agency is not achieving the targeted goals even with increase in funds.
The Minnesota Department of Transportation (MnDOT) articulates inflation trends in its 20 Year Investment Plan (2009-2028). These are illustrated in Figures 7 and 8 and provide valuable insight on the purchasing power of the funds available to the state.
The impact of inflation is also illustrated in the projections for costs of implementing the pavement program for the sample DOT as shown in Figure 9. This figure shows that at an assumed annual inflation rate of 3%, the effective costs of implementing its pavement program go up.
Figure 7. MN Construction Cost Index vs Consumer Price Index (All Items)SOURCE: MNDOT

Report 2: Components of a Financial Plan 25
Figure 8. Minnesota Historical Road Construction Expenditures with and without InflationSOURCE MINNESOTA DOT
Figure 9. The Estimated Impact of Inflation on Projected Pavement Program Costs and PCR for a Sample DOT

26 Financial Planning for Transportation Asset Management
Conversely, if such increased costs were not invested, it would result in a commensurate reduction in the achievable Pavement Condition Rating (PCR).
The TAMP prepared by an agency will articulate its asset goals for future years. The budget needs for the state agency will depend on the projected goals reflected in the TAMP. Projections of such needs for the next 10 or more years will provide perspective and help decision makers plan invest-ments for the long-term condition and performance of assets. Agencies can analyze what the long-term condition and performance targets should be based on good asset management practices and life cycle analysis that focuses on whole life of assets and their needs at various stages of the assets’ life. Based on these analyses and targets, agencies can compute the annual investment required over the long-term. Long-term financial plans that are linked to strategic performance and condition of assets are valuable in planning long-term investments. They are also extremely useful in communicating the long-term investment needs for asset management activities with legislators and other stakehold-ers. They can serve as tools to also convey the seriousness of the needs and set expectations on the conditions and perfor-mance the traveling public should expect if the needs are not met or the appropriate investments are not made.
As an initial step in the interactive process of financial planning, the agency can estimate its needs to meet all of its future targets. Such an estimate will be based on the various factors detailed above and the related assumptions used by the agency, and will represent the “future needs” of the agency for the plan period. Table 3 summarizes the future needs for the 2015-2025 period for the sample state DOT.
The funding needs summary in Table 3 shows the invest-ment needed in rehabilitation and replacement and in

Report 2: Components of a Financial Plan 27
Funding Needs 2015 2016 2017 2018 2019 2020 2021 2022 2023 2024 2025 Total
Overall (NHS + Non-NHS) Pavement Condition Rating (%)
77% 80% 82% 84% 86% 87% 87% 87% 88% 88% 88% N/A
Pavement Rehab & Replace 60 85 90 95 95 95 95 95 85 85 90 970
Pavement Preservation 36 44 48 56 64 68 72 72 60 60 64 644
Pavement Maintenance 9 11 12 14 16 17 18 18 15 15 16 161
Subtotal Pavement Program 105 140 150 165 175 180 185 185 160 160 170 1,775
Bridge Structural Deficiency– NHS and Non-NHS (%) 18% 18% 16% 14% 13% 12% 12% 12% 12% 12% 12% N/A
Bridge Rehab & Replace 60 110 125 150 150 170 160 120 100 95 90 1,330
Bridge Maintenance 45 75 90 95 100 110 105 90 75 75 80 940
Subtotal Bridge Program 105 185 215 245 250 280 265 210 175 170 170 2,270
Traffic Maintenance 10 15 15 15 15 20 20 20 20 20 20 190
Drainage Maintenance 5 5 10 10 10 12 12 15 15 20 20 134
Winter Maintenance 25 25 30 30 35 35 35 35 35 40 40 365
Other Maintenance 55 45 45 50 50 55 55 55 60 60 65 595
Subtotal Maintenance 95 90 100 105 110 122 122 125 130 140 145 1,284
ITS 5 5 5 5 5 5 5 5 5 5 5 55
Safety 10 35 30 25 25 25 25 25 30 30 30 290
Other Assets 25 25 20 20 15 20 20 20 25 25 25 240
New Construction 65 80 80 95 100 120 135 120 110 105 105 1,115
Local Projects 40 40 45 55 50 50 45 50 50 50 50 525
Debt Svc. Existing obligations 125 85 85 80 30 – – – – – – 405
Debt Svc. New State Bonds – – – 24 50 84 122 141 139 133 127 819
Subtotal Debt Servicing 125 85 85 104 80 84 122 141 139 133 127 1,224
Programming/ Project Delivery 20 20 20 20 20 20 25 25 25 25 25 245
Administrative Expenses 25 28 28 30 30 32 32 35 35 35 35 345
TOTAL USES 620 733 778 869 860 938 981 941 884 878 887 9,368
Table 3. Illustrative Example of Projected Uses of Funds for Sample State DOT to meet “Aspirational” Targets (All figures in $ Millions)
28 Financial Planning for Transportation Asset Management
preservation and maintenance for pavements and bridges. The improvement in pavement goals illustrated in the table are based on an assumption of strategically replacing and rehabilitating pavements in “poor” condition while maintain-ing the pavements in “good” condition. The assumption is also that of improving pavements in “fair” condition where possible and bringing them up to “good” condition while trying to avoid those in “fair” dropping to “poor” condition. This example does not show separate line items for Inter-state, NHS (non-interstate), and other systems. Similarly the targets for bridges assume that systematically the bridge deficiencies on all the bridges are reduced. As before, this example is shown purely for illustrative purposes and does not bear any resemblance to actual needs of any particular state agency. States can break the information down to sub-systems to illustrate the funding needed to meet tar-gets set for each of those sub-systems. Presenting the financial needs for the ten year period alongside the fore-casted system condition targets provides perspective and valuable information to decision makers.
The projections of funding needed to meet aspirational goals as computed above represents an important step in the financial planning effort. However, the plan cannot be sustainable and implementable if funds are not available to meet these investment needs. A similar process of evaluat-ing the historical sources, trends and related projections will help determine if sufficient revenues will be available to meet these needs or if adjustments will be necessary to the projected uses of funds in order to establish a sustainable financial plan. These aspects are detailed in subsequent sections below. At the time of writing of this report, few U.S. examples of financial plans for TAMP exist. Two examples[2] that exist are from the Colorado and Minnesota DOTs, and are discussed in the following section of this report.

Report 2: Components of a Financial Plan 29
Examples from Minnesota and Colorado DOT TAMPs
The 2014 Minnesota DOT (MnDOT) Draft TAMP illustrates various aspects of the financial planning effort described above. It clearly articulates the investment priorities for the agency with an emphasis on preservation in all asset management categories (Pavement Condition, Bridge Condition and Roadside Infrastructure Condition) for the next 10 years. It further emphasizes that the investment direction taken by the agency is to address high-priority improvements in all investment categories. MnDOT’s asset investment strategies are developed on the basis of these priorities and direction.
In the case of pavements, MnDOT assumes a conceptual model of pavement deterioration illustrated in Figure 10.
Figure 10. Conceptual Model of Pavement DeteriorationSOURCE: MINNESOTA DOT

30 Financial Planning for Transportation Asset Management
It further accounts for various trade-offs to be considered while developing a “balanced investment plan”:
��� Constrained Budget,
��� Pavement Age and Condition,
��� Length of Pavement Segment,
��� Performance Targets, and
��� Pavement Preventive Maintenance
MnDOT’s strategies to ensure that its bridges are structurally sound and safe include:
��� Conduct frequent and regular inspections,
��� Invest in preventive maintenance,
��� Invest in rehabilitation at appropriate times in a bridge’s life-cycle,
��� Refine its Bridge Replacement and Improvement management System (BRIM) to help identify improve-ments that minimize life-cycle costs, meet performance targets, and address the highest-risk bridges, and
��� Defer some long-term fixes and impose occasional weight restrictions to avoid hazardous conditions, as needed.
Similarly, strategies are also described for MnDOT’s Roadside Infrastructure assets.
The financial plan contained in the Draft TAMP also provides a summary of MnDOT’s asset management targets and the estimated investment needed to achieve those targets during the plan period (See Table 4).

31 Report 2: Components of a Financial Plan
Asset Current Condition
Target Recommendation Investment*
Pavement: Interstate 2.45% Poor ≤ 2% Poor $392 million Pavement: Non-Interstate NHS 4.3% Poor ≤ 4% Poor $1.13 million
Pavement: Non-NHS 7.5% Poor ≤ 10% Poor $1.38 billion
Pavement: Total N/A N/A $2.9 billion
Bridge: NHS 4.7% Poor ≤ 2% Poor $1.10 million Bridge: Non-NHS 2.1% Poor ≤ 8% Poor $430 million
Bridge: Total N/A N/A $1.53 billion
Hydraulic Infrastructure: Highway Culverts
10% Poor, 6% Very Poor
≤ 8% Poor, ≤ 3% Very Poor $400 million
Hydraulic Infrastructure: Deep Storm Water Tunnels
39% Poor, 14% Very Poor
≤ 8% Poor, ≤ 3% Very Poor
$35 million (condition) + $1.6 million (inspection)
Other Traffic Structures: Overhead Sign Structures
6% Poor, 8% Very Poor
≤ 4% Poor, ≤ 2% Very Poor $8 million
Other Traffic Structures: High Mast Tower Structures
6% Poor, 15% Very Poor TBD TBD
Table 4. MnDOT Asset Management Targets and Related Investment Needs *Pavement and bridge figures represent 10 year planned investment to meet targets, hydraulic
infrastructure and other traffic structures figures represent 10 year needed investment to meet targets.
SOURCE: MNDOT
Similar to Minnesota, the ten year (2015-2024) funding and asset management spending projections by the Colorado DOT as detailed in its TAMP, are shown in Table 5 (see page 32).
Sources of Revenue
This section discusses the next major component of a financial plan—the sources of revenue. Transportation agencies have several sources of funds. While developing their financial plans, agencies will have to articulate the revenue trends of the past and depending on the developments taking place in their states, the forecasted revenue sources that are

32 Financial Planning for Transportation Asset Management
10 Y
ear E
stim
ate
(Mill
ions
)20
1520
1620
1720
1820
1920
2020
2120
2220
2320
24
Tota
l CD
OT
Estim
ated
Re
venu
e$1
,104
.8$1
,110
.8$1
,132
.7$1
,099
.2$9
75.9
$981
.4$9
86.8
$974
.6$9
77.3
$978
.9
MLO
S$2
51.3
$254
.4$2
62.0
$269
.9$2
77.9
$286
.3$2
94.9
$303
.8$3
12.9
$322
.3
Surfa
ce T
reat
men
t$2
35.2
$235
.9$2
40.0
$240
.0$2
40.0
$240
.0$2
40.0
$240
.0$2
40.0
$240
.0
Brid
ge$5
3.3
$49.
1$5
5.3
$41.
5$4
1.5
$41.
5$4
1.5
$41.
5$4
1.5
$41.
5
Culv
erts
$9.6
$8.2
$9.5
$7.1
$7.1
$7.1
$7.1
$7.1
$7.1
$7.1
Tunn
els
$12.
4$5
.2$1
2.2
$9.1
$9.1
$9.1
$9.1
$9.1
$9.1
$9.1
Wal
ls–
$2.4
$3.0
$2.3
$2.3
$2.3
$2.3
$2.3
$2.3
$2.3
Brid
ge E
nter
pris
e$1
14.9
$115
.0$1
32.3
$134
.6$1
36.9
$139
.3$1
41.8
$144
.5$1
47.2
$149
.9
Rock
fall
Miti
gatio
n$9
.1$9
.2$9
.0$5
.1$5
.1$5
.1$5
.1$5
.1$5
.1$5
.1
Flee
t (Ro
ad E
quip
men
t)$2
0.9
$18.
4$1
8.7
$14.
0$1
4.0
$14.
0$1
4.0
$14.
0$1
4.0
$14.
0
Build
ings
(Pro
perty
)$2
0.8
$12.
9$1
5.5
$7.2
$7.2
$7.2
$7.2
$7.2
$7.2
$7.2
ITS
Mai
nten
ance
$27.
6$2
1.4
$27.
3$1
4.8
$14.
8$1
4.8
$14.
8$1
4.8
$14.
8$1
4.8
Ass
et M
anag
emen
t Tot
al$7
55.1
$732
.1$7
84.8
$745
.6$7
55.9
$766
.7$7
77.8
$789
.4$8
01.2
$813
.3
Tab
le 5
. Co
lora
do
DO
T P
roje
cted
10
Yea
r A
sset
Man
agem
ent
Inve
stm
ents
and
Est
imat
ed R
even
ues
SO
UR
CE
: CO
LOR
AD
O D
OT

Report 2: Components of a Financial Plan 33
expected to support their transportation needs. Some of the common sources of funds for state transportation agencies include the following:
��� State fuel taxes
��� Federal funding
���Other state revenues (Sales taxes, tolls, permits)
��� Grants
��� Bonds
It may be noted that for most states, state fuel tax revenues which continued to increase up to about 2008, have declined since then till 2014. A weakened global economy, increasing fuel economy standards, and increasing use of transit or personal transportation have been identified as the primary causes for this decline. Other state revenue sources, which include state vehicle registration, trucking permit fees and toll revenues, have also not been immune to such decline.
On Federal funding sources, besides Federal-aid, there also have been some short-term revenues from the American Recovery and Reinvestment Act (ARRA) in the recent past. This influx of funds has significantly helped some states address their transportation needs. Past revenue trends from Federal sources will show these funds as a temporary influx. Federal revenue also includes any amounts received from the annual Federal redistribution of funds that states receive.
Revenue from the Federal Highway Trust Fund is a big component of the sources of funds for state transportation agencies. Reduction and increase in this source of revenue has a significant effect on some states where the percentage of their transportation revenue is more tilted towards Federal funds. Examples include the state of Rhode Island and the territory of Puerto Rico. Historic trends and projections as

34 Financial Planning for Transportation Asset Management
detailed in Figure 11 indicate that unless additional revenues are provided to the Trust Fund, or appropriations from the fund are curtailed, it would face inevitable deficits that are unsustainable. This uncertainty may lead to states emphasiz-ing the risks inherent in their financial forecasts. Historical sources such as the Federal Highway Trust fund may not be as reliable or consistent as in the past. This uncertainty further emphasizes the need to take a risk-based approach to forecasting revenue and in the management of assets.
Each state will have many common sources of funds as highlighted above and some that are unique to their state. The main revenue sources for MnDOT as articulated in its 2014 Draft TAMP include Federal-aid (gas tax and General Funds), State gas tax (motor fuel excise tax), state tab fees (motor vehicle registration tax) and state motor vehicle sales tax. The financial plan will need to reflect all sources of revenue. Because the permanency or temporary nature of
Figure 11. Highway Trust Fund Balances and Projected ShortfallsSOURCE: CONGRESSIONAL BUDGET OFFICE

35 Report 2: Components of a Financial Plan
funds has an impact on how and when transportation needs can be met, the plan should reflect the permanency or temporary nature of these revenues.
Table 6 shows the historic funding sources for the period from 2010 to 2014 and the funds allocated for the current year (2015) for the sample State DOT discussed earlier in the report.
Sources of Funds 2010 2011 2012 2013 2014 2015 Total Average (2010-2014)
State Fuel Tax 134 134 135 132 119 120 775 129
State Sales Tax 8 34 51 51 51 60 255 43
State License and Registration Fees 55 55 55 55 55 55 330 55
State Toll Revenues 30 30 30 30 30 30 180 30
State General Funds 60 60 60 60 60 60 360 60
State Bonds – – – – – – – –
Subtotal State Funds 287 313 331 328 315 325 1,900 317
Federal Programs 268 300 291 297 285 285 1,726 288
Other Federal Programs (ARRA) 55 15 – – – – 70 35
Federal Bonds – – – – – – – –
Subtotal Federal Funds 323 315 291 297 285 285 1,796 299
Local Match 10 10 10 10 10 10 60 10
Subtotal Local Funds 10 10 10 10 10 10 60 10
Total 620 638 632 635 610 620 3,756 626
Table 6. Historic Sources of Funds for Sample State DOT (All figures in $ Millions)

36 Financial Planning for Transportation Asset Management
The sources in Table 6 are categorized as state, Federal and local funds. The state sources for the period for the sample DOT shown are state fuel tax, state sales tax, license and registration fees, toll revenues, general fund and bonds. In the period shown, there were no revenues from state bonds. The table illustrates that the funding levels available to the DOT in 2015 were more or less similar in the aggregate to those in the previous five years.
An evaluation of the historic funding trends can provide an insight on what state agencies may expect in the future, albeit they may be affected by the current fiscal environment in the state.
Future Projections for Revenues
The ability of a transportation agency to meet its future performance and condition goals are closely tied to availabil-ity of future funds. The number of such sources and amounts available from them will vary from state to state. During the writing of this report, some states have either passed or are in the process of approving legislation to increase taxes to fund their transportation needs. These include, Utah, which has approved $0.05/gallon gas tax increase with effect from January 1, 2016 and allowed local governments to go to voters for a $0.25 sales tax increase to fund transportation projects; Idaho, where a $0.07 per gallon increase in gas taxes and increases in vehicle registration fees will fund approximately $94 million of roadway and bridge mainte-nance needs (out of a projected need of approximately $262 million); and Mississippi, which authorized $200 million in bonds for bridges and roadway infrastructure. Yet others are in the process of trying to find additional sources of revenue to address their transportation needs. The future projections of sources and amounts of revenue estimated to be available from them will determine an agency’s financial ability to meet the future asset performance and condition

Report 2: Components of a Financial Plan 37
goals detailed in its TAMP. Inability to do timely treatment will have an impact on the deterioration of assets and the amount of resources required to bring assets that may have deteriorated beyond a certain condition back to an acceptable operational level.
Risks and Assumptions
While historical trends might shed light on the levels of funding to expect in the future from known and available funding sources, specific factors surrounding each of those sources may have a major impact on whether similar funding levels can be expected in the future and should be appropri-ately considered.
As noted in Figure 11 and the factors surrounding the High-way Trust Fund, the availability of Federal funding at histori-cal levels in the future may be prone to significant risk owing to the declining balances in the Trust Fund. Similarly, ARRA funds were temporary and these are no longer a source of future funds for states.
States vary in their ability to raise monies through bonds. Depending on its current financial exposure, a state DOT may or may not have the authority and ability to raise funds through issuance of new bonds for a period of time.
The demographics and age of the population and the increases in other transit options may pose risks to the extent of funds that were historically available through licensing and vehicle registration for some states. Similarly, as observed in many states, increasing fuel economy standards of vehicles have resulted in lower fuel tax revenues and the historical trends may not be sustainable.
It would be informative for transportation agencies to list all risks associated with future revenue sources. They could also

38 Financial Planning for Transportation Asset Management
present their assumptions about future sources and the amounts they are projecting will be available. It would be informative for states to show all such potential increases and decreases in the plan and explain any related assumptions. Any impact of other national or international factors that may have an influence on future revenue also could be presented.
Based on the assumptions and risk analysis, reasonable projections of future revenues for the plan period can be estimated for use in the financial plan.
Estimates of Projected Funding for Plan Period
Based on the information available, including the assump-tions and analysis of various funding risks, state agencies can estimate the level of funding that they can reasonably expect to receive from various sources for each year of the plan period. Depending on the risks, agencies may be considering alternative strategies to mitigate the impact of those funding risks. Various funding scenarios, and their impacts on investments towards maintaining system condi-tions to the established targets for each of those scenarios, can be separately considered and incorporated into the plan before its final adoption.
Table 7 illustrates the projected funding for the 10 year period from 2016 through 2025 along with the funds allo-cated for the current year (2015) for the sample State DOT. The table shows an anticipated increase (20%) in the State Fuel Tax with effect from 2016. Similarly, State Sales Taxes, License and Registration Fees, and Toll Revenues are also shown to increase by 10% in 2016. Assuming a repayment of existing liabilities to a level when the state will be in a position to issue new bonds, the sample projections show an aggregate of $1 billion coming from the issuance of new bonds progressively between 2018 and 2022.

Report 2: Components of a Financial Plan 39So
urce
s of
Fun
ds20
1520
1620
1720
1820
1920
2020
2120
2220
2320
2420
25To
tal
Stat
e Fu
el T
ax 1
20
144
1
44
144
1
44
144
1
44
144
1
44
144
1
44
1,5
60
Stat
e Sa
les
Tax
60
66
66
66
66
66
66
66
66
66
66
720
Stat
e Lic
ense
& R
egist
ratio
n Fe
es 5
5 6
1 6
1 6
1 6
1 6
1 6
1 6
1 6
1 6
1 6
1 6
60
Stat
e To
ll Re
venu
es 3
0 3
3 3
3 3
3 3
3 3
3 3
3 3
3 3
3 3
3 3
3 3
60
Stat
e Ge
nera
l Fun
ds 6
0 6
0 6
0 6
0 6
0 6
0 6
0 6
0 6
0 6
0 6
0 6
60
Stat
e Bo
nds
–
––
189
1
71
239
2
72
129
–
––
1,0
00
Subt
otal
Sta
te F
unds
325
3
64
364
5
53
535
6
03
636
4
93
364
3
64
364
4
,960
Fede
ral P
rogr
ams
285
2
94
302
3
11
321
3
30
340
3
51
361
3
72
372
3
,639
Othe
r Fed
eral
Pro
gram
s–
––
––
––
––
––
–
Fede
ral B
onds
––
––
––
––
––
––
Subt
otal
Fed
eral
Fun
ds 2
85
294
3
02
311
3
21
330
3
40
351
3
61
372
3
72
3,6
39
Loca
l Mat
ch 1
0 1
1 5
5
5
5
5
5
5
5
5
6
6
Subt
otal
Loc
al F
unds
10
11
5
5
5
5
5
5
5
5
5
66
Tota
l 6
20
668
6
71
869
8
60
938
9
81
848
7
30
740
7
40
8,6
65
Tab
le 7
. Pro
ject
ed S
our
ces
of
Fun
ds
for
Sam
ple
Sta
te D
OT
for
10 Y
ear
Pla
n P
erio
d (
All
fig
ures
in $
Mill
ions
)

40 Financial Planning for Transportation Asset Management
Table 7 illustrates the projected funding for the 10 year period from 2016 through 2025 along with the funds allocated for the current year (2015) for the sample State DOT. The table shows an anticipated increase (20%) in the State Fuel Tax with effect from 2016. Similarly, State Sales Taxes, License and Registration Fees, and Toll Revenues are also shown to increase by 10% in 2016. Assuming a repay-ment of existing liabilities to a level when the state will be in a position to issue new bonds, the sample projections show an aggregate of $1 billion coming from the issuance of new bonds progressively between 2018 and 2022.
Figure 12 shows the percentage split between the three main sources of funds for the sample State DOT. It signifies a higher reliance on state sources (primarily bonds) until 2022, beyond which state sources more or less match revenues from Federal sources.
Figure 12. Relative Distribution of funds between State, Federal and Local Sources for a Sample State DOT for the 10 Year Plan Period

Report 2: Components of a Financial Plan 41
Gaps and Surpluses
The next step in determining the sustainability of the financial plan elements is to determine if the projected funding levels are sufficient to enable the agency to cover the investment needs it has estimated for meeting its aspirational goals. To the extent that the revenue sources are sufficient to meet an agency’s needs over the course of the plan period, the sources and uses of funds estimated by the agency can make their way into the financial plan supporting its TAMP. However, if gaps in funding exist, or if the identified risk factors can result in gaps in funding during the plan period, the agency will need to evaluate and implement alternative strategies to address such gaps or to mitigate the impact of the anticipated risks.
The illustrations for the sample DOT present a convenient example to explain the process of identification of gaps and strategies that may be utilized to mitigate them. Table 3 showed the funds needed to meet the aspirational long-term asset goals. The needs were based on taking into account the current and historic treatments, the age, other asset conditions, and performance factors. The annual condition and performance targets shown in the example state DOT are assumed to have been developed taking into consideration the life cycle cost and the cost effective treatment approaches to extending the useful life of assets. However, when the projections of the extent of available sources of funds detailed in Table 7 for the sample State DOT are compared with the needs associated with the aspirational targets projected in Table 3, it is found that there is a gap between the amount of funds projected to be available for the ten year period and the total needs to meet the optimal life cycle cost and asset performance and condition targets. Table 8 (see page 42) summarizes the Total Revenues and the Total Uses, and also computes the gap between the two for the plan period.

42 Financial Planning for Transportation Asset Management
Description 2015 2016 2017 2018 2019 2020 2021 2022 2023 2024 2025 Total
Total Revenues 620 668 671 869 860 938 981 848 730 740 740 8,665
Total Uses 620 733 778 869 860 938 981 941 884 878 887 9,368
Gap between Projected Sources and Aspirational Needs
0 (65) (107) (0) 0 0 0 (93) (154) (138) (147) (703)
Table 8. Gap between Projected Sources and Aspirational Needs for Sample DOT (All figures in $ Millions)
With the funding resource limitations observed across the nation, such scenarios are common for most states. Articulating the gaps and the treatments needed to bridge the gaps and create a balanced funding plan thus become very important.
MnDOT’s 2014 Draft TAMP projects that while the revenues it receives from the State Highway Trunk Fund will increase at approximately 2% per year for the next 10 years, associated construction costs are growing at 3% per year, thus creating a gap. Further, it estimates the gap between its operations and maintenance needs and available funding over a four-year period to be approximately $90 million, which equates to approximately $94 million after accounting for inflation (See Table 9).
Similarly, Colorado DOT has completed a specific exercise to identify the gaps between investment needs and revenues projected for a 25 year period between 2016 and 2040. These are more fully described in a Needs and Gap Technical Memorandum[3]. Extracts of illustrations from this report are shown in Table 10 and Figure 13 (see page 44) to amply illustrate the projected gaps in Colorado DOT’s financial projections.

43 Report 2: Components of a Financial Plan
Investment Area Current Budget
Need Beyond Current Budget
Current Gap
Gap Including Inflation
Drainage $43.9 $68.0 $24.1 $25.3
Safety and Guidance: Lighting $19.0 $39.8 $20.8 $21.8
Smooth Roads: Roads $77.8 $86.0 $8.2 $8.8
Smooth Roads: Shoulders $29.9 $40.0 $10.1 $10.6
Structures: Bridge Preventative $16.1 $27.4 $13.0 $13.6
Structures: Bridge Reactive $20.4 $33.6 $8.6 $9.0
Structures: Other Infrastructure– Inspection/Inventory
$21.2 $26.0 $4.8 $94.1
TOTAL $228.3 $320.8 $89.6 $94.1
Table 9. Gaps between Needs and Available Funding for Operations and Maintenance for MnDOT (All figures in $ Millions) SOURCE: MNDOT 2014 DRAFT TAMP
Category Needs Revenue Gap Annual
Highway Asset Maintenance $5,840,780,000 $3,761,544,700 $(2,079,235,300) $(207,923,530.03)
Highway Maintenance $2,745,610,000 $2,544,000,000 $(201,610,000) $(20,161,000.00)
Highway Expansion $8,620,080,000 $661,517,754 $(7,958,562,246) $(795,856,224.65)
Highway Operations $321,640,000 $257,978,544 $(63,661,456) $(6,366,145.63)
Highway Safety $1,203,000,000 $1,013,710,723 $(189,289,277) $(18,928,927.69)
Transit $384,177,826 $384,177,826 $ – $ –
Flexible $ – $1,720,616,554 $1,720,616,554 $172,061,655.38
TOTAL $19,115,287,826 $10,343,546,100 $(8,771,741,726) $(877,174,172.63)
Table 10. Gaps between Needs and Available Funding for various categories for Colorado DOT (2016-2025) (All figures in $ Millions) SOURCE: COLORADO DOT 2015 NEEDS AND GAPS TECHNICAL MEMORANDUM

44 Financial Planning for Transportation Asset Management
Figure 13. Aggregate Gap between Needs and Available Funding for Colorado DOT (2016-2040)SOURCE: COLORADO DOT 2015 NEEDS AND GAPS TECHNICAL MEMORANDUM
Alternative Investment and Funding Scenarios with ConsequencesState agencies can consider various scenarios specific to the estimated sources and uses based on the assumptions and risk factors that they have considered in preparing their projected sources and uses for the plan period. As previ-ously discussed, these will typically include a revision in the achievable targets by re-aligning investment priorities and direction, much like those articulated by MnDOT in its 2014 Draft TAMP. They may also include revisions in the estimates of available funding based on information specific to the assumptions used in preparing initial revenue projections, including accommodations for mitigation of various risks. Ultimately, the final plan will need to balance the adjust-ments to both revenues and investments, so as to arrive at a financial plan that can be reasonably sustained. The final plan can also incorporate some flexibility that will allow for the incurring of certain investments and the resultant improvement in system conditions should any of the uncer-tain funds become available in the future. A dynamic plan of

Report 2: Components of a Financial Plan 45
this nature can also help set the appropriate expectations of achievable system conditions based on the funding that actually becomes available.
In the discussion that follows, different scenarios are described, once again for illustrative purposes only, using the sample State DOT data presented previously.
Scenario 1—Bridge the Gap with Increased Funding
One of the choices available to agency decision makers would be to communicate and convince the public and other stakeholders to find additional sources of revenue to bridge the identified funding gap. The TAMP and the financial plan presented using the aspirational needs (Tables 3 and 7) can serve as good resources in such communication efforts. Scenarios, explained later in this section, can be used to convey the outcome and impact of not addressing these gaps. If this effort is successful and the agency leadership feels confident that the gaps can be filled, then the revenue projections can be suitably revised to reflect such increased funding. The revised revenue projections and the projected investment needs can then form the essence of the final financial plan prepared by the agency in support of its TAMP.
Scenario 2—Targets Reduced to Align Uses with Projected Funding
This scenario assumes that the funding levels originally projected by the agency are reasonably achievable. This would mean that the projected investment needs cannot be fully met because the projected sources are less than the projected uses. In such an event, the agency will need to re-prioritize its asset management objectives and determine how to optimize the various treatments it intends to imple-ment, so as to be able to work within available funding levels. The tradeoffs that will need to be made will necessarily mean

46 Financial Planning for Transportation Asset Management
a slippage in the achievement of condition or service levels for various assets. Table 11 shows the reduction to various categories of uses for the sample State DOT and the result-ing implications of reductions to different priorities to close the funding gaps. Reductions are applied largely during the period prior to and after the period when the revenues from bonds are available to the state agency.
Assumptions for Scenario 2 The following assumptions are made for the scenario in Table 11 for the sample state DOT:
��� All projected revenues will be available
��� Condition and performance goals have been adjusted to prioritize preservation and maintenance of bridges on the NHS and other critical assets. This is reflected in a slight overall increase for both bridge and pavement preservation and maintenance programs, while cuts have been made to rehabilitation and replacement programs. This has resulted in a reduction in the overall pavement condition rating and increase in the percent-age of total deck area that is structurally deficient for bridges (structural deficiency for bridges) (See Figures 14 and 15 on page 48)
��� Cuts have been applied to New Construction, Local Programs and expenditure on rehabilitation and replacement of bridges and pavements.
Such representations (Figures 14 and 15) of the impact of reduction in investment to asset and system conditions can help decision-makers see the trend in the asset conditions at a glance. The information can also be used to articulate the importance of additional investment to the public and other stakeholders.

47 Report 2: Components of a Financial Plan U
ses
2015
20
16
2017
20
18
2019
20
20
2021
20
22
2023
20
24
2025
To
tal
Over
all (
NHS
+ N
on-N
HS) P
avem
ent C
ondi
tion
Ratin
g (%
) 77
%
78%
77
%
79%
81
%
83%
85
%
83%
81
%
78%
76
%
N/A
Pa
vem
ent R
ehab
& R
epla
ce 6
0 6
0 6
0 9
5 9
5 9
5 9
5 7
2 6
0 6
5 6
5 8
22
Pave
men
t Pre
serv
atio
n 3
6 5
2 5
2 5
6 6
4 6
8 7
2 7
6 6
8 6
8 6
8 6
80
Pave
men
t Mai
nten
ance
9
13
13
14
16
17
18
19
17
17
17
170
Su
btot
al P
avem
ent P
rogr
am 1
05
125
1
25
165
1
75
180
1
85
167
1
45
150
1
50
1,67
2 Br
idge
Stru
ctur
al D
efi ci
ency
- N
HS a
nd N
on-N
HS (%
) 18
%
21%
22
%
19%
17
%
15%
14
%
14%
16
%
18%
21
%
N/A
Br
idge
Reh
ab &
Rep
lace
6
0 7
0 7
8 1
50
150
1
70
160
9
5 7
1 7
5 7
5 1,
154
Brid
ge M
aint
enan
ce
45
90
95
95
100
1
10
105
1
00
85
82
83
990
Su
btot
al B
ridge
Pro
gram
1
05
160
1
73
245
2
50
280
2
65
195
1
56
157
1
58
2,14
4 Tr
affi c
Mai
nten
ance
10
15
15
15
15
20
20
20
20
20
20
190
Dr
aina
ge M
aint
enan
ce
5 5
10
10
10
12
12
15
15
20
20
134
W
inte
r Mai
nten
ance
2
5 2
5 3
0 3
0 3
5 3
5 3
5 3
5 3
5 4
0 4
0 3
65
Othe
r Mai
nten
ance
55
40
40
50
50
55
55
55
60
60
65
585
Su
btot
al M
aint
enan
ce 9
5 8
5 9
5 1
05
110
1
22
122
1
25
130
1
40
145
1,
274
ITS
5 5
5 5
5 5
5 5
5 5
5 5
5 SA
FETY
10
35
30
25
25
25
25
25
30
30
30
290
O
THER
ASS
ETS
25
25
20
20
15
20
20
20
25
25
25
240
N
EW C
ON
STRU
CTIO
N 6
5 7
0 6
0 9
5 1
00
120
1
35
70
– –
– 7
15
LOCA
L PR
OJE
CTS
40
30
30
55
50
50
45
40
40
40
40
460
De
bt S
vc. E
xist
ing
oblig
atio
ns 1
25
85
85
80
30
– –
– –
– –
405
De
bt S
vc. N
ew S
tate
Bon
ds
– –
– 2
4 5
0 8
4 1
22
141
1
39
133
1
28
820
Su
btot
al D
ebt S
ervi
cing
125
8
5 8
5 1
04
80
84
122
1
41
139
1
33
128
1,
225
Prog
ram
min
g/Pr
ojec
t Del
iver
y 2
0 2
0 2
0 2
0 2
0 2
0 2
5 2
5 2
5 2
5 2
5 2
45
Adm
inis
trativ
e Ex
pens
es 2
5 2
8 2
8 3
0 3
0 3
2 3
2 3
5 3
5 3
5 3
5 3
45
Tota
l Use
s 6
20
668
6
71
869
8
60
938
9
81
848
7
30
740
7
41
8,66
5
Tab
le 1
1. E
xpen
dit
ures
Red
uced
wit
h Lo
wer
Ass
et G
oal
s to
Ad
dre
ss t
he G
aps
(All
fig
ures
in $
Mill
ions
)

48 Financial Planning for Transportation Asset Management
Figure 14. Sample State DOT—Impact on Overall PCR due to Reduction in Investment (Scenario 2)
Figure 15: Sample State DOT—Impact on Structural Deficiency of Bridges due to Reduction in Investment (Scenario 2)

49 Report 2: Components of a Financial Plan
The July 2014 version of the Minnesota DOT’s TAMP explains that for the four year budget cycle (2012-2015), the budget for maintenance and operation was approximately $860 million, while the needs totaled to $1.25 billion, with a budget gap of $390 million ($410 million with inflation). This includes funds for assets in the TAMP such as drainage, lighting, smooth roads and shoulders, and bridge preventative and reactive maintenance. The TAMP also explains that it will meet the NHS and Interstate pavement condition targets, however with the emphasis on the higher volume NHS roads, the Non-NHS roads will see a performance drop. Tables 12 and 13 (see page 50) show the existing and recommended pavement and bridge condition targets respectively. The tables show the existing target, the aspirational target and the constrained target that shows reductions in targets that have to be made to close the anticipated gap between the future revenues and the amounts that would be needed to meet the aspirational goals.
System
MNSHIP 2012
Condition (% Poor)
MNSHIP Aspirational Target (%)
MNSHIP Constrained
Target/ 10 year
Anticipated Outcome (% poor)
TAMP Target
recommendation
(% Poor)
TAMP Plan
Outcome (% Poor)
Interstate 2.4% < 2% 2% < 2% 2%
Non-Interstate NHS 4.3% <=4% 4% <=4% 4%
Non- NHS 7.5% NA 12% <=10% 12%
Table 12. MnDOT—Existing and Recommended Pavement Condition Targets SOURCE: MNDOT DRAFT 2014 TAMP

50 Financial Planning for Transportation Asset Management
System
MNSHIP 2012
Condition (% Poor)
MNSHIP Aspirational Target (%)
MNSHIP Constrained
Target/ 10 year
Anticipated Outcome (% poor)
TAMP Target
recommendation
(% Poor)
TAMP Plan
Outcome (% Poor)
NHS 4.7% <2% 2% <2% 2%
Non- NHS 2.1% <=8% 6% <=8% 6%
Table 13. MnDOT—Existing and Recommended Bridge Condition Targets SOURCE: MNDOT DRAFT 2014 TAMP
Additional Scenarios State agencies may consider several other scenarios that are reasonably likely and estimate the impacts resulting therefrom. These may include further reduction in revenues to account for the anticipated funding risks, or conversely, a partial increase in funding based on new sources becoming available. The impacts on system conditions can also be presented. Ultimately the scenario representing sources and uses that are most reasonably likely to be achieved along with the implications to the asset conditions can be used to establish the final financial plan.

Report 2: Components of a Financial Plan 51
4. Final PlanHaving evaluated the various scenarios specific to a state agency, the agency can select the plan options that are most realistically achievable for the state. In doing so, the agency could explicitly articulate the various assumptions that are pertinent to the estimates and projections arrived at in the plan. To the extent trade-offs are being planned to balance the investments with reasonable projections of available funding, specific details of such trade-offs must be described. These may involve redefining investment priori-ties, focus on preservation and maintenance over rehabilita-tion and replacement, and other such strategies. These assumptions and strategies may need to be articulated in greater detail to cover specific assets or asset categories, so that clarity in the direction being taken by the agency in completing its TAMP and related financial plan are evident. Given that the planning is expected to cover an extended period of time, such as a ten or twenty year period, the agency may incorporate flexibility for dealing with a variety of scenarios, including, increases or decreases in available funding, increases or decreases in investment needs based on demands to the system, and such other factors it consid-ers pertinent. Based on the projected levels of funding and investments the agency plans to make, projections covering the state of the system and specific asset categories based on the performance metrics it has established would also be pertinent. While these can be described in sufficient level of detail in the plan document to communicate specifics of the plan to its community of stakeholders (traveling public, agency officials, legislators, etc.), the agency may also consider presenting a summary view of the key elements of the financial plan. A summary presentation can provide at-a-glance information pertaining to important elements of the plan that the agency wishes to communicate.

52 Financial Planning for Transportation Asset Management
Table 14 summarizes the projected Sources and Uses for the sample State DOT (Assuming funding and investment from Scenario 2). The summary illustrates that the agency has a balanced plan that eliminates gaps, but with the gaps in funding persisting for the plan period, trade-offs needed to be made in overall system conditions achievable by the agency.
State Agency Examples
The MnDOT financial plan associated with the Draft 2014 TAMP does not provide details of projected sources and uses in the format as presented for the sample DOT. However, the primary sources and uses are depicted in Figure 16 provided in the MnDOT TAMP. Pertinent information is summarized for the plan period in Table 4 (discussed previously). Table 4 shows the summary of the ten year targets established by the Mn-DOT and the investments required to achieve those targets.
Figure 16. Sources and Uses for MnDOTSOURCE: 2014 DRAFT MNDOT TAMP

53 Report 2: Components of a Financial Plan So
urce
s 20
15
2016
20
17
2018
20
19
2020
20
21
2022
20
23
2024
20
25
Tota
l St
ate
Fuel
Tax
120
1
44
144
1
44
144
1
44
144
1
44
144
1
44
144
1
,560
Stat
e Sa
les
Tax
60
66
66
66
66
66
66
66
66
66
66
720
Stat
e Li
cens
e &
Reg
istra
tion
Fees
55
61
61
61
61
61
61
61
61
61
61
660
Stat
e To
ll Re
venu
es 3
0 3
3 3
3 3
3 3
3 3
3 3
3 3
3 3
3 3
3 3
3 3
60
Stat
e Ge
nera
l Fun
ds 6
0 6
0 6
0 6
0 6
0 6
0 6
0 6
0 6
0 6
0 6
0 6
60
Stat
e Bo
nds
– –
– 1
89
171
2
39
272
1
29
– –
– 1
,000
Subt
otal
Sta
te F
unds
325
3
64
364
5
53
535
6
03
636
4
93
364
3
64
364
4
,960
Fede
ral P
rogr
ams
285
2
94
302
3
11
321
3
30
340
3
51
361
3
72
372
3
,639
Othe
r Fed
eral
Pro
gram
s –
– –
– –
– –
– –
– –
–
Fede
ral B
onds
–
– –
– –
– –
– –
– –
–
Subt
otal
Fed
eral
Fun
ds 2
85
294
3
02
311
3
21
330
3
40
351
3
61
372
3
72
3,6
39
Loca
l Mat
ch 1
0 1
1 5
5 5
5 5
5 5
5 5
66
Subt
otal
Loc
al F
unds
10
11
5 5
5 5
5 5
5 5
5 6
6
Tota
l 6
20
668
6
71
869
8
60
938
9
81
848
7
30
740
7
41
8,6
65
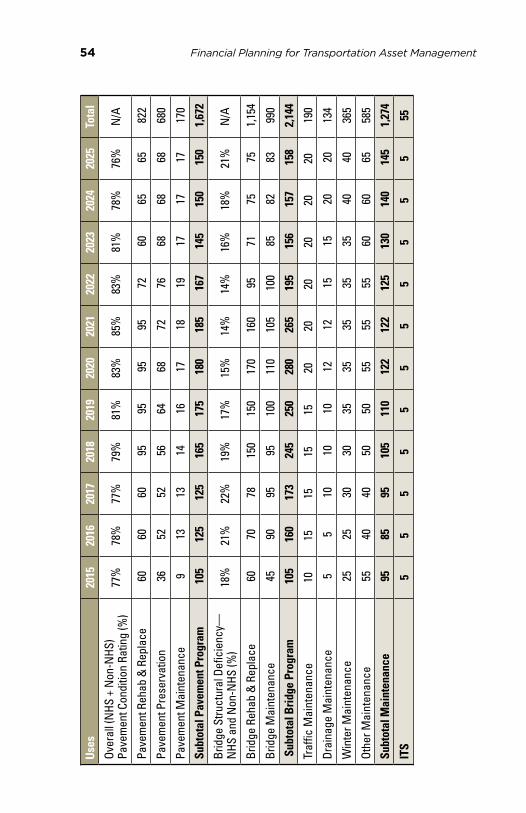
54 Financial Planning for Transportation Asset Management
Use
s 20
15
2016
20
17
2018
20
19
2020
20
21
2022
20
23
2024
20
25
Tota
l
Over
all (
NHS
+ N
on-N
HS)
Pave
men
t Con
ditio
n Ra
ting
(%)
77%
78
%
77%
79
%
81%
83
%
85%
83
%
81%
78
%
76%
N
/A
Pa
vem
ent R
ehab
& R
epla
ce 6
0 6
0 6
0 9
5 9
5 9
5 9
5 7
2 6
0 6
5 6
5 8
22
Pa
vem
ent P
rese
rvat
ion
36
52
52
56
64
68
72
76
68
68
68
680
Pa
vem
ent M
aint
enan
ce
9 1
3 1
3 1
4 1
6 1
7 1
8 1
9 1
7 1
7 1
7 1
70
Subt
otal
Pav
emen
t Pro
gram
105
1
25
125
1
65
175
1
80
185
1
67
145
1
50
150
1
,672
Br
idge
Stru
ctur
al D
efi ci
ency
—
NHS
and
Non
-NHS
(%)
18%
21
%
22%
19
%
17%
15
%
14%
14
%
16%
18
%
21%
N
/A
Br
idge
Reh
ab &
Rep
lace
6
0 7
0 7
8 1
50
150
1
70
160
9
5 7
1 7
5 7
5 1
,154
Br
idge
Mai
nten
ance
4
5 9
0 9
5 9
5 1
00
110
1
05
100
8
5 8
2 8
3 9
90
Subt
otal
Brid
ge P
rogr
am
105
1
60
173
2
45
250
2
80
265
1
95
156
1
57
158
2
,144
Traf
fi c M
aint
enan
ce
10
15
1 5
15
15
20
20
20
20
20
20 1
90
Drai
nage
Mai
nten
ance
5
5 1
0 1
0 1
0 1
2 1
2 1
5 1
5 2
0 2
0 1
34
W
inte
r Mai
nten
ance
2
5 2
5 3
0 3
0 3
5 3
5 3
5 3
5 3
5 4
0 4
0 3
65
Othe
r Mai
nten
ance
55
40
40
50
50
55
55
55
60
60
65
585
Subt
otal
Mai
nten
ance
95
85
95
105
1
10
122
1
22
125
1
30
140
1
45
1,2
74
ITS
5 5
5 5
5 5
5 5
5 5
5 5
5
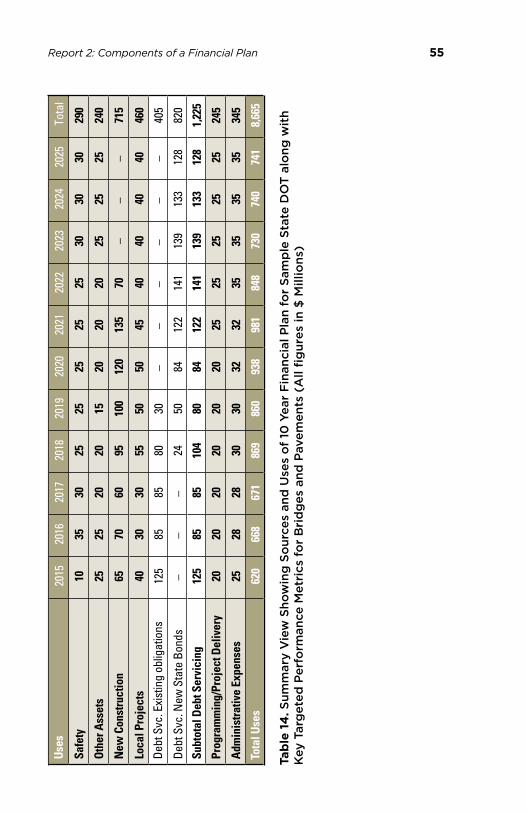
55 Report 2: Components of a Financial Plan U
ses
2015
20
16
2017
20
18
2019
20
20
2021
20
22
2023
20
24
2025
To
tal
Safe
ty 1
0 3
5 3
0 2
5 2
5 2
5 2
5 2
5 3
0 3
0 3
0 2
90
Oth
er A
sset
s 2
5 2
5 2
0 2
0 1
5 2
0 2
0 2
0 2
5 2
5 2
5 2
40
New
Con
stru
ctio
n 6
5 7
0 6
0 9
5 1
00
120
1
35
70
– –
– 7
15
Loca
l Pro
ject
s 4
0 3
0 3
0 5
5 5
0 5
0 4
5 4
0 4
0 4
0 4
0 4
60
Debt
Svc
. Exi
stin
g ob
ligat
ions
125
8
5 8
5 8
0 3
0 –
– –
– –
– 4
05
Debt
Svc
. New
Sta
te B
onds
–
– –
24
50
84
122
1
41
139
1
33
128
8
20
Subt
otal
Deb
t Ser
vici
ng 1
25
85
85
104
8
0 8
4 1
22
141
1
39
133
1
28
1,2
25
Prog
ram
min
g/Pr
ojec
t Del
iver
y 2
0 2
0 2
0 2
0 2
0 2
0 2
5 2
5 2
5 2
5 2
5 2
45
Adm
inis
trativ
e Ex
pens
es 2
5 2
8 2
8 3
0 3
0 3
2 3
2 3
5 3
5 3
5 3
5 3
45
Tota
l Use
s 6
20
668
6
71
869
8
60
938
9
81
848
7
30
740
7
41
8,6
65
Tab
le 1
4. S
umm
ary
Vie
w S
how
ing
So
urce
s an
d U
ses
of
10 Y
ear
Fin
anci
al P
lan
for
Sam
ple
Sta
te D
OT
alo
ng w
ith
Key
Tar
get
ed P
erfo
rman
ce M
etri
cs f
or
Bri
dg
es a
nd P
avem
ents
(A
ll fi
gur
es in
$ M
illio
ns)
56 Financial Planning for Transportation Asset Management
Table 15 summarizes the aggregate anticipated revenues from various sources and projected expenses for different asset management categories for a ten year plan period used by Colorado DOT in its TAMP. Note that expenditures associated with items other than for asset management items are not shown on this table. In Table 16 (see page 58), Colorado DOT highlights current performance, aspirational and constrained targets, and projected performance gaps for various asset categories. Through these two tables, and specific details pertaining to funding gaps as demonstrated in Table 10, Colorado DOT is able to communicate the gaps in performance that result from the gaps in funding. Further details are also provided by Colorado DOT for the plan period for each of its asset management categories, such as pavements, bridges and Maintenance.
As can be observed from the Minnesota and Colorado examples, pertinent information relating to projected Sources and Uses, performance targets, funding gaps, and trade-offs necessary are communicated through a variety of means both at the aggregate level and also at the asset category level. The format and detail to which such informa-tion is communicated varies from state to state, however, information relating to how the agency is able to meet its TAM goals is very effectively communicated by the financial planning effort.

Report 2: Components of a Financial Plan 5710
Yea
r Est
imat
e (M
illio
ns)
2015
2016
2017
2018
2019
2020
2021
2022
2023
2024
Tota
l CD
OT
Estim
ated
Re
venu
e$1
,104
.8$1
,110
.8$1
,132
.7$1
,099
.2$9
75.9
$981
.4$9
86.8
$974
.6$9
77.3
$978
.9
MLO
S$2
51.3
$254
.4$2
62.0
$269
.9$2
77.9
$286
.3$2
94.9
$303
.8$3
12.9
$322
.3
Surfa
ce T
reat
men
t$2
35.2
$235
.9$2
40.0
$240
.0$2
40.0
$240
.0$2
40.0
$240
.0$2
40.0
$240
.0
Brid
ge$5
3.3
$49.
1$5
5.3
$41.
5$4
1.5
$41.
5$4
1.5
$41.
5$4
1.5
$41.
5
Culv
erts
$9.6
$8.2
$9.5
$7.1
$7.1
$7.1
$7.1
$7.1
$7.1
$7.1
Tunn
els
$12.
4$5
.2$1
2.2
$9.1
$9.1
$9.1
$9.1
$9.1
$9.1
$9.1
Wal
ls–
$2.4
$3.0
$2.3
$2.3
$2.3
$2.3
$2.3
$2.3
$2.3
Brid
ge E
nter
pris
e$1
14.9
$115
.0$1
32.3
$134
.6$1
36.9
$139
.3$1
41.8
$144
.5$1
47.2
$149
.9
Rock
fall
Miti
gatio
n$9
.1$9
.2$9
.0$5
.1$5
.1$5
.1$5
.1$5
.1$5
.1$5
.1
Flee
t (Ro
ad E
quip
men
t)$2
0.9
$18.
4$1
8.7
$14.
0$1
4.0
$14.
0$1
4.0
$14.
0$1
4.0
$14.
0
Build
ings
(Pro
perty
)$2
0.8
$12.
9$1
5.5
$7.2
$7.2
$7.2
$7.2
$7.2
$7.2
$7.2
ITS
Mai
nten
ance
$27.
6$2
1.4
$27.
3$1
4.8
$14.
8$1
4.8
$14.
8$1
4.8
$14.
8$1
4.8
Ass
et M
anag
emen
t Tot
al$7
55.1
$732
.1$7
84.8
$745
.6$7
55.9
$766
.7$7
77.8
$789
.4$8
01.2
$813
.3
Tab
le 1
5. 1
0 Y
ear
Ass
et M
anag
emen
t P
lann
ed F
und
ing
and
Inve
stm
ent
SO
UR
CE
: CO
LOR
AD
O D
OT

58 Financial Planning for Transportation Asset Management
Asse
t M
easu
re
Curr
ent
Perfo
rman
ce
Aspi
ratio
nal
Targ
et
Fisc
ally
Co
nstra
ined
Targ
et
Perfo
rman
ce
Gapb
BRI
DG
ES
Perc
enta
ge o
f dec
k ar
ea o
n st
ruct
ural
ly d
efi ci
ent C
DOT-
owne
d br
idge
s 6%
5%
10
%a
5%
BRI
DG
ES
Perc
enta
ge o
f dec
k ar
ea o
n st
ruct
ural
ly d
efi ci
ent b
ridge
s on
th
e N
HS
5%
5%
10%
a 5%
BRI
DG
ES
Perc
enta
ge o
f CDO
T-ow
ned
brid
ges
over
wat
erw
ays
that
are
sc
our c
ritic
al
6%
1%
5%
4%
BRI
DG
ES
Perc
enta
ge o
f brid
ge c
ross
ings
ove
r Int
erst
ates
, U.S
. rou
tes
and
Colo
rado
sta
te h
ighw
ays
with
a v
ertic
al c
lear
ance
less
th
an th
e st
atut
ory
max
imum
veh
icle
hei
ght o
f 14
feet
-6 in
ches
1%
0%
1%
1%
BRI
DG
ES
Perc
enta
ge o
f brid
ge c
ross
ings
ove
r Int
erst
ates
, U.S
. Rou
tes
and
Colo
rado
sta
te h
ighw
ays
with
a v
ertic
al c
lear
ance
less
th
an th
e m
inim
um d
esig
n re
quire
men
t of 1
6 fe
et-6
inch
es
8%
2%
7%
5%
BRI
DG
ES
Perc
enta
ge o
f CDO
T-ow
ned
brid
ges
post
ed fo
r loa
d 0%
0%
0%
0%
BRI
DG
ES
Perc
enta
ge o
f CDO
T-ow
ned
brid
ges
with
a lo
ad re
stric
tion
3%
1%
3%
2%
BRI
DG
ES
Perc
enta
ge o
f lea
king
exp
ansi
on jo
int b
y le
ngth
on
CDOT
-ow
ned
brid
ges
18%
5%
15
%
10%
BRI
DG
ES
Perc
enta
ge o
f CDO
T-ow
ned
brid
ge d
eck
area
that
is u
nsea
led
or o
ther
wis
e un
prot
ecte
d 41
%
5%
30%
25
%

Report 2: Components of a Financial Plan 59 A
sset
M
easu
re
Curr
ent
Perfo
rman
ce
Aspi
ratio
nal
Targ
et
Fisc
ally
Co
nstra
ined
Targ
et
Perfo
rman
ce
Gapb
PAVE
MEN
T Pe
rcen
tage
hig
h-m
oder
ate
driv
abili
ty li
fe fo
r Int
erst
ates
bas
ed
on c
ondi
tion
stan
dard
s an
d tre
atm
ents
set
for t
raffi
c vo
lum
e ca
tego
ries
86%
90
%
80%
a 10
%
PAVE
MEN
T Pe
rcen
tage
hig
h-m
oder
ate
driv
abili
ty li
fe fo
r CDO
T-ow
ned
NHS
, exc
ludi
ng In
ters
tate
s ba
sed
on c
ondi
tion
stan
dard
s an
d tre
atm
ents
set
for t
raffi
c vo
lum
e ca
tego
ries
83%
90
%
80%
a 10
%
PAVE
MEN
T Pe
rcen
tage
hig
h-m
oder
ate
driv
abili
ty li
fe fo
r the
Sta
te h
igh
way
sys
tem
bas
ed o
n co
nditi
on s
tand
ards
and
trea
tmen
ts s
et
for t
raffi
c vo
lum
e ca
tego
ries
82%
90
%
80%
a 10
%
MA
INTE
NA
NCE
St
atew
ide
Lette
r Gra
de
BB-
B-a
Non
e
BU
ILD
ING
S St
atew
ide
Lette
r Gra
de
86%
C o
r Be
tter
100%
C o
r Be
tter
90%
C o
r Be
tter
10%
ITS
Aver
age
Perc
ent U
sefu
l Life
14
3%
80%
10
4%
24%
FL
EET
Aver
age
Perc
ent U
sefu
l Life
96
%
70%
TB
D
TBD
CU
LVER
TS
Perc
enta
ge C
ritic
al C
ulve
rts
4.4%
2%
5%
3%
RO
CKFA
LL
Vehi
cle
Expo
sure
Sco
re
TBD
TB
D
TBD
TB
D
TUN
NEL
S TB
D
TBD
TB
D
TBD
TB
D
Tab
le 1
6. C
DO
T O
bje
ctiv
es a
nd T
arg
ets
as d
etai
led
in it
s TA
MP
a Th
ese
obje
ctiv
es a
nd ta
rget
s ar
e fro
m P
D 14
, ado
pted
by
the
Tran
spor
tatio
n Co
mm
issi
on. O
ther
s ar
e st
aff r
ecom
men
ded,
and
sub
ject
to
avai
labl
e fu
ndin
g.b
CDOT
defi
nes
the
perfo
rman
ce g
ap a
s th
e di
ffere
nce
betw
een
aspi
ratio
nal a
nd fi
scal
ly c
onst
rain
ed ta
rget
s.
SO
UR
CE
: CO
LOR
AD
O D
OT
60 Financial Planning for Transportation Asset Management
5. Summary and ConclusionsTransportation assets represent by far one of the largest investments in the nation’s infrastructure. Aging of this infrastructure is resulting in increasing demands on mainte-nance, preservation, rehabilitation and replacement, while at the same time funding limitations are not showing any signs of easing. Being a primary driver of the nation’s economic health, effective management and maintenance of these transportation assets is vital to the nation’s economy. It therefore becomes important to not only be strategic in the way these assets are managed, but also to establish clear priorities based on which they can be managed optimally to extract the highest levels of performance within the constrained budgets seen across the nation. To do so effectively, it becomes important to track the performance of various assets in detail and also to optimize the manner in which investments are made to extract the best performance possible for the long term.
Financial planning provides a means to accomplish these objectives effectively. The elements of a financial plan should be such as to not only facilitate the preparation of an objective long-term plan to support strategic TAM objec-tives, but also to communicate the essence of the planning effort to stakeholders. This will entail demonstrating the realistic asset management needs based on an objective evaluation of the necessary investments to keep the assets performing at certain desired levels. At the same time, realistic projections must be prepared to recognize the level of funding that can be expected to meet these invest-ment needs. To the extent that there are gaps in funding observed, steps will need to be taken to optimize the use of limited funds. Not only will the proper planning and objective, data based financial projections allow an agency to accomplish this, it will also allow an agency to project the consequences of not making the needed investments.

Report 2: Components of a Financial Plan 61
Inevitably, reduced investment will result in a decline in performance. As seen from the examples referenced in the report, documenting the historical trends, the factors influencing the achievement of performance targets, gaps in funding, trade-offs to be made in the final plan, and the details of the final plan prepared which balances all these considerations, allows an agency the means to do that. In so doing, an agency is able to inform its stakeholders and user community of what might be expected from the transporta-tion assets over the long term. It also provides decision makers the basis on which to request for and obtain the necessary funding to preserve, protect, maintain and man-age the nation’s transportation assets at desired levels of performance. In addition, the financial plan related to the TAMP highlights the responsibilities faced by transportation agencies and their financial ability to leave transportation assets in a state of good repair for future generations.

62 Financial Planning for Transportation Asset Management
6. References[1]�CDOT’s Risk Based Asset Management Plan, December 9,
2013, Colorado DOT.
[2]�At the present time the FHWA is in the process of rulemaking, and the regulations pertaining to the TAMP certification have not been finalized. Therefore, references to the current State DOTs’ TAMPs are solely for the pur-pose of illustration and do not indicate that these TAMPs have been certified by FHWA. Needs and Gap Technical Memorandum, Transportation Matters”, March 23, 2015, Colorado DOT.
[3]�Needs and Gap Technical Memorandum, Transportation Matters”, March 23, 2015, Colorado DOT.

Report 2: Components of a Financial Plan 63
Nastaran SaadatmandAsset Management Program ManagerOffice of Asset Management, Pavements, and ConstructionFederal Highway Administration1200 New Jersey Avenue, SEWashington, DC, 20590(202) [email protected]
Stephen GajLeader, System Management & Monitoring TeamOffice of Asset Management, Pavements, and ConstructionFederal Highway Administration1200 New Jersey Avenue, SEWashington, DC 20590(202) [email protected]
Prepared by:
Shobna Varma StarIsis Corporation
and
Gordon Proctor Gordon Proctor & Associates, Inc.
Administrative and Contract Support by:
Greenman Pedersen Inc.


Office of Asset Management, Pavements and ConstructionFederal Highway Administration
1200 New Jersey Avenue, SE • Washington, DC 20590
FHWA-HIF-15-017
ASSET MANAGEMENT FINANCIAL REPORT SERIES