report & accounts 2010 - leek united · unrealistic rates to savers, ... that risk and...
TRANSCRIPT

Report & Accounts 2010
Contents
Directors and Officers 3
Chairman’s Statement 4
Chief Executive’s Report 6
Directors’ Report 8
Corporate Governance Report 12
Directors’ Remuneration Report 14
Directors’ Responsibilities 15
Independent Auditors’ Report 16
Income and Expenditure Accounts 17
Balance Sheets 18
Group Cash Flow Statement 20
Notes to the Accounts 21
Annual Business Statement 38
Member of the Building Societies Association. Authorised and regulated by the Financial Services Authority.
Established 1863
Registered Principal Office: 50 St.Edward Street, Leek, Staffs. ST13 5DL
Telephone: 01538 384151 Fax: 01538 399179E-mail: [email protected] Internet: www.leekunited.co.uk
Registered Number 323B
2
Photograph of Hen Cloud, The Roaches, Staffordshire taken by Mr Clive Shenton of Leek Photographic Club

Kevin Wilson
3
DIRECTORS K Griffiths BSc (Econ), FCA P W Kerns D J Lyons MCISI P Marriott FCA P A Stanyer FCA, FIMI, AInstIB J Washington ACIB K Wilson
CHAIRMAN P Marriott FCA
CHIEF EXECUTIVE K Wilson
FINANCE DIRECTOR K Griffiths BSc (Econ), FCA
INTERNAL AUDITOR I Boston
BANKERS HSBC Santander
AUDITORS PricewaterhouseCoopers LLP Chartered Accountants and Statutory Auditors
Jim WashingtonPhilip Stanyer Peter KernsKeith Griffiths
Derek LyonsPaul Marriott
Directors and Officers
It is with a great sense of pride that the above statement is made.
Our 2010 results have further strengthened and endorsed our
position as a successful, modern mutual with a proven, sustainable
business model.
Our core activities remained the provision of competitive
residential mortgage and savings products with a broader range of
insurance and financial planning products being offered as security
for our members.
A strong funding position is crucial in maintaining a safe, well-balanced
and sustainable building society. As at 31 December 2010, 99% of
our funding was from savings deposits, with the remaining 1% being
from wholesale funding. These figures place our reliance on wholesale
funding as one of the lowest across the entire sector; a fact of which
the board is very proud.
Despite 2010’s profit being slightly lower than the previous year’s,
it remained at a very healthy level. As a mutual building society, our
objective is not profit maximisation, but more a case of profit sufficiency.
A financially robust business that benefits our members is our overriding
aim and we will not pursue unsustainable mortgage business or offer
unrealistic rates to savers, purely to enhance the balance sheet. We will,
therefore, continue to set interest rates to take into account the needs
of our borrowers and savers alike, at levels that protect the integrity of
our business.
Growth and retained profit provide the strength to absorb the ever-
increasing costs of running a successful business, ensuring we keep
pace with appropriate advances in technology and the rising cost
of regulation.
Likewise, our lending policy will always have affordability as its
cornerstone. There is no benefit to the society, nor its members, in
allowing people to borrow beyond their means and I am heartened by
our low arrears levels with just five repossessions during the year. We
believe these encouraging statistics are not merely a consequence,
but also a vindication, of our policy of responsible lending.
Concerns over the economic outlook and the biting reality of
spending cuts have done little to improve a fragile market defined by
weak consumer sentiment and a lack of demand for housing finance.
However, interest rates are likely to remain historically very low for
some time which will continue to support a favourable affordability
position for those entering the market and limit financial pressure on
existing homeowners.
Our share balances and retail deposit accounts achieved a record
increase of £65m and I am very proud to announce that the society
has achieved asset growth of 3.87% for 2010. These creditable
results are testament to the work and measures undertaken by the
society throughout the year.
FSCS Levy
The panic over the collapse of Bradford & Bingley and the Icelandic
banks may now be something of a distant memory, but we continue
to bear a disproportionately high share of this levy when compared
to the banks and other financial institutions that acted less prudently
during the housing market boom.
The society’s liability relating to our share of the interest on the
Government loan to the FSCS in 2010 was £245k. Whilst we continue
to support the need for such a compensation scheme, we do believe
that risk and dependency on wholesale money markets should be
proportionately taken into account when future scheme guidelines
are considered.
Historically, the maximum amount of compensation paid out to
depositors, by the Financial Services Compensation Scheme (FSCS),
if a financial institution failed, was £50,000. However, during last
year, it was announced that this limit was to be increased to the GB
pounds equivalent of 100,000 Euros based on the current exchange
rate. For 2011, the FSCS confirmed that the maximum amount of
compensation would be increased to £85,000.
4
“ Our strong, independent and profitable building society is the result of a sustainable business model that has served us well for almost 150 years.”
Chairman’s Statement

5
We have a longstanding reputation as a safe, trusted and local
mutual building society – somewhere our customers feel is a secure
place with which to entrust their hard-earned savings. Our robust
performance over the past 12 months will serve to strengthen
this standing.
Corporate Governance
The Combined Code of Corporate Governance is the system
by which companies are directed and controlled and in building
societies this has assumed increased importance over recent years.
The board ensures that it operates in line with guidance contained
within the Combined Code of Corporate Governance and believes
that the principles of good governance, accountability and
transparancy, as set out in the Code, will ensure the long-term
success of Leek United.
Further information on the role of the board and its sub-committees
can be found in the Corporate Governance Report on page 12.
Regulation
In an attempt to promote a more prudent and robust banking
system for the future, we have continued to see many changes
in regulation. However, whilst each change in regulation can be
justified on its own merit, the cumulative impact is making legitimate
and prudent business activity increasingly difficult.
Looking forward
During 2011, we will undertake a major enhancement to our main
Information Technology software. The costs associated with
this upgrade are significant, but necessary to ensure continued
progress is achieved in business efficiencies and customer service.
We are well placed to continue serving our members, ensuring that
they are part of a forward-looking society which is loyal to its roots.
Leek United is proud of its position as a strong, independent
organisation, which is going from strength to strength.
Of course, none of this could be achieved without the dedication
and loyalty of the staff, who are the backbone of Leek United. On
behalf of the board, I would like to thank everyone for the superb
contribution they have all made.
Finally, I must thank you, our members, for the loyalty and support
you continue to show. In return, the board and staff of Leek United
will ensure that we will remain a local independent building society,
working for the members and communities we serve.
P MarriottChairman
23 February 2011
Presentation of cheque for £6,115.10, in respect of balances held on the society’s Affinity Account, to the County Air Ambulance Trust.

6
Group Financial Performance
Group profit before tax and FSCS levy £3.87m
Group reserves £50.69m
Group assets £764m
Chief Executive’s Report
Overview
I am pleased to be able to report that 2010 has been another very
successful year for Leek United.
Our 2010 results stand testimony to our ability to cope with
the well-documented adversity of today’s economic conditions.
We continue to trade in an extremely competitive business
environment which is compounded by a deluge of new financial
regulations.
It is against this backdrop, that I am pleased to report a strong
financial performance in 2010.
Group Financial Performance
Group profit before tax and FSCS levy - £3.87m (2009: £4.18m)
Profit after tax - £2.53m (2009: £2.75m)
Group assets - £764m (2009: £735m)
Group reserves - £50.69m (2009: £47.37m)
Management expenses ratio – 0.79% (2009: 0.80%)
Our other key financial ratios including liquidity, gross capital and
free capital have increased during the year to complete a robust
financial performance.
Mortgage Lending
Gross lending in the year was £84m (2009: £60m).
This progressive controlled increase has been achieved without
any compromise on the quality of our prudent lending policy. Our
ability to increase our mortgage lending demonstrates a robust
financial position and a commitment to provide housing funding for
prospective purchasers.
The society retains a significantly strong, high quality mortgage
book with no exposure to sub-prime lending and extremely low
arrears levels. The small mortgage loss we registered during
2010 was the first in six years. This is testament to the continuing
value of our prudent lending policy adopted over many years. Our
traditional individual case underwriting, with a focus towards high
quality and low loan to value mortgage applications, is clearly
continuing to prove its worth.
A consequence of the continuing low interest rate environment
is members, understandably, choosing to reduce their mortgage
balances. We have, therefore, witnessed a significant increase in
capital repayments and monthly overpayments.
Our prudent approach to lending has ensured that we maintain
an enviable record of arrears history. Less than 0.18% of our
borrowers were 3 months or more in arrears as at 31 December
2010, which is significantly below the industry average.
For those members who are experiencing financial difficulties,
we will continue to offer support and forbearance to borrowers
individual circumstances with the aim of achieving a positive
solution, which is in everyone’s best interests.
Savings
Our retail savings balances increased during the year with an overall
retail sales inflow of £65m. Strong demand for our savings products
in a very low interest rate environment is particularly pleasing.
Leek United has, and will continue to offer, a safe, secure and
trusted home for our members’ savings.
We will continue to offer competitive rates of interest to our
members, which refrain from headline short-term introductory
rates. Consistency and fairness, backed by total security for
our members’ hard-earned savings, will always be our
paramount objective.

7
Our People and the Community we serve
The decision by the Lloyds Banking Group to close all of their Halifax
branch agencies provided us with the opportunity to review possible
strategic acquisitions to our branch based member service.
I am delighted to confirm that following a review of numerous
expansion opportunities, we opened two new agencies at
Ashbourne and Wirksworth. This further strengthens the Leek
United brand in our local community and we will continue to review
further business development opportunities in the future.
We are extremely proud of the professionalism, dedication and
motivation of our people. Our results are dependant on our people
delivering a timely, caring and efficient level of customer service.
We are fortunate to have a team who display genuine passion for
the society and its members.
We have continued to support our local communities throughout
2010. Our activities and fund raising involved schools, hospitals,
sports clubs and non-government funded charities such as the
Donna Louise Trust, Douglas Macmillan Charity and the County
Air Ambulance Trust.
Outlook
2011 looks set to provide a very challenging environment. The full
impact of the Government’s spending cuts will bring new pressures
for consumers and businesses. Increases in taxation, a fragile
housing market and rising unemployment will define the economic
environment for the foreseeable future.
Financial markets remain fragile and susceptible to any deterioration
in the global economy. A slow recovery is, therefore, inevitable for
the UK given the magnitude of the recent recession.
All of these issues are likely to have a degree of influence on our
financial performance over the coming year. We will continue to
build on our strong financial position and demonstrate the true
values of a local, independent building society.
Consistency and fairness in our competitive products, fairness
in our business approach, all supported by the highest levels of
customer service, makes for a very compelling proposition for
our members.
I would like to thank you, our members, for your valued support
and we look forward to the future with confidence as we continue
to serve our members’ best interests.
K WilsonChief Executive
23 February 2011
Donation to Douglas Macmillan hospice in Staffordshire, in respect of the votes cast at the Society’s Annual General Meeting.

8
“ The directors have pleasure in submitting the 148th Annual Report and Accounts for the year ended 31 December 2010.”
Directors’ Report
BUSINESS OBJECTIVES AND ACTIVITIESThe society’s primary objective is the provision of mortgage finance mainly for the purchase and improvement of residential property. The funding of this finance is achieved predominantly through the society’s range of personal savings accounts.
BUSINESS REVIEW
The directors are satisfied with the society’s performance during the year. The key developments are described in the chairman’s statement on pages 4 and 5 and chief executive’s report on pages 6 and 7. The society’s business review is contained within the key performance indicators and the principal risks and uncertainties in the following section.
KEy PERFORMANCE INDICATORS
The society uses various performance indicators to monitor its progress. The key performance indicators are as follows:-
Total Assets
Definition total assets is the value of all the assets held as set out in the group balance sheet.
The total assets of the group at the end of 2010 were £763.8m (2009: £735.3m), an increase of £28.5m (3.87%).
Pre-tax Profit
Definition pre-tax profit is the surplus achieved on trading activity in the financial period before tax.
The pre-tax profit was £3.62m in 2010 (2009: £3.86m).
Management Expenses Ratio
Definition the management expenses ratio is the aggregate of administrative expenses and depreciation as a percentage of the average total assets in the year.
The management expenses ratio was 0.79% for 2010 (2009: 0.80%).
Gross Capital
Definition gross capital is the sum of the general reserve, and the revaluation reserve, as shown in the balance sheet.
Gross capital amounted to £50.69m at 31 December 2010 (2009: £47.37m).
The ratio of gross capital as a percentage of total shares and borrowings was 7.14% at 31 December 2010 (2009: 6.94%) and the ratio of free capital as a percentage of total shares and borrowings was 6.92% (2009: 6.68%). Free capital is the general reserve, revaluation reserve and general loss provisions less fixed assets.
Liquid Assets
Definition liquid assets represent the total of cash in hand, loans and advances to credit institutions and debt securities.
Liquid assets, in the form of cash and securities, amounted to £193.5m (2009: £163.1m), representing 27.25% (2009: 23.90%) of shares and borrowings.
The amount of liquidity repayable on demand is £41.9m (2009: £47.3m).
Donation to Donna Louise Trust in Staffordshire, in respect of the votes cast at the Society’s Annual General Meeting.

Leek United staff receiving their NVQ Certificates in Business Management.
9
Gross Lending
Definition gross lending is the total value of all mortgage advances made in the financial year.
Gross lending was £84m (2009: £60m).
Arrears
Definition the number of mortgage accounts on which there is an amount of arrears which exceeds 2.5% of the mortgage balance. This number is expressed as a percentage of total mortgage accounts.
Arrears greater than 2.5% as at 31 December 2010 - 0.18% (2009: 0.27%).
Shares and Deposits
Definition shares and deposits represent the total amount owed by the society to shareholding members and depositors in respect of their account balances.
Investors’ and depositors’ balances at 31 December 2010 totalled £709.9m (2009: £682.5m), an increase during the year of £27.4m (2009: Decrease £21m).
Loans and Advances to Customers
The total amount outstanding on mortgages at the end of the year was £566.8m (2009: £568.6m). At 31 December 2010 there were nil (2009: nil) mortgage accounts which were twelve months or more in arrears. The total amount of these arrears was £nil (2009: £nil).
PRINCIPAL RISKS AND UNCERTAINTIES
General
The board deploys the Audit and Risk Committee (a board sub-committee) and the Risk Management Committee (an executive management committee) to oversee a risk management process which is embedded in the society and which identifies the key risks facing the business. It reviews reports submitted by those committees on how those risks are being managed. On a day to day basis, authority is delegated to management to establish, operate and monitor the risk management systems.
The Audit and Risk Committee’s role with respect to risk management is to assure the board that risks are being managed in accordance with policy and within the limits of the board’s stated risk appetite. The Risk Management Committee’s main responsibility is to assess the management of operational risk across the group. Operational responsibility for market, liquidity and wholesale counterparties credit risk is delegated to the Assets and Liabilities Committee (a board sub-committee) and responsibility for mortgage lending risk to the Lending Committee (a committee made up of executive directors and senior managers).
As a building society, our principal business is the production and distribution of financial products and, in particular, mortgages and deposit-based savings accounts. Regulated investment products are supplied by the group via our subsidiary Leek United Financial Services Limited. The group uses wholesale financial instruments in the management of its balance sheet, investing funds held as liquidity and raising wholesale funding. We also make use of instruments in the wholesale market to manage our interest rate risk and this entails the use of derivative financial instruments. The derivatives are used solely for this purpose and are not used for trading activity or for speculative purposes.

10
Directors’ Report (continued)
Our risk management activity focuses on four principal risk areas:
Credit Risk
Credit risk is the risk that our retail customers or counterparties in the wholesale markets fail to meet their obligations as they fall due. Credit risk in relation to retail customers is governed by limits contained in our board-approved lending policy. Exposure to wholesale counterparty risk is controlled within limits set in policies and procedures agreed by the board with oversight delegated to the Assets and Liabilities Committee. The Assets and Liabilities Committee ensures that appropriate credit limits are established for individual counterparties, sectors, countries and types of financial instrument. Minimum credit ratings are applied where appropriate.
Market Risk
Market risk is the risk that income/expense arising from the group’s assets and/or liabilities varies as a result of changes in interest rates. We manage this risk on a continuing basis, operating to limits set by the board and using on and off balance sheet instruments as described above. The Assets and Liabilities Committee regularly review, manage and control the balance sheet exposures of the society.
Liquidity Risk
Liquidity risk is the risk that we fail to maintain sufficient liquidity to deal with cash flow fluctuations which can arise as a result of our contractual obligations to saving and borrowing members and other wholesale funding counterparties. We manage this risk by ensuring that an appropriate level of liquid assets is maintained using wholesale funding facilities and taking account of the planned and controlled expansion of the business. A significant proportion of the society’s liquidity is held at call or in the form of debt securities which are capable of being sold at short notice. Stress tests are undertaken to measure the society’s ability to meet adverse cash flows on a regular basis.
Operational Risk
Operational risk is the risk of loss resulting from inadequate or failed internal processes, people and systems or from external events. Responsibility for the identification and management of these risks rests with all managers in each business area and they have a direct reporting line to the Risk Management Committee.
DIRECTORS
The following persons served as directors of the society during the year:
Keith Griffiths (Finance Director)Peter Kerns (Non Executive Director)Derek Lyons (Vice-Chairman)Paul Marriott (Chairman )Philip Stanyer (Non Executive Director)David Stevens (Non Executive Director to 21 April 2010)Jim Washington (Non Executive Director)Kevin Wilson (Chief Executive)
STAFF AND AGENTS
The directors wish to acknowledge the contribution made by all staff to the society’s success in 2010. Their enthusiasm and dedication to our objective of exceptional customer service will ensure continued success in the years ahead.
During the financial year the society has maintained and developed systems for the provision of information to employees. In addition, meetings, team briefings, circulars, newsletters and the society’s intranet ensure employees are aware of the society’s performance and objectives and the business environment in which it operates. It is the society’s policy to afford access to training, career development and promotion opportunities equally to all employees regardless of their age, ethnic origin, creed, gender, marital status, disability, sexual orientation and religion or belief. Should employees become disabled, it is the society’s policy to continue their employment where possible with appropriate training and redeployment.
We also wish to thank the society’s agents and many other business associates for their continued support.

11
INTEREST RATES
The residential mortgage base rate was 5.19% throughout the year.
CREDITOR PAyMENT POLICy
For all trade creditors it is the society’s policy to agree the terms of payment at the start of trading with that supplier and to pay in accordance with its contractual and other legal obligations. It is our policy to pay invoices within 15 days (2009: 15).
CHARITABLE DONATIONS
The society made charitable donations of £2,960 (2009: £3,247) during the year.
There were no donations for political purposes.
TREATING CUSTOMERS FAIRLy
Historically the society has always strived to ensure the fair treatment of its customers in every way, and as part of its continuing commitment to that principle has completed an extensive exercise in promoting and developing a cultural model which will continue to support that aim. This involves continually reviewing procedures, measuring performance and listening to customers concerns and complaints, and then taking action to put things right quickly if we fall below our high standards.
PROVISION OF INFORMATION TO AUDITORS
Each person who is a director at the date of approval of this report confirms that:
• so far as the director is aware, there is no relevant auditinformation of which the society’s auditors are unaware; and
• each director has taken all the steps that he ought to havetaken as a director to make himself aware of any relevant audit information and to establish that the society’s auditors are aware of that information.
AUDITORS
A resolution to reappoint PricewaterhouseCoopers LLP as auditors to the society will be proposed at the Annual General Meeting.
POST BALANCE SHEET EVENTS
The directors consider that there have been no events since the year end that have an important effect on the position of the society.
On behalf of the board of directors
P MarriottChairman23 February 2011
Leek Derby Street Branch Staff taking part in Leek Show, Staffordshire.

12
“ The society’s board is accountable to members for the careful direction of society affairs, safe stewardship of funds held on members’ behalf and the provision of high quality products and services which meet the needs of individual members whilst offering a fair deal to all.”
Corporate Governance Report
At the beginning of 2010, the board consisted of six non-executive and two executive directors. David Stevens retired on 21 April 2010. At the end of 2010 the board, therefore, consisted of five non-executive and two executive directors.
In striving towards ever higher standards of service to members, the board focuses not only on members’ interests as customers for the society’s products and services but also their interests as members of a mutual enterprise. In regard to this latter relationship, we take account of the guidance contained in the Combined Code on Corporate Governance. Whilst this Code is addressed to plcs, many of its provisions can be directly applied to the board and management arrangements in a mutual building society. The board is pleased to confirm that the society complies with the Combined Code in all material and relevant aspects.
A formal system of board appraisal is in place and each director’s personal contribution to board proceedings and society progress in the year has been the subject of rigorous review by the chairman. Performance evaluation of the chairman has been conducted by non-executive directors led by the vice-chairman and taking account of the views of the executive directors.
The overall effectiveness of the board and its committees is monitored throughout the year and is subject to formal review on an annual basis.
All directors participate in a programme of training and professional development designed to keep their knowledge and skills up to date in a fast changing, highly regulated business environment. They are also entitled to obtain independent professional advice at the society’s expense.
The offices of chairman and chief executive are separate and held by different people.
The board considers that all non-executive directors are independent and carry out their duties with complete objectivity. The board has considered the individual performance of any director whose service exceeds nine years and is satisfied that their independence is not impaired as they are considered to be independent in character and judgement and free of any relationship or circumstances which could materially interfere with the exercise of their judgement. Non-executive directors with over nine years service offer themselves for re-election on an annual basis. All other directors are required to submit themselves for re-election at least once every three years.
All directors conform to the requirements of the Approved Persons regime instituted by the Financial Services Authority and pass the “fit and proper” test specified in the FSA’s Handbook.
The Combined Code recommends that a non-executive director should be designated as the senior independent director with responsibility for leading non-executive directors in the performance appraisal of the chairman and to act as a contact for any member who may feel that contact with the chairman or chief executive would not be appropriate. The board considers that the duties of this role are encompassed within the role of the society’s vice-chairman, Derek Lyons, who is pleased to act as an alternative contact point for members.
Register of Candidates for Board Vacancies
The society maintains a register of potential candidates for future non-executive board vacancies. Members who believe they have the skills, experience and commitment to serve effectively as a director of the society are invited to write, in confidence, to the chairman of the Nominations Committee at the society’s head office.
Sponsorship of the Ashbourne Fun Run.
13
Board Committees
Supervision and direction is facilitated by the operation of a number of board committees which meet regularly to consider issues specific to key business areas.
The Audit and Risk Committee receives reports from the society’s internal auditor and external auditors and its remit includes matters relating to compliance with the Building Societies Act 1986 and the Financial Services and Markets Act 2000, the effectiveness of systems of control, risk management, Internal Capital Adequacy Assessment Process (ICAAP), external audit arrangements, annual report and accounts and all regulatory issues. It considers and recommends the appointment of internal and external auditors and monitors their effectiveness and independence. At 31 December 2010 the committee comprised the following non-executive directors:
J Washington (chair) P Marriott P A Stanyer
The Remuneration Committee considers and approves general policy on staff salaries and benefits, with particular reference to remuneration arrangements for senior management and executive and non-executive directors. The committee makes an annual report to members – this can be found on page 14. The committee is comprised entirely of non-executive directors and committee membership at 31 December 2010 was as follows:
D J Lyons (chair) P Marriott J Washington
The Board Nominations Committee leads the process for board appointments, ensuring a thorough search and selection process based on their evaluation of the balance of skills, knowledge and experience required on the board. All non-executive board vacancies are advertised in the press/media with a regional or national scope as appropriate. The committee also acts in the nomination of new board appointments. At 31 December 2010 the committee comprised:
P Marriott (chair) D J Lyons J Washington K Wilson
Other committees operated by the board, each with its own terms of reference, are as follows:-
Assets and Liabilities Committee monitors and controls balance sheet risk, funding and liquidity. At 31 December 2010 the committee comprised:
K Wilson (chair) K Griffiths P W Kerns D J Lyons J Washington
Information Technology Committee approves and monitors major IT projects. At 31 December 2010 the committee comprised:
P A Stanyer (chair) K Griffiths P W Kerns J Washington K Wilson
Attendance at Board and Board sub-committee meetings - 2010
Audit & Assets & Board IT Remuneration Risk Liabilities Nominations
P Marriott 12 (12) - 4 (4) 4 (4) 1 (1) 1 (1)
K Wilson 12 (12) 3 (3) - - 4 (4) 1 (1)
K Griffiths 12 (12) 3 (3) - - 4 (4) -
P W Kerns 12 (12) 2 (2) - - 3 (3) -
D J Lyons 11 (12) - 4 (4) - 4 (4) 0 (1)
P A Stanyer 12 (12) 3 (3) - 4 (4) 1 (1) -
D A W Stevens 3 (3) - - 1 (1) - - (to 21/4/10)
J Washington 12 (12) 3 (3) 4 (4) 4 (4) 4 (4) 1 (1)
Figures in brackets denote number of meetings for which eligible to attend during the year.
Relations with members
The views of new and existing members are sought by individual questionnaires during the year. Members’ forums are held each year when the chief executive gives a presentation on the main business developments and members present have the opportunity to raise questions to the directors and senior management.
Constructive use of the AGM
The society sends details of the AGM to all members who are eligible to vote. Members are encouraged to vote or appoint a proxy to vote if they cannot or choose not to attend the AGM. A donation to charity is made for each vote cast.
All members of the board are present at the AGM (unless their absence is unavoidable). The chair of all of the committees are therefore available to answer questions raised by members.
On behalf of the board of directors
P MarriottChairman23 February 2011
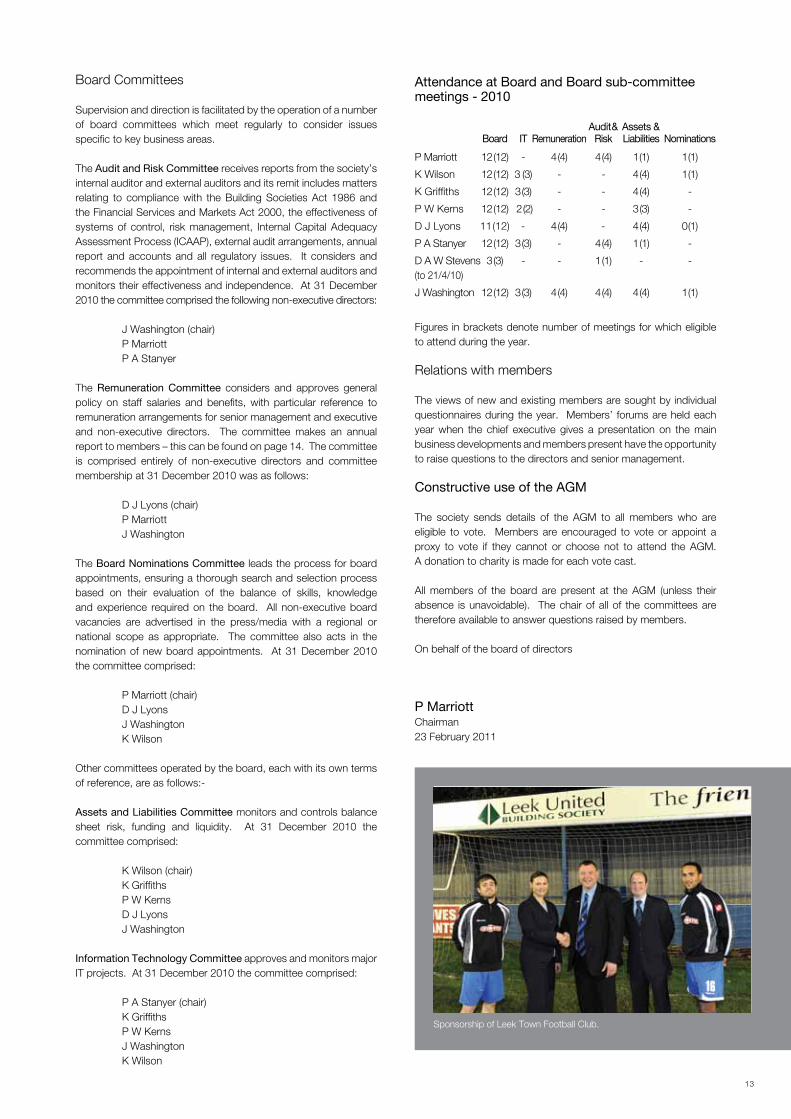
Sponsorship of Leek Town Football Club.
14
“ The society’s Remuneration Committee is composed solely of non-executive directors. D J Lyons, P Marriott and J Washington served on the committee during 2010.”
Directors’ Remuneration Report
The committee’s principal responsibility is the determination of the terms and conditions of employment of executive directors and the level of fees payable to non-executive directors. In making its determinations the committee is guided by the recommendations of the Combined Code on Corporate Governance and so aims to set remuneration at levels that are sufficient to attract, retain and motivate directors of the quality required to run a successful building society such as Leek United.
When considering the remuneration of both the executive and non-executive directors, the Remuneration Committee takes into account comparative data from a range of independent sources covering building societies and firms in the wider financial services sector where the scale and complexity of business operations are similar to those of Leek United.
Executive Directors
The main elements of each executive director’s remuneration package are - basic salary, pension benefits, private medical insurance and the provision of a company car or car allowance.
The chief executive is a member of the Leek United Building Society Pension and Assurance Scheme. In addition, due to salary cap restrictions on his defined benefit pension scheme, the society also contributes into a personal pension scheme.
The finance director is a member of the defined contribution stakeholder pension scheme.
The Combined Code recommends that a director’s service contract period should be set at 12 months or less and the contractual notice period for existing and new executive director appointments conforms to this limit.
Non-Executive Directors
Non-executive directors receive fees for the provision of their services. They do not have service contracts and do not receive any other benefits (other than travelling expenses incurred in the normal course of duties), bonus or pension entitlement.
Directors’ Remuneration
The table in note 5 to the Annual Accounts summarises directors’ pay and benefits for the year ended 31 December 2010.
Member Consultation
The Directors’ Remuneration Report will be the subject of an advisory vote at this year’s AGM.
Remuneration Code
During 2010, the scope of the Remuneration Code has been extended to implement changes required by the Capital Requirements Directive (CRD) and also to take account of provisions relating to remuneration as set out in the Financial Services Act 2010 and Sir David Walker’s review of corporate governance. For the society, a number of the provisions within the new Code will apply from 1 January 2011 with a range of further provisions subject to a transition period of up to six months. The society will be required to fully comply with the Code’s provisions by 1 July 2011. The Committee is confident that the society’s existing policies and practices substantially comply with the Code’s provisions and has established an appropriate plan to review those areas where further developments may be required. The Pillar 3 disclosures required under the CRD will be placed on our website www.leekunited.co.uk/corporate/financial-information.
D J LyonsChair of the Remuneration Committee23 February 2011

15
Directors’ Responsibilities
Directors` Responsibilities for Preparing the Annual Accounts
The following statement, which should be read in conjunction with the statement of the respective responsibilities of directors and auditors on page 16, is made by the directors to explain their responsibilities in relation to the preparation of the annual accounts, annual business statement and directors’ report.
The directors are required by the Building Societies Act 1986 (the Act) to prepare, for each financial year, annual accounts which give a true and fair view:
• ofthestateoftheaffairsofthesocietyandofthegroupasattheend of the financial year;
• oftheincomeandexpenditureofthesocietyandofthegroupfor the financial year.
In preparing these accounts, the directors are required to:
• select suitable accounting policies and then apply themconsistently;
• make judgements and estimates that are reasonable andprudent;
• state whether applicable accounting standards have beenfollowed, subject to any material departures disclosed and explained in the accounts;
• prepare the accounts on the going concern basis, unless itis inappropriate to presume that the society will continue in business.
In addition to the accounts, the Act requires the directors to prepare, for each financial year, an annual business statement and a directors’ report, each containing prescribed information relating to the business of the group.
Directors` Responsibilities for Accounting Records and Internal Control
The directors are responsible for ensuring that the society and its connected undertakings:
• keep accounting records in accordance with the BuildingSocieties Act 1986, and
• take reasonable care to establish, maintain, document and review such systems and controls as are appropriate to its business in accordance with the rules made by the Financial Services Authority under the Financial Services and Markets Act 2000.
The directors have general responsibility for safeguarding the assets of the society and group and for taking reasonable steps for the prevention and detection of fraud and other irregularities.
The directors are responsible for the maintenance and integrity of the corporate and financial information included on the Society’s website. Legislation in the UK, governing the preparation and dissemination of financial statements, may differ from legislation in other jurisdictions.
Going Concern
Having fully considered the financial strength of the society and the current financial market, the directors are satisfied that the society has adequate resources to continue in business for the foreseeable future. For this reason, they continue to adopt the going concern basis in preparing the accounts.
P MarriottChairman23 February 2011
Sponsorship of Leek Cricket Club.
Independent Auditors’ Report to the Members of Leek United Building Society
We have audited the Group and Society Annual Accounts of Leek United Building Society for the year ended 31 December 2010 which comprise the Group and Society Income and Expenditure Accounts, the Group and Society Balance Sheets, the Group Cash Flow Statement, the Group and Society Statements of Total Recognised Gains and Losses, the Accounting Policies and the related notes. The financial reporting framework that has been applied in their preparation is applicable law and United Kingdom Accounting Standards (United Kingdom Generally Accepted Accounting Practice).
Respective responsibilities of directors and auditors
As explained more fully in the Director’s Responsibilities Statement set out on page 15, the directors are responsible for the preparation of annual accounts which give a true and fair view. Our responsibility is to audit and express an opinion on the annual accounts in accordance with applicable law and International Standards on Auditing (UK and Ireland). Those standards require us to comply with the Auditing Practices Board’s (APB’s) Ethical Standards for Auditors.
This report, including the opinion, has been prepared for, and only for, the Society’s Members as a body in accordance with Section 78 of the Building Societies Act 1986 and for no other purpose. We do not, in giving this opinion, accept or assume responsibility for any other purpose or to any other person to whom this report is shown or into whose hands it may come save where expressly agreed by our prior consent in writing.
Scope of the audit of the annual accounts
An audit involves obtaining evidence about the amounts and disclosures in the annual accounts sufficient to give reasonable assurance that the annual accounts are free from material misstatement, whether caused by fraud or error. This includes an assessment of: whether the accounting policies are appropriate to the Group’s and Society’s circumstances and have been consistently applied and adequately disclosed; the reasonableness of significant accounting estimates made by the directors; and the overall presentation of the annual accounts.
Opinion on annual accounts
In our opinion the annual accounts:
• giveatrueandfairview, inaccordancewithUnitedKingdomGenerally Accepted Accounting Practice, of the state of the Group’s and the Society’s affairs as at 31 December 2010 and of the Group’s and the Society’s income and expenditure and the Group’s cash flows for the year then ended;and
• havebeenpreparedinaccordancewiththerequirementsoftheBuilding Societies Act 1986.
Opinion on other matters prescribed by the Building Societies Act 1986
In our opinion:
• theAnnualBusinessStatementandtheDirectors’Reporthavebeen prepared in accordance with the requirements of the Building Societies Act 1986;
• the informationgiven in theDirectors’Report for thefinancialyear for which the annual accounts are prepared is consistent with the accounting records and the annual accounts; and
• theinformationgivenintheAnnualBusinessStatement(otherthan the information upon which we are not required to report) gives a true representation of the matters in respect of which it is given.
Matters on which we are required to report by exception
We have nothing to report in respect of the following matters where the Building Societies Act 1986 requires us to report to you if, in our opinion:
• properaccountingrecordshavenotbeenkeptbytheSociety;or
• theGroupandtheSocietyannualaccountsarenotinagreementwith the accounting records; or
• wehavenotreceivedalltheinformationandexplanationsandaccess to documents we require for our audit.
David Roper (Senior Statutory Auditor)for and behalf of PricewaterhouseCoopers LLPChartered Accountants and Statutory Auditors
Manchester 23 February 2011
16

17
Income and Expenditure Accounts
Notes
Group2010
£000’s
Group2009
£000’s
Society2010
£000’s
Society2009
£000’s
Interest receivable and similar income 2 22,847 24,354 22,820 24,325
Interest payable and similar charges 3 (14,450) (15,577) (14,450) (15,577)
Net interest receivable 8,397 8,777 8,370 8,748
Income from investments 4 - - 300 300Fees and commissions receivable 2,016 1,777 1,333 1,155
Fees and commissions payable (227) (223) (227) (223)
Other operating income 6 12 6 12
Total income 10,192 10,343 9,782 9,992
Administrative expenses 5 (5,652) (5,645) (5,431) (5,411)
Depreciation 13 (282) (285) (271) (278)
Other operating charges 6 (185) (6) (185) (6)
Net finance credit/(charge) on pension scheme 26 80 (137) 80 (137)
Operating profit before provisions 4,153 4,270 3,975 4,160
Provisions for bad and doubtful debts 7 (287) (91) (287) (91)
Provisions for contingent liabilities and commitments - FSCS Levy 24 (245) (320) (245) (320)
Profit on ordinary activities before tax 3,621 3,859 3,443 3,749
Tax on profit on ordinary activities 8 (1,085) (1,107) (953) (994)
Profit for the financial year 23 2,536 2,752 2,490 2,755
Notes
Group2010
£000’s
Group2009
£000’s
Society2010
£000’s
Society2009
£000’s
Profit for the financial year 2,536 2,752 2,490 2,755
Actuarial gain/(loss) recognised in pension scheme 26 1,079 (1,578) 1,079 (1,578)
Taxation relating to actuarial (gain)/loss (291) 442 (291) 442
Total recognised gains and losses relating to the year 3,324 1,616 3,278 1,619
The above results are all derived from continuing operations.
The notes on pages 21 to 37 form part of these accounts.
There is no material difference in the current or previous year between the results above and the
results which would have been reported on an unmodified historical cost basis.
Statement of total recognised gains and losses for the year ended 31 December 2010
Income and Expenditure Accounts for the year ended 31 December 2010

18
ASSETS Notes
Group2010
£000’s
Group2009
£000’s
Society2010
£000’s
Society2009
£000’s
Liquid assets:
Cash in hand and balances with the Bank of England 5,749 864 5,749 864
Loans and advances to credit institutions 9 36,161 70,556 36,078 70,373
Debt securities 10 151,544 91,698 151,544 91,698
Loans and advances to customers:
Loans fully secured on residential property 11 565,748 567,372 565,462 566,689
Loans fully secured on land 11 1,086 1,234 1,086 1,234
Investments in subsidiary undertakings 12 - - 61 522
Tangible fixed assets 13 2,769 2,790 2,740 2,788
Other assets 14 600 592 600 590
Prepayments and accrued income 15 139 215 139 215
Total assets 763,796 735,321 763,459 734,973
Balance sheets at 31 December 2010
Balance Sheets

19
Balance Sheets
LIABILITIES AND RESERVES Notes
Group2010
£000’s
Group2009
£000’s
Society2010
£000’s
Society2009
£000’s
Shares 16 695,724 616,316 695,724 616,316
Amounts owed to credit institutions 17 2,038 39,139 2,038 39,139
Amounts owed to other customers 18 12,116 27,009 12,116 27,009
Other liabilities 19 558 910 983 1,271
Accruals and deferred income 20 569 644 495 577
Provisions for liabilities and charges 21 771 771 771 771
Net pension liability 26 1,328 3,164 1,328 3,164
Revaluation reserve 22 1,113 1,113 1,113 1,113
General reserve 23 49,579 46,255 48,891 45,613
Total liabilities and reserves 763,796 735,321 763,459 734,973
Balance sheets at 31 December 2010
The notes on pages 21 to 37 form part of these accounts.
These accounts were approved by the board of directors on 23 February 2011 and were signed on its behalf by:
Paul Marriott Chairman
Kevin Wilson Chief Executive
Keith Griffiths Finance Director

20
Group Cash Flow Statement
2010£000’s
2009£000’s
Net cash inflow from operating activities (see below) 55,400 14,783
Taxation paid (979) (850)
Capital expenditure and financial investment:
Purchase of tangible fixed assets (262) (120)
Sale of tangible fixed assets 29 8
Purchase of investment securities (198,230) (74,150)
Maturities and disposals of investment securities 138,599 57,348
(Decrease) in cash (5,443) (2,981)
Group cash flow statement for the year ended 31 December 2010
Profit on ordinary activities before tax 3,621 3,859
(Increase)/Decrease in prepayments and accrued income (72) 1,540
(Decrease)/Increase in accruals and deferred income (75) 193
Provisions for bad and doubtful debts 296 100
Increase in provisions for liabilities and charges - 67
Depreciation 282 285
Profit on disposal of tangible fixed assets (28) (7)
Pension contributions in excess of charge (1,496) (907)
Net cash inflow from trading activities 2,528 5,130
Decrease in loans and advances to customers 1,476 14,744
Increase/(Decrease) in shares 79,408 (18,799)
Decrease in amounts owed to credit institutions and other customers (51,994) (2,250)
Decrease in loans and advances to credit institutions 24,000 16,000
Decrease/(Increase) in other assets 12 (5)
Decrease in other liabilities (30) (37)
Net cash inflow from operating activities 55,400 14,783
Reconciliation of operating profit to net cash inflow from operating activities
1 January 2010
£000’s
Movement in year£000’s
31 December 2010
£000’s
Cash in hand and balances with the Bank of England 864 4,885 5,749
Loans and advances to credit institutions - repayable on
demand (note 9) 46,489 (10,328) 36,161
47,353 (5,443) 41,910
Analysis of the balances of cash as shown in the balance sheet

21
Notes to the Accounts at 31 December 2010
Principal accounting policies
The accounts have been prepared in accordance with applicable accounting standards in the United Kingdom and with
the Building Societies (Accounts and Related Provisions) Regulations 1998. The accounts comply with relevant British
Bankers Association Statements Of Recommended Accounting Practices in all material respects. A summary of the more
significant accounting policies, which have been applied consistently, is set out below.
Basis of accounting
The accounts have been prepared on a going concern basis under the historical cost convention, modified to include land
and buildings at valuation. This valuation was performed under the transitional rules of FRS15, consequently land and
buildings have been included at their 31 December 1999 revalued amount.
Basis of consolidation
The group accounts include the results, cashflows and balance sheets of the society and its subsidiaries.
Taxation
The tax charge is based on the profit for the year and takes into account taxation deferred because of timing differences
between the treatment of certain items for taxation and accounting purposes.
Deferred tax is provided using the full provision method in accordance with FRS19 “Deferred Tax”.
Deferred tax is provided at the appropriate future rate on a non-discounted basis, on all timing differences between the
recognition of gains and losses in the accounts and their recognition in the tax computation.
Fixed Assets and Depreciation
Tangible fixed assets are stated at cost with the exception of freehold land and buildings which are stated at their
previously revalued amount and no further revaluations will be undertaken. Freehold buildings are depreciated on a
straight-line basis over 50 years. Freehold land is not depreciated. Equipment, fixtures and fittings are depreciated on a
straight-line basis over their estimated useful lives of between three and fifteen years.
Liquid assets
Liquid assets are stated at cost to the society together with accrued interest to the balance sheet date less any impairment.
At the date of purchase the cost is adjusted where relevant to exclude accrued interest and a similar adjustment is also
made on realisation. Premiums and discounts arising on the purchase of liquid assets are amortised on a straight-line
basis over the period to maturity.
Incentives to borrowers
Mortgage incentives, other than interest discounts, are charged to the income and expenditure account in the year in
which the costs are incurred, and are shown as other operating charges. Interest discounts reduce interest receivable
over the period of the relevant discounted rate.
Broker fees
Introductory fees paid to brokers in respect of mortgages are charged to fees and commissions payable in the year in
which the costs are incurred.
Fees and commissions receivable
Fees and commissions receivable includes the following:
• salescommissionsreceivableintheyearnetofclawbackofanycommissionsrepayable.
• mortgagefeeswhichareaccountedforonareceivedbasis.
1

22
Notes to the Accounts at 31 December 2010
Losses on loans and advances
Provision is made for all incurred losses on loans and advances based upon an appraisal.
Specific provisions are made against mortgage loans on a case by case basis to cover anticipated losses in respect of
all accounts that are in arrears and where a probable loss has been identified. Anticipated losses on such accounts are
calculated as the difference between the current achievable market value of the security, based on current valuations of
the property performed by qualified surveyors, and the outstanding loan balance, after making appropriate allowance for
costs of repossession and sale and any amounts recoverable under external loss insurance.
General provisions are made to reflect the probability that other loans may also be impaired at the balance sheet date,
with the result that the amount outstanding may not be recoverable in full. The provision is based upon the society’s
experience, current economic trends and consistency with industry levels.
Interest recognition
Interest in respect of all loans is credited to the income and expenditure account as it becomes receivable, except in
respect of advances where the property has been taken into possession and where the interest is considered irrecoverable.
Such interest is credited to the suspended interest account.
Pension costs
Pension benefits are provided by an externally funded final salary (defined benefit) scheme administered by Jardine Lloyd
Thompson. Contributions to the scheme are determined by a qualified actuary on the basis of a triennial valuation using
the projected unit method, and are charged to the income and expenditure account over the periods benefiting from the
employees’ services. The charge to the income and expenditure account over the financial year in relation to the defined
benefit scheme is shown in note 26. The society also provides a defined contribution stakeholder pension scheme.
Contributions payable to the scheme are charged to the income and expenditure account in the period to which they
relate.
The liability recognised in the balance sheet in respect of defined benefit pension plans is the present value of the defined
benefit obligation at the balance sheet date less the fair value of plan assets. Quoted securities held as plan assets in the
defined benefit pension scheme are valued at bid price.
The defined benefit obligation is calculated annually by independent actuaries using the projected unit credit method.
The present value of the defined benefit obligation is determined by discounting the estimated future cash outflows using
interest rates of high quality sterling bonds of comparable term to the related pension liability.
Actuarial gains and losses arising from experience adjustments and changes in actuarial assumptions are charged or
credited each year to reserves and shown in the statement of total recognised gains and losses. Past service costs are
recognised immediately in income.
Investments in subsidiary undertakings
Investments in subsidiary undertakings are stated at cost less any provision for impairment.
Derivatives
The criteria required for an instrument to be classified as a hedge are that the transaction must be reasonably expected to
match or eliminate a significant proportion of the risk inherent in the assets, liabilities, other positions or cash flows being
hedged. This results from potential movements in interest rates and market indices. Adequate evidence of the intention
to hedge and linkage with the underlying risk inherent in the assets, liabilities, other positions or cash flows being hedged
must be established at the outset of the transactions.
All interest rate related derivative contracts are accounted for on a consistent basis with the underlying assets, liabilities
and positions. The group hedges its interest rate exposures on a portfolio basis. Amounts accrued on hedging contracts
and instruments are included within accruals or prepayments as appropriate.
23
Notes to the Accounts at 31 December 2010
Interest receivable and similar income
Group2010
£000’s
Group2009
£000’s
Society2010
£000’s
Society2009
£000’s
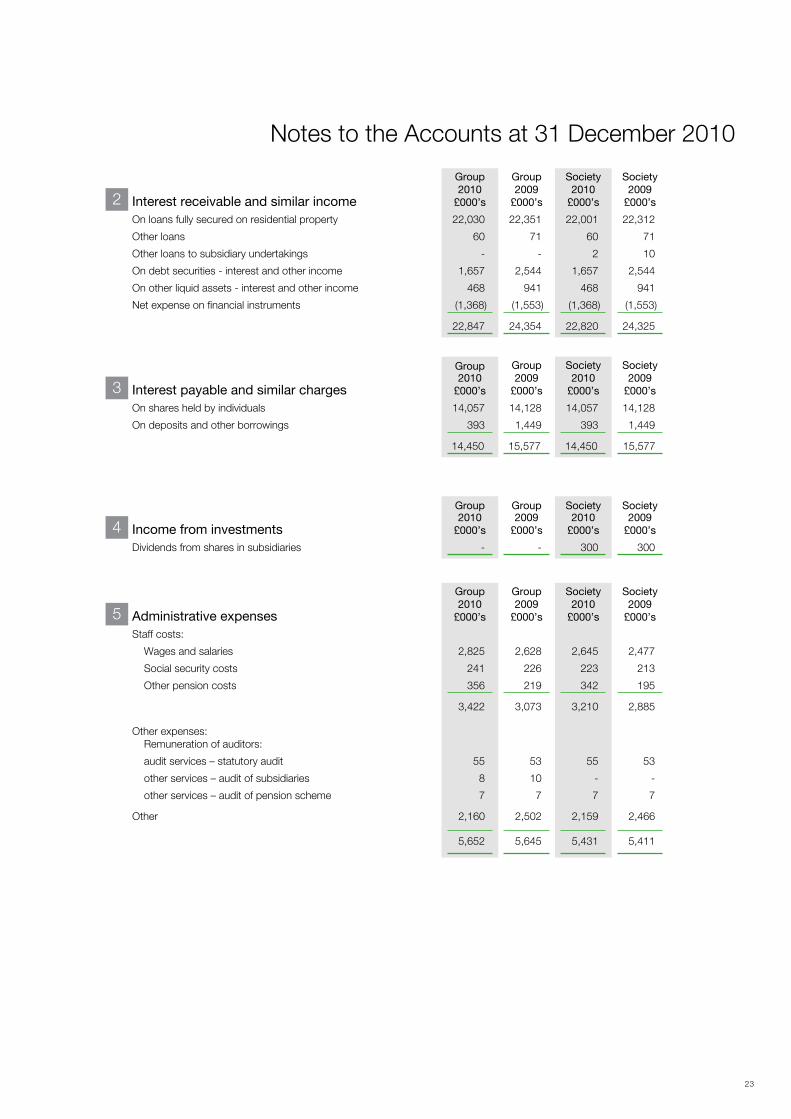
On loans fully secured on residential property 22,030 22,351 22,001 22,312
Other loans 60 71 60 71
Other loans to subsidiary undertakings - - 2 10
On debt securities - interest and other income 1,657 2,544 1,657 2,544
On other liquid assets - interest and other income 468 941 468 941
Net expense on financial instruments (1,368) (1,553) (1,368) (1,553)
22,847 24,354 22,820 24,325
2
Administrative expenses
Group2010
£000’s
Group2009
£000’s
Society2010
£000’s
Society2009
£000’s
Staff costs:
Wages and salaries 2,825 2,628 2,645 2,477
Social security costs 241 226 223 213
Other pension costs 356 219 342 195
3,422 3,073 3,210 2,885
Other expenses: Remuneration of auditors:
audit services – statutory audit 55 53 55 53
other services – audit of subsidiaries 8 10 - -
other services – audit of pension scheme 7 7 7 7
Other 2,160 2,502 2,159 2,466
5,652 5,645 5,431 5,411
5
Interest payable and similar charges
Group2010
£000’s
Group2009
£000’s
Society2010
£000’s
Society2009
£000’s
On shares held by individuals 14,057 14,128 14,057 14,128
On deposits and other borrowings 393 1,449 393 1,449
14,450 15,577 14,450 15,577
3
Income from investments
Group2010
£000’s
Group2009
£000’s
Society2010
£000’s
Society2009
£000’s
Dividends from shares in subsidiaries - - 300 300
4

24
Notes to the Accounts at 31 December 2010
Administrative expenses (continued)The average number of persons (including executive directors) employed during the year was:
Group2010
Number
Group2009
Number
Society2010
Number
Society2009
Number
(i) At principal office:
Full-time staff 48 46 44 42
Part-time staff 20 18 20 18
(ii) At branch offices:
Full-time staff 46 44 46 44
Part-time staff 20 18 20 18
2010 2009
Salary/ Fees
£000’sBenefits£000’s
Increase in
accrued pension£000’s
Pensions£000’s
Total£000’s
Salary/ Fees
£000’sBenefits£000’s
Increase in
accrued pension£000’s
Pensions£000’s
Total£000’s
Non Executive directors
E W Hodkinson (Chairman to 22 April 2009) - - - - - 9 - - - 9
P Marriott (Chairman from 22 April 2009) 30 - - - 30 28 - - - 28
P W Kerns (from 21 December 2009) 20 - - - 20 1 - - - 1
D J Lyons 25 1 - - 26 23 1 - - 24
P A Stanyer 20 - - - 20 19 - - - 19
D A W Stevens (to 21 April 2010) 7 - - - 7 22 2 - - 24
J Washington 21 - - - 21 19 - - - 19
Executive directors
K Wilson 150 10 4 9 173 148 8 3 13 172
K Griffiths 96 1 - 12 109 100 - - 9 109
369 12 4 21 406 369 11 3 22 405
5
Directors’ loans and transactions.
A register of loans and transactions with directors and connected persons is maintained, and is available for
inspection by members at the society’s principal office up to and including 20 April 2011 and at the Annual General
Meeting. The total loans outstanding at 31 December 2010, in respect of 3 (2009: 4) persons, amounted to £373,519
(2009: £499,918).
There is no disclosure in respect of directors’ investment accounts because of the overriding duty of confidentiality with
regard to customers’ affairs.
Analysis of Directors’ remuneration
Other operating charges
Group2010
£000’s
Group2009
£000’s
Society2010
£000’s
Society2009
£000’s
Mortgage incentives 185 6 185 6
6

(b) Factors affecting current tax charge in year:
Profit on ordinary activities before tax 3,621 3,859 3,443 3,749
Tax on profit at UK standard rate of 28% (2009: 28%) 1,014 1,081 964 1,050
Effects of:
Difference between depreciation and capital allowances together with other timing differences (428) (218) (426) (213)
Dividend from subsidiary - - (84) (84)
Expenses not deductible for tax purposes 23 26 23 26
Impact of change in rate - deferred tax 50 - 50 -
Adjustment in respect of previous year - 2 - 2
Small companies relief (2) (2) - -
657 889 527 781
25
Notes to the Accounts at 31 December 2010
The provisions as at 31 December 2010 have been deducted from loans fully secured on residential property in the
balance sheet.
The charge in the income and expenditure account is as follows: 2010£000’s
2009£000’s
Charge for the year 296 100
Amounts recovered in respect of loans previously written off (9) (9)
Income and expenditure account 287 91
Tax on profit on ordinary activities
Group2010
£000’s
Group2009
£000’s
Society2010
£000’s
Society2009
£000’s
(a) UK Corporation tax at 28% (2009: 28%):
Current Tax 657 887 527 779
Adjustment in respect of prior year - 2 - 2
Total current tax 657 889 527 781
UK Deferred tax at 27% (2009: 28%):
Deferred tax - current year (see note 14) 428 218 426 213
Total 1,085 1,107 953 994
8
Provisions for bad and doubtful debtsLoans fully secured on
residential property
Group & Society Specific£000’s
General£000’s
Total£000’s
At 1 January 2010 - 1,000 1,000
Amounts utilised (14) - (14)
Charge for the year 96 200 296
At 31 December 2010 82 1,200 1,282
7
During the year, as a result of the change in the UK main corporation tax rate from 28% to 27% that was substantively
enacted on 20 July 2010 and that will be effective from 1 April 2011, the relevant deferred tax balances have been
re-measured. Further reductions to the UK corporation tax rate were announced in the June 2010 Budget. The changes,
which are expected to be enacted separately each year, propose to reduce the rate by 1% per annum to 24% by 1 April
2014. The changes had not been substantively enacted at the balance sheet date and therefore are not recognised in
these financial statements.

Analysis of debt securities:
Listed 10,048 - 10,048 -
Unlisted 141,496 91,698 141,496 91,698
151,544 91,698 151,544 91,698
Market value of listed debt securities 10,146 - 10,146 -
Debt securities held as financial fixed assets:
Maturity value 150,569 91,130 150,569 91,130
Unamortised premium 192 - 192 -
150,761 91,130 150,761 91,130
Accrued interest 783 568 783 568
151,544 91,698 151,544 91,698
26
Notes to the Accounts at 31 December 2010
9 Loans and advances to credit institutions
Group2010
£000’s
Group2009
£000’s
Society2010
£000’s
Society2009
£000’s
Maturity analysis:
Repayable on demand 36,161 46,489 36,078 46,306
In not more than three months - 24,000 - 24,000
36,161 70,489 36,078 70,306
Accrued interest - 67 - 67
36,161 70,556 36,078 70,373
Maturity analysis:
In not more than one year 120,361 78,780 120,361 78,780
In more than one year 30,400 12,350 30,400 12,350
150,761 91,130 150,761 91,130
Accrued interest 783 568 783 568
151,544 91,698 151,544 91,698
10 Debt securities
Group2010
£000’s
Group2009
£000’s
Society2010
£000’s
Society2009
£000’s
Issued by public bodies 35,062 - 35,062 -
Issued by other borrowers 116,482 91,698 116,482 91,698
151,544 91,698 151,544 91,698
Group & Society 2010£000’s
At 1 January 2010 91,130
Additions 198,230
Maturities and disposals (138,599)
At 31 December 2010 150,761
The directors of the society consider that the primary purpose of holding securities is prudential. The securities held
as liquid assets are held with the intention of use on a continuing basis in the society`s activities and are classified as
“financial fixed assets”.
Movements of financial fixed assets during the year were as follows:

27
Notes to the Accounts at 31 December 2010
It should be noted that the above maturity analysis may not reflect actual experience of repayments since many mortgage loans are repaid early.
11 Loans and advances to customers
The maturity of loans fully secured on residential property and other loans fully secured on land, from the balance sheet date, is as follows:
Group2010
£000’s
Group2009
£000’s
Society2010
£000’s
Society2009
£000’s
Repayable on demand 1,020 667 1,008 656
In not more than three months 4,160 4,139 4,159 4,136
In more than three months but not more than one year 14,566 14,103 14,553 14,089
In more than one year but not more than five years 95,132 95,094 95,086 94,791
In more than five years 453,238 455,603 453,024 455,251
568,116 569,606 567,830 568,923
Provisions for bad and doubtful debts (1,282) (1,000) (1,282) (1,000)
566,834 568,606 566,548 567,923
Leek United Home Loans Limited is a wholly owned direct subsidiary undertaking of the society. The society holds
£100 of shares in the subsidiary. The company is registered in England and Wales. All shares are £1 ordinary shares.
The principal activity of the subsidiary is the purchase and administration of mortgage portfolios. No director had a
beneficial interest in any shares or debentures of the subsidiary undertaking.
Leek United Financial Services Limited is a wholly owned direct subsidiary undertaking of the society. The society holds
£1,000 of shares in the subsidiary. The company is registered in England and Wales. All shares are £1 ordinary shares.
The principal activity of the subsidiary is the provision of financial services. No director had a beneficial interest in any
shares or debentures of the subsidiary undertaking.
The Mortgage Outlet Limited is a wholly owned direct subsidiary undertaking of the society. The society holds £1,000
of shares in the subsidiary. The company is registered in England and Wales. All shares are £1 ordinary shares.
The principal activity of the subsidiary was the provision of mortgage broking services. No director had a beneficial
interest in any shares or debentures of the subsidiary undertaking. The company ceased trading on 31 December 2009.
From 1 January 2010 the company has been dormant.
12 Investments in subsidiary undertakings Society2010
£000’s
Society2009
£000’s
Shares 2 2
Loans 59 520
61 522

28
Notes to the Accounts at 31 December 2010
13 Tangible fixed assets
Group
Freehold land andbuildings£000’s
Equipment fixtures and
fittings£000’s
Totals£000’s
Cost
At 1 January 2010 2,583 4,731 7,314
Additions - 262 262
Disposals - (119) (119)
At 31 December 2010 2,583 4,874 7,457
Accumulated depreciation
At 1 January 2010 383 4,141 4,524
Charge for the year 38 244 282
Disposals - (118) (118)
At 31 December 2010 421 4,267 4,688
Net book value
At 31 December 2010 2,162 607 2,769
At 31 December 2009 2,200 590 2,790
Society
Freehold land andbuildings£000’s
Equipment fixtures and
fittings£000’s
Totals£000’s
Cost
At 1 January 2010 2,583 4,704 7,287
Additions - 230 230
Disposals - (98) (98)
At 31 December 2010 2,583 4,836 7,419
Accumulated depreciation
At 1 January 2010 383 4,116 4,499
Charge for the year 38 233 271
Disposals - (91) (91)
At 31 December 2010 421 4,258 4,679
Net book value
At 31 December 2010 2,162 578 2,740
At 31 December 2009 2,220 588 2,788
29
Notes to the Accounts at 31 December 2010
14 Other assets
Group2010
£000’s
Group2009
£000’s
Society2010
£000’s
Society2009
£000’s
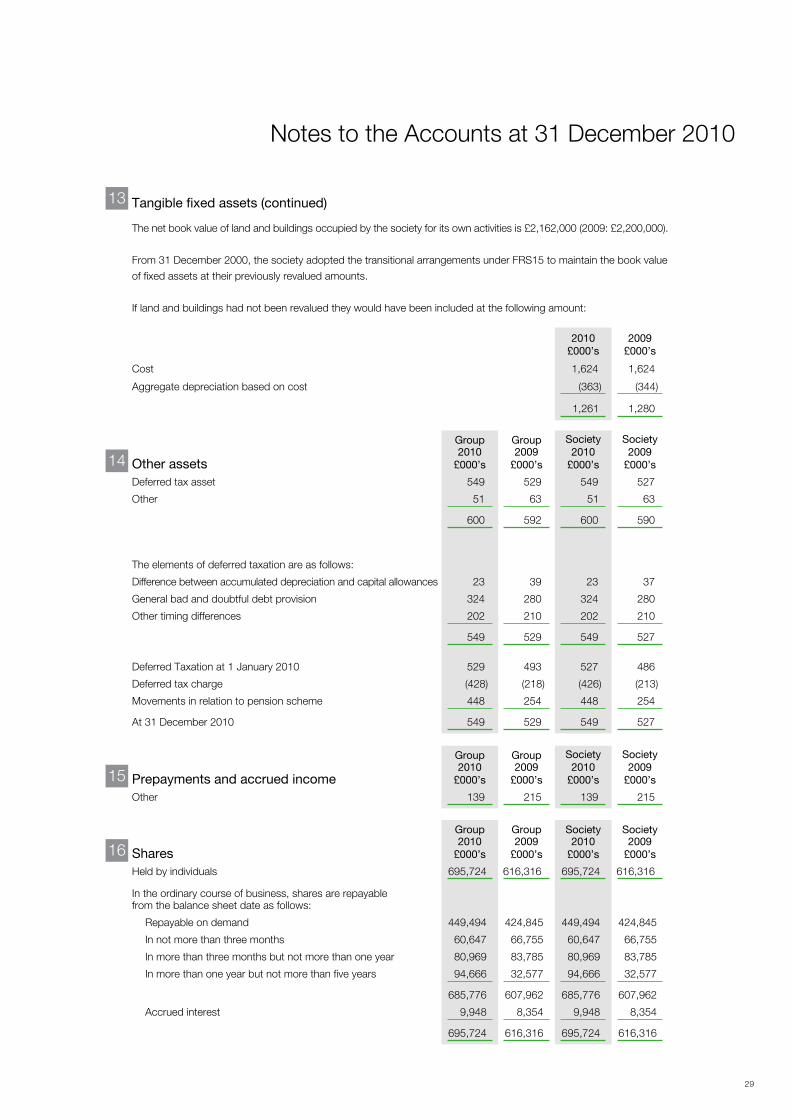
Deferred tax asset 549 529 549 527
Other 51 63 51 63
600 592 600 590
The elements of deferred taxation are as follows:
Difference between accumulated depreciation and capital allowances 23 39 23 37
General bad and doubtful debt provision 324 280 324 280
Other timing differences 202 210 202 210
549 529 549 527
15 Prepayments and accrued income
Group2010
£000’s
Group2009
£000’s
Society2010
£000’s
Society2009
£000’s
Other 139 215 139 215
13
16 Shares
Group2010
£000’s
Group2009
£000’s
Society2010
£000’s
Society2009
£000’s
Held by individuals 695,724 616,316 695,724 616,316
In the ordinary course of business, shares are repayable from the balance sheet date as follows:
Repayable on demand 449,494 424,845 449,494 424,845
In not more than three months 60,647 66,755 60,647 66,755
In more than three months but not more than one year 80,969 83,785 80,969 83,785
In more than one year but not more than five years 94,666 32,577 94,666 32,577
685,776 607,962 685,776 607,962
Accrued interest 9,948 8,354 9,948 8,354
695,724 616,316 695,724 616,316
Deferred Taxation at 1 January 2010 529 493 527 486
Deferred tax charge (428) (218) (426) (213)
Movements in relation to pension scheme 448 254 448 254
At 31 December 2010 549 529 549 527
Tangible fixed assets (continued)
The net book value of land and buildings occupied by the society for its own activities is £2,162,000 (2009: £2,200,000).
From 31 December 2000, the society adopted the transitional arrangements under FRS15 to maintain the book value
of fixed assets at their previously revalued amounts.
If land and buildings had not been revalued they would have been included at the following amount:
2010£000’s
2009£000’s
Cost 1,624 1,624
Aggregate depreciation based on cost (363) (344)
1,261 1,280
30
Notes to the Accounts at 31 December 2010
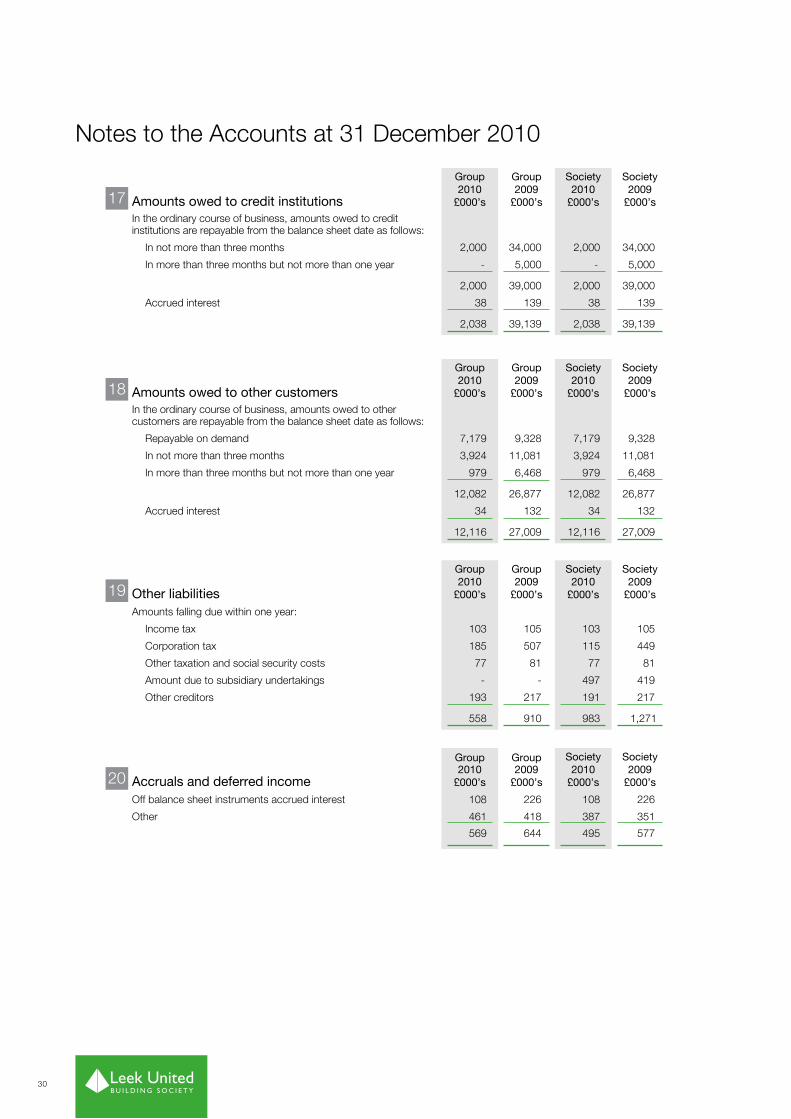
20 Accruals and deferred income
Group2010
£000’s
Group2009
£000’s
Society2010
£000’s
Society2009
£000’s
Off balance sheet instruments accrued interest 108 226 108 226
Other 461 418 387 351
569 644 495 577
17 Amounts owed to credit institutions
Group2010
£000’s
Group2009
£000’s
Society2010
£000’s
Society2009
£000’s
In the ordinary course of business, amounts owed to credit institutions are repayable from the balance sheet date as follows:
In not more than three months 2,000 34,000 2,000 34,000
In more than three months but not more than one year - 5,000 - 5,000
2,000 39,000 2,000 39,000
Accrued interest 38 139 38 139
2,038 39,139 2,038 39,139
18 Amounts owed to other customers
Group2010
£000’s
Group2009
£000’s
Society2010
£000’s
Society2009
£000’s
In the ordinary course of business, amounts owed to other customers are repayable from the balance sheet date as follows:
Repayable on demand 7,179 9,328 7,179 9,328
In not more than three months 3,924 11,081 3,924 11,081
In more than three months but not more than one year 979 6,468 979 6,468
12,082 26,877 12,082 26,877
Accrued interest 34 132 34 132
12,116 27,009 12,116 27,009
19 Other liabilities
Group2010
£000’s
Group2009
£000’s
Society2010
£000’s
Society2009
£000’s
Amounts falling due within one year:
Income tax 103 105 103 105
Corporation tax 185 507 115 449
Other taxation and social security costs 77 81 77 81
Amount due to subsidiary undertakings - - 497 419
Other creditors 193 217 191 217
558 910 983 1,271

31
Notes to the Accounts at 31 December 2010
22 Revaluation reserveGroup£000’s
Society£000’s
At 1 January 2010 and 31 December 2010 1,113 1,113
The revaluation reserve arises because until 31 December 1999, the society revalued properties annually. From
31 December 2000, the society adopted the transitional arrangements under FRS15 to maintain the book value of fixed
assets at their previously revalued amounts.
23 General reserveGroup£000’s
Society£000’s
At 1 January 2010 46,255 45,613
Profit for the year 2,536 2,490
Actuarial gains 788 788
At 31 December 2010 49,579 48,891
24 Financial Services Compensation Scheme levy
The society has a liability and a contingent liability in respect of contributions to the Financial Services Compensation
Scheme.
Based on its share of protected deposits, the society, in common with all regulated UK deposit takers, pays levies to the Financial Services Compensation Scheme (FSCS) to enable the FSCS to meet claims against it. The FSCS levy consists of two parts – a management expenses levy and a compensation levy. The management expenses levy covers the costs of running the scheme and the compensation levy covers the amount of compensation the scheme pays, net of any recoveries it makes using the rights that have been assigned to it. In September 2008 a claim was triggered against the FSCS by the transfer of Bradford & Bingley plc’s retail deposit business to Abbey National plc. In October 2008 a further claim was triggered against the FSCS by the transfer of Kaupthing Singer and Friedlander’s (KSF) internet deposit business (‘Kaupthing Edge’) and Heritable Bank’s (a subsidiary of Landsbanki hf) deposit business to ING Direct. The FSCS will also be liable to claims from depositors of Landsbanki hf (Icesave) and KSF whose balances have not been transferred to ING Direct, but are covered by the FSCS. In December 2008 a further claim arose relating to the default of London Scottish Bank plc. A claim may also arise in respect of the Dunfermline Building Society.
We understand that the FSCS has met, or will meet, the claims by way of loans received from HM Treasury. The FSCS has, in turn, acquired the rights to the realisation of the assets of these banks. The FSCS is liable to pay interest on the loans from HM Treasury. The FSCS may have a further liability if there are insufficient funds available from the realisation of the assets of the banks to fully repay the respective HM Treasury loans.
As a result of notifications it has received from the Financial Services Authority, the society has recognised in this year’s accounts a provision for a levy of £245,000 which gives a total levy provision, as at 31 December 2010, of £750,000 in respect of the scheme year 2010/11, which is calculated with reference to the protected deposits at 31 December 2009, and the scheme year 2011/12, which is calculated with reference to the protected deposits it held at 31 December 2010. The levy amounts have been calculated with reference to the level of the society’s protected deposits and anticipated future interest rates. The amounts above do not take account of any compensation levies which may arise from any ultimate payout on claims.
21 Provisions for liabilities and chargesGroup & Society
Regulated Business£000’s
FSCS Levy
£000’sTotal
£000’s
At 1 January 2010 21 750 771
Amount charged during the year - 245 245
Amount paid during the year - (245) (245)
At 31 December 2010 21 750 771
The regulated business provision is to provide for potential claims against the group in respect of past sales and is
expected to be utilised in the coming year. The Financial Services Compensation Scheme levy is explained in note 24.

32
Activity Risk Type of hedge
Fixed rate savings products Sensitivity to falls in interest rates Receive fixed interest rate swaps
Fixed rate mortgage lending Sensitivity to increases in interest rates Pay fixed interest rate swaps
The table below shows the nominal principal amounts, credit risk weighted amounts and replacement costs of
derivatives. Nominal principal amounts indicate the volume of business outstanding at the balance sheet date and
do not represent amounts at risk. The replacement cost represents the cost of replacing contracts with positive values,
calculated at market rates current at the balance sheet date reflecting the group’s maximum exposure should the
counterparties default. The credit risk weighted amount, which is calculated according to rules specified by the
Financial Services Authority, is based on the replacement costs, but also takes into account measures of the extent
of potential future exposure and the nature of the counterparty.
Notes to the Accounts at 31 December 2010
Nominal principalamount
2010£000’s
Credit riskweightedamount
2010£000’s
ReplacementCost2010
£000’s
Nominal principalamount
2009£000’s
Credit risk weightedamount
2009£000’s
Replacement cost 2009
£000’s
Interest rate contracts maturing:
In less than 1 year - - - 30,000 - -
Between 1 year and 5 years 40,000 40 - 30,000 30 -
25 Financial Instruments
A financial instrument is a contract which gives rise to a financial asset of one entity and a financial liability of another
entity. The group is a retailer of financial instruments in the form of mortgage and savings products and also uses
wholesale financial instruments to invest liquid asset balances, raise wholesale funding and manage the risks arising
from its operations.
The group has a formal structure for managing risk, including established risk limits, reporting lines, mandates and
other control procedures. This structure is reviewed regularly by the board, which is charged with the responsibility for
managing and controlling the balance sheet exposures and the use of financial instruments for risk management purposes.
Instruments used for risk management purposes include derivative financial instruments ‘derivatives’, which are contracts
or agreements whose value is derived from one or more underlying price, rate or index inherent in the contract or
agreement, such as interest rates.
Derivatives are only used by the group in accordance with the Building Societies Act 1986 (as amended by the
Building Societies Acts 1997 and 2005), to reduce the risk of loss arising from changes in interest rates or other
factors specified in the legislation. The group does not trade in derivatives or use them for speculative purposes.
Type of derivatives
The principal derivatives used in balance sheet risk management are interest rate swaps which are used to hedge
group balance sheet exposures arising from fixed rate mortgage lending and savings products.
The accounting policy for derivatives is described in note 1 to the accounts.
The following table describes the significant activities undertaken by the group, the related risks associated with such
activities and the types of derivatives which are typically used in managing such risks.
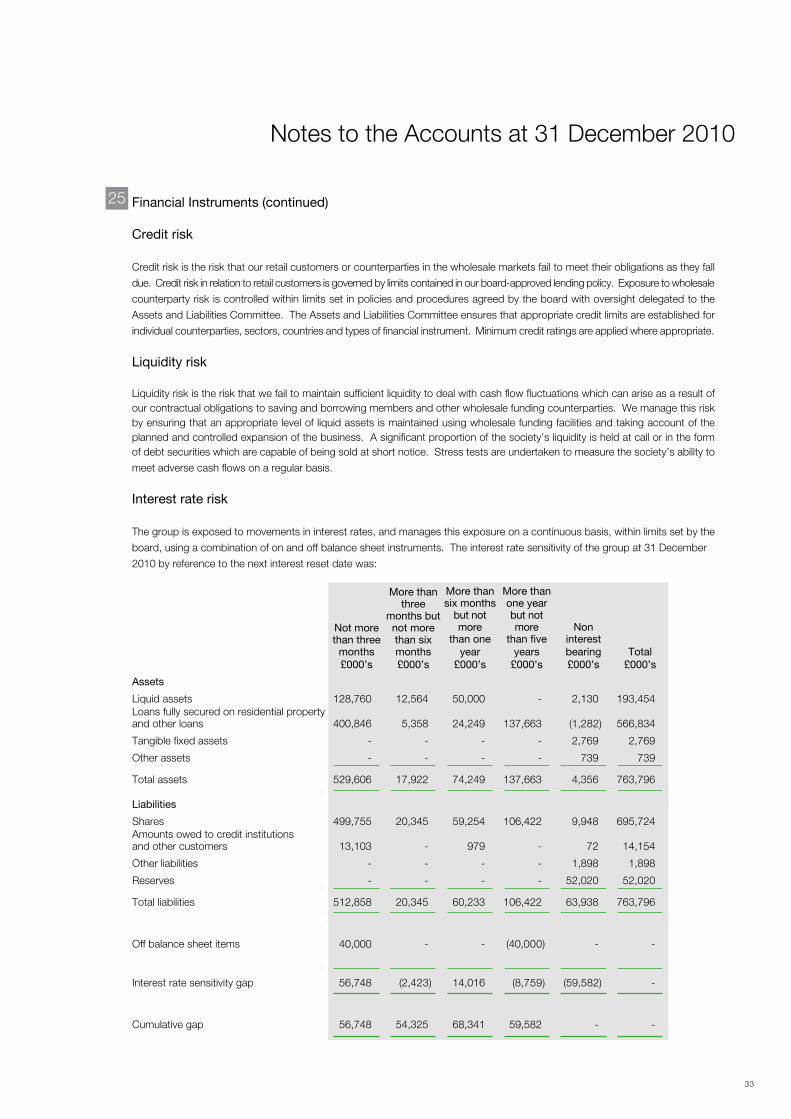
Liabilities
Shares 499,755 20,345 59,254 106,422 9,948 695,724Amounts owed to credit institutions and other customers 13,103 - 979 - 72 14,154
Other liabilities - - - - 1,898 1,898
Reserves - - - - 52,020 52,020
Total liabilities 512,858 20,345 60,233 106,422 63,938 763,796
Off balance sheet items 40,000 - - (40,000) - -
Interest rate sensitivity gap 56,748 (2,423) 14,016 (8,759) (59,582) -
Cumulative gap 56,748 54,325 68,341 59,582 - -
33
Notes to the Accounts at 31 December 2010
25
Not morethan three
months£000’s
More thanthree
months butnot morethan sixmonths£000’s
More thansix months
but not more
than oneyear
£000’s
More thanone yearbut not more
than fiveyears
£000’s
Noninterestbearing£000’s
Total £000’s
Assets
Liquid assets 128,760 12,564 50,000 - 2,130 193,454Loans fully secured on residential property and other loans 400,846 5,358 24,249 137,663 (1,282) 566,834
Tangible fixed assets - - - - 2,769 2,769
Other assets - - - - 739 739
Total assets 529,606 17,922 74,249 137,663 4,356 763,796
Financial Instruments (continued)
Credit risk
Credit risk is the risk that our retail customers or counterparties in the wholesale markets fail to meet their obligations as they fall
due. Credit risk in relation to retail customers is governed by limits contained in our board-approved lending policy. Exposure to wholesale
counterparty risk is controlled within limits set in policies and procedures agreed by the board with oversight delegated to the
Assets and Liabilities Committee. The Assets and Liabilities Committee ensures that appropriate credit limits are established for
individual counterparties, sectors, countries and types of financial instrument. Minimum credit ratings are applied where appropriate.
Liquidity risk
Liquidity risk is the risk that we fail to maintain sufficient liquidity to deal with cash flow fluctuations which can arise as a result of our contractual obligations to saving and borrowing members and other wholesale funding counterparties. We manage this risk by ensuring that an appropriate level of liquid assets is maintained using wholesale funding facilities and taking account of the planned and controlled expansion of the business. A significant proportion of the society’s liquidity is held at call or in the form of debt securities which are capable of being sold at short notice. Stress tests are undertaken to measure the society’s ability to
meet adverse cash flows on a regular basis.
Interest rate risk
The group is exposed to movements in interest rates, and manages this exposure on a continuous basis, within limits set by the
board, using a combination of on and off balance sheet instruments. The interest rate sensitivity of the group at 31 December
2010 by reference to the next interest reset date was:
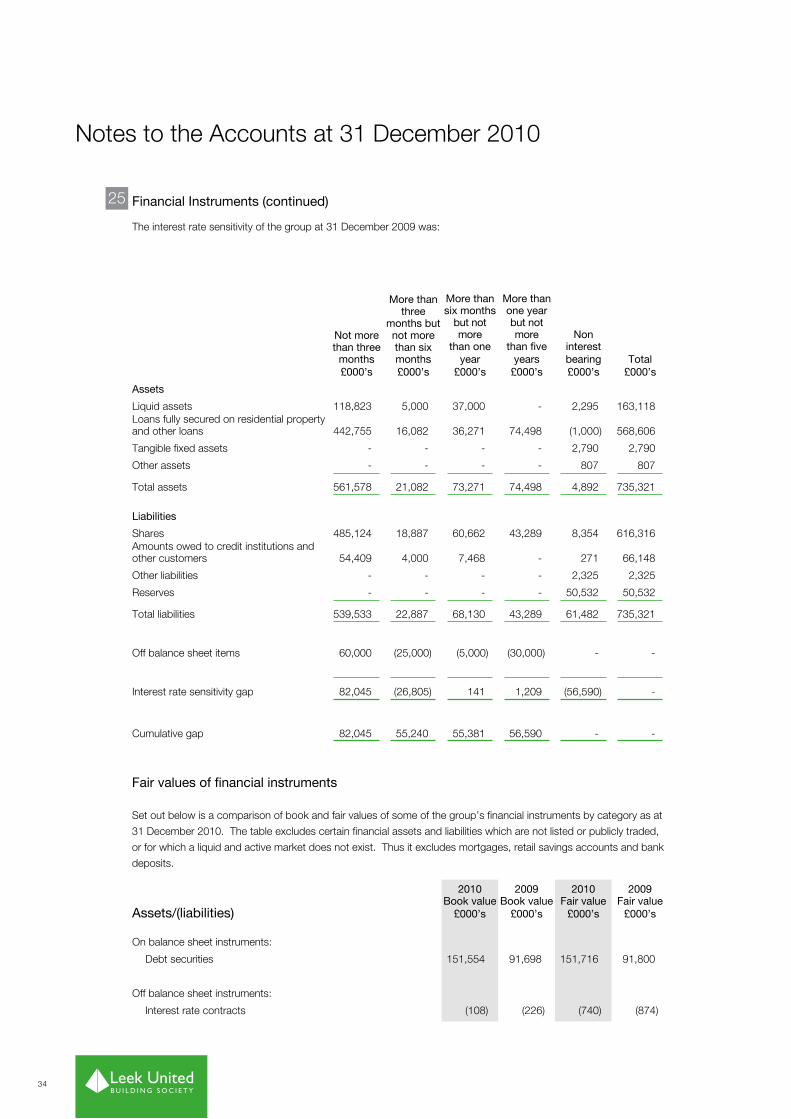
Notes to the Accounts at 31 December 2010
25 Financial Instruments (continued)
The interest rate sensitivity of the group at 31 December 2009 was:
Not morethan three
months£000’s
More thanthree
months butnot morethan sixmonths£000’s
More thansix months
but not more
than oneyear
£000’s
More thanone yearbut not more
than fiveyears
£000’s
Noninterestbearing£000’s
Total £000’s
Assets
Liquid assets 118,823 5,000 37,000 - 2,295 163,118Loans fully secured on residential property and other loans 442,755 16,082 36,271 74,498 (1,000) 568,606
Tangible fixed assets - - - - 2,790 2,790
Other assets - - - - 807 807
Total assets 561,578 21,082 73,271 74,498 4,892 735,321
Liabilities
Shares 485,124 18,887 60,662 43,289 8,354 616,316Amounts owed to credit institutions and other customers 54,409 4,000 7,468 - 271 66,148
Other liabilities - - - - 2,325 2,325
Reserves - - - - 50,532 50,532
Total liabilities 539,533 22,887 68,130 43,289 61,482 735,321
Off balance sheet items 60,000 (25,000) (5,000) (30,000) - -
Interest rate sensitivity gap 82,045 (26,805) 141 1,209 (56,590) -
Cumulative gap 82,045 55,240 55,381 56,590 - -
Assets/(liabilities)
2010Book value
£000’s
2009Book value
£000’s
2010Fair value
£000’s
2009Fair value
£000’s
On balance sheet instruments:
Debt securities 151,554 91,698 151,716 91,800
Off balance sheet instruments:
Interest rate contracts (108) (226) (740) (874)
Fair values of financial instruments
Set out below is a comparison of book and fair values of some of the group’s financial instruments by category as at
31 December 2010. The table excludes certain financial assets and liabilities which are not listed or publicly traded,
or for which a liquid and active market does not exist. Thus it excludes mortgages, retail savings accounts and bank
deposits.
34
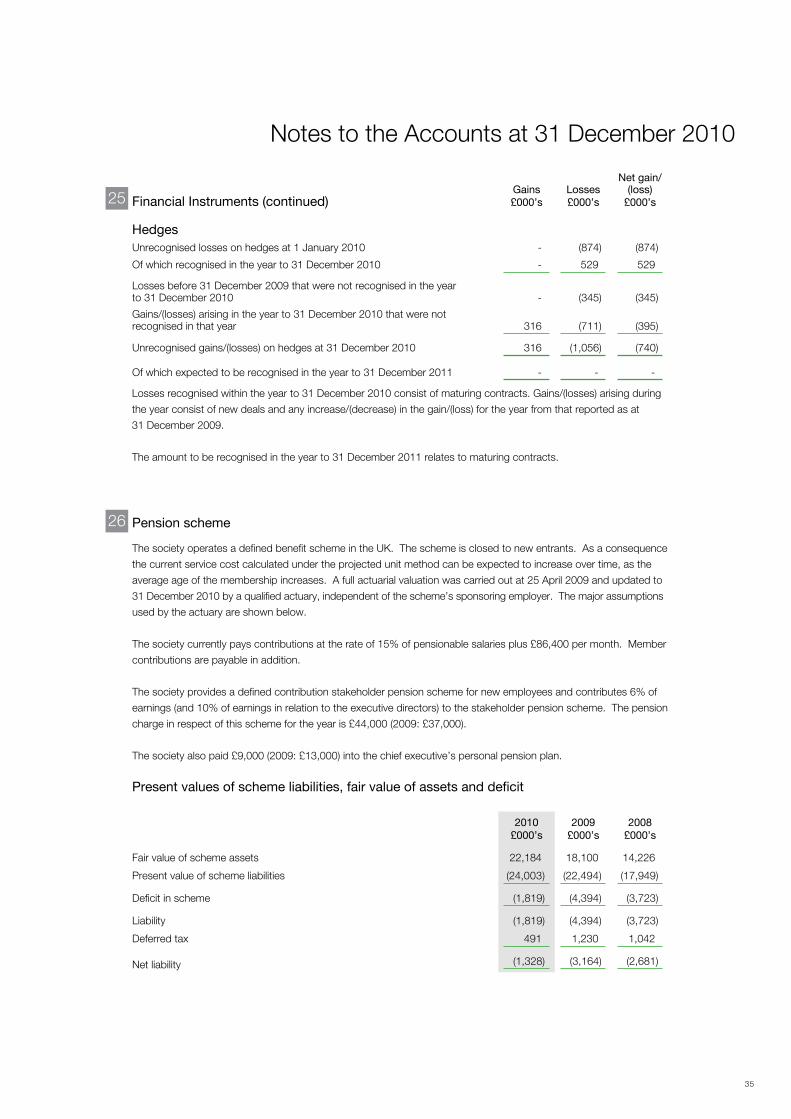
Notes to the Accounts at 31 December 2010
25 Financial Instruments (continued)Gains£000’s
Losses£000’s
Net gain/(loss)
£000’s
HedgesUnrecognised losses on hedges at 1 January 2010 - (874) (874)
Of which recognised in the year to 31 December 2010 - 529 529
Losses before 31 December 2009 that were not recognised in the year to 31 December 2010 - (345) (345)
Gains/(losses) arising in the year to 31 December 2010 that were not recognised in that year 316 (711) (395)
Unrecognised gains/(losses) on hedges at 31 December 2010 316 (1,056) (740)
Of which expected to be recognised in the year to 31 December 2011 - - -
Losses recognised within the year to 31 December 2010 consist of maturing contracts. Gains/(losses) arising during
the year consist of new deals and any increase/(decrease) in the gain/(loss) for the year from that reported as at
31 December 2009.
The amount to be recognised in the year to 31 December 2011 relates to maturing contracts.
26 Pension scheme
The society operates a defined benefit scheme in the UK. The scheme is closed to new entrants. As a consequence
the current service cost calculated under the projected unit method can be expected to increase over time, as the
average age of the membership increases. A full actuarial valuation was carried out at 25 April 2009 and updated to
31 December 2010 by a qualified actuary, independent of the scheme’s sponsoring employer. The major assumptions
used by the actuary are shown below.
The society currently pays contributions at the rate of 15% of pensionable salaries plus £86,400 per month. Member
contributions are payable in addition.
The society provides a defined contribution stakeholder pension scheme for new employees and contributes 6% of
earnings (and 10% of earnings in relation to the executive directors) to the stakeholder pension scheme. The pension
charge in respect of this scheme for the year is £44,000 (2009: £37,000).
The society also paid £9,000 (2009: £13,000) into the chief executive’s personal pension plan.
Present values of scheme liabilities, fair value of assets and deficit
2010£000’s
2009£000’s
2008£000’s
Fair value of scheme assets 22,184 18,100 14,226
Present value of scheme liabilities (24,003) (22,494) (17,949)
Deficit in scheme (1,819) (4,394) (3,723)
Liability (1,819) (4,394) (3,723)
Deferred tax 491 1,230 1,042
Net liability (1,328) (3,164) (2,681)
35
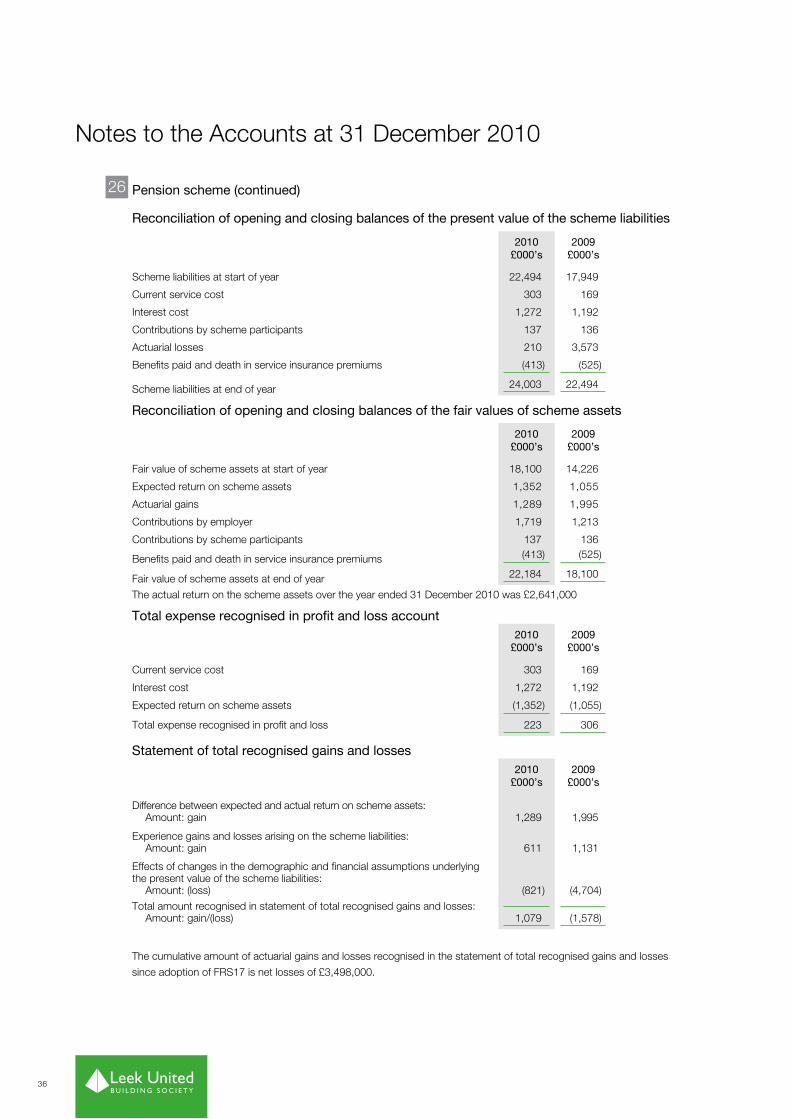
36
Notes to the Accounts at 31 December 2010
26 Pension scheme (continued)
Reconciliation of opening and closing balances of the present value of the scheme liabilities
2010£000’s
2009£000’s
Scheme liabilities at start of year 22,494 17,949
Current service cost 303 169
Interest cost 1,272 1,192
Contributions by scheme participants 137 136
Actuarial losses 210 3,573
Benefits paid and death in service insurance premiums (413) (525)
Scheme liabilities at end of year 24,003 22,494
2010£000’s
2009£000’s
Fair value of scheme assets at start of year 18,100 14,226
Expected return on scheme assets 1,352 1,055
Actuarial gains 1,289 1,995
Contributions by employer 1,719 1,213
Contributions by scheme participants 137 136
Benefits paid and death in service insurance premiums (413) (525)
Fair value of scheme assets at end of year 22,184 18,100
Reconciliation of opening and closing balances of the fair values of scheme assets
2010£000’s
2009£000’s
Current service cost 303 169
Interest cost 1,272 1,192
Expected return on scheme assets (1,352) (1,055)
Total expense recognised in profit and loss 223 306
Total expense recognised in profit and loss account
2010£000’s
2009£000’s
Difference between expected and actual return on scheme assets: Amount: gain 1,289 1,995
Experience gains and losses arising on the scheme liabilities: Amount: gain 611 1,131
Effects of changes in the demographic and financial assumptions underlying the present value of the scheme liabilities: Amount: (loss) (821) (4,704)
Total amount recognised in statement of total recognised gains and losses: Amount: gain/(loss) 1,079 (1,578)
Statement of total recognised gains and losses
The actual return on the scheme assets over the year ended 31 December 2010 was £2,641,000
The cumulative amount of actuarial gains and losses recognised in the statement of total recognised gains and losses
since adoption of FRS17 is net losses of £3,498,000.

37
2010£000’s
2009£000’s
2008£000’s
Equities 12,993 12,849 9,980
Bonds 8,858 5,000 3,976
Other 333 251 270
Total assets 22,184 18,100 14,226
26 Pension scheme (continued)
Assets
None of the fair values of the assets shown above include any of the society’s own financial instruments or any property
occupied by, or other assets used by, the society.
Notes to the Accounts at 31 December 2010
2010%
per annum
2009%
per annum
2008%
per annum
Retail Price index inflation 3.70 3.75 3.10
Consumer Price index inflation 3.00 N/A N/A
Salary increases 4.95 5.00 4.35
Rate of discount 5.40 5.65 6.70
Allowance for pension in payment increases of RPI or 5% p.a. if less 3.70 3.75 3.10
Allowance for revaluation of deferred pensions of CPI/RPI or 5% p.a. if less 3.00 3.75 3.10
Allowance for commutation of pension for cash at retirement Yes Yes None
Assumptions
Amounts for the current and previous four years
Male retiring at age 60 in 2010 27.1 years (2009: 27.0 years)
Female retiring at age 60 in 2010 29.8 years (2009: 29.7 years)
Male retiring at age 60 in 2030 29.3 years (2009: 29.2 years)
Female retiring at age 60 in 2030 31.8 years (2009: 31.7 years)
2010%
per annum
2009%
per annum
Equities 8.00 8.00
Bonds 5.10 5.25
Other 4.80 4.50
Overall for scheme 7.20 7.20
The best estimate of contributions to be paid by the employer to the scheme for the year ending 31 December 2011 is £1,269,000.
Expected long-term rates of return
The long-term expected rate of return on cash is determined by reference to bank base rates at the balance sheet dates.
The long-term expected return on bonds is determined by reference to UK long dated government and corporate bond yields at
the balance sheet date. The long-term expected rate of return on equities is based on the rate of return on bonds with an
allowance for out-performance. The long-term expected rate of return on annuities is the rate of discount used to calculate
liabilities.
The expected long-term rates of return applicable at the start of each year are as follows:
2010£000’s
2009£000’s
2008£000’s
2007£000’s
2006£000’s
Fair value of scheme assets 22,184 18,100 14,226 16,304 14,485
Present value of scheme liabilities (24,003) (22,494) (17,949) (21,045) (23,712)
Deficit in scheme (1,819) (4,394) (3,723) (4,741) (9,227)
Experience adjustment on scheme assets 1,289 1,995 (4,270) (166) 428 Experience adjustment on scheme liabilities 611 1,131 (10) (6) 202
The mortality assumptions adopted at 31 December 2010 imply the following life expectancies:

38
Annual Business Statement
Annual Business Statement for the year ended 31 December 2010
Ratio at 31.12.10
%
StatutoryLimit
%
Statutory Percentages
Calculated in accordance with the Building Societies Act 1986 as amended by the Building Societies Acts 1997 and 2005.
Lending limit 0.32 25.00
Funding limit 1.99 50.00
The lending limit measures the proportion of business assets not in the form of loans fully secured on residential property.
The funding limit measures the proportion of shares and borrowings not in the form of shares held by individuals.
Business assets are the total assets of the group plus provisions for bad and doubtful debts, less fixed assets and liquid assets.
Loans fully secured on residential property is the amount of principal owing by borrowers and interest accrued not yet
payable. This is the amount shown in the group balance sheet plus provisions for bad and doubtful debts.
Shares and borrowings represent the total of shares, amounts owed to credit institutions and amounts owed to other
customers as shown in the group balance sheet.
The amount of shares held by individuals is shown in note 16 of the notes to the accounts.
Ratio at 31.12.10
%
Ratio at31.12.09
%
Other Percentages
Gross capital as a percentage of shares and borrowings 7.14 6.94
Free capital as a percentage of shares and borrowings 6.92 6.68
Liquid assets as a percentage of shares and borrowings 27.25 23.90
Profit on ordinary activities after taxation as a percentage of mean total assets 0.34 0.37
Management expenses as a percentage of mean total assets 0.79 0.80
Gross capital represents the sum of the general reserve and the revaluation reserve as shown in the group balance sheet.
Free capital represents the sum of the general reserve, the revaluation reserve and general loss provisions less fixed assets.
Shares and borrowings represent the total of shares, amounts owed to credit institutions and amounts owed to other
customers as shown in the group balance sheet.
Liquid assets represent the total of cash in hand, loans and advances to credit institutions and debt securities.
Mean total assets is the average of the 2009 and 2010 total assets.
Management expenses represent the aggregate of administrative expenses and depreciation.

Name Occupation
R Bebington Head of Risk and Compliance
I Boston Internal Auditor
S Boulton PGDip Mgmt, MCMI Head of Information Technology and Savings
B Gronneberg Head of Retail Sales, Insurance and Marketing
M Williams Head of Lending
D Wilson Head of Human Resources
Annual Business Statement for the year ended 31 December 2010 (continued)
Annual Business Statement
Information relating to directors as at 31 December 2010
Name Date of Birth Occupation
Date of Appointment Other Directorships
K Griffiths BSc(Econ), FCA19/7/57
Building Society Finance Director
3/11/08 -
P W Kerns9/6/53
Solicitor 21/12/09 Hob Hey Management Company Ltd
D J Lyons MCISI5/12/43
Financial Consultant 14/6/02 Help! Investments Ltd
P Marriott FCA28/9/52
Chartered Accountant 14/4/94 Fearns Marriott LtdLeek United Home Loans LtdLeek United Financial Services LtdThe Mortgage Outlet Ltd
P A Stanyer FCA, FIMI, AInstIB 21/9/49
Business Consultant 19/12/08 Planned Consultancy LtdDerbyshire & Nottinghamshire Chamber of CommerceApica Ltd
J Washington ACIB26/5/50
Independent Consultant 23/11/05 -
K Wilson 20/12/58
Building Society Chief Executive
1/10/98 Leek United Home Loans LtdLeek United Financial Services LtdThe Mortgage Outlet Ltd
Documents may be served on the above named directors c/o Bowcock and Pursaill, P.O. Box No. 1, 54 St. Edward Street,
Leek, Staffordshire ST13 5DJ.
K Wilson and K Griffiths have 12 months or less rolling service contracts. The non-executive directors do not have service contracts.
Information relating to other officers
39

50 St Edward Street, Leek Staffordshire ST13 5DL T: 01538 384151 F: 01538 399179 DX: 16354 LEEK E: [email protected] W: www.leekunited.co.uk
The pulp used in the manufacture of this paper is from renewable timber produced from sustainable forests and is elemental chlorine free.