report and economic influences on perimeter …
TRANSCRIPT

FINAL REPORT
SOCIAL AND ECONOMIC INFLUENCES ON PERIMETER MANAGEMENT
AND OPERATION FINDINGS FROM RESEARCH IN
THE MAGGIA VALLEY NIGER
Luin Goldring Development Sociology Cornell University
WMS-II Activity Title Niger Small-Scale Irrigation Study
Code Number 3-04-023-86
JANUARY 1987
EXECUTIVE SUMMARY
Irrigation development is expected to continue to play asignificant role in Nigers agricultural development policyThis paper reports the results of socioeconomic research conducted on two dam-fed irrigated perimeters and examines social and economic influences that may affect operation
The two perimeters studied are supervised by ONAHA the parastatal agency charged with developing managing andmaintaining irrigation infrastructure and with providing trainingand extension services to farmers A long-term policy objectiveis for irrigation perimeters to become self-managed by their management committees with ONAHA acting as a technical assistance agency
Review of the agricultural tasks performed during the wetand dry seasons on and off the perimeters indicates that added labor is required in irrigated agriculture (both because some tasks take longer under irrigated conditions and more tasks areperformed) Planting and weeding are performed during periods ofpeak labor demand farmers may find it difficult to completetasks on both rainfed and irrigated plots in a timely fashion
Irrigation schemes in Niger (as in many countries) are managed with the idea that farmers will complete tasks accordingto a uniform schedule so that crops may receive maximum benefit from irrigation An implicit assumption that farmers on a givenperimeter are equally able to mobilize resources for agricultureunderlies this model Research findings suggest that not allfarmers can mobilize the same levels of resources because resources are not equally distributed This variability mayaccount for appparent performance differences and affect perimeter operation
Social and economc factors affecting perimeter operationwere analyzed These include labor availability access to cashland and other productive resources and power as it relates toland tenure and property control over agronomic practicesdecision making and ONAHAs role in perimeter management
The availability of household labor plays an important rolein agricultural production households with less available labor must limit the area they cultivate hire labor or mobilize labor through other means The majority of households on bothperimeters include two to three potentially active working males Irrigated area and rainfed plots are not evenly distributed amongperimeter farmers The data suggest that the distribution of total area cultivated per household is unequal on each perimetertherefore the labor required to cultivate total holdings will vary from household to household No positive linear
i
relationship between available male labor and irrigater land area or number of rainfed plots per household was found Thusfarmers on a given perimeter will have different priorities for allocating labor based on differential access to land and labor
Irrigated agriculture is only one element in the household production strategy During the wet season more labor is allocated to rainfed plots than to irrigated plots Labor perunit area allocated to perimeter cultivation appears relativelyconstant while that allocated to rainfed agriculture may varyconsiderably from household to household Farmers on both perimeters also engage in off-farm activities many of which generatI cash more directly than agriculture
IThe availability of cash and its timing also affect a households production strategy Most households studied include at least onn member engaged in a cash-generating activity outside of agriculture and animal husbandry Within each perimeterhowever the number of cash-generating members varies widelyLand is another source of cash income The unequal distribution of irrigated land area and rainfed plots suggests a wide gap in income from land within each perimeter The emerging picture of two perimeters with both resource-rich and -poor farmers is corroborated by evidence of unequal distribution of livestock and consumer goods Differential access to cash labor land and other resources may allow some farmers to complete perimetertasks sooner and better than other farmers The hypothesis that a more homogenous group of farmers may lead to smoother and more efficient operation is put forth and various implications are discussed The issue of heterogeneity versus homogeneity of irrigation units may have important implications for irrigation management and the policy objective of local self-management
Irrigation development implies changes in property relations and changes in cultivation practices Laws prohibiting land rental or sale on the perimeters are aimed to prevent land concentration and less explicitly towards controlling land use and farm management However farmers rights to make decisions about how their land is cultivated may be compromised by state regulations Most farmers interviewed wanted to have more choices about cropping patterns and farm practices
Farmers on both perimeters tend to consider decisions about redevance calculations irrigation scheduling timing of planting and other activities on the perimeters as made by the perimeter director and other ONAHA staff and by the managementcommittee A description of the pattern of information flow on the perimeters shows that information flows 2rom top to bottomand only reaches farmers indirectly This structure is not entirely effective in communicating information to farmers about irrigations Better communication channels would improve water management and yields and increase farmer participation in
ii
management thereby helping to meet the policy objective of autoshygestion or self-management
ONAHA has a somewhat ambiguous role with respect toirrigation management and rule enforcement Although it issupposed to become a technical assistance agency ONAHA now manages the perimeters However the agencys staff have limited authority to pnish farmers who break rules like selling land orfailing to pay -he redevance Regional administrativo authorities must consent to sanctions their consent is not always forthcoming
ONAHA staff try to follow and impose agency guidelines atMoullela and Galmi while farmers and their families cultivate various often distant plots and also make a living from other sources Because production strategies vary farmers do not behave uniformly in accordance with agency directives Day-toshyday farming and water management involves the sometimes conflicting agendas of a diverse group of farmers ONAHA stafflocal authorities and extra-local administrative authorities Some issues remain a source of debate while others are resolved at least temporarily In Moullela such arrangements have had alonger time to develop it is not an easy or negotiated give and take nor is it a bitter constant battle
The fact that farmers with parcels in a given perimeter do not have uniform access to resources needs to be recognized and taken into account in water management and irrigation systemdesign Changes that might be instituted include flexible waterschedules wider choice in cropping patterns changes in the size and perhaps composition of GMPs or their equivalent anddesigning control structures and canals that take larger water flows so that selected areas of a perimeter can irrigate fairlyquickly even if they are far from the head of the system The situation of resource-poor farmers might be improved throughcredit programs In conclusion it would be useful to relax assumptions about uniform performance among perimeter farmers
iii
ACKNOWLEDGEMENTS
I am grateful to E Walter Coward Jr Mike Walter Tammo Steenhuis Barbara Lynch and Ray Norman for supporting theinclusion of sociological research under the Water ManagementSynthesis II Project activities in Niger
The field research which formed the basis for this reportbenefited from the assistance and commants of a number of individuals in ONAHA and the USAIDNiger Mission I would like to extend my thanks to M Amadou Soumeila M Talabe ChaibouM Souley Moutari M Wolff M Omar NaAwa and M Hima Guero inONAHA Mr Roger Briend technical consultant to ONAHA with the CFDT shared his perspectives on irrigation with me I would also like to express my appreciation to Dayton Maxwell MichaelGould Lynne Graybeal Eric Arnould Cynthia Moore and KathyPanther presently or formerly with USAIDNiger
A number of people were very helpful to me during theresearch through their hospitality and logistical assistance or by sharing their knowledge and increasing my familiarity with Nigerien cultures I would particularly like to thank Ray and Hdi~ne Norman Omar and Aisatou NaAwa Wendy Ascher Walter Westand Steve Long Adji Souley deserves special thanks for increasing my understanding of Hausa culture and sharing his knowledge of socioeconomic aspects of irrigation in the region
Wendy Ascher E Walter Coward Barbara Lynch Ray NormanPeter Vandergeest Mike Walter and Walter West provided helpfulsubstantive and editorial comments on an earlier draft of this report Barbara Lynch shared insightful comments in the field and edited the final draft Wendy Ascher and Patty Reynoldsprovided timely and essential assistance in coding data
I would like to acknowledge the help provided by my research assistants and the many residents in the research area who patiently spent time with us
iv
PREFACE
This is the final report for sociological research conductedunder the USAID Water Management Synthesis-II Project (WMS-II) inNiger This short term study was designed to complement theagricultural engineering researcn carried out by Mr W RayNorman for two years ending in April 1986
The general objectives of this study were to provide asocioeconomic profile of the areas served by two irrigatedperimeters in the Maggia Valley of Niger as well as a model ofperimeter organization and operation Terms of reference for thesociological research were drafted by Mr Ray Norman and Dr EricArnould consulting anthropologist in collaboration with theOffice National dAm6nagements Hydro-Agricoles (ONAHA) andUSAIDNiger They were later modified in consultation with ONAHA and USAID
v
TABLE OF CONTENTS
EXECUTIVE SUMMARY i
ACKNOWLEDGEMENTS iv
PREFACE v
I INTRODUCTION 1
II IRRIGATION IN NIGER INSTITUTIONAL AND ORGANIZATIONAL CONTEXT LEGAL ASPECTS AGENCIES INVOLVED IN PERIMETER DEVELOPMENT AND
MANAGEMENT Structure and Function of ONAHA Cooperatives The Perimeter Management Committee The GMP
3 3
3
III THE RESEARCH AREA GALMI AND MOULLELA THE SETTING THE PERIMETERS
10 10 11
IV THE AGRICULTURAL CYCLE CROPS AGRICULTURAL TASKS SEQUENCE DURATION AND PEAK
LABOR REQUIREMENTS The Rainy Season The Dry Season
16 16
16
V LABOR AND PERIMETER MANAGEMENT AND OPERATION POTENTIAL HOUSEHOLD LABOR LABOR LAuiD DISTRIBUTION AND AREA UNDER CULTIVATION
Perimeter Parcels Reservoir Parcels Rainfed Plots Household Size and Land Area
DISCUSSION OF LABOR AVAILABILITY ACTUAL LABOR ALLOCATED TO AGRICULTURE BY GENDER
Male Labor
22 22 24
29 35
Female Labor LABOR MIGRATION FARM VERSUS OFF-FARM ACTIVITIES CONCLUSIONS AND QUESTIONS FOR FURTHER RESEARCH
36 37 39
vi
VI INCOME LAND AND OTHER PRODUCTIVE RESOURCES 42 CASH 43
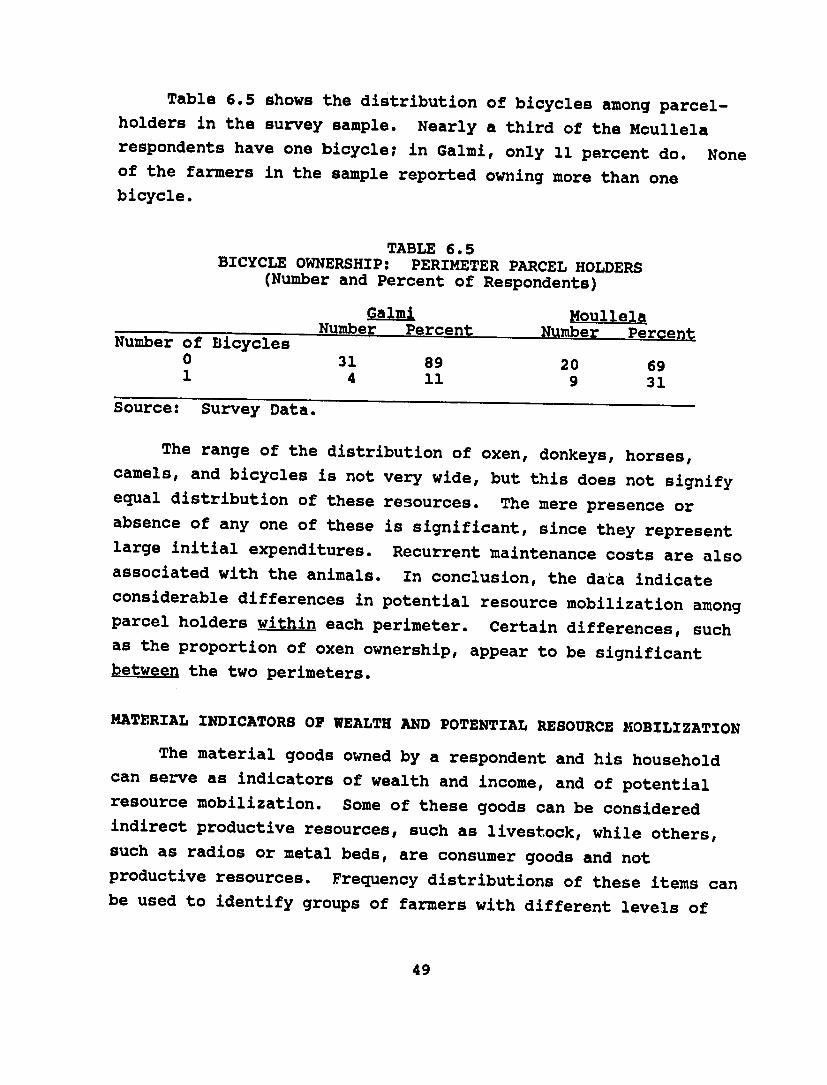
Cash-Generating Activities INCOME FROM LAND 45 OTHER PRODUCTIVE RESOURCES 47 MATERIAL INDICATORS OF WEALTH AND POTENTIAL RESOURCE
MOBILIZATION 49 CONCLUSIONS 52
VII POWER AND PERIMETER MANAGEMENT 54 LAND TENURE AND PROPERTY RIGHTS 55 LAND ALLOCATION AND THE ROLE OF VILLAGE CHIEFS 57 CROP CHOICE AlD AGRONOMIC PRACTICES 58 DECISION MAKING AND THE FLOW OF INFORMATION ONAHATHB COOPERATIVE AND THE MANAGEMENT COMMITTEE 60
ONAHAS ROLE IN PERIMETER MANAGEMENT 61A MODEL OF PERIMETER OPERATION 62
VIII CONCLUSIONS 63
APPENDIX 1 RESEARCH METHODOLOGY 67
APPENDIX 2 DATA COLLECTED 74
BIBLIOGRAPHY 95
vii
Chapter One INTRODUCTION
Irrigated agriculture has played and is expected to continue to play a growing role in meeting Nigers food production requirements A series of factors including Nigers Sahelian agro-climatic conditions the sharp decline of its uranium revenues and the vulnerability of the vast majority of the population to recurrent droughts are behind the governments promotion of irrigated agriculture In a country where twoshythirds to three-quarters of the land area is classified as inutile or useless desert rainfed and irrigated agriculture on the remaining band of land to the south is considered a key means for increasing the production of crops for domestic consumption and to a lesser extent export
Nearly 10000 hectares have been brought under irrigation by the government since independence in 19601 The actual area cultivated during the 1985 rainy season on perimeters managed by the Office National dAmnnagements Hydro-Agricoles (ONAHA the national irrigation agency) came to 9115 ha (USAID 1986) The irrigated area cultivated during the 1984-85 dry season was 4197 ha The rainy season figure represented an increase from the 5500 irrigated hectares in production in 1983 (USAID 1984) 2
Although the importance of irrigation in Niger is indisputable assessments of and recommendations for irrigation development and perimeter performance are mixed (Horowitz et al 1983 USAID 1984) This is in part due to limitations in the
1 The countrys total land area is 126700000 ha
including land and water (Horowitz ampt Al 198318)
2 For additional background consult USAIDs (1984) Niger Irrigation Subsector Assessment which contains a generaldiscussion of policy economic institutional engineeringagronomic marketing health and environmental aspects ofirrigation in Niger The Niger Social and Institutional Profileprepared by the Institute for Development Anthropology (Horowitzet al 1983) includes chapters on both irrigated and drylandagriculture which provide very thorough and useful information
(
quality amount and level of aggregation of data available on which to base such assessments and recommendations In the last few years various studies have attempted to remedy this situation USAIDs WMS-II Project activities in Niger represent part of this effort
The main objective of this study was to collect and analyze socioeconomic data to complement the hydrological agronomic and socioeconomic data collected by Ray Norman in the Maggia Valley of Niger (see Norman 1986 and 1987 forthcoming dissertation) in order to increase understanding of social and economic factors that affect water management Previously available socioeconomic data for the Galmi and Moullela perimeters date from pre-project feasibility studies (1981 for Galmi 1967 and 1969 for Moullela) The data collected by the present study provide a socioeconomic profile of the areas served by tne perimeters (ie a source of baseline data) and a model of perimeter organization and operation
The next chapter describes the institutional and organizational framework surrounding irrigation development in Niger Chapter three provides an introduction to the research area The fourth chapter consista of a description of the agricultural cycle in the area Chapters five through seven provide dencriptive data and analyses of selected factors affecting perimeter operation Chapter five deals with labor as a factor affecting perimeter activities Differential access to cash land and other productive resources is discussed in chapter six Chapter seven examines the relationship between power relations and perimeter management by focusing on property rights and land allocation crop choice and agronomic practices decision making and information flows and ONAHAs role in perimeter management The last chapter presents concluding coinments A discussion of the methodology employed in data collection is presented in Appendix 1 Finally Appendix 2 contains frequency distributions of collected quantitative data
2
Chapter Two IRRIGATION IN NIGER INSTITUTIONAL AND ORGANIZATIONAL CONTEXT
Irrigation development generally takes place through institutions and organizations designed to support it Examples of such institutions and organizations include laws governing land tenure marketing cooperatives and agencies charged with building operating and maintaining irrigation infrastructure This section provides an introduction to the institutional and organizational context of irrigation development in Niger
LEGAL ASPECTS According to Nigerien law all land belongs to the
government Traditionally village chiefs had authority to allocate and settle disputes involvinq rainfed agricultural land While this is still largely the case in relatively densely populated areas such as Galmi the reported purchase and rental of rainfed land indicates the growing presence of a market in land3 Land which has been improved by the state through irrigation development belongs to and is controlled by the government it is illegal to sell or rent perimeter plots Such plots can however be temporarily reallocated or lent to farmers normally outside an irrigation scheme
AGENCIES INVOLVED IN PERIMETER DEVELOPMENT AND MANAGEMENT A number of agencies and organizations intervene at
different levels to fill various functions related to irrigation development and perimeter operation (see Figure 1) Some of these functions operlap Perimeters are designed by Genie Rural (Rural Engineering) a division of the Ministry of Agriculture Genie Rural is also charged with supervising the construction of small irrigation projects but the execution of large-scale
3 Horowitz et al (1983) in a section called Land HoldingToday suggest that land markets are widespread in areas of higher population density
3
FIGURE 1 ORGANIZATIONS INVOLVED IN IRRIGATION
MINISTRY OF AGRICULTURE
UN I - L -1
GENIE RURAL Other Divisions ONAHA Other Parastatals
DIVISIONS
Regional Directorates
TJ C __ _ __ _ --_ _ __ __I__ _ _ _
I __ __
Regional Director Niamey TAHOUA Tillabery
Perimeter Perimeter OTHER PERIMETERS Director Director Konni MOULELLA GALMI Djiratawa
r Tounfafi KawaraCOOPERATIVE COOPERATIVE Ibohaman Guidan Maggagi
Comitd de Gestion Comitd de Gestion----I11 4t
25amps4fMPs
- 4 FARMERS r--- -)FARMERS-I I
I I
IConseiller VillageoisQuartier Chief
Village Chief Conseil National I de DeveloppementChef de Canton DoguerawaI
Chef de Poste Administrative Malbaza
SUBPREET of KONNII PREFET OF TAHOUAI HEAD OF STATE
4
projects is the joint responsibility of Genie Rural and ONAHA Because ONAHA has general responsibilities over irrigation development its activities may overlap with those of Genie Rural Feasibility studies are often carried out by foreign consulting firms while perimeter construction is carried out by foreign and local construction firms Funding for irrigation comes primarily from external donors
Structure and Function of ONARA ONAHA was created in Deuember 1979 as a parastatal under
the Ministry of Rural Development charged with responsibility over irrigation activities Before this time irrigation was the responsibility of the Union Nigerienne de Credit et de Cooperatishyon (UNCC) also under the Ministry of Rural Development ONAHAs government affiliation was transferred to the Ministry of Agriculture in 1986
ONAHA is responsible for developing managing and maintaining irrigation infrastructure as well as for providing training and extension services to farmers In addition to the central office in Niamey ONAHA has Regional Directorates in Niamey Tillabery and Tahoua Each perimeter is overseen by a perimeter director perimeter directors are under the authority of their corresponding regional directors Larger perimeters also include field agents among their associated ONAHA staff
Auto-gestion or self-management is a key element of Nigers irrigation development policy Government policy is aimed at eventual auto-gestion at the perimeter level with ONAHA playing the role of a technical assistance agency contracted with for specific tasks by local cooperatives and the comitd de gestion (management committee) attached to each perimeter
Cooperatives Each perimeter is associated with a local cooperative or
in the case of larger perimeters (such as Konni) with several cooperatives Village cooperatives are grouped under the National Union of Cooperatives (UNC) at the national level and
5
the Regional Union of Cooperatives (UIC) at the regional level (the UNC replaced the UNCC) Cooperatives provide credit some inputs marketing and accounting services to their membership which includes local farmers practicing rainfed and irrigated agriculture
The Perimeter Management Committee Cooperatives associated with irrigated perimeters have a
management committee (comitd de Qestion) which is responsible in principle at least for managing the perimeter Management committee structure is designed to allow for the representation of farmer interests and ONAHA technical assistance or supervision Each committee includes a president viceshypresident treasurer and secretary chosen at farmer meetings ONAHA staff comprise the rest of the committee
The committees purchase agricultural inputs from the UNC on credit at the beginning of each season and repay them at the end of the harvest Farmers either purchase inputs directly from the cooperative or receive them as part the package of goods and services covered by the redevance or perimeter user fee They can also buy inputs in the market
The redevance is an obligatory fee charged of all perimeter parcel holders It is calculated each season by ONAHA staff and covers selected inputs some perimeter maintenance and repairs and part of ONAHAs operating costs Specific line items vary from perimeter to perimeter (see Table 21) The rate is calculated on a flat per-hectare fee per farmer and per season rather than as a per volume water fee
Management committees are responsible for collecting the redevance Part of the money is kept at the perimeter level to be spent on minor repairs and day-to-day expenditures The rest is deposited in a bank account from which a portion is taken out and transferred to ONAHA The portion remaining in the account is to be used under the committees authority for major irrigation-related expenditures sucA as repairs and maintenance
6
----------------------------------------------------
------------------------------------------------------
------------------------------------------------------
TABLE 21 BREAKDOWN OF REDEVANCE BY LINE ITEM
PER HECTARE of WET SEASON SORGHUM AND COTTON BY PERIMETER 1985 (CFA)
ITEM MOULLELA GALMI
Construction repairs 15255 11000 heavy works Agricultural inputs (fertilizer) 12025 9000 Vehicle depreciation - 2000 Vehicle operating costs - 3200 Office operation 500 Support to ONAHA 3000 3000 Cooperative revolving funds 2000 1500 Turnout operators fees - 300
Total 32280 30500
Source Briend 1986
n theory the management committee and ONAHA staff determine cropping patterns In practice cropping patterns are conditioned by a combination of the governments policy of promoting food production aid farmers wishes to grow sorghum millet beans and other crops In addition to planting a portion of their parcel in food crops farmers must plant cash crops (ie onions cotton or wheat) in order to ensure payment of the redevance Cotton is sold to a French company under terms of an agreement with the government of Niger
The GMP Perimeters are divided into organizational units called
Groupements Mutualistes de Production (GMP or Mutual Production Groups) GMPs are composed of farmers whose parcels are located on a single secondary canal each group has a president secretary and treasurer The GMP president is usually responsible for collecting the redevance from farmers andor from
7
his treasurer and turning it over to the management committee GMPs are the last link in the long institutional chain that
extends from the Ministry of Agriculture at the state level down through ONAHA to individual farmers (Figure 3) Nigerien farmers lives are also touched by other local groups and by representatives of national ocganizations and political authorities In principle such institutional chains should provide for a two-way channel of communication between the central government and the population However as Ware (USAID 1984) and Arnould (1986) note the structure provides for the top-down transmission of state directives rather than mass
participation
8
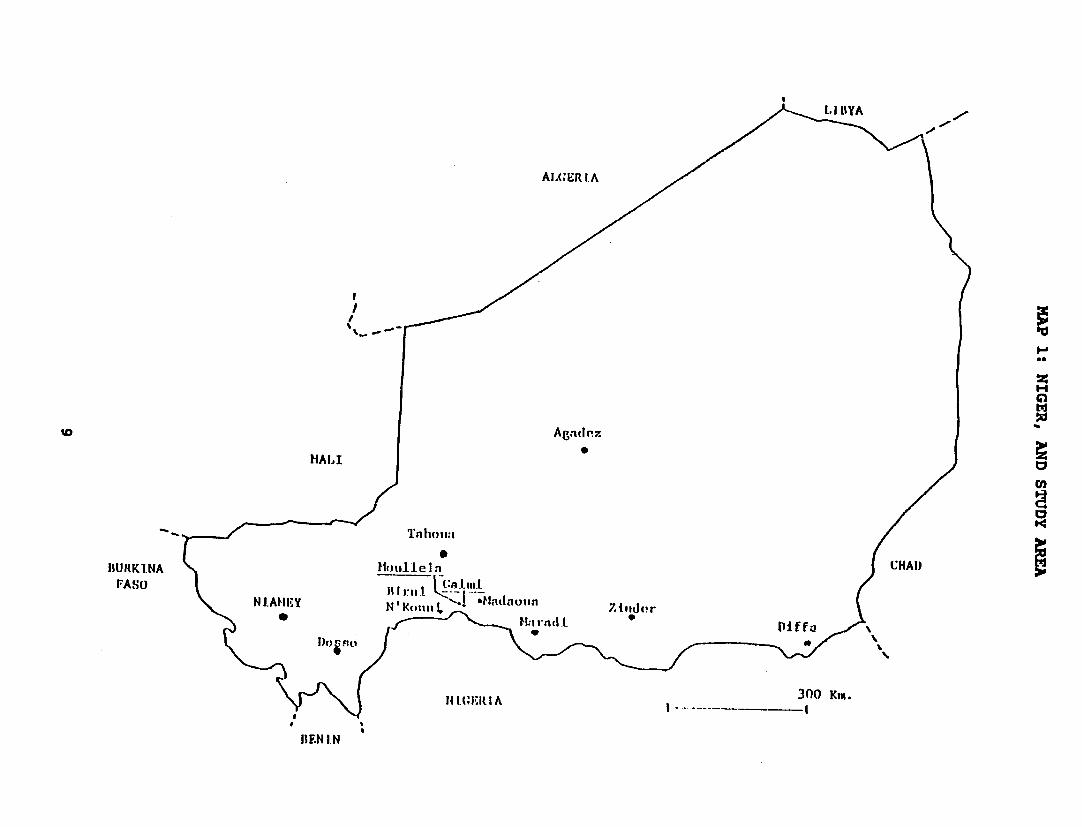
MA
P 1
NIG
ER
AND
STUD
Y
AR
EA
co6
IZ
shyez
9
L
Chapter Three
THE RESEARCH AREA GALMI AND MOULLELA
This section describes the two perimeters where research was conducted and points out their similarities and differences It also provides background for the social and economic data and issues raised in oubsequent sections4
THE SETTING Galmi perimeter is located just off the paved Route National
that runs east-west through the south of Niger connecting Niamey with Znder Annual rainfall in the area averages about 400 mm The perimeter is within one or two kilometers of several villages varying proportions of whose inhabitants have irrigated parcels Galmi Birni Guidan Kare and Guidan Doutchi which are right on the paved road appear to be a single village5
Together they represent an important economic center for the area On market days Galmi is crowded with villagers from throughout the region At the onion harvests and periodically thereafter truckers stop to buy sacks of onions which are sold in Togo Benin and the Ivory Coast Locally hired trucks also take part in the onion trade Onions have been grown in the area for well over fifty years the violet de Galmi (a local variety) is widely known for Its flavor and storage potential
The largest numbers of irrigated parcel holders on the Galmi perimeter come from these three villages and from Guidan Miko and Guidan Roro which are a few kilometers off the highway to the north and northeast Smaller numbers of parcel holders come
4 The selection of Moullela and Galmi perimeters asresearch sites was conditioned by the terms of reference The decision was based on the desirability of gathering additional social and economic data on perimeters for which hydrological and engineering data as well as some socioeconomic data had been collected by Ray Norman
5 These villages will be collectively referred to a Galmi in the remainder of the report
10
from a few other small villages in the area A few farmers with parcels in the Galmi perimeter live in Moullela which is about 6 km north of Galmi along a dirt road
The Moullela perimeter is located just north of the village of Moullela Parcel holders there come primarily from Moullela although a number of Guidan Miko residents also have parcels on the Moullela perimeter A small number of farmers have parcels on both perimeters In contrast to Galmi the village of Moullela has no market nor does it have a school Moullela residents go to Galmi for the market but not for schooling
THE PERIMETERS Table 31 presents selected descriptive data for the
Moullela and Galmi systems Moullela has a smaller command area and fewer parcel holders than Galmi Given the difference in size it is not surprising that the perimeters have different numbers of ONAHA staff At Moullela the perimeter director is the only ONAHA agent in residence At Galmi however there are two training and extension agents and an engineering and maintenance agent in addition to the perimeter director In addition a UNC paid accountantmanager works at the cooperative
Both Moullela and Galmi are gravity flow systems that use water stored in dams for supplemental rainy season and full dry season irrigation In Moullela irrigation water reaches individual fields by passing through control structures into field channels In Galmi siphons are used to draw water from earthen canals into field channels
The cropping patterns on the two perimeters are similar at present During the 1986 rainy season farmers grew cotton on one half of their parcels and millet or sorghum on the other half The grain to cotton ratio at Moullela depends on a crop rotation pattern that has been in existence for a number of years but which was modified slightly a few years ago Now half of each
11
TABLE 31 SELECTED DESCRIPTIVE DATA FOR MOULLELA AND
GALMI PERIMETERS
Perimeter ITEM MOULLELA GALMI
Date of First 1967 1983 - 1984Operation (Dry Season)
Hectares IrrigatedWet Season 1985 626 242 Dry Season 1985-86 11 241 Reservoir Bottom 20 NA
Number of Farmers 124 854
Main CropsWet Season 1984 Sorghum Millet Sorghum Millet
Cotton Beans Beans Dry Season 1985-86 Onions Corn Onions Wheat
CornReservoir Bottom Onions Wheat Corn
Sweet Potatoes NA Tomatoes Okra Squash
Wet Season 1986 Sorghum Millet Sorghum Millet Cotton Cotton
Redevance (CFAha)Wet Season 1985 32280 30500Dry Season 1985-86 15170 22000
Percent Recovery of 100 67 Redevance (through end of wet season 1985)
Source Interviews and Roger Briend (personal cormunication)NA Not Applicable
parcel is planted in grains rather than only a third Cotton was grown at Galmi for the first time in 1986 Farmers could choose between sorghum and millet for the other half of their parcels In previous years the main wet season crops were sorghum and millet Onions wheat and corn are the dry season crops on both perimeters
12
Moullela is an older perimeter than Galmi (Table 31) Siltation is a problem at Moullela this is also true of other small dams in the Maggia Valley (Wells 1985) Although flood recession agriculture is practiced on most of the reservoir bottom the command area is drastically reduced in the dry season There is some question as to how many more years dry season cropping will be viable at Moullela (Briend personal communication) Water availability and siltation do not presently pose a problem at Galmi 6
A certain amount of temporary parcel reallocation takes place at Moullela during the dry season to accommodate parcel holders who are willing and able to cultivate within the reduced command area Some farmers leave their parcels in order to work in Nigeria but the majority remain High onion seed prices may prevent some farmers from growing onions A few non parcelshyholding farmers are allowed to plant on the perimeter during the dry season Arrangements are made either by farmers and approved by the perimeter director or through the perimeter director andor the management committee Non-perimeter parcel holders who farm on the perimeter are charged their proportional (per hectare) share of the redevance
Parcel changes also take place in Galmi but in a different manner and for different reasons Non-perimeter holders are allowed to farm on the perimeter in the dry season for the stated purpose (according to ONAHA staff) of increasing access to irrigated land High labor requirements for onion cultivation are another reason for reducing plot size Farmers with more than one parcel have to give up part of their parcels to other farmers Besides the officially recorded dry-season parcel reassignments some farmers make private arrangements In some
6 The exception to this generalization about Galmi is that there are times when the tail of the system (GMP 25) does not receive enough water during the dry season This is due to asecondary canal which should carry 40 lps according to designbut which for some reason was installed as a 30 lps canal
13
instances this leads to problems in redevance recovery Under officially recorded transactions each party is
responsible for his proportional share of the redevance although there is some ambiguity over who is supposed to give it to the GMP head Under private arrangements however the parcel holder is responsible for the redevance whether or not he receives it from the other farmer
The two perimeters have different rates of redevance recovery (Table 31) Some Galmi farmers have not paid their redevance since the establishment of the perimeter At Moullela payment is not considered a problem
Further differences in farmer behavior on the perimeters were noted at the beginning of the 1986 rainy season In general agricultural tasks were completed earlier and more promptly at Moullela The first rains did reach Moullela before Galmi which would explain the fact that planting weeding and successive tasks would take place later at Galmi A relative shortage of oxen and plows in Galmi partially explains observed delays in plowing there Irrigation furrows were reinforced sooner and more adequately at Moullela and canals were cleaned in anticipation of irrigation Galmi canals remained full of vegetative growth and irrigation furrows were only partially reinforced at the beginning of August
Farmers on both perimeters complain about others irrigating out of turn or excessively but it was difficult to assess these claims given the time frame of the field work Water scarcity is a problem on two of Galmis GMPs this was corroborated by numerous individuals including ONAHA staff who say that this problem is a design fault rather than a people problem (see footnote no6)
Some Moullela farmers complain about a mass expulsion of farmers that took place in 1974 This sanction was supposed to have been leveled at farmers who did not pay their redevance A few say that certain individuals did pay but lost their parcels anyway as a result of actions taken by individuals who
14
subsequently ended up with land that had been farmed by the excluded farmers Moullela farmers did not complain about the process of original parcel allocation Such complaints were heard in the villages served by the Galmi perimeter (see Chapter Seven)7
One can attribute some differences between tha perimeters to the larger number of irrigators at Galmi and to the fact that years of experience may have led to local arrangements that allow somewhat smoother operation at Moullela Clearly both perimeters are operating however auto-gestion is not fully realized8
Before examining some of the socioeconomic factors that may affect perimeter management a brief description of the agricultural cycle on the perimeters is presented in order to provide a context for the subsequent discussion
7 Complaints about land allocation on perimeters have been recorded in other areas See for example Republique du Niger(198518)
8 See Laucoin (1971 1973) for an early discussion of factors constraining auto-gestion
15
Chapter Four
THE AGRICULTURAL CYCLE
CROPS The agricultural cycle includes two cropping seasons
During the rainy season faimers grow rainfed millet sorghum cotton and beans outside the perimeter Millet sorghum and cotton are grown with supplemental irrigation on the perimeters Some farmers grow mangos lemons and root fiber and vegetable plants in enclosed gardens To irrigate they draw water from dug wells with a calabash Farmers who can afford onion seeds and who can mobilize the necessary labor grow wet season onions outside the perimeters
During the dry season farmers grow onions and wheat or corn on the perimeters Sweet potatoes okra squash and beans are grown on the exposed bottom of the Moullela reservoir Onions fruit trees and some vegetables are grown with calabash irrigation in gardens A second crop is not possible on rainfed parcels with the exception of a limited amount of very moist fadama land9
AGRICULTURAL TASKS SEQUENCE DURATION AND PEAK LABOR REQUIREMENTS
This section presents a description of the agricultural calendar with reference to labor requirements It shows that the period of planting and weeding from mid-June through August is a time of concentrated labor requirement Periods of high labor demand on the perimeter may conflict with other household labor needs
Farmers with irrigated parcels must coordinate work on their rainfed parcels with perimeter tasks which follow a schedule fixed by the perimeter directors Certain tasks which are not necessary on rainfed land such as plowing and furrowing must be
9 Fadama land refers to moist alluvial soil in valleyfloors with a high water table
16
performed on the perimeter Tables 41 and 4P present illustrative interview data on time 6pent on selected activities
TABLE 41 REPORTED LABOR ALLOCATION BY TASK ON IRRIGATED LAND
SELECTED CASES FROM GALMI AND MOULLELA (in Worker Days)
TYPE OF IRRIGATED PARCEL CROP(S) AND AREA Wet Season Dry Season
Sorghum and Cotton Wheat Onions Task Beans 05 ha 05 ha 0125 ha 0125 ha
Clearing Soil 3 NA 3 3Plowing 3 NA NA NAPlanting 9 4 3 18First Weeding 9 14 5 18Second Weeding 6 19 0 10 (or further weeding)Irrigation 1 NA (8 for both)Harvest 20 59 8 18Tying (Sorghum) 4 0 0 0 TOTAL 55 96 23 71 Working daysha 110 192 184 568
NA=Not Available Source Farmer Interviews
TABLE 42 REPORTED LABOR ALLOCATION BY PLOT AND SOIL TYPE
FOR SELECTED TASKS AND CASES FROM GALMI AND MOULLELA (in Worker Days)
Type and Area Plot Per Hectareof Parcel Weeding(s) Harvest Total Total
Rainfed Millet 26 16 42 28 15 ha
Rainfed Millet 8 5 13 26 05 ha
Rainfed Millet on 8 2 10 20 Sandy Soil 05 ha
Rainfed Millet on 15 3 18 72 Fadama Soil 025 ha
Irrigated Millet 16 2610 104 025 ha
Source Farmer Interviews
17
Labor allocation reported by farmers differs by crop on irrigated parcels (Table 41) and for a given crop depending on soil type (Table 42) It must be stressed that these data come from interviews with selected farmers and refer to their specific conditions the information is meant to be illustrative The irrigation time for sorghum and cotton may be closer to 3 to 4 worker daysha (see Norman 1987) Norman (personal communication) suggests that the total worker daysha for sorghum is slightly overestimated the cotton figwe underestimated while dry-season onions take 350 to 400 worker daysha The irrigation time for sorghum and cotton may be closer to 3 to 4 daysha per wet season A narrative overview of the sequence and timing of major tasks will further clarify the significance of labor requirements
The Rainy Season
Preparation for the rainy season begins in June when farmers clear rainfed parcels and dry-plant sorghum and millet in anticipation of the first rains Dry-planting refers to the practice of planting seeds in dry soil just before the beginning of the expected rainy season If the rains are insufficient or late the seeds may not all germinate if there is flooding seeds may rot 10 Thus selective re-planting is often necessary Beans are often planted between the rows of rainfed millet or sorghum In Moullela farmers plow rainfed cotton plots In general however rainfed land is not plowed
According to ONAHA directives parcels on the perimeters must be cleared and plowed Farmers who do not own oxen and plows need to pay those who do to get the work done Due to a shortage of oxen in Galmi plowing continued into mid July 1986 in some parts of the perimeter After plowing farmers wait for the first rains to plant Dry-planting on the perimeters is
10 Most farmers interviewed at Moullela and Galmi reported treating their millet and sorghum seeds with fungicide to preventmold
18
discouraged by ONAHA agents who argue that too much seed is lost this way Many farmers on both perimeters say they would prefer to dry-plant without plowing on the perimeter to reduce costs and labor requirements
This is clearly a period of high labor demand particularly for farmers with both rainfed lands and perimeter parcels and farmers with larger total holdings since work must be accomplished everywhere at once Galmi and Moullela farmers found it difficult to finish their planting both on their outside parcels and on the perimeter within the time frame recommended by ONAHA personnel Some farmers reported hiring labor in order to meet the perimeter directors schedule these farmers must have had access to cash to pay wages
Labor requirements remain high through the weeding period which extends from July to September depending on the timing of planting and rains Millet and sorghum are weeded at least twice both on and off the perimeters Beans are weeded after the cereal crops Cotton must be thinned and weeded Yields are highly responsive to weeding
The rainy season harvest is also a period of high labor demand but farmers claimed it was less critical than planting and weeding The millet and sorghum harvest begins in mid- to late August continuing through late October Certain varieties planted on rainfed land are harvested later Beans are harvested for about a six week period starting in mid-September Cotton is harvested four to six times between October and mid-December The different growing periods associated with each crop together with staggered planting dates and microclimatic differences between parcels may allow the harvest to take place with somewhat less pressure than planting and weeding Farmers who plant wet season onions however face additional labor requirements
Changes in the cost of hired labor reflect periods of peak labor requirements Farmers in Galmi reported that laborers were being paid 1500 CFA per day for weeding during the 1986 wet season They noted that the price would go down to 1000 CFA per
19
day for harvesting and packing Labor is more expensive in Galmi than in Moulella where day laborers typically make 500 CFA plus two meals (worth about 150 CFA)ll
Farmers who can afford to hire labor must balance increased labor costs against anticipated yields Farmers without the cash to hire labor are largely constrained by household labor availability12 Land-short villagers may obtain substantial income during the weeding period by hiring themselves out13
The Dry Season Soil preparation for the dry season begins as early as
October following the harvest After clearing and plowing farmers make beds with raised edges for their onion plants they then plant wheat or corn and onions Onions are transplanted from nursery plots begun over a month earlier Some farmers have their own nurseries others buy the seedlings Either way onions require considerable labor and cash investments According to one estimate one hectare of irrigated onions requires 660 person-days of labor (GERSAR 1981) Galmi farmers usually plant 0125 ha (half a parcel) of onions which would require 825 person-days following the GERSAR estimates
After transplanting onions must be weeded Wheat is also weeded during this period Harvesting onions includes several
11 During the period of research the exchange rate averaged 360 Francs CFA per $100 US
12 Labor may also be mobilized through gavaa a traditional form of community labor organization In addition close relatives and friends frequently exchange labor However it hasbeen suggested (USAID 1984) that these forms of labor mobilization occur more frequently on rainfed land than onirrigated parcels Cases of gaaa and labor exchanges were observed on the perimeters during field work This is an issuethat deserves further study in order to determine whether there are systematic differences in labor mobilization patterns between rainfed and irrigated land
13 This fact is often ignored by economists and developmentplanners in discussions about the benefits of introducing laborshysaving technologies
20
operations The onions are picked and the leaves are cut wrapped into bunches and dried Most farmers sell their onions immediately after the harvest
Farmers without pressing cash needs and who have access to storage facilities can store onions and sell them later on at prices of up to ten times the price at harvest Onions harvested before maturity cannot be stored as long as fully matured ones which may be stored from five to seven months Briend (personal communication) notes that many farmers on both perimeters harvest
onions before full maturity This may be due to labor constraints experienced at the wheat and onion harvest Harvesting before maturity is probably more common among farmers who sell their onions immediately to meet cash needs
The dry season harvest is generally over by the end of March During April and early May farmers repair their tools and homes And of course they continue to perform the various offshyfarm activities they have engaged in throughout the year In late May the cycle begins again
21
Chapter Five LABOR AND PERIMETER MANAGEMENT AND OPERATION
irrigation perimeter management and operation is affected by hydrological engineering climatological agronomic economic sociological and cultural factors Sociological analysis of irrigation systems implies the examination of economic and social influences on production to describe elements that affect perimeter operation Three broad elements have been selected for analysis in this report (1) labor (2) differential access to cash land and other productive resources and (3) issues of power as related to land tenure and property control over agronomic practices decision making and the cooperative and management committee and ONAHAs role in perimeter management14
The first is discussed in this chapter the second and third in the chapters which follow
POTENTIAL HOUSEHOLD LABOR Demographic variables such as total household size and
household composition by age and gender determine household labor availability and therefore have a significant impact on agricultural production of any kind Labor requirements for irrigated agriculture are higher than for rainfed production because additional tasks are required plowing field channel construction canal cleaning and irrigating Also tasks like weeding require more time under irrigated conditions Insufficient household labor means limiting the area cultivated hiring labor or mobilizing labor through other means
Agricultural activities on Moullela and Galmi perimeters are performed primarily by men and boys Children begin working on their elders fields at the age of seven or eight Women participate in the cotton harvest but their contribution to
14 Appendix 1 describes the methodology employed in this
research
22
other agricultural work is indirect and includes preparing and carrying food to men and boys working in the fields Therefore the number imales of age eight and over can be used as an rough indicator of available household labor for irrigated agriculture
Data collected on a series of variables related to household size and composition show that the modal household consists of a male head of household an additional zero to two males eight years or older one to two women over the age of seven and two or three children under seven years of age 15
Males over the age of eight are defined as potential workers or active males Table 51 shows the distribution of potential
working males per household
TABLE 51 DISTRIBUTION OF NUMBER OF POTENTIAL WORKING
MALES PER HOUSEHOLD (Number of Households)
Number of Males Per Household 1
Number of Households Galmi 6 Moullela 1
2
9 9
3
9 10
4
6 5
5
2 2
6
0 2
7
2 -
8
1 -
--------------shy----------------
Total 7 18 19 11 4 2 2 1
Source Survey data
The majority of households (especially in Moullela) have two or three active males Assuming a six-day work week a household with two active males has fifty-six theoretically available worker days per month and a household with three active males has eighty-four However potential labor supply is also
15 For research purposes the household was defined as including those individuals with whom the respondent usuallylived ate or pooled resources At minimum Hausa households generally include a male head of household one or more wivesand unmarried children In many cases married sons (and their wives and children) remain in the fathers compound and share certain resources in common Other relatives may also be present See Horowitz et Al (198327) for further background on definitions of households in Niger
23
affected by the (1) timing of tasks (2) total area of land cultivated (3) labor actually allocated to agriculture and (4) the importance of other activities that comprise the household livelihood
LABOR LAND DISTRIBUTION AND THE AREA UNDER CULTIVATION
As noted earlier planting and weeding are ideally performed on a number of plots at once Available worker days may be sufficient to work any one household plot but insufficient to work a number of plots Accurate measures of total landholdings would be necessary to fully evaluate labor constraints Gathering such data was beyond the scope of this study However data were collected on the area of irrigated land and on the number and type of rainfed plots held by respondents While in the case of rainfed land the number of plots does not correspond directly to land area the data give a rough indication of the extent and types of land that draw the farmers labor These data can be used in conjunction with data on labor committed for specific tasks to estimate the minimum number of worker-days allocated to cultivate a set of parcels with a given area
Perimeter Parcels Table 52 shows the distribution of parcels per household
for perimeter parcel-holders in Moullela and Galmi
TABLE 52 DISTRIBUTION OF IRRIGATED PARCELS TO WHICH
RESPONDENT HAS TITLE (Number and Percent of Respondents)
Number of Parcels
GALMI (N=31) Number Percent
MOULLELA (N=29) Number Percent
1 29 83 20 69 2 2 17 7 24 3 - - -
4 - - 2 7 31 100 29 100
Source Survey data
24
Most of the perimeter parcel-holding households sampled have one perimeter parcel In Galmi 17 percent of respondents have two irrigated parcels while in Moullela the iorresponding figure is 24 percent Two farmers in Moullela reported having four perimeter parcels16
Total irrigated land holding size varies within the perimeters On the whole Moullela farmers have larger areas of irrigated land than those on the Galmi perimeter Furthermore the distribution of irrigated holding size is wider at Moullela than at Galmi (Table 53) For these reasons the per-household labor requirement for perimeter parcel holders also varies
TABLE 53
DISTRIBUTION OF IRRIGATED LAND AREA BY PERIMETER (Number and Percent of Respondents)
Irrigated Area GALMI (N=31) MOULLELA (N=29)(ha) Number Percent Number Percent
0 - 025 23 66 2 7 026 - 050 10 28 11 37 051 - 075 2 6 6 20 076 - 124 - - 3 10 125 - 150 shy - 4 14 151 - 167 shy -3 10
31 100 29 98
Note Percentages do not add to 100 due to rounding error Source Survey data
Differences in irrigated holding size can be partially explained by the different guidelines followed in parcel attribution on the two perimeters In Galmi between one and three parcels of 025 ha were allocated on the basis of previous landholding and family size (GERSAR 1981) In Moullela parcels were allocated on the same principle but with a different formula and no fixed increment of parcel sizes Furthermore as
16 Six of the sampled Moullela farmers with multiple parcels have one on the Galmi perimeter as well
25
noted above Galmi has been operating for a shorter time period While most farmers in Galmi are the original parcel holders this is no longer the case in Moullela where only thirty-one of the original parcel holders remain (see Norman forthcoming 1987) According to Norman (personal communication) in approximately 90 percent of the cases of farmers who lost irrigated parcels the land was reallocated within the same family Thus the original attribution procedure provides only a partial explanation for the present uneven distribution of land at Moullela parcels have also been subdivided among inheriting sons
The conclusions to be drawn from Table 53 with respect to labor requirements are first that perimeter parcel holding households are not by virtue of membership in a perimeter likely to spend uniform time working on their parcels Second Moullela farmers have an average of twice as much irrigated land to cultivate Third given land distribution on the Moullela perimeter calculations of average labor requirements for Moullela farmers as a group will hide wide variation between households
Reservoir Parcels In addition to parcels on the perimeter itself Moullela
parcel holders received title to a strip of land on the reservoir bottom which is cultivated in the dry season as the water recedes However 55 percent of the Moullela respondents reported that they did not have parcels on the reservoir bottom (Table 54)17 Moullela farmers who cultivate the reservoir bottomas well as irrigated parcels during the dry season will need more labor in comparison to those who do not farm on the reservoir bottom
17 Norman (personal communication) suggests that some peoplebegan farming this land when the perimeter was built whileothers did not Those who began earlier have gradually expandedtheir holdings over the years However the process leading upto the unequal use of the reservoir bottoms is unclear and deserves further study
26
TABLE 54 DISTRIBUTION OF RECESSION AGRICULTURE PLOTS USED
IN THE MOULLELA RESERVOIR (N=29)
Number of Plots Number of Respondents Percent
0 16 55 1 11 38 2 2 7
Source Survey data
Rainfed Plots Farmers in the research area classify their rainfed plots
according to differences in soil type altitude slope and moisture For this study rainfed land has been grouped into two broad categories (1) fadama low-lying land with moist soils which may flood during the rainy season and (2) all other rainfed land (which farmers divide into at least four different categories) Data on the distribution of fadama and other rainfed plots are shown in Table 55
TABLE 55PERCENT DISTRIBUTION OF NON-IRRIGATED PLOTS BY TYPE OF LAND
AMONG PERIMETER PARCEL HOLDERS (Number and Percent of Respondents)
Fadama Other Rainfed Number of Plots
GALMI No
MOULLELA No
GALMI No
MOULLELA No
0 1 2
25 7 2
71 20 6
15 8 2
52 28 7
2 13 7
5 37 20
1 5 7
3 17 24
3 - - 2 7 6 17 4 14 4 1 3 1 3 3 9 6 21 5 - - - - 3 9 3 10 6
10
- -
1 -
3 -
1 1
3 3
14 - - 1 3 - -25 -
35 -
I00 -
29 -
100 -
35 -
100 1
29 _3 98
Note Percentages do not add to 100 due to rounding error Source Survey data
27
About half of the perimeter parcel-holding farmers in Moullela and 30 in Galmi have at least one fadama plot The number of plots per household ranges from one to four in both samples One Moullela farmer reported that he held 14 fadama plots he is clearly an exception
In contrast the vast majority of perimeter-parcel holding farmers have several other rainfed plots Only two respondents from Galmi and one from Moullela reported no other rainfed plots (Table 55) Eighty percent of Moullela respondents and 58 percent of those in Galmi have two or more rainfed plots One Moullela farmer reported having twenty-five rainfed plots
Gardens do not figure prominently as a category of land worked by sampled farmers ith perimeter plots Two Galmi parcel holders and four from Moullela report that they have gardens The rest of the perimeter holders (94 percent of respondents in Galmi 86 percent in Moullela) do not Gardening is more prevalent among non perimeter parcel holders (see Appendix 2 Table VI) 18
Household Size and Land Area Cultivated land area may be primarily a function of
household size or available labor (see Chayanov 1966) In order to test whether this was the case among the samples from the two perimeters the number of active males per household was crosstabulated and correlated against the irrigated area number of rainfed plots and number of fadama plots per household
X found little evidence of a direct positive relationship between available male labor and irrigated area and number of rainfed or fadama plots The only positive and significant association (r= 044) was between the number of active males and number of rainfed plots per household in Galmi The correlation
18 Further research might investigate whether this is a
systematic pattern and if so explore the reasons behind this
28
coefficient for these two variables for the two perimeters combined was r- 018
These results are difficult to interpret given the lack of data on rainfed area However they do show that there is no strong positive linear relationship between available (male) labor and available indicators of land held by farmers on the two perimeters studied A similar analysis for the Konni I perimeter showed a weak but significant correlation (r=030) for these two variables (Rdpublique du Niger 198518)
Horowitz et al (198347-51) review a number of studies and conclude that the distribution of landholding on a village level in different regions of Niger is unequal They note that
(o)ne of the contributing factors to the differentiation ofrural farmers is the uneven access of farming units to land Although there are few truly landless rural households manyhouseholds do not hold enough land to meet either food or cash needs from their farming activities alone (198347)
Thus access to land in the research area--defined In terms of indicators of land holding and land use--also appears to be unequal and not necessarily related to household size or available labor
DISCUSSION OF LABOR AVAILABILITY Labor available for irrigated agriculture and water
management is a function of household labor total irrigated holdings and total rainfed land Other factors such as off-farm activities and the capacity to hire labor also affect labor availability for irrigated agriculture The vast majority of Galmi and Moullela farmers are engaged in a farming system in which irrigated parcels represent only one of various types of plots worked Half of the Moullela farmers have one fadama plot and a plot in the reservoir and the majority have at least two other rainfed plots in addition to their irrigated parcel In Galmi over a quarter of farmers have one fadama plot and the majority have at least one other rainfed plot
29
In order to translate Qata on number of plots into an estimate of labor allocation for each individual household in the sample we would need to know the actual area of land for each rainfed plot as well as mean days of labor invested per unit area Since these data are not available we will estimate labor requirements on rainfed plots for the group as a whole by attributing average sizes to different types of plots Informal interviews indicate that fadama plots vary in size from 025 to 075 ha while other rainfed plots range from 02 to 30 ha A reasonable estimate for a mid-range fadama plot is therefore about 05 ha and 16 ha for other rainfed
Based on these mid-range holding sizes I have constructed two hypothetical case households for each perimeter (Table 56) Case 1 for each perimeter includes a fadama plot case 2 does not case 1 for Moullela includes a reservoir bottom plot Table 56 suggests the total land area cultivated for households with mid-range holdings The actual spread is probably far greater
TABLE 56ESTIMATED WET SEASON LAND AREA CULTIVATED PER HOUSEHOLD CASE EXAMPLES
Average Area of Cultivated Land (ha)
Type of Plot GALMI
Case 1 Case 2 MOULLELA
Case 1 Case 2
Perimeter 025 025 050 050 Reservoir - - 008 -Fadama 050 - 050 -Other Rainfed 160 160 320 320
235 185 428 370
Note Case 1 includes fadama land while case 2 does notSource Farmer Interviews
Data were collected on labor investments on plots of known sizes in the course of the research from a limited number of farmers (see Tables 41 and 42) The GERSAR (1981) pre-project study for the Galmi perimeter includes the results of a labor allocation study for a number of crops on rainfed and irrigated land By incorporating these data into the four cases shown in
30
Table 56 it is possible to calculate the number of working days these households hypothetically invest in agriculture This is carried out for the wet season crops
For the purpose of these calculations I assume that perimeter areas in Table 56 are devoted half to cotton and half to milletsorghum and that labor is fully and uniformly allocated over a five-month rainy season The interview data and GERSAR data are similar for irrigated crops but the GERSAR data show a higher labor allocation on rainfed plots than the data gathered in this study
The labor allocation values used for the calculations are 1 Irrigated Sorghum and Millet 100 working-daysha
(Source Interview Results and GERSAR)
2 Irrigated Cotton 192 working-daysha (Source Interview Results)
3 Rainfed Millet Fadama soil 87 working-daysha (Source Interview Results)
4 Rainfed Millet Other soil a) 40 working-daysha (Light weeding)
(Source Interview Results)b) 87 working-daysha (Heavy weeding)
(Source GERSAR)
Incorporating these results into the data from Table 56 gives the results shown in Table 57 It must be noted that the total working-days per month are probably underestimated
The following observations about wet season agriculture can be made based on the results in Table 57 1 The first set of cases (light weeding) is based on interview results and therefore represents actual labor commitments These figures reflect the availability of labor to the household not a hypothetical fixed labor requirement per unit area 2 The difference between the GERSAR data and interview data on rainfed land indicates that labor input per unit area can be highly variable We can assume that the GERSAR data represent a case where labor is utilized more intensively possibly because of greater ability to mobilize labor from within the household
31
----------------------------------------------------
TABLE 57 LABOR INVESTMENTS WET SEASON AGRICULTURE
(COTTON AND MILLETSORGHUM) CASE EXAMPLES
(Number of Working-Days)
Type of GALMI MOULLELA Land Case 1 Case 2 Case 1 Case 2 a) Light Weeding
Perimeter 37 37 73 73 Fadama 44 - 44 -Rainfed 64 64 144 144Total 145 101 261 217Working-daysmo 29 20 52 43
b) Heavy Weeding
Perimeter 37 37 73 73 Fadama 44 shy 44 -Rainfed 115 115 230 230 Total 196 152 347 303 Working-daysmo 39 30 69 61
Sources Table 56 and labor allocation values presented above
or to draw on cash resources to hire labor The discrepancy might also be explained by different soil and water conditions However the overall conclusion that there is great potential variation in labor input per unit area depending on labor availability and cash costs still seems valid 3 Total labor allocation to perimeter plots is relatively constant in the two sources of data (GERSAR and interviews) while the actual (based on interviews) labor commitment to rainfed land is much lower that that given by GERSAR While this may simply be a function of the higher labor intensity required on the perimeter for a given crop it also suggests that in the research area labor may be preferentially committed to the perimeter plots That is labor allocated to the perimeter is relatively constant but labor allocated to rainfed land may fall with declining labor availability
32
These preliminary results indicating preferential labor allocation to perimeter plots may reflect (1) the greater reliability of perimeter agriculture in relation to rainfed agriculture (at least during drier years) or (2) the closely supervised nature of perimeter agriculture or (3) the need for cash from cotton and onions or (4) the relatively higher labor intensity of certain perimeter crops such as cotton and onions (although cotton is also grown on rainfed plots and onions are grown in gardens or (5) all of the above In order to provide irrigation planners witlh adequate baseline information further research should address the question of how households respond to different levels of labor availability especially with respect to allocation choices between rainfed and perimeter agriculture The relationship between whether a given year is good or bad with respect to rainfall and labor allocation between perimeter and rainfed land should also be investigated It is possible that on good years farmers try to spend relatively less time on the perimeter since their marginal product on rainfed land would be higher than on a bad year when it might be more economical to concentrate on getting a good harvest from the perimeter 4 With respect to the actual working days the case of light weeding (I) the data in Table 57 show that monthly labor investment ranges from 20 and 29 days per month in Galmi to 43 and 52 days per month in Moullela (Note again that these ranges reflect actual labor committed) We can conclude that one adult male could cultivate the set of Galmi parcels but that two adults or one adult and two children would be required for the set of Moullela parcels
In the set of cases of heavy weeding (II) monthly labor requirements (now potential rather than actual) would range from 30 to 39 working days in Galmi this could be accomplished by an adult and a child or two adults for the second case) In Moullela the labor requirements would be 61 and 69 working-days
33
which would require for example two adults and a child or one adult and three to four children
These represent typical or average cases for Galmi and Moullela As the data on land distribution show (Table 56) the actual range is greater than given by these cases many households farm larger areas of land The problem of matching total available labor in a given area to unequally distributed land leads to the utilization of institutions of labor exchange (hiring labor kinship networks etc) this may represent a bottleneck that can constrain marginal labor productivity in any smallholder agricultural system 5 The proportion of agricultural working-days allocated to the perimeter in the wet season are given in Table 58
TABLE 58 PROPORTION OF TOTAL AGRICULTURAL LABOR ALLOCATED TO THE PERIMETER WET SEASON
Case GALMI 1 Case 2
MOULLELA Case 1 Case 2
I (Actual) 26 II (Potential) 19
37 24
28 21
34 24
Source Table 57
The majority of working time is allocated not to the perimeter but to rainfed land This implies that during the wet season perimeter agriculture is not the primary component of the household production strategy at least in terms of labor committed These results refer to the wet season and therefore do not necessarily imply that income from or total household labor allocated to the perimeter is correspondingly small Some farmers are able to make a relatively large income from cash crop agriculture on the perimeter particularly during the dry season (see Chapter Six)
34
ACTUAL LABOR ALLOCATED TO AGRICULTURE BY GENDER
Table 59 summarizes the aggregate survey data on potential labor available versus actual labor allocated to agriculture by gender for each perimeter
TABLE 59 POTENTIAL AND ACTUAL LABOR ALLOCATION
FOR MALES AND FEMALES EIGHT YEARS OF AGE AND OVER (Number and Percent of Males and Females)
MOULLELA GALMI (29 Households) ( 56 Households)
MALES Potentially Available Males 85 107
Males Actually in Agriculture 79 82 (at least part-time)
Percent of Total Males 7 23 not in Agriculture
FEMALES Potential Available Females 66 140
Females Actually in Agriculture 37 91 (not necessarily full-time)
Percent of Total Females 44 85 not in Agriculture
Source Survey Data
Male Labor Data on actual labor allocated to agriculture shows that the
theoretically available labor of males over the age of eight is not allocated entirely to agriculture Off-farm activities compete with agriculture for household labor
A much greater proportion of available male labor is allocated to non-agricultural activities in Galmi than Moullela In Moullela 7 percent of active males are engaged full-time in non-agricultural activities whereas in Galmi the corresponding figure is 23 percent This difference is probably explained by the greater availability of alternative sources of income
35
generating activities in Galmi The remainder (93 percent of active males in Moullela 77 percent in Galmi) are engaged in agriculture on either a part-time or full-time basis These figures include children whose labor contribution is not equivalent to that of an adult Nevertheless all of these males are counted as full-time male adult workers for the purpose of this study This overestimates available male labor
Female Labor The data in Table 59 show that the proportion of females
over seven years of age working in agriculture is significantly different for the two perimeters Seventy percent of households in the Moullela perimeter subsample had one or two women performing some agricultural work (primarily in the cotton harvest) That is 50 percent of the women over age seven in the Moullela subsample were involved in some kind of agricultural work In contrast only a little over one-quarter of Galmi perimeter households had one or more women engaged in some agricultural activity Of the total number of females over age seven in this subsample only 15 percent performed at least some agricultural tasks
The higher proportion of women involved in agriculture among parcel-holding households in Moullela--as opposed to those from Galmi--may be due to the longer history of cotton cultivation in Moullela There may also be a relationship between womens higher participation in agriculture and the apparent higher proportion of (male) labor migration in Moullela Another reason behind this difference may have to do with wider opportunities for women to generate income through non-agricultural activities in Galmi Processing andor selling food would be an example of such activities
LABOR MIGRATION Labor migration affects agricultural production by changing
the extent and seasonality of available household labor and by
36
-----------------------------------------------
providing additional cash income Migrants are often considered to represent labor that might otherwise be allocated to agriculture However insofar as labor migration is a kind of rite of passage that young men in rural areas practice to accumulate cash it does not necessarily follow that this labor would just as easily be allocated to agriculture
Data on the number of people usually considered to be part of the household but who were currently absent and employed or seeking employment show that migration is more prevalent in Moullela than Galmi (Table 510) This is corroborated by data
TABLE 510 NUMBER OF MIGRANTS PER HOUSEHOLD
(Parcel-holding Subsample)
Number of Migrants per Household 0 1 2 3 Overall
Number of Households Galmi 19 6 7 3 35 Moullela 10 14 2 3 29 Percent of Households Galmi 54 17 20 9 100 Moullela 35 48 7 10 100
Total 29 20 9 6
Source Survey Data
from the subsample of non-perimeter parcel holders over 90 percent of the non-perimeter holding subsample in Galmi had no migrants whereas in Moullela 43 percent did not (see Table I Appendix 2) The greater proportion of migrants in Moullela for parcel holders and non-parcel holders alike might be explained by the few options for cash generation there
FARM VERSUS OFF-FARM ACTIVITIES The survey results show that respondents with perimeter
parcels engage in a variety of non-agricultural activities Variables representing the respondents primary and secondary activities were constructed based on answers to questions about
37
- -
time spent on different activities (Table 511) (Note that the activities of the male head of household are listed not the activities of other household members) These data illustrate differences in the importance of agriculture as a primary activity in Moullela and Galmi
TABLE 511 PRIMARY AND SECONDARY
ECONOMIC ACTIVITIES OF PERIMETER PARCEL-HOLDING RESPONDENTS (Number and Percent of Respondents)
Primary GALMI MOULLELA
Secondary GALMI MOULLELA
no no no no
Agriculture 26 74 25 86 2 6 1 3
Agriculture and 1 3 2 7 10 29 16 55 Livestock
Local Non-Ag 3 9 - - 4 11 - -Wage Labor
Migrant - - 3 9 2 7 Wage Labor
Agricultural - - - - 2 6 3 10 Wage Labor
Commerce and Trade 3 9 1 3 4 11 2 7
Petty Commerce 1 3 - - 2 6 1 3
Mechanic - - 1 3 - - 1 3
Blacksmith 1 3 - - 1 3 - -
Butcher - - 2 6
Trucker 1 3 - -
Baker - shy - - 1 3
No Secondary 4 11 2 7 Occupation
35 101 29 99 35 101 29 98
Note Percentages do not add up to 100 due to rounding error Source Survey data
38
We can conclude from the data in Table 511 that agriculture is the dominant primary activity for farmers on both perimeters but it is relatively more important at Moullela Other primary activities include commercetrade and mechanical repairs at Moullela and commercetrade petty commerce19 non-agricultural wage labor and blacksmithing at Galmi Second most farmers on both perimeters are engaged in a range of secondary activities many of which are not agricultural A higher proportion of respondents at Galmi are engaged in secondary activities that do not include agriculture or livestock than at Moullela
CONCLUSION3 AND QUESTIONS FOR FURTHER RESEARCH In summary labor requirements per unit of land for irrigated
agriculture are higher than for rainfed production Insufficient household labor means limiting the area cultivated hiring labor or mobilizing labor through other means The majority of households on both perimeters include two to three potentially active working males which translates into fifty-six to eightyshyfour working days per month This labor is allocated primarily but not entirely to agricultural activities
Labor allocated to agriculture is only partly a function of the total area cultivated The relationship between available male labor and irrigated land area or number of rainfed plots per household was fcund to be negative or weak for the two perimeters
Land is not evenly distributed among sampled farmers this is true particularly of irrigated land in Moullela but also holds for the distribution of the number of rainfed plots With respect to irrigated land there are also differences between the two perimeters on average farmers in Moullela cultivate twice as much irrigated land as in Galmi (but the number of available males per household is roughly similar the perimeters)
19 Petty commerce refers to selling anything from cigarettes and chewing gum to batteries mosquito coils and cansof tomato paste from a small roadside table
39
Furthermore reservoir bottom land (available only in Moullela) is only used by about one-half the sampled farmers
This suggests that the distribution of total area cultivated per household (rainfed and irrigated) on each perimeter is unequal Unequal land distribution implies that the labor necessary to cultivate a set of plots will vary from household to household That is households do not face uniform labor demands The relevance of this issue to water management is that farmers on a perimeter will have different priorities for allocating labor based on differential access to land and labor Coordinating their activities may be problematic
Calculations based on reported labor allocation to various types of plots and estimates of total land area suggest that during the rainy season a greater proportion of labor is allocated to rainfed plots than to irrigated plots That is working irrigated plots is only one part of the overall household livelihood strategy and is balanced against utilization of other land resources The data suggest that the labor per unit area allocated to perimeter cultivation is relatively constant while labor per unit area allocated to rainfed agriculture may vary considerably from household to household
A higher proportion of male labor is allocated to nonshyagricultural activities among Galmi parcel holders than among those from Moullela This may be due in part to the greater opportunities for non-agricultural labor in Galmi which is situated on the main road arAd perhaps also by the smaller average land area held by Galmi households A higher proportion of females in parcel-holding Moullela households participate in agriculture than in Galmi This is primarily a function of the longer history of cotton cultivation in Moullela
Labor migration is more pravalent among Moullela perimeter holders than those from Galmi This is probably due to the
40
relative lack of non-agricultural work for young males in Moullela20
Agriculture is the dominant primary activity among respondents from both perimeters but especially in Moullela Farmers on both perimeters however do engage in a range of additional activities Secondary activities for Galmi parcel holders include a greater proportion of cash-generating occupations outside of agriculture and animal husbandry than for Moullela parcel holders
20 The lower rates of labor migration in Galmi may be related to the proximity of the Nigerian border Men from Galmi can make shorter more frequent trips which are not defined as exode (labor migration) but which would preclude other (agricultural) activities and would represent a source of cash income
41
Chapter Six
INCOME LAND OTHER PRODUCTIVE RESOURCES AND MATERIAL INDICATORS OF POTENTIAL RESOURCE MOBILIZATION
Farmers incomes (cash or in-kind) land and other productive resources such as animals tools and equipment influence agricultural production in general and irrigated agriculture in particular Different levels of income and other resources may translate into differences in investment in fertilizer costly seeds such as onions or labor and consequently into differences in total production
Most irrigation schemes in Nigcr are managed with the idea that farmers will complete tasks according to a uniform schedule In this way an entire crop will receive maximum benefit from any given irrigation by virtue of being at the same stage of growth and water requirement Underlying this model of perimeter operation is the implicit assumption that all farmers on a given perimeter are equally able to mobilize resources for agriculture
For example the expectation that all farmers on a perimeter will weed by a certain date assumes they can either use their own and family labor or hire the necessary labor all within a limited time period Even if we assume an adequate overall labor supply it is not evident that individual farmers can uniformly mobilize labor--whether hired or not
Not all farmers can mobilize the same levels of resources whatever the resource This variability alone may account for apparent performance differences and be a crucial influence on perimeter operation It is therefore important to examine the distribution of resources among farmers associated with a given perimeter Unequal distribution of resources indicates a gap between resource-rich and -poor farmers The wider the gal the more difficult it may be to coordinate activities among a group of farmers Variables indicating differences in potential resource mobilization are discussed in this chapter
42
CASH
The availability of cash and its timing determine farmers ability (1) to hire labor during periods of peak labor demand (2) to purchase adequate inputs when needed and pay the redevance (3) to invest in animals equipment and other productive resources (4) to store a portion of the crop (eg onions) for later sale at a higher price or for consumption rather than selling immediately to pay outstanding debts or bills and (5) to purchase consumption and other goods Payments received in-kind may be sold for cash or retained for consumption or future sale
Farmers generally obtain cash not only from agriculture but by engaging in non-agricultural work They may also receive cash from other household members who earn cash Data on total cash income were not collected but information on participation in cash-generating activities can serve to indicate variability in access to cash--and by logical extension differential resource mobilization potential Cash available from agricultural production is discussed separately
Cash-Generatinq Activities As noted in Chapter Five Moullela and Galmi farmers are
engaged in a variety of activities many of which generate cash faster and with greater regularity and reliability than agriculture Table 61 shows that although most farmers on both perimeters allocate their time to more than one productive activity a higher proportion of respondents from Galmi have primary as well as secondary activities which generate cash directly21 While these data refer only to the respondent the data in Table 62 present information on all household members engaged either full- or part-time in a cash-generating activity
21 Livestock may also be considered a cash-generating activity Animals such as sheep and goats are controlled primarily by women
43
TABLE 61 RESPONDENTS PRIMARY AND SECONDARY ACTIVITY
BY PERIMETER (Percent of Respondents)
PrimaryGALMI MOULLELA
SecondaryGALMI MOULLELA
Agriculture and 77 93 35 58 Livestock (irrig amp rainfed)
Other Cash- 24 6 55 33 Generating
No Secondary - - 11 7 Livelihood
101 99 101 98
Note Percentages do not add up to 100 due to rounding error Source Table 511
TABLE 62 NUMBER OF HOUSEHOLD MEMBERS ENGAGED IN
CASH-GENERATING ACTIVITIES (Number and Percent of Respondents)
Number of Galmi Moullela Household Members Number Percent Number Percent
0 1 2 3 4 5 7
5 6
11 4 6 2 1
14 17 31 12 17
6 3
5 8 6 5 4 1 -
17 28 21 17 14
3
35 100 29 100
Source Survey Data
Table 62 shows that most farm households sampled from both perimeters include at least one member who is engaged in a cashshygenerating activity outside of agriculture and animal husbandry Moullela respondents tend to have fewer cash-generating members per household For each perimeter the range for the number of
44
household members earning cash is wide The presence of one as opposed to six or seven cash-generating household members suggests significant variability in access to cash among households in each perimeter
Variability in the number of out-migrants per household ranges from one to three persons for farmers sampled from both perimeters (Table 510) This suggests another source of variability in access to cash among perimeter households
INCOME FROM LAND The amount of land cultivated by household members helps
determine total agricultural production which is a type of income As noted production may be used for consumption or it may be sold Rainfed land may also be sold or rented to generate income2 2 Perimeter plots cannot be legally rented or sold but farmers may lend all or a part of their plot during the dry season in exchange for redevance payment--which might be considered a form of rent
Cotton onions wheat and corn are the major cash crops grown in the study area Farmers on the Galmi and Moullela perimeters grow some rainfed cotton but cash crop production takes place primarily on the perimeters Millet and sorghum are used primarily for consumption The irrigated area worked by a farmer and his household is an indicator of the volume and value of cash crop production and therefore of income from cash crops23
Data on land distribution (Tables 52 through 55) show considerable variation in the distribution of irrigated land on both perimeters This suggests a wide gap in income from
22 Land may also be lent in exchange for part of the production future reciprocal loans or gifts
23 This assumes that differences in soil types etc are held constant
45
--------------------------------------------------------
---------------------------------------------------------
irrigated agriculture between farmers with the smallest parcels and those with the largest
Data on irrigated and rainfed agricultural production for nine cases from Moullela are shown in Table 63
TABLE 63 SELECTED DATA ON AGRICULTURAL VALUE OF PRODUCTION
FOR NINE MOULLELA FARMERS 1985-1986 AGRICULTURAL YEAR (CFA)
NET VALUE OF PRODUCTION (Cash Crops)House- Perimeter Rainfed Overall hold Total AC Total BC Total
Farmer Size (A) Percent (B) Percent (A+B=C)
1 11 52850 624 31900 376 84750 2 6 71380 725 27100 275 98480 3 3 82815 666 41450 333 124265 4 8 59890 448 73850 552 133740 5 8 124285 841 23550 159 147835 6 10 92550 492 95600 508 188150 7 7 113225 511 108500 489 221725 8 7 389085 787 105000 211 494085 9 14 436150 7055 182750 295 618900
Net Value of Production was calculated by subtracting reportedcash costs of production from total value of production for rainfed and perimeter productionTotal Value of Production figures were in turn calculated bymultiplying reported quantity of production by price at harvestfor each crop and adding the values for each farmer for rainfed and perimeter production Source Farmer Interviews
A gap of 383300 CFA (US $1095) between the lowest and highest net value of all perimeter production and a gap of 534150 CFA ($1526) between the lowest and highest net value of total agricultural production (on and off the perimeter) indicates considerable variability in the income available from agriculture both on and off the perimeters for Moullela farmers
Two general patterns are discernible from the data in Table 63 First in general as the net value of total agricultural
46
production increases the net value of total perimeter production rises as well Second a greater proportion of the net value of production tends to be derived from the perimeter than from rainfed production (there are two exceptions) However it must be emphasized that these data encompass an entire agricultural year and that the dry season production on the perimeter accounts for a significant part of the difference in the net value of production between rainfed and perimeter land
OTHER PRODUCTIVE RESOURCES Draft animals and beasts of burden are also productive
resources Possessing a pair of oxen or a donkey eliminates the need to rent the former for plowing or the latter for transport Other productive resources include tools (hoes shovels etc) and equipment (plows etc) Bicycles can also be considered a productive resource in that they shorten the time it takes to go to a distant field Data on the distribution of draft and transportation animals are shown in Table 64
The table shows that a much higher proportion of farmers own oxen in Moullela than in Galmi However oxen ownership must be used with caution as an indicator of a productive resource for two reasons First the situation in both perimeters has been changing Fifty-one farmers on the Galmi perimeter and twelvefrom Moullela (or six and ten percent of the total number of farmers on each perimeter respectively) were in different stages of receiving pairs of oxen through a credit project financed by the European Development Fund (FED) After the distribution process is completed the proportion of farmers owning oxen on each perimeter will increase However it appears that the relative difference between the perimeters will remain largely unchanged Furthermore while the distribution of the ownership of oxen within a perimeter will be somewhat less unequal differences will remain
47
TABLE 64 DRAFT AND TRANSPORTATION ANIMALS
PERIMETER PARCEL HOLDERS (Number and Percent of Respondents)
Galmi Moullela Number Percent Number Percent
Number of Oxen 0 31 89 12 421 0 0 1 32 4 11 15 52 4 0 0 1 3
Number of Donkeys0 26 74 24 24 1 5 14 4 14 2 4 12 1 3
Number of Horses 0 34 97 27 931 1 3 2 7
Number of Camels 0 35 100 28 97 2 0 0 1 3
Source Survey Data
Second at present oxen distribution at Galmi is a function of the fact that farmers have sold a large number of oxen which had been purchased through the Caisse National de Crddit Agricole(National Agricultural Credit Bank) in many cases before repaying the loans Informants said farmers used the money to buy younger draft animals (which would not have been coded as oxen in this study) to invest in other livestock or to buy food during the drought
Table 64 shows that the majority of farmers on both perimeters do not own horses or camels Ownership of donkeys is slightly more common A greater proportion of farmers at Galmi have donkeys than at Moullela This is probably explained by the opportunities to make money transporting water in large metal drums from the well located at ONAHA headquarters to the main part of town--a distance of three kilometers
48
Table 65 shows the distribution of bicycles among parcelshyholders in the survey sample Nearly a third of the Mcullela respondents have one bicycle in Galmi only 11 percent do None of the farmers in the sample reported owning more than one bicycle
TABLE 65BICYCLE OWNERSHIP PERIMETER PARCEL HOLDERS
(Number and Percent of Respondents)
GMoullela Number Percent Number Percent
Number of Bicycles0 1
31 4
89 11
20 9
69 31
Source Survey Data
The range of the distribution of oxen donkeys horses camels and bicycles is not very wide but this does not signify equal distribution of these resources The mere presence or absence of any one of these is significant since they represent large initial expenditures Recurrent maintenance costs are also associated with the animals In conclusion the data indicate considerable differences in potential resource mobilization among parcel holders within each perimeter Certain differences such as the proportion of oxen ownership appear to be significant between the two perimeters
MATERIAL INDICATORS OF WEALTH AND POTENTIAL RESOURCE MOBILIZATION
The material goods owned by a respondent and his household can serve as indicators of wealth and income and of potential resource mobilization Some of these goods can be considered indirect productive resources such as livestock while others such as radios or metal beds are consumer goods and not productive resources Frequency distributions of these items can be used to identify groups of farmers with different levels of
49
resources and with assumed corresponding differences in the resources they might invest in agricultural production
Data were collected on the number of various material goods possassed by respondents Certain items have been selected for discussion their distributions are presented in Table 66 and Table 67
These tables show that sheep and goats are unevenly distributed among parcel holding households on both perimeters Sheep and goats also represent important economic investments Females provide milk for consumption and sale males are also slaughtered for major religious feasts The distribution range is somewhat wider for Moullela respondents for both types of ruminants The distribution of tables radios metal beds and vehicles is also uneven for the two perimeters Similarly the range between the lowest and highest count of any given item is wider at Moullela than Galmi with the exception of vehicles which were not found among Moullela respondents
TABLE 66DISTRIBUTION OF SHEEP AND GOATS PERIMETER PARCEL HOLDERS (Number and Percent of Respondents)
Galmi Moullela Number Percent Number Percent
Number of Sheep0 21 60 7 24
1 - 2 7 20 7 243 - 4 5 14 7 245 - 6 1 3 3 109 - 12 1 3 3 10
21 - 22 0 0 2 7
Number of Goats 0
1 - 2 3 - 4 5 - 6 7 -9
10 -14 20+
13 5 8 4 4 0 1
37 14 23 11 11 0 3
6 6 3 5 0 6 3
21 21 10 17 0
20 10
Source Survey Data
50
TABLE 67 DISTRIBUTION OF CONSUMER GOODS
(Number and Percent of Respondents)
Galmi Moullela Number Percent Number Percent
Number of Radios 0 26 74 19 661 9 26 10 34
Number of Metal Beds 0 11 31 10 351 15 43 6 212 5 14 6 213 2 6 3 104 2 6 3 106 0 0 1 3
Number of Vehicles 0 34 97 0 03 1 3 0 0
Lumber of Tables 0 28 80 24 721 6 17 4 142 1 3 2 73+ 0 0 2 14
Source Survey Data
While it cannot be automatically assumed that all farmers spend the same proportion of income on material goods their distributions can be taken as indicators of differential levels of potential resource mobilization In other words a farmer who owns a radio several tables and six metal beds probably has more resources to invest in agriculture than one who does not have a radio or a table and has one metal bed This does not necessarily mean that he will invest in agriculture in proportion to his wealth
CONCLUSIONS
51
This chapter opened with the proposition that variability in the level of resources which can be mobilized and invested in agriculture may be an important influence on perimeter operation This variability was documented by examining the distribution of numbers of cash-generating members per respondents household non-agricultural primary and secondary activities irrigated land area value of agricultural production various productive resources and finally selected material goods
Based on the unequal distribution of these variables among parcel holders on each perimeter we can conclude that both Galmi and Moullela have richer and poorer farmers--cultivators who may not all be able to mobilize the same set of resources for production
Establishing this fact however does not explain the extent to which irrigation development has produced or perpetuated these inequalities nor does it explain what the precise impact of these differences is on perimeter management With respect to the first problem it is possible that at Moullela the longer period of perimeter operation has allowed some farmers (probably those with higher initial levels of labor cash and land) to accumulate more resources than others and to take better advantage of the benefits of perimeter production In Galmi however the uneven (but not as wide) distribution of resources does not reflect accumulation allowed by the perimeter because the perimeter is recent The distribution may reflect original differences in cash labor and land It may also reflect ongoing resource accumulation based on activities other than irrigated agriculture
The ways in which patterns of differential access to resources can affect perimeter operation deserve further research Tentative information about this based on informal interviews suggests the following Differential access to cash labor total land area and other resources a~lowu some farmers to complete perimeter tasks sooner and better than others and perhaps to benefit more from irrigation GMPs with
52
larger proportions of farmers who can do this may more effectively coordinate the timing of their activities We can hypothesize that the more homogeneous a group of farmers is with respect to resource distribution (whether at the GMP or perimeter level) the easier it will be to coordinate their agricultural activities
The issue of differentiation versus homogeneity of irrigation units may have important implications for autoshygestion Is self-management more likely to succeed where groups of irrigators have more or less equal access to cash and labor and the corresponding differences in status which accompany such variation Implications of this issue are discussed in Chapter
Eight
Chapter Seven POWER AND PERIMETER MANAGEMENT
The previous two chapters discussed wasa in which the availability of labor land and cash may affect activities on the irrigated perimeters under study But quantifiable resources such as these are not the only influences on perimeter operation and management This chapter presents discussions of selected qualitative influences that affect perimeter management and operation These influences have to do with power relationships of different kinds The first two sections center around the governments power to establish property rights and control over perimeter land The issue is explored through discussions of potential implications of farmers attitudes about property for perimeter management and of the role of village chiefs in land allocation The next three sections focus on power relations between farmers and ONAHA staff This issue is approached in discussions of control over agronomic practices decision making and information flows and ONAHAs role in perimeter management
In addition to affecting present perimeter activities these are issues which along with the resource-based factors presented earlier relate to the problem of auto-gestion or selfshymanagement--at present an important ONAHA policy objective Assuming that self-management is based on some degree of farmer participation in management decisions or at least widespread farmer approval of those actually making decisions then a perimeter where farmers are fairly involved in or pleased with the way activities are managed may have a better chance of attaining self-management This chapter aims to draw out contradictions between the goal of self-management on one hand and present power relations between farmers and local and national authorities and policy on the other
54
LAND TENURE AND PROPERTY RIGHTS
Irrigation development implies a heavy financial investment in infrastructure and a modification of the land surface which is to be put under irrigation It may also imply changes in existing patterns of land tenure and distribution and in definitions of property Both the manner in which these modifications are made in the course of building perimeters and the arrangements set in place to maintain these modifications will affect perimeter management and operation24 There may be contradictions between the government mandate for auto-gestion and some of the institutional changes and arrangements made in the course of irrigation development
The legal code in Niger (and many other countries) gives property rights to irrigation infrastructure over to the government in the case of government andor externally financed irrigation development In Niger rights to and control over irrigated land also rest with the state Thus the state can establish rules concerning property rights to irrigated land These rules presently include the prohibition of land rental and sale on the perimeters Such rules are geared towards preserving initial perimeter land allocation and preventing land concentration and less explicitly towards controlling land use and farm management
There is however a certain dissonance between state control of the land and a farmers sense of property A farmer who has a parcel in an area targeted for irrigation development will lose control over that parcel and in its stead receive a (usually smaller) perimeter plot But in addition to a change in the area he can cultivate the farmer experiences a change in the property rights he can excercise over his land (see Laucoin 197154-55)
24 See Coward (1985) for a discussion of property as a critical factor in water management and El-Kholy (1985) for a discussion on the same topic based on an Egyptian case
55
It may be argued that in the historical absence of private property in this region any analysis of land tenure and property is of minor importance But property cannot be equated with private property alone While land may not have been held as private property (transferable part of a land market etc) it is clear from interviews that farmers in Galmi and Moullela conceived of the parcels over which they had use rights before the perimeters were built as their own land--just as they now consider that they own their rainfed land (Laucoin 197154-55)
This conception changed dramatically with the creation of the perimeter When asked who the irrigated plots belong to most farmers on both perimeters answered the government Only a minority answered that they belonged to whomever they were allocated (see Table VI Appendix 2) Some farmers who gave the first answer explained that the parcel was on loan to them by the government Clearly farmers sense of property has undergone a transformation
A relationship between stable land tenure andor property rights in irrigation systems and productive investments and participation in system management and maintenance has been suggested This may be attributed to the relationship betweeen property rights (or stable tenure) and higher degrees of control over agricultural practices and decisionmaking The implications for self-management are clear Farmers rights to make decisions about how their land is cultivated and used are compromised by state regulations Farmers property rights are limited and we can expect that their interest in self-management may be correspondingly limited2 5
25 This is not to say that perimeter operation will necessarily be compromised but that self-management may be Themore congruent government policy and control over irrigated landis with farmers practices and resource constraints the lessthis will pose a problem for perimeter operation and managementBut farmers differential access to resources must be kept inmind when evaluating policy effectiveness
56
LAND ALLOCATION AND THE ROLE OF VILLAGE CHIEFS In principle land on both perimeters was allocated to all
farmers who had parcels on the area affected by perimeter development including the present command area the reservoir drainage ditches etc In order to accommodate all the farmers with rights to parcels formulas based on family size and area previously held were used to allocate parcels Therefore most farmers received smaller areas than they originally held Several complaints about this process emerged in the course of informal interviews with farmers in the Galmi area
Old property markers were destroyed by bulldozers before surveys were carried out to determine the pre-existing pattern of land distribution This led to difficulties in determining exactly who had how much land before hand Some farmers report that this allowed some individuals to claim they had land in the affected area and thereby gain access to perimeter plots when in fact they did not have such rights There are also farmers who claim to have had land on the affected area but who did not receive parcels It is clear that parcels were allocated on the basis of land tenure surveys conducted AFTER bulldozers had cleared the command area destroying previous plot boundaries It is impossible and perhaps pointless to do anything about this now however in the future land attribution surveys should be conducted BEFORE the bulldozing begins
A few informants noted that village chiefs were not consulted during that period This means that a potentially useful source of information on land holding patterns was bypassed Planners of future parcel attribution procedures might consider utilizing village chiefs and elders as a source of information particularly with respect to land holding data
The relationship between perimeter-related organizations and village chiefs as a local institution deserves further analysis Village chiefs from Moullela and the villages served by the Galmi perimeter are active in perimeter organizations but to varying degrees Some hold office in the management committees (Moullela
57
and Guidan Roro) others hold office on GMP committees Others however either do not hold offices in these organizations or do not have perimeter parcels
Opinions among farmers and chiefs vary with regard to the relationship they consider to be appropriate between chiefs and perimeter activities Some people think village chiefs should play an active role in land and water disputes a role chiefs do play for rainfed land disputes and some chiefs play in reference to the perimeter Others do not consider this a pressing issue
When more than one village is represented in a cooperative and management committee people from some villages may not feel adequately represented In Guidan Miko one of the villages served by the Galmi perimeter farmers suggested that villageshylevel representation in perimeter organizations should be stronger
CROP CHOICE AND AGRONOMIC PRACTICES Irrigation development implies changes in cultivation
practices as well as property relations Some farmers may need to learn new techniques (eg how to irrigate) in other instances they may have to learn to perform a task in a different manner Furthermore choices about cropping patterns are often constrained
Farmers at Moullela and Galmi while generally positive about the benefits of reduced crop failure risk obtained through the perimeters listed several complaints related to agronomic aspects of perimeter management Most farmers interviewed wanted to have more choice with respect to cropping patterns--both in terms of deciding what portion of their parcel to devote to crops planted and in terms of planting additional crops
For example in Galmi the prescribed cropping mix for the 1986 wet season was half cotton and half millet or sorghum Nevertheless at least a dozen farmers planted their plots entirely with millet These farmers were due to receive written warnings from the management committee and the perimeter
58
director (Three warnings are grounds for removal from the perimeter) In another example of farmers interest in increasing cropping choices several farmers interviewed said they would like to enlarge the area planted in beans Farmers also cited okra gourds additional sorghum and millet varieties peanuts and rama2 6 as crops they would like to plant on the perimeter
Reports that ONAHA staff have uprooted illegal crops is evidence of conflict over crop choices Eight out of 15 farmers interviewed from Moullela (53 percent) said they had had crops uprooted at some point in the perimeters seventeen-year history The corresponding figure for Galmi since 1982 was 19 percent (out of 32 farmers) Norman (personal communication) suggests that ONAHA staff uproot crops planted in earth canals or drainage ditches
Dry-planting is an agronomic practice over whose benefits farmers and agronomists appear to disagree Dry-planting can save labor if the rains arrive at the right time Many farmers say they would dry-plant on the perimeters if it were allowed some do anyway
ONAHA staff attach priority to finishing tasks on the perimeter Farmers on both perimeters reported that they began planting and weeding on rainfed plots before doing so on their perimeter parcels In other words farmers begin by dry-planting off the perimeter and then depending on the timing of the rains juggle their work between the perimeter and rainfed plots as best they can This reflects the fact that the timing of planting on rainfed plots is more critical Farmers on both perimeters were aware of the importance attached by ONAHA staff to the timely completion of perimeter tasks although they did not always understand the reasons for this and did not necessarily comply
26 Rama iF the Hausa term The plant can be used to make rope and the leaves may be eaten
59
DECISION MAKING AND THE FLOW OF INFORMATION ONAHA THECOOPERATIVE AND THE MANAGEMENT COMMITTEE
Farmers on both perimeters tend to view decisions about redevance calculations irrigation scheduling timing of planting and other activities on the perimeters as made by the perimeter director and other ONAHA staff and by the management committee However there are some differences between the two perimeters A greater proportion of sampled farmers from Moullela see their perimeter director as making most decisions The comitd de gestion is seen as making most decisions by a greater proportion of sampled farmers from Galmi than from Moullela (see Table VII Appendix 2) These differences may be due to what seems to be a very close working relationship between the Galmi perimeter director and the comitd de gestion It is possible that more Galmi farmers identify the committee and the director as forming a single decision making unit
The following pattern of information flow regarding decisions about what to do and when on the perimeters is reported by ONAHA staff After making a decision the director (or the director and his staff at Galmi) informs the management committee andor GMP heads depending on the type of decision In the case of decisions that need to be communicated to farmers such as when the next irrigation will take place the director tells the GMP heads to pass the information on to farmers and informs the management committee members about the decision If the decision requires further decisions or ratification by the management committee a meeting is held between the committee and ONAHA staff GMP heads either communicate information directly to the group of farmers for which they are responsible or tell a member of their GMP committee to pass on the information In Moullela the director said he told GMP and management committee members about his decisions
Thus information flow is top-down and only reaches farmers indirectly The information flow structure is not entirely effective with respect to communicating information about
60
irrigations Eighty-four percent of farmers sampled on each perimeter said they often did not hear about irrigations in a timely way This suggests that farmers or family members may not always be present during irrigation with consequent negative implications for both crop stress and water efficiency For example if farmers are not present during irrigation they cannot build or remove temporary field channel openings within their plots which means that crops may receive too much or too little water and water may be wasted Effective communication channels must be developed in order to improve water management and yields and to increase farmers participation in management particularly if auto-gestion continues to be a policy objective
ONAHAIS ROLE IN PERIMETER MANAGEMENT A current government policy objective is the eventual
transformation of ONAHA into a technical assistance agency with perimeters managed by their management committees In the interim however ONANA is charged with supervising perimeter activities In practice ONAHA staff are responsible for scheduling and delivering water and supervising the maintenance and repair of the facilities They are also responsible for ensuring that farmers plant specific portions of their parcels with particular crops finish tasks according to schedule follow agricultural practices as prescribed and do not break rules against the sale or rental of perimeter land In short in addition to their role in water delivery and system operation and maintenance ONAHA staff are put in a policing role
However ONAHAs authority to employ available sanctions is limited Major sanctions including removing farmers from a perimeter must be approved by political authorities While ONAHA staff can give written warnings they cannot remove a farmer after issuing three warnings without the consent of the political authorities (eg chef de canton and sous-prefet) This consent is not always forthcoming
61
The fact that ONAHA must follow political directives puts ONAHA staff in an ambiguous position27 In Galmi farmers who have never paid their redevance remain in the perimeter because it is too early farmers have to be given a chance and besides the authorities have not given their approval 28 The point is not that farmers should or should not be removed but rather that ONAHAs ambiguous role with respect to making policy and enforcing existing rules should be defined more clearly
A MODEL OF PERIMETER MANAGEMENT Based on the discussion in the preceding sections a model
of perimeter operation emerges for both Moullela and Galmi in which ONAHA staff try to follow and impose their agencys guidelines for agronomic practices crop rotations committee organization and irrigation management At the same time farmers and their families are busy trying to cultivate their various and sometimes distant plots while they also make a living from other sources Because there is no such thing as an average farmer (Horowitz et al 198323) it is difficult for all farmers to perform uniformly in accordance with agency directives This may have adverse effects on goals of economic and technical efficiency
The day-to-day practice of farming and managing water involves some struggle on all sides a diverse group of farmers ONAHA staff local authorities and extra-local political authorities Certain issues remain a source of debate while arrangements may be reached over others at least for a while In Moullela such arrangements have had a longer time to develop It is not an easy or negotiated give and take nor is it a bitter constant battle
27 An agronomist familiar with the region cites higherpolitical authorities with interfering with ONAHAs managementrole
28 Interview with ONAHA employee
62
Chapter Eight CONCLUSIONS AND RECOMMENDATIONS
Research findings suggest that farmers on the Moullela and Galmi perimeters differ in their potential ability to mobilize resources for agriculture whether irrigated or rainfed The explanation for this lies in their variable access to resources such as labor land cash and other income and livestock Farmers with certain sets of resources will be in a better position to take advantage of irrigation and to complete tasks on the perimeter within ONAHAs guidelines It is worth reflecting on the implications of this variability for perimeter management
If the hypothesis proposed in chapter six is correct that all else being equal a more homogeneous group of farmers leads to smoother and more efficient operation then it follows that policies that discourage differentiation among farmers and promote more even distribution of resources will enhance perimeter management More equal access to resources among farmers on a perimeter can be achieved in a number of ways
The first is through selection the exclusion of outliers (the very rich or poor) from the perimeter Selection may occur either at initial project stages by selecting farmers with a minimum level of resources or during the course of perimeter operation when resource-poor farmers who are unable to keep up redevance payments or other perimeter obligations lose their land This process has occurred to some extent at Moullela When a relatively resource-rich farmer such as a town merchant gains control of irrigated land the selection process increases heterogeneity rather than promoting more equal resource distribution among farmers so that the operation of the perimeter may be negatively affected A number of Galmi area farmers say that this took place on the Galmi perimeter
A second method for achieving a degree of homogeneity on the perimeter is to institute controls which prevent or slow the widening of the gap between rich and poor farmers Government
63
policies banning the sale or rental of perimeter lands are intended to prevent concentration This clearly has some impact in slowing down differentiation in access to irrigated land However the policy does not address the problems of differentiation in access to other resources especially labor and cash Banning land sales does not necessarily affect the forces which lead farmers to sell land so that they may find other means to achieve the same end and the control of large areas of land by a few individuals may become covert Control over the sale of irrigated land does not affect distribution of or differentiation in access to rainfed land which this study has shown to be a major part of the household agricultural system Moreover it does not affect the differential ability of farmers to mobilize resources for cash crop production--an important source of income and therefore of differentiation on the perimeter
Another method for maintaining or promoting homogeneity would be through ongoing redistribution or subsidization of key resouces for resource-poor farmers One alternative would be to make low-cost credit available to poorer farmers29 Money can in turn allow farmers to hire labor or draft animals at key times in the agricultural cycle A second alternative is the provision of employment opportunities during slack periods in the agricultural cycle so that farmers can obtain money which can be invested in agriculture
It would be useful to know how households cultivating unequal areas of land and operating under differing labor and capital constraints mobilize and allocate labor for various kinds of agricultural activities A typology of farmers with shared cash labor and land constraint levels could be used to
29 Poorer farmers can also gain access to scarce cash through moneylenders or their equivalent Information on moneylending was not obtained in this research This form ofgaining access to money is almost always very expensive for the borrower and is more likely to promote differentiation than to ameliorate it
64
analyze the ways in which farmers in different strata accumulate (or fail to accumulate) resources Such research could also determine how different constriints on the availability of labor cash and land affect agricultural production and levels of wellshybeing
The issue of finding a compromise between overall management goals which involve uniformity of operations as a means of achieving technical and economic efficiency and maximizing individual choice is central to perimeter management The former promotes the smooth running of a perimeter the latter allows farmers to best utilize their particular mix of resources The question is how can an irrigation system be effectively managed to increase production while minimizing the top-down control that this technology so often entails
This question suggests a need for continuing research efforts It would be useful to test several models of irrigation scheduling cropping patterns and organizational arrangements These models should be designed to increase the choice of crops available to farmers One approach would be to reserve a portion of a perimeter or of GMP for garden crops which could be planted following the harvest of early millet varieties The effect of intercropping on yields and on labor allocation to different tasks (especially weeding) should be tested to see whether and under what conditions intercropping would save enough labor to make this practice worthwhile even if yields decline somewhat
Changing the size and composition of irrigation units is another possible strategy for applied research For example the viability of GMPs composed of smaller groups of farmers with more uniform access to productive resources could be examined Reducing GMP size may require design changes such as shortening secondary andor tertiary canals Another design change would be to modify canals and control structures in order to increase water capacity so that GMPs at the end of a system could irrigate more quickly This would enhance scheduling flexibility by permitting selected areas to irrigate separately
65
The role and performance of local institutions (eg village chiefs) should also be examined Stronger villageshylevel representation is an issue that deserves further discussion especially with respect to larger perimeters where numerous villages have to coordinate their decisions and activities
A related issue is that of ONAHAs role in perimeter management and the agencys relationship with the management committee If self-management continues to be an objective it will be important to clarify the relationship between farmers the management committee ONLHA staff and local and extra-local political authorities in order to reduce ambiguity over decisionmaking and enforcement powers
In conclusion the fact that farmers with parcels on a given perimeter do not have uniform access to resources needs to be recognized and taken into account in water management and irrigation system design Because of this variability it would be useful to relax assumptions about uniform performance among perimeter farmers An alternative to reducing variability among farmers through compensatory programs (eg credit) would be to manage perimeters in a way that assumes variability rather than uniformity This would imply at a minimum more flexible scheduling selective irrigation wider choices in cropping patterns and cultivation practices and changes in the size and perhaps composition of GMPs or their equivalent
66
APPENDIX I
RESEARCH METHODOLOGY
METHODOLOGY
The data on which this report is based were collected over a thirteen week period ending August 10 1986 Part of this period was devoted to coding and data analysis
The methodoloqy adopted for this research included the following data collection strategies proxy participant observation open-ended individual and group interviews and formal surveys Three field assistants worked in different quartiers of Galmi two in Moullela and one in Guidan Miko a village located between Galmi and Moullela Assistants lived temporarily in the villages in order to gather qualitative data by means of participant-observation Each assistant kept a journal covering topics such as cooperative meetings perimeter activities informal interviews on perimeter management etc
Open-ended group and individual interviews conducted in French or through an interpreter provided a second source of data These interviews were conducted with ONAHA personnel individuals occupying positions of responsibility at the cooperative perimeter and village levels and with perimeter parcel holders
Four survey instruments were developed and administered to varying samples in the course of the research3 0 The first questionnaire (schedules 1 through 5) was designed to collect quantitative data on household composition and labor availabilshyity migration access to land land use possession of household items tools farming equipment and animals and participation in rainfed agriculture end non-agricultural activities
A second questionnaire (schedule 6) was used to gather information from people occupying positions of responsibility in
30 Copies of the questionnaires are available from the Cornell Irrigation Studies Group Cornell University Ithaca New York 14853
67
local cooperatives village institutions and GMPs This instrument includes questions on the number of positions held by the respondent his duties means of attaining posts and perceived advantages and disadvantages associated with the jobs It was administered to a non-random sample of 39 respondents selected by the field assistants and therefore is not treated in the discussion on sampling presented below
The third set of questions was based on three questionnaires drafted by Eric Arnould in January 1986 The questions cover land tenure perimeter management and cooperative organization This instrument was administered to the same sample drawn for the first questionnaire but a subsample was selected for analysis due to time limitations (Table A-3 below shows the sample sizes associated with the different instruments)
A fourth and final set of questions was designed to gather more detailed information about yields production costs land use crop choices changes in womens access to land and selected agronomic practices Due to the length of the questionnaire and to pressing time limitations this instrument was only administered to a subsample of irrigators
SAMPLING The questionnaires were administered to different subshy
samples of an initial sample however due to time constraints their results were only partially coded and analyzed The first questionnaire was administered to an initial stratified random sample consisting of a stratum of irrigators from the Galmi and Moullela perimeters and a stratum of non-irrigators from the villages associated with the perimeters The sample was also stratified on the basis of village residence in order to ensure an adequate representation of the villages associated with the two perimeters
The sample of irrigated parcel holders was randomly drawn from a sampling frame consisting of a list of parcel holders available for each perimeter The sample of individuals without
68
an irrigated perimeter parcel was randomly drawn from lists constructed at the village level by asking village chiefs and other key informants for the names of people without any perimeter parcels3 1 For each village the list of nonshyirrigators was made very long (relative to the actual sample size to be drawn) in an attempt to reduce the bias intruduced by the sampling technique The sampling frame was obtained in this manner due to difficulties in obtaining disaggregated census data
Sample sizes were determined on the basis of projected data collection capacity and an effort to include approximately 20 percent of the irrigators at Moullela and 10 percent at Galmi and a roughly corresponding number of non-irrigators Sampling was not based on calculations of the probability of representativeness of key variables for the population for two reasons A probabilistic sample would have required accurate census data and reasonable estimates of the variance of the phenomena under study for the population Difficulties were encountered in locating recent dissagregated census data for all of the villages and estimates of variance for the variables studied were not available
Table A-1 displays the sample sizes as percent of the number of irrigators associated with each perimeter and as percent of the population of adult males in villages served by the perimeters The latter is based on aggregated census data for 1983 for those villages for which data were available
31 Village chiefs are responsible for collecting taxes and therefore have a reasonably accurate idea of who lives in thevillage and what they do for a living
69
-- ---------------------------------------------------
---------------------------------------------------
TABLE A-i
SAMPLE SIZES AS PERCENT OF IRRIGATORS AND PERCENT OF ADULT MALES RESIDING IN THE AREA
TOTAL SAMPLE of IRRIGA- TOTAL SAMPLE NUMBER of TORS as of as of
PERIMETER IRRIGATORS TOTAL IRRIGATORS MALE POP --------I----------------------------------------------
MOULLELA 124 23 25-35 GALMI 854 8 10
Note The higher figure for total sample as percent of male population for Moullela is based on the male population of Moullela alone The lower range was calculated by adding a quarter of the male population of Guidan Miko to that of Moullela This was done to preserve the proportionality of village membership
70
-------------------------------
---------- ---------------------------------------------------
----------------------------------------------------------------
------------------------------------------------------------
------------------------------------------------------------
---------------------------------------------------------------- ------------- ------------------------------------------
The breakdown of the original sample by village and by irrigatornon-irrigator category is presented in Table A-2 As noted not all of the data gathered from the first questionnaire were analyzed nor were subsequent questionnares administered and analyzed on the basis of the original sample The scope of work was reduced in an attempt to collect AND analyze data within the project time frame
TABLE A-2
ORIGINAL SAMPLE BY PERIMETER AND VILLAGE
PERIMETER MEMBERSHIP
PERIMETER VILLAGE IN OUT TOTAL
MOULLELA Moullela 24 23 47 Guidan Miko 4 0 4 Guidan Sofo 1 0 0
SUB TOTAL 29 23 52
GALMI Moullela 2 0 2 Guidan Miko Toungaand Taganaoua 11 13 24 Galmi Birni 21 15 36 Guidan Doutchi 15 12 27 Guidan Kare 8 9 17 Guidan Roro and Zongo Annissar 14 13 27
SUB TOTAL 69 62 131
OVERALL TOTAL 98 85 183 m ------------------- m-----------------------------shy
71
-----------------------------------------------------------
---- ----------------- --------------------- - ------------
Table A-3 presents the sample sizes for data collected and analyzed with questionnaires 1 3 and 4 (As mentioned earlier the second questionnaire was administered to a separate judgment sample and therefore is not included in this table)
TABLE A-3
SAMPLE SIZES FOR DATA COLLECTED AND ANALYZED FOR QUESTIONNAIRES 1 3 AND 4
BY PERIMETER AND PERIMETER PARCEL HOLDING STATUS (Number of Cases)
QUESTIONNAIRE No 1 No 3 No 4
Collected PERIMETER AND STATUS
Analyzed Coll Analyzed Coll Analyzed
MOULLELA on perimeter off perim
29 23
29 23
29 23
19 0
19 0
15 0
GALMI on perimeter off perim
69 62
35 33
35 33
32 0
32 0
32 0
SUBTOTAL on perimeters off perims
52 131
64 56
64 56
51 0
51 0
47 0
TOTAL 183 120 120 51 51 47
The criterion used to reduce the sample size at each iteration was to maintain the proportion of respondents earning their livelihoods primarily through farming through commerce or a mixture of both fairly close to the proportions found in response to the first questionnaire Responses to questions associated with this criterion were examined for the entire sample before reducing the sample for the first round of analysis Non-perimeter parcel holders were left out of the analysis of the third questionnaire and out of the data collection for the fourth questionnaire because of time
72
constraints and because as a group they were felt to be less central to issues of land tenure cooperative organization and perimeter management The full data set is available and can be analyzed in the future
73
Appendix 2
DATA COLLECTED
Notes to Tables in Appendix 2
IN = Farmers with perimeter parcels OUT = Farmers without perimeter parcels
HE = Household
R = Respondent
74
0
E-4 rn
PMI4 O
4
0
or-a
o
0 0
0 0
0 C
O
0
HI-
0 0w
Irn
_
00
E-
IM
Nrl
w
C
N4
n
z ID
H
75
4 tA
q
o r-n
~OO
IDO
do 400Q
rOD
C4N
M-4t
0
E-4~shy
0
z n
it A
C
ot8o0
mC
4
q
C
tn C
i
1
-4 f-
f-
c
n 00
ooo
raC
Dk
tA 4
r
~c4
tnrf41
C4
1O
nH
-i
Cq
C
-D
a
64
0 o
M ejr~
f3
0 N
0 N
I
f l
D
q0
cq LzeID 4 n
co r r
0 E-
0
b
CP
C
ii
-I tfl f
D
(
C
n
v
0C
NN
C4
t
0
-4H
n
C
a
a
t c~4 c
iiC
M +
VIP
rshy
76
00 0
E-404
S
55S
9
1
C4
C
AC
4O
0
0
r-q
PL
4
C
4
I-0
ca
r-m
LA
C
~ -4O
ac
r-o
E
~0 P
r(
g
tgU
~~e4 IC
4I
-
m f
4O
4b
04 4 ~
0 -
4f- N m
Io
77
Ii1
dP
A
0
1-00
3w
4b4shy
0
0
V~~ 0 r0 q
400
O-4
N m
qt0f
nr-0
4Nn
78
0
N
Lntn
t ni
A
g-
4u
4r-o
N40
dguero44
E-4O
~
4-r-O
0 01
0 -4
-4 0
0
-4 1
I-Ie-40 q
H
H4m
e
4M
r C
i)
ii4 3P
0cpound
C
0 54
4 00
v 470
N
-O
tn
in in in
o r-Jiflifl
00
E-
q -4
u-4
fl4 q
H
do Itr
iC
iCi 0 q
0
licq
9
I~qoo a
a m
(n v
04oo z
o0 ~
o 0C
oo140
s4dP ~O
~o 44
~~
o
q
EEshy0
43 E
-4 d
0 0C
0
0
z~
80
(n C4
OD
a
Sn
5
t tA
0 ta
E44 4
b _0
L
H
E-
0
tcR~c 4
A
4q
4 V
C
)
~o
e00v0
an
0 P
f-4
n0-4C
n4
N (q
0V
C110-
4
I8
t-v(I qrN
r -
00
w-o
MM
Mo
dP O
iC
Edee
Xaa
4
Sn
c4
o
rntnL
0
04
mP
oq
a
M
OC
Tin
r
L
4
coPlc4~
dV~
i
N~~0
fn0~i w
0
nItc
E-
0r~j
of
0ciov0
j
Ooshy
-4
82
0
~~
-4-~-O
04
0
-IDc
o tn
0 0 000
z d
N
Ce4
CI
4 I
0
E-m
4C
4C
dOM
Eshy0
tq8L
16 o
t-OD
CD
r-V
o ei1
In
~ a
shy
0
udpaj
in
E400
dp
N
F
okooo~
I
0 1 1
c4 tLn
oo0
00 ro tor-
40
0 E
--b
R0
z O0 -4
( ~
c Ln Ici
-1
P
0 Pu4 C
ru
1
4
0r
84
qr-1
q w
w w
r-N
O
rm
m
q
09d
E
~~ v4rr ~
~ ~~
4-q004A0N
N044
ON
-4 0O
O
M M
tt-4
0 -
40
-4 0 40r0
~0
-4D
0 Il
r~-aOOr4-
Cq
z
dPL
4 ad N
0 0
00 V
Or 0
4a L
00000 0Y
V4
4
E-4
0I4
0A
0C
40
E-N
fl
f-q
4
4
C4
r4m
dP I0 ri
0qc
0 w~40 D
-Iqj r 00
0q
t0
e4I 0
P404
0
0
0 -4
N
m
0 r-4
85
dore~ r-rtn-d
c4 A
oo -4
0 OP 00CO
40-4
0
0 0 0lC
E-4
a a (
(4
~
e0-4
In O
~
LC
qU
)A
o
o
o 4H
0 o
l
0 ~
l V
0VC
)Hr4
-A0
H1
ob 8
c
N
0 00
0H
0
q Ci4 cq
0
qa~qmmmm
rvrodP
otnq44
1 0ro
en4004r4c 0~~~I eq
aI i
It0 dP
-
0n~wo86
I e V
i a S1ERFD MED
Ce KUMJREN IiRIrtUH BkRi(S) Ell IPfrUfl
(site of repxx~mts by ruitw of Srcwis)
Medid of ~ Ei4EGD HLXIIA Total (DW52)(W32) (WJ19) a3aisitim Of _ _ __ _ _ _ _ _-r~s _ __
liuta cf N ampZbwtr ofa Lzer of N
Inherited 0 4 13 2 I 6 12
the bither 1 27 as 13 63 40 78
2 1 3 4 21 5 10
Irite xvxfi 0 32 1M 19 95 51 96
RrzchdbI 0 30 94 19 100 49 96
1 2 6 - - 2 4
Givenit 0 31 97 is 95 4 96
1 1 31 1 53 2 49
padld0 3) 94 19 11) 49 96 by reqnmt
1 2 63 - - 2 4
Fated ty 0 32 IM0 19 10)0 51 ID
Ampired 0 32 100 14 74 46 90 after another
s 1 shy - 5 26 5 10
Nte Etra s lary not mrd tp t 100 die to mxding
3axm SxYW cda
87
TABLE VI-I
OMMENCE OF DISPL1ES
(Has respondent ever had a land or water dispute)
Galmi (N = 32) Moullela (N = 19) Both (N -=
Number Number Number Yes 825-- 10 -T3- Id-- 3
No 24 75 9 47 33 65
Source Survey data
TABLE VI-2
TYPE OF PAEM INVOLVED IN DISPLE
Galmi (N = 8) oullella (N I0) Both (N = 18)
Number Number Number
Perimeshyter 1 12 9 90 10 56
Rainfed 7 88 1 10 8 44
Source Survey data
TABLE VI-3
TYPE Oi CONLICT
Galmi (N = 8 0ullela (N = 1) Both (04 is1)
Number Number iumber
Irrigationout of turn 1 12 4 40 5 28
Boundarydispite 7 88 6 60 13 72
Source Survey data
88
TABLE VI-4
CONFLICT RESOLUTION LEVEL FOR ALL CONFLICTS
GALMI (N =8) MULLELIA (N=10) BOTH (N=18)
Number Number Number
With the Farmers Involved 3 38 5 50 8 44
Farmers and GMP Head 0 0 1 10 1 6
With Local Authorities (Village Chief Conseil- 2 25 1 10 3 17 ler Villageois)
With Perimeter Director 0 0 3 30 3 17
Higher Political 1 12 0 0 1 6 Authorities
Not Resolved 2 25 0 0 2 11
Source Survey Data NE Percentages may not add to 100 due to rounding error
89
VARIABLES AND CArEGORIES
ho do perim plots belong to
NA1 - Govnt 2 - Farmers farming 3 -(HA 4 -Other
Total
Who advises the Comit4 de Gestion
NA6 1 - Perim director 2 - Farmers 3 - Local authorities 4 - Higher local auth 5 - Agents amp director 6 - ONAIA Tahoua 9 - Donnt know
Total
Who calcul redev
NA1 -Perim director 2 - Agents amp director 3 - CG 4 - Dir Com Agents 5 - GMP heads amp dir 6 - GMP heads 7 --Farmers 8 - Taboua offioe
9 - Dont know
Total
TABLE VII -
PERIWrFR MANMA4E1r AND OMnIZATIO (PARCEL HOLDERS)
GALM (0=32) MOULLE[A (N=19) BOTH (N=51)-
5 156 3 158 8 15722 693 14 737 365 156 2 105 7
706 137
0 0 0 0 0 0 0 0 0 0 0 0
32 100 19 100 51 100
2 63 1 53 3 5914 438 14 737 28 5490 0 0 0 0 0 5 156 0 0 5 980 0 0 0 0 0 7 219 1 53 8 1572 63 3 158 5 98 2 63 0 0 2 39
32 100 19 100 51 100
1 31 0 0 1 205 156 II 579 16 3143 94 1 53 4 78
10 313 1 53 11 2167 219 1 53 8 157 0 0 0 0 0 00 0 0 0 0 00 0 0 0 0 0 2 63 4 211 6 118 4 125 1 53 5 98
32 100 19 I00 51 I00
90
TABLE VII -2
PERIMETER MANAGaEE AND ORGANIZATION
(PAICEL iicL~ae)
VARIABLES AND
CATEW~RIES GALt4I (14=32) L4JLLEIA (N=19) 8301H (N=51)
Who decides when to plant
1 31 0 0 1 201 2 63 17 895 19 373 2 2 63 1 53 3 59 3 16 500 0 0 16 314 4 7 219 1 53 8 157 5 0 0 0 0 0 0 6 0 0 0 0 0 0 7 0 0 0 0 0 08 2 63 0 0 2 399 2 63 0 0 2 39
Total 32 100 19 100 51 100
Who decides when to irrigate
NA 1 31 0 0 1 20 1 8 250 17 895 25 490 2 2 63 0 0 2 39 3 14 438 2 105 16 314 4 6 189 0 0 6 118 5 0 0 0 0 0 06 0 0 0 0 0 0 7 0 0 0 0 0 0 8 0 0 0 0 0 0 9 1 31 0 0 1 20
Total 32 100 19 100 51 100
91
TABLE VII -3
PmqErR mmat wr AaD omizAaio
VARIABLES AND CATE)GORIES
Who decides who gets ox
NA 1 2 3 4 5 6 7 8 9
Total
Does R attend ccnite coop meetings
NA-no perim parcels 1 - yes 2 - no 3 -sometimes
Total
Relation to GMP head
NA 1 = same family 2 - same quartier 3 = not related
Total
GALs4
1 0 0
22 1 0 0 0 0 8
32
2 13 14 3
32
1 15 11 5
32
(PARCEL OLD RS)
(N=32) 14OULLELA (N=19) ksra (L4=51)
31 0 0 1 20 0 2 105 2 39 0 0 0 0 0 693 12 632 34 667 31 1 53 2 39 0 0 0 0 0 0 2 105 2 39 0 2 105 2 39 0 0 0 0 0 250 0 0 8 157
100 19 100 51 100
63 0 0 2 39 406 18 947 31 608 438 1 53 15 294 94 0 0 3 59
100 19 100 51 100
31 3 158 4 78 469 10 526 25 490 344 2 105 13 255 156 4 211 9 176
100 19 100 51 10)
92
TABLE VII - 4
pEIMffER 1 3 -1Er AND ORGANIZATION
(PARCEL dOLDEiRS)
VARAB[Eamp AND GAL141 (N~=32) 140LULA (Ni=19) WWft (N=F51)
CATEGO0RIES
Has R received warning from GKP head
7u43 1581 31 5 983 1582 63 8241 yes 13 684 42
= 29 906 2 no
51 10019 10032 100Total
Who tells to clean the canals
3 590 03 94 9 176NA 7 3682 63 - Perim director 32 6271 9 47423 719
2 - GMP head 0 0 1 20 1 31
3 - Other farmers 0 2 39 2 63
No one just does 0
4 784 - 3 1581 31 5-Other
51 10019 10032 100Total
How does R pay redevanCe 2 391 531 31
NA 18 947 31 608 13 406Cash crop sales1 - 6 1180 06 189
Cash amp food crops 2 392 - 0 02 633 - Commerce amp crops 0 0 3 59
3 944 - Commerce rev 0 0 2 39
2 635 - Migration income 0 0 1 20
1 31 6 - Animal sales 2 63 0 0 2 39 7-Sala-y 1 200 01 318 - Skill-inc crops 0 0 1 20
1 319-From relative
51 10019 10032 100Total
93
TALE VII - 5
PER1~rER pound4AGEMENr AND ORANIZATION
(PAXM OLD~ERS)
VARIABLES AND CATCBORIES GAL4I (N=32) MOULLEEA (N=19)
What day does R irrig
NA 2 63 2 105 1 2 3
14 11
2
438 344 63
2 6 4
105 326 216
4 6 7+ 8 OK others do it
1 0 0 1
31 0 0 31
3 0 0 0
158 0 0 0
9 doesnt know 0 0 0 0
Total 100 19 100 51
Who notifies R of irrigNA 2 63 2 105
1 - perim director 2 63 6 326 2 - GMP head Cooppres 21 656 7 368 3 - other farmers 2 63 0 0 4 - no oneknows sched 4 125 4 211 5 - tam-tam 1 31 0 0
Total 32 100 19 1000
Does R hear about irr in time
NA 2 63 2 105 1 = yes 3 94 1 53 2 = no 27 844 16 842
Total 32 100 19 100
Lack of water NA 2 6 2 105
1 - not enough 4 12 3 1582 - enough 20 63 11 579 3 - sometimes insuff 5 16 3 1588 - OK other irrig 1 3 0 09 - doesnt know 0 0 0 0
Total 32 100 19 100
94
aHnI (N=51)
4 78 16 314 17 333 6 11d 4 78 0 0 0 0 1 20 0 0
100
4 78 8 157
28 549 2 157 8 157 1 20
51 00
4 78 4 78
43 843
51 100
4 78 7 137
31 608 8 157 1 20 0 0
51 100
BIBLIOGRAPHY
Arnould Eric 1986 Maggia Valley Systems Report of the Consulting
Anthropologist WMS-II Project Cornell Universityand USAID Niger
Briend Roger1986 Rapport Annuel Campagne Hivernal 1985 Campagne Saison
S~che 198586 Niger ONAHA
Chayanov AV 1966 Theory of Peasant Economy ed D Thorner B Kerblay
and R Smith Homewood Illinois Richard D Irwin Inc
Coward E Walter 1985 Property in Action The Property Factor in Irrigation
Development Khon Kaen University Thailand Paperpresented at Conference at Khon Kaen University
El-Kholy Heba Aziz 1985 Property Relations and Irrigation Organizations A Case
Study of Water Lifting Devices in an Egyptian Village inthe Delta MS thesis Ithaca New York Cornell University
GERSAR 1981 Amdnagement Hydroagricole de la Plaine de Galmi
Projet Etudes Preliminaires Niger ONAHA
Horowitz M 1983 Niger A Social and Institutional Profile New York
Institute for Development Anthropology
Laucoin Guy1971 Vers lautogestion des am~nagem3nts au Niger
Developpement ot Civilisations no 4454-62
1973 La gestion des amdnagements hydro-agricoles au NigerDeveloppement et Civilisations no 5121-31
Norman W Ray1986 Gestion de 1eau dans lamdnagement hydro-agricole de
Moullela Une presentation des donn6es de la campagne de 1985 Paper prepared for the Office National dAmdnagements Hydro-Agricoles Rdpublique du NigerSpecial Study USAIDWMS-II Project
1987 Developed and Traditional Small-Scale Irrigation inNiger West Africa PhD dissertation draft IthacaNew York Cornell University
95
Rdpublique du Niger1985 Evaluation du temps de travail des paysans sur
quelques amdnagements hydro-agricoles du Niger Niger Ministere du Plan
SOGETHA 1968 Etude Agro-Economique ds Petits Pdrim~tres en
Exploitation dans la Vallde de la Maggia Mission 1967 Grenoble France SOGETHA
1970 Etude Agro-Economique des Petits Pdrim~tres en Exploitation dans la Vallde de la Maggia Mission 1969--Rapport Final Grenoble France SOGETHA
United States Agency for International Development1984 Niger Irrigation Subsector Assessment Volumes One and
Two Niger USAID
1986 Applied Irrigation Research and Coordination (AIRC)Project Identification Paper USAIDNiger
Wells John Craig1985 Sedimentation of Small Irrigation Reservoirs in the
Ader Doutchi Maggia WMS-II Project Trip ReportIthaca New York Cornell University
96

EXECUTIVE SUMMARY
Irrigation development is expected to continue to play asignificant role in Nigers agricultural development policyThis paper reports the results of socioeconomic research conducted on two dam-fed irrigated perimeters and examines social and economic influences that may affect operation
The two perimeters studied are supervised by ONAHA the parastatal agency charged with developing managing andmaintaining irrigation infrastructure and with providing trainingand extension services to farmers A long-term policy objectiveis for irrigation perimeters to become self-managed by their management committees with ONAHA acting as a technical assistance agency
Review of the agricultural tasks performed during the wetand dry seasons on and off the perimeters indicates that added labor is required in irrigated agriculture (both because some tasks take longer under irrigated conditions and more tasks areperformed) Planting and weeding are performed during periods ofpeak labor demand farmers may find it difficult to completetasks on both rainfed and irrigated plots in a timely fashion
Irrigation schemes in Niger (as in many countries) are managed with the idea that farmers will complete tasks accordingto a uniform schedule so that crops may receive maximum benefit from irrigation An implicit assumption that farmers on a givenperimeter are equally able to mobilize resources for agricultureunderlies this model Research findings suggest that not allfarmers can mobilize the same levels of resources because resources are not equally distributed This variability mayaccount for appparent performance differences and affect perimeter operation
Social and economc factors affecting perimeter operationwere analyzed These include labor availability access to cashland and other productive resources and power as it relates toland tenure and property control over agronomic practicesdecision making and ONAHAs role in perimeter management
The availability of household labor plays an important rolein agricultural production households with less available labor must limit the area they cultivate hire labor or mobilize labor through other means The majority of households on bothperimeters include two to three potentially active working males Irrigated area and rainfed plots are not evenly distributed amongperimeter farmers The data suggest that the distribution of total area cultivated per household is unequal on each perimetertherefore the labor required to cultivate total holdings will vary from household to household No positive linear
i
relationship between available male labor and irrigater land area or number of rainfed plots per household was found Thusfarmers on a given perimeter will have different priorities for allocating labor based on differential access to land and labor
Irrigated agriculture is only one element in the household production strategy During the wet season more labor is allocated to rainfed plots than to irrigated plots Labor perunit area allocated to perimeter cultivation appears relativelyconstant while that allocated to rainfed agriculture may varyconsiderably from household to household Farmers on both perimeters also engage in off-farm activities many of which generatI cash more directly than agriculture
IThe availability of cash and its timing also affect a households production strategy Most households studied include at least onn member engaged in a cash-generating activity outside of agriculture and animal husbandry Within each perimeterhowever the number of cash-generating members varies widelyLand is another source of cash income The unequal distribution of irrigated land area and rainfed plots suggests a wide gap in income from land within each perimeter The emerging picture of two perimeters with both resource-rich and -poor farmers is corroborated by evidence of unequal distribution of livestock and consumer goods Differential access to cash labor land and other resources may allow some farmers to complete perimetertasks sooner and better than other farmers The hypothesis that a more homogenous group of farmers may lead to smoother and more efficient operation is put forth and various implications are discussed The issue of heterogeneity versus homogeneity of irrigation units may have important implications for irrigation management and the policy objective of local self-management
Irrigation development implies changes in property relations and changes in cultivation practices Laws prohibiting land rental or sale on the perimeters are aimed to prevent land concentration and less explicitly towards controlling land use and farm management However farmers rights to make decisions about how their land is cultivated may be compromised by state regulations Most farmers interviewed wanted to have more choices about cropping patterns and farm practices
Farmers on both perimeters tend to consider decisions about redevance calculations irrigation scheduling timing of planting and other activities on the perimeters as made by the perimeter director and other ONAHA staff and by the managementcommittee A description of the pattern of information flow on the perimeters shows that information flows 2rom top to bottomand only reaches farmers indirectly This structure is not entirely effective in communicating information to farmers about irrigations Better communication channels would improve water management and yields and increase farmer participation in
ii
management thereby helping to meet the policy objective of autoshygestion or self-management
ONAHA has a somewhat ambiguous role with respect toirrigation management and rule enforcement Although it issupposed to become a technical assistance agency ONAHA now manages the perimeters However the agencys staff have limited authority to pnish farmers who break rules like selling land orfailing to pay -he redevance Regional administrativo authorities must consent to sanctions their consent is not always forthcoming
ONAHA staff try to follow and impose agency guidelines atMoullela and Galmi while farmers and their families cultivate various often distant plots and also make a living from other sources Because production strategies vary farmers do not behave uniformly in accordance with agency directives Day-toshyday farming and water management involves the sometimes conflicting agendas of a diverse group of farmers ONAHA stafflocal authorities and extra-local administrative authorities Some issues remain a source of debate while others are resolved at least temporarily In Moullela such arrangements have had alonger time to develop it is not an easy or negotiated give and take nor is it a bitter constant battle
The fact that farmers with parcels in a given perimeter do not have uniform access to resources needs to be recognized and taken into account in water management and irrigation systemdesign Changes that might be instituted include flexible waterschedules wider choice in cropping patterns changes in the size and perhaps composition of GMPs or their equivalent anddesigning control structures and canals that take larger water flows so that selected areas of a perimeter can irrigate fairlyquickly even if they are far from the head of the system The situation of resource-poor farmers might be improved throughcredit programs In conclusion it would be useful to relax assumptions about uniform performance among perimeter farmers
iii
ACKNOWLEDGEMENTS
I am grateful to E Walter Coward Jr Mike Walter Tammo Steenhuis Barbara Lynch and Ray Norman for supporting theinclusion of sociological research under the Water ManagementSynthesis II Project activities in Niger
The field research which formed the basis for this reportbenefited from the assistance and commants of a number of individuals in ONAHA and the USAIDNiger Mission I would like to extend my thanks to M Amadou Soumeila M Talabe ChaibouM Souley Moutari M Wolff M Omar NaAwa and M Hima Guero inONAHA Mr Roger Briend technical consultant to ONAHA with the CFDT shared his perspectives on irrigation with me I would also like to express my appreciation to Dayton Maxwell MichaelGould Lynne Graybeal Eric Arnould Cynthia Moore and KathyPanther presently or formerly with USAIDNiger
A number of people were very helpful to me during theresearch through their hospitality and logistical assistance or by sharing their knowledge and increasing my familiarity with Nigerien cultures I would particularly like to thank Ray and Hdi~ne Norman Omar and Aisatou NaAwa Wendy Ascher Walter Westand Steve Long Adji Souley deserves special thanks for increasing my understanding of Hausa culture and sharing his knowledge of socioeconomic aspects of irrigation in the region
Wendy Ascher E Walter Coward Barbara Lynch Ray NormanPeter Vandergeest Mike Walter and Walter West provided helpfulsubstantive and editorial comments on an earlier draft of this report Barbara Lynch shared insightful comments in the field and edited the final draft Wendy Ascher and Patty Reynoldsprovided timely and essential assistance in coding data
I would like to acknowledge the help provided by my research assistants and the many residents in the research area who patiently spent time with us
iv
PREFACE
This is the final report for sociological research conductedunder the USAID Water Management Synthesis-II Project (WMS-II) inNiger This short term study was designed to complement theagricultural engineering researcn carried out by Mr W RayNorman for two years ending in April 1986
The general objectives of this study were to provide asocioeconomic profile of the areas served by two irrigatedperimeters in the Maggia Valley of Niger as well as a model ofperimeter organization and operation Terms of reference for thesociological research were drafted by Mr Ray Norman and Dr EricArnould consulting anthropologist in collaboration with theOffice National dAm6nagements Hydro-Agricoles (ONAHA) andUSAIDNiger They were later modified in consultation with ONAHA and USAID
v
TABLE OF CONTENTS
EXECUTIVE SUMMARY i
ACKNOWLEDGEMENTS iv
PREFACE v
I INTRODUCTION 1
II IRRIGATION IN NIGER INSTITUTIONAL AND ORGANIZATIONAL CONTEXT LEGAL ASPECTS AGENCIES INVOLVED IN PERIMETER DEVELOPMENT AND
MANAGEMENT Structure and Function of ONAHA Cooperatives The Perimeter Management Committee The GMP
3 3
3
III THE RESEARCH AREA GALMI AND MOULLELA THE SETTING THE PERIMETERS
10 10 11
IV THE AGRICULTURAL CYCLE CROPS AGRICULTURAL TASKS SEQUENCE DURATION AND PEAK
LABOR REQUIREMENTS The Rainy Season The Dry Season
16 16
16
V LABOR AND PERIMETER MANAGEMENT AND OPERATION POTENTIAL HOUSEHOLD LABOR LABOR LAuiD DISTRIBUTION AND AREA UNDER CULTIVATION
Perimeter Parcels Reservoir Parcels Rainfed Plots Household Size and Land Area
DISCUSSION OF LABOR AVAILABILITY ACTUAL LABOR ALLOCATED TO AGRICULTURE BY GENDER
Male Labor
22 22 24
29 35
Female Labor LABOR MIGRATION FARM VERSUS OFF-FARM ACTIVITIES CONCLUSIONS AND QUESTIONS FOR FURTHER RESEARCH
36 37 39
vi
VI INCOME LAND AND OTHER PRODUCTIVE RESOURCES 42 CASH 43
Cash-Generating Activities INCOME FROM LAND 45 OTHER PRODUCTIVE RESOURCES 47 MATERIAL INDICATORS OF WEALTH AND POTENTIAL RESOURCE
MOBILIZATION 49 CONCLUSIONS 52
VII POWER AND PERIMETER MANAGEMENT 54 LAND TENURE AND PROPERTY RIGHTS 55 LAND ALLOCATION AND THE ROLE OF VILLAGE CHIEFS 57 CROP CHOICE AlD AGRONOMIC PRACTICES 58 DECISION MAKING AND THE FLOW OF INFORMATION ONAHATHB COOPERATIVE AND THE MANAGEMENT COMMITTEE 60
ONAHAS ROLE IN PERIMETER MANAGEMENT 61A MODEL OF PERIMETER OPERATION 62
VIII CONCLUSIONS 63
APPENDIX 1 RESEARCH METHODOLOGY 67
APPENDIX 2 DATA COLLECTED 74
BIBLIOGRAPHY 95
vii
Chapter One INTRODUCTION
Irrigated agriculture has played and is expected to continue to play a growing role in meeting Nigers food production requirements A series of factors including Nigers Sahelian agro-climatic conditions the sharp decline of its uranium revenues and the vulnerability of the vast majority of the population to recurrent droughts are behind the governments promotion of irrigated agriculture In a country where twoshythirds to three-quarters of the land area is classified as inutile or useless desert rainfed and irrigated agriculture on the remaining band of land to the south is considered a key means for increasing the production of crops for domestic consumption and to a lesser extent export
Nearly 10000 hectares have been brought under irrigation by the government since independence in 19601 The actual area cultivated during the 1985 rainy season on perimeters managed by the Office National dAmnnagements Hydro-Agricoles (ONAHA the national irrigation agency) came to 9115 ha (USAID 1986) The irrigated area cultivated during the 1984-85 dry season was 4197 ha The rainy season figure represented an increase from the 5500 irrigated hectares in production in 1983 (USAID 1984) 2
Although the importance of irrigation in Niger is indisputable assessments of and recommendations for irrigation development and perimeter performance are mixed (Horowitz et al 1983 USAID 1984) This is in part due to limitations in the
1 The countrys total land area is 126700000 ha
including land and water (Horowitz ampt Al 198318)
2 For additional background consult USAIDs (1984) Niger Irrigation Subsector Assessment which contains a generaldiscussion of policy economic institutional engineeringagronomic marketing health and environmental aspects ofirrigation in Niger The Niger Social and Institutional Profileprepared by the Institute for Development Anthropology (Horowitzet al 1983) includes chapters on both irrigated and drylandagriculture which provide very thorough and useful information
(
quality amount and level of aggregation of data available on which to base such assessments and recommendations In the last few years various studies have attempted to remedy this situation USAIDs WMS-II Project activities in Niger represent part of this effort
The main objective of this study was to collect and analyze socioeconomic data to complement the hydrological agronomic and socioeconomic data collected by Ray Norman in the Maggia Valley of Niger (see Norman 1986 and 1987 forthcoming dissertation) in order to increase understanding of social and economic factors that affect water management Previously available socioeconomic data for the Galmi and Moullela perimeters date from pre-project feasibility studies (1981 for Galmi 1967 and 1969 for Moullela) The data collected by the present study provide a socioeconomic profile of the areas served by tne perimeters (ie a source of baseline data) and a model of perimeter organization and operation
The next chapter describes the institutional and organizational framework surrounding irrigation development in Niger Chapter three provides an introduction to the research area The fourth chapter consista of a description of the agricultural cycle in the area Chapters five through seven provide dencriptive data and analyses of selected factors affecting perimeter operation Chapter five deals with labor as a factor affecting perimeter activities Differential access to cash land and other productive resources is discussed in chapter six Chapter seven examines the relationship between power relations and perimeter management by focusing on property rights and land allocation crop choice and agronomic practices decision making and information flows and ONAHAs role in perimeter management The last chapter presents concluding coinments A discussion of the methodology employed in data collection is presented in Appendix 1 Finally Appendix 2 contains frequency distributions of collected quantitative data
2
Chapter Two IRRIGATION IN NIGER INSTITUTIONAL AND ORGANIZATIONAL CONTEXT
Irrigation development generally takes place through institutions and organizations designed to support it Examples of such institutions and organizations include laws governing land tenure marketing cooperatives and agencies charged with building operating and maintaining irrigation infrastructure This section provides an introduction to the institutional and organizational context of irrigation development in Niger
LEGAL ASPECTS According to Nigerien law all land belongs to the
government Traditionally village chiefs had authority to allocate and settle disputes involvinq rainfed agricultural land While this is still largely the case in relatively densely populated areas such as Galmi the reported purchase and rental of rainfed land indicates the growing presence of a market in land3 Land which has been improved by the state through irrigation development belongs to and is controlled by the government it is illegal to sell or rent perimeter plots Such plots can however be temporarily reallocated or lent to farmers normally outside an irrigation scheme
AGENCIES INVOLVED IN PERIMETER DEVELOPMENT AND MANAGEMENT A number of agencies and organizations intervene at
different levels to fill various functions related to irrigation development and perimeter operation (see Figure 1) Some of these functions operlap Perimeters are designed by Genie Rural (Rural Engineering) a division of the Ministry of Agriculture Genie Rural is also charged with supervising the construction of small irrigation projects but the execution of large-scale
3 Horowitz et al (1983) in a section called Land HoldingToday suggest that land markets are widespread in areas of higher population density
3
FIGURE 1 ORGANIZATIONS INVOLVED IN IRRIGATION
MINISTRY OF AGRICULTURE
UN I - L -1
GENIE RURAL Other Divisions ONAHA Other Parastatals
DIVISIONS
Regional Directorates
TJ C __ _ __ _ --_ _ __ __I__ _ _ _
I __ __
Regional Director Niamey TAHOUA Tillabery
Perimeter Perimeter OTHER PERIMETERS Director Director Konni MOULELLA GALMI Djiratawa
r Tounfafi KawaraCOOPERATIVE COOPERATIVE Ibohaman Guidan Maggagi
Comitd de Gestion Comitd de Gestion----I11 4t
25amps4fMPs
- 4 FARMERS r--- -)FARMERS-I I
I I
IConseiller VillageoisQuartier Chief
Village Chief Conseil National I de DeveloppementChef de Canton DoguerawaI
Chef de Poste Administrative Malbaza
SUBPREET of KONNII PREFET OF TAHOUAI HEAD OF STATE
4
projects is the joint responsibility of Genie Rural and ONAHA Because ONAHA has general responsibilities over irrigation development its activities may overlap with those of Genie Rural Feasibility studies are often carried out by foreign consulting firms while perimeter construction is carried out by foreign and local construction firms Funding for irrigation comes primarily from external donors
Structure and Function of ONARA ONAHA was created in Deuember 1979 as a parastatal under
the Ministry of Rural Development charged with responsibility over irrigation activities Before this time irrigation was the responsibility of the Union Nigerienne de Credit et de Cooperatishyon (UNCC) also under the Ministry of Rural Development ONAHAs government affiliation was transferred to the Ministry of Agriculture in 1986
ONAHA is responsible for developing managing and maintaining irrigation infrastructure as well as for providing training and extension services to farmers In addition to the central office in Niamey ONAHA has Regional Directorates in Niamey Tillabery and Tahoua Each perimeter is overseen by a perimeter director perimeter directors are under the authority of their corresponding regional directors Larger perimeters also include field agents among their associated ONAHA staff
Auto-gestion or self-management is a key element of Nigers irrigation development policy Government policy is aimed at eventual auto-gestion at the perimeter level with ONAHA playing the role of a technical assistance agency contracted with for specific tasks by local cooperatives and the comitd de gestion (management committee) attached to each perimeter
Cooperatives Each perimeter is associated with a local cooperative or
in the case of larger perimeters (such as Konni) with several cooperatives Village cooperatives are grouped under the National Union of Cooperatives (UNC) at the national level and
5
the Regional Union of Cooperatives (UIC) at the regional level (the UNC replaced the UNCC) Cooperatives provide credit some inputs marketing and accounting services to their membership which includes local farmers practicing rainfed and irrigated agriculture
The Perimeter Management Committee Cooperatives associated with irrigated perimeters have a
management committee (comitd de Qestion) which is responsible in principle at least for managing the perimeter Management committee structure is designed to allow for the representation of farmer interests and ONAHA technical assistance or supervision Each committee includes a president viceshypresident treasurer and secretary chosen at farmer meetings ONAHA staff comprise the rest of the committee
The committees purchase agricultural inputs from the UNC on credit at the beginning of each season and repay them at the end of the harvest Farmers either purchase inputs directly from the cooperative or receive them as part the package of goods and services covered by the redevance or perimeter user fee They can also buy inputs in the market
The redevance is an obligatory fee charged of all perimeter parcel holders It is calculated each season by ONAHA staff and covers selected inputs some perimeter maintenance and repairs and part of ONAHAs operating costs Specific line items vary from perimeter to perimeter (see Table 21) The rate is calculated on a flat per-hectare fee per farmer and per season rather than as a per volume water fee
Management committees are responsible for collecting the redevance Part of the money is kept at the perimeter level to be spent on minor repairs and day-to-day expenditures The rest is deposited in a bank account from which a portion is taken out and transferred to ONAHA The portion remaining in the account is to be used under the committees authority for major irrigation-related expenditures sucA as repairs and maintenance
6
----------------------------------------------------
------------------------------------------------------
------------------------------------------------------
TABLE 21 BREAKDOWN OF REDEVANCE BY LINE ITEM
PER HECTARE of WET SEASON SORGHUM AND COTTON BY PERIMETER 1985 (CFA)
ITEM MOULLELA GALMI
Construction repairs 15255 11000 heavy works Agricultural inputs (fertilizer) 12025 9000 Vehicle depreciation - 2000 Vehicle operating costs - 3200 Office operation 500 Support to ONAHA 3000 3000 Cooperative revolving funds 2000 1500 Turnout operators fees - 300
Total 32280 30500
Source Briend 1986
n theory the management committee and ONAHA staff determine cropping patterns In practice cropping patterns are conditioned by a combination of the governments policy of promoting food production aid farmers wishes to grow sorghum millet beans and other crops In addition to planting a portion of their parcel in food crops farmers must plant cash crops (ie onions cotton or wheat) in order to ensure payment of the redevance Cotton is sold to a French company under terms of an agreement with the government of Niger
The GMP Perimeters are divided into organizational units called
Groupements Mutualistes de Production (GMP or Mutual Production Groups) GMPs are composed of farmers whose parcels are located on a single secondary canal each group has a president secretary and treasurer The GMP president is usually responsible for collecting the redevance from farmers andor from
7
his treasurer and turning it over to the management committee GMPs are the last link in the long institutional chain that
extends from the Ministry of Agriculture at the state level down through ONAHA to individual farmers (Figure 3) Nigerien farmers lives are also touched by other local groups and by representatives of national ocganizations and political authorities In principle such institutional chains should provide for a two-way channel of communication between the central government and the population However as Ware (USAID 1984) and Arnould (1986) note the structure provides for the top-down transmission of state directives rather than mass
participation
8
MA
P 1
NIG
ER
AND
STUD
Y
AR
EA
co6
IZ
shyez
9
L
Chapter Three
THE RESEARCH AREA GALMI AND MOULLELA
This section describes the two perimeters where research was conducted and points out their similarities and differences It also provides background for the social and economic data and issues raised in oubsequent sections4
THE SETTING Galmi perimeter is located just off the paved Route National
that runs east-west through the south of Niger connecting Niamey with Znder Annual rainfall in the area averages about 400 mm The perimeter is within one or two kilometers of several villages varying proportions of whose inhabitants have irrigated parcels Galmi Birni Guidan Kare and Guidan Doutchi which are right on the paved road appear to be a single village5
Together they represent an important economic center for the area On market days Galmi is crowded with villagers from throughout the region At the onion harvests and periodically thereafter truckers stop to buy sacks of onions which are sold in Togo Benin and the Ivory Coast Locally hired trucks also take part in the onion trade Onions have been grown in the area for well over fifty years the violet de Galmi (a local variety) is widely known for Its flavor and storage potential
The largest numbers of irrigated parcel holders on the Galmi perimeter come from these three villages and from Guidan Miko and Guidan Roro which are a few kilometers off the highway to the north and northeast Smaller numbers of parcel holders come
4 The selection of Moullela and Galmi perimeters asresearch sites was conditioned by the terms of reference The decision was based on the desirability of gathering additional social and economic data on perimeters for which hydrological and engineering data as well as some socioeconomic data had been collected by Ray Norman
5 These villages will be collectively referred to a Galmi in the remainder of the report
10
from a few other small villages in the area A few farmers with parcels in the Galmi perimeter live in Moullela which is about 6 km north of Galmi along a dirt road
The Moullela perimeter is located just north of the village of Moullela Parcel holders there come primarily from Moullela although a number of Guidan Miko residents also have parcels on the Moullela perimeter A small number of farmers have parcels on both perimeters In contrast to Galmi the village of Moullela has no market nor does it have a school Moullela residents go to Galmi for the market but not for schooling
THE PERIMETERS Table 31 presents selected descriptive data for the
Moullela and Galmi systems Moullela has a smaller command area and fewer parcel holders than Galmi Given the difference in size it is not surprising that the perimeters have different numbers of ONAHA staff At Moullela the perimeter director is the only ONAHA agent in residence At Galmi however there are two training and extension agents and an engineering and maintenance agent in addition to the perimeter director In addition a UNC paid accountantmanager works at the cooperative
Both Moullela and Galmi are gravity flow systems that use water stored in dams for supplemental rainy season and full dry season irrigation In Moullela irrigation water reaches individual fields by passing through control structures into field channels In Galmi siphons are used to draw water from earthen canals into field channels
The cropping patterns on the two perimeters are similar at present During the 1986 rainy season farmers grew cotton on one half of their parcels and millet or sorghum on the other half The grain to cotton ratio at Moullela depends on a crop rotation pattern that has been in existence for a number of years but which was modified slightly a few years ago Now half of each
11
TABLE 31 SELECTED DESCRIPTIVE DATA FOR MOULLELA AND
GALMI PERIMETERS
Perimeter ITEM MOULLELA GALMI
Date of First 1967 1983 - 1984Operation (Dry Season)
Hectares IrrigatedWet Season 1985 626 242 Dry Season 1985-86 11 241 Reservoir Bottom 20 NA
Number of Farmers 124 854
Main CropsWet Season 1984 Sorghum Millet Sorghum Millet
Cotton Beans Beans Dry Season 1985-86 Onions Corn Onions Wheat
CornReservoir Bottom Onions Wheat Corn
Sweet Potatoes NA Tomatoes Okra Squash
Wet Season 1986 Sorghum Millet Sorghum Millet Cotton Cotton
Redevance (CFAha)Wet Season 1985 32280 30500Dry Season 1985-86 15170 22000
Percent Recovery of 100 67 Redevance (through end of wet season 1985)
Source Interviews and Roger Briend (personal cormunication)NA Not Applicable
parcel is planted in grains rather than only a third Cotton was grown at Galmi for the first time in 1986 Farmers could choose between sorghum and millet for the other half of their parcels In previous years the main wet season crops were sorghum and millet Onions wheat and corn are the dry season crops on both perimeters
12
Moullela is an older perimeter than Galmi (Table 31) Siltation is a problem at Moullela this is also true of other small dams in the Maggia Valley (Wells 1985) Although flood recession agriculture is practiced on most of the reservoir bottom the command area is drastically reduced in the dry season There is some question as to how many more years dry season cropping will be viable at Moullela (Briend personal communication) Water availability and siltation do not presently pose a problem at Galmi 6
A certain amount of temporary parcel reallocation takes place at Moullela during the dry season to accommodate parcel holders who are willing and able to cultivate within the reduced command area Some farmers leave their parcels in order to work in Nigeria but the majority remain High onion seed prices may prevent some farmers from growing onions A few non parcelshyholding farmers are allowed to plant on the perimeter during the dry season Arrangements are made either by farmers and approved by the perimeter director or through the perimeter director andor the management committee Non-perimeter parcel holders who farm on the perimeter are charged their proportional (per hectare) share of the redevance
Parcel changes also take place in Galmi but in a different manner and for different reasons Non-perimeter holders are allowed to farm on the perimeter in the dry season for the stated purpose (according to ONAHA staff) of increasing access to irrigated land High labor requirements for onion cultivation are another reason for reducing plot size Farmers with more than one parcel have to give up part of their parcels to other farmers Besides the officially recorded dry-season parcel reassignments some farmers make private arrangements In some
6 The exception to this generalization about Galmi is that there are times when the tail of the system (GMP 25) does not receive enough water during the dry season This is due to asecondary canal which should carry 40 lps according to designbut which for some reason was installed as a 30 lps canal
13
instances this leads to problems in redevance recovery Under officially recorded transactions each party is
responsible for his proportional share of the redevance although there is some ambiguity over who is supposed to give it to the GMP head Under private arrangements however the parcel holder is responsible for the redevance whether or not he receives it from the other farmer
The two perimeters have different rates of redevance recovery (Table 31) Some Galmi farmers have not paid their redevance since the establishment of the perimeter At Moullela payment is not considered a problem
Further differences in farmer behavior on the perimeters were noted at the beginning of the 1986 rainy season In general agricultural tasks were completed earlier and more promptly at Moullela The first rains did reach Moullela before Galmi which would explain the fact that planting weeding and successive tasks would take place later at Galmi A relative shortage of oxen and plows in Galmi partially explains observed delays in plowing there Irrigation furrows were reinforced sooner and more adequately at Moullela and canals were cleaned in anticipation of irrigation Galmi canals remained full of vegetative growth and irrigation furrows were only partially reinforced at the beginning of August
Farmers on both perimeters complain about others irrigating out of turn or excessively but it was difficult to assess these claims given the time frame of the field work Water scarcity is a problem on two of Galmis GMPs this was corroborated by numerous individuals including ONAHA staff who say that this problem is a design fault rather than a people problem (see footnote no6)
Some Moullela farmers complain about a mass expulsion of farmers that took place in 1974 This sanction was supposed to have been leveled at farmers who did not pay their redevance A few say that certain individuals did pay but lost their parcels anyway as a result of actions taken by individuals who
14
subsequently ended up with land that had been farmed by the excluded farmers Moullela farmers did not complain about the process of original parcel allocation Such complaints were heard in the villages served by the Galmi perimeter (see Chapter Seven)7
One can attribute some differences between tha perimeters to the larger number of irrigators at Galmi and to the fact that years of experience may have led to local arrangements that allow somewhat smoother operation at Moullela Clearly both perimeters are operating however auto-gestion is not fully realized8
Before examining some of the socioeconomic factors that may affect perimeter management a brief description of the agricultural cycle on the perimeters is presented in order to provide a context for the subsequent discussion
7 Complaints about land allocation on perimeters have been recorded in other areas See for example Republique du Niger(198518)
8 See Laucoin (1971 1973) for an early discussion of factors constraining auto-gestion
15
Chapter Four
THE AGRICULTURAL CYCLE
CROPS The agricultural cycle includes two cropping seasons
During the rainy season faimers grow rainfed millet sorghum cotton and beans outside the perimeter Millet sorghum and cotton are grown with supplemental irrigation on the perimeters Some farmers grow mangos lemons and root fiber and vegetable plants in enclosed gardens To irrigate they draw water from dug wells with a calabash Farmers who can afford onion seeds and who can mobilize the necessary labor grow wet season onions outside the perimeters
During the dry season farmers grow onions and wheat or corn on the perimeters Sweet potatoes okra squash and beans are grown on the exposed bottom of the Moullela reservoir Onions fruit trees and some vegetables are grown with calabash irrigation in gardens A second crop is not possible on rainfed parcels with the exception of a limited amount of very moist fadama land9
AGRICULTURAL TASKS SEQUENCE DURATION AND PEAK LABOR REQUIREMENTS
This section presents a description of the agricultural calendar with reference to labor requirements It shows that the period of planting and weeding from mid-June through August is a time of concentrated labor requirement Periods of high labor demand on the perimeter may conflict with other household labor needs
Farmers with irrigated parcels must coordinate work on their rainfed parcels with perimeter tasks which follow a schedule fixed by the perimeter directors Certain tasks which are not necessary on rainfed land such as plowing and furrowing must be
9 Fadama land refers to moist alluvial soil in valleyfloors with a high water table
16
performed on the perimeter Tables 41 and 4P present illustrative interview data on time 6pent on selected activities
TABLE 41 REPORTED LABOR ALLOCATION BY TASK ON IRRIGATED LAND
SELECTED CASES FROM GALMI AND MOULLELA (in Worker Days)
TYPE OF IRRIGATED PARCEL CROP(S) AND AREA Wet Season Dry Season
Sorghum and Cotton Wheat Onions Task Beans 05 ha 05 ha 0125 ha 0125 ha
Clearing Soil 3 NA 3 3Plowing 3 NA NA NAPlanting 9 4 3 18First Weeding 9 14 5 18Second Weeding 6 19 0 10 (or further weeding)Irrigation 1 NA (8 for both)Harvest 20 59 8 18Tying (Sorghum) 4 0 0 0 TOTAL 55 96 23 71 Working daysha 110 192 184 568
NA=Not Available Source Farmer Interviews
TABLE 42 REPORTED LABOR ALLOCATION BY PLOT AND SOIL TYPE
FOR SELECTED TASKS AND CASES FROM GALMI AND MOULLELA (in Worker Days)
Type and Area Plot Per Hectareof Parcel Weeding(s) Harvest Total Total
Rainfed Millet 26 16 42 28 15 ha
Rainfed Millet 8 5 13 26 05 ha
Rainfed Millet on 8 2 10 20 Sandy Soil 05 ha
Rainfed Millet on 15 3 18 72 Fadama Soil 025 ha
Irrigated Millet 16 2610 104 025 ha
Source Farmer Interviews
17
Labor allocation reported by farmers differs by crop on irrigated parcels (Table 41) and for a given crop depending on soil type (Table 42) It must be stressed that these data come from interviews with selected farmers and refer to their specific conditions the information is meant to be illustrative The irrigation time for sorghum and cotton may be closer to 3 to 4 worker daysha (see Norman 1987) Norman (personal communication) suggests that the total worker daysha for sorghum is slightly overestimated the cotton figwe underestimated while dry-season onions take 350 to 400 worker daysha The irrigation time for sorghum and cotton may be closer to 3 to 4 daysha per wet season A narrative overview of the sequence and timing of major tasks will further clarify the significance of labor requirements
The Rainy Season
Preparation for the rainy season begins in June when farmers clear rainfed parcels and dry-plant sorghum and millet in anticipation of the first rains Dry-planting refers to the practice of planting seeds in dry soil just before the beginning of the expected rainy season If the rains are insufficient or late the seeds may not all germinate if there is flooding seeds may rot 10 Thus selective re-planting is often necessary Beans are often planted between the rows of rainfed millet or sorghum In Moullela farmers plow rainfed cotton plots In general however rainfed land is not plowed
According to ONAHA directives parcels on the perimeters must be cleared and plowed Farmers who do not own oxen and plows need to pay those who do to get the work done Due to a shortage of oxen in Galmi plowing continued into mid July 1986 in some parts of the perimeter After plowing farmers wait for the first rains to plant Dry-planting on the perimeters is
10 Most farmers interviewed at Moullela and Galmi reported treating their millet and sorghum seeds with fungicide to preventmold
18
discouraged by ONAHA agents who argue that too much seed is lost this way Many farmers on both perimeters say they would prefer to dry-plant without plowing on the perimeter to reduce costs and labor requirements
This is clearly a period of high labor demand particularly for farmers with both rainfed lands and perimeter parcels and farmers with larger total holdings since work must be accomplished everywhere at once Galmi and Moullela farmers found it difficult to finish their planting both on their outside parcels and on the perimeter within the time frame recommended by ONAHA personnel Some farmers reported hiring labor in order to meet the perimeter directors schedule these farmers must have had access to cash to pay wages
Labor requirements remain high through the weeding period which extends from July to September depending on the timing of planting and rains Millet and sorghum are weeded at least twice both on and off the perimeters Beans are weeded after the cereal crops Cotton must be thinned and weeded Yields are highly responsive to weeding
The rainy season harvest is also a period of high labor demand but farmers claimed it was less critical than planting and weeding The millet and sorghum harvest begins in mid- to late August continuing through late October Certain varieties planted on rainfed land are harvested later Beans are harvested for about a six week period starting in mid-September Cotton is harvested four to six times between October and mid-December The different growing periods associated with each crop together with staggered planting dates and microclimatic differences between parcels may allow the harvest to take place with somewhat less pressure than planting and weeding Farmers who plant wet season onions however face additional labor requirements
Changes in the cost of hired labor reflect periods of peak labor requirements Farmers in Galmi reported that laborers were being paid 1500 CFA per day for weeding during the 1986 wet season They noted that the price would go down to 1000 CFA per
19
day for harvesting and packing Labor is more expensive in Galmi than in Moulella where day laborers typically make 500 CFA plus two meals (worth about 150 CFA)ll
Farmers who can afford to hire labor must balance increased labor costs against anticipated yields Farmers without the cash to hire labor are largely constrained by household labor availability12 Land-short villagers may obtain substantial income during the weeding period by hiring themselves out13
The Dry Season Soil preparation for the dry season begins as early as
October following the harvest After clearing and plowing farmers make beds with raised edges for their onion plants they then plant wheat or corn and onions Onions are transplanted from nursery plots begun over a month earlier Some farmers have their own nurseries others buy the seedlings Either way onions require considerable labor and cash investments According to one estimate one hectare of irrigated onions requires 660 person-days of labor (GERSAR 1981) Galmi farmers usually plant 0125 ha (half a parcel) of onions which would require 825 person-days following the GERSAR estimates
After transplanting onions must be weeded Wheat is also weeded during this period Harvesting onions includes several
11 During the period of research the exchange rate averaged 360 Francs CFA per $100 US
12 Labor may also be mobilized through gavaa a traditional form of community labor organization In addition close relatives and friends frequently exchange labor However it hasbeen suggested (USAID 1984) that these forms of labor mobilization occur more frequently on rainfed land than onirrigated parcels Cases of gaaa and labor exchanges were observed on the perimeters during field work This is an issuethat deserves further study in order to determine whether there are systematic differences in labor mobilization patterns between rainfed and irrigated land
13 This fact is often ignored by economists and developmentplanners in discussions about the benefits of introducing laborshysaving technologies
20
operations The onions are picked and the leaves are cut wrapped into bunches and dried Most farmers sell their onions immediately after the harvest
Farmers without pressing cash needs and who have access to storage facilities can store onions and sell them later on at prices of up to ten times the price at harvest Onions harvested before maturity cannot be stored as long as fully matured ones which may be stored from five to seven months Briend (personal communication) notes that many farmers on both perimeters harvest
onions before full maturity This may be due to labor constraints experienced at the wheat and onion harvest Harvesting before maturity is probably more common among farmers who sell their onions immediately to meet cash needs
The dry season harvest is generally over by the end of March During April and early May farmers repair their tools and homes And of course they continue to perform the various offshyfarm activities they have engaged in throughout the year In late May the cycle begins again
21
Chapter Five LABOR AND PERIMETER MANAGEMENT AND OPERATION
irrigation perimeter management and operation is affected by hydrological engineering climatological agronomic economic sociological and cultural factors Sociological analysis of irrigation systems implies the examination of economic and social influences on production to describe elements that affect perimeter operation Three broad elements have been selected for analysis in this report (1) labor (2) differential access to cash land and other productive resources and (3) issues of power as related to land tenure and property control over agronomic practices decision making and the cooperative and management committee and ONAHAs role in perimeter management14
The first is discussed in this chapter the second and third in the chapters which follow
POTENTIAL HOUSEHOLD LABOR Demographic variables such as total household size and
household composition by age and gender determine household labor availability and therefore have a significant impact on agricultural production of any kind Labor requirements for irrigated agriculture are higher than for rainfed production because additional tasks are required plowing field channel construction canal cleaning and irrigating Also tasks like weeding require more time under irrigated conditions Insufficient household labor means limiting the area cultivated hiring labor or mobilizing labor through other means
Agricultural activities on Moullela and Galmi perimeters are performed primarily by men and boys Children begin working on their elders fields at the age of seven or eight Women participate in the cotton harvest but their contribution to
14 Appendix 1 describes the methodology employed in this
research
22
other agricultural work is indirect and includes preparing and carrying food to men and boys working in the fields Therefore the number imales of age eight and over can be used as an rough indicator of available household labor for irrigated agriculture
Data collected on a series of variables related to household size and composition show that the modal household consists of a male head of household an additional zero to two males eight years or older one to two women over the age of seven and two or three children under seven years of age 15
Males over the age of eight are defined as potential workers or active males Table 51 shows the distribution of potential
working males per household
TABLE 51 DISTRIBUTION OF NUMBER OF POTENTIAL WORKING
MALES PER HOUSEHOLD (Number of Households)
Number of Males Per Household 1
Number of Households Galmi 6 Moullela 1
2
9 9
3
9 10
4
6 5
5
2 2
6
0 2
7
2 -
8
1 -
--------------shy----------------
Total 7 18 19 11 4 2 2 1
Source Survey data
The majority of households (especially in Moullela) have two or three active males Assuming a six-day work week a household with two active males has fifty-six theoretically available worker days per month and a household with three active males has eighty-four However potential labor supply is also
15 For research purposes the household was defined as including those individuals with whom the respondent usuallylived ate or pooled resources At minimum Hausa households generally include a male head of household one or more wivesand unmarried children In many cases married sons (and their wives and children) remain in the fathers compound and share certain resources in common Other relatives may also be present See Horowitz et Al (198327) for further background on definitions of households in Niger
23
affected by the (1) timing of tasks (2) total area of land cultivated (3) labor actually allocated to agriculture and (4) the importance of other activities that comprise the household livelihood
LABOR LAND DISTRIBUTION AND THE AREA UNDER CULTIVATION
As noted earlier planting and weeding are ideally performed on a number of plots at once Available worker days may be sufficient to work any one household plot but insufficient to work a number of plots Accurate measures of total landholdings would be necessary to fully evaluate labor constraints Gathering such data was beyond the scope of this study However data were collected on the area of irrigated land and on the number and type of rainfed plots held by respondents While in the case of rainfed land the number of plots does not correspond directly to land area the data give a rough indication of the extent and types of land that draw the farmers labor These data can be used in conjunction with data on labor committed for specific tasks to estimate the minimum number of worker-days allocated to cultivate a set of parcels with a given area
Perimeter Parcels Table 52 shows the distribution of parcels per household
for perimeter parcel-holders in Moullela and Galmi
TABLE 52 DISTRIBUTION OF IRRIGATED PARCELS TO WHICH
RESPONDENT HAS TITLE (Number and Percent of Respondents)
Number of Parcels
GALMI (N=31) Number Percent
MOULLELA (N=29) Number Percent
1 29 83 20 69 2 2 17 7 24 3 - - -
4 - - 2 7 31 100 29 100
Source Survey data
24
Most of the perimeter parcel-holding households sampled have one perimeter parcel In Galmi 17 percent of respondents have two irrigated parcels while in Moullela the iorresponding figure is 24 percent Two farmers in Moullela reported having four perimeter parcels16
Total irrigated land holding size varies within the perimeters On the whole Moullela farmers have larger areas of irrigated land than those on the Galmi perimeter Furthermore the distribution of irrigated holding size is wider at Moullela than at Galmi (Table 53) For these reasons the per-household labor requirement for perimeter parcel holders also varies
TABLE 53
DISTRIBUTION OF IRRIGATED LAND AREA BY PERIMETER (Number and Percent of Respondents)
Irrigated Area GALMI (N=31) MOULLELA (N=29)(ha) Number Percent Number Percent
0 - 025 23 66 2 7 026 - 050 10 28 11 37 051 - 075 2 6 6 20 076 - 124 - - 3 10 125 - 150 shy - 4 14 151 - 167 shy -3 10
31 100 29 98
Note Percentages do not add to 100 due to rounding error Source Survey data
Differences in irrigated holding size can be partially explained by the different guidelines followed in parcel attribution on the two perimeters In Galmi between one and three parcels of 025 ha were allocated on the basis of previous landholding and family size (GERSAR 1981) In Moullela parcels were allocated on the same principle but with a different formula and no fixed increment of parcel sizes Furthermore as
16 Six of the sampled Moullela farmers with multiple parcels have one on the Galmi perimeter as well
25
noted above Galmi has been operating for a shorter time period While most farmers in Galmi are the original parcel holders this is no longer the case in Moullela where only thirty-one of the original parcel holders remain (see Norman forthcoming 1987) According to Norman (personal communication) in approximately 90 percent of the cases of farmers who lost irrigated parcels the land was reallocated within the same family Thus the original attribution procedure provides only a partial explanation for the present uneven distribution of land at Moullela parcels have also been subdivided among inheriting sons
The conclusions to be drawn from Table 53 with respect to labor requirements are first that perimeter parcel holding households are not by virtue of membership in a perimeter likely to spend uniform time working on their parcels Second Moullela farmers have an average of twice as much irrigated land to cultivate Third given land distribution on the Moullela perimeter calculations of average labor requirements for Moullela farmers as a group will hide wide variation between households
Reservoir Parcels In addition to parcels on the perimeter itself Moullela
parcel holders received title to a strip of land on the reservoir bottom which is cultivated in the dry season as the water recedes However 55 percent of the Moullela respondents reported that they did not have parcels on the reservoir bottom (Table 54)17 Moullela farmers who cultivate the reservoir bottomas well as irrigated parcels during the dry season will need more labor in comparison to those who do not farm on the reservoir bottom
17 Norman (personal communication) suggests that some peoplebegan farming this land when the perimeter was built whileothers did not Those who began earlier have gradually expandedtheir holdings over the years However the process leading upto the unequal use of the reservoir bottoms is unclear and deserves further study
26
TABLE 54 DISTRIBUTION OF RECESSION AGRICULTURE PLOTS USED
IN THE MOULLELA RESERVOIR (N=29)
Number of Plots Number of Respondents Percent
0 16 55 1 11 38 2 2 7
Source Survey data
Rainfed Plots Farmers in the research area classify their rainfed plots
according to differences in soil type altitude slope and moisture For this study rainfed land has been grouped into two broad categories (1) fadama low-lying land with moist soils which may flood during the rainy season and (2) all other rainfed land (which farmers divide into at least four different categories) Data on the distribution of fadama and other rainfed plots are shown in Table 55
TABLE 55PERCENT DISTRIBUTION OF NON-IRRIGATED PLOTS BY TYPE OF LAND
AMONG PERIMETER PARCEL HOLDERS (Number and Percent of Respondents)
Fadama Other Rainfed Number of Plots
GALMI No
MOULLELA No
GALMI No
MOULLELA No
0 1 2
25 7 2
71 20 6
15 8 2
52 28 7
2 13 7
5 37 20
1 5 7
3 17 24
3 - - 2 7 6 17 4 14 4 1 3 1 3 3 9 6 21 5 - - - - 3 9 3 10 6
10
- -
1 -
3 -
1 1
3 3
14 - - 1 3 - -25 -
35 -
I00 -
29 -
100 -
35 -
100 1
29 _3 98
Note Percentages do not add to 100 due to rounding error Source Survey data
27
About half of the perimeter parcel-holding farmers in Moullela and 30 in Galmi have at least one fadama plot The number of plots per household ranges from one to four in both samples One Moullela farmer reported that he held 14 fadama plots he is clearly an exception
In contrast the vast majority of perimeter-parcel holding farmers have several other rainfed plots Only two respondents from Galmi and one from Moullela reported no other rainfed plots (Table 55) Eighty percent of Moullela respondents and 58 percent of those in Galmi have two or more rainfed plots One Moullela farmer reported having twenty-five rainfed plots
Gardens do not figure prominently as a category of land worked by sampled farmers ith perimeter plots Two Galmi parcel holders and four from Moullela report that they have gardens The rest of the perimeter holders (94 percent of respondents in Galmi 86 percent in Moullela) do not Gardening is more prevalent among non perimeter parcel holders (see Appendix 2 Table VI) 18
Household Size and Land Area Cultivated land area may be primarily a function of
household size or available labor (see Chayanov 1966) In order to test whether this was the case among the samples from the two perimeters the number of active males per household was crosstabulated and correlated against the irrigated area number of rainfed plots and number of fadama plots per household
X found little evidence of a direct positive relationship between available male labor and irrigated area and number of rainfed or fadama plots The only positive and significant association (r= 044) was between the number of active males and number of rainfed plots per household in Galmi The correlation
18 Further research might investigate whether this is a
systematic pattern and if so explore the reasons behind this
28
coefficient for these two variables for the two perimeters combined was r- 018
These results are difficult to interpret given the lack of data on rainfed area However they do show that there is no strong positive linear relationship between available (male) labor and available indicators of land held by farmers on the two perimeters studied A similar analysis for the Konni I perimeter showed a weak but significant correlation (r=030) for these two variables (Rdpublique du Niger 198518)
Horowitz et al (198347-51) review a number of studies and conclude that the distribution of landholding on a village level in different regions of Niger is unequal They note that
(o)ne of the contributing factors to the differentiation ofrural farmers is the uneven access of farming units to land Although there are few truly landless rural households manyhouseholds do not hold enough land to meet either food or cash needs from their farming activities alone (198347)
Thus access to land in the research area--defined In terms of indicators of land holding and land use--also appears to be unequal and not necessarily related to household size or available labor
DISCUSSION OF LABOR AVAILABILITY Labor available for irrigated agriculture and water
management is a function of household labor total irrigated holdings and total rainfed land Other factors such as off-farm activities and the capacity to hire labor also affect labor availability for irrigated agriculture The vast majority of Galmi and Moullela farmers are engaged in a farming system in which irrigated parcels represent only one of various types of plots worked Half of the Moullela farmers have one fadama plot and a plot in the reservoir and the majority have at least two other rainfed plots in addition to their irrigated parcel In Galmi over a quarter of farmers have one fadama plot and the majority have at least one other rainfed plot
29
In order to translate Qata on number of plots into an estimate of labor allocation for each individual household in the sample we would need to know the actual area of land for each rainfed plot as well as mean days of labor invested per unit area Since these data are not available we will estimate labor requirements on rainfed plots for the group as a whole by attributing average sizes to different types of plots Informal interviews indicate that fadama plots vary in size from 025 to 075 ha while other rainfed plots range from 02 to 30 ha A reasonable estimate for a mid-range fadama plot is therefore about 05 ha and 16 ha for other rainfed
Based on these mid-range holding sizes I have constructed two hypothetical case households for each perimeter (Table 56) Case 1 for each perimeter includes a fadama plot case 2 does not case 1 for Moullela includes a reservoir bottom plot Table 56 suggests the total land area cultivated for households with mid-range holdings The actual spread is probably far greater
TABLE 56ESTIMATED WET SEASON LAND AREA CULTIVATED PER HOUSEHOLD CASE EXAMPLES
Average Area of Cultivated Land (ha)
Type of Plot GALMI
Case 1 Case 2 MOULLELA
Case 1 Case 2
Perimeter 025 025 050 050 Reservoir - - 008 -Fadama 050 - 050 -Other Rainfed 160 160 320 320
235 185 428 370
Note Case 1 includes fadama land while case 2 does notSource Farmer Interviews
Data were collected on labor investments on plots of known sizes in the course of the research from a limited number of farmers (see Tables 41 and 42) The GERSAR (1981) pre-project study for the Galmi perimeter includes the results of a labor allocation study for a number of crops on rainfed and irrigated land By incorporating these data into the four cases shown in
30
Table 56 it is possible to calculate the number of working days these households hypothetically invest in agriculture This is carried out for the wet season crops
For the purpose of these calculations I assume that perimeter areas in Table 56 are devoted half to cotton and half to milletsorghum and that labor is fully and uniformly allocated over a five-month rainy season The interview data and GERSAR data are similar for irrigated crops but the GERSAR data show a higher labor allocation on rainfed plots than the data gathered in this study
The labor allocation values used for the calculations are 1 Irrigated Sorghum and Millet 100 working-daysha
(Source Interview Results and GERSAR)
2 Irrigated Cotton 192 working-daysha (Source Interview Results)
3 Rainfed Millet Fadama soil 87 working-daysha (Source Interview Results)
4 Rainfed Millet Other soil a) 40 working-daysha (Light weeding)
(Source Interview Results)b) 87 working-daysha (Heavy weeding)
(Source GERSAR)
Incorporating these results into the data from Table 56 gives the results shown in Table 57 It must be noted that the total working-days per month are probably underestimated
The following observations about wet season agriculture can be made based on the results in Table 57 1 The first set of cases (light weeding) is based on interview results and therefore represents actual labor commitments These figures reflect the availability of labor to the household not a hypothetical fixed labor requirement per unit area 2 The difference between the GERSAR data and interview data on rainfed land indicates that labor input per unit area can be highly variable We can assume that the GERSAR data represent a case where labor is utilized more intensively possibly because of greater ability to mobilize labor from within the household
31
----------------------------------------------------
TABLE 57 LABOR INVESTMENTS WET SEASON AGRICULTURE
(COTTON AND MILLETSORGHUM) CASE EXAMPLES
(Number of Working-Days)
Type of GALMI MOULLELA Land Case 1 Case 2 Case 1 Case 2 a) Light Weeding
Perimeter 37 37 73 73 Fadama 44 - 44 -Rainfed 64 64 144 144Total 145 101 261 217Working-daysmo 29 20 52 43
b) Heavy Weeding
Perimeter 37 37 73 73 Fadama 44 shy 44 -Rainfed 115 115 230 230 Total 196 152 347 303 Working-daysmo 39 30 69 61
Sources Table 56 and labor allocation values presented above
or to draw on cash resources to hire labor The discrepancy might also be explained by different soil and water conditions However the overall conclusion that there is great potential variation in labor input per unit area depending on labor availability and cash costs still seems valid 3 Total labor allocation to perimeter plots is relatively constant in the two sources of data (GERSAR and interviews) while the actual (based on interviews) labor commitment to rainfed land is much lower that that given by GERSAR While this may simply be a function of the higher labor intensity required on the perimeter for a given crop it also suggests that in the research area labor may be preferentially committed to the perimeter plots That is labor allocated to the perimeter is relatively constant but labor allocated to rainfed land may fall with declining labor availability
32
These preliminary results indicating preferential labor allocation to perimeter plots may reflect (1) the greater reliability of perimeter agriculture in relation to rainfed agriculture (at least during drier years) or (2) the closely supervised nature of perimeter agriculture or (3) the need for cash from cotton and onions or (4) the relatively higher labor intensity of certain perimeter crops such as cotton and onions (although cotton is also grown on rainfed plots and onions are grown in gardens or (5) all of the above In order to provide irrigation planners witlh adequate baseline information further research should address the question of how households respond to different levels of labor availability especially with respect to allocation choices between rainfed and perimeter agriculture The relationship between whether a given year is good or bad with respect to rainfall and labor allocation between perimeter and rainfed land should also be investigated It is possible that on good years farmers try to spend relatively less time on the perimeter since their marginal product on rainfed land would be higher than on a bad year when it might be more economical to concentrate on getting a good harvest from the perimeter 4 With respect to the actual working days the case of light weeding (I) the data in Table 57 show that monthly labor investment ranges from 20 and 29 days per month in Galmi to 43 and 52 days per month in Moullela (Note again that these ranges reflect actual labor committed) We can conclude that one adult male could cultivate the set of Galmi parcels but that two adults or one adult and two children would be required for the set of Moullela parcels
In the set of cases of heavy weeding (II) monthly labor requirements (now potential rather than actual) would range from 30 to 39 working days in Galmi this could be accomplished by an adult and a child or two adults for the second case) In Moullela the labor requirements would be 61 and 69 working-days
33
which would require for example two adults and a child or one adult and three to four children
These represent typical or average cases for Galmi and Moullela As the data on land distribution show (Table 56) the actual range is greater than given by these cases many households farm larger areas of land The problem of matching total available labor in a given area to unequally distributed land leads to the utilization of institutions of labor exchange (hiring labor kinship networks etc) this may represent a bottleneck that can constrain marginal labor productivity in any smallholder agricultural system 5 The proportion of agricultural working-days allocated to the perimeter in the wet season are given in Table 58
TABLE 58 PROPORTION OF TOTAL AGRICULTURAL LABOR ALLOCATED TO THE PERIMETER WET SEASON
Case GALMI 1 Case 2
MOULLELA Case 1 Case 2
I (Actual) 26 II (Potential) 19
37 24
28 21
34 24
Source Table 57
The majority of working time is allocated not to the perimeter but to rainfed land This implies that during the wet season perimeter agriculture is not the primary component of the household production strategy at least in terms of labor committed These results refer to the wet season and therefore do not necessarily imply that income from or total household labor allocated to the perimeter is correspondingly small Some farmers are able to make a relatively large income from cash crop agriculture on the perimeter particularly during the dry season (see Chapter Six)
34
ACTUAL LABOR ALLOCATED TO AGRICULTURE BY GENDER
Table 59 summarizes the aggregate survey data on potential labor available versus actual labor allocated to agriculture by gender for each perimeter
TABLE 59 POTENTIAL AND ACTUAL LABOR ALLOCATION
FOR MALES AND FEMALES EIGHT YEARS OF AGE AND OVER (Number and Percent of Males and Females)
MOULLELA GALMI (29 Households) ( 56 Households)
MALES Potentially Available Males 85 107
Males Actually in Agriculture 79 82 (at least part-time)
Percent of Total Males 7 23 not in Agriculture
FEMALES Potential Available Females 66 140
Females Actually in Agriculture 37 91 (not necessarily full-time)
Percent of Total Females 44 85 not in Agriculture
Source Survey Data
Male Labor Data on actual labor allocated to agriculture shows that the
theoretically available labor of males over the age of eight is not allocated entirely to agriculture Off-farm activities compete with agriculture for household labor
A much greater proportion of available male labor is allocated to non-agricultural activities in Galmi than Moullela In Moullela 7 percent of active males are engaged full-time in non-agricultural activities whereas in Galmi the corresponding figure is 23 percent This difference is probably explained by the greater availability of alternative sources of income
35
generating activities in Galmi The remainder (93 percent of active males in Moullela 77 percent in Galmi) are engaged in agriculture on either a part-time or full-time basis These figures include children whose labor contribution is not equivalent to that of an adult Nevertheless all of these males are counted as full-time male adult workers for the purpose of this study This overestimates available male labor
Female Labor The data in Table 59 show that the proportion of females
over seven years of age working in agriculture is significantly different for the two perimeters Seventy percent of households in the Moullela perimeter subsample had one or two women performing some agricultural work (primarily in the cotton harvest) That is 50 percent of the women over age seven in the Moullela subsample were involved in some kind of agricultural work In contrast only a little over one-quarter of Galmi perimeter households had one or more women engaged in some agricultural activity Of the total number of females over age seven in this subsample only 15 percent performed at least some agricultural tasks
The higher proportion of women involved in agriculture among parcel-holding households in Moullela--as opposed to those from Galmi--may be due to the longer history of cotton cultivation in Moullela There may also be a relationship between womens higher participation in agriculture and the apparent higher proportion of (male) labor migration in Moullela Another reason behind this difference may have to do with wider opportunities for women to generate income through non-agricultural activities in Galmi Processing andor selling food would be an example of such activities
LABOR MIGRATION Labor migration affects agricultural production by changing
the extent and seasonality of available household labor and by
36
-----------------------------------------------
providing additional cash income Migrants are often considered to represent labor that might otherwise be allocated to agriculture However insofar as labor migration is a kind of rite of passage that young men in rural areas practice to accumulate cash it does not necessarily follow that this labor would just as easily be allocated to agriculture
Data on the number of people usually considered to be part of the household but who were currently absent and employed or seeking employment show that migration is more prevalent in Moullela than Galmi (Table 510) This is corroborated by data
TABLE 510 NUMBER OF MIGRANTS PER HOUSEHOLD
(Parcel-holding Subsample)
Number of Migrants per Household 0 1 2 3 Overall
Number of Households Galmi 19 6 7 3 35 Moullela 10 14 2 3 29 Percent of Households Galmi 54 17 20 9 100 Moullela 35 48 7 10 100
Total 29 20 9 6
Source Survey Data
from the subsample of non-perimeter parcel holders over 90 percent of the non-perimeter holding subsample in Galmi had no migrants whereas in Moullela 43 percent did not (see Table I Appendix 2) The greater proportion of migrants in Moullela for parcel holders and non-parcel holders alike might be explained by the few options for cash generation there
FARM VERSUS OFF-FARM ACTIVITIES The survey results show that respondents with perimeter
parcels engage in a variety of non-agricultural activities Variables representing the respondents primary and secondary activities were constructed based on answers to questions about
37
- -
time spent on different activities (Table 511) (Note that the activities of the male head of household are listed not the activities of other household members) These data illustrate differences in the importance of agriculture as a primary activity in Moullela and Galmi
TABLE 511 PRIMARY AND SECONDARY
ECONOMIC ACTIVITIES OF PERIMETER PARCEL-HOLDING RESPONDENTS (Number and Percent of Respondents)
Primary GALMI MOULLELA
Secondary GALMI MOULLELA
no no no no
Agriculture 26 74 25 86 2 6 1 3
Agriculture and 1 3 2 7 10 29 16 55 Livestock
Local Non-Ag 3 9 - - 4 11 - -Wage Labor
Migrant - - 3 9 2 7 Wage Labor
Agricultural - - - - 2 6 3 10 Wage Labor
Commerce and Trade 3 9 1 3 4 11 2 7
Petty Commerce 1 3 - - 2 6 1 3
Mechanic - - 1 3 - - 1 3
Blacksmith 1 3 - - 1 3 - -
Butcher - - 2 6
Trucker 1 3 - -
Baker - shy - - 1 3
No Secondary 4 11 2 7 Occupation
35 101 29 99 35 101 29 98
Note Percentages do not add up to 100 due to rounding error Source Survey data
38
We can conclude from the data in Table 511 that agriculture is the dominant primary activity for farmers on both perimeters but it is relatively more important at Moullela Other primary activities include commercetrade and mechanical repairs at Moullela and commercetrade petty commerce19 non-agricultural wage labor and blacksmithing at Galmi Second most farmers on both perimeters are engaged in a range of secondary activities many of which are not agricultural A higher proportion of respondents at Galmi are engaged in secondary activities that do not include agriculture or livestock than at Moullela
CONCLUSION3 AND QUESTIONS FOR FURTHER RESEARCH In summary labor requirements per unit of land for irrigated
agriculture are higher than for rainfed production Insufficient household labor means limiting the area cultivated hiring labor or mobilizing labor through other means The majority of households on both perimeters include two to three potentially active working males which translates into fifty-six to eightyshyfour working days per month This labor is allocated primarily but not entirely to agricultural activities
Labor allocated to agriculture is only partly a function of the total area cultivated The relationship between available male labor and irrigated land area or number of rainfed plots per household was fcund to be negative or weak for the two perimeters
Land is not evenly distributed among sampled farmers this is true particularly of irrigated land in Moullela but also holds for the distribution of the number of rainfed plots With respect to irrigated land there are also differences between the two perimeters on average farmers in Moullela cultivate twice as much irrigated land as in Galmi (but the number of available males per household is roughly similar the perimeters)
19 Petty commerce refers to selling anything from cigarettes and chewing gum to batteries mosquito coils and cansof tomato paste from a small roadside table
39
Furthermore reservoir bottom land (available only in Moullela) is only used by about one-half the sampled farmers
This suggests that the distribution of total area cultivated per household (rainfed and irrigated) on each perimeter is unequal Unequal land distribution implies that the labor necessary to cultivate a set of plots will vary from household to household That is households do not face uniform labor demands The relevance of this issue to water management is that farmers on a perimeter will have different priorities for allocating labor based on differential access to land and labor Coordinating their activities may be problematic
Calculations based on reported labor allocation to various types of plots and estimates of total land area suggest that during the rainy season a greater proportion of labor is allocated to rainfed plots than to irrigated plots That is working irrigated plots is only one part of the overall household livelihood strategy and is balanced against utilization of other land resources The data suggest that the labor per unit area allocated to perimeter cultivation is relatively constant while labor per unit area allocated to rainfed agriculture may vary considerably from household to household
A higher proportion of male labor is allocated to nonshyagricultural activities among Galmi parcel holders than among those from Moullela This may be due in part to the greater opportunities for non-agricultural labor in Galmi which is situated on the main road arAd perhaps also by the smaller average land area held by Galmi households A higher proportion of females in parcel-holding Moullela households participate in agriculture than in Galmi This is primarily a function of the longer history of cotton cultivation in Moullela
Labor migration is more pravalent among Moullela perimeter holders than those from Galmi This is probably due to the
40
relative lack of non-agricultural work for young males in Moullela20
Agriculture is the dominant primary activity among respondents from both perimeters but especially in Moullela Farmers on both perimeters however do engage in a range of additional activities Secondary activities for Galmi parcel holders include a greater proportion of cash-generating occupations outside of agriculture and animal husbandry than for Moullela parcel holders
20 The lower rates of labor migration in Galmi may be related to the proximity of the Nigerian border Men from Galmi can make shorter more frequent trips which are not defined as exode (labor migration) but which would preclude other (agricultural) activities and would represent a source of cash income
41
Chapter Six
INCOME LAND OTHER PRODUCTIVE RESOURCES AND MATERIAL INDICATORS OF POTENTIAL RESOURCE MOBILIZATION
Farmers incomes (cash or in-kind) land and other productive resources such as animals tools and equipment influence agricultural production in general and irrigated agriculture in particular Different levels of income and other resources may translate into differences in investment in fertilizer costly seeds such as onions or labor and consequently into differences in total production
Most irrigation schemes in Nigcr are managed with the idea that farmers will complete tasks according to a uniform schedule In this way an entire crop will receive maximum benefit from any given irrigation by virtue of being at the same stage of growth and water requirement Underlying this model of perimeter operation is the implicit assumption that all farmers on a given perimeter are equally able to mobilize resources for agriculture
For example the expectation that all farmers on a perimeter will weed by a certain date assumes they can either use their own and family labor or hire the necessary labor all within a limited time period Even if we assume an adequate overall labor supply it is not evident that individual farmers can uniformly mobilize labor--whether hired or not
Not all farmers can mobilize the same levels of resources whatever the resource This variability alone may account for apparent performance differences and be a crucial influence on perimeter operation It is therefore important to examine the distribution of resources among farmers associated with a given perimeter Unequal distribution of resources indicates a gap between resource-rich and -poor farmers The wider the gal the more difficult it may be to coordinate activities among a group of farmers Variables indicating differences in potential resource mobilization are discussed in this chapter
42
CASH
The availability of cash and its timing determine farmers ability (1) to hire labor during periods of peak labor demand (2) to purchase adequate inputs when needed and pay the redevance (3) to invest in animals equipment and other productive resources (4) to store a portion of the crop (eg onions) for later sale at a higher price or for consumption rather than selling immediately to pay outstanding debts or bills and (5) to purchase consumption and other goods Payments received in-kind may be sold for cash or retained for consumption or future sale
Farmers generally obtain cash not only from agriculture but by engaging in non-agricultural work They may also receive cash from other household members who earn cash Data on total cash income were not collected but information on participation in cash-generating activities can serve to indicate variability in access to cash--and by logical extension differential resource mobilization potential Cash available from agricultural production is discussed separately
Cash-Generatinq Activities As noted in Chapter Five Moullela and Galmi farmers are
engaged in a variety of activities many of which generate cash faster and with greater regularity and reliability than agriculture Table 61 shows that although most farmers on both perimeters allocate their time to more than one productive activity a higher proportion of respondents from Galmi have primary as well as secondary activities which generate cash directly21 While these data refer only to the respondent the data in Table 62 present information on all household members engaged either full- or part-time in a cash-generating activity
21 Livestock may also be considered a cash-generating activity Animals such as sheep and goats are controlled primarily by women
43
TABLE 61 RESPONDENTS PRIMARY AND SECONDARY ACTIVITY
BY PERIMETER (Percent of Respondents)
PrimaryGALMI MOULLELA
SecondaryGALMI MOULLELA
Agriculture and 77 93 35 58 Livestock (irrig amp rainfed)
Other Cash- 24 6 55 33 Generating
No Secondary - - 11 7 Livelihood
101 99 101 98
Note Percentages do not add up to 100 due to rounding error Source Table 511
TABLE 62 NUMBER OF HOUSEHOLD MEMBERS ENGAGED IN
CASH-GENERATING ACTIVITIES (Number and Percent of Respondents)
Number of Galmi Moullela Household Members Number Percent Number Percent
0 1 2 3 4 5 7
5 6
11 4 6 2 1
14 17 31 12 17
6 3
5 8 6 5 4 1 -
17 28 21 17 14
3
35 100 29 100
Source Survey Data
Table 62 shows that most farm households sampled from both perimeters include at least one member who is engaged in a cashshygenerating activity outside of agriculture and animal husbandry Moullela respondents tend to have fewer cash-generating members per household For each perimeter the range for the number of
44
household members earning cash is wide The presence of one as opposed to six or seven cash-generating household members suggests significant variability in access to cash among households in each perimeter
Variability in the number of out-migrants per household ranges from one to three persons for farmers sampled from both perimeters (Table 510) This suggests another source of variability in access to cash among perimeter households
INCOME FROM LAND The amount of land cultivated by household members helps
determine total agricultural production which is a type of income As noted production may be used for consumption or it may be sold Rainfed land may also be sold or rented to generate income2 2 Perimeter plots cannot be legally rented or sold but farmers may lend all or a part of their plot during the dry season in exchange for redevance payment--which might be considered a form of rent
Cotton onions wheat and corn are the major cash crops grown in the study area Farmers on the Galmi and Moullela perimeters grow some rainfed cotton but cash crop production takes place primarily on the perimeters Millet and sorghum are used primarily for consumption The irrigated area worked by a farmer and his household is an indicator of the volume and value of cash crop production and therefore of income from cash crops23
Data on land distribution (Tables 52 through 55) show considerable variation in the distribution of irrigated land on both perimeters This suggests a wide gap in income from
22 Land may also be lent in exchange for part of the production future reciprocal loans or gifts
23 This assumes that differences in soil types etc are held constant
45
--------------------------------------------------------
---------------------------------------------------------
irrigated agriculture between farmers with the smallest parcels and those with the largest
Data on irrigated and rainfed agricultural production for nine cases from Moullela are shown in Table 63
TABLE 63 SELECTED DATA ON AGRICULTURAL VALUE OF PRODUCTION
FOR NINE MOULLELA FARMERS 1985-1986 AGRICULTURAL YEAR (CFA)
NET VALUE OF PRODUCTION (Cash Crops)House- Perimeter Rainfed Overall hold Total AC Total BC Total
Farmer Size (A) Percent (B) Percent (A+B=C)
1 11 52850 624 31900 376 84750 2 6 71380 725 27100 275 98480 3 3 82815 666 41450 333 124265 4 8 59890 448 73850 552 133740 5 8 124285 841 23550 159 147835 6 10 92550 492 95600 508 188150 7 7 113225 511 108500 489 221725 8 7 389085 787 105000 211 494085 9 14 436150 7055 182750 295 618900
Net Value of Production was calculated by subtracting reportedcash costs of production from total value of production for rainfed and perimeter productionTotal Value of Production figures were in turn calculated bymultiplying reported quantity of production by price at harvestfor each crop and adding the values for each farmer for rainfed and perimeter production Source Farmer Interviews
A gap of 383300 CFA (US $1095) between the lowest and highest net value of all perimeter production and a gap of 534150 CFA ($1526) between the lowest and highest net value of total agricultural production (on and off the perimeter) indicates considerable variability in the income available from agriculture both on and off the perimeters for Moullela farmers
Two general patterns are discernible from the data in Table 63 First in general as the net value of total agricultural
46
production increases the net value of total perimeter production rises as well Second a greater proportion of the net value of production tends to be derived from the perimeter than from rainfed production (there are two exceptions) However it must be emphasized that these data encompass an entire agricultural year and that the dry season production on the perimeter accounts for a significant part of the difference in the net value of production between rainfed and perimeter land
OTHER PRODUCTIVE RESOURCES Draft animals and beasts of burden are also productive
resources Possessing a pair of oxen or a donkey eliminates the need to rent the former for plowing or the latter for transport Other productive resources include tools (hoes shovels etc) and equipment (plows etc) Bicycles can also be considered a productive resource in that they shorten the time it takes to go to a distant field Data on the distribution of draft and transportation animals are shown in Table 64
The table shows that a much higher proportion of farmers own oxen in Moullela than in Galmi However oxen ownership must be used with caution as an indicator of a productive resource for two reasons First the situation in both perimeters has been changing Fifty-one farmers on the Galmi perimeter and twelvefrom Moullela (or six and ten percent of the total number of farmers on each perimeter respectively) were in different stages of receiving pairs of oxen through a credit project financed by the European Development Fund (FED) After the distribution process is completed the proportion of farmers owning oxen on each perimeter will increase However it appears that the relative difference between the perimeters will remain largely unchanged Furthermore while the distribution of the ownership of oxen within a perimeter will be somewhat less unequal differences will remain
47
TABLE 64 DRAFT AND TRANSPORTATION ANIMALS
PERIMETER PARCEL HOLDERS (Number and Percent of Respondents)
Galmi Moullela Number Percent Number Percent
Number of Oxen 0 31 89 12 421 0 0 1 32 4 11 15 52 4 0 0 1 3
Number of Donkeys0 26 74 24 24 1 5 14 4 14 2 4 12 1 3
Number of Horses 0 34 97 27 931 1 3 2 7
Number of Camels 0 35 100 28 97 2 0 0 1 3
Source Survey Data
Second at present oxen distribution at Galmi is a function of the fact that farmers have sold a large number of oxen which had been purchased through the Caisse National de Crddit Agricole(National Agricultural Credit Bank) in many cases before repaying the loans Informants said farmers used the money to buy younger draft animals (which would not have been coded as oxen in this study) to invest in other livestock or to buy food during the drought
Table 64 shows that the majority of farmers on both perimeters do not own horses or camels Ownership of donkeys is slightly more common A greater proportion of farmers at Galmi have donkeys than at Moullela This is probably explained by the opportunities to make money transporting water in large metal drums from the well located at ONAHA headquarters to the main part of town--a distance of three kilometers
48
Table 65 shows the distribution of bicycles among parcelshyholders in the survey sample Nearly a third of the Mcullela respondents have one bicycle in Galmi only 11 percent do None of the farmers in the sample reported owning more than one bicycle
TABLE 65BICYCLE OWNERSHIP PERIMETER PARCEL HOLDERS
(Number and Percent of Respondents)
GMoullela Number Percent Number Percent
Number of Bicycles0 1
31 4
89 11
20 9
69 31
Source Survey Data
The range of the distribution of oxen donkeys horses camels and bicycles is not very wide but this does not signify equal distribution of these resources The mere presence or absence of any one of these is significant since they represent large initial expenditures Recurrent maintenance costs are also associated with the animals In conclusion the data indicate considerable differences in potential resource mobilization among parcel holders within each perimeter Certain differences such as the proportion of oxen ownership appear to be significant between the two perimeters
MATERIAL INDICATORS OF WEALTH AND POTENTIAL RESOURCE MOBILIZATION
The material goods owned by a respondent and his household can serve as indicators of wealth and income and of potential resource mobilization Some of these goods can be considered indirect productive resources such as livestock while others such as radios or metal beds are consumer goods and not productive resources Frequency distributions of these items can be used to identify groups of farmers with different levels of
49
resources and with assumed corresponding differences in the resources they might invest in agricultural production
Data were collected on the number of various material goods possassed by respondents Certain items have been selected for discussion their distributions are presented in Table 66 and Table 67
These tables show that sheep and goats are unevenly distributed among parcel holding households on both perimeters Sheep and goats also represent important economic investments Females provide milk for consumption and sale males are also slaughtered for major religious feasts The distribution range is somewhat wider for Moullela respondents for both types of ruminants The distribution of tables radios metal beds and vehicles is also uneven for the two perimeters Similarly the range between the lowest and highest count of any given item is wider at Moullela than Galmi with the exception of vehicles which were not found among Moullela respondents
TABLE 66DISTRIBUTION OF SHEEP AND GOATS PERIMETER PARCEL HOLDERS (Number and Percent of Respondents)
Galmi Moullela Number Percent Number Percent
Number of Sheep0 21 60 7 24
1 - 2 7 20 7 243 - 4 5 14 7 245 - 6 1 3 3 109 - 12 1 3 3 10
21 - 22 0 0 2 7
Number of Goats 0
1 - 2 3 - 4 5 - 6 7 -9
10 -14 20+
13 5 8 4 4 0 1
37 14 23 11 11 0 3
6 6 3 5 0 6 3
21 21 10 17 0
20 10
Source Survey Data
50
TABLE 67 DISTRIBUTION OF CONSUMER GOODS
(Number and Percent of Respondents)
Galmi Moullela Number Percent Number Percent
Number of Radios 0 26 74 19 661 9 26 10 34
Number of Metal Beds 0 11 31 10 351 15 43 6 212 5 14 6 213 2 6 3 104 2 6 3 106 0 0 1 3
Number of Vehicles 0 34 97 0 03 1 3 0 0
Lumber of Tables 0 28 80 24 721 6 17 4 142 1 3 2 73+ 0 0 2 14
Source Survey Data
While it cannot be automatically assumed that all farmers spend the same proportion of income on material goods their distributions can be taken as indicators of differential levels of potential resource mobilization In other words a farmer who owns a radio several tables and six metal beds probably has more resources to invest in agriculture than one who does not have a radio or a table and has one metal bed This does not necessarily mean that he will invest in agriculture in proportion to his wealth
CONCLUSIONS
51
This chapter opened with the proposition that variability in the level of resources which can be mobilized and invested in agriculture may be an important influence on perimeter operation This variability was documented by examining the distribution of numbers of cash-generating members per respondents household non-agricultural primary and secondary activities irrigated land area value of agricultural production various productive resources and finally selected material goods
Based on the unequal distribution of these variables among parcel holders on each perimeter we can conclude that both Galmi and Moullela have richer and poorer farmers--cultivators who may not all be able to mobilize the same set of resources for production
Establishing this fact however does not explain the extent to which irrigation development has produced or perpetuated these inequalities nor does it explain what the precise impact of these differences is on perimeter management With respect to the first problem it is possible that at Moullela the longer period of perimeter operation has allowed some farmers (probably those with higher initial levels of labor cash and land) to accumulate more resources than others and to take better advantage of the benefits of perimeter production In Galmi however the uneven (but not as wide) distribution of resources does not reflect accumulation allowed by the perimeter because the perimeter is recent The distribution may reflect original differences in cash labor and land It may also reflect ongoing resource accumulation based on activities other than irrigated agriculture
The ways in which patterns of differential access to resources can affect perimeter operation deserve further research Tentative information about this based on informal interviews suggests the following Differential access to cash labor total land area and other resources a~lowu some farmers to complete perimeter tasks sooner and better than others and perhaps to benefit more from irrigation GMPs with
52
larger proportions of farmers who can do this may more effectively coordinate the timing of their activities We can hypothesize that the more homogeneous a group of farmers is with respect to resource distribution (whether at the GMP or perimeter level) the easier it will be to coordinate their agricultural activities
The issue of differentiation versus homogeneity of irrigation units may have important implications for autoshygestion Is self-management more likely to succeed where groups of irrigators have more or less equal access to cash and labor and the corresponding differences in status which accompany such variation Implications of this issue are discussed in Chapter
Eight
Chapter Seven POWER AND PERIMETER MANAGEMENT
The previous two chapters discussed wasa in which the availability of labor land and cash may affect activities on the irrigated perimeters under study But quantifiable resources such as these are not the only influences on perimeter operation and management This chapter presents discussions of selected qualitative influences that affect perimeter management and operation These influences have to do with power relationships of different kinds The first two sections center around the governments power to establish property rights and control over perimeter land The issue is explored through discussions of potential implications of farmers attitudes about property for perimeter management and of the role of village chiefs in land allocation The next three sections focus on power relations between farmers and ONAHA staff This issue is approached in discussions of control over agronomic practices decision making and information flows and ONAHAs role in perimeter management
In addition to affecting present perimeter activities these are issues which along with the resource-based factors presented earlier relate to the problem of auto-gestion or selfshymanagement--at present an important ONAHA policy objective Assuming that self-management is based on some degree of farmer participation in management decisions or at least widespread farmer approval of those actually making decisions then a perimeter where farmers are fairly involved in or pleased with the way activities are managed may have a better chance of attaining self-management This chapter aims to draw out contradictions between the goal of self-management on one hand and present power relations between farmers and local and national authorities and policy on the other
54
LAND TENURE AND PROPERTY RIGHTS
Irrigation development implies a heavy financial investment in infrastructure and a modification of the land surface which is to be put under irrigation It may also imply changes in existing patterns of land tenure and distribution and in definitions of property Both the manner in which these modifications are made in the course of building perimeters and the arrangements set in place to maintain these modifications will affect perimeter management and operation24 There may be contradictions between the government mandate for auto-gestion and some of the institutional changes and arrangements made in the course of irrigation development
The legal code in Niger (and many other countries) gives property rights to irrigation infrastructure over to the government in the case of government andor externally financed irrigation development In Niger rights to and control over irrigated land also rest with the state Thus the state can establish rules concerning property rights to irrigated land These rules presently include the prohibition of land rental and sale on the perimeters Such rules are geared towards preserving initial perimeter land allocation and preventing land concentration and less explicitly towards controlling land use and farm management
There is however a certain dissonance between state control of the land and a farmers sense of property A farmer who has a parcel in an area targeted for irrigation development will lose control over that parcel and in its stead receive a (usually smaller) perimeter plot But in addition to a change in the area he can cultivate the farmer experiences a change in the property rights he can excercise over his land (see Laucoin 197154-55)
24 See Coward (1985) for a discussion of property as a critical factor in water management and El-Kholy (1985) for a discussion on the same topic based on an Egyptian case
55
It may be argued that in the historical absence of private property in this region any analysis of land tenure and property is of minor importance But property cannot be equated with private property alone While land may not have been held as private property (transferable part of a land market etc) it is clear from interviews that farmers in Galmi and Moullela conceived of the parcels over which they had use rights before the perimeters were built as their own land--just as they now consider that they own their rainfed land (Laucoin 197154-55)
This conception changed dramatically with the creation of the perimeter When asked who the irrigated plots belong to most farmers on both perimeters answered the government Only a minority answered that they belonged to whomever they were allocated (see Table VI Appendix 2) Some farmers who gave the first answer explained that the parcel was on loan to them by the government Clearly farmers sense of property has undergone a transformation
A relationship between stable land tenure andor property rights in irrigation systems and productive investments and participation in system management and maintenance has been suggested This may be attributed to the relationship betweeen property rights (or stable tenure) and higher degrees of control over agricultural practices and decisionmaking The implications for self-management are clear Farmers rights to make decisions about how their land is cultivated and used are compromised by state regulations Farmers property rights are limited and we can expect that their interest in self-management may be correspondingly limited2 5
25 This is not to say that perimeter operation will necessarily be compromised but that self-management may be Themore congruent government policy and control over irrigated landis with farmers practices and resource constraints the lessthis will pose a problem for perimeter operation and managementBut farmers differential access to resources must be kept inmind when evaluating policy effectiveness
56
LAND ALLOCATION AND THE ROLE OF VILLAGE CHIEFS In principle land on both perimeters was allocated to all
farmers who had parcels on the area affected by perimeter development including the present command area the reservoir drainage ditches etc In order to accommodate all the farmers with rights to parcels formulas based on family size and area previously held were used to allocate parcels Therefore most farmers received smaller areas than they originally held Several complaints about this process emerged in the course of informal interviews with farmers in the Galmi area
Old property markers were destroyed by bulldozers before surveys were carried out to determine the pre-existing pattern of land distribution This led to difficulties in determining exactly who had how much land before hand Some farmers report that this allowed some individuals to claim they had land in the affected area and thereby gain access to perimeter plots when in fact they did not have such rights There are also farmers who claim to have had land on the affected area but who did not receive parcels It is clear that parcels were allocated on the basis of land tenure surveys conducted AFTER bulldozers had cleared the command area destroying previous plot boundaries It is impossible and perhaps pointless to do anything about this now however in the future land attribution surveys should be conducted BEFORE the bulldozing begins
A few informants noted that village chiefs were not consulted during that period This means that a potentially useful source of information on land holding patterns was bypassed Planners of future parcel attribution procedures might consider utilizing village chiefs and elders as a source of information particularly with respect to land holding data
The relationship between perimeter-related organizations and village chiefs as a local institution deserves further analysis Village chiefs from Moullela and the villages served by the Galmi perimeter are active in perimeter organizations but to varying degrees Some hold office in the management committees (Moullela
57
and Guidan Roro) others hold office on GMP committees Others however either do not hold offices in these organizations or do not have perimeter parcels
Opinions among farmers and chiefs vary with regard to the relationship they consider to be appropriate between chiefs and perimeter activities Some people think village chiefs should play an active role in land and water disputes a role chiefs do play for rainfed land disputes and some chiefs play in reference to the perimeter Others do not consider this a pressing issue
When more than one village is represented in a cooperative and management committee people from some villages may not feel adequately represented In Guidan Miko one of the villages served by the Galmi perimeter farmers suggested that villageshylevel representation in perimeter organizations should be stronger
CROP CHOICE AND AGRONOMIC PRACTICES Irrigation development implies changes in cultivation
practices as well as property relations Some farmers may need to learn new techniques (eg how to irrigate) in other instances they may have to learn to perform a task in a different manner Furthermore choices about cropping patterns are often constrained
Farmers at Moullela and Galmi while generally positive about the benefits of reduced crop failure risk obtained through the perimeters listed several complaints related to agronomic aspects of perimeter management Most farmers interviewed wanted to have more choice with respect to cropping patterns--both in terms of deciding what portion of their parcel to devote to crops planted and in terms of planting additional crops
For example in Galmi the prescribed cropping mix for the 1986 wet season was half cotton and half millet or sorghum Nevertheless at least a dozen farmers planted their plots entirely with millet These farmers were due to receive written warnings from the management committee and the perimeter
58
director (Three warnings are grounds for removal from the perimeter) In another example of farmers interest in increasing cropping choices several farmers interviewed said they would like to enlarge the area planted in beans Farmers also cited okra gourds additional sorghum and millet varieties peanuts and rama2 6 as crops they would like to plant on the perimeter
Reports that ONAHA staff have uprooted illegal crops is evidence of conflict over crop choices Eight out of 15 farmers interviewed from Moullela (53 percent) said they had had crops uprooted at some point in the perimeters seventeen-year history The corresponding figure for Galmi since 1982 was 19 percent (out of 32 farmers) Norman (personal communication) suggests that ONAHA staff uproot crops planted in earth canals or drainage ditches
Dry-planting is an agronomic practice over whose benefits farmers and agronomists appear to disagree Dry-planting can save labor if the rains arrive at the right time Many farmers say they would dry-plant on the perimeters if it were allowed some do anyway
ONAHA staff attach priority to finishing tasks on the perimeter Farmers on both perimeters reported that they began planting and weeding on rainfed plots before doing so on their perimeter parcels In other words farmers begin by dry-planting off the perimeter and then depending on the timing of the rains juggle their work between the perimeter and rainfed plots as best they can This reflects the fact that the timing of planting on rainfed plots is more critical Farmers on both perimeters were aware of the importance attached by ONAHA staff to the timely completion of perimeter tasks although they did not always understand the reasons for this and did not necessarily comply
26 Rama iF the Hausa term The plant can be used to make rope and the leaves may be eaten
59
DECISION MAKING AND THE FLOW OF INFORMATION ONAHA THECOOPERATIVE AND THE MANAGEMENT COMMITTEE
Farmers on both perimeters tend to view decisions about redevance calculations irrigation scheduling timing of planting and other activities on the perimeters as made by the perimeter director and other ONAHA staff and by the management committee However there are some differences between the two perimeters A greater proportion of sampled farmers from Moullela see their perimeter director as making most decisions The comitd de gestion is seen as making most decisions by a greater proportion of sampled farmers from Galmi than from Moullela (see Table VII Appendix 2) These differences may be due to what seems to be a very close working relationship between the Galmi perimeter director and the comitd de gestion It is possible that more Galmi farmers identify the committee and the director as forming a single decision making unit
The following pattern of information flow regarding decisions about what to do and when on the perimeters is reported by ONAHA staff After making a decision the director (or the director and his staff at Galmi) informs the management committee andor GMP heads depending on the type of decision In the case of decisions that need to be communicated to farmers such as when the next irrigation will take place the director tells the GMP heads to pass the information on to farmers and informs the management committee members about the decision If the decision requires further decisions or ratification by the management committee a meeting is held between the committee and ONAHA staff GMP heads either communicate information directly to the group of farmers for which they are responsible or tell a member of their GMP committee to pass on the information In Moullela the director said he told GMP and management committee members about his decisions
Thus information flow is top-down and only reaches farmers indirectly The information flow structure is not entirely effective with respect to communicating information about
60
irrigations Eighty-four percent of farmers sampled on each perimeter said they often did not hear about irrigations in a timely way This suggests that farmers or family members may not always be present during irrigation with consequent negative implications for both crop stress and water efficiency For example if farmers are not present during irrigation they cannot build or remove temporary field channel openings within their plots which means that crops may receive too much or too little water and water may be wasted Effective communication channels must be developed in order to improve water management and yields and to increase farmers participation in management particularly if auto-gestion continues to be a policy objective
ONAHAIS ROLE IN PERIMETER MANAGEMENT A current government policy objective is the eventual
transformation of ONAHA into a technical assistance agency with perimeters managed by their management committees In the interim however ONANA is charged with supervising perimeter activities In practice ONAHA staff are responsible for scheduling and delivering water and supervising the maintenance and repair of the facilities They are also responsible for ensuring that farmers plant specific portions of their parcels with particular crops finish tasks according to schedule follow agricultural practices as prescribed and do not break rules against the sale or rental of perimeter land In short in addition to their role in water delivery and system operation and maintenance ONAHA staff are put in a policing role
However ONAHAs authority to employ available sanctions is limited Major sanctions including removing farmers from a perimeter must be approved by political authorities While ONAHA staff can give written warnings they cannot remove a farmer after issuing three warnings without the consent of the political authorities (eg chef de canton and sous-prefet) This consent is not always forthcoming
61
The fact that ONAHA must follow political directives puts ONAHA staff in an ambiguous position27 In Galmi farmers who have never paid their redevance remain in the perimeter because it is too early farmers have to be given a chance and besides the authorities have not given their approval 28 The point is not that farmers should or should not be removed but rather that ONAHAs ambiguous role with respect to making policy and enforcing existing rules should be defined more clearly
A MODEL OF PERIMETER MANAGEMENT Based on the discussion in the preceding sections a model
of perimeter operation emerges for both Moullela and Galmi in which ONAHA staff try to follow and impose their agencys guidelines for agronomic practices crop rotations committee organization and irrigation management At the same time farmers and their families are busy trying to cultivate their various and sometimes distant plots while they also make a living from other sources Because there is no such thing as an average farmer (Horowitz et al 198323) it is difficult for all farmers to perform uniformly in accordance with agency directives This may have adverse effects on goals of economic and technical efficiency
The day-to-day practice of farming and managing water involves some struggle on all sides a diverse group of farmers ONAHA staff local authorities and extra-local political authorities Certain issues remain a source of debate while arrangements may be reached over others at least for a while In Moullela such arrangements have had a longer time to develop It is not an easy or negotiated give and take nor is it a bitter constant battle
27 An agronomist familiar with the region cites higherpolitical authorities with interfering with ONAHAs managementrole
28 Interview with ONAHA employee
62
Chapter Eight CONCLUSIONS AND RECOMMENDATIONS
Research findings suggest that farmers on the Moullela and Galmi perimeters differ in their potential ability to mobilize resources for agriculture whether irrigated or rainfed The explanation for this lies in their variable access to resources such as labor land cash and other income and livestock Farmers with certain sets of resources will be in a better position to take advantage of irrigation and to complete tasks on the perimeter within ONAHAs guidelines It is worth reflecting on the implications of this variability for perimeter management
If the hypothesis proposed in chapter six is correct that all else being equal a more homogeneous group of farmers leads to smoother and more efficient operation then it follows that policies that discourage differentiation among farmers and promote more even distribution of resources will enhance perimeter management More equal access to resources among farmers on a perimeter can be achieved in a number of ways
The first is through selection the exclusion of outliers (the very rich or poor) from the perimeter Selection may occur either at initial project stages by selecting farmers with a minimum level of resources or during the course of perimeter operation when resource-poor farmers who are unable to keep up redevance payments or other perimeter obligations lose their land This process has occurred to some extent at Moullela When a relatively resource-rich farmer such as a town merchant gains control of irrigated land the selection process increases heterogeneity rather than promoting more equal resource distribution among farmers so that the operation of the perimeter may be negatively affected A number of Galmi area farmers say that this took place on the Galmi perimeter
A second method for achieving a degree of homogeneity on the perimeter is to institute controls which prevent or slow the widening of the gap between rich and poor farmers Government
63
policies banning the sale or rental of perimeter lands are intended to prevent concentration This clearly has some impact in slowing down differentiation in access to irrigated land However the policy does not address the problems of differentiation in access to other resources especially labor and cash Banning land sales does not necessarily affect the forces which lead farmers to sell land so that they may find other means to achieve the same end and the control of large areas of land by a few individuals may become covert Control over the sale of irrigated land does not affect distribution of or differentiation in access to rainfed land which this study has shown to be a major part of the household agricultural system Moreover it does not affect the differential ability of farmers to mobilize resources for cash crop production--an important source of income and therefore of differentiation on the perimeter
Another method for maintaining or promoting homogeneity would be through ongoing redistribution or subsidization of key resouces for resource-poor farmers One alternative would be to make low-cost credit available to poorer farmers29 Money can in turn allow farmers to hire labor or draft animals at key times in the agricultural cycle A second alternative is the provision of employment opportunities during slack periods in the agricultural cycle so that farmers can obtain money which can be invested in agriculture
It would be useful to know how households cultivating unequal areas of land and operating under differing labor and capital constraints mobilize and allocate labor for various kinds of agricultural activities A typology of farmers with shared cash labor and land constraint levels could be used to
29 Poorer farmers can also gain access to scarce cash through moneylenders or their equivalent Information on moneylending was not obtained in this research This form ofgaining access to money is almost always very expensive for the borrower and is more likely to promote differentiation than to ameliorate it
64
analyze the ways in which farmers in different strata accumulate (or fail to accumulate) resources Such research could also determine how different constriints on the availability of labor cash and land affect agricultural production and levels of wellshybeing
The issue of finding a compromise between overall management goals which involve uniformity of operations as a means of achieving technical and economic efficiency and maximizing individual choice is central to perimeter management The former promotes the smooth running of a perimeter the latter allows farmers to best utilize their particular mix of resources The question is how can an irrigation system be effectively managed to increase production while minimizing the top-down control that this technology so often entails
This question suggests a need for continuing research efforts It would be useful to test several models of irrigation scheduling cropping patterns and organizational arrangements These models should be designed to increase the choice of crops available to farmers One approach would be to reserve a portion of a perimeter or of GMP for garden crops which could be planted following the harvest of early millet varieties The effect of intercropping on yields and on labor allocation to different tasks (especially weeding) should be tested to see whether and under what conditions intercropping would save enough labor to make this practice worthwhile even if yields decline somewhat
Changing the size and composition of irrigation units is another possible strategy for applied research For example the viability of GMPs composed of smaller groups of farmers with more uniform access to productive resources could be examined Reducing GMP size may require design changes such as shortening secondary andor tertiary canals Another design change would be to modify canals and control structures in order to increase water capacity so that GMPs at the end of a system could irrigate more quickly This would enhance scheduling flexibility by permitting selected areas to irrigate separately
65
The role and performance of local institutions (eg village chiefs) should also be examined Stronger villageshylevel representation is an issue that deserves further discussion especially with respect to larger perimeters where numerous villages have to coordinate their decisions and activities
A related issue is that of ONAHAs role in perimeter management and the agencys relationship with the management committee If self-management continues to be an objective it will be important to clarify the relationship between farmers the management committee ONLHA staff and local and extra-local political authorities in order to reduce ambiguity over decisionmaking and enforcement powers
In conclusion the fact that farmers with parcels on a given perimeter do not have uniform access to resources needs to be recognized and taken into account in water management and irrigation system design Because of this variability it would be useful to relax assumptions about uniform performance among perimeter farmers An alternative to reducing variability among farmers through compensatory programs (eg credit) would be to manage perimeters in a way that assumes variability rather than uniformity This would imply at a minimum more flexible scheduling selective irrigation wider choices in cropping patterns and cultivation practices and changes in the size and perhaps composition of GMPs or their equivalent
66
APPENDIX I
RESEARCH METHODOLOGY
METHODOLOGY
The data on which this report is based were collected over a thirteen week period ending August 10 1986 Part of this period was devoted to coding and data analysis
The methodoloqy adopted for this research included the following data collection strategies proxy participant observation open-ended individual and group interviews and formal surveys Three field assistants worked in different quartiers of Galmi two in Moullela and one in Guidan Miko a village located between Galmi and Moullela Assistants lived temporarily in the villages in order to gather qualitative data by means of participant-observation Each assistant kept a journal covering topics such as cooperative meetings perimeter activities informal interviews on perimeter management etc
Open-ended group and individual interviews conducted in French or through an interpreter provided a second source of data These interviews were conducted with ONAHA personnel individuals occupying positions of responsibility at the cooperative perimeter and village levels and with perimeter parcel holders
Four survey instruments were developed and administered to varying samples in the course of the research3 0 The first questionnaire (schedules 1 through 5) was designed to collect quantitative data on household composition and labor availabilshyity migration access to land land use possession of household items tools farming equipment and animals and participation in rainfed agriculture end non-agricultural activities
A second questionnaire (schedule 6) was used to gather information from people occupying positions of responsibility in
30 Copies of the questionnaires are available from the Cornell Irrigation Studies Group Cornell University Ithaca New York 14853
67
local cooperatives village institutions and GMPs This instrument includes questions on the number of positions held by the respondent his duties means of attaining posts and perceived advantages and disadvantages associated with the jobs It was administered to a non-random sample of 39 respondents selected by the field assistants and therefore is not treated in the discussion on sampling presented below
The third set of questions was based on three questionnaires drafted by Eric Arnould in January 1986 The questions cover land tenure perimeter management and cooperative organization This instrument was administered to the same sample drawn for the first questionnaire but a subsample was selected for analysis due to time limitations (Table A-3 below shows the sample sizes associated with the different instruments)
A fourth and final set of questions was designed to gather more detailed information about yields production costs land use crop choices changes in womens access to land and selected agronomic practices Due to the length of the questionnaire and to pressing time limitations this instrument was only administered to a subsample of irrigators
SAMPLING The questionnaires were administered to different subshy
samples of an initial sample however due to time constraints their results were only partially coded and analyzed The first questionnaire was administered to an initial stratified random sample consisting of a stratum of irrigators from the Galmi and Moullela perimeters and a stratum of non-irrigators from the villages associated with the perimeters The sample was also stratified on the basis of village residence in order to ensure an adequate representation of the villages associated with the two perimeters
The sample of irrigated parcel holders was randomly drawn from a sampling frame consisting of a list of parcel holders available for each perimeter The sample of individuals without
68
an irrigated perimeter parcel was randomly drawn from lists constructed at the village level by asking village chiefs and other key informants for the names of people without any perimeter parcels3 1 For each village the list of nonshyirrigators was made very long (relative to the actual sample size to be drawn) in an attempt to reduce the bias intruduced by the sampling technique The sampling frame was obtained in this manner due to difficulties in obtaining disaggregated census data
Sample sizes were determined on the basis of projected data collection capacity and an effort to include approximately 20 percent of the irrigators at Moullela and 10 percent at Galmi and a roughly corresponding number of non-irrigators Sampling was not based on calculations of the probability of representativeness of key variables for the population for two reasons A probabilistic sample would have required accurate census data and reasonable estimates of the variance of the phenomena under study for the population Difficulties were encountered in locating recent dissagregated census data for all of the villages and estimates of variance for the variables studied were not available
Table A-1 displays the sample sizes as percent of the number of irrigators associated with each perimeter and as percent of the population of adult males in villages served by the perimeters The latter is based on aggregated census data for 1983 for those villages for which data were available
31 Village chiefs are responsible for collecting taxes and therefore have a reasonably accurate idea of who lives in thevillage and what they do for a living
69
-- ---------------------------------------------------
---------------------------------------------------
TABLE A-i
SAMPLE SIZES AS PERCENT OF IRRIGATORS AND PERCENT OF ADULT MALES RESIDING IN THE AREA
TOTAL SAMPLE of IRRIGA- TOTAL SAMPLE NUMBER of TORS as of as of
PERIMETER IRRIGATORS TOTAL IRRIGATORS MALE POP --------I----------------------------------------------
MOULLELA 124 23 25-35 GALMI 854 8 10
Note The higher figure for total sample as percent of male population for Moullela is based on the male population of Moullela alone The lower range was calculated by adding a quarter of the male population of Guidan Miko to that of Moullela This was done to preserve the proportionality of village membership
70
-------------------------------
---------- ---------------------------------------------------
----------------------------------------------------------------
------------------------------------------------------------
------------------------------------------------------------
---------------------------------------------------------------- ------------- ------------------------------------------
The breakdown of the original sample by village and by irrigatornon-irrigator category is presented in Table A-2 As noted not all of the data gathered from the first questionnaire were analyzed nor were subsequent questionnares administered and analyzed on the basis of the original sample The scope of work was reduced in an attempt to collect AND analyze data within the project time frame
TABLE A-2
ORIGINAL SAMPLE BY PERIMETER AND VILLAGE
PERIMETER MEMBERSHIP
PERIMETER VILLAGE IN OUT TOTAL
MOULLELA Moullela 24 23 47 Guidan Miko 4 0 4 Guidan Sofo 1 0 0
SUB TOTAL 29 23 52
GALMI Moullela 2 0 2 Guidan Miko Toungaand Taganaoua 11 13 24 Galmi Birni 21 15 36 Guidan Doutchi 15 12 27 Guidan Kare 8 9 17 Guidan Roro and Zongo Annissar 14 13 27
SUB TOTAL 69 62 131
OVERALL TOTAL 98 85 183 m ------------------- m-----------------------------shy
71
-----------------------------------------------------------
---- ----------------- --------------------- - ------------
Table A-3 presents the sample sizes for data collected and analyzed with questionnaires 1 3 and 4 (As mentioned earlier the second questionnaire was administered to a separate judgment sample and therefore is not included in this table)
TABLE A-3
SAMPLE SIZES FOR DATA COLLECTED AND ANALYZED FOR QUESTIONNAIRES 1 3 AND 4
BY PERIMETER AND PERIMETER PARCEL HOLDING STATUS (Number of Cases)
QUESTIONNAIRE No 1 No 3 No 4
Collected PERIMETER AND STATUS
Analyzed Coll Analyzed Coll Analyzed
MOULLELA on perimeter off perim
29 23
29 23
29 23
19 0
19 0
15 0
GALMI on perimeter off perim
69 62
35 33
35 33
32 0
32 0
32 0
SUBTOTAL on perimeters off perims
52 131
64 56
64 56
51 0
51 0
47 0
TOTAL 183 120 120 51 51 47
The criterion used to reduce the sample size at each iteration was to maintain the proportion of respondents earning their livelihoods primarily through farming through commerce or a mixture of both fairly close to the proportions found in response to the first questionnaire Responses to questions associated with this criterion were examined for the entire sample before reducing the sample for the first round of analysis Non-perimeter parcel holders were left out of the analysis of the third questionnaire and out of the data collection for the fourth questionnaire because of time
72
constraints and because as a group they were felt to be less central to issues of land tenure cooperative organization and perimeter management The full data set is available and can be analyzed in the future
73
Appendix 2
DATA COLLECTED
Notes to Tables in Appendix 2
IN = Farmers with perimeter parcels OUT = Farmers without perimeter parcels
HE = Household
R = Respondent
74
0
E-4 rn
PMI4 O
4
0
or-a
o
0 0
0 0
0 C
O
0
HI-
0 0w
Irn
_
00
E-
IM
Nrl
w
C
N4
n
z ID
H
75
4 tA
q
o r-n
~OO
IDO
do 400Q
rOD
C4N
M-4t
0
E-4~shy
0
z n
it A
C
ot8o0
mC
4
q
C
tn C
i
1
-4 f-
f-
c
n 00
ooo
raC
Dk
tA 4
r
~c4
tnrf41
C4
1O
nH
-i
Cq
C
-D
a
64
0 o
M ejr~
f3
0 N
0 N
I
f l
D
q0
cq LzeID 4 n
co r r
0 E-
0
b
CP
C
ii
-I tfl f
D
(
C
n
v
0C
NN
C4
t
0
-4H
n
C
a
a
t c~4 c
iiC
M +
VIP
rshy
76
00 0
E-404
S
55S
9
1
C4
C
AC
4O
0
0
r-q
PL
4
C
4
I-0
ca
r-m
LA
C
~ -4O
ac
r-o
E
~0 P
r(
g
tgU
~~e4 IC
4I
-
m f
4O
4b
04 4 ~
0 -
4f- N m
Io
77
Ii1
dP
A
0
1-00
3w
4b4shy
0
0
V~~ 0 r0 q
400
O-4
N m
qt0f
nr-0
4Nn
78
0
N
Lntn
t ni
A
g-
4u
4r-o
N40
dguero44
E-4O
~
4-r-O
0 01
0 -4
-4 0
0
-4 1
I-Ie-40 q
H
H4m
e
4M
r C
i)
ii4 3P
0cpound
C
0 54
4 00
v 470
N
-O
tn
in in in
o r-Jiflifl
00
E-
q -4
u-4
fl4 q
H
do Itr
iC
iCi 0 q
0
licq
9
I~qoo a
a m
(n v
04oo z
o0 ~
o 0C
oo140
s4dP ~O
~o 44
~~
o
q
EEshy0
43 E
-4 d
0 0C
0
0
z~
80
(n C4
OD
a
Sn
5
t tA
0 ta
E44 4
b _0
L
H
E-
0
tcR~c 4
A
4q
4 V
C
)
~o
e00v0
an
0 P
f-4
n0-4C
n4
N (q
0V
C110-
4
I8
t-v(I qrN
r -
00
w-o
MM
Mo
dP O
iC
Edee
Xaa
4
Sn
c4
o
rntnL
0
04
mP
oq
a
M
OC
Tin
r
L
4
coPlc4~
dV~
i
N~~0
fn0~i w
0
nItc
E-
0r~j
of
0ciov0
j
Ooshy
-4
82
0
~~
-4-~-O
04
0
-IDc
o tn
0 0 000
z d
N
Ce4
CI
4 I
0
E-m
4C
4C
dOM
Eshy0
tq8L
16 o
t-OD
CD
r-V
o ei1
In
~ a
shy
0
udpaj
in
E400
dp
N
F
okooo~
I
0 1 1
c4 tLn
oo0
00 ro tor-
40
0 E
--b
R0
z O0 -4
( ~
c Ln Ici
-1
P
0 Pu4 C
ru
1
4
0r
84
qr-1
q w
w w
r-N
O
rm
m
q
09d
E
~~ v4rr ~
~ ~~
4-q004A0N
N044
ON
-4 0O
O
M M
tt-4
0 -
40
-4 0 40r0
~0
-4D
0 Il
r~-aOOr4-
Cq
z
dPL
4 ad N
0 0
00 V
Or 0
4a L
00000 0Y
V4
4
E-4
0I4
0A
0C
40
E-N
fl
f-q
4
4
C4
r4m
dP I0 ri
0qc
0 w~40 D
-Iqj r 00
0q
t0
e4I 0
P404
0
0
0 -4
N
m
0 r-4
85
dore~ r-rtn-d
c4 A
oo -4
0 OP 00CO
40-4
0
0 0 0lC
E-4
a a (
(4
~
e0-4
In O
~
LC
qU
)A
o
o
o 4H
0 o
l
0 ~
l V
0VC
)Hr4
-A0
H1
ob 8
c
N
0 00
0H
0
q Ci4 cq
0
qa~qmmmm
rvrodP
otnq44
1 0ro
en4004r4c 0~~~I eq
aI i
It0 dP
-
0n~wo86
I e V
i a S1ERFD MED
Ce KUMJREN IiRIrtUH BkRi(S) Ell IPfrUfl
(site of repxx~mts by ruitw of Srcwis)
Medid of ~ Ei4EGD HLXIIA Total (DW52)(W32) (WJ19) a3aisitim Of _ _ __ _ _ _ _ _-r~s _ __
liuta cf N ampZbwtr ofa Lzer of N
Inherited 0 4 13 2 I 6 12
the bither 1 27 as 13 63 40 78
2 1 3 4 21 5 10
Irite xvxfi 0 32 1M 19 95 51 96
RrzchdbI 0 30 94 19 100 49 96
1 2 6 - - 2 4
Givenit 0 31 97 is 95 4 96
1 1 31 1 53 2 49
padld0 3) 94 19 11) 49 96 by reqnmt
1 2 63 - - 2 4
Fated ty 0 32 IM0 19 10)0 51 ID
Ampired 0 32 100 14 74 46 90 after another
s 1 shy - 5 26 5 10
Nte Etra s lary not mrd tp t 100 die to mxding
3axm SxYW cda
87
TABLE VI-I
OMMENCE OF DISPL1ES
(Has respondent ever had a land or water dispute)
Galmi (N = 32) Moullela (N = 19) Both (N -=
Number Number Number Yes 825-- 10 -T3- Id-- 3
No 24 75 9 47 33 65
Source Survey data
TABLE VI-2
TYPE OF PAEM INVOLVED IN DISPLE
Galmi (N = 8) oullella (N I0) Both (N = 18)
Number Number Number
Perimeshyter 1 12 9 90 10 56
Rainfed 7 88 1 10 8 44
Source Survey data
TABLE VI-3
TYPE Oi CONLICT
Galmi (N = 8 0ullela (N = 1) Both (04 is1)
Number Number iumber
Irrigationout of turn 1 12 4 40 5 28
Boundarydispite 7 88 6 60 13 72
Source Survey data
88
TABLE VI-4
CONFLICT RESOLUTION LEVEL FOR ALL CONFLICTS
GALMI (N =8) MULLELIA (N=10) BOTH (N=18)
Number Number Number
With the Farmers Involved 3 38 5 50 8 44
Farmers and GMP Head 0 0 1 10 1 6
With Local Authorities (Village Chief Conseil- 2 25 1 10 3 17 ler Villageois)
With Perimeter Director 0 0 3 30 3 17
Higher Political 1 12 0 0 1 6 Authorities
Not Resolved 2 25 0 0 2 11
Source Survey Data NE Percentages may not add to 100 due to rounding error
89
VARIABLES AND CArEGORIES
ho do perim plots belong to
NA1 - Govnt 2 - Farmers farming 3 -(HA 4 -Other
Total
Who advises the Comit4 de Gestion
NA6 1 - Perim director 2 - Farmers 3 - Local authorities 4 - Higher local auth 5 - Agents amp director 6 - ONAIA Tahoua 9 - Donnt know
Total
Who calcul redev
NA1 -Perim director 2 - Agents amp director 3 - CG 4 - Dir Com Agents 5 - GMP heads amp dir 6 - GMP heads 7 --Farmers 8 - Taboua offioe
9 - Dont know
Total
TABLE VII -
PERIWrFR MANMA4E1r AND OMnIZATIO (PARCEL HOLDERS)
GALM (0=32) MOULLE[A (N=19) BOTH (N=51)-
5 156 3 158 8 15722 693 14 737 365 156 2 105 7
706 137
0 0 0 0 0 0 0 0 0 0 0 0
32 100 19 100 51 100
2 63 1 53 3 5914 438 14 737 28 5490 0 0 0 0 0 5 156 0 0 5 980 0 0 0 0 0 7 219 1 53 8 1572 63 3 158 5 98 2 63 0 0 2 39
32 100 19 100 51 100
1 31 0 0 1 205 156 II 579 16 3143 94 1 53 4 78
10 313 1 53 11 2167 219 1 53 8 157 0 0 0 0 0 00 0 0 0 0 00 0 0 0 0 0 2 63 4 211 6 118 4 125 1 53 5 98
32 100 19 I00 51 I00
90
TABLE VII -2
PERIMETER MANAGaEE AND ORGANIZATION
(PAICEL iicL~ae)
VARIABLES AND
CATEW~RIES GALt4I (14=32) L4JLLEIA (N=19) 8301H (N=51)
Who decides when to plant
1 31 0 0 1 201 2 63 17 895 19 373 2 2 63 1 53 3 59 3 16 500 0 0 16 314 4 7 219 1 53 8 157 5 0 0 0 0 0 0 6 0 0 0 0 0 0 7 0 0 0 0 0 08 2 63 0 0 2 399 2 63 0 0 2 39
Total 32 100 19 100 51 100
Who decides when to irrigate
NA 1 31 0 0 1 20 1 8 250 17 895 25 490 2 2 63 0 0 2 39 3 14 438 2 105 16 314 4 6 189 0 0 6 118 5 0 0 0 0 0 06 0 0 0 0 0 0 7 0 0 0 0 0 0 8 0 0 0 0 0 0 9 1 31 0 0 1 20
Total 32 100 19 100 51 100
91
TABLE VII -3
PmqErR mmat wr AaD omizAaio
VARIABLES AND CATE)GORIES
Who decides who gets ox
NA 1 2 3 4 5 6 7 8 9
Total
Does R attend ccnite coop meetings
NA-no perim parcels 1 - yes 2 - no 3 -sometimes
Total
Relation to GMP head
NA 1 = same family 2 - same quartier 3 = not related
Total
GALs4
1 0 0
22 1 0 0 0 0 8
32
2 13 14 3
32
1 15 11 5
32
(PARCEL OLD RS)
(N=32) 14OULLELA (N=19) ksra (L4=51)
31 0 0 1 20 0 2 105 2 39 0 0 0 0 0 693 12 632 34 667 31 1 53 2 39 0 0 0 0 0 0 2 105 2 39 0 2 105 2 39 0 0 0 0 0 250 0 0 8 157
100 19 100 51 100
63 0 0 2 39 406 18 947 31 608 438 1 53 15 294 94 0 0 3 59
100 19 100 51 100
31 3 158 4 78 469 10 526 25 490 344 2 105 13 255 156 4 211 9 176
100 19 100 51 10)
92
TABLE VII - 4
pEIMffER 1 3 -1Er AND ORGANIZATION
(PARCEL dOLDEiRS)
VARAB[Eamp AND GAL141 (N~=32) 140LULA (Ni=19) WWft (N=F51)
CATEGO0RIES
Has R received warning from GKP head
7u43 1581 31 5 983 1582 63 8241 yes 13 684 42
= 29 906 2 no
51 10019 10032 100Total
Who tells to clean the canals
3 590 03 94 9 176NA 7 3682 63 - Perim director 32 6271 9 47423 719
2 - GMP head 0 0 1 20 1 31
3 - Other farmers 0 2 39 2 63
No one just does 0
4 784 - 3 1581 31 5-Other
51 10019 10032 100Total
How does R pay redevanCe 2 391 531 31
NA 18 947 31 608 13 406Cash crop sales1 - 6 1180 06 189
Cash amp food crops 2 392 - 0 02 633 - Commerce amp crops 0 0 3 59
3 944 - Commerce rev 0 0 2 39
2 635 - Migration income 0 0 1 20
1 31 6 - Animal sales 2 63 0 0 2 39 7-Sala-y 1 200 01 318 - Skill-inc crops 0 0 1 20
1 319-From relative
51 10019 10032 100Total
93
TALE VII - 5
PER1~rER pound4AGEMENr AND ORANIZATION
(PAXM OLD~ERS)
VARIABLES AND CATCBORIES GAL4I (N=32) MOULLEEA (N=19)
What day does R irrig
NA 2 63 2 105 1 2 3
14 11
2
438 344 63
2 6 4
105 326 216
4 6 7+ 8 OK others do it
1 0 0 1
31 0 0 31
3 0 0 0
158 0 0 0
9 doesnt know 0 0 0 0
Total 100 19 100 51
Who notifies R of irrigNA 2 63 2 105
1 - perim director 2 63 6 326 2 - GMP head Cooppres 21 656 7 368 3 - other farmers 2 63 0 0 4 - no oneknows sched 4 125 4 211 5 - tam-tam 1 31 0 0
Total 32 100 19 1000
Does R hear about irr in time
NA 2 63 2 105 1 = yes 3 94 1 53 2 = no 27 844 16 842
Total 32 100 19 100
Lack of water NA 2 6 2 105
1 - not enough 4 12 3 1582 - enough 20 63 11 579 3 - sometimes insuff 5 16 3 1588 - OK other irrig 1 3 0 09 - doesnt know 0 0 0 0
Total 32 100 19 100
94
aHnI (N=51)
4 78 16 314 17 333 6 11d 4 78 0 0 0 0 1 20 0 0
100
4 78 8 157
28 549 2 157 8 157 1 20
51 00
4 78 4 78
43 843
51 100
4 78 7 137
31 608 8 157 1 20 0 0
51 100
BIBLIOGRAPHY
Arnould Eric 1986 Maggia Valley Systems Report of the Consulting
Anthropologist WMS-II Project Cornell Universityand USAID Niger
Briend Roger1986 Rapport Annuel Campagne Hivernal 1985 Campagne Saison
S~che 198586 Niger ONAHA
Chayanov AV 1966 Theory of Peasant Economy ed D Thorner B Kerblay
and R Smith Homewood Illinois Richard D Irwin Inc
Coward E Walter 1985 Property in Action The Property Factor in Irrigation
Development Khon Kaen University Thailand Paperpresented at Conference at Khon Kaen University
El-Kholy Heba Aziz 1985 Property Relations and Irrigation Organizations A Case
Study of Water Lifting Devices in an Egyptian Village inthe Delta MS thesis Ithaca New York Cornell University
GERSAR 1981 Amdnagement Hydroagricole de la Plaine de Galmi
Projet Etudes Preliminaires Niger ONAHA
Horowitz M 1983 Niger A Social and Institutional Profile New York
Institute for Development Anthropology
Laucoin Guy1971 Vers lautogestion des am~nagem3nts au Niger
Developpement ot Civilisations no 4454-62
1973 La gestion des amdnagements hydro-agricoles au NigerDeveloppement et Civilisations no 5121-31
Norman W Ray1986 Gestion de 1eau dans lamdnagement hydro-agricole de
Moullela Une presentation des donn6es de la campagne de 1985 Paper prepared for the Office National dAmdnagements Hydro-Agricoles Rdpublique du NigerSpecial Study USAIDWMS-II Project
1987 Developed and Traditional Small-Scale Irrigation inNiger West Africa PhD dissertation draft IthacaNew York Cornell University
95
Rdpublique du Niger1985 Evaluation du temps de travail des paysans sur
quelques amdnagements hydro-agricoles du Niger Niger Ministere du Plan
SOGETHA 1968 Etude Agro-Economique ds Petits Pdrim~tres en
Exploitation dans la Vallde de la Maggia Mission 1967 Grenoble France SOGETHA
1970 Etude Agro-Economique des Petits Pdrim~tres en Exploitation dans la Vallde de la Maggia Mission 1969--Rapport Final Grenoble France SOGETHA
United States Agency for International Development1984 Niger Irrigation Subsector Assessment Volumes One and
Two Niger USAID
1986 Applied Irrigation Research and Coordination (AIRC)Project Identification Paper USAIDNiger
Wells John Craig1985 Sedimentation of Small Irrigation Reservoirs in the
Ader Doutchi Maggia WMS-II Project Trip ReportIthaca New York Cornell University
96

----------------------------------------------------
------------------------------------------------------
------------------------------------------------------
TABLE 21 BREAKDOWN OF REDEVANCE BY LINE ITEM
PER HECTARE of WET SEASON SORGHUM AND COTTON BY PERIMETER 1985 (CFA)
ITEM MOULLELA GALMI
Construction repairs 15255 11000 heavy works Agricultural inputs (fertilizer) 12025 9000 Vehicle depreciation - 2000 Vehicle operating costs - 3200 Office operation 500 Support to ONAHA 3000 3000 Cooperative revolving funds 2000 1500 Turnout operators fees - 300
Total 32280 30500
Source Briend 1986
n theory the management committee and ONAHA staff determine cropping patterns In practice cropping patterns are conditioned by a combination of the governments policy of promoting food production aid farmers wishes to grow sorghum millet beans and other crops In addition to planting a portion of their parcel in food crops farmers must plant cash crops (ie onions cotton or wheat) in order to ensure payment of the redevance Cotton is sold to a French company under terms of an agreement with the government of Niger
The GMP Perimeters are divided into organizational units called
Groupements Mutualistes de Production (GMP or Mutual Production Groups) GMPs are composed of farmers whose parcels are located on a single secondary canal each group has a president secretary and treasurer The GMP president is usually responsible for collecting the redevance from farmers andor from
7
his treasurer and turning it over to the management committee GMPs are the last link in the long institutional chain that
extends from the Ministry of Agriculture at the state level down through ONAHA to individual farmers (Figure 3) Nigerien farmers lives are also touched by other local groups and by representatives of national ocganizations and political authorities In principle such institutional chains should provide for a two-way channel of communication between the central government and the population However as Ware (USAID 1984) and Arnould (1986) note the structure provides for the top-down transmission of state directives rather than mass
participation
8
MA
P 1
NIG
ER
AND
STUD
Y
AR
EA
co6
IZ
shyez
9
L
Chapter Three
THE RESEARCH AREA GALMI AND MOULLELA
This section describes the two perimeters where research was conducted and points out their similarities and differences It also provides background for the social and economic data and issues raised in oubsequent sections4
THE SETTING Galmi perimeter is located just off the paved Route National
that runs east-west through the south of Niger connecting Niamey with Znder Annual rainfall in the area averages about 400 mm The perimeter is within one or two kilometers of several villages varying proportions of whose inhabitants have irrigated parcels Galmi Birni Guidan Kare and Guidan Doutchi which are right on the paved road appear to be a single village5
Together they represent an important economic center for the area On market days Galmi is crowded with villagers from throughout the region At the onion harvests and periodically thereafter truckers stop to buy sacks of onions which are sold in Togo Benin and the Ivory Coast Locally hired trucks also take part in the onion trade Onions have been grown in the area for well over fifty years the violet de Galmi (a local variety) is widely known for Its flavor and storage potential
The largest numbers of irrigated parcel holders on the Galmi perimeter come from these three villages and from Guidan Miko and Guidan Roro which are a few kilometers off the highway to the north and northeast Smaller numbers of parcel holders come
4 The selection of Moullela and Galmi perimeters asresearch sites was conditioned by the terms of reference The decision was based on the desirability of gathering additional social and economic data on perimeters for which hydrological and engineering data as well as some socioeconomic data had been collected by Ray Norman
5 These villages will be collectively referred to a Galmi in the remainder of the report
10
from a few other small villages in the area A few farmers with parcels in the Galmi perimeter live in Moullela which is about 6 km north of Galmi along a dirt road
The Moullela perimeter is located just north of the village of Moullela Parcel holders there come primarily from Moullela although a number of Guidan Miko residents also have parcels on the Moullela perimeter A small number of farmers have parcels on both perimeters In contrast to Galmi the village of Moullela has no market nor does it have a school Moullela residents go to Galmi for the market but not for schooling
THE PERIMETERS Table 31 presents selected descriptive data for the
Moullela and Galmi systems Moullela has a smaller command area and fewer parcel holders than Galmi Given the difference in size it is not surprising that the perimeters have different numbers of ONAHA staff At Moullela the perimeter director is the only ONAHA agent in residence At Galmi however there are two training and extension agents and an engineering and maintenance agent in addition to the perimeter director In addition a UNC paid accountantmanager works at the cooperative
Both Moullela and Galmi are gravity flow systems that use water stored in dams for supplemental rainy season and full dry season irrigation In Moullela irrigation water reaches individual fields by passing through control structures into field channels In Galmi siphons are used to draw water from earthen canals into field channels
The cropping patterns on the two perimeters are similar at present During the 1986 rainy season farmers grew cotton on one half of their parcels and millet or sorghum on the other half The grain to cotton ratio at Moullela depends on a crop rotation pattern that has been in existence for a number of years but which was modified slightly a few years ago Now half of each
11
TABLE 31 SELECTED DESCRIPTIVE DATA FOR MOULLELA AND
GALMI PERIMETERS
Perimeter ITEM MOULLELA GALMI
Date of First 1967 1983 - 1984Operation (Dry Season)
Hectares IrrigatedWet Season 1985 626 242 Dry Season 1985-86 11 241 Reservoir Bottom 20 NA
Number of Farmers 124 854
Main CropsWet Season 1984 Sorghum Millet Sorghum Millet
Cotton Beans Beans Dry Season 1985-86 Onions Corn Onions Wheat
CornReservoir Bottom Onions Wheat Corn
Sweet Potatoes NA Tomatoes Okra Squash
Wet Season 1986 Sorghum Millet Sorghum Millet Cotton Cotton
Redevance (CFAha)Wet Season 1985 32280 30500Dry Season 1985-86 15170 22000
Percent Recovery of 100 67 Redevance (through end of wet season 1985)
Source Interviews and Roger Briend (personal cormunication)NA Not Applicable
parcel is planted in grains rather than only a third Cotton was grown at Galmi for the first time in 1986 Farmers could choose between sorghum and millet for the other half of their parcels In previous years the main wet season crops were sorghum and millet Onions wheat and corn are the dry season crops on both perimeters
12
Moullela is an older perimeter than Galmi (Table 31) Siltation is a problem at Moullela this is also true of other small dams in the Maggia Valley (Wells 1985) Although flood recession agriculture is practiced on most of the reservoir bottom the command area is drastically reduced in the dry season There is some question as to how many more years dry season cropping will be viable at Moullela (Briend personal communication) Water availability and siltation do not presently pose a problem at Galmi 6
A certain amount of temporary parcel reallocation takes place at Moullela during the dry season to accommodate parcel holders who are willing and able to cultivate within the reduced command area Some farmers leave their parcels in order to work in Nigeria but the majority remain High onion seed prices may prevent some farmers from growing onions A few non parcelshyholding farmers are allowed to plant on the perimeter during the dry season Arrangements are made either by farmers and approved by the perimeter director or through the perimeter director andor the management committee Non-perimeter parcel holders who farm on the perimeter are charged their proportional (per hectare) share of the redevance
Parcel changes also take place in Galmi but in a different manner and for different reasons Non-perimeter holders are allowed to farm on the perimeter in the dry season for the stated purpose (according to ONAHA staff) of increasing access to irrigated land High labor requirements for onion cultivation are another reason for reducing plot size Farmers with more than one parcel have to give up part of their parcels to other farmers Besides the officially recorded dry-season parcel reassignments some farmers make private arrangements In some
6 The exception to this generalization about Galmi is that there are times when the tail of the system (GMP 25) does not receive enough water during the dry season This is due to asecondary canal which should carry 40 lps according to designbut which for some reason was installed as a 30 lps canal
13
instances this leads to problems in redevance recovery Under officially recorded transactions each party is
responsible for his proportional share of the redevance although there is some ambiguity over who is supposed to give it to the GMP head Under private arrangements however the parcel holder is responsible for the redevance whether or not he receives it from the other farmer
The two perimeters have different rates of redevance recovery (Table 31) Some Galmi farmers have not paid their redevance since the establishment of the perimeter At Moullela payment is not considered a problem
Further differences in farmer behavior on the perimeters were noted at the beginning of the 1986 rainy season In general agricultural tasks were completed earlier and more promptly at Moullela The first rains did reach Moullela before Galmi which would explain the fact that planting weeding and successive tasks would take place later at Galmi A relative shortage of oxen and plows in Galmi partially explains observed delays in plowing there Irrigation furrows were reinforced sooner and more adequately at Moullela and canals were cleaned in anticipation of irrigation Galmi canals remained full of vegetative growth and irrigation furrows were only partially reinforced at the beginning of August
Farmers on both perimeters complain about others irrigating out of turn or excessively but it was difficult to assess these claims given the time frame of the field work Water scarcity is a problem on two of Galmis GMPs this was corroborated by numerous individuals including ONAHA staff who say that this problem is a design fault rather than a people problem (see footnote no6)
Some Moullela farmers complain about a mass expulsion of farmers that took place in 1974 This sanction was supposed to have been leveled at farmers who did not pay their redevance A few say that certain individuals did pay but lost their parcels anyway as a result of actions taken by individuals who
14
subsequently ended up with land that had been farmed by the excluded farmers Moullela farmers did not complain about the process of original parcel allocation Such complaints were heard in the villages served by the Galmi perimeter (see Chapter Seven)7
One can attribute some differences between tha perimeters to the larger number of irrigators at Galmi and to the fact that years of experience may have led to local arrangements that allow somewhat smoother operation at Moullela Clearly both perimeters are operating however auto-gestion is not fully realized8
Before examining some of the socioeconomic factors that may affect perimeter management a brief description of the agricultural cycle on the perimeters is presented in order to provide a context for the subsequent discussion
7 Complaints about land allocation on perimeters have been recorded in other areas See for example Republique du Niger(198518)
8 See Laucoin (1971 1973) for an early discussion of factors constraining auto-gestion
15
Chapter Four
THE AGRICULTURAL CYCLE
CROPS The agricultural cycle includes two cropping seasons
During the rainy season faimers grow rainfed millet sorghum cotton and beans outside the perimeter Millet sorghum and cotton are grown with supplemental irrigation on the perimeters Some farmers grow mangos lemons and root fiber and vegetable plants in enclosed gardens To irrigate they draw water from dug wells with a calabash Farmers who can afford onion seeds and who can mobilize the necessary labor grow wet season onions outside the perimeters
During the dry season farmers grow onions and wheat or corn on the perimeters Sweet potatoes okra squash and beans are grown on the exposed bottom of the Moullela reservoir Onions fruit trees and some vegetables are grown with calabash irrigation in gardens A second crop is not possible on rainfed parcels with the exception of a limited amount of very moist fadama land9
AGRICULTURAL TASKS SEQUENCE DURATION AND PEAK LABOR REQUIREMENTS
This section presents a description of the agricultural calendar with reference to labor requirements It shows that the period of planting and weeding from mid-June through August is a time of concentrated labor requirement Periods of high labor demand on the perimeter may conflict with other household labor needs
Farmers with irrigated parcels must coordinate work on their rainfed parcels with perimeter tasks which follow a schedule fixed by the perimeter directors Certain tasks which are not necessary on rainfed land such as plowing and furrowing must be
9 Fadama land refers to moist alluvial soil in valleyfloors with a high water table
16
performed on the perimeter Tables 41 and 4P present illustrative interview data on time 6pent on selected activities
TABLE 41 REPORTED LABOR ALLOCATION BY TASK ON IRRIGATED LAND
SELECTED CASES FROM GALMI AND MOULLELA (in Worker Days)
TYPE OF IRRIGATED PARCEL CROP(S) AND AREA Wet Season Dry Season
Sorghum and Cotton Wheat Onions Task Beans 05 ha 05 ha 0125 ha 0125 ha
Clearing Soil 3 NA 3 3Plowing 3 NA NA NAPlanting 9 4 3 18First Weeding 9 14 5 18Second Weeding 6 19 0 10 (or further weeding)Irrigation 1 NA (8 for both)Harvest 20 59 8 18Tying (Sorghum) 4 0 0 0 TOTAL 55 96 23 71 Working daysha 110 192 184 568
NA=Not Available Source Farmer Interviews
TABLE 42 REPORTED LABOR ALLOCATION BY PLOT AND SOIL TYPE
FOR SELECTED TASKS AND CASES FROM GALMI AND MOULLELA (in Worker Days)
Type and Area Plot Per Hectareof Parcel Weeding(s) Harvest Total Total
Rainfed Millet 26 16 42 28 15 ha
Rainfed Millet 8 5 13 26 05 ha
Rainfed Millet on 8 2 10 20 Sandy Soil 05 ha
Rainfed Millet on 15 3 18 72 Fadama Soil 025 ha
Irrigated Millet 16 2610 104 025 ha
Source Farmer Interviews
17
Labor allocation reported by farmers differs by crop on irrigated parcels (Table 41) and for a given crop depending on soil type (Table 42) It must be stressed that these data come from interviews with selected farmers and refer to their specific conditions the information is meant to be illustrative The irrigation time for sorghum and cotton may be closer to 3 to 4 worker daysha (see Norman 1987) Norman (personal communication) suggests that the total worker daysha for sorghum is slightly overestimated the cotton figwe underestimated while dry-season onions take 350 to 400 worker daysha The irrigation time for sorghum and cotton may be closer to 3 to 4 daysha per wet season A narrative overview of the sequence and timing of major tasks will further clarify the significance of labor requirements
The Rainy Season
Preparation for the rainy season begins in June when farmers clear rainfed parcels and dry-plant sorghum and millet in anticipation of the first rains Dry-planting refers to the practice of planting seeds in dry soil just before the beginning of the expected rainy season If the rains are insufficient or late the seeds may not all germinate if there is flooding seeds may rot 10 Thus selective re-planting is often necessary Beans are often planted between the rows of rainfed millet or sorghum In Moullela farmers plow rainfed cotton plots In general however rainfed land is not plowed
According to ONAHA directives parcels on the perimeters must be cleared and plowed Farmers who do not own oxen and plows need to pay those who do to get the work done Due to a shortage of oxen in Galmi plowing continued into mid July 1986 in some parts of the perimeter After plowing farmers wait for the first rains to plant Dry-planting on the perimeters is
10 Most farmers interviewed at Moullela and Galmi reported treating their millet and sorghum seeds with fungicide to preventmold
18
discouraged by ONAHA agents who argue that too much seed is lost this way Many farmers on both perimeters say they would prefer to dry-plant without plowing on the perimeter to reduce costs and labor requirements
This is clearly a period of high labor demand particularly for farmers with both rainfed lands and perimeter parcels and farmers with larger total holdings since work must be accomplished everywhere at once Galmi and Moullela farmers found it difficult to finish their planting both on their outside parcels and on the perimeter within the time frame recommended by ONAHA personnel Some farmers reported hiring labor in order to meet the perimeter directors schedule these farmers must have had access to cash to pay wages
Labor requirements remain high through the weeding period which extends from July to September depending on the timing of planting and rains Millet and sorghum are weeded at least twice both on and off the perimeters Beans are weeded after the cereal crops Cotton must be thinned and weeded Yields are highly responsive to weeding
The rainy season harvest is also a period of high labor demand but farmers claimed it was less critical than planting and weeding The millet and sorghum harvest begins in mid- to late August continuing through late October Certain varieties planted on rainfed land are harvested later Beans are harvested for about a six week period starting in mid-September Cotton is harvested four to six times between October and mid-December The different growing periods associated with each crop together with staggered planting dates and microclimatic differences between parcels may allow the harvest to take place with somewhat less pressure than planting and weeding Farmers who plant wet season onions however face additional labor requirements
Changes in the cost of hired labor reflect periods of peak labor requirements Farmers in Galmi reported that laborers were being paid 1500 CFA per day for weeding during the 1986 wet season They noted that the price would go down to 1000 CFA per
19
day for harvesting and packing Labor is more expensive in Galmi than in Moulella where day laborers typically make 500 CFA plus two meals (worth about 150 CFA)ll
Farmers who can afford to hire labor must balance increased labor costs against anticipated yields Farmers without the cash to hire labor are largely constrained by household labor availability12 Land-short villagers may obtain substantial income during the weeding period by hiring themselves out13
The Dry Season Soil preparation for the dry season begins as early as
October following the harvest After clearing and plowing farmers make beds with raised edges for their onion plants they then plant wheat or corn and onions Onions are transplanted from nursery plots begun over a month earlier Some farmers have their own nurseries others buy the seedlings Either way onions require considerable labor and cash investments According to one estimate one hectare of irrigated onions requires 660 person-days of labor (GERSAR 1981) Galmi farmers usually plant 0125 ha (half a parcel) of onions which would require 825 person-days following the GERSAR estimates
After transplanting onions must be weeded Wheat is also weeded during this period Harvesting onions includes several
11 During the period of research the exchange rate averaged 360 Francs CFA per $100 US
12 Labor may also be mobilized through gavaa a traditional form of community labor organization In addition close relatives and friends frequently exchange labor However it hasbeen suggested (USAID 1984) that these forms of labor mobilization occur more frequently on rainfed land than onirrigated parcels Cases of gaaa and labor exchanges were observed on the perimeters during field work This is an issuethat deserves further study in order to determine whether there are systematic differences in labor mobilization patterns between rainfed and irrigated land
13 This fact is often ignored by economists and developmentplanners in discussions about the benefits of introducing laborshysaving technologies
20
operations The onions are picked and the leaves are cut wrapped into bunches and dried Most farmers sell their onions immediately after the harvest
Farmers without pressing cash needs and who have access to storage facilities can store onions and sell them later on at prices of up to ten times the price at harvest Onions harvested before maturity cannot be stored as long as fully matured ones which may be stored from five to seven months Briend (personal communication) notes that many farmers on both perimeters harvest
onions before full maturity This may be due to labor constraints experienced at the wheat and onion harvest Harvesting before maturity is probably more common among farmers who sell their onions immediately to meet cash needs
The dry season harvest is generally over by the end of March During April and early May farmers repair their tools and homes And of course they continue to perform the various offshyfarm activities they have engaged in throughout the year In late May the cycle begins again
21
Chapter Five LABOR AND PERIMETER MANAGEMENT AND OPERATION
irrigation perimeter management and operation is affected by hydrological engineering climatological agronomic economic sociological and cultural factors Sociological analysis of irrigation systems implies the examination of economic and social influences on production to describe elements that affect perimeter operation Three broad elements have been selected for analysis in this report (1) labor (2) differential access to cash land and other productive resources and (3) issues of power as related to land tenure and property control over agronomic practices decision making and the cooperative and management committee and ONAHAs role in perimeter management14
The first is discussed in this chapter the second and third in the chapters which follow
POTENTIAL HOUSEHOLD LABOR Demographic variables such as total household size and
household composition by age and gender determine household labor availability and therefore have a significant impact on agricultural production of any kind Labor requirements for irrigated agriculture are higher than for rainfed production because additional tasks are required plowing field channel construction canal cleaning and irrigating Also tasks like weeding require more time under irrigated conditions Insufficient household labor means limiting the area cultivated hiring labor or mobilizing labor through other means
Agricultural activities on Moullela and Galmi perimeters are performed primarily by men and boys Children begin working on their elders fields at the age of seven or eight Women participate in the cotton harvest but their contribution to
14 Appendix 1 describes the methodology employed in this
research
22
other agricultural work is indirect and includes preparing and carrying food to men and boys working in the fields Therefore the number imales of age eight and over can be used as an rough indicator of available household labor for irrigated agriculture
Data collected on a series of variables related to household size and composition show that the modal household consists of a male head of household an additional zero to two males eight years or older one to two women over the age of seven and two or three children under seven years of age 15
Males over the age of eight are defined as potential workers or active males Table 51 shows the distribution of potential
working males per household
TABLE 51 DISTRIBUTION OF NUMBER OF POTENTIAL WORKING
MALES PER HOUSEHOLD (Number of Households)
Number of Males Per Household 1
Number of Households Galmi 6 Moullela 1
2
9 9
3
9 10
4
6 5
5
2 2
6
0 2
7
2 -
8
1 -
--------------shy----------------
Total 7 18 19 11 4 2 2 1
Source Survey data
The majority of households (especially in Moullela) have two or three active males Assuming a six-day work week a household with two active males has fifty-six theoretically available worker days per month and a household with three active males has eighty-four However potential labor supply is also
15 For research purposes the household was defined as including those individuals with whom the respondent usuallylived ate or pooled resources At minimum Hausa households generally include a male head of household one or more wivesand unmarried children In many cases married sons (and their wives and children) remain in the fathers compound and share certain resources in common Other relatives may also be present See Horowitz et Al (198327) for further background on definitions of households in Niger
23
affected by the (1) timing of tasks (2) total area of land cultivated (3) labor actually allocated to agriculture and (4) the importance of other activities that comprise the household livelihood
LABOR LAND DISTRIBUTION AND THE AREA UNDER CULTIVATION
As noted earlier planting and weeding are ideally performed on a number of plots at once Available worker days may be sufficient to work any one household plot but insufficient to work a number of plots Accurate measures of total landholdings would be necessary to fully evaluate labor constraints Gathering such data was beyond the scope of this study However data were collected on the area of irrigated land and on the number and type of rainfed plots held by respondents While in the case of rainfed land the number of plots does not correspond directly to land area the data give a rough indication of the extent and types of land that draw the farmers labor These data can be used in conjunction with data on labor committed for specific tasks to estimate the minimum number of worker-days allocated to cultivate a set of parcels with a given area
Perimeter Parcels Table 52 shows the distribution of parcels per household
for perimeter parcel-holders in Moullela and Galmi
TABLE 52 DISTRIBUTION OF IRRIGATED PARCELS TO WHICH
RESPONDENT HAS TITLE (Number and Percent of Respondents)
Number of Parcels
GALMI (N=31) Number Percent
MOULLELA (N=29) Number Percent
1 29 83 20 69 2 2 17 7 24 3 - - -
4 - - 2 7 31 100 29 100
Source Survey data
24
Most of the perimeter parcel-holding households sampled have one perimeter parcel In Galmi 17 percent of respondents have two irrigated parcels while in Moullela the iorresponding figure is 24 percent Two farmers in Moullela reported having four perimeter parcels16
Total irrigated land holding size varies within the perimeters On the whole Moullela farmers have larger areas of irrigated land than those on the Galmi perimeter Furthermore the distribution of irrigated holding size is wider at Moullela than at Galmi (Table 53) For these reasons the per-household labor requirement for perimeter parcel holders also varies
TABLE 53
DISTRIBUTION OF IRRIGATED LAND AREA BY PERIMETER (Number and Percent of Respondents)
Irrigated Area GALMI (N=31) MOULLELA (N=29)(ha) Number Percent Number Percent
0 - 025 23 66 2 7 026 - 050 10 28 11 37 051 - 075 2 6 6 20 076 - 124 - - 3 10 125 - 150 shy - 4 14 151 - 167 shy -3 10
31 100 29 98
Note Percentages do not add to 100 due to rounding error Source Survey data
Differences in irrigated holding size can be partially explained by the different guidelines followed in parcel attribution on the two perimeters In Galmi between one and three parcels of 025 ha were allocated on the basis of previous landholding and family size (GERSAR 1981) In Moullela parcels were allocated on the same principle but with a different formula and no fixed increment of parcel sizes Furthermore as
16 Six of the sampled Moullela farmers with multiple parcels have one on the Galmi perimeter as well
25
noted above Galmi has been operating for a shorter time period While most farmers in Galmi are the original parcel holders this is no longer the case in Moullela where only thirty-one of the original parcel holders remain (see Norman forthcoming 1987) According to Norman (personal communication) in approximately 90 percent of the cases of farmers who lost irrigated parcels the land was reallocated within the same family Thus the original attribution procedure provides only a partial explanation for the present uneven distribution of land at Moullela parcels have also been subdivided among inheriting sons
The conclusions to be drawn from Table 53 with respect to labor requirements are first that perimeter parcel holding households are not by virtue of membership in a perimeter likely to spend uniform time working on their parcels Second Moullela farmers have an average of twice as much irrigated land to cultivate Third given land distribution on the Moullela perimeter calculations of average labor requirements for Moullela farmers as a group will hide wide variation between households
Reservoir Parcels In addition to parcels on the perimeter itself Moullela
parcel holders received title to a strip of land on the reservoir bottom which is cultivated in the dry season as the water recedes However 55 percent of the Moullela respondents reported that they did not have parcels on the reservoir bottom (Table 54)17 Moullela farmers who cultivate the reservoir bottomas well as irrigated parcels during the dry season will need more labor in comparison to those who do not farm on the reservoir bottom
17 Norman (personal communication) suggests that some peoplebegan farming this land when the perimeter was built whileothers did not Those who began earlier have gradually expandedtheir holdings over the years However the process leading upto the unequal use of the reservoir bottoms is unclear and deserves further study
26
TABLE 54 DISTRIBUTION OF RECESSION AGRICULTURE PLOTS USED
IN THE MOULLELA RESERVOIR (N=29)
Number of Plots Number of Respondents Percent
0 16 55 1 11 38 2 2 7
Source Survey data
Rainfed Plots Farmers in the research area classify their rainfed plots
according to differences in soil type altitude slope and moisture For this study rainfed land has been grouped into two broad categories (1) fadama low-lying land with moist soils which may flood during the rainy season and (2) all other rainfed land (which farmers divide into at least four different categories) Data on the distribution of fadama and other rainfed plots are shown in Table 55
TABLE 55PERCENT DISTRIBUTION OF NON-IRRIGATED PLOTS BY TYPE OF LAND
AMONG PERIMETER PARCEL HOLDERS (Number and Percent of Respondents)
Fadama Other Rainfed Number of Plots
GALMI No
MOULLELA No
GALMI No
MOULLELA No
0 1 2
25 7 2
71 20 6
15 8 2
52 28 7
2 13 7
5 37 20
1 5 7
3 17 24
3 - - 2 7 6 17 4 14 4 1 3 1 3 3 9 6 21 5 - - - - 3 9 3 10 6
10
- -
1 -
3 -
1 1
3 3
14 - - 1 3 - -25 -
35 -
I00 -
29 -
100 -
35 -
100 1
29 _3 98
Note Percentages do not add to 100 due to rounding error Source Survey data
27
About half of the perimeter parcel-holding farmers in Moullela and 30 in Galmi have at least one fadama plot The number of plots per household ranges from one to four in both samples One Moullela farmer reported that he held 14 fadama plots he is clearly an exception
In contrast the vast majority of perimeter-parcel holding farmers have several other rainfed plots Only two respondents from Galmi and one from Moullela reported no other rainfed plots (Table 55) Eighty percent of Moullela respondents and 58 percent of those in Galmi have two or more rainfed plots One Moullela farmer reported having twenty-five rainfed plots
Gardens do not figure prominently as a category of land worked by sampled farmers ith perimeter plots Two Galmi parcel holders and four from Moullela report that they have gardens The rest of the perimeter holders (94 percent of respondents in Galmi 86 percent in Moullela) do not Gardening is more prevalent among non perimeter parcel holders (see Appendix 2 Table VI) 18
Household Size and Land Area Cultivated land area may be primarily a function of
household size or available labor (see Chayanov 1966) In order to test whether this was the case among the samples from the two perimeters the number of active males per household was crosstabulated and correlated against the irrigated area number of rainfed plots and number of fadama plots per household
X found little evidence of a direct positive relationship between available male labor and irrigated area and number of rainfed or fadama plots The only positive and significant association (r= 044) was between the number of active males and number of rainfed plots per household in Galmi The correlation
18 Further research might investigate whether this is a
systematic pattern and if so explore the reasons behind this
28
coefficient for these two variables for the two perimeters combined was r- 018
These results are difficult to interpret given the lack of data on rainfed area However they do show that there is no strong positive linear relationship between available (male) labor and available indicators of land held by farmers on the two perimeters studied A similar analysis for the Konni I perimeter showed a weak but significant correlation (r=030) for these two variables (Rdpublique du Niger 198518)
Horowitz et al (198347-51) review a number of studies and conclude that the distribution of landholding on a village level in different regions of Niger is unequal They note that
(o)ne of the contributing factors to the differentiation ofrural farmers is the uneven access of farming units to land Although there are few truly landless rural households manyhouseholds do not hold enough land to meet either food or cash needs from their farming activities alone (198347)
Thus access to land in the research area--defined In terms of indicators of land holding and land use--also appears to be unequal and not necessarily related to household size or available labor
DISCUSSION OF LABOR AVAILABILITY Labor available for irrigated agriculture and water
management is a function of household labor total irrigated holdings and total rainfed land Other factors such as off-farm activities and the capacity to hire labor also affect labor availability for irrigated agriculture The vast majority of Galmi and Moullela farmers are engaged in a farming system in which irrigated parcels represent only one of various types of plots worked Half of the Moullela farmers have one fadama plot and a plot in the reservoir and the majority have at least two other rainfed plots in addition to their irrigated parcel In Galmi over a quarter of farmers have one fadama plot and the majority have at least one other rainfed plot
29
In order to translate Qata on number of plots into an estimate of labor allocation for each individual household in the sample we would need to know the actual area of land for each rainfed plot as well as mean days of labor invested per unit area Since these data are not available we will estimate labor requirements on rainfed plots for the group as a whole by attributing average sizes to different types of plots Informal interviews indicate that fadama plots vary in size from 025 to 075 ha while other rainfed plots range from 02 to 30 ha A reasonable estimate for a mid-range fadama plot is therefore about 05 ha and 16 ha for other rainfed
Based on these mid-range holding sizes I have constructed two hypothetical case households for each perimeter (Table 56) Case 1 for each perimeter includes a fadama plot case 2 does not case 1 for Moullela includes a reservoir bottom plot Table 56 suggests the total land area cultivated for households with mid-range holdings The actual spread is probably far greater
TABLE 56ESTIMATED WET SEASON LAND AREA CULTIVATED PER HOUSEHOLD CASE EXAMPLES
Average Area of Cultivated Land (ha)
Type of Plot GALMI
Case 1 Case 2 MOULLELA
Case 1 Case 2
Perimeter 025 025 050 050 Reservoir - - 008 -Fadama 050 - 050 -Other Rainfed 160 160 320 320
235 185 428 370
Note Case 1 includes fadama land while case 2 does notSource Farmer Interviews
Data were collected on labor investments on plots of known sizes in the course of the research from a limited number of farmers (see Tables 41 and 42) The GERSAR (1981) pre-project study for the Galmi perimeter includes the results of a labor allocation study for a number of crops on rainfed and irrigated land By incorporating these data into the four cases shown in
30
Table 56 it is possible to calculate the number of working days these households hypothetically invest in agriculture This is carried out for the wet season crops
For the purpose of these calculations I assume that perimeter areas in Table 56 are devoted half to cotton and half to milletsorghum and that labor is fully and uniformly allocated over a five-month rainy season The interview data and GERSAR data are similar for irrigated crops but the GERSAR data show a higher labor allocation on rainfed plots than the data gathered in this study
The labor allocation values used for the calculations are 1 Irrigated Sorghum and Millet 100 working-daysha
(Source Interview Results and GERSAR)
2 Irrigated Cotton 192 working-daysha (Source Interview Results)
3 Rainfed Millet Fadama soil 87 working-daysha (Source Interview Results)
4 Rainfed Millet Other soil a) 40 working-daysha (Light weeding)
(Source Interview Results)b) 87 working-daysha (Heavy weeding)
(Source GERSAR)
Incorporating these results into the data from Table 56 gives the results shown in Table 57 It must be noted that the total working-days per month are probably underestimated
The following observations about wet season agriculture can be made based on the results in Table 57 1 The first set of cases (light weeding) is based on interview results and therefore represents actual labor commitments These figures reflect the availability of labor to the household not a hypothetical fixed labor requirement per unit area 2 The difference between the GERSAR data and interview data on rainfed land indicates that labor input per unit area can be highly variable We can assume that the GERSAR data represent a case where labor is utilized more intensively possibly because of greater ability to mobilize labor from within the household
31
----------------------------------------------------
TABLE 57 LABOR INVESTMENTS WET SEASON AGRICULTURE
(COTTON AND MILLETSORGHUM) CASE EXAMPLES
(Number of Working-Days)
Type of GALMI MOULLELA Land Case 1 Case 2 Case 1 Case 2 a) Light Weeding
Perimeter 37 37 73 73 Fadama 44 - 44 -Rainfed 64 64 144 144Total 145 101 261 217Working-daysmo 29 20 52 43
b) Heavy Weeding
Perimeter 37 37 73 73 Fadama 44 shy 44 -Rainfed 115 115 230 230 Total 196 152 347 303 Working-daysmo 39 30 69 61
Sources Table 56 and labor allocation values presented above
or to draw on cash resources to hire labor The discrepancy might also be explained by different soil and water conditions However the overall conclusion that there is great potential variation in labor input per unit area depending on labor availability and cash costs still seems valid 3 Total labor allocation to perimeter plots is relatively constant in the two sources of data (GERSAR and interviews) while the actual (based on interviews) labor commitment to rainfed land is much lower that that given by GERSAR While this may simply be a function of the higher labor intensity required on the perimeter for a given crop it also suggests that in the research area labor may be preferentially committed to the perimeter plots That is labor allocated to the perimeter is relatively constant but labor allocated to rainfed land may fall with declining labor availability
32
These preliminary results indicating preferential labor allocation to perimeter plots may reflect (1) the greater reliability of perimeter agriculture in relation to rainfed agriculture (at least during drier years) or (2) the closely supervised nature of perimeter agriculture or (3) the need for cash from cotton and onions or (4) the relatively higher labor intensity of certain perimeter crops such as cotton and onions (although cotton is also grown on rainfed plots and onions are grown in gardens or (5) all of the above In order to provide irrigation planners witlh adequate baseline information further research should address the question of how households respond to different levels of labor availability especially with respect to allocation choices between rainfed and perimeter agriculture The relationship between whether a given year is good or bad with respect to rainfall and labor allocation between perimeter and rainfed land should also be investigated It is possible that on good years farmers try to spend relatively less time on the perimeter since their marginal product on rainfed land would be higher than on a bad year when it might be more economical to concentrate on getting a good harvest from the perimeter 4 With respect to the actual working days the case of light weeding (I) the data in Table 57 show that monthly labor investment ranges from 20 and 29 days per month in Galmi to 43 and 52 days per month in Moullela (Note again that these ranges reflect actual labor committed) We can conclude that one adult male could cultivate the set of Galmi parcels but that two adults or one adult and two children would be required for the set of Moullela parcels
In the set of cases of heavy weeding (II) monthly labor requirements (now potential rather than actual) would range from 30 to 39 working days in Galmi this could be accomplished by an adult and a child or two adults for the second case) In Moullela the labor requirements would be 61 and 69 working-days
33
which would require for example two adults and a child or one adult and three to four children
These represent typical or average cases for Galmi and Moullela As the data on land distribution show (Table 56) the actual range is greater than given by these cases many households farm larger areas of land The problem of matching total available labor in a given area to unequally distributed land leads to the utilization of institutions of labor exchange (hiring labor kinship networks etc) this may represent a bottleneck that can constrain marginal labor productivity in any smallholder agricultural system 5 The proportion of agricultural working-days allocated to the perimeter in the wet season are given in Table 58
TABLE 58 PROPORTION OF TOTAL AGRICULTURAL LABOR ALLOCATED TO THE PERIMETER WET SEASON
Case GALMI 1 Case 2
MOULLELA Case 1 Case 2
I (Actual) 26 II (Potential) 19
37 24
28 21
34 24
Source Table 57
The majority of working time is allocated not to the perimeter but to rainfed land This implies that during the wet season perimeter agriculture is not the primary component of the household production strategy at least in terms of labor committed These results refer to the wet season and therefore do not necessarily imply that income from or total household labor allocated to the perimeter is correspondingly small Some farmers are able to make a relatively large income from cash crop agriculture on the perimeter particularly during the dry season (see Chapter Six)
34
ACTUAL LABOR ALLOCATED TO AGRICULTURE BY GENDER
Table 59 summarizes the aggregate survey data on potential labor available versus actual labor allocated to agriculture by gender for each perimeter
TABLE 59 POTENTIAL AND ACTUAL LABOR ALLOCATION
FOR MALES AND FEMALES EIGHT YEARS OF AGE AND OVER (Number and Percent of Males and Females)
MOULLELA GALMI (29 Households) ( 56 Households)
MALES Potentially Available Males 85 107
Males Actually in Agriculture 79 82 (at least part-time)
Percent of Total Males 7 23 not in Agriculture
FEMALES Potential Available Females 66 140
Females Actually in Agriculture 37 91 (not necessarily full-time)
Percent of Total Females 44 85 not in Agriculture
Source Survey Data
Male Labor Data on actual labor allocated to agriculture shows that the
theoretically available labor of males over the age of eight is not allocated entirely to agriculture Off-farm activities compete with agriculture for household labor
A much greater proportion of available male labor is allocated to non-agricultural activities in Galmi than Moullela In Moullela 7 percent of active males are engaged full-time in non-agricultural activities whereas in Galmi the corresponding figure is 23 percent This difference is probably explained by the greater availability of alternative sources of income
35
generating activities in Galmi The remainder (93 percent of active males in Moullela 77 percent in Galmi) are engaged in agriculture on either a part-time or full-time basis These figures include children whose labor contribution is not equivalent to that of an adult Nevertheless all of these males are counted as full-time male adult workers for the purpose of this study This overestimates available male labor
Female Labor The data in Table 59 show that the proportion of females
over seven years of age working in agriculture is significantly different for the two perimeters Seventy percent of households in the Moullela perimeter subsample had one or two women performing some agricultural work (primarily in the cotton harvest) That is 50 percent of the women over age seven in the Moullela subsample were involved in some kind of agricultural work In contrast only a little over one-quarter of Galmi perimeter households had one or more women engaged in some agricultural activity Of the total number of females over age seven in this subsample only 15 percent performed at least some agricultural tasks
The higher proportion of women involved in agriculture among parcel-holding households in Moullela--as opposed to those from Galmi--may be due to the longer history of cotton cultivation in Moullela There may also be a relationship between womens higher participation in agriculture and the apparent higher proportion of (male) labor migration in Moullela Another reason behind this difference may have to do with wider opportunities for women to generate income through non-agricultural activities in Galmi Processing andor selling food would be an example of such activities
LABOR MIGRATION Labor migration affects agricultural production by changing
the extent and seasonality of available household labor and by
36
-----------------------------------------------
providing additional cash income Migrants are often considered to represent labor that might otherwise be allocated to agriculture However insofar as labor migration is a kind of rite of passage that young men in rural areas practice to accumulate cash it does not necessarily follow that this labor would just as easily be allocated to agriculture
Data on the number of people usually considered to be part of the household but who were currently absent and employed or seeking employment show that migration is more prevalent in Moullela than Galmi (Table 510) This is corroborated by data
TABLE 510 NUMBER OF MIGRANTS PER HOUSEHOLD
(Parcel-holding Subsample)
Number of Migrants per Household 0 1 2 3 Overall
Number of Households Galmi 19 6 7 3 35 Moullela 10 14 2 3 29 Percent of Households Galmi 54 17 20 9 100 Moullela 35 48 7 10 100
Total 29 20 9 6
Source Survey Data
from the subsample of non-perimeter parcel holders over 90 percent of the non-perimeter holding subsample in Galmi had no migrants whereas in Moullela 43 percent did not (see Table I Appendix 2) The greater proportion of migrants in Moullela for parcel holders and non-parcel holders alike might be explained by the few options for cash generation there
FARM VERSUS OFF-FARM ACTIVITIES The survey results show that respondents with perimeter
parcels engage in a variety of non-agricultural activities Variables representing the respondents primary and secondary activities were constructed based on answers to questions about
37
- -
time spent on different activities (Table 511) (Note that the activities of the male head of household are listed not the activities of other household members) These data illustrate differences in the importance of agriculture as a primary activity in Moullela and Galmi
TABLE 511 PRIMARY AND SECONDARY
ECONOMIC ACTIVITIES OF PERIMETER PARCEL-HOLDING RESPONDENTS (Number and Percent of Respondents)
Primary GALMI MOULLELA
Secondary GALMI MOULLELA
no no no no
Agriculture 26 74 25 86 2 6 1 3
Agriculture and 1 3 2 7 10 29 16 55 Livestock
Local Non-Ag 3 9 - - 4 11 - -Wage Labor
Migrant - - 3 9 2 7 Wage Labor
Agricultural - - - - 2 6 3 10 Wage Labor
Commerce and Trade 3 9 1 3 4 11 2 7
Petty Commerce 1 3 - - 2 6 1 3
Mechanic - - 1 3 - - 1 3
Blacksmith 1 3 - - 1 3 - -
Butcher - - 2 6
Trucker 1 3 - -
Baker - shy - - 1 3
No Secondary 4 11 2 7 Occupation
35 101 29 99 35 101 29 98
Note Percentages do not add up to 100 due to rounding error Source Survey data
38
We can conclude from the data in Table 511 that agriculture is the dominant primary activity for farmers on both perimeters but it is relatively more important at Moullela Other primary activities include commercetrade and mechanical repairs at Moullela and commercetrade petty commerce19 non-agricultural wage labor and blacksmithing at Galmi Second most farmers on both perimeters are engaged in a range of secondary activities many of which are not agricultural A higher proportion of respondents at Galmi are engaged in secondary activities that do not include agriculture or livestock than at Moullela
CONCLUSION3 AND QUESTIONS FOR FURTHER RESEARCH In summary labor requirements per unit of land for irrigated
agriculture are higher than for rainfed production Insufficient household labor means limiting the area cultivated hiring labor or mobilizing labor through other means The majority of households on both perimeters include two to three potentially active working males which translates into fifty-six to eightyshyfour working days per month This labor is allocated primarily but not entirely to agricultural activities
Labor allocated to agriculture is only partly a function of the total area cultivated The relationship between available male labor and irrigated land area or number of rainfed plots per household was fcund to be negative or weak for the two perimeters
Land is not evenly distributed among sampled farmers this is true particularly of irrigated land in Moullela but also holds for the distribution of the number of rainfed plots With respect to irrigated land there are also differences between the two perimeters on average farmers in Moullela cultivate twice as much irrigated land as in Galmi (but the number of available males per household is roughly similar the perimeters)
19 Petty commerce refers to selling anything from cigarettes and chewing gum to batteries mosquito coils and cansof tomato paste from a small roadside table
39
Furthermore reservoir bottom land (available only in Moullela) is only used by about one-half the sampled farmers
This suggests that the distribution of total area cultivated per household (rainfed and irrigated) on each perimeter is unequal Unequal land distribution implies that the labor necessary to cultivate a set of plots will vary from household to household That is households do not face uniform labor demands The relevance of this issue to water management is that farmers on a perimeter will have different priorities for allocating labor based on differential access to land and labor Coordinating their activities may be problematic
Calculations based on reported labor allocation to various types of plots and estimates of total land area suggest that during the rainy season a greater proportion of labor is allocated to rainfed plots than to irrigated plots That is working irrigated plots is only one part of the overall household livelihood strategy and is balanced against utilization of other land resources The data suggest that the labor per unit area allocated to perimeter cultivation is relatively constant while labor per unit area allocated to rainfed agriculture may vary considerably from household to household
A higher proportion of male labor is allocated to nonshyagricultural activities among Galmi parcel holders than among those from Moullela This may be due in part to the greater opportunities for non-agricultural labor in Galmi which is situated on the main road arAd perhaps also by the smaller average land area held by Galmi households A higher proportion of females in parcel-holding Moullela households participate in agriculture than in Galmi This is primarily a function of the longer history of cotton cultivation in Moullela
Labor migration is more pravalent among Moullela perimeter holders than those from Galmi This is probably due to the
40
relative lack of non-agricultural work for young males in Moullela20
Agriculture is the dominant primary activity among respondents from both perimeters but especially in Moullela Farmers on both perimeters however do engage in a range of additional activities Secondary activities for Galmi parcel holders include a greater proportion of cash-generating occupations outside of agriculture and animal husbandry than for Moullela parcel holders
20 The lower rates of labor migration in Galmi may be related to the proximity of the Nigerian border Men from Galmi can make shorter more frequent trips which are not defined as exode (labor migration) but which would preclude other (agricultural) activities and would represent a source of cash income
41
Chapter Six
INCOME LAND OTHER PRODUCTIVE RESOURCES AND MATERIAL INDICATORS OF POTENTIAL RESOURCE MOBILIZATION
Farmers incomes (cash or in-kind) land and other productive resources such as animals tools and equipment influence agricultural production in general and irrigated agriculture in particular Different levels of income and other resources may translate into differences in investment in fertilizer costly seeds such as onions or labor and consequently into differences in total production
Most irrigation schemes in Nigcr are managed with the idea that farmers will complete tasks according to a uniform schedule In this way an entire crop will receive maximum benefit from any given irrigation by virtue of being at the same stage of growth and water requirement Underlying this model of perimeter operation is the implicit assumption that all farmers on a given perimeter are equally able to mobilize resources for agriculture
For example the expectation that all farmers on a perimeter will weed by a certain date assumes they can either use their own and family labor or hire the necessary labor all within a limited time period Even if we assume an adequate overall labor supply it is not evident that individual farmers can uniformly mobilize labor--whether hired or not
Not all farmers can mobilize the same levels of resources whatever the resource This variability alone may account for apparent performance differences and be a crucial influence on perimeter operation It is therefore important to examine the distribution of resources among farmers associated with a given perimeter Unequal distribution of resources indicates a gap between resource-rich and -poor farmers The wider the gal the more difficult it may be to coordinate activities among a group of farmers Variables indicating differences in potential resource mobilization are discussed in this chapter
42
CASH
The availability of cash and its timing determine farmers ability (1) to hire labor during periods of peak labor demand (2) to purchase adequate inputs when needed and pay the redevance (3) to invest in animals equipment and other productive resources (4) to store a portion of the crop (eg onions) for later sale at a higher price or for consumption rather than selling immediately to pay outstanding debts or bills and (5) to purchase consumption and other goods Payments received in-kind may be sold for cash or retained for consumption or future sale
Farmers generally obtain cash not only from agriculture but by engaging in non-agricultural work They may also receive cash from other household members who earn cash Data on total cash income were not collected but information on participation in cash-generating activities can serve to indicate variability in access to cash--and by logical extension differential resource mobilization potential Cash available from agricultural production is discussed separately
Cash-Generatinq Activities As noted in Chapter Five Moullela and Galmi farmers are
engaged in a variety of activities many of which generate cash faster and with greater regularity and reliability than agriculture Table 61 shows that although most farmers on both perimeters allocate their time to more than one productive activity a higher proportion of respondents from Galmi have primary as well as secondary activities which generate cash directly21 While these data refer only to the respondent the data in Table 62 present information on all household members engaged either full- or part-time in a cash-generating activity
21 Livestock may also be considered a cash-generating activity Animals such as sheep and goats are controlled primarily by women
43
TABLE 61 RESPONDENTS PRIMARY AND SECONDARY ACTIVITY
BY PERIMETER (Percent of Respondents)
PrimaryGALMI MOULLELA
SecondaryGALMI MOULLELA
Agriculture and 77 93 35 58 Livestock (irrig amp rainfed)
Other Cash- 24 6 55 33 Generating
No Secondary - - 11 7 Livelihood
101 99 101 98
Note Percentages do not add up to 100 due to rounding error Source Table 511
TABLE 62 NUMBER OF HOUSEHOLD MEMBERS ENGAGED IN
CASH-GENERATING ACTIVITIES (Number and Percent of Respondents)
Number of Galmi Moullela Household Members Number Percent Number Percent
0 1 2 3 4 5 7
5 6
11 4 6 2 1
14 17 31 12 17
6 3
5 8 6 5 4 1 -
17 28 21 17 14
3
35 100 29 100
Source Survey Data
Table 62 shows that most farm households sampled from both perimeters include at least one member who is engaged in a cashshygenerating activity outside of agriculture and animal husbandry Moullela respondents tend to have fewer cash-generating members per household For each perimeter the range for the number of
44
household members earning cash is wide The presence of one as opposed to six or seven cash-generating household members suggests significant variability in access to cash among households in each perimeter
Variability in the number of out-migrants per household ranges from one to three persons for farmers sampled from both perimeters (Table 510) This suggests another source of variability in access to cash among perimeter households
INCOME FROM LAND The amount of land cultivated by household members helps
determine total agricultural production which is a type of income As noted production may be used for consumption or it may be sold Rainfed land may also be sold or rented to generate income2 2 Perimeter plots cannot be legally rented or sold but farmers may lend all or a part of their plot during the dry season in exchange for redevance payment--which might be considered a form of rent
Cotton onions wheat and corn are the major cash crops grown in the study area Farmers on the Galmi and Moullela perimeters grow some rainfed cotton but cash crop production takes place primarily on the perimeters Millet and sorghum are used primarily for consumption The irrigated area worked by a farmer and his household is an indicator of the volume and value of cash crop production and therefore of income from cash crops23
Data on land distribution (Tables 52 through 55) show considerable variation in the distribution of irrigated land on both perimeters This suggests a wide gap in income from
22 Land may also be lent in exchange for part of the production future reciprocal loans or gifts
23 This assumes that differences in soil types etc are held constant
45
--------------------------------------------------------
---------------------------------------------------------
irrigated agriculture between farmers with the smallest parcels and those with the largest
Data on irrigated and rainfed agricultural production for nine cases from Moullela are shown in Table 63
TABLE 63 SELECTED DATA ON AGRICULTURAL VALUE OF PRODUCTION
FOR NINE MOULLELA FARMERS 1985-1986 AGRICULTURAL YEAR (CFA)
NET VALUE OF PRODUCTION (Cash Crops)House- Perimeter Rainfed Overall hold Total AC Total BC Total
Farmer Size (A) Percent (B) Percent (A+B=C)
1 11 52850 624 31900 376 84750 2 6 71380 725 27100 275 98480 3 3 82815 666 41450 333 124265 4 8 59890 448 73850 552 133740 5 8 124285 841 23550 159 147835 6 10 92550 492 95600 508 188150 7 7 113225 511 108500 489 221725 8 7 389085 787 105000 211 494085 9 14 436150 7055 182750 295 618900
Net Value of Production was calculated by subtracting reportedcash costs of production from total value of production for rainfed and perimeter productionTotal Value of Production figures were in turn calculated bymultiplying reported quantity of production by price at harvestfor each crop and adding the values for each farmer for rainfed and perimeter production Source Farmer Interviews
A gap of 383300 CFA (US $1095) between the lowest and highest net value of all perimeter production and a gap of 534150 CFA ($1526) between the lowest and highest net value of total agricultural production (on and off the perimeter) indicates considerable variability in the income available from agriculture both on and off the perimeters for Moullela farmers
Two general patterns are discernible from the data in Table 63 First in general as the net value of total agricultural
46
production increases the net value of total perimeter production rises as well Second a greater proportion of the net value of production tends to be derived from the perimeter than from rainfed production (there are two exceptions) However it must be emphasized that these data encompass an entire agricultural year and that the dry season production on the perimeter accounts for a significant part of the difference in the net value of production between rainfed and perimeter land
OTHER PRODUCTIVE RESOURCES Draft animals and beasts of burden are also productive
resources Possessing a pair of oxen or a donkey eliminates the need to rent the former for plowing or the latter for transport Other productive resources include tools (hoes shovels etc) and equipment (plows etc) Bicycles can also be considered a productive resource in that they shorten the time it takes to go to a distant field Data on the distribution of draft and transportation animals are shown in Table 64
The table shows that a much higher proportion of farmers own oxen in Moullela than in Galmi However oxen ownership must be used with caution as an indicator of a productive resource for two reasons First the situation in both perimeters has been changing Fifty-one farmers on the Galmi perimeter and twelvefrom Moullela (or six and ten percent of the total number of farmers on each perimeter respectively) were in different stages of receiving pairs of oxen through a credit project financed by the European Development Fund (FED) After the distribution process is completed the proportion of farmers owning oxen on each perimeter will increase However it appears that the relative difference between the perimeters will remain largely unchanged Furthermore while the distribution of the ownership of oxen within a perimeter will be somewhat less unequal differences will remain
47
TABLE 64 DRAFT AND TRANSPORTATION ANIMALS
PERIMETER PARCEL HOLDERS (Number and Percent of Respondents)
Galmi Moullela Number Percent Number Percent
Number of Oxen 0 31 89 12 421 0 0 1 32 4 11 15 52 4 0 0 1 3
Number of Donkeys0 26 74 24 24 1 5 14 4 14 2 4 12 1 3
Number of Horses 0 34 97 27 931 1 3 2 7
Number of Camels 0 35 100 28 97 2 0 0 1 3
Source Survey Data
Second at present oxen distribution at Galmi is a function of the fact that farmers have sold a large number of oxen which had been purchased through the Caisse National de Crddit Agricole(National Agricultural Credit Bank) in many cases before repaying the loans Informants said farmers used the money to buy younger draft animals (which would not have been coded as oxen in this study) to invest in other livestock or to buy food during the drought
Table 64 shows that the majority of farmers on both perimeters do not own horses or camels Ownership of donkeys is slightly more common A greater proportion of farmers at Galmi have donkeys than at Moullela This is probably explained by the opportunities to make money transporting water in large metal drums from the well located at ONAHA headquarters to the main part of town--a distance of three kilometers
48
Table 65 shows the distribution of bicycles among parcelshyholders in the survey sample Nearly a third of the Mcullela respondents have one bicycle in Galmi only 11 percent do None of the farmers in the sample reported owning more than one bicycle
TABLE 65BICYCLE OWNERSHIP PERIMETER PARCEL HOLDERS
(Number and Percent of Respondents)
GMoullela Number Percent Number Percent
Number of Bicycles0 1
31 4
89 11
20 9
69 31
Source Survey Data
The range of the distribution of oxen donkeys horses camels and bicycles is not very wide but this does not signify equal distribution of these resources The mere presence or absence of any one of these is significant since they represent large initial expenditures Recurrent maintenance costs are also associated with the animals In conclusion the data indicate considerable differences in potential resource mobilization among parcel holders within each perimeter Certain differences such as the proportion of oxen ownership appear to be significant between the two perimeters
MATERIAL INDICATORS OF WEALTH AND POTENTIAL RESOURCE MOBILIZATION
The material goods owned by a respondent and his household can serve as indicators of wealth and income and of potential resource mobilization Some of these goods can be considered indirect productive resources such as livestock while others such as radios or metal beds are consumer goods and not productive resources Frequency distributions of these items can be used to identify groups of farmers with different levels of
49
resources and with assumed corresponding differences in the resources they might invest in agricultural production
Data were collected on the number of various material goods possassed by respondents Certain items have been selected for discussion their distributions are presented in Table 66 and Table 67
These tables show that sheep and goats are unevenly distributed among parcel holding households on both perimeters Sheep and goats also represent important economic investments Females provide milk for consumption and sale males are also slaughtered for major religious feasts The distribution range is somewhat wider for Moullela respondents for both types of ruminants The distribution of tables radios metal beds and vehicles is also uneven for the two perimeters Similarly the range between the lowest and highest count of any given item is wider at Moullela than Galmi with the exception of vehicles which were not found among Moullela respondents
TABLE 66DISTRIBUTION OF SHEEP AND GOATS PERIMETER PARCEL HOLDERS (Number and Percent of Respondents)
Galmi Moullela Number Percent Number Percent
Number of Sheep0 21 60 7 24
1 - 2 7 20 7 243 - 4 5 14 7 245 - 6 1 3 3 109 - 12 1 3 3 10
21 - 22 0 0 2 7
Number of Goats 0
1 - 2 3 - 4 5 - 6 7 -9
10 -14 20+
13 5 8 4 4 0 1
37 14 23 11 11 0 3
6 6 3 5 0 6 3
21 21 10 17 0
20 10
Source Survey Data
50
TABLE 67 DISTRIBUTION OF CONSUMER GOODS
(Number and Percent of Respondents)
Galmi Moullela Number Percent Number Percent
Number of Radios 0 26 74 19 661 9 26 10 34
Number of Metal Beds 0 11 31 10 351 15 43 6 212 5 14 6 213 2 6 3 104 2 6 3 106 0 0 1 3
Number of Vehicles 0 34 97 0 03 1 3 0 0
Lumber of Tables 0 28 80 24 721 6 17 4 142 1 3 2 73+ 0 0 2 14
Source Survey Data
While it cannot be automatically assumed that all farmers spend the same proportion of income on material goods their distributions can be taken as indicators of differential levels of potential resource mobilization In other words a farmer who owns a radio several tables and six metal beds probably has more resources to invest in agriculture than one who does not have a radio or a table and has one metal bed This does not necessarily mean that he will invest in agriculture in proportion to his wealth
CONCLUSIONS
51
This chapter opened with the proposition that variability in the level of resources which can be mobilized and invested in agriculture may be an important influence on perimeter operation This variability was documented by examining the distribution of numbers of cash-generating members per respondents household non-agricultural primary and secondary activities irrigated land area value of agricultural production various productive resources and finally selected material goods
Based on the unequal distribution of these variables among parcel holders on each perimeter we can conclude that both Galmi and Moullela have richer and poorer farmers--cultivators who may not all be able to mobilize the same set of resources for production
Establishing this fact however does not explain the extent to which irrigation development has produced or perpetuated these inequalities nor does it explain what the precise impact of these differences is on perimeter management With respect to the first problem it is possible that at Moullela the longer period of perimeter operation has allowed some farmers (probably those with higher initial levels of labor cash and land) to accumulate more resources than others and to take better advantage of the benefits of perimeter production In Galmi however the uneven (but not as wide) distribution of resources does not reflect accumulation allowed by the perimeter because the perimeter is recent The distribution may reflect original differences in cash labor and land It may also reflect ongoing resource accumulation based on activities other than irrigated agriculture
The ways in which patterns of differential access to resources can affect perimeter operation deserve further research Tentative information about this based on informal interviews suggests the following Differential access to cash labor total land area and other resources a~lowu some farmers to complete perimeter tasks sooner and better than others and perhaps to benefit more from irrigation GMPs with
52
larger proportions of farmers who can do this may more effectively coordinate the timing of their activities We can hypothesize that the more homogeneous a group of farmers is with respect to resource distribution (whether at the GMP or perimeter level) the easier it will be to coordinate their agricultural activities
The issue of differentiation versus homogeneity of irrigation units may have important implications for autoshygestion Is self-management more likely to succeed where groups of irrigators have more or less equal access to cash and labor and the corresponding differences in status which accompany such variation Implications of this issue are discussed in Chapter
Eight
Chapter Seven POWER AND PERIMETER MANAGEMENT
The previous two chapters discussed wasa in which the availability of labor land and cash may affect activities on the irrigated perimeters under study But quantifiable resources such as these are not the only influences on perimeter operation and management This chapter presents discussions of selected qualitative influences that affect perimeter management and operation These influences have to do with power relationships of different kinds The first two sections center around the governments power to establish property rights and control over perimeter land The issue is explored through discussions of potential implications of farmers attitudes about property for perimeter management and of the role of village chiefs in land allocation The next three sections focus on power relations between farmers and ONAHA staff This issue is approached in discussions of control over agronomic practices decision making and information flows and ONAHAs role in perimeter management
In addition to affecting present perimeter activities these are issues which along with the resource-based factors presented earlier relate to the problem of auto-gestion or selfshymanagement--at present an important ONAHA policy objective Assuming that self-management is based on some degree of farmer participation in management decisions or at least widespread farmer approval of those actually making decisions then a perimeter where farmers are fairly involved in or pleased with the way activities are managed may have a better chance of attaining self-management This chapter aims to draw out contradictions between the goal of self-management on one hand and present power relations between farmers and local and national authorities and policy on the other
54
LAND TENURE AND PROPERTY RIGHTS
Irrigation development implies a heavy financial investment in infrastructure and a modification of the land surface which is to be put under irrigation It may also imply changes in existing patterns of land tenure and distribution and in definitions of property Both the manner in which these modifications are made in the course of building perimeters and the arrangements set in place to maintain these modifications will affect perimeter management and operation24 There may be contradictions between the government mandate for auto-gestion and some of the institutional changes and arrangements made in the course of irrigation development
The legal code in Niger (and many other countries) gives property rights to irrigation infrastructure over to the government in the case of government andor externally financed irrigation development In Niger rights to and control over irrigated land also rest with the state Thus the state can establish rules concerning property rights to irrigated land These rules presently include the prohibition of land rental and sale on the perimeters Such rules are geared towards preserving initial perimeter land allocation and preventing land concentration and less explicitly towards controlling land use and farm management
There is however a certain dissonance between state control of the land and a farmers sense of property A farmer who has a parcel in an area targeted for irrigation development will lose control over that parcel and in its stead receive a (usually smaller) perimeter plot But in addition to a change in the area he can cultivate the farmer experiences a change in the property rights he can excercise over his land (see Laucoin 197154-55)
24 See Coward (1985) for a discussion of property as a critical factor in water management and El-Kholy (1985) for a discussion on the same topic based on an Egyptian case
55
It may be argued that in the historical absence of private property in this region any analysis of land tenure and property is of minor importance But property cannot be equated with private property alone While land may not have been held as private property (transferable part of a land market etc) it is clear from interviews that farmers in Galmi and Moullela conceived of the parcels over which they had use rights before the perimeters were built as their own land--just as they now consider that they own their rainfed land (Laucoin 197154-55)
This conception changed dramatically with the creation of the perimeter When asked who the irrigated plots belong to most farmers on both perimeters answered the government Only a minority answered that they belonged to whomever they were allocated (see Table VI Appendix 2) Some farmers who gave the first answer explained that the parcel was on loan to them by the government Clearly farmers sense of property has undergone a transformation
A relationship between stable land tenure andor property rights in irrigation systems and productive investments and participation in system management and maintenance has been suggested This may be attributed to the relationship betweeen property rights (or stable tenure) and higher degrees of control over agricultural practices and decisionmaking The implications for self-management are clear Farmers rights to make decisions about how their land is cultivated and used are compromised by state regulations Farmers property rights are limited and we can expect that their interest in self-management may be correspondingly limited2 5
25 This is not to say that perimeter operation will necessarily be compromised but that self-management may be Themore congruent government policy and control over irrigated landis with farmers practices and resource constraints the lessthis will pose a problem for perimeter operation and managementBut farmers differential access to resources must be kept inmind when evaluating policy effectiveness
56
LAND ALLOCATION AND THE ROLE OF VILLAGE CHIEFS In principle land on both perimeters was allocated to all
farmers who had parcels on the area affected by perimeter development including the present command area the reservoir drainage ditches etc In order to accommodate all the farmers with rights to parcels formulas based on family size and area previously held were used to allocate parcels Therefore most farmers received smaller areas than they originally held Several complaints about this process emerged in the course of informal interviews with farmers in the Galmi area
Old property markers were destroyed by bulldozers before surveys were carried out to determine the pre-existing pattern of land distribution This led to difficulties in determining exactly who had how much land before hand Some farmers report that this allowed some individuals to claim they had land in the affected area and thereby gain access to perimeter plots when in fact they did not have such rights There are also farmers who claim to have had land on the affected area but who did not receive parcels It is clear that parcels were allocated on the basis of land tenure surveys conducted AFTER bulldozers had cleared the command area destroying previous plot boundaries It is impossible and perhaps pointless to do anything about this now however in the future land attribution surveys should be conducted BEFORE the bulldozing begins
A few informants noted that village chiefs were not consulted during that period This means that a potentially useful source of information on land holding patterns was bypassed Planners of future parcel attribution procedures might consider utilizing village chiefs and elders as a source of information particularly with respect to land holding data
The relationship between perimeter-related organizations and village chiefs as a local institution deserves further analysis Village chiefs from Moullela and the villages served by the Galmi perimeter are active in perimeter organizations but to varying degrees Some hold office in the management committees (Moullela
57
and Guidan Roro) others hold office on GMP committees Others however either do not hold offices in these organizations or do not have perimeter parcels
Opinions among farmers and chiefs vary with regard to the relationship they consider to be appropriate between chiefs and perimeter activities Some people think village chiefs should play an active role in land and water disputes a role chiefs do play for rainfed land disputes and some chiefs play in reference to the perimeter Others do not consider this a pressing issue
When more than one village is represented in a cooperative and management committee people from some villages may not feel adequately represented In Guidan Miko one of the villages served by the Galmi perimeter farmers suggested that villageshylevel representation in perimeter organizations should be stronger
CROP CHOICE AND AGRONOMIC PRACTICES Irrigation development implies changes in cultivation
practices as well as property relations Some farmers may need to learn new techniques (eg how to irrigate) in other instances they may have to learn to perform a task in a different manner Furthermore choices about cropping patterns are often constrained
Farmers at Moullela and Galmi while generally positive about the benefits of reduced crop failure risk obtained through the perimeters listed several complaints related to agronomic aspects of perimeter management Most farmers interviewed wanted to have more choice with respect to cropping patterns--both in terms of deciding what portion of their parcel to devote to crops planted and in terms of planting additional crops
For example in Galmi the prescribed cropping mix for the 1986 wet season was half cotton and half millet or sorghum Nevertheless at least a dozen farmers planted their plots entirely with millet These farmers were due to receive written warnings from the management committee and the perimeter
58
director (Three warnings are grounds for removal from the perimeter) In another example of farmers interest in increasing cropping choices several farmers interviewed said they would like to enlarge the area planted in beans Farmers also cited okra gourds additional sorghum and millet varieties peanuts and rama2 6 as crops they would like to plant on the perimeter
Reports that ONAHA staff have uprooted illegal crops is evidence of conflict over crop choices Eight out of 15 farmers interviewed from Moullela (53 percent) said they had had crops uprooted at some point in the perimeters seventeen-year history The corresponding figure for Galmi since 1982 was 19 percent (out of 32 farmers) Norman (personal communication) suggests that ONAHA staff uproot crops planted in earth canals or drainage ditches
Dry-planting is an agronomic practice over whose benefits farmers and agronomists appear to disagree Dry-planting can save labor if the rains arrive at the right time Many farmers say they would dry-plant on the perimeters if it were allowed some do anyway
ONAHA staff attach priority to finishing tasks on the perimeter Farmers on both perimeters reported that they began planting and weeding on rainfed plots before doing so on their perimeter parcels In other words farmers begin by dry-planting off the perimeter and then depending on the timing of the rains juggle their work between the perimeter and rainfed plots as best they can This reflects the fact that the timing of planting on rainfed plots is more critical Farmers on both perimeters were aware of the importance attached by ONAHA staff to the timely completion of perimeter tasks although they did not always understand the reasons for this and did not necessarily comply
26 Rama iF the Hausa term The plant can be used to make rope and the leaves may be eaten
59
DECISION MAKING AND THE FLOW OF INFORMATION ONAHA THECOOPERATIVE AND THE MANAGEMENT COMMITTEE
Farmers on both perimeters tend to view decisions about redevance calculations irrigation scheduling timing of planting and other activities on the perimeters as made by the perimeter director and other ONAHA staff and by the management committee However there are some differences between the two perimeters A greater proportion of sampled farmers from Moullela see their perimeter director as making most decisions The comitd de gestion is seen as making most decisions by a greater proportion of sampled farmers from Galmi than from Moullela (see Table VII Appendix 2) These differences may be due to what seems to be a very close working relationship between the Galmi perimeter director and the comitd de gestion It is possible that more Galmi farmers identify the committee and the director as forming a single decision making unit
The following pattern of information flow regarding decisions about what to do and when on the perimeters is reported by ONAHA staff After making a decision the director (or the director and his staff at Galmi) informs the management committee andor GMP heads depending on the type of decision In the case of decisions that need to be communicated to farmers such as when the next irrigation will take place the director tells the GMP heads to pass the information on to farmers and informs the management committee members about the decision If the decision requires further decisions or ratification by the management committee a meeting is held between the committee and ONAHA staff GMP heads either communicate information directly to the group of farmers for which they are responsible or tell a member of their GMP committee to pass on the information In Moullela the director said he told GMP and management committee members about his decisions
Thus information flow is top-down and only reaches farmers indirectly The information flow structure is not entirely effective with respect to communicating information about
60
irrigations Eighty-four percent of farmers sampled on each perimeter said they often did not hear about irrigations in a timely way This suggests that farmers or family members may not always be present during irrigation with consequent negative implications for both crop stress and water efficiency For example if farmers are not present during irrigation they cannot build or remove temporary field channel openings within their plots which means that crops may receive too much or too little water and water may be wasted Effective communication channels must be developed in order to improve water management and yields and to increase farmers participation in management particularly if auto-gestion continues to be a policy objective
ONAHAIS ROLE IN PERIMETER MANAGEMENT A current government policy objective is the eventual
transformation of ONAHA into a technical assistance agency with perimeters managed by their management committees In the interim however ONANA is charged with supervising perimeter activities In practice ONAHA staff are responsible for scheduling and delivering water and supervising the maintenance and repair of the facilities They are also responsible for ensuring that farmers plant specific portions of their parcels with particular crops finish tasks according to schedule follow agricultural practices as prescribed and do not break rules against the sale or rental of perimeter land In short in addition to their role in water delivery and system operation and maintenance ONAHA staff are put in a policing role
However ONAHAs authority to employ available sanctions is limited Major sanctions including removing farmers from a perimeter must be approved by political authorities While ONAHA staff can give written warnings they cannot remove a farmer after issuing three warnings without the consent of the political authorities (eg chef de canton and sous-prefet) This consent is not always forthcoming
61
The fact that ONAHA must follow political directives puts ONAHA staff in an ambiguous position27 In Galmi farmers who have never paid their redevance remain in the perimeter because it is too early farmers have to be given a chance and besides the authorities have not given their approval 28 The point is not that farmers should or should not be removed but rather that ONAHAs ambiguous role with respect to making policy and enforcing existing rules should be defined more clearly
A MODEL OF PERIMETER MANAGEMENT Based on the discussion in the preceding sections a model
of perimeter operation emerges for both Moullela and Galmi in which ONAHA staff try to follow and impose their agencys guidelines for agronomic practices crop rotations committee organization and irrigation management At the same time farmers and their families are busy trying to cultivate their various and sometimes distant plots while they also make a living from other sources Because there is no such thing as an average farmer (Horowitz et al 198323) it is difficult for all farmers to perform uniformly in accordance with agency directives This may have adverse effects on goals of economic and technical efficiency
The day-to-day practice of farming and managing water involves some struggle on all sides a diverse group of farmers ONAHA staff local authorities and extra-local political authorities Certain issues remain a source of debate while arrangements may be reached over others at least for a while In Moullela such arrangements have had a longer time to develop It is not an easy or negotiated give and take nor is it a bitter constant battle
27 An agronomist familiar with the region cites higherpolitical authorities with interfering with ONAHAs managementrole
28 Interview with ONAHA employee
62
Chapter Eight CONCLUSIONS AND RECOMMENDATIONS
Research findings suggest that farmers on the Moullela and Galmi perimeters differ in their potential ability to mobilize resources for agriculture whether irrigated or rainfed The explanation for this lies in their variable access to resources such as labor land cash and other income and livestock Farmers with certain sets of resources will be in a better position to take advantage of irrigation and to complete tasks on the perimeter within ONAHAs guidelines It is worth reflecting on the implications of this variability for perimeter management
If the hypothesis proposed in chapter six is correct that all else being equal a more homogeneous group of farmers leads to smoother and more efficient operation then it follows that policies that discourage differentiation among farmers and promote more even distribution of resources will enhance perimeter management More equal access to resources among farmers on a perimeter can be achieved in a number of ways
The first is through selection the exclusion of outliers (the very rich or poor) from the perimeter Selection may occur either at initial project stages by selecting farmers with a minimum level of resources or during the course of perimeter operation when resource-poor farmers who are unable to keep up redevance payments or other perimeter obligations lose their land This process has occurred to some extent at Moullela When a relatively resource-rich farmer such as a town merchant gains control of irrigated land the selection process increases heterogeneity rather than promoting more equal resource distribution among farmers so that the operation of the perimeter may be negatively affected A number of Galmi area farmers say that this took place on the Galmi perimeter
A second method for achieving a degree of homogeneity on the perimeter is to institute controls which prevent or slow the widening of the gap between rich and poor farmers Government
63
policies banning the sale or rental of perimeter lands are intended to prevent concentration This clearly has some impact in slowing down differentiation in access to irrigated land However the policy does not address the problems of differentiation in access to other resources especially labor and cash Banning land sales does not necessarily affect the forces which lead farmers to sell land so that they may find other means to achieve the same end and the control of large areas of land by a few individuals may become covert Control over the sale of irrigated land does not affect distribution of or differentiation in access to rainfed land which this study has shown to be a major part of the household agricultural system Moreover it does not affect the differential ability of farmers to mobilize resources for cash crop production--an important source of income and therefore of differentiation on the perimeter
Another method for maintaining or promoting homogeneity would be through ongoing redistribution or subsidization of key resouces for resource-poor farmers One alternative would be to make low-cost credit available to poorer farmers29 Money can in turn allow farmers to hire labor or draft animals at key times in the agricultural cycle A second alternative is the provision of employment opportunities during slack periods in the agricultural cycle so that farmers can obtain money which can be invested in agriculture
It would be useful to know how households cultivating unequal areas of land and operating under differing labor and capital constraints mobilize and allocate labor for various kinds of agricultural activities A typology of farmers with shared cash labor and land constraint levels could be used to
29 Poorer farmers can also gain access to scarce cash through moneylenders or their equivalent Information on moneylending was not obtained in this research This form ofgaining access to money is almost always very expensive for the borrower and is more likely to promote differentiation than to ameliorate it
64
analyze the ways in which farmers in different strata accumulate (or fail to accumulate) resources Such research could also determine how different constriints on the availability of labor cash and land affect agricultural production and levels of wellshybeing
The issue of finding a compromise between overall management goals which involve uniformity of operations as a means of achieving technical and economic efficiency and maximizing individual choice is central to perimeter management The former promotes the smooth running of a perimeter the latter allows farmers to best utilize their particular mix of resources The question is how can an irrigation system be effectively managed to increase production while minimizing the top-down control that this technology so often entails
This question suggests a need for continuing research efforts It would be useful to test several models of irrigation scheduling cropping patterns and organizational arrangements These models should be designed to increase the choice of crops available to farmers One approach would be to reserve a portion of a perimeter or of GMP for garden crops which could be planted following the harvest of early millet varieties The effect of intercropping on yields and on labor allocation to different tasks (especially weeding) should be tested to see whether and under what conditions intercropping would save enough labor to make this practice worthwhile even if yields decline somewhat
Changing the size and composition of irrigation units is another possible strategy for applied research For example the viability of GMPs composed of smaller groups of farmers with more uniform access to productive resources could be examined Reducing GMP size may require design changes such as shortening secondary andor tertiary canals Another design change would be to modify canals and control structures in order to increase water capacity so that GMPs at the end of a system could irrigate more quickly This would enhance scheduling flexibility by permitting selected areas to irrigate separately
65
The role and performance of local institutions (eg village chiefs) should also be examined Stronger villageshylevel representation is an issue that deserves further discussion especially with respect to larger perimeters where numerous villages have to coordinate their decisions and activities
A related issue is that of ONAHAs role in perimeter management and the agencys relationship with the management committee If self-management continues to be an objective it will be important to clarify the relationship between farmers the management committee ONLHA staff and local and extra-local political authorities in order to reduce ambiguity over decisionmaking and enforcement powers
In conclusion the fact that farmers with parcels on a given perimeter do not have uniform access to resources needs to be recognized and taken into account in water management and irrigation system design Because of this variability it would be useful to relax assumptions about uniform performance among perimeter farmers An alternative to reducing variability among farmers through compensatory programs (eg credit) would be to manage perimeters in a way that assumes variability rather than uniformity This would imply at a minimum more flexible scheduling selective irrigation wider choices in cropping patterns and cultivation practices and changes in the size and perhaps composition of GMPs or their equivalent
66
APPENDIX I
RESEARCH METHODOLOGY
METHODOLOGY
The data on which this report is based were collected over a thirteen week period ending August 10 1986 Part of this period was devoted to coding and data analysis
The methodoloqy adopted for this research included the following data collection strategies proxy participant observation open-ended individual and group interviews and formal surveys Three field assistants worked in different quartiers of Galmi two in Moullela and one in Guidan Miko a village located between Galmi and Moullela Assistants lived temporarily in the villages in order to gather qualitative data by means of participant-observation Each assistant kept a journal covering topics such as cooperative meetings perimeter activities informal interviews on perimeter management etc
Open-ended group and individual interviews conducted in French or through an interpreter provided a second source of data These interviews were conducted with ONAHA personnel individuals occupying positions of responsibility at the cooperative perimeter and village levels and with perimeter parcel holders
Four survey instruments were developed and administered to varying samples in the course of the research3 0 The first questionnaire (schedules 1 through 5) was designed to collect quantitative data on household composition and labor availabilshyity migration access to land land use possession of household items tools farming equipment and animals and participation in rainfed agriculture end non-agricultural activities
A second questionnaire (schedule 6) was used to gather information from people occupying positions of responsibility in
30 Copies of the questionnaires are available from the Cornell Irrigation Studies Group Cornell University Ithaca New York 14853
67
local cooperatives village institutions and GMPs This instrument includes questions on the number of positions held by the respondent his duties means of attaining posts and perceived advantages and disadvantages associated with the jobs It was administered to a non-random sample of 39 respondents selected by the field assistants and therefore is not treated in the discussion on sampling presented below
The third set of questions was based on three questionnaires drafted by Eric Arnould in January 1986 The questions cover land tenure perimeter management and cooperative organization This instrument was administered to the same sample drawn for the first questionnaire but a subsample was selected for analysis due to time limitations (Table A-3 below shows the sample sizes associated with the different instruments)
A fourth and final set of questions was designed to gather more detailed information about yields production costs land use crop choices changes in womens access to land and selected agronomic practices Due to the length of the questionnaire and to pressing time limitations this instrument was only administered to a subsample of irrigators
SAMPLING The questionnaires were administered to different subshy
samples of an initial sample however due to time constraints their results were only partially coded and analyzed The first questionnaire was administered to an initial stratified random sample consisting of a stratum of irrigators from the Galmi and Moullela perimeters and a stratum of non-irrigators from the villages associated with the perimeters The sample was also stratified on the basis of village residence in order to ensure an adequate representation of the villages associated with the two perimeters
The sample of irrigated parcel holders was randomly drawn from a sampling frame consisting of a list of parcel holders available for each perimeter The sample of individuals without
68
an irrigated perimeter parcel was randomly drawn from lists constructed at the village level by asking village chiefs and other key informants for the names of people without any perimeter parcels3 1 For each village the list of nonshyirrigators was made very long (relative to the actual sample size to be drawn) in an attempt to reduce the bias intruduced by the sampling technique The sampling frame was obtained in this manner due to difficulties in obtaining disaggregated census data
Sample sizes were determined on the basis of projected data collection capacity and an effort to include approximately 20 percent of the irrigators at Moullela and 10 percent at Galmi and a roughly corresponding number of non-irrigators Sampling was not based on calculations of the probability of representativeness of key variables for the population for two reasons A probabilistic sample would have required accurate census data and reasonable estimates of the variance of the phenomena under study for the population Difficulties were encountered in locating recent dissagregated census data for all of the villages and estimates of variance for the variables studied were not available
Table A-1 displays the sample sizes as percent of the number of irrigators associated with each perimeter and as percent of the population of adult males in villages served by the perimeters The latter is based on aggregated census data for 1983 for those villages for which data were available
31 Village chiefs are responsible for collecting taxes and therefore have a reasonably accurate idea of who lives in thevillage and what they do for a living
69
-- ---------------------------------------------------
---------------------------------------------------
TABLE A-i
SAMPLE SIZES AS PERCENT OF IRRIGATORS AND PERCENT OF ADULT MALES RESIDING IN THE AREA
TOTAL SAMPLE of IRRIGA- TOTAL SAMPLE NUMBER of TORS as of as of
PERIMETER IRRIGATORS TOTAL IRRIGATORS MALE POP --------I----------------------------------------------
MOULLELA 124 23 25-35 GALMI 854 8 10
Note The higher figure for total sample as percent of male population for Moullela is based on the male population of Moullela alone The lower range was calculated by adding a quarter of the male population of Guidan Miko to that of Moullela This was done to preserve the proportionality of village membership
70
-------------------------------
---------- ---------------------------------------------------
----------------------------------------------------------------
------------------------------------------------------------
------------------------------------------------------------
---------------------------------------------------------------- ------------- ------------------------------------------
The breakdown of the original sample by village and by irrigatornon-irrigator category is presented in Table A-2 As noted not all of the data gathered from the first questionnaire were analyzed nor were subsequent questionnares administered and analyzed on the basis of the original sample The scope of work was reduced in an attempt to collect AND analyze data within the project time frame
TABLE A-2
ORIGINAL SAMPLE BY PERIMETER AND VILLAGE
PERIMETER MEMBERSHIP
PERIMETER VILLAGE IN OUT TOTAL
MOULLELA Moullela 24 23 47 Guidan Miko 4 0 4 Guidan Sofo 1 0 0
SUB TOTAL 29 23 52
GALMI Moullela 2 0 2 Guidan Miko Toungaand Taganaoua 11 13 24 Galmi Birni 21 15 36 Guidan Doutchi 15 12 27 Guidan Kare 8 9 17 Guidan Roro and Zongo Annissar 14 13 27
SUB TOTAL 69 62 131
OVERALL TOTAL 98 85 183 m ------------------- m-----------------------------shy
71
-----------------------------------------------------------
---- ----------------- --------------------- - ------------
Table A-3 presents the sample sizes for data collected and analyzed with questionnaires 1 3 and 4 (As mentioned earlier the second questionnaire was administered to a separate judgment sample and therefore is not included in this table)
TABLE A-3
SAMPLE SIZES FOR DATA COLLECTED AND ANALYZED FOR QUESTIONNAIRES 1 3 AND 4
BY PERIMETER AND PERIMETER PARCEL HOLDING STATUS (Number of Cases)
QUESTIONNAIRE No 1 No 3 No 4
Collected PERIMETER AND STATUS
Analyzed Coll Analyzed Coll Analyzed
MOULLELA on perimeter off perim
29 23
29 23
29 23
19 0
19 0
15 0
GALMI on perimeter off perim
69 62
35 33
35 33
32 0
32 0
32 0
SUBTOTAL on perimeters off perims
52 131
64 56
64 56
51 0
51 0
47 0
TOTAL 183 120 120 51 51 47
The criterion used to reduce the sample size at each iteration was to maintain the proportion of respondents earning their livelihoods primarily through farming through commerce or a mixture of both fairly close to the proportions found in response to the first questionnaire Responses to questions associated with this criterion were examined for the entire sample before reducing the sample for the first round of analysis Non-perimeter parcel holders were left out of the analysis of the third questionnaire and out of the data collection for the fourth questionnaire because of time
72
constraints and because as a group they were felt to be less central to issues of land tenure cooperative organization and perimeter management The full data set is available and can be analyzed in the future
73
Appendix 2
DATA COLLECTED
Notes to Tables in Appendix 2
IN = Farmers with perimeter parcels OUT = Farmers without perimeter parcels
HE = Household
R = Respondent
74
0
E-4 rn
PMI4 O
4
0
or-a
o
0 0
0 0
0 C
O
0
HI-
0 0w
Irn
_
00
E-
IM
Nrl
w
C
N4
n
z ID
H
75
4 tA
q
o r-n
~OO
IDO
do 400Q
rOD
C4N
M-4t
0
E-4~shy
0
z n
it A
C
ot8o0
mC
4
q
C
tn C
i
1
-4 f-
f-
c
n 00
ooo
raC
Dk
tA 4
r
~c4
tnrf41
C4
1O
nH
-i
Cq
C
-D
a
64
0 o
M ejr~
f3
0 N
0 N
I
f l
D
q0
cq LzeID 4 n
co r r
0 E-
0
b
CP
C
ii
-I tfl f
D
(
C
n
v
0C
NN
C4
t
0
-4H
n
C
a
a
t c~4 c
iiC
M +
VIP
rshy
76
00 0
E-404
S
55S
9
1
C4
C
AC
4O
0
0
r-q
PL
4
C
4
I-0
ca
r-m
LA
C
~ -4O
ac
r-o
E
~0 P
r(
g
tgU
~~e4 IC
4I
-
m f
4O
4b
04 4 ~
0 -
4f- N m
Io
77
Ii1
dP
A
0
1-00
3w
4b4shy
0
0
V~~ 0 r0 q
400
O-4
N m
qt0f
nr-0
4Nn
78
0
N
Lntn
t ni
A
g-
4u
4r-o
N40
dguero44
E-4O
~
4-r-O
0 01
0 -4
-4 0
0
-4 1
I-Ie-40 q
H
H4m
e
4M
r C
i)
ii4 3P
0cpound
C
0 54
4 00
v 470
N
-O
tn
in in in
o r-Jiflifl
00
E-
q -4
u-4
fl4 q
H
do Itr
iC
iCi 0 q
0
licq
9
I~qoo a
a m
(n v
04oo z
o0 ~
o 0C
oo140
s4dP ~O
~o 44
~~
o
q
EEshy0
43 E
-4 d
0 0C
0
0
z~
80
(n C4
OD
a
Sn
5
t tA
0 ta
E44 4
b _0
L
H
E-
0
tcR~c 4
A
4q
4 V
C
)
~o
e00v0
an
0 P
f-4
n0-4C
n4
N (q
0V
C110-
4
I8
t-v(I qrN
r -
00
w-o
MM
Mo
dP O
iC
Edee
Xaa
4
Sn
c4
o
rntnL
0
04
mP
oq
a
M
OC
Tin
r
L
4
coPlc4~
dV~
i
N~~0
fn0~i w
0
nItc
E-
0r~j
of
0ciov0
j
Ooshy
-4
82
0
~~
-4-~-O
04
0
-IDc
o tn
0 0 000
z d
N
Ce4
CI
4 I
0
E-m
4C
4C
dOM
Eshy0
tq8L
16 o
t-OD
CD
r-V
o ei1
In
~ a
shy
0
udpaj
in
E400
dp
N
F
okooo~
I
0 1 1
c4 tLn
oo0
00 ro tor-
40
0 E
--b
R0
z O0 -4
( ~
c Ln Ici
-1
P
0 Pu4 C
ru
1
4
0r
84
qr-1
q w
w w
r-N
O
rm
m
q
09d
E
~~ v4rr ~
~ ~~
4-q004A0N
N044
ON
-4 0O
O
M M
tt-4
0 -
40
-4 0 40r0
~0
-4D
0 Il
r~-aOOr4-
Cq
z
dPL
4 ad N
0 0
00 V
Or 0
4a L
00000 0Y
V4
4
E-4
0I4
0A
0C
40
E-N
fl
f-q
4
4
C4
r4m
dP I0 ri
0qc
0 w~40 D
-Iqj r 00
0q
t0
e4I 0
P404
0
0
0 -4
N
m
0 r-4
85
dore~ r-rtn-d
c4 A
oo -4
0 OP 00CO
40-4
0
0 0 0lC
E-4
a a (
(4
~
e0-4
In O
~
LC
qU
)A
o
o
o 4H
0 o
l
0 ~
l V
0VC
)Hr4
-A0
H1
ob 8
c
N
0 00
0H
0
q Ci4 cq
0
qa~qmmmm
rvrodP
otnq44
1 0ro
en4004r4c 0~~~I eq
aI i
It0 dP
-
0n~wo86
I e V
i a S1ERFD MED
Ce KUMJREN IiRIrtUH BkRi(S) Ell IPfrUfl
(site of repxx~mts by ruitw of Srcwis)
Medid of ~ Ei4EGD HLXIIA Total (DW52)(W32) (WJ19) a3aisitim Of _ _ __ _ _ _ _ _-r~s _ __
liuta cf N ampZbwtr ofa Lzer of N
Inherited 0 4 13 2 I 6 12
the bither 1 27 as 13 63 40 78
2 1 3 4 21 5 10
Irite xvxfi 0 32 1M 19 95 51 96
RrzchdbI 0 30 94 19 100 49 96
1 2 6 - - 2 4
Givenit 0 31 97 is 95 4 96
1 1 31 1 53 2 49
padld0 3) 94 19 11) 49 96 by reqnmt
1 2 63 - - 2 4
Fated ty 0 32 IM0 19 10)0 51 ID
Ampired 0 32 100 14 74 46 90 after another
s 1 shy - 5 26 5 10
Nte Etra s lary not mrd tp t 100 die to mxding
3axm SxYW cda
87
TABLE VI-I
OMMENCE OF DISPL1ES
(Has respondent ever had a land or water dispute)
Galmi (N = 32) Moullela (N = 19) Both (N -=
Number Number Number Yes 825-- 10 -T3- Id-- 3
No 24 75 9 47 33 65
Source Survey data
TABLE VI-2
TYPE OF PAEM INVOLVED IN DISPLE
Galmi (N = 8) oullella (N I0) Both (N = 18)
Number Number Number
Perimeshyter 1 12 9 90 10 56
Rainfed 7 88 1 10 8 44
Source Survey data
TABLE VI-3
TYPE Oi CONLICT
Galmi (N = 8 0ullela (N = 1) Both (04 is1)
Number Number iumber
Irrigationout of turn 1 12 4 40 5 28
Boundarydispite 7 88 6 60 13 72
Source Survey data
88
TABLE VI-4
CONFLICT RESOLUTION LEVEL FOR ALL CONFLICTS
GALMI (N =8) MULLELIA (N=10) BOTH (N=18)
Number Number Number
With the Farmers Involved 3 38 5 50 8 44
Farmers and GMP Head 0 0 1 10 1 6
With Local Authorities (Village Chief Conseil- 2 25 1 10 3 17 ler Villageois)
With Perimeter Director 0 0 3 30 3 17
Higher Political 1 12 0 0 1 6 Authorities
Not Resolved 2 25 0 0 2 11
Source Survey Data NE Percentages may not add to 100 due to rounding error
89
VARIABLES AND CArEGORIES
ho do perim plots belong to
NA1 - Govnt 2 - Farmers farming 3 -(HA 4 -Other
Total
Who advises the Comit4 de Gestion
NA6 1 - Perim director 2 - Farmers 3 - Local authorities 4 - Higher local auth 5 - Agents amp director 6 - ONAIA Tahoua 9 - Donnt know
Total
Who calcul redev
NA1 -Perim director 2 - Agents amp director 3 - CG 4 - Dir Com Agents 5 - GMP heads amp dir 6 - GMP heads 7 --Farmers 8 - Taboua offioe
9 - Dont know
Total
TABLE VII -
PERIWrFR MANMA4E1r AND OMnIZATIO (PARCEL HOLDERS)
GALM (0=32) MOULLE[A (N=19) BOTH (N=51)-
5 156 3 158 8 15722 693 14 737 365 156 2 105 7
706 137
0 0 0 0 0 0 0 0 0 0 0 0
32 100 19 100 51 100
2 63 1 53 3 5914 438 14 737 28 5490 0 0 0 0 0 5 156 0 0 5 980 0 0 0 0 0 7 219 1 53 8 1572 63 3 158 5 98 2 63 0 0 2 39
32 100 19 100 51 100
1 31 0 0 1 205 156 II 579 16 3143 94 1 53 4 78
10 313 1 53 11 2167 219 1 53 8 157 0 0 0 0 0 00 0 0 0 0 00 0 0 0 0 0 2 63 4 211 6 118 4 125 1 53 5 98
32 100 19 I00 51 I00
90
TABLE VII -2
PERIMETER MANAGaEE AND ORGANIZATION
(PAICEL iicL~ae)
VARIABLES AND
CATEW~RIES GALt4I (14=32) L4JLLEIA (N=19) 8301H (N=51)
Who decides when to plant
1 31 0 0 1 201 2 63 17 895 19 373 2 2 63 1 53 3 59 3 16 500 0 0 16 314 4 7 219 1 53 8 157 5 0 0 0 0 0 0 6 0 0 0 0 0 0 7 0 0 0 0 0 08 2 63 0 0 2 399 2 63 0 0 2 39
Total 32 100 19 100 51 100
Who decides when to irrigate
NA 1 31 0 0 1 20 1 8 250 17 895 25 490 2 2 63 0 0 2 39 3 14 438 2 105 16 314 4 6 189 0 0 6 118 5 0 0 0 0 0 06 0 0 0 0 0 0 7 0 0 0 0 0 0 8 0 0 0 0 0 0 9 1 31 0 0 1 20
Total 32 100 19 100 51 100
91
TABLE VII -3
PmqErR mmat wr AaD omizAaio
VARIABLES AND CATE)GORIES
Who decides who gets ox
NA 1 2 3 4 5 6 7 8 9
Total
Does R attend ccnite coop meetings
NA-no perim parcels 1 - yes 2 - no 3 -sometimes
Total
Relation to GMP head
NA 1 = same family 2 - same quartier 3 = not related
Total
GALs4
1 0 0
22 1 0 0 0 0 8
32
2 13 14 3
32
1 15 11 5
32
(PARCEL OLD RS)
(N=32) 14OULLELA (N=19) ksra (L4=51)
31 0 0 1 20 0 2 105 2 39 0 0 0 0 0 693 12 632 34 667 31 1 53 2 39 0 0 0 0 0 0 2 105 2 39 0 2 105 2 39 0 0 0 0 0 250 0 0 8 157
100 19 100 51 100
63 0 0 2 39 406 18 947 31 608 438 1 53 15 294 94 0 0 3 59
100 19 100 51 100
31 3 158 4 78 469 10 526 25 490 344 2 105 13 255 156 4 211 9 176
100 19 100 51 10)
92
TABLE VII - 4
pEIMffER 1 3 -1Er AND ORGANIZATION
(PARCEL dOLDEiRS)
VARAB[Eamp AND GAL141 (N~=32) 140LULA (Ni=19) WWft (N=F51)
CATEGO0RIES
Has R received warning from GKP head
7u43 1581 31 5 983 1582 63 8241 yes 13 684 42
= 29 906 2 no
51 10019 10032 100Total
Who tells to clean the canals
3 590 03 94 9 176NA 7 3682 63 - Perim director 32 6271 9 47423 719
2 - GMP head 0 0 1 20 1 31
3 - Other farmers 0 2 39 2 63
No one just does 0
4 784 - 3 1581 31 5-Other
51 10019 10032 100Total
How does R pay redevanCe 2 391 531 31
NA 18 947 31 608 13 406Cash crop sales1 - 6 1180 06 189
Cash amp food crops 2 392 - 0 02 633 - Commerce amp crops 0 0 3 59
3 944 - Commerce rev 0 0 2 39
2 635 - Migration income 0 0 1 20
1 31 6 - Animal sales 2 63 0 0 2 39 7-Sala-y 1 200 01 318 - Skill-inc crops 0 0 1 20
1 319-From relative
51 10019 10032 100Total
93
TALE VII - 5
PER1~rER pound4AGEMENr AND ORANIZATION
(PAXM OLD~ERS)
VARIABLES AND CATCBORIES GAL4I (N=32) MOULLEEA (N=19)
What day does R irrig
NA 2 63 2 105 1 2 3
14 11
2
438 344 63
2 6 4
105 326 216
4 6 7+ 8 OK others do it
1 0 0 1
31 0 0 31
3 0 0 0
158 0 0 0
9 doesnt know 0 0 0 0
Total 100 19 100 51
Who notifies R of irrigNA 2 63 2 105
1 - perim director 2 63 6 326 2 - GMP head Cooppres 21 656 7 368 3 - other farmers 2 63 0 0 4 - no oneknows sched 4 125 4 211 5 - tam-tam 1 31 0 0
Total 32 100 19 1000
Does R hear about irr in time
NA 2 63 2 105 1 = yes 3 94 1 53 2 = no 27 844 16 842
Total 32 100 19 100
Lack of water NA 2 6 2 105
1 - not enough 4 12 3 1582 - enough 20 63 11 579 3 - sometimes insuff 5 16 3 1588 - OK other irrig 1 3 0 09 - doesnt know 0 0 0 0
Total 32 100 19 100
94
aHnI (N=51)
4 78 16 314 17 333 6 11d 4 78 0 0 0 0 1 20 0 0
100
4 78 8 157
28 549 2 157 8 157 1 20
51 00
4 78 4 78
43 843
51 100
4 78 7 137
31 608 8 157 1 20 0 0
51 100
BIBLIOGRAPHY
Arnould Eric 1986 Maggia Valley Systems Report of the Consulting
Anthropologist WMS-II Project Cornell Universityand USAID Niger
Briend Roger1986 Rapport Annuel Campagne Hivernal 1985 Campagne Saison
S~che 198586 Niger ONAHA
Chayanov AV 1966 Theory of Peasant Economy ed D Thorner B Kerblay
and R Smith Homewood Illinois Richard D Irwin Inc
Coward E Walter 1985 Property in Action The Property Factor in Irrigation
Development Khon Kaen University Thailand Paperpresented at Conference at Khon Kaen University
El-Kholy Heba Aziz 1985 Property Relations and Irrigation Organizations A Case
Study of Water Lifting Devices in an Egyptian Village inthe Delta MS thesis Ithaca New York Cornell University
GERSAR 1981 Amdnagement Hydroagricole de la Plaine de Galmi
Projet Etudes Preliminaires Niger ONAHA
Horowitz M 1983 Niger A Social and Institutional Profile New York
Institute for Development Anthropology
Laucoin Guy1971 Vers lautogestion des am~nagem3nts au Niger
Developpement ot Civilisations no 4454-62
1973 La gestion des amdnagements hydro-agricoles au NigerDeveloppement et Civilisations no 5121-31
Norman W Ray1986 Gestion de 1eau dans lamdnagement hydro-agricole de
Moullela Une presentation des donn6es de la campagne de 1985 Paper prepared for the Office National dAmdnagements Hydro-Agricoles Rdpublique du NigerSpecial Study USAIDWMS-II Project
1987 Developed and Traditional Small-Scale Irrigation inNiger West Africa PhD dissertation draft IthacaNew York Cornell University
95
Rdpublique du Niger1985 Evaluation du temps de travail des paysans sur
quelques amdnagements hydro-agricoles du Niger Niger Ministere du Plan
SOGETHA 1968 Etude Agro-Economique ds Petits Pdrim~tres en
Exploitation dans la Vallde de la Maggia Mission 1967 Grenoble France SOGETHA
1970 Etude Agro-Economique des Petits Pdrim~tres en Exploitation dans la Vallde de la Maggia Mission 1969--Rapport Final Grenoble France SOGETHA
United States Agency for International Development1984 Niger Irrigation Subsector Assessment Volumes One and
Two Niger USAID
1986 Applied Irrigation Research and Coordination (AIRC)Project Identification Paper USAIDNiger
Wells John Craig1985 Sedimentation of Small Irrigation Reservoirs in the
Ader Doutchi Maggia WMS-II Project Trip ReportIthaca New York Cornell University
96