report - australian securities exchange - · pdf filebontang burrup orica annual report 2013...
TRANSCRIPT

Orica
Annual
2013 Report
For
per
sona
l use
onl
y

No Accidents Today
Succeed Through Collaboration
Find Valuable Solutions
It’s Our Business
Annual
2013
Clever ResourcefulSolutions
Report
Report
For
per
sona
l use
onl
y

ORICA lIMItEd ABN 24 004 145 868
Lorena
Carseland
Marion
Hallowell
Georgetown
Geneva
Antofagasta
Brownsburg
About Orica 2
Chairman’s Message 4
Managing Director’s Message 5
Review Of Operations and Financial Performance 6
Board Members 14
Executive Committee 15
Sustainability 16
Corporate Governance Statement 18
Directors’ Report 22
Directors’ Report – Remuneration Report 25
Lead Auditor’s Independence Declaration 49
Income Statement 50
Statement of Comprehensive Income 51
Balance Sheet 52
Statement of Changes in Equity 53
Statement of Cash Flows 54
Notes to the Financial Statements 55
Directors’ Declaration 126
Independent Auditor’s Report 127
Shareholder’s Statistics 129
Ten Year Financial Statistics 130
Shareholder Information 132
Shareholder Timetable 134
Contents
Ammonium NitrateBontang (Indonesia) Burrup (Australia) under construction Carseland (Canada) Geneva (USA) – 50% joint venture Kooragang Island (Australia) Yarwun (Australia)
Major Manufacturing SitesFor
per
sona
l use
onl
y

1
Botany
Gyttorp
Gomia
Weihai
Yarwun
Helidon
Smithfield
Kalgoorlie
Nanling
Laverton
Kooragang Island
Bontang
Burrup
Orica Annual Report 2013
An Australian Company with a Global Footprint
Our Markets
Initiating Systems Antofagasta (Chile) Brownsburg (Canada) Gomia (India) Gyttorp (Sweden) Helidon (Australia) Lorena (Brazil) Nanling (China) Weihai (China)
Bulk/Packaged Explosives Gomia (India) Gyttorp (Sweden) Hallowell (USA)Kalgoorlie (Australia) Lorena (Brazil)
Ground Support ServicesGeorgetown (USA) Marion (USA) Smithfield (Australia)
ChemicalsBotany (Australia) Laverton (Australia) Yarwun (Australia)
For
per
sona
l use
onl
y

2
Orica is the largest provider of commercial explosives and blasting systems to the mining and infrastructure markets, the global leader in the provision of ground support for mining and tunnelling and a leading supplier of sodium cyanide to the gold industry. Orica also supplies general chemicals across a diverse range of markets, including agriculture, building and construction, food and beverage, flavours and fragrances, personal care, pulp and paper, plastics, and water treatment industries including the provision of clean drinking water.
An Australian company with a global footprint, Orica has a diverse workforce of over 14,500 people, with operations in more than 50 countries and customers in more than 100. Orica’s global vision is to provide Clever Resourceful Solutions to its customers around the world. The values that support a united purpose for what Orica stands for are: No Accidents Today, Succeed Through Collaboration, Find Valuable Solutions and It’s Our Business.
Orica delivers Clever Resourceful Solutions for the many challenges facing the mining industry through ground-breaking technology and a significant research and development focus. Explosives customer needs are met through a personalised combination of products, delivery, storage and loading, blasting services, technology and tools, along with advanced design solutions.
Customers’ needs are varied, ranging from productivity improvements, recovery of ore and reducing environmental impacts, through to operating safely and efficiently. Orica tailors the offering to meet these needs.
In an economic environment with considerable cost pressures, along with challenging ore bodies, Orica’s cutting-edge technologies provide valuable solutions to customers. This highly technical suite consists of advanced blasting service solutions, rock on ground and rock to specification. These services can reduce energy cost further downstream, which offers significant cost saving, along with higher recovery of material, lessened environmental impact and greater blasting control.
Orica uses its flexible supply chain to ensure security of supply of mining inputs through its manufacturing plants, capital-efficient joint ventures and supply alliances. This supply chain spans across Australia Pacific, Asia, EMEA, Latin America and North America, providing capabilities unmatched in the industry. Through this capability Orica has earned trusted partner status from its customers around the world.
At Orica we are committed to the safe handling and use of products and services to ensure the protection of people, the environment and our customers’ business reputations. We believe that our responsible corporate practices will enhance our financial performance and benefit the communities in which we work.
About Orica
Orica Annual Report 2013
For
per
sona
l use
onl
y

3
Mining ServicesBlasting
Bulk explosives
Packaged explosives
Electronic Blasting Systems
Initiating systems
Seismic systems
Blasting services
Delivery and magazine services
Surface mining, underground, quarry & construction – design, loading and firing services
Technical services – training, auditing, blast modelling and blast improvement
Blast measurement services
Blasting environmental effects and risk management services
Performance services – blasting to specification
Ground Support
Steel and composite ground support systems
Injection and high volume chemical ground support systems
Ground support services
Mine ventilation control systems
Emergency and recovery services support
Specialised mine service and repair products
Mining Chemicals
Sodium cyanide
Sparge – cyanide delivery and
dissolutions systems
PRO service – technical in-use mineral processing reagent support
Specialty mining chemicals
Flotation reagents
Emulsifiers
General ChemicalsAgriculture
Building and construction
Food and beverage
Flavours and fragrances
Personal care
Pulp and paper
Plastics
Water treatment and Watercare
For
per
sona
l use
onl
y

4
“ Orica has operations in over 50 countries and customers in more than 100. More than 14,500 people work for Orica each day across hundreds of sites. The expertise and collective commitment of our employees contributes greatly to Orica’s performance.”
In 2013 Orica has had a challenging year in what is a period of transition for the Company.
For the first time in more than a decade the Company’s net profit before individually material items has fallen behind that of the previous year. Before individually material items, net profit after tax (NPAT) was $602 million for the full year ended 30 September 2013, down from $650 million for the previous corresponding period. After individually material items, Orica recorded a statutory NPAT of $602 million, up $199 million or 49% compared with the previous corresponding period (pcp) of $403 million.
Overall, against a difficult background, this is a reasonable result that sees Orica entering 2014 with its position undiminished as the global leader in the provision of explosives to the resources and infrastructure sectors.
The Board is pleased to declare a fully franked final dividend of 55 cents per ordinary share.
The reduction in earnings in 2013 resulted from the impact of weak global economic conditions, which affected demand and pricing for ground support products and services as well as for chemicals. There were higher than expected costs associated with completing the integration of the ground support business into Mining Services. Higher depreciation and interest charges which negatively impacted earnings.
However the strategy of extending services and promoting product differentiation has led to an increased contribution from Mining Services across its explosives markets. Mining chemicals products showed improved results on the back of better plant performance.
Orica has operations in over 50 countries and customers in more than 100. More than 14,500 people work for Orica each day across hundreds of sites. The expertise and collective commitment of our employees contributes greatly to Orica’s performance.
With the Board’s support, management have overseen the completion of Orica’s transition to a functional structure and brought greater focus on operational excellence, customer engagement and product innovation.
More disciplined capital allocation is ensuring shareholders’ funds are deployed to the most value accretive opportunities. The focus on disciplined capital allocation, operational performance and reducing costs has placed the company in a better position to invest for future growth and respond to shareholders’ dividend expectations.
Significant investment has continued at the Kooragang Island, Australia, facility which has improved operational performance through changes in the plant, processes and people at the site. Our efforts to engage openly with the surrounding community included the launch in July of a Community Investment Program to provide grant funding to eligible groups and support positive local initiatives.
Reliable supply and the breadth of Orica’s global operations remain amongst its most important attributes. The Company’s exposure to resilient resource markets, such as Australia, Asia and Latin America, continues to underpin financial performance. Asian demand for natural resources, driven by urbanisation and a growing middle class, will continue to support growth in ammonium nitrate demand.
In addition, Africa and the CIS both remain important opportunities for Orica. Africa represents an emerging market with growing economic and political stability and large, relatively undeveloped mineral endowment. It is a strategic growth opportunity given Orica’s global relationships with major mining companies now operating in the region.
Over the past 18 months, Orica has undertaken a global initiative under the banner of Project Sustain to provide consistent leadership and solutions to ensure Orica’s operations meet the same high standards across all aspects of Safety, Health, Environment and Community. The project has now been completed and its results incorporated into the Company’s daily operations. Orica is committed to continuous improvement in this area.
We will continue to work with communities and regulators and all stakeholders to ensure Orica continues to earn its social licence to operate.
Last year Short Term Incentives were not paid to senior executives as the economic profit threshold was not reached. As previously advised, Orica’s STI scheme was revised for the 2012/13 year with separate thresholds for four separate components. For this year payments were made for those components where threshold performance was achieved. Details are given in the Remuneration Report.
Throughout Orica, executives and employees have worked through a period of tremendous change and considerable pressure. As Ian Smith’s report illustrates, significant improvements have been made in all areas of the business under their control.
In 2013 three new directors, Maxine Brenner, Gene Tilbrook and Alberto Calderon, joined the Board. Each has brought a unique perspective, deep corporate experience and multi-disciplinary expertise to the Board’s deliberations.
I also thank two directors who leave the Board for their substantial contributions. Garry Hounsell resigned as a non-executive Director in February 2013 after nine years’ service. Michael Tilley will retire at the forthcoming Annual General Meeting after ten years. Mike and Garry played important roles on a number of Board Committees and in Board deliberations. Mike was Chair of the Safety Health and Environment Committee.
The 2013 Annual Report marks my last as Chairman and as a Director. Following the Annual General Meeting in January 2014, Russell Caplan will assume the role of Chairman of the Board. Russell has served on the Orica Board and its Committees with great distinction for the past six years and his counsel and contributions have been invaluable. Under his leadership of the Board I am confident that Orica will continue to prosper.
On a personal note, I would like to express my sincere thanks to the employees and executive team at Orica, my fellow directors and most importantly to shareholders for their support over the 12 years that I have had the privilege of serving on the Orica Board.
In this period there have been many important initiatives which have shaped the strategy and direction of the Company, including the transformational acquisition of Dyno-Nobel and the successful spin-out of DuluxGroup. I am also conscious that the Excel business acquired by Orica in 2007 has not met expectations. The record is therefore not unblemished. Overall though, our Company has positioned itself as the world leader in its chosen area of business and is well placed for further success in the coming years.
P J B Duncan Chairman
Chairman’s Message
Orica Annual Report 2013
For
per
sona
l use
onl
y

5
“ In conjunction with Orica’s latest electronic initiating systems, a number of sophisticated blasting techniques were implemented to improve the productivity of customers’ mining operations. Such innovation continues to make Orica the supplier of choice in its markets.”
will receive matched funding from Orica and both governments to establish the pilot plant at the University. If the technology can be successfully commercialised, it has the potential to contribute to a meaningful reduction in both Orica’s and customers’ CO
2 emissions.
Stakeholder EngagementIn 2013 progress has been made to strengthen the Company’s relationship with its host communities and other stakeholders.
To support improved community engagement, stakeholder plans have been developed and implemented at a number of manufacturing sites in Australia and New Zealand. A rollout of such an approach across the globe is scheduled for 2014.At Botany, Australia, Orica responded to community concerns about the potential for mercury contamination offsite from past operations, by funding an independent study overseen by the New South Wales Government. The study will assess the need for any additional independent testing being conducted using scientifically rigorous methods.
Some of Orica’s stakeholders were able to see first-hand the professionalism, teamwork and technical capability of the Orica-GreenEDGE professional road cycling team, while local communities and employees benefited from athletes’ participation at community events and site visits. The success of the Orica-GreenEDGE team in 2013 included stage victories at the Tour de France and the women’s Orica-AIS road team finished the season ranked number one in the world.
People To ensure employees have an understanding of Orica’s vision, values, strategy and the core competencies required to achieve the Company’s objectives, a global training program, Orica Seven Pillars, was commenced. Completed by 6750 employees in 2013, it will reach 85% of all employees by April 2014.
During the year, Orica concluded the first stage of a multi-million dollar investment in systems to migrate all employees onto one global Human Resources (HR) information system, and to enable all employees to access HR support over the phone, chat or email. Orica’s HR information system, PeopleNet, aims to improve the way Orica organises, recruits, rewards and develops its workforce.
Operational HighlightsSignificant improvement in the performance of major manufacturing plants has been delivered through upgrading computerised instrumentation and monitoring equipment, improved maintenance, process improvements and better engagement with local communities that host Orica’s operations. Global manufactured ammonium nitrate volumes in 2013 were at record levels as well as Brownsburg, in Canada, having its best ever production year
Orica’s annual earnings declined in 2013 against the backdrop of weaker than expected global economic conditions and the impact associated with the optimisation of the ground support business which is now fully integrated with Mining Services.
This year also saw the initiation of changes across the important areas of Safety, Health, Environment and Community (SHEC) and Risk. These enhancements are designed to provide a more consistent approach across Orica which will help improve operations and Orica’s social licence to operate.
Sustainability Understanding that chemical energy is around 25 times more effective than mechanical energy for the breaking of rock puts Orica in a privileged position to establish blasting solutions that enable significant greenhouse gas improvements. This is achieved with the reduction of energy consumed in the comminution (crushing and grinding) of rock during mineral processing.
In addition, abatement technology already installed at some of Orica’s biggest sites has reduced Orica’s annual carbon emissions by the equivalent of taking more than 250,000 vehicles off the road.
Orica has joined the Australian and NSW governments to support a world-first research pilot project. The technology transforms captured carbon dioxide emissions into solid carbonate for safe disposal or use in “green” building materials. Mineral carbonation mimics and accelerates the Earth’s own natural carbon sink mechanism by combining CO
2 with low grade minerals to create
inert carbonates.
Mineral Carbonation International Pty Ltd (MCi) is a joint venture between Orica, the University of Newcastle and the GreenMag Group. MCi
Ian K Smith Managing Director and CEO
for electronic detonators (up 10% on the prior year) and sodium cyanide production at Yarwun, Australia, reaching record levels. The Bontang, Indonesia, AN plant successfully reached nameplate capacity. In conjunction with Orica’s latest electronic initiating systems, a number of sophisticated blasting techniques were implemented to improve the productivity of customers’ mining operations. Such innovation continues to make Orica the supplier of choice in its markets.
Orica continued to grow new markets around the world. An example of this growth was the announcement of a 10-year supply contract for explosives and blasting services with Apatit, a subsidiary of a world leading fertiliser company, PhosAgro. The contract will deliver up to 700,000 tonnes of explosives per annum, as well as “down the hole” services for mine sites in the Murmansk Province in Russia.
Growth InitiativesSlower demand growth in the South East region of Australia has meant that the full expansion of the Kooragang Island (KI) plant in Newcastle, New South Wales, will not be needed for several years. Even though the KI capacity will not be raised to 750ktpa at the moment, the market profile means that the plant’s supply capacity needs to be increased in the short term. An incremental development to meet this growing demand will increase AN capacity by 70ktpa to 500ktpa with the construction of a 10,000t nitric acid import tank. To be delivered in mid-2015, this low capital approach will ensure Orica meets demand without major capital commitment until such time as the market warrants a full expansion to 750ktpa of Ammonium Nitrate.
The development of the 330 ktpa Burrup AN plant, Australia, in a joint venture with Yara (45%) and Apache (10%), remains on budget and schedule. Commissioning is due to commence mid to late-2015, with nameplate production rates expected by the end of 2016. Orica has the marketing and distribution rights for the entire plant output which will mainly supply the growing iron ore markets in the Pilbara.
OutlookThrough its strategy of providing differentiated products, services and solutions that will enhance value for mining and infrastructure customers, Orica is well positioned to take advantage of the attractive long-term industry fundamentals of mining. Strong worldwide manufacturing and sales capabilities and a cost efficient, secure and reliable supply chain will also benefit customers.
Orica’s net profit after tax before individually material items in 2014 is expected to exceed 2013; however volatile market conditions add a greater degree of uncertainty to the outlook.
Managing Director’s Message
Orica Annual Report 2013
For
per
sona
l use
onl
y

6
Review of Operations and Financial Per formance
Statutory net profit after tax (NPAT) and individually material items1 for the full year ended 30 September 2013 was $602M. The previous corresponding period (pcp) was $403M.
NPAT before individually material items2 was $602M (pcp: $650M).
KEy FINANCIAlS (BEFOrE INDIvIDuAlly MATErIAl ITEMS)
EBITDA3 was steady at $1,269M (pcp: $1,274M).
EBIT4 was down 4% at $985M (pcp: $1,023M).
Net operating cash flows at $1,059M, up 95% from $544M in the pcp.
Earnings per ordinary share down 7% to 165c.
Return on shareholders’ funds at 17.3%, down from 18.9% in the pcp.
Gearing7 was 36.9%, an improvement from 41.5% in the pcp.
Interest cover of 6.6 times5.
Final fully franked ordinary dividend of 55 cents per share, up 2%.
Business Summary• EBIT of $985M was 4% below the pcp.
Weakness in demand and pricing for ground support products and services, combined with higher depreciation and lower asset sales have eroded the benefit of a stronger contribution from explosives and mining chemical products and services.
• Mining Services EBIT down 2% to $993M.
– contribution from explosives products and services was in line with pcp after adjusting for the impacts of prior year one-off items.
– significant weakness in demand and pricing for ground support products and services and one-off costs associated with the integration of the ground support business into the Mining Services division.
– increased contribution from mining chemicals products.
• Chemicals EBIT down 8% to $92M impacted by subdued conditions in most industrial markets in Australia and New Zealand.
2014 OutlookGroup net profit after tax before individually material items in 2014 is expected to exceed 2013, however volatile market conditions add a greater degree of uncertainty.
Earnings per share (c)
185.6174.6 173.5 177.9
165.4
10 11 12 1309
(Before individually material items)
Earnings per share (cents)(Before individually material items)
Sales ($M)
5,8126,471 6,182
6,674 6,898
10 11 12 1309
Sales ($M)8
EBIT ($M)
1,009954
1,028 1,023 985
10 11 12 1309
EBIT ($M)8
Orica Annual Report 2013
$1,059MNet operating cash flows at $1,059M, up 95% from $544M in the pcp.
For
per
sona
l use
onl
y

7
revenueSales revenue of $6.9B increased by $224M (3%), driven primarily by:
• increased revenue from explosives products in all regions with the focus on supplying improved value propositions through more advanced technology products and services;
• improved pricing for mining chemicals; and
• a stronger USD currency.
Offset by weakness in demand and pricing pressure for ground support products and services.
Earnings Before Interest and Tax (EBIT)EBIT decreased by 4% to $985M (pcp $1,023M). Decreased earnings were attributed to:
• one-off costs associated with the integration of the ground support business into the Mining Services division ($29M);
• reduced demand for ground support products and explosives was partly offset by higher volumes in the Chemicals business ($21M);
• weakness in pricing for ground support and lower average pricing in the Chemicals business was partly offset by higher pricing for sodium cyanide ($33M);
• higher other costs impacted by inflationary factors, the commencement of production from the Bontang plant and project start up costs in Africa ($35M);
• increased depreciation mainly arising from commencement of the new Bontang plant and a full year of operation of the Kooragang Island ammonia plant ($33M); and
• lower profit from land sales ($23M).
Partially offset by:
• non-recurrence of the Kooragang Island shutdown costs incurred in the first half of 2012 (+$90M);
• improved services and product mix particularly in North America and Latin America and higher explosives pricing in North America (+$36M); and
• a favourable FX impact due to the strengthening USD and other items (+$10M).
InterestNet interest expense of $150M was $22M higher than the pcp ($128M) due to lower capitalised interest following the commissioning of the Bontang plant and higher average debt levels partly offset by lower average interest rates. Capitalised interest was $12M (pcp: $38M) and interest cover was 6.6 times (pcp: 8.0 times).
Tax ExpenseAn effective underlying tax rate of 25.6% (pcp: 25.0%).
Net ProfitNPAT before individually material items decreased 7% to $602M (pcp: $650M).
Individually Material ItemsThere were no individually material items for the period. A loss of $247M after tax relating to an impairment of goodwill in the former Minova segment was recorded in the pcp.
Certain non-IFRS information has been included in this report. This information is considered by management in assessing the operating performance of the business and has not been reviewed by the Group’s external auditor. These measures are defined in the footnotes to this report.
1. Equivalent to Net profit for the period attributable to shareholders of Orica Limited in the Segment report within the Orica Annual Report.
2. Equivalent to Profit after income tax expense before individually material items attributable to shareholders of Orica Limited in the Segment report.
3. EBIT plus Depreciation and Amortisation.
4. EBIT (equivalent to Profit / (loss) before individually material items, net financing costs and income tax expense in the Segment report).
5. EBIT / Net interest expense.
6. Total interest bearing liabilities less cash and cash equivalents.
7. Net debt / (net debt + book equity).
8. Excluding DuluxGroup which was demerged from Orica on 9 July 2010.
Net profit after tax before individually material items net of tax ($M)
676646 642 650602
10 11 12 1309
NPAT ($M)(Before individually material items net of tax)
Dividends per share ($)
0.950.970.90 0.92 0.94
10 11 12 1309
Dividends per share ($)
For
per
sona
l use
onl
y

8
Key Points• EBIT contribution from Mining Services
down 2% to $993M.• The contribution from explosives products
was in line with last year after adjusting for the prior year impact of the Kooragang Island shutdowns and asset sales.
• Globally, total explosives volumes were down 2% with reduced demand in US coal markets and Latin America partly offset by growth in the Pilbara iron ore region, South Eastern Australian coal markets and the emerging markets of Africa and Russia.
• Improved product mix with bulk emulsion volumes up 6% offset by a reduction in AN volumes down 10%. Declines in explosives volumes in North American coal markets and the Latin American market have been offset by higher margin sales to US metals markets, improved customer mix in Latin America and higher volumes in Australia.
• Pricing for explosives has been flat to slightly down in most markets apart from North America, where modest price increases have been achieved.
• Strong growth in Electronic Blasting Systems (EBS) with volumes up 11% versus the pcp.
• Increased contribution from mining chemicals.
• Significant decline in contribution from ground support products and services due to weaker demand and continued pricing pressure. One-off costs of $29M in integrating the ground support business into Mining Services were incurred during 2013.
regional SummariesAustralia/Pacific• EBIT of $623M, up 20% ($105M) on the
pcp.• Higher contribution from explosives with
volumes up 5% on market share growth in the Pilbara and the South East region partially offset by lower volumes in the North East region. Volumes increased 18% in the South East region and 67% in the Pilbara and declined 9% in the North East.
• Steady margins for explosives supported by a shift to higher margin products and services.
• Improved contribution from mining chemicals due to higher sodium cyanide prices and improved production performance at the Yarwun facility.
• Significant reduction in contribution from ground support products and services due to volume and price declines in key underground coal markets. The integration of the Australian ground support activities into Mining Services has delivered efficiency improvements in the second half.
North America• EBIT of $109M, down 24% ($35M) on the
pcp. EBIT including the contribution from the global hub was $172M, down 15% ($30M) on the pcp. The earnings decline is due mainly to the reduction in contribution from ground support products, higher purchase costs for ammonium nitrate as a result of a third-party supplier outage and weaker demand for explosives from coal markets.
• Explosives volumes were down 6% on the pcp with 14% lower demand from the Eastern coal region partly offset by 6% growth in metals markets in Canada and South West US. Quarry and Construction volumes improved during the second half. Modest increases in explosives pricing for bulk products sold into the metals markets and good EBS pricing across the business largely offset the impact of reduced explosives volumes.
• Significant decline in contribution from ground support products as a result of weaker demand. Whilst steel volumes were flat, chemical volumes declined 20% as customers switched to lower cost alternatives.
latin America• EBIT of $87M, up 3% ($3M) on the pcp.
EBIT including the contribution from the global hub was $115M, up 1% ($1M) due to a focus on higher margin products and services and the favourable impact from a recent land sale.
• Explosives volumes were down 8% following the loss of low margin business in Peru, weaker metals markets in Brazil and customer strikes in Colombia.
• Moving towards a services oriented offering has led to startup costs ahead of future revenue benefits.
Europe, Middle East and Africa (EMEA)• EBIT of $64M, down 53% ($72M) on
the pcp due to structurally challenging conditions in most ground support markets, non-recurrence of land sales ($27M) from pcp and the impact of a weak first half year result for explosives products due to the protracted European winter and slow economic growth in European markets.
• Explosives volumes increased 8% due to stronger growth in the second half of the year in the emerging markets of Africa and CIS. Volumes were up 19% in Africa and 32% in CIS on a year-on-year basis.
• Pricing for explosives products remained weak.
• Significant decline in contribution from ground support products due to weak European coal markets. Many European coal producers struggled to compete with cheap coal imports from North America.
• Project startup costs impacted negatively on the results for the African region.
review of Operations and Financial Performance continued
Mining Services
year Ended September 2013
A$M 2013 2012 Change F/(u)
Sales Revenue 5,770.2 5,629.8 2%
EBIT 992.7 1,009.5 (2%)
Operating Net Assets 5,589.5 5,064.7 10%
EBIT:
Australia/Pacific 623.3 518.4 20%
North America 108.9 144.2 (24%)
Latin America 86.7 83.8 3%
EMEA 63.8 135.4 (53%)
Other 110.0 127.7 (14%)
Other comprises:
North America – Operations 63.1 57.8 9%
Latin America – Operations 28.1 29.7 (5%)
Global Hub – Operations (46.9) (53.8) 13%
Global Hub 44.3 33.7 31%
Asia and head office 65.7 94.0 (30%)
Total mining services other 110.0 127.7 (14%)
1st Half EBIT2nd Half EBITEBIT Margin
586.9559.1 593.4 557.5
429.3443.2 416.1 435.2
11 12 1310
20%21%
0
300
600
900
1200
EBIT
A$M
EBIT
MA
RG
IN
18%17%
EBIT ($M) and EBIT margin graph EBIT Margin %
EBIT Margin
1st Half EBIT
2nd Half EBIT
Orica Annual Report 2013
For
per
sona
l use
onl
y
9
Other (Asia, Global Hub and Head Office)• EBIT of $110M, down 14% ($18M) on
the pcp. Excluding profit in the global hub related to operations in North America and Latin America, the underlying EBIT was $19M, down 53% ($21M) on the pcp.
• One-off costs associated with the integration of the ground support business into Mining Services.
• Significant decline in contribution from ground support in China due to weak demand and increased competition.
• Explosives volumes declined 3% in Asia with a 15% decline in Indonesian volumes partly offset by higher Indian volumes. The decline in Indonesian volumes was due to the temporary closure of two key customer sites related to specific customer issues.
• Explosives pricing in Indonesia was stable due to the contracted customer profile, while pricing pressure continued in the Indian market.
• Lower explosive product volumes and pricing in China.
• Global Hub Operations costs of $47M were down $7M on the pcp due mainly to lower research and development recharges and other support costs.
Perspectives for 2014• Subdued demand conditions in most explosives
markets excluding the Pilbara, CIS and Africa, where growth is expected to continue.
• General pricing pressure is expected to continue although the impact on margins is expected to be offset by efficiency gains and the provision of higher value customer offerings.
• Sodium cyanide volumes are expected to remain flat on an annual basis, although customer destocking in the short term will most likely see softer volumes in the first half.
• The non-recurrence of the one-off costs of integrating the ground support activities and delivery of synergies following the integration into Mining Services.
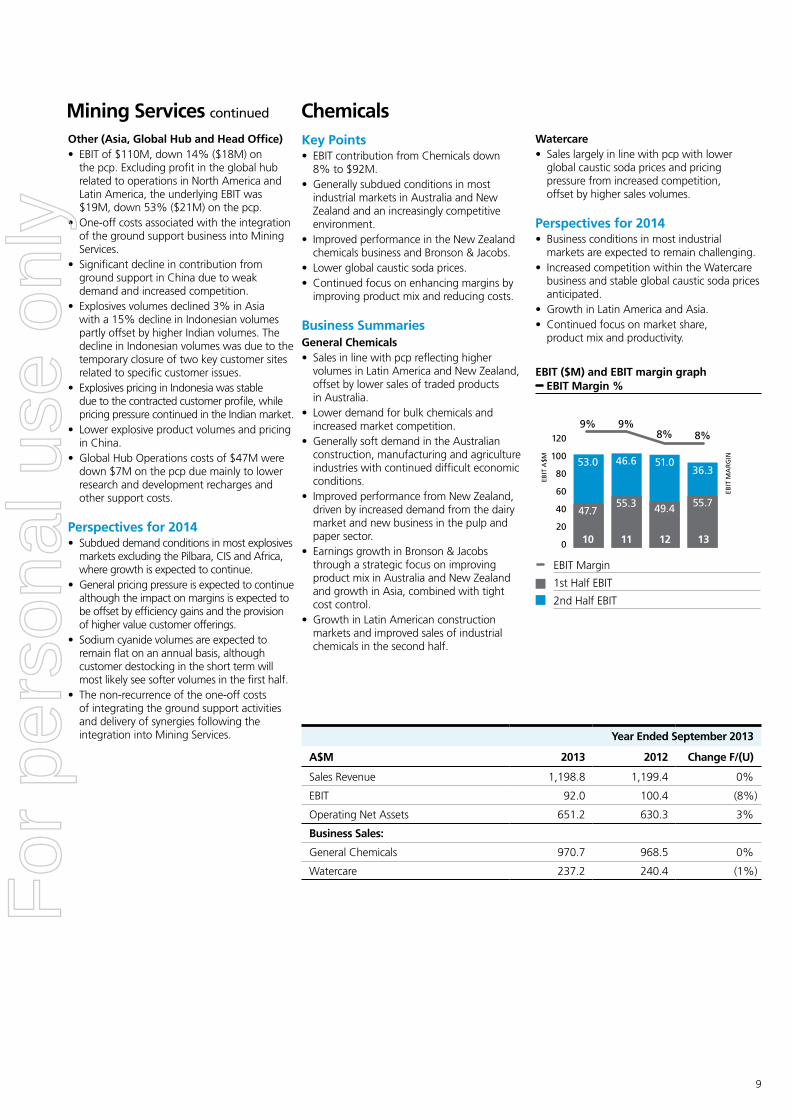
Key Points• EBIT contribution from Chemicals down
8% to $92M.• Generally subdued conditions in most
industrial markets in Australia and New Zealand and an increasingly competitive environment.
• Improved performance in the New Zealand chemicals business and Bronson & Jacobs.
• Lower global caustic soda prices. • Continued focus on enhancing margins by
improving product mix and reducing costs.
Business SummariesGeneral Chemicals• Sales in line with pcp reflecting higher
volumes in Latin America and New Zealand, offset by lower sales of traded products in Australia.
• Lower demand for bulk chemicals and increased market competition.
• Generally soft demand in the Australian construction, manufacturing and agriculture industries with continued difficult economic conditions.
• Improved performance from New Zealand, driven by increased demand from the dairy market and new business in the pulp and paper sector.
• Earnings growth in Bronson & Jacobs through a strategic focus on improving product mix in Australia and New Zealand and growth in Asia, combined with tight cost control.
• Growth in Latin American construction markets and improved sales of industrial chemicals in the second half.
Watercare• Sales largely in line with pcp with lower
global caustic soda prices and pricing pressure from increased competition, offset by higher sales volumes.
Perspectives for 2014• Business conditions in most industrial
markets are expected to remain challenging.• Increased competition within the Watercare
business and stable global caustic soda prices anticipated.
• Growth in Latin America and Asia. • Continued focus on market share,
product mix and productivity.
ChemicalsMining Services continued
year Ended September 2013
A$M 2013 2012 Change F/(u)
Sales Revenue 1,198.8 1,199.4 0%
EBIT 92.0 100.4 (8%)
Operating Net Assets 651.2 630.3 3%
Business Sales:
General Chemicals 970.7 968.5 0%
Watercare 237.2 240.4 (1%)
0
40
60
80
100
120
20
EBIT
A$M
EBIT
MA
RG
IN
1st Half EBIT2nd Half EBITEBIT Margin
46.653.0 51.036.3
9%9%8% 8%
55.347.7 49.4 55.7
11 12 1310
EBIT ($M) and EBIT margin graph EBIT Margin %
EBIT Margin
1st Half EBIT
2nd Half EBIT
For
per
sona
l use
onl
y

10
Key balance sheet movements since September 2012 were:• trade working capital (TWC) has decreased
by $23M from the pcp as a result of an underlying decrease of $102M and divestments of $2M, partially offset by an unfavourable foreign exchange impact of $80M;
• the underlying decrease in TWC reflects improved trading terms in most regions;
• net property, plant and equipment (PP&E) was $421M up on the pcp including an FX movement of $139M on translation. Other major movements were spend on growth projects ($279M), sustaining capital ($257M) and capitalised interest ($9M), partially offset by depreciation ($248M). Spending on growth projects in the period included Kooragang Island ($80M) and HONCE ($32M);
• intangible assets increased by $171M from pcp due primarily to FX translation ($181M) and capital expenditure ($30M), partially offset by amortisation ($37M);
• net other liabilities have decreased by $211M. Major movements include increased investments ($229M) primarily Burrup, partly offset by increased net tax liability ($63M);
• net debt increased by $32M due primarily to dividend payments and cash spent on capital projects including the investment in Burrup ($200M) being mostly offset by higher operating cashflows; and
• Orica shareholders’ equity increased by $732M driven mainly by increased earnings net of dividends declared and a movement in the foreign currency translation reserve ($347M).
Key balance sheet movements since March 2013 were:• TWC decreased by $128M due to an
underlying decrease of $217M partially offset by an unfavourable foreign exchange translation impact of $89M;
• the underlying decrease in TWC reflects improved trading terms in most regions;
• net PP&E was up $257M mainly due to FX translation ($142M), growth spend ($118M) and sustaining capital ($138M), offset by depreciation ($130M);
• intangible assets increased by $189M due mainly to FX translation ($192M) and capital expenditure ($20M), partially offset by amortisation ($18M); and
• net debt decreased by $222M as a result of operating cash flow generated in the second half of the financial year being partially offset by the cash spend on capital of $350M which included $73M for Burrup in addition to $115M in ordinary dividend payments.
DebtNet debt of $2.3B was in line with the pcp. Total debt facilities of $4.6B comprised US Private Placement of $1.9B, bilateral bank facilities of $2.2B, export credit agency funding of $0.1B and drawn commercial paper of $0.4B. Total undrawn committed debt facilities is $2.1B.
The weighted average tenor of bilateral bank facilities is approximately 2.1 years. The September US Private Placement issue increased the duration of the drawn debt profile from 4.5 years at the end of March 2013 to approximately 6.6 years at year end.
GearingGearing decreased from 41.5% at 30 September 2012 to 36.9% and is within the Company’s target range of 35% to 45%.
Cash Flow• Net operating cash inflows increased by
$515M to $1,059M (pcp: $544M), mainly due to: – improved creditor days in most regions resulted in a $143M increase in cashflows;
– cashflows from non trade working capital increased by $139M due to higher indirect tax refunds, costs associated with the non-recurrence of costs associated with the Kooragang Island incident in the prior period and lower environmental spend in the current year;
– the depreciation of the AUD against the USD, CAD and EUR has resulted in a favourable FX movement on translation of debt and reserves of $65M (pcp: $46M unfavourable); and
– lower tax paid due to the timing of tax instalments of $32M.
• Net investing cash outflows increased by $69M to $743M (pcp: $674M), primarily due to: – increased spend on investments of $120M from the pcp mainly associated with the Burrup project of $200M in the current period (pcp: $41M) and higher sustaining capital of $35M, partly offset by lower capital spend on growth projects of $91M.
• Net financing cash flows decreased by $384M to an outflow of $351M (pcp: $33M inflow). Major movements included: – a net decrease in proceeds from external borrowings of $416M as more cash was available in the period to repay debts; and
– higher dividends paid to non controlling interest shareholders of $10M.
Partly offset by:
– additional share proceeds of $18M primarily received for repayment of LTEIP loans;
– decreased payments of $10M for shares purchased on market for the LTEIP plan; and
– the non-recurrence of SPS distributions of $11M paid in the first half of 2012.
Balance Sheet
review of Operations and Financial Performance continued
Interest Cover (times)
7.57.8
6.4 6.1 6.1
10 11 12 1309
Interest Cover (times)
Return on shareholders funds (%)
18.3
16.017.7
18.9 17.3
10 11 12 1309
(Including individually material items)
return on shareholders’ fund (%)(Before individually material items)
Net Debt ($M)
1,0521,095
1,408
2,299 2,331
10 11 12 1309
Net Debt ($M)6
Year end share price ($)
25.7123.50 23.48
24.87
20.06
10 11 12 1309
year end share price ($)
Orica Annual Report 2013
For
per
sona
l use
onl
y

11
During the period, work continued on a number of growth projects including:
• The expansion of the ammonium nitrate plant at Kooragang Island, Australia. Demand for explosives in south eastern Australia continues to grow albeit at a slower rate than previously forecast. It is estimated that demand for ammonium nitrate in the South East region will exceed current installed capacity by 100ktpa in 2015. It is planned that this supply shortage will be serviced by a 70ktpa capacity expansion to 500ktpa. Approximately $40M will be spent installing a 10,000t nitric acid tank to supplement the existing nitric acid supply and release latent capacity within the AN plant. This expansion is a capital light, low-risk solution to meeting customer demand prior to the planned Kooragang Island expansion to 750ktpa. The additional 70ktpa capacity is scheduled to be commissioned by mid-2015.
• Construction of the ammonium nitrate plant at the Burrup Joint Venture in Pilbara, Western Australia (45% owned by Orica). The project design is largely complete and all major contracts have been awarded. Site construction is focused on civil works in preparation for modules that are due to start arriving on site in late 2013. The project is over 52% complete, with module fabrication 28% complete and site construction 30% complete. The project remains on time and budget with commissioning scheduled for mid to late 2015 calendar year.
CorporateIn September Orica successfully raised US$415M in the US Private Placement debt market. The issue was comprised of two tranches – US$350M in a 10 year tranche, issued at a coupon rate of 4.59% and US$65M in a 12 year tranche, issued at a coupon rate of 4.74%. Proceeds from the issue were used to repay committed bank lines and commercial paper.
DividendThe Directors declared a fully franked final ordinary dividend of 55 cps. This brings the total annual dividend to 94 cps, 2 cents or 2% higher than the pcp. The dividend is fully franked due to increased Australian profits in 2013 and the timing of Australian tax payments. The final dividend is payable to shareholders on 13 December 2013 and shareholders registered as at the close of business on 25 November 2013 will be eligible for the final dividend. It is anticipated that dividends in the near future are unlikely to be franked at a rate of more than 50%.
Orica is committed to developing tomorrow’s technologies and solving today’s challenges for its customers.
Orica also supplies general chemicals across a diverse range of markets, including agriculture, building and construction, food and beverage, flavours and fragrances, personal care, pulp and paper, plastics, and water treatment industries including the provision of clean drinking water.
Orica has a portfolio of manufacturing and distribution assets strategically located across Australia Pacific, Asia, Europe, Africa, Latin America and North America, which provide valuable supply networks for customers.
Orica has operations in more than 50 countries with customers in more than 100.
Orica’s strategic direction is the provision of differentiated products, services and solutions which enhance value for customers across the globe. This strategic direction is supported by:
• reliable low-cost multi-source supply chains, e.g., ammonium nitrate, initiating systems, sodium cyanide to customers in key markets;
• capital efficient joint ventures or secure alliances and relationships with supply partners; and
• the development and commercialisation of differentiated product and service applications.
Orica’s strategic positioning within the mining sector also allows it to maintain stability through continued global uncertainty. Orica has focused its strategy on providing products and services to the segment of the mining value chain that is primarily exposed to production volumes rather than commodity price fluctuations.
Meeting environmental, social and community obligations is a core Company value.
Orica believes that responsible corporate practices not only enhance financial performance, but benefit the communities in which it operates.
Business Development Overview of Business Strategies
For
per
sona
l use
onl
y

12
Orica applies the following three core steps to risk and control management:
• identify risk and opportunity and the control frameworks required to manage these.
• effectively implement and utilise these controls.
• ensure the control is in place and functioning correctly.
risk ManagementOur risk management approach, which is consistent with AS/NZS ISO 31000:2009 Risk Management – Principles and Guidelines, facilitates the ongoing assessment, monitoring and reporting of risks, which otherwise could impede progress in delivering our strategic priorities.
Core to Orica’s risk management approach is a focus on the identification and application of effective controls to both prevent and mitigate the realisation of known risks. These controls are subject to regular verification and assessment to ensure they are functioning as required and opportunities for improvement are captured.
Internal Control FrameworkOrica’s internal control framework can be reflected in the ‘Three Lines of Defence’ model. The three key elements being:
• embedded business controls• oversight advisory• independent monitoring and assurance.
Orica remains committed to a continuous improvement approach to managing risks and ensuring that a strong, integrated risk and compliance culture is maintained.
Identifying and managing risks, which have the potential to affect the success of Orica’s strategy, is an essential part of the governance framework.
There are a number of risks, both specific to Orica and of a more general nature, that may affect the future financial performance of Orica. A summary of key risks is outlined below.
(i) Changes to industry structure and competitionOrica operates in highly competitive sectors and has a broad range of competitors across its global operations. Competition can arise from existing as well as new competitors, often with different operating models. If Orica does not adapt in the correct manner it may result in a loss of market share and revenue. Orica’s strategy is to retain and grow its market share through the use of its global technical services network of mining engineers, blasting technicians and product support specialists focused on improving the efficiency, productivity and safety results of customers’ operations. In addition, it enhances its relationships with customers, suppliers and governments.
(ii) Adapting to global economic movements and market conditionsOrica’s operating and financial performance is influenced by a variety of general economic and business conditions across the range of countries in which Orica operates. These include economic growth and development, the level of inflation and government fiscal, monetary and regulatory policies.
Future weakness in economic conditions may generally decrease demand for Orica’s products and may result in an adverse impact on Orica’s operating and financial performance.
Orica recognises the need to adapt its operating model to align with structural changes in the market place and continually reduce its cost base to remain competitive. To achieve this goal it continues to seek sustained process improvement initiatives and develop and provide differentiated products, services and solutions which enhance value for customers.
(iii) Regulatory mattersOrica operates in a number of highly regulated industries and is subject to a range of industry-specific and general legal and other regulatory controls. These requirements may change over time and Orica’s ability to comply with these obligations may be impacted by factors within and outside of Orica’s control.
Orica operates within hazardous environments, particularly in the areas of manufacturing, storage and transportation of raw materials, products and wastes. These potential hazards may cause personal injury and/or loss of life, damage to property and contamination of the environment, which may result in the suspension of operations and the imposition of civil or criminal penalties, including fines, expenses for remediation and claims brought by governmental entities or third parties that have the potential to adversely impact Orica’s financial performance.
Orica is committed to its ongoing focus on the safety and health of its people, visitors and communities through its safety culture based upon visible leadership and in encouraging employees and contractors that no work be undertaken if it is not safe to do so. Also by embedding an uncompromising focus on hazard identification, risk identification, risk assessment and risk management processes across all work.
Our Approach to risk and Control Framework
Material Business risks that could adversely affect the achievement of future business performance
review of Operations and Financial Performance continuedOrica Annual Report 2013
For
per
sona
l use
onl
y

13
In relation to environmental legacy sites, Orica conducts remediation activities and investigates suitable remediation options for these sites. It does so in consultation with relevant parties, such as local communities and relevant regulatory authorities, ensuring that responses consider the interests of all relevant parties. In many instances the remediation work is regulated by statutory authorities. Orica is committed to meeting its environmental obligations.
(iv) Lack of community supportOrica has operations in many diverse communities and locations. If Orica does not conduct its operations in a manner appropriate to those communities or locations, it may result in an adverse impact on its operating and financial performance.
Orica is committed to making a positive contribution to the communities in which it operates. This will be achieved by establishing mutually beneficial partnerships based on constructive and respectful engagement.
(v) Business disruptionOrica’s ability to sustain business operations and deliver customer service may be impeded by a significant business disruption. This could occur due to potential events such as a severe weather event, industrial action, local political instability in a foreign country in which it operates or a critical process failure. To manage these risks Orica continually monitors its business performance, executes business continuity programs and coordinates incident responses in the event incidents occur.
(vi) Distribution or sub-optimal supply chain performanceOrica has a number of major supply contracts for products and raw materials, including contracts for the supply of ammonium nitrate, natural gas and ammonia, which are due to expire over the short and medium term. If Orica is not able to renew these contracts or negotiate new contracts with alternate suppliers on similar terms to current contracts, this may have an adverse impact on Orica’s financial performance.
Similarly, if Orica is unable to secure and maintain supply chains to effectively deliver product to market, this may impact customer confidence in the Company and adversely impact Orica’s financial performance.
Orica manages these risks through low cost, multi source, flexible supply chains of mining inputs to customers in key markets delivered through Orica’s own manufacturing capabilities, capital efficient joint ventures or alliances with supply partners.
(vii) Adverse funding and other treasury mattersGiven Orica’s large and diverse business operations it is dependent on current and future funding requirements to meet its capital needs. Future weakness in global economic conditions could have an adverse impact on business profitability and/or the liquidity of capital markets, in particular during a period in which Orica is required to refinance its facilities. If this risk is realised Orica may not be able to refinance its debt, on acceptable terms, as it becomes due. In addition it may restrict Orica’s ability to raise further finance on acceptable terms to pursue future opportunities.
Orica manages this risk by maintaining appropriate gearing and financial metrics and a reasonable level of uncommitted debt facilities.
For
per
sona
l use
onl
y

14
P J B DuncanBChE (Hons), GradDip (Bus), FAICDChairman, Non-Executive Director since June 2001, appointed Chairman in December 2009. Chairman of the Corporate Governance and Nominations Committee. Chairman of Scania Australia. Former Director of National Australia Bank Limited, GasNet Australia Limited, Woodside Petroleum Limited and CSIRO and former member of Siemens Australia Advisory Board. Former Chief Executive Officer of the Shell Group of Companies in Australia.
Ian K SmithBE Mining (Hons), BF in Admin, FIEAust, FAusIMM, MAICDManaging Director and Chief Executive Officer since February 2012. Member of Corporate Governance and Nominations Committee. Prior to joining Orica, was the Managing Director and Chief Executive Officer of Newcrest Mining Limited. Former Global Head of Operational and Technical Excellence with Rio Tinto, London and Managing Director – Comalco Aluminium Smelting of Rio Tinto, Brisbane.Director of Transurban Holdings Limited and Transurban International Limited. President of the Australian Mines and Metals Association. Former Director of the Australian Chamber of Commerce and Industry.
Noel A Meehan*
BSc (Hons), FCPAExecutive Director Finance since September 2005. Member of Corporate Governance and Nominations Committee. Former Chief Financial Officer of Orica Chemicals, Orica Group Investor Relations Manager and Corporate Reporting Manager. Prior to joining Orica, held a variety of finance roles both within Qantas Airways Limited and Australian Airlines Limited.
Maxine BrennerBA LLBNon-Executive Director since April 2013. Member of the Human Resources and Compensation Committee and the Corporate Governance and Nominations Committee. Director of Qantas Airways Limited and Growthpoint Properties Australia Limited. Former Director of Neverfail Australia Ltd, Bulmer Australia Ltd and Federal Airports Corporation. Former Managing Director of Investment Banking at Investec Bank (Australia) Ltd. Former member of the Takeovers Panel.
Alberto CalderonPhD Econ, M Phil Econ, JD Law, BA EconNon-Executive Director since August 2013. Member of the Safety, Health and Environment Committee and the Corporate Governance and Nominations Committee.Former Group Executive and Chief Executive of BHP Billiton, Aluminium, Nickel and Corporate Development. Former Chief Executive Officer of Cerrejón Coal Company and Colombian oil company, Ecopetrol.
russell r CaplanLLB, FAICD, FAIMNon-Executive Director since October 2007. Chairman of the Human Resources and Compensation Committee. Member of the Audit and Risk Committee and Corporate Governance and Nominations Committee. Director of Aurizon Holdings Limited. Former Chairman of the Shell Group of Companies in Australia. Former Director of Woodside Petroleum Limited.
Ian CockerillBSc (Hons) Geology, MSc (Mining), MDP, AMPNon-Executive Director since July 2010. Member of the Safety, Health and Environment Committee and the Corporate Governance and Nominations Committee. Chairman of the Petmin Limited and Hummingbird Resources Plc. Director of African Minerals Limited, Endeavour Mining Corporation, and Ivanhoe Mines Limited. Former Chief Executive Officer of Anglo Coal and Gold Fields Limited. Former executive with AngloGold Ashanti and Anglo American Group.
lim Chee OnnBSc (Hons), MPA, DEng (Honorary)Non-Executive Director since July 2010. Member of the Safety, Health and Environment Committee and the Corporate Governance and Nominations Committee. Chairman of the Singapore-Suzhou Township Development Pte Ltd and the Advisory Board of the Sim Kee Boon Institute of Financial Economics, Singapore Management University. Board Member of the Monetary Authority of Singapore and Business China. Member of the Governing Board, Lee Kuan Yew School of Public Policy (LKYSPP), and a member of the International Advisory Panel of the Institute of Water Policy at LKYSPP and a Trustee of the Nanyang Technological University. Former Chairman of Keppel Corporation Limited and Singbridge International Singapore Pte Limited.
Nora ScheinkestelPhD, LLB (Hons), FAICDNon-Executive Director since August 2006. Chairman of the Audit and Risk Committee. Member of the Human Resources and Compensation Committee and the Corporate Governance and Nominations Committee. Director of Telstra Corporation Limited and Insurance Australia Group Limited. Former director of numerous companies including AMP Limited, Pacific Brands Limited, Newcrest Mining Limited, Mayne Group Ltd, Mayne Pharma Limited and North Ltd, former Chairman of South East Water Limited and the Energy 21 and Stratus Group.Member of the Takeovers Panel and Associate Professor, Melbourne Business School. Awarded the Centenary Medal for services to business leadership.
Gene TilbrookBSc, MBA, FAICDNon-Executive Director since August 2013. Member of the Audit and Risk Committee and the Corporate Governance and Nominations Committee.Director of Aurizon Holdings Limited, Fletcher Building Limited and GPT Group Limited. Former Chairman of Transpacific Industries Group Limited and Director of NBN Co Limited. Former Executive Director of Wesfarmers Limited.
Michael TilleyGradDip, BA, FAICDNon-Executive Director since November 2003. Chairman of the Safety, Health and Environment Committee. Member of the Audit and Risk Committee and the Corporate Governance and Nominations Committee. Former Managing Director and Chief Executive Officer of Challenger Financial Services Group Limited. Former member of the Takeovers Panel. Former Non-Executive Director of Incitec Ltd and former Chairman and Chief Executive Officer of Merrill Lynch Australasia.
Annette M CookDip Bus (Accounting), Dip Bus (Data Processing), CPACompany Secretary of Orica Limited Since 16 February 2005 and prior to that was assistant Company Secretary from August 2002. Joined Orica in July 1987 and has held a variety of roles in Business Services, IT and Finance.
Board Members
* Left Orica on 31 October 2013
Orica Annual Report 2013
For
per
sona
l use
onl
y

15
Ian K SmithBE Mining (Hons), BF in Admin, FIEAust, FAusIMM, MAICDManaging Director and Chief Executive Officer (CEO)Ian joined Orica as Managing Director and CEO in February 2012 after five years as Managing Director and CEO of Newcrest Mining Ltd. Ian has over thirty years’ experience in the global mining industry, in operational and project management roles including Global Head of Operational and Technical Excellence with Rio Tinto, London and Managing Director of Comalco Aluminium Smelting with Rio Tinto, Brisbane amongst other general manager positions.
Noel Meehan*
BSc (Hons), FCPAExecutive Director FinanceNoel joined Orica in April 1999 as Corporate Reporting Manager. Since then, he has held a number of other senior finance roles within the Group, including CFO for Chemicals and Orica Group Investor Relations Manager. Noel was appointed to the role of Chief Financial Officer in May 2005 and Executive Director Finance in September 2005.
Alison Andrew*
BE (Chem & Mats), MBA, FIPENZ Executive Global Head, ChemicalsAlison joined Orica in October 2009 as General Manager for Chemicals New Zealand and was appointed to her current position in December 2012. She brings to Orica many years of experience across a range of industries such as energy, pulp and paper, forestry and dairy. Alison has held senior roles in manufacturing, finance and commercial, working mainly in multinational companies based out of New Zealand.
Eileen Burnett-KantMEng Manufacturing Sciences & Engineering, MBAExecutive Global Head, Human ResourcesEileen joined Orica in March 2013 as Executive Global Head Human Resources. Eileen previously held the position of Executive Manager, People and Communication at Jetstar Airways, and prior to that, positions with Wesfarmers and McKinsey.
ron DouglasBEngExecutive Global Head, Projects and TechnologyRon brings to Orica 30 years’ experience in management of operational performance and capital development throughout Australia, the UK, the USA, South East Asia and Africa across the mineral processing and petrochemical industries. In his most recent role as Executive General Manager Projects and Development at Newcrest Mining, Ron was accountable for delivery of all studies and capital development for the Newcrest organisation.
Tony EdmondstoneBComm, CPA, MBAExecutive Global Head, SupplyTony has held the role of Executive Global Head of Supply since February 2013. Prior to this he held the roles General Manager Finance for the Mining Services and Manufacturing functions as well as CFO for the Orica Mining Services Division. Tony joined Orica in 2008 from Alcoa Inc., where he held the role of Commercial Director for their Global Primary Products operations based out of the USA. Tony has more than 25 years’ experience in varying executive roles across finance, supply chain, logistics and procurement with Alcoa Inc., Alcoa of Australia, Amcor Limited and PMP Limited.
Craig Elkington*
BBus (Acc), CPAExecutive Global Head, Mining ServicesCraig Elkington was appointed Executive Global Head of Mining Services in June 2012. He joined Orica in 1994 and moved from corporate accounting responsibilities to several senior finance, commercial and executive roles across the Orica Group. In 2008, Craig was appointed President, Orica Mining Services, North America, based in Denver before returning to Melbourne. He has held the CFO positions of the Company’s former subsidiary Incitec Ltd, the Chemicals Division and Orica Mining Services.
richard HoggardBEng (Sand) Chemical EngineeringExecutive Global Head, ManufacturingRichard brings to Orica more than 25 years of manufacturing experience. He joined ICI PLC in 1987 and transferred to ICI Australia in 1990. From 1990 to 2007 Richard held a variety of manufacturing, supply chain and engineering roles in Australia with Incitec Limited, Incitec Pivot Limited and Orica. In 2011 he completed a four year assignment in a commercial role in Latin America.
Gavin JackmanMPP, ANUExecutive Global Head, Corporate Affairs and Social ResponsibilityGavin commenced with Orica in July 2012, bringing with him a wide range of private and public sector experience. Most recently he worked as Group Executive Public Affairs for Santos Limited. Prior to that, Gavin was Director of Government Affairs for BP Australia and held senior executive roles in the federal government and public service.
Andrew larke*
LLB, BComm, Grad Dip (Corporations and Securities Law) Executive Global Head, Strategy, Planning and Mergers and AcquisitionsAndrew has more than 20 years’ experience in corporate strategy, mergers and acquisitions, divestments and corporate advisory. He joined Orica in 2002 and has been responsible for leading Orica’s corporate strategy and mergers and acquisitions program since that time. Prior to joining Orica, Andrew was Head of Mergers and Acquisitions at resources company North Limited.
Sean WinstoneBE (Chem, Hons), Grad Cert Business Management (Executive) Manufacturing Executive, Continuous PlantsSean joined the Company in 1989 and has worked across a variety of manufacturing roles including Kooragang Island Site Manager and Global Ammonium Nitrate Manufacturing Manager. Prior to his current position, Sean was the Australia/Asia Sustainability Manager for Orica Mining Services.
Molly ZhangMChem, PhD in Chemical EngineeringManufacturing Executive, Mining SystemsMolly joined Orica in September 2011 as General Manager for global manufacturing and supply chain for the mining services business and was appointed to her current position in May 2012. Molly brings to Orica her many years of global leadership experience including roles such as Global Business Vice President, Managing Director for joint ventures, Manufacturing Director for Asia Pacific, and board member in various joint ventures and non-profit organisations.
Executive Committee
* Left Orica on 31 October 2013
* Appointed CFO on 1 November 2013
* Left Orica on 1 November 2013
* In addition, appointed Executive Global Head, Chemicals 1 November 2013
Orica Annual Report 2013
For
per
sona
l use
onl
y

16
Orica recognises that its actions, relationships and reputation form the basis of its social licence to operate in the communities which host the Company’s operations.During 2013, Orica’s sustainability focus has been on strengthening the foundations for operational and environmental excellence. Policies, standards and guidelines are being updated, new systems are being put in place and changes have been made to the organisational structure, which will all assist Orica in continuing to improve sustainability performance.
Progress continues to be made in addressing legacy issues associated with historical operations. Increased priority is also being placed on managing operations to prevent and mitigate the creation of future environmental issues.
Sustainability GovernanceRisk management is a fundamental pillar of Orica’s activities, including the identification and management of its Safety, Health, Environment and Community risks. Orica has robust processes in place to systematically undertake risk management across the Company’s activities, products and services. A key aspect of Orica’s risk management approach is a focus on preventative controls and the effectiveness of those controls.
Performance against selected sustainability indicators is reported internally on a monthly basis to the Orica Executive Committee and the Orica Board, and sustainability issues are considered as part of the Board Safety, Health and Environment Committee and the Board Audit and Risk Committee meetings.
Sustainability performance continues to be reported publicly through the annual Orica Sustainability Report, which is available at www.orica.com. Orica has again been included in the Dow Jones Sustainability Australia Index and the FTSE4Good Index and also reports greenhouse gas and energy related performance to the Carbon Disclosure Project.
Safety, Health, Environment and CommunityProject Sustain was commenced in 2012 as a global initiative to review Orica’s Safety, Health, Environment and Community (SHEC) systems and structures. The objective of Project Sustain was to ensure consistent leadership and fit for purpose solutions to improve organisational SHEC and risk management capabilities. Project Sustain concluded at the end of 2013, with a number of initiatives identified to be implemented over the coming year.
Orica achieved an All Worker Recordable Case Rate (number of injuries and illnesses per 200,000 hours worked) of 0.54. There were no fatalities. The Company revised its procedure on the operation of Technical Panels, which provide technical advice on managing Orica’s most critical process safety risks. Technical Panels undertook a number of safety audits of key technologies and also advised on technical safety aspects for significant capital projects.
Ammonia production is Orica’s most energy intensive process. During 2013, Orica’s energy consumption increased compared to the previous year, primarily due to the Kooragang Island Ammonia Plant being fully operational across the period. Greenhouse gas abatement projects commissioned since 2010 at sites in Australia, Canada and Indonesia have reduced nitrous oxide emissions by more than 750,000 tonnes of carbon dioxide equivalent (CO
2-e)
in 2013, compared to pre-abatement baselines. Overall a reduction in nitrous oxide intensity of more than 50% has been acheived at Orica’s nitric acid plants. Abatement installed at the Bontang, Indonesia plant in November 2012 received registration under the United Nations Framework Convention on Climate Change (UNFCCC) Clean Development Mechanism (CDM) program. The project is expected to generate 140,000 carbon credits annually.
The Company manages legacy issues associated with historical operations at a number of its sites around the world. During 2013, remediation activities associated with past operations were undertaken at sites in Australia, Norway, Sweden, Brazil and the USA. At Botany, Australia, remediation works have recommenced at the former Chlor-alkali site and are expected to take two years.
Sustainability
Key achievements in the past year include: Restructure of SHEC within the Corporate Affairs and Social Responsibility function, including the appointment of key SHEC personnel and the development of regional SHEC structures to support the business.
Review and upgrade of the SHEC Management System, including updated SHEC policies which will be reflected in revised management standards and procedures.
Review of Orica’s risk assessment processes and development of a standardised partially quantitative risk assessment process to be implemented across the organisation.
Selection of a new integrated SHEC information management and reporting system.
Implementation of the Incident Cause Analysis Method (ICAM) as the standardised incident investigation methodology across Orica.
Introduction of a requirement for site specific environmental management plans to be put in place at all Company production facilities.
Development of stakeholder plans at a number of key sites to provide a more consistent approach to community engagement.
Review of the SHEC audit program to deliver a more streamlined and standardised process and improve integration with other SHEC assurance system elements.
Orica Annual Report 2013
For
per
sona
l use
onl
y

17
Orica responded to community concerns about the potential for offsite mercury contamination from past operations at Botany by funding an independent study overseen by the New South Wales Government. Although prior testing indicated that there is no unacceptable risk to human health or the environment, the study will assess the need for any additional independent testing.
Orica pleaded guilty to four counts of breaching the Queensland Environmental Protection Act (EPA) as a result of unauthorised stormwater and effluent releases from its Yarwun facility between February 2010 and February 2012. There was no evidence of any environmental damage as a result of the discharges. In November 2012, the Court ordered Orica to pay a fine of $432,000, including $250,000 to three community environmental groups – Port Curtis green turtle research, Australian Conservation Volunteers and Gladstone Healthy Harbours Partnership. No convictions were entered.
Orica is currently the subject of legal proceedings issued by the NSW EPA in relation to incidents at its Kooragang Island and Botany sites that occurred during 2010 and 2011. Orica has entered guilty pleas to the charges involved. A sentencing and mitigation hearing was held in the NSW Land and Environment Court in December 2012. The matter is adjourned pending a decision from the Court.
Orica is also the subject of legal proceedings issued by the Victorian Environmental Protection Authority in relation to an incident involving fluorosilicic acid that occurred in September 2010 in Gippsland, Victoria. Orica is yet to enter a plea in relation to these proceedings.
As part of the Company’s commitment to improve the way that it engages with the community, stakeholder plans are being developed for Orica’s operating sites. These plans provide a structured process for identifying stakeholders and responding to issues and opportunities in a balanced way. Following a successful pilot, stakeholder planning workshops were completed at a number of sites in Australia and New Zealand with further plans to be developed globally during 2014.
Product StewardshipOrica aims to adopt life cycle thinking in the creation and delivery of its products and services. The Company’s approach is based on the International Chemical Council’s Responsible Care Product Stewardship Code of Practice. Orica is a signatory to the International Cyanide Management Code (ICMC), with its cyanide manufacturing facility at Gladstone, Australia and transfer stations in Peru and Ghana fully ICMC accredited. Orica’s global supply chain is also ICMC accredited, with route assessments conducted by accredited third party contractors for road deliveries, and due diligence programs for port and rail delivery operations.
Orica collaborated with customer and carrier representatives worldwide to train emergency responders in all regions where Orica cyanide is sold. Representatives were trained using a comprehensive programme of best practice tools and techniques. Emergency response plans, procedures and standards were also developed to guide the response in the unlikely event of a cyanide incident.
The Company is a member of the global explosives safety group SAFEX and a number of other organisations that promote the safe manufacture, transport and use of explosives and chemicals.
To comply with the United Nations ‘Globally Harmonised System of classification and labelling of chemicals’ (GHS), Orica has updated its Safety Data Sheets (SDS) and labelling IT systems. Work has commenced to update more than 8,000 Orica SDSs.
A full Life Cycle Assessment (LCA) has been conducted as part of a project to deliver a new high energy extension to Orica’s existing ammonium nitrate based bulk explosives product range. The LCA was completed in accordance with International Standards ISO 14040 and ISO 14044. Orica’s existing baseline ammonium nitrate LCA has also been updated as part of the project.
During the year, Orica entered into a joint venture with the Australian and New South Wales governments to jointly fund a world-first CO
2 mineral carbonation research pilot
plant. The funding will enable research and trials of a new technology to transform
captured carbon dioxide emissions into carbonate rock. If successful on a commercial scale, this technology could provide safe CO
2
capture for disposal or use in ‘green’ building and construction materials. The pilot plant will use CO
2 from Orica’s Kooragang Island
manufacturing facility.
People A skilled, productive and diverse workforce is critical to Orica’s performance. Orica’s People Strategy, together with its policies, training and development programs and supporting systems, guides how the Company attracts, develops and retains talented people while ensuring alignment to business strategy.
Orica has a diverse workforce over 14,500 people from more than 130 nationalities. To ensure all employees have an understanding of Orica’s vision, values, strategy and the core competencies required to achieve Company objectives, a company-wide training program called Seven Pillars has been developed. The two-day training program was completed by 6,750 employees in 2013 and is on track to reach 85 percent of all employees by April 2014.
Orica’s commitment to diversity extends to all areas of the business including recruitment and appointment to roles, talent development and succession planning, training and development, flexible working arrangements and forms of leave available to employees. To support gender diversity, five ‘Orica Women in Leadership’ programs were run across the globe as well as three Female Leadership Programs in Latin America, with participants from all areas of the Company.
The Company has a multi award-winning Graduate Development Program with 150 participating graduates across Australia Pacific, Asia, Latin America and North America. The program will expand to Africa in January 2014.
A significant improvement was delivered in Human Resources support systems during the year, with the first stage of a project to migrate all employees onto one global information system, PeopleNet, completed. The project will improve the way Orica organises, recruits, rewards and develops its workforce.
Orica’s People Strategy, together with its policies, training and development programs and supporting systems, guides how the Company attracts, develops and retains talented people while ensuring alignment to business strategy.
For
per
sona
l use
onl
y

18
The Board believes that Orica’s policies and practices comply with the Australian Securities Exchange (ASX) Corporate Governance Council Principles and Recommendations. The Company’s corporate governance policies can be viewed on the Company’s website at www.orica.com.
The Board roleThe Board of Orica Limited sees its primary role as the protection and enhancement of long-term shareholder value. The Board is accountable to shareholders for the performance of the Company. It oversees and monitors the business and affairs of the Company on behalf of shareholders and is responsible for the Company’s overall corporate governance.
The Board’s responsibilities include appointing the Managing Director; succession planning; approving major strategic plans; monitoring the integrity and consistency of management’s control of risk; agreeing business plans and budgets; approving major capital expenditure, acquisitions and divestments; approving funding plans, capital raisings and setting dividends; agreeing corporate goals and reviewing performance against approved plans; and taking all reasonable steps to ensure that reporting to shareholders and other stakeholders is true and fair.
Responsibility for managing, directing and promoting the profitable operation and development of the Company, consistent with the primary objective of enhancing long-term shareholder value, is delegated to the Managing Director, who is accountable to the Board.
The Board recognises the respective roles and responsibilities of the Board and management in the charters prepared for the Board, Managing Director and Chairman and in the Company’s reserved authorities approved by the Board.
Integrity of reportingThe Company has controls in place that are designed to safeguard the Company’s interests and integrity of its reporting. These include accounting, financial reporting, safety, health and environment and other internal control policies and procedures. These controls and procedures are also directed at monitoring whether the Company complies with regulatory requirements and community standards. At each reporting period, both the Managing Director and Chief Financial Officer are required to state in writing to the Board that:
• the Company’s financial statements and associated notes give a true and fair view of the Group’s financial position and performance and are in accordance with relevant accounting standards; and
• these statements are founded on a sound system of risk management and internal control and that the system is operating effectively in all material respects in relation to financial reporting risks.
Due to inherent limitations, internal controls over financial reporting risks can only provide reasonable but not absolute assurance, and may not prevent error or fraud.
These assurances are based on a financial letter of assurance that cascades down through management and includes sign-off by global operational and functional heads and finance general managers.
Comprehensive practices have been adopted to monitor:
• that capital expenditure, revenue and expense commitments above a certain limit obtain prior Board approval;
• financial exposures including the use of derivatives;
• safety, health and environment standards and management systems designed to achieve high levels of performance and compliance; and
• that business transactions are properly authorised and executed.
Internal audit has a mandate for reviewing and recommending improvements to controls, processes and procedures used by the Company across its corporate and business activities. The Company’s internal audit is managed by the General Manager Internal Audit and supported by an independent external firm of accountants.
The Company’s financial statements are subject to an annual audit by an independent, professional auditor who also reviews the Company’s half-year financial statements. The Board Audit and Risk Committee oversee this process on behalf of the Board.
risk Identification and ManagementOrica recognises the importance of risk management practices across all businesses and operations. Effective risk management enables the business to identify and understand the potential impact of uncertainty on the realisation of Orica’s objectives. Management is then able to develop coordinated responses to control or mitigate known risks and, make risk informed decisions in delivery of the Company’s strategy.
Orica aims to maintain a consistent and effective organisation-wide approach to the management of risks by maintaining a Risk Management Framework that provides a transparent approach to managing risk across Orica consistent with the principles of ISO 31000:2009, including regular reporting to management and the Board of risks for the Company.
The Board reviews the risk management framework and oversees identification and management of material business risks and internal controls. The design and implementation of the risk management and internal control systems to manage the Company’s material business risks is the responsibility of management.
The Managing Director and Chief Financial Officer have provided a report to the Board that the risk management and internal control systems have been designed and implemented to manage the Company’s material business risks, and management has reported to the Board as to the effectiveness of the Company’s and consolidated entity’s management of its material business risks.
Corporate Governance StatementOrica’s directors and management are committed to conducting the Company’s business ethically and in accordance with the highest standards of corporate governance. This statement describes Orica’s approach to corporate governance.
Orica Annual Report 2013
For
per
sona
l use
onl
y

19
The risk management and internal control functions in the Company are managed by the General Manager Risk and the General Manager Internal Audit respectively. Both of these roles have direct access to the Board Audit and Risk Committee.
Where instances of non-compliance occur, Orica procedures require that internal investigations are conducted to determine the cause of the non-compliance and to ensure the risk of recurrence is minimised.
Board Composition and ProcessesThe Board considers that its structure, size, focus, experience and use of committees enables it to operate effectively and add value to the Company. Orica maintains a majority of non-executive directors on its Board and separates the role of Chairman and Managing Director.
The Board currently comprises ten directors: nine independent non-executive directors, including the Chairman, and one executive director, being the Managing Director. Details of the directors as at the date of this report, including their qualifications and experience, are set out on page 14.
The composition of the Board seeks to achieve the necessary competencies as well as a diversity of perspective through a range of experience, skills, knowledge and backgrounds. In reviewing the Board’s composition and in assessing nominations for appointment as non-executive directors, the Board uses external professional advice as well as its own resources to identify candidates for appointment as directors.
Two non-executive directors are domiciled outside Australia and the Board has had continued female representation since 1998. The Board is committed to an ongoing program of Board renewal, including increased internationalisation and gender diversity, as evidenced by the appointment of three new non-executive directors during 2013.
IndependenceThe Board recognises the special responsibility of non-executive directors for monitoring executive management and the importance of independent views. The Chairman and all non-executive directors are independent of executive management and free of any business or other relationship that could materially interfere with the exercise of unfettered and independent judgement or compromise their ability to act in the best interests of the Company. The independence of each director is considered on a case–by-case basis from the perspective of both the Company and the director. Materiality is assessed by reference to each director’s individual circumstances, rather than by applying general materiality thresholds. Each director is obliged to immediately inform the Company of any fact or circumstance which may affect the director’s independence.
If a significant conflict of interest arises, the director concerned does not receive the relevant Board papers and is not present at the meeting whilst the item is considered. Directors must keep the Board advised, on an ongoing basis, of any interests that could potentially conflict with those of the Company.
Selection and Appointment of DirectorsIn considering membership of the Board, directors take into account the appropriate characteristics needed to maximise effectiveness and the blend of skills, knowledge and experience necessary for the present and future needs of the Company. Nominations for appointment to the Board are considered by the Corporate Governance and Nominations Committee and approved by the Board. Non-executive directors are subject to shareholder re-election by rotation at least every three years, and normally do not serve more than 10 years.
All directors must obtain the Chairman’s prior approval before accepting directorships or other significant appointments. An orientation program is offered to new directors including a program of site visits and briefings on Orica’s businesses and operations and key policies and controls.
Board MeetingsThe Board has seven scheduled meetings per year, of which four are of two days duration and one is three days. Additional meetings are held as the business of the Company may require. Directors receive comprehensive Board papers in advance of the Board meetings. Regular Board meetings are held to review business plans, performance and strategic issues, in addition to a dedicated meeting to comprehensively review Company strategy. Directors receive regular exposure to Orica’s businesses and the major regulatory controls relevant to the Company. In addition, directors undertake site visits to a range of Orica operations to meet with employees, customers and other stakeholders.
In those months in which Board meetings are not scheduled, directors receive financial, business and safety, health and environment reports. In conjunction with or in addition to scheduled Board meetings, the non-executive directors meet together without the presence of management and the Managing Director to discuss Company matters.
To aid the effectiveness of Board meetings, each scheduled Board meeting is subject to a critical review evaluating the standard of information and material presented to the Board and the quality of the contribution made by directors to the consideration of issues on the agenda.
Board and Executive PerformanceOrica has in place a range of formal processes to evaluate the performance of the Board, Board committees and executives.
At the conclusion of the year, the Board carries out a review of its performance. Directors standing for re-election are subject to a performance review conducted by the Board. In addition, each Board committee reviews its effectiveness. An independent review of Board, committee and director performance is undertaken periodically.
The non-executive directors are responsible for regularly evaluating the performance of the Managing Director. The evaluation is based on specific criteria, including the Company’s business performance, short- and long-term strategic objectives and the achievement of personal objectives agreed annually with the Managing Director.
All Orica executives are subject to an annual performance review. The review involves an executive being evaluated by their immediate superior by reference to their specific performance agreement for the year, including the completion of key performance indicators and contributions to specific business and Company plans. All Orica executives, including the Managing Director, have had their performance evaluated during the year in accordance with the process set out above.
Access to Information and Independent AdviceEach director has the right of access to all relevant Company information and to the Company’s executives and, subject to prior consultation with the Chairman or with the approval of a majority of the Board, may seek independent professional advice at the Company’s expense. Pursuant to a deed executed by the Company and each director, a director also has the right to have access to all documents which have been presented to meetings or made available whilst in office, or made available in relation to their position as director for a term of ten years after ceasing to be a director or such longer period as is necessary to determine relevant legal proceedings that commenced during this term.
Shareholdings of Directors and EmployeesThe Board has approved guidelines for dealing in securities. Directors and employees must not, directly or indirectly, buy or sell the shares or other securities of Orica when in possession of price-sensitive information which is not publicly available, which could materially affect the value of those securities. Subject to this restriction, directors and employees may buy or sell Orica shares during the following trading windows:
For
per
sona
l use
onl
y

20
• in the period of 28 days commencing one day after the announcement of the Orica’s half-year results;
• in the period of 28 days commencing one day after the announcement of the Orica’s full-year results; and
• in the period of 28 days commencing one day after Orica’s annual general meeting.
Directors and employees must receive clearance from the Chairman or Company Secretary for any proposed dealing in Orica shares outside of a trading window. In addition to observing the procedures set out above, directors and employees are prohibited from trading in Orica securities during the following periods:
• between 1 April and the opening of the next ”window” (which will be one day after announcement of Orica’s half-yearly results); and
• between 1 October and the opening of the next ”window” (which will be one day after announcement of Orica’s full-year results).
Clearance will not be granted during these blackout periods.
Directors and employees may not create, enter into or deal in derivatives, a derivative arrangement or margin loans in relation to Orica securities at any time.
Any transaction conducted by directors in Orica securities is notified to the ASX. Each director has entered into an agreement with the Company to provide information to allow the Company to notify the ASX of any transaction within five business days. The current shareholdings are shown in Note 37.
Directors’ Fees and Executive remunerationThe remuneration report on page 25 sets out details regarding the Company’s remuneration policy, fees paid to directors for the past financial year, and specific details of executive remuneration.
Board CommitteesThe Board has charters for each of its committees. Charters are reviewed annually and objectives set for each committee. The committees report back to the Board and do not have formal delegation of decision-making authority. The Committee chairmen report on the committees as a standing item of the Board agenda. Additionally any director is welcome to attend any committee, and minutes of the committees are circulated to the Board. The charters may be viewed on the Orica website at www.orica.com.
Board Audit and risk CommitteeThe Board Audit and Risk Committee comprises four independent non-executive directors with relevant experience and financial literacy. The Chairman of the Board Audit and Risk Committee is separate from the Chairman of the Board. Nora Scheinkestel is the current Chairman of the Board Audit
and Risk Committee and the other members are Michael Tilley, Russell Caplan and Gene Tilbrook. The Chairman, Managing Director and Chief Financial Officer attend ex officio.
The committee is charged with assessing the adequacy of the Company’s financial and operating controls, oversight of risk management systems and compliance with legal requirements affecting the Company. The committee meets at least four times per year.
Details of directors’ attendance at meetings of the Board Audit and Risk Committee are set out in the Directors’ Report on page 22.
The committee assesses and reviews external and internal audits, risk reviews and any material issues arising from these audits or reviews. It assesses and reviews the accounting policies and practices of the group as an integral part of reviewing the half-year and full-year accounts for recommendation to the Board. It also makes recommendations to the Board regarding the appointment of external auditors and the level of their fees and provides a facility, if necessary, to convey any concerns raised by the internal and external auditors independent of management influence. The external and internal auditors attend committee meetings and meet privately with the committee at least twice per year.
The Board Audit and Risk Committee monitors the level of any other services provided by the external auditor to ensure auditor independence is maintained. Restrictions are placed on other services performed by the external auditor and projects outside the scope of the approved audit program require the approval of the Chairman of the Board Audit and Risk committee. Any other services with a value of greater than $100,000 must be submitted to the committee for approval in advance of the work being undertaken. The committee is asked to ratify any other services less than $100,000 in value. The fees paid to the Company’s external auditors for audit and other services are set out in Note 31.
Human resources and Compensation Committee The Human Resources and Compensation Committee comprises Russell Caplan (Chairman), Nora Scheinkestel and Maxine Brenner. The Board Chairman attends ex officio and the Managing Director attends by invitation. Details of directors’ attendance at meetings of the Human Resources and Compensation Committee are set out in the Directors’ Report on page 22.
The committee assists the Board to oversee management’s provision of the human resources necessary to execute the Company’s strategy effectively over the long term. The committee makes recommendations to the Board on the Company’s recruitment, organisational and people development, retention, employee relations, diversity strategy and workplace capability, including the capability and diversity of candidates considered for succession to Managing Director and Executive Committee positions.
Remuneration arrangements and termination payments for the Managing Director and executives reporting to the Managing Director, including short-term incentive payments, performance targets and bonus payments, remain matters for all non-executive directors. Remuneration is set by reference to independent data, external professional advice, the Company’s circumstances and the requirement to attract and retain high calibre management.
Corporate Governance and Nominations CommitteeThe Corporate Governance and Nominations Committee comprises all directors. The committee monitors developments in corporate governance practices and evaluates the Company’s policies and practices in response to changing external and internal factors and the ethical guidelines affecting the Company. This committee also deals with the nomination of directors and considers the most appropriate processes for review of the Board’s composition and performance.
The committee evaluates the composition of the Board and the annual program of matters considered by the Board to determine whether the appropriate mix of skills and experience exists to enable the Board to discharge its responsibilities to shareholders. Details of directors’ attendance at meetings of the Corporate Governance and Nominations Committee are set out in the Directors’ Report on page 22.
Safety, Health and Environment CommitteeThe Safety, Health and Environment (SH&E) Committee comprises Michael Tilley (Chairman), Ian Cockerill, Lim Chee Onn and Alberto Calderon. The Board Chairman and Managing Director attend ex officio and the Chief Financial Officer attends by invitation. The committee assists the Board in the effective discharge of its responsibilities in relation to safety, health and environmental matters arising out of activities within the Company as they affect employees, contractors, customers, visitors and the communities in which it operates. The committee also reviews the Company’s compliance with environment policy and legislation and reviews safety, health and environmental objectives, targets and due diligence processes adopted by the Company. At each Board meeting the directors receive a report on current safety, health and environment issues and performance in the group.
Orica aims to maintain a consistent and effective organisation-wide approach to the management of SH&E by maintaining a SH&E and Community Management Framework that provides a transparent approach to managing SH&E across Orica consistent with the principles of OSHAS 18001, ISO 14001 and ISO 21000, including regular reporting to management and the Board of SH&E risks for the Company.
Corporate Governance Statement continuedOrica Annual Report 2013
For
per
sona
l use
onl
y

21
For more in-depth information on the Company’s SH&E and Sustainability commitments visit the Orica website: www.orica.com. The Sustainability section of this Annual Report on page 16 details the actions being undertaken by the Company to improve its environmental performance.
Details of directors’ attendance at meetings of the SH&E Committee are set out in the Directors’ Report on page 22.
Board Executive and Special CommitteesIn addition, there is a standing Board Executive Committee comprising the Chairman, the Managing Director, and any other non-executive director who is available (but at least one), which is convened as required, to deal with matters that need to be dealt with between Board meetings. From time to time special committees may be formed on an as-needs basis to deal with specific matters.
Continuous Disclosure and Keeping Shareholders InformedThe Company seeks to provide relevant and timely information to its shareholders and is committed to fulfilling its obligations to the broader market for continuous disclosure and enabling equal access to material information about the Company.
The Board has approved a continuous disclosure policy so that the procedures for identifying and disclosing material and price-sensitive information in accordance with the Corporations Act and ASX Listing Rules are clearly articulated. This policy sets out the obligations of employees and guidelines relating to the type of information that must be disclosed and may be viewed on the Orica website at www.orica.com.
Information provided to and discussions with analysts are subject to the continuous disclosure policy. Material information must not be selectively disclosed prior to being announced to the ASX. The Company Secretary is the person responsible for communication with the ASX.
The www.orica.com website contains copies of the Annual Report and Company Overview, ASX announcements, investor relations publications, briefings and presentations given by executives (including webcasts), plus links to information on the Company’s products and services. Shareholders may elect to receive electronic notification of releases of information by the Company and receive their notice of meeting and proxy form by email. Electronic submission of proxy appointments and power of attorney are also available to shareholders. Page 132 of this report contains details of how information provided to shareholders may be obtained.
The Board encourages participation of shareholders at the Annual General Meeting. Important issues are presented to the shareholders as individual resolutions. The external auditor attends annual general meetings to answer any questions concerning the audit and the content of the auditor’s report.
Code of ConductOrica acknowledges the need for directors, executives, employees and contractors to observe the highest ethical standards of corporate and business behaviour. Orica has adopted a Code of Conduct (entitled Your Guide To How We Do Business) which applies to all countries in which Orica operates. The Code of Conduct sets out the standards of business conduct required of all employees and contractors of the Company. It is aimed at ensuring the Company maintains its good reputation and that its business is conducted with integrity and in an environment of openness.
The Code of Conduct provides clear direction and guidance with regard to expected standards of behaviour and conduct with respect to (amongst other things):
• safety, health and environment;• protection of information and the
Company’s resources;• competition law and trade practices
compliance;• privacy;• conflict of interest;• insider trading and dealing in securities;• equal employment opportunity and
harassment;• gifts and benefits;• prevention of bribery and facilitation
payments; and• prevention of, and dealing with, fraud.
The Code of Conduct is periodically reviewed and approved by the Corporate Governance and Nominations Committee and processes are in place to promote and communicate the Code of Conduct and relevant Company policies and procedures. An Integrity Hotline (the “Speak Up” line) and associated website and email facility have been established to enable employees to report (on an anonymous basis) breaches of the Code of Conduct. If a report is made, it is escalated as appropriate for investigation and action.
The Code of Conduct is overseen by the Orica Business Conduct Committee comprising the Chief Financial Officer, Global Head Human Resources, the Group General Counsel and the General Manager Internal Audit. This Committee reviews compliance and, if required, reports any significant issues to the Corporate Governance and Nominations Committee.
The Code of Conduct has been translated into several languages, reflecting the diversity of Orica’s workforce. It may be viewed on the Orica website at www.orica.com.
DiversityDiversity of people and thought is a critical part of Orica’s global growth strategy, and as such, Orica’s Board approved a formal diversity strategy in 2009.
Orica has made good progress on diversity.
Globally, 18 percent of Orica’s workforce is female, and in the Australia–Pacific region, it is 22 percent, compared to the Australian mining average for companies with more than 1,000 employees of less than 17 percent.1 The representation of women in executive and general management ranks has increased from 5 percent in 2009 to 18 percent in 2013, now close to the aim of 20 percent set in 2009.
Orica’s workforce is internationally diverse, with over 75 percent of employees located outside of the Australia–Pacific region. The proportion of non-Australian/New Zealand managers is over 40 percent.
Almost 7,000 employees to date have undertaken diversity awareness training through a global training program, Orica Seven Pillars.
Specific diversity initiatives in relation to graduate recruitment, executive search and selection, women’s leadership networks, and leadership development remain in place and continue to deliver improvements in Orica’s level of diversity. Diversity remains a key area of focus for the Company into 2014 and beyond.
DonationsAn allocation is made for donations equivalent to the dividends payable on a shareholding of approximately 0.5 percent of the Company’s ordinary issued capital. Priority areas for funding are environment, science, engineering and education, from the amount allocated for corporate donations, Orica matches employees’ contributions to community organisations under the “Dare to Share” program. In addition, Orica’s operations contribute to local communities with donations, sponsorship and practical support.
Orica does not make political donations.
1 Workforce Gender Equality Agency reporting, 2012
For
per
sona
l use
onl
y
22
Directors’ Report
Orica Limited 22
The directors of Orica Limited (‘the Company’ or ‘Orica’) present the financial report of the Company and its controlled entities (collectively ‘the consolidated entity’ or ‘the Group’) for the year ended 30 September 2013 and the auditor’s report thereon.
Directors The directors of the Company during the financial year and up to the date of this report are: P J B Duncan, Chairman I K Smith, Managing Director and Chief Executive Officer
I D Cockerill G A Hounsell (retired 18 February 2013)
N A Meehan, Executive Director Finance (retired 31 October 2013) Lim C O M N Brenner (appointed 8 April 2013) N L Scheinkestel A Calderon (appointed 14 August 2013) G T Tilbrook (appointed 14 August 2013) R R Caplan M Tilley
Particulars of directors’ qualifications, experience and special responsibilities are detailed on page 14 of the annual report. A Cook (Dip Bus (Accounting), Dip Bus (Data Processing), CPA) has been Company Secretary of Orica Limited since 16 February 2005 and prior to that was Assistant Company Secretary from August 2002, following a series of roles in Orica over 25 years.
Directors’ meetings The number of directors’ meetings (including meetings of committees of directors) and number of meetings attended by each of the directors of the Company during the financial year are listed below:
Director Scheduled Board Meetings (1)
Audit and Risk Committee (1)
Human Resources and Compensation
Committee (1)
Corporate Governance and
Nominations Committee (1)
Safety, Health and Environment Committee (1)
Held Attended Held Attended Held Attended Held Attended Held Attended
P J B Duncan 8 8 - - - - 5 5 - - I K Smith 8 8 - - - - 5 5 - - N A Meehan 8 8 - - - - 5 5 - - M N Brenner 4 4 - - 3 3 3 3 - - A Calderon 1 1 - - - - 1 1 - - R R Caplan 8 8 3 3 4 4 5 5 - - I D Cockerill 8 8 - - - - 5 5 5 5 Lim C O 8 8 - - - - 5 5 5 5 N L Scheinkestel 8 8 5 5 4 4 5 5 - - G T Tilbrook 1 1 1 1 - - 1 1 - - M Tilley 8 8 5 5 - - 5 4 5 5 Former G A Hounsell 3 3 2 2 1 1 2 2 - -
(1) Shows the number of meetings held and attended by each director during the period the director was a member of the Board or Committee. In addition to the Board meetings referred to in the above table, available directors attended five meetings during the year to address business matters arising between scheduled Board meetings.
Directors’ interests in share capital The relevant interest of each director in the share capital of the Company as at the date of this report is disclosed in note 37. Directors’ interests shown in this note are as at 30 September 2013, however there has been no change in holdings to the date of this report.
Principal activities The principal activities of the consolidated entity in the course of the financial year were the manufacture and distribution of commercial blasting systems, mining and tunnelling support systems to the mining and infrastructure markets, and various chemical products and services.
Orica Annual Report 2013
For
per
sona
l use
onl
y

23
Directors’ Report
Orica Limited 23
Likely developments Likely developments in the operations of the consolidated entity and the expected results of those operations are covered generally in the review of operations and financial performance of the consolidated entity on pages 6 to 13 of the annual report.
Review and results of operations A review of the operations of the consolidated entity during the financial year and of the results of those operations is contained on pages 6 to 13 of the annual report.
Dividends Dividends paid or declared since the end of the previous financial year were: $m
Final dividend at the rate of 54.0 cents per share on ordinary shares, franked to 44.4% (24.0 cents) at the 30% corporate tax rate, paid 14 December 2012.
196.5
Interim dividend declared at the rate of 39.0 cents per share on ordinary shares, franked to 38.5% (15.0 cents) at the 30% corporate tax rate, paid 1 July 2013.
142.5
Total dividends paid 339.0 Since the end of the financial year, the directors have declared a final dividend to be paid at the rate of 55.0 cents per share on ordinary shares. This dividend will be franked to 100% (55.0 cents) at the 30% corporate tax rate.
Changes in the state of affairs There were no significant changes in the state of affairs of the consolidated entity during the year ended 30 September 2013.
Events subsequent to balance date On 11 November 2013, the directors declared a final dividend of 55.0 cents per ordinary share payable on 13 December 2013. The financial effect of this dividend is not included in the financial statements for the year ended 30 September 2013 and will be recognised in the 2014 financial statements. The directors have not become aware of any other significant matter or circumstance that has arisen since 30 September 2013, that has affected or may affect the operations of the consolidated entity, the results of those operations, or the state of affairs of the consolidated entity in subsequent years, which has not been covered in this report.
Environmental regulations Orica aspires to become a business that does no harm to people and the environment. To deliver on this aspiration, Orica, as a minimum, seeks to be compliant with all applicable environmental laws and regulatory permissions relevant to its operations. Where instances of non-compliance occur, Orica procedures require that internal investigations are conducted to determine the cause of the non-compliance and to ensure the risk of recurrence is minimised. Orica procedures further require that the relevant governmental authorities are notified in compliance with statutory requirements. The Company has committed major investments, both in terms of capital and resources, to improve its environmental performance at New South Wales and Queensland sites in addition to the maintenance program. The Company is also working closely and co-operatively with regulators and government agencies in relation to these initiatives, as well as enhancing community engagement and consultation. Orica continues to devote considerable resources to cleaning up legacy sites and is committed to dealing with environmental issues from the past in an honest and practical way. Environmental prosecutions Orica pleaded guilty to four counts of breaching the Queensland Environmental Protection Act as a result of unauthorised stormwater and effluent releases from its Yarwun facility between February 2010 and February 2012. There was no evidence of any environmental damage as a result of the discharges. In November 2012, the Court ordered Orica to pay a fine of $432,000. No convictions were entered. As part of the fine, Orica has contributed a total of $250,000 to three community based environmental groups - green turtle research at Port Curtis, Australian Conservation Volunteers and Gladstone Healthy Harbours Partnership. Orica is currently the subject of legal proceedings issued by the New South Wales Environment Protection Authority in relation to incidents at its Kooragang Island and Botany sites that occurred during 2010 and 2011. Orica has entered guilty pleas to the charges involved in those legal proceedings. A sentencing and mitigation hearing of those proceedings was held in the NSW Land & Environment Court in December 2012. The matter is adjourned pending a decision from the Court. Orica is also the subject of legal proceedings issued by the Victorian Environment Protection Authority in relation to an incident involving fluorosilicic acid that occurred in September 2010 in Gippsland, Victoria. Orica is yet to enter a plea in relation to these proceedings. More specific details about Orica's sustainability initiatives and performance, including safety, health and environment, can be found on the Orica website – www.orica.com/sustainability. Greenhouse gas and energy data reporting requirements The Group is subject in Australia to the reporting requirements of both the Energy Efficiency Opportunities Act 2006 and the National Greenhouse and Energy Reporting Act 2007.
For
per
sona
l use
onl
y

24
Directors’ Report
Orica Limited 24
The Energy Efficiency Opportunities Act 2006 requires the Group to assess its energy usage in Australia, including the identification, investigation and evaluation of energy saving opportunities, and to report publicly on the assessments undertaken, including what action the Group intends to take as a result. The Group has registered with the Department of Resources, Energy and Tourism as a participant entity and reported results as required under this Act. The National Greenhouse and Energy Reporting Act 2007 requires the Group to report its annual Australian greenhouse gas emissions and energy consumption and production. The Group has implemented new systems and processes for the collection and reporting of the data required and, in compliance with the legislation, has submitted its reports as required under this Act.
Indemnification of officers The Company's Constitution requires the Company to indemnify any person who is, or has been, an officer of the Company, including the directors, the secretaries and other executive officers, against liabilities incurred whilst acting as such officers to the extent permitted by law. In accordance with the Company's Constitution, the Company has entered into a Deed of Access, Indemnity and Insurance with each of the Company’s directors and in a few cases specific indemnities have been provided. No director or officer of the Company has received benefits under an indemnity from the Company during or since the end of the year. The Company has paid a premium in respect of a contract insuring officers of the Company and of controlled entities, against a liability for costs and expenses incurred by them in defending civil or criminal proceedings involving them as such officers, with some exceptions. The contract of insurance prohibits disclosure of the nature of the liability insured against and the amount of the premium paid.
Non-audit services During the year, KPMG, the Company’s auditor, performed certain other services in addition to its audit responsibilities. The Board is satisfied that the provision of non-audit services during the year by the auditor is compatible with, and did not compromise, the auditor independence requirements of the Corporations Act 2001 for the following reasons: all non-audit services were subject to the corporate governance procedures adopted by the Company and have been reviewed
by the Board Audit and Risk Committee to ensure they do not impact the integrity and objectivity of the auditor; and the non-audit services provided do not undermine the general principles relating to auditor independence as set out in APES
110 Code of Ethics for Professional Accountants, as they did not involve reviewing or auditing the auditor’s own work, acting in a management or decision making capacity for the Company, acting as an advocate for the Company or jointly sharing risks and rewards.
No officer of the Company was a former partner or director of KPMG. A copy of the lead auditor’s independence declaration as required under Section 307C of the Corporations Act is contained on page 49 of the annual report and forms part of this Directors’ report. Details of the amounts paid to the auditor of the Company, KPMG, and its related practices for audit and non-audit services provided during the year are disclosed in note 31.
Orica Annual Report 2013
For
per
sona
l use
onl
y
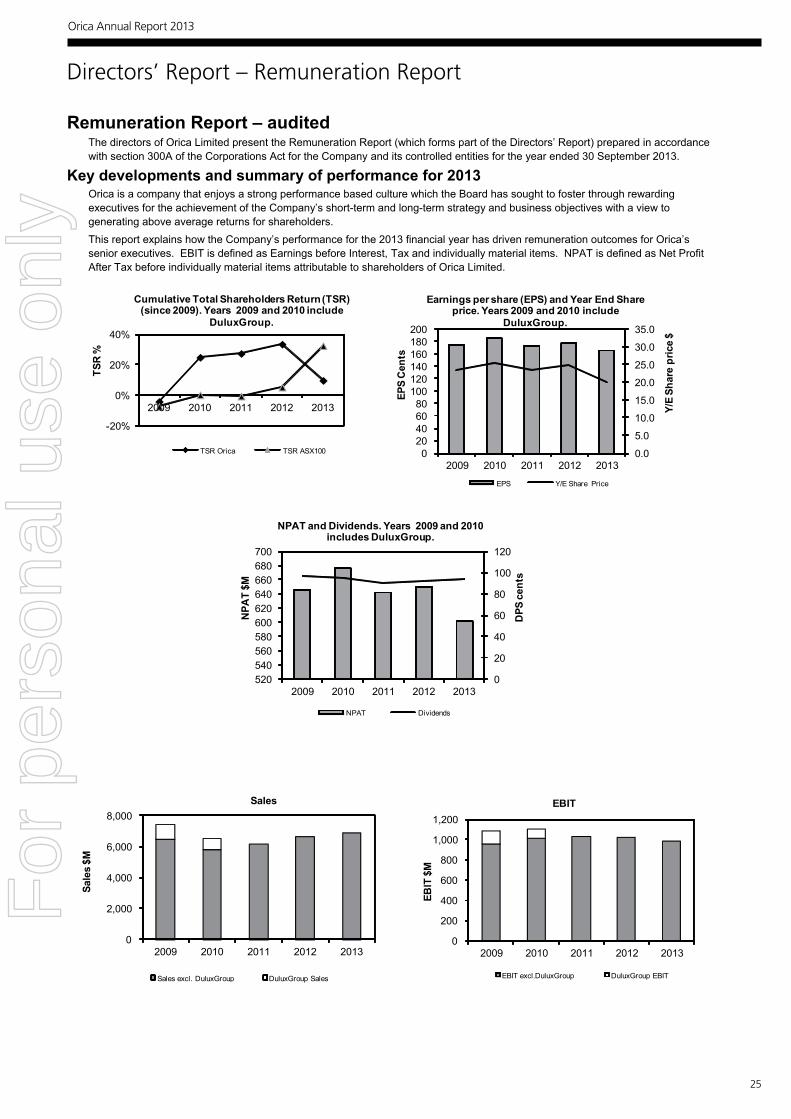
25
Directors’ Report – Remuneration Report
Orica Limited 25
Remuneration Report – audited The directors of Orica Limited present the Remuneration Report (which forms part of the Directors’ Report) prepared in accordance with section 300A of the Corporations Act for the Company and its controlled entities for the year ended 30 September 2013.
Key developments and summary of performance for 2013 Orica is a company that enjoys a strong performance based culture which the Board has sought to foster through rewarding executives for the achievement of the Company’s short-term and long-term strategy and business objectives with a view to generating above average returns for shareholders. This report explains how the Company’s performance for the 2013 financial year has driven remuneration outcomes for Orica’s senior executives. EBIT is defined as Earnings before Interest, Tax and individually material items. NPAT is defined as Net Profit After Tax before individually material items attributable to shareholders of Orica Limited.
-20%
0%
20%
40%
2009 2010 2011 2012 2013
TSR
%
Cumulative Total Shareholders Return (TSR) (since 2009). Years 2009 and 2010 include
DuluxGroup.
TSR Orica TSR ASX100
0
20
40
60
80
100
120
520 540 560 580 600 620 640 660 680 700
2009 2010 2011 2012 2013
DPS
cen
ts
NPA
T $M
NPAT and Dividends. Years 2009 and 2010 includes DuluxGroup.
NPAT Dividends
0
2,000
4,000
6,000
8,000
2009 2010 2011 2012 2013
Sale
s $M
Sales
Sales excl. DuluxGroup DuluxGroup Sales
0.0
5.0
10.0
15.0
20.0
25.0
30.0
35.0
0 20 40 60 80
100 120 140 160 180 200
2009 2010 2011 2012 2013
Y/E
Shar
e pr
ice
$
EPS
Cen
ts
Earnings per share (EPS) and Year End Share price. Years 2009 and 2010 include
DuluxGroup.
EPS Y/E Share Price
0
200
400
600
800
1,000
1,200
2009 2010 2011 2012 2013
EBIT
$M
EBIT
EBIT excl.DuluxGroup DuluxGroup EBIT
Orica Annual Report 2013
For
per
sona
l use
onl
y
26
Directors’ Report – Remuneration Report
Orica Limited 26
The table below summarises key indicators of the performance of the Group and relevant shareholder returns over the past five financial years:
Financial year ended 30 September 2009 2010 2011 2012 2013 EBIT ($m) (1) (3) 953.6 1,009.0 1,028.3 1,022.6 984.8 Dividends per ordinary share (cents) 97.0 95.0 90.0 92.0 94.0 Closing share price (4) ($ as at 30 September)
23.50 25.71 23.48 24.87 20.06
EPS growth (%) (3) 2.71% 6.30% (6.52%) 2.54% (7.03%) NPAT ($m) (2) (3) 646.1 675.8 642.3 650.2 601.6 External Sales ($m) (1) 6,470.9 5,812.1 6,182.3 6,674.1 6,898.1 Cumulative TSR (%) (4.08) 24.88 27.41 33.53 9.72
(1) Excluding DuluxGroup which was demerged from Orica on 9 July 2010. (2) Including DuluxGroup which was demerged from Orica on 9 July 2010. (3) Before individually material items. (4) The opening share price for financial year 2009 was $20.95.
The Board has set challenging financial and non-financial performance targets for management and has directly aligned Executive Key Management Personnel (KMP) incentives to the achievement of those targets. The link is clear: when target performance is achieved, target rewards are earned, and when above target performance is achieved, Executive KMP earn above target rewards. Where Group performance does not meet the Board’s performance targets, Executive KMP will receive reduced or no benefit from their ‘at risk’ short term or long term incentive components.
Over the past five years: cumulative growth in total shareholder return (movement in the Company’s share price plus dividends received) was 9.72 per
cent; an average of 93.6 cents per ordinary share per annum has been paid to shareholders under the Company’s dividend policy;
and compound earnings per share (EPS) growth was approximately nil%.
This financial performance has resulted in variable financial outcomes for Executive KMP over the past five years:
a Short Term Incentive (STI) payment has been made in four of the five years. In 2012, STI payments were not made to Executive KMP as the economic profit gateway was not achieved. Orica’s STI Plan was revised for 2013, with a single financial gateway removed and separate gateways introduced for each Group and Personal KPI (see Section C.2. for further detail). In 2013, STI payments were made for those components where threshold performance was achieved and overall STI outcomes for Executive KMP were between threshold and target performance. STI payments were between target and maximum for 2009 to 2011.
the Long Term Equity Incentive Plan (LTEIP) has provided a capital appreciation benefit to Plan participants in three of the past five years and a partial loan forgiveness benefit in only one of those years (where the benefit granted was around target and not at maximum).
Orica Annual Report 2013
For
per
sona
l use
onl
y

27
Directors’ Report – Remuneration Report
Orica Limited 27
A summary of our executive remuneration arrangements, key developments and outcomes for FY13 is set out below:
Executive remuneration component
Payment vehicle Performance measure
Specific targets / performance link
Key developments/ outcomes for
FY13
Further discussion
in this report
Fixe
d
Section C.1
At-r
isk
rem
uner
atio
n
Section C.2
Section C.3
Table 1 * Before individually material items
Details of the remuneration arrangements for Non-Executive Directors are set out in section E. There was no increase to Directors’ fees for either the 2012 or 2013 financial years.
Fixed annual remuneration (FAR)
Short Term Incentive
Plan (STI Plan)
Long Term Equity
Incentive Plan
(LTEIP)
Cash, superannuation, other benefits
Individual performance against set targets
No increase to FAR for Executive KMP in FY13
Specific KPIs based on personal and Group objectives
Annual cash payment
following the release of end of year results
Group and Personal
performance objectives operate
independently and the
weighted result for each of the
Group and Personal
performance objectives are then multiplied
together to determine the
final STI amount
Group Objective 1 Safety, Health & Environment
Group Objective 2 Earnings measures
Group Objective 3 Margin measures
Group Objective 4 Board discretion
Personal Objectives 3 personal objectives and Board discretion
Executive KMP STI payments for FY13 were between threshold and target performance For the Board Discretion components of Group and Personal Objectives zero was awarded
A revised STI plan was introduced for FY13. The new STI plan aligns Executive KMP with the Plan introduced for the CEO in 2012
Loan-based share plan, assessed over a 3 year period where up to 35% of loan is forgiven if performance hurdles are achieved
Share price appreciation
Earnings per Share (EPS) growth
Relative Total Shareholder Return (TSR)
During FY13, the 2009 LTEIP was eligible for testing. No loan forgiveness was available and modest capital gains were achieved A relative TSR measure was introduced in 2013
Improvements in: All Worker
Recordable Case Rate
Process Safety
Improvements in: Earnings Before
Interest & Tax * Net Profit After
Tax *
Improvements in: Gross Margin Cash
Conversion
Functional and financial objectives specific to KMP area of influence
Compound annual EPS growth of between 5% (threshold) and 15% (maximum) TSR percentile ranking above median (threshold) to 75th percentile and above (maximum) F
or p
erso
nal u
se o
nly

28
Directors’ Report – Remuneration Report
Orica Limited 28
Section A. Key management personnel Key Management Personnel (KMP) include each of the directors, both executive and non-executive, and those members of the Executive Committee who have authority and responsibility for planning, directing and controlling the activities of Orica. In this report, “Executive KMP” refers to the KMP other than the Non-Executive Directors. Non–Executive Directors have oversight of the strategic direction of the Group but no direct involvement in the day to day management of the business. Particulars of KMP qualifications, experience and special responsibilities are detailed on pages 14 to 15 of the annual report. The KMP to whom this Report applies are: Name
Role
Commencement date in current role
Non-Executive Current Peter Duncan (1) Non-Executive Director, Chairman 1 June 2001 Maxine Brenner Non-Executive Director 8 April 2013 Alberto Calderon Non-Executive Director 14 August 2013 Russell Caplan (2) Non-Executive Director 1 October 2007 Ian Cockerill Non-Executive Director 12 July 2010 Lim Chee Onn Non-Executive Director 12 July 2010 Nora Scheinkestel Non-Executive Director 1 August 2006 Gene Tilbrook Non-Executive Director 14 August 2013 Michael Tilley Non-Executive Director 10 November 2003 Former Date ceased to hold office Garry Hounsell Non-Executive Director 18 February 2013 Executives Current Ian Smith Managing Director and Chief Executive Officer 27 February 2012 Noel Meehan (3) Executive Director Finance 1 May 2005 Alison Andrew (4) Executive Global Head, Chemicals 24 December 2012 Tony Edmondstone Executive Global Head, Supply 4 February 2013 Craig Elkington (5)(6) Executive Global Head, Mining Services 1 October 2012 Richard Hoggard Executive Global Head, Manufacturing 1 October 2012 Andrew Larke (4) Executive Global Head, Strategy, Planning and Mergers and
Acquisitions 1 June 2006
Former Date ceased to hold office John Beevers Chief Executive Officer, Orica Mining Services 1 October 2012 Patricia McEwan Executive Global Head, Human Resources 2 April 2013 Greg Witcombe Executive Global Head, Chemicals 24 December 2012
Table 2 The table of key management personnel set out above reflects the key management personnel and role titles in place during financial year 2013. (1) Peter Duncan will retire from the Board at the Annual General Meeting (AGM) in January 2014. (2) Russell Caplan has been elected to succeed Peter Duncan as Chairman with effect from the AGM in January 2014.
(3) Noel Meehan left Orica on 31 October 2013. (4) Alison Andrew left Orica on 1 November 2013. Andrew Larke, currently Executive Global Head, Strategy, Planning and Mergers and Acquisitions, assumed responsibility for Chemicals, in addition to his existing responsibilities. (5) Craig Elkington was appointed Chief Financial Officer as of 1 November 2013. (6) Nick Bowen will commence as Executive Global Head, Mining Services on 11 November 2013.
Orica Annual Report 2013
For
per
sona
l use
onl
y

29
Directors’ Report – Remuneration Report
Orica Limited 29
Section B. Executive remuneration – policy and framework The Human Resources and Compensation Committee is delegated responsibility by the Board for reviewing and making recommendations on remuneration policies for the Group, including in particular, the policies governing the remuneration of executives. The Committee receives survey data sourced from external specialists and received external advice on matters relating to remuneration from Egan & Associates and JWS Consulting. The advice received did not constitute remuneration recommendations for the purpose of the Corporations Act. Further information regarding the objectives and role of the Human Resources and Compensation Committee is contained in its Charter, which is available on the Company’s website at www.orica.com.
Orica’s remuneration framework is underpinned by the following objective – to attract, motivate, reward and retain executives through a remuneration approach that is globally relevant, competitive, aligns with shareholder interests and has a high perceived value.
The executive remuneration framework for 2013 consisted of the following components:
Base Salary At-risk component
Fixed annual remuneration (FAR) Short term incentive (STI) paid as cash Long term equity incentive plan (LTEIP)
In setting FAR: FAR is generally set with reference
to the market median for listed companies of a comparable market capitalisation to Orica
FAR is set having regard to an individual’s responsibilities, performance, qualifications, skills and experience
consideration is given to business and individual performance as well as the ability to retain key talent
additional sector or industry-specific data is taken into consideration in benchmarking the senior executives where appropriate
annual cash incentive plan linked to specific financial and non-financial performance conditions
performance conditions: Group objectives – divided equally
among the achievement of specific targets relating to Safety, Health and Environment, Group financial measures linked to Earnings (NPAT and EBIT) and Margin (Gross Margin and Cash Conversion) and Board discretion; and
Personal objectives – divided equally among three role-specific objectives (which are a combination of financial and non-financial based measures) and Board discretion
Executive Committee members are provided with an interest free, non-recourse loan for the sole purpose of acquiring shares in the Company
any dividends paid on the shares are applied (on an after-tax basis) towards repaying the loan
future forgiveness of part of the loan may be granted based on achievement of performance conditions measured over a three year performance period, which in relation to the February 2013 grant was based on EPS growth and relative TSR performance
maximum rewards under LTEIP arise where there is strong share price performance, strong EPS growth and strong relative TSR performance to ensure a clear link with the creation of shareholder value
Table 3
The Board considers that a significant portion of executive remuneration should be ‘at risk’ in order to provide a strong alignment with this framework and the interests of the Company’s shareholders.
Orica’s mix of fixed and at-risk components for each of the Executive KMP, as a percentage of total annual remuneration is as follows:
Table 4 (1) Fixed annual remuneration for each Executive KMP is set out in table 5 in section C.1. (2) The percentage attributable to the short term incentive is for performance ‘at target’ against the applicable performance conditions. Actual STI Awards for 2013 and the maximum STI opportunity (%) are set out in table 6 in section C.2.3. (3) The percentage attributable to LTEIP is based on the five year moving average of actual returns to participants. The LTEIP has an aspirational design to deliver to participants a net benefit of one times fixed annual remuneration when target performance is achieved. In the case of the Managing Director, his participation has been designed to provide a net benefit in excess of two times FAR for target performance. The actual LTEIP loans made and shares acquired are set out in table 9 in section C.3.4 and table 10 in section C.3.5, respectively.
For full details of the remuneration of the Executive KMP for the 2013 financial year, refer to section F.
The Board regularly reviews the appropriateness of executive remuneration arrangements. A detailed framework review of all executive remuneration arrangements, including FAR, STI and LTEIP together with Directors’ fees will be undertaken during 2014.
Relative components of Total Annual Remuneration Fixed (1) At-risk Short term
incentive (2) Long term incentive (3)
Managing Director 35% 25% 40% Executive Director Finance 50% 25% 25% Other Executive KMP 55% 20% 25%
For
per
sona
l use
onl
y

30
Directors’ Report – Remuneration Report
Orica Limited 30
Section C. Executive remuneration components
C.1 Fixed annual remuneration All executives (including the Executive KMP) receive a fixed remuneration component, the basis for which is set out in section B. In general, this is expressed as a total amount of base salary and other benefits (including statutory superannuation contributions) that may be taken in an agreed form, including cash and superannuation. As a result of a review of fixed remuneration by the Human Resources and Compensation Committee during financial year 2013, no increases to fixed remuneration levels for Executive KMP were made. Set out below is the fixed annual remuneration for each of the Executive KMP as at the end financial year 2013:
Name
Term of Agreement
Fixed
Annual Remuneration (1) Current Executive Directors I K Smith 27 February 2017 2,500,000 N A Meehan (2) Open 1,250,000 Current Executive KMP A M Andrew (3) Open 638,803 T J Edmondstone Open 640,000 C B Elkington (4) Open 880,000 R Hoggard Open 810,000 A J P Larke Open 888,200
Table 5 (1) Fixed salary, inclusive of superannuation, is reviewed annually by Orica’s non-executive directors following the end of each financial year and adjustments are, in general, effective from the next 1 January. Accordingly, the amounts set out in the table above are the Executive KMPs’ fixed annual remuneration as at 30 September 2013. As part of the normal annual review of remuneration, fixed annual remuneration for all Executive KMP will be reviewed and, where appropriate, adjusted during the 2014 financial year. (2) Noel Meehan left Orica on 31 October 2013. (3) Alison Andrew left Orica on 1 November 2013. (4) Fixed Annual Remuneration increased to $880,000 effective 1 October 2012 to reflect change in position to Executive Global Head Mining, Services. As of 1 November 2013, C B Elkington was appointed Chief Financial Officer.
C.2 At-risk remuneration – Short Term Incentive Plan (STI Plan) The Orica STI Plan is the short term incentive component of the remuneration mix for the Executive KMP and is paid annually in cash. The STI Plan provides a reward for meeting annual performance targets linked to both Group and Personal objectives. A new STI plan operated in 2013 for all Executive KMP and is consistent with the Plan that was put in place for the Managing Director, Ian Smith, in 2012. The Board believes that the STI Plan provides appropriately challenging targets for participants. The actual STI awards granted to individual Executive KMP vary based upon actual performance against the financial and non-financial performance targets specific to each executive.
C.2.1 Key features of the STI Plan
Structure and purpose of the plan
What is the STI Plan? An annual cash incentive plan linked to specific annual Group and Personal performance objectives, which is based on a percentage range of each participant’s fixed annual remuneration.
STI performance objectives
What are the STI performance objectives?
The performance conditions applied to the 2013 STI Plan comprise Group and Personal performance objectives. Group objectives: All Executive KMP members share a common set of Group objectives linked to Safety, Health and Environment, Earnings measures and Margin measures, with a final component determined at the Board’s discretion on overall Group performance. Each of the four Group objectives is equally weighted in determining the final outcome of Group objectives under the STI. With the exception of Board discretion, each objective has two component measures which account for 50% of each objective. The Group objectives selected include specific improvements in financial performance (Earnings measures) and financial efficiency (Margin measures). The Board selected these performance measures as they are key annual objectives which are aligned to Orica’s business strategy and linked to long term increases in shareholder value. A key feature of the 2013 STI is the greater emphasis which has been placed on Safety, Health and Environment as a performance measure – increasing its weighting from 10% of maximum STI in 2012 to 25% in 2013. The Safety, Health and Environment measure is seen as imperative to the successful operation of Orica’s business.
Orica Annual Report 2013
For
per
sona
l use
onl
y

31
Directors’ Report – Remuneration Report
Orica Limited 31
Group objectives
Component Weighting
Safety, Health and Environment
Improvement in All Worker Recordable Case Rate (AWRCR) 12.5%
Improvement in process safety 12.5%
Earnings measures
Improvement on previous year’s Earnings Before Interest and Taxation (EBIT) (1) 12.5%
Improvement in Net Profit After Tax (NPAT) (2) 12.5%
Margin measures Improvement in Gross Margin 12.5%
Improvement in Cash Conversion 12.5%
Board discretion Amount payable determined at the Board’s discretion 25% (1) For STI purposes EBIT is defined as earnings before interest, tax and individually material items. (2) NPAT is defined as Net Profit After Tax before individually material items attributable to shareholders of Orica Limited. Personal objectives: Each KMP is set three Personal objectives specific to their area of influence with the fourth component determined at the Board’s discretion.
Personal objectives
Description Weighting
Objective 1 Examples of Personal objectives include functional targets, completion of strategic initiatives and other projects closely related to each Executive KMP’s role. Personal objectives measure performance beyond what is expected in the achievement of each KMP’s regular work activities.
25%
Objective 2 25%
Objective 3 25%
Board discretion Amount payable determined at the Board’s discretion. 25%
Why were these STI performance objectives chosen?
Group Performance objectives were selected to reflect Orica's focus on people and operational safety and on financial performance arising from execution of business strategy.
Target performance for each Group objective typically represents improvement relative to the previous year.
Personal objectives for each KMP were selected based on each KMP's area of influence and key strategic priorities.
For
per
sona
l use
onl
y
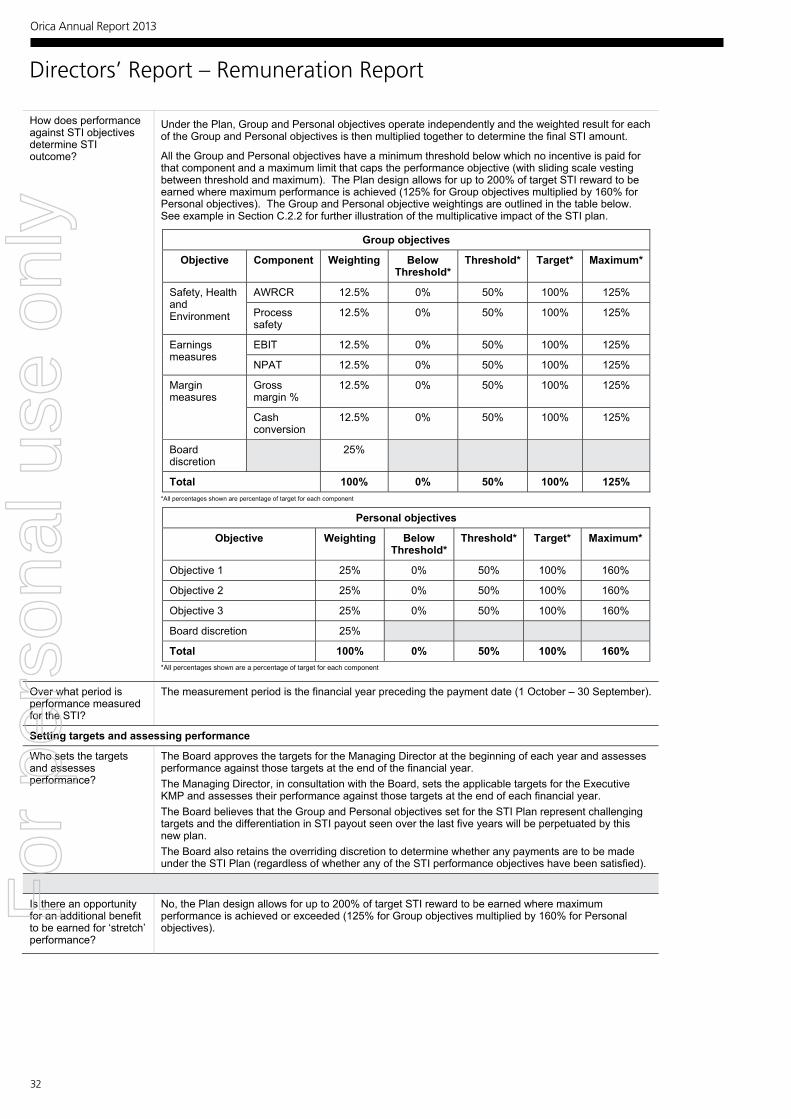
32
Directors’ Report – Remuneration Report
Orica Limited 32
How does performance against STI objectives determine STI outcome?
Under the Plan, Group and Personal objectives operate independently and the weighted result for each of the Group and Personal objectives is then multiplied together to determine the final STI amount.
All the Group and Personal objectives have a minimum threshold below which no incentive is paid for that component and a maximum limit that caps the performance objective (with sliding scale vesting between threshold and maximum). The Plan design allows for up to 200% of target STI reward to be earned where maximum performance is achieved (125% for Group objectives multiplied by 160% for Personal objectives). The Group and Personal objective weightings are outlined in the table below. See example in Section C.2.2 for further illustration of the multiplicative impact of the STI plan.
Group objectives
Objective Component Weighting Below Threshold*
Threshold* Target* Maximum*
Safety, Health and Environment
AWRCR 12.5% 0% 50% 100% 125%
Process safety
12.5% 0% 50% 100% 125%
Earnings measures
EBIT 12.5% 0% 50% 100% 125%
NPAT 12.5% 0% 50% 100% 125%
Margin measures
Gross margin %
12.5% 0% 50% 100% 125%
Cash conversion
12.5% 0% 50% 100% 125%
Board discretion
25%
Total 100% 0% 50% 100% 125% *All percentages shown are percentage of target for each component
Personal objectives
Objective Weighting Below Threshold*
Threshold* Target* Maximum*
Objective 1 25% 0% 50% 100% 160%
Objective 2 25% 0% 50% 100% 160%
Objective 3 25% 0% 50% 100% 160%
Board discretion 25%
Total 100% 0% 50% 100% 160% *All percentages shown are a percentage of target for each component
Over what period is performance measured for the STI?
The measurement period is the financial year preceding the payment date (1 October – 30 September).
Setting targets and assessing performance
Who sets the targets and assesses performance?
The Board approves the targets for the Managing Director at the beginning of each year and assesses performance against those targets at the end of the financial year. The Managing Director, in consultation with the Board, sets the applicable targets for the Executive KMP and assesses their performance against those targets at the end of each financial year. The Board believes that the Group and Personal objectives set for the STI Plan represent challenging targets and the differentiation in STI payout seen over the last five years will be perpetuated by this new plan. The Board also retains the overriding discretion to determine whether any payments are to be made under the STI Plan (regardless of whether any of the STI performance objectives have been satisfied).
Is there an opportunity for an additional benefit to be earned for ‘stretch’ performance?
No, the Plan design allows for up to 200% of target STI reward to be earned where maximum performance is achieved or exceeded (125% for Group objectives multiplied by 160% for Personal objectives).
Orica Annual Report 2013
For
per
sona
l use
onl
y

33
Directors’ Report – Remuneration Report
Orica Limited 33
Cessation of employment or a change of control
What happens in the event of cessation of employment?
A participant will not be eligible for a payment if terminated due to misconduct or poor performance nor, in general, if they resign before the end of the STI performance period. In limited circumstances approved by the Board (such as bona fide redundancy) and where a participant has more than 6 months service in the financial year, the participant may be awarded a pro-rata STI payment up to a maximum of target STI. Any STI payment made will be payable following the end of the relevant financial year in line with all other STI participants.
How would a change of control impact on STI entitlements?
Where there is a change of control, the Board has the discretion to pay some or all of the STI available for that financial year.
C.2.2. Illustrative example of how STI works
The following example illustrates the multiplicative nature of the STI plan. It is based on hypothetical performance against the STI objectives and is not reflective of the final STI outcome for 2013.
Group objectives Component Result STI%
awarded
Personal objectives Result STI% awarded
Safety, Health and Environment
AWRCR Target 12.50% (1) Objective 1 Target 25.00% (3)
Process safety Target 12.50% (1) Objective 2 Target 25.00% (3)
Earnings measures
EBIT Target 12.50% (1) Objective 3 Target 25.00% (3)
NPAT Threshold 6.25% (2) Board discretion 25.00%
Margin measures
Gross margin % Threshold 6.25% (2) Total 100.00%
Cash conversion Target 12.50% (1)
Board discretion 12.50%
Total 75.00%
Final STI outcome (as % of target STI) = 75% (75% x 100%) (1) Target Group objective performance 12.5% x 100% multiplier
(2) Threshold Group objective performance 12.5% x 50% multiplier (3) Target Personal objective performance 25% x 100% multiplier
C.2.3 Awards to Executive KMP under STI Plan In 2013, the STI payment was at 34.1% of maximum STI for the Managing Director and an average of 26.3% of maximum STI for other current Executive KMP. In reviewing STI outcomes, for the Board Discretion components of Group and Personal Objectives zero was awarded. Details of the 2013 STI percentage for the Executive KMP are set out in the table below:
For the year ended 30 September 2013 Maximum
STI opportunity
$000 (1)
Actual STI payment $000 (2)
Actual STI payment as % of maximum
STI (1)
% of maximum STI payment
forfeited/forgone Current Executive KMP I K Smith 3,000.0 1,023.8 34.1 65.9 N A Meehan 1,250.0 328.1 26.2 73.8 A M Andrew 511.0 129.7 25.4 74.6 T J Edmondstone 512.0 134.4 26.3 73.8 C B Elkington 704.0 160.2 22.8 77.2 R Hoggard 648.0 187.1 28.9 71.1 A J P Larke 1,421.1 385.5 27.1 72.9 Former Executive KMP J R Beevers - - - - P McEwan (3) 260.5 34.2 13.1 86.9 G J Witcombe - - - -
Table 6 (1) In general, for 2013, the Executive KMP (excluding the Managing Director and the Executive Director Finance) could have earned 40% of FAR for ‘at target’ performance and 80% of FAR ‘at maximum’. The Executive Director Finance could have earned 50% of FAR at target and 100% of FAR at maximum. The Managing Director could have earned 60% of FAR at target and 120% of FAR at maximum (with no additional opportunity). (2) STI constitutes a cash incentive earned during 2013 which is expected to be paid in December 2013 to current and selected former Executive KMP (3) P McEwan was entitled to receive a pro-rata STI payment under the terms of the STI plan.
For
per
sona
l use
onl
y
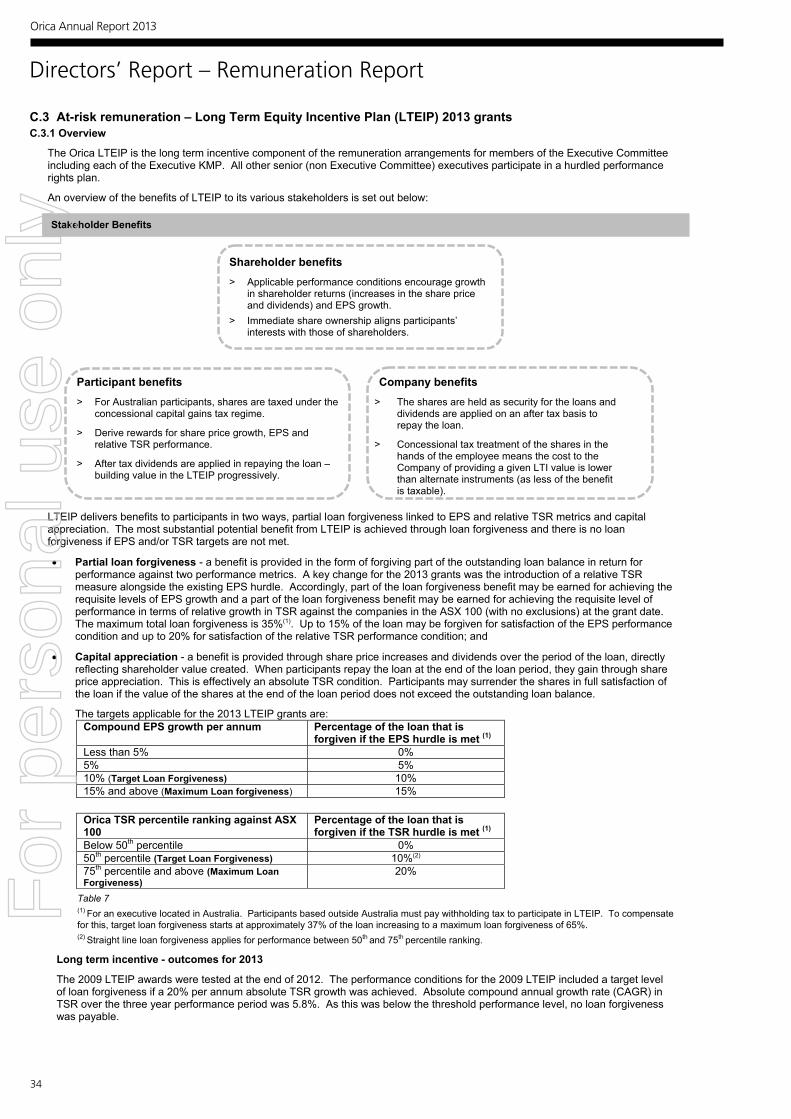
34
Directors’ Report – Remuneration Report
Orica Limited 34
C.3 At-risk remuneration – Long Term Equity Incentive Plan (LTEIP) 2013 grants C.3.1 Overview
The Orica LTEIP is the long term incentive component of the remuneration arrangements for members of the Executive Committee including each of the Executive KMP. All other senior (non Executive Committee) executives participate in a hurdled performance rights plan.
An overview of the benefits of LTEIP to its various stakeholders is set out below:
LTEIP delivers benefits to participants in two ways, partial loan forgiveness linked to EPS and relative TSR metrics and capital appreciation. The most substantial potential benefit from LTEIP is achieved through loan forgiveness and there is no loan forgiveness if EPS and/or TSR targets are not met.
Partial loan forgiveness - a benefit is provided in the form of forgiving part of the outstanding loan balance in return for performance against two performance metrics. A key change for the 2013 grants was the introduction of a relative TSR measure alongside the existing EPS hurdle. Accordingly, part of the loan forgiveness benefit may be earned for achieving the requisite levels of EPS growth and a part of the loan forgiveness benefit may be earned for achieving the requisite level of performance in terms of relative growth in TSR against the companies in the ASX 100 (with no exclusions) at the grant date. The maximum total loan forgiveness is 35%(1). Up to 15% of the loan may be forgiven for satisfaction of the EPS performance condition and up to 20% for satisfaction of the relative TSR performance condition; and
Capital appreciation - a benefit is provided through share price increases and dividends over the period of the loan, directly reflecting shareholder value created. When participants repay the loan at the end of the loan period, they gain through share price appreciation. This is effectively an absolute TSR condition. Participants may surrender the shares in full satisfaction of the loan if the value of the shares at the end of the loan period does not exceed the outstanding loan balance.
The targets applicable for the 2013 LTEIP grants are: Compound EPS growth per annum Percentage of the loan that is
forgiven if the EPS hurdle is met (1) Less than 5% 0% 5% 5% 10% (Target Loan Forgiveness) 10% 15% and above (Maximum Loan forgiveness) 15%
Orica TSR percentile ranking against ASX 100
Percentage of the loan that is forgiven if the TSR hurdle is met (1)
Below 50th percentile 0% 50th percentile (Target Loan Forgiveness) 10%(2) 75th percentile and above (Maximum Loan Forgiveness)
20%
Table 7
(1) For an executive located in Australia. Participants based outside Australia must pay withholding tax to participate in LTEIP. To compensate for this, target loan forgiveness starts at approximately 37% of the loan increasing to a maximum loan forgiveness of 65%. (2) Straight line loan forgiveness applies for performance between 50th and 75th percentile ranking.
Long term incentive - outcomes for 2013
The 2009 LTEIP awards were tested at the end of 2012. The performance conditions for the 2009 LTEIP included a target level of loan forgiveness if a 20% per annum absolute TSR growth was achieved. Absolute compound annual growth rate (CAGR) in TSR over the three year performance period was 5.8%. As this was below the threshold performance level, no loan forgiveness was payable.
Participant benefits > For Australian participants, shares are taxed under the
concessional capital gains tax regime.
> Derive rewards for share price growth, EPS and relative TSR performance.
> After tax dividends are applied in repaying the loan – building value in the LTEIP progressively.
Company benefits> The shares are held as security for the loans and
dividends are applied on an after tax basis to repay the loan.
> Concessional tax treatment of the shares in the hands of the employee means the cost to the Company of providing a given LTI value is lower than alternate instruments (as less of the benefit is taxable).
Shareholder benefits
> Applicable performance conditions encourage growth in shareholder returns (increases in the share price and dividends) and EPS growth.
> Immediate share ownership aligns participants’ interests with those of shareholders.
Stakeholder Benefits
Orica Annual Report 2013
For
per
sona
l use
onl
y

35
Directors’ Report – Remuneration Report
Orica Limited 35
Why a loan plan instead of a more traditional option or performance shares plan?
The Board continues to prefer a loan based scheme over more common performance right or performance share schemes because, as compared to those other schemes, it delivers the same ultimate benefit to the participants at a lower cost to the Company. Unlike a rights-based plan, a loan-based plan also puts participants in the position of shareholders immediately from the grant date.
How does Orica’s loan plan deliver the same benefit at less cost?
In Australia, as a result of LTEIP shares being acquired by the employee for full market value at the date of acquisition, the shares are taxed under the capital gains tax regime rather than the income tax deferral provisions that relate to the other types of schemes. Accordingly, once the shares have been held for 12 months (and they must be held for three years under LTEIP), Australian participants of the Plan qualify for concessional capital gains tax treatment.
While the Company is required to pay fringe benefits tax in relation to any performance based loan forgiveness that may occur, this cost has been factored into the level of the forgiveness granted (such that the true ‘cost’ is effectively borne by the participant out of their target award).
While LTEIP is an equity plan pursuant to which shares are acquired up front through the provision of a non-recourse loan from the Company, this structure operates very much like a traditional option plan, as the outstanding loan balance is effectively the ‘exercise price’ that must be paid before any value can be realised.
The Plan has an aspirational design to deliver to participants a net benefit of one times fixed annual remuneration when target performance is achieved. In the case of the Managing Director, his participation has been designed to provide a net benefit in excess of two times FAR for target performance. As may be seen from table 8 in section C.3.3 below, the performance components of the Plan have been suitably challenging. As a result, over the past five years LTEIP has, on average, delivered a net benefit to participants of approximately half the target opportunity.
C.3.2 Key Features of LTEIP Structure of awards (including how the loan operates)
How is the amount of the loan determined?
The key metrics of LTEIP including the manner of determining the amount of the loan to be granted and the level of partial loan forgiveness that may be granted to participants have been calculated to deliver a net benefit of 100% of FAR to the participant (200% for Managing Director) for ‘at target’ performance. This calculation factors in a notional interest charge on the loan and the fringe benefits tax cost of the partial loan forgiveness. As indicated above, notwithstanding this design aspiration, over the past five years LTEIP has, on average, delivered a net benefit to participants of approximately half the target opportunity.
What is the term of the loan?
The loan period runs from the allocation date until shortly after the performance condition of LTEIP is tested, a period of approximately three years.
Is the loan interest free?
An interest component is taken into account in determining the level of performance based loan forgiveness that may be awarded to participants. There is no interest charge to the executive on the loan itself.
How are shares acquired for allocation to executives under LTEIP?
The Company has the flexibility under LTEIP rules to acquire shares on-market, issue new shares, or reallocate forfeited shares to participants in the Plan. For the LTEIP offer expected to be made to the Managing Director in February 2014, Orica will seek shareholder approval for this grant.
Are executives entitled to deal with shares during the loan period?
No. The shares are held as security for the loan.
How is the balance of the loan reduced over time?
During the loan period, 51.5% of any dividends paid on the shares are applied in part repayment of the loan. The remainder (after withholding tax, where applicable) is paid directly to the participant to fund their tax liability on the dividends received. The loan balance can also be reduced at the end of the performance period through the performance based partial loan forgiveness (discussed in further detail below). Participants are not entitled to make any additional voluntary repayments on the loan.
If the loan is non-recourse, do executives have to repay the loan?
Yes, executives must repay their loan at the end of the performance period. Executives can either repay their loan out of their own funds or sell some or all of their shares and apply the proceeds of sale to repay the loan. Shares remain restricted until the loan is repaid. If the value of the shares is less than the outstanding loan balance at the end of the performance period, the executive surrenders and forfeits the shares to Orica in full settlement of the loan balance and no benefit accrues to the executive. This is why the loan is regarded as ‘non-recourse’. LTEIP has over the past five years constituted 25% of total remuneration for Executive KMP and 40% of total remuneration for the Managing Director. If the shares are forfeited at the end of the loan period, the executives have missed out on a significant part of their remuneration. The Board believes this to be an adequate penalty for the executives, without them also owing a debt to the Company for that part of the loan balance not covered by the then current (and transitory) value of the shares.
For
per
sona
l use
onl
y
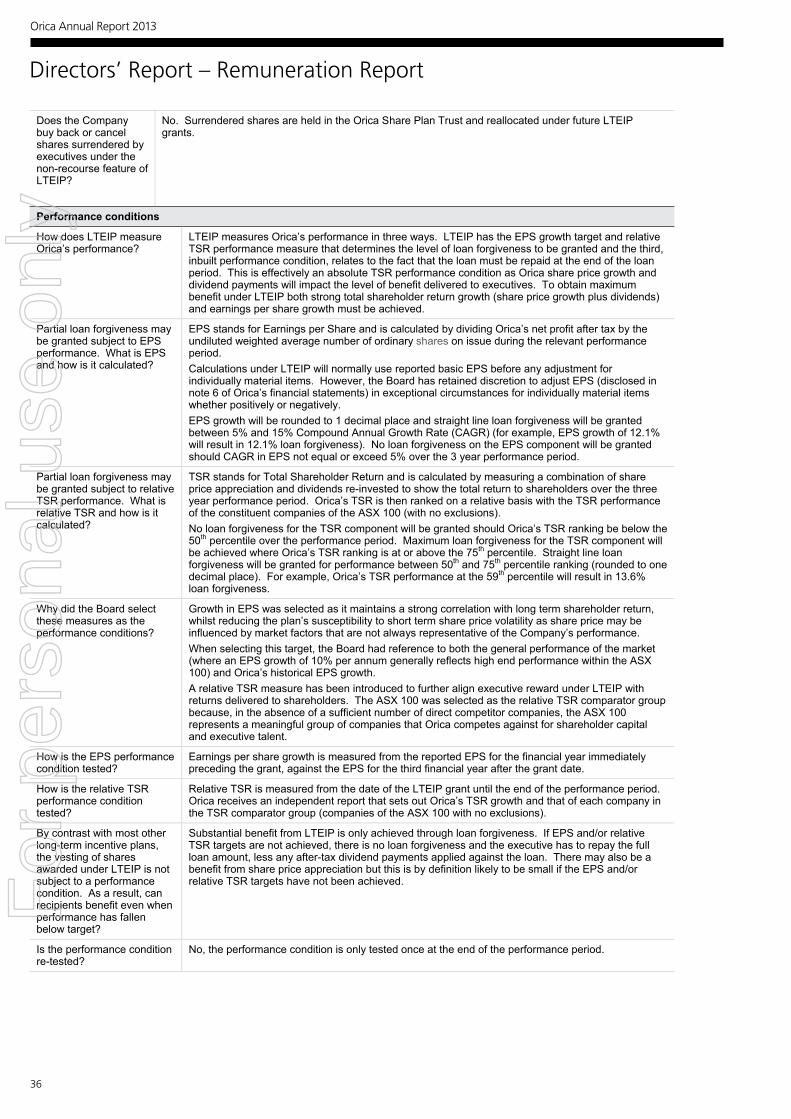
36
Directors’ Report – Remuneration Report
Orica Limited 36
Does the Company buy back or cancel shares surrendered by executives under the non-recourse feature of LTEIP?
No. Surrendered shares are held in the Orica Share Plan Trust and reallocated under future LTEIP grants.
Performance conditions
How does LTEIP measure Orica’s performance?
LTEIP measures Orica’s performance in three ways. LTEIP has the EPS growth target and relative TSR performance measure that determines the level of loan forgiveness to be granted and the third, inbuilt performance condition, relates to the fact that the loan must be repaid at the end of the loan period. This is effectively an absolute TSR performance condition as Orica share price growth and dividend payments will impact the level of benefit delivered to executives. To obtain maximum benefit under LTEIP both strong total shareholder return growth (share price growth plus dividends) and earnings per share growth must be achieved.
Partial loan forgiveness may be granted subject to EPS performance. What is EPS and how is it calculated?
EPS stands for Earnings per Share and is calculated by dividing Orica’s net profit after tax by the undiluted weighted average number of ordinary shares on issue during the relevant performance period. Calculations under LTEIP will normally use reported basic EPS before any adjustment for individually material items. However, the Board has retained discretion to adjust EPS (disclosed in note 6 of Orica’s financial statements) in exceptional circumstances for individually material items whether positively or negatively. EPS growth will be rounded to 1 decimal place and straight line loan forgiveness will be granted between 5% and 15% Compound Annual Growth Rate (CAGR) (for example, EPS growth of 12.1% will result in 12.1% loan forgiveness). No loan forgiveness on the EPS component will be granted should CAGR in EPS not equal or exceed 5% over the 3 year performance period.
Partial loan forgiveness may be granted subject to relative TSR performance. What is relative TSR and how is it calculated?
TSR stands for Total Shareholder Return and is calculated by measuring a combination of share price appreciation and dividends re-invested to show the total return to shareholders over the three year performance period. Orica’s TSR is then ranked on a relative basis with the TSR performance of the constituent companies of the ASX 100 (with no exclusions). No loan forgiveness for the TSR component will be granted should Orica’s TSR ranking be below the 50th percentile over the performance period. Maximum loan forgiveness for the TSR component will be achieved where Orica’s TSR ranking is at or above the 75th percentile. Straight line loan forgiveness will be granted for performance between 50th and 75th percentile ranking (rounded to one decimal place). For example, Orica’s TSR performance at the 59th percentile will result in 13.6% loan forgiveness.
Why did the Board select these measures as the performance conditions?
Growth in EPS was selected as it maintains a strong correlation with long term shareholder return, whilst reducing the plan’s susceptibility to short term share price volatility as share price may be influenced by market factors that are not always representative of the Company’s performance. When selecting this target, the Board had reference to both the general performance of the market (where an EPS growth of 10% per annum generally reflects high end performance within the ASX 100) and Orica’s historical EPS growth. A relative TSR measure has been introduced to further align executive reward under LTEIP with returns delivered to shareholders. The ASX 100 was selected as the relative TSR comparator group because, in the absence of a sufficient number of direct competitor companies, the ASX 100 represents a meaningful group of companies that Orica competes against for shareholder capital and executive talent.
How is the EPS performance condition tested?
Earnings per share growth is measured from the reported EPS for the financial year immediately preceding the grant, against the EPS for the third financial year after the grant date.
How is the relative TSR performance condition tested?
Relative TSR is measured from the date of the LTEIP grant until the end of the performance period. Orica receives an independent report that sets out Orica’s TSR growth and that of each company in the TSR comparator group (companies of the ASX 100 with no exclusions).
By contrast with most other long-term incentive plans, the vesting of shares awarded under LTEIP is not subject to a performance condition. As a result, can recipients benefit even when performance has fallen below target?
Substantial benefit from LTEIP is only achieved through loan forgiveness. If EPS and/or relative TSR targets are not achieved, there is no loan forgiveness and the executive has to repay the full loan amount, less any after-tax dividend payments applied against the loan. There may also be a benefit from share price appreciation but this is by definition likely to be small if the EPS and/or relative TSR targets have not been achieved.
Is the performance condition re-tested?
No, the performance condition is only tested once at the end of the performance period.
Orica Annual Report 2013
For
per
sona
l use
onl
y

37
Directors’ Report – Remuneration Report
Orica Limited 37
Cessation of employment or a change of control
What happens if a LTEIP participant ceases employment prior to repayment of the loan?
If a participant resigns from the Group or is terminated for cause during the loan period, in general the shares are forfeited and surrendered to the Group (in full settlement of the loan) and the individual has no further interest in the shares. However, the Board retains a discretion to determine otherwise in appropriate circumstances which may include allowing a participant to repay the loan and retain the capital appreciation or, where performance warrants, grant partial loan forgiveness on a pro rata basis. The Board may also determine to leave the loan in place for the remainder of the performance period and test the loan forgiveness provisions at the end of the performance period in appropriate circumstances.
How would a change of control impact on LTEIP entitlements?
The LTEIP rules provide that the loan becomes immediately repayable upon a change of control event, with the outstanding loan balance reduced by the target forgiveness amount, except where the Board determines otherwise. The Board’s current intention is that it would not exercise its discretion to vary this default position in the event of an actual change of control.
C.3.3 Five year historical analysis of benefits under the Long Term Equity Incentive Plan (LTEIP) Performance
Plan Hurdles Allocation price
Performance period
Status Was a capital benefit derived (ie did the participating executives keep their shares?)
Was loan forgiveness / waiver granted?
Was the maximum loan forgiveness granted?
2005 Offer TSR growth (average 15% pa or greater (compound))
$20.67 3 years Complete NO
NO
NO
2006 Offer TSR growth (average 15% pa or greater (compound))
$23.77 3 years Complete YES
NO NO
2007 Offer TSR growth (average 15% pa or greater (compound))
$31.76 3 years Complete NO
NO
NO
2008 Offer TSR growth (average 10% pa or greater (compound))
$16.13 3 years Complete YES
YES
NO
2009 Offer TSR growth (average 10% pa or greater (compound))
$24.79 3 years Complete YES NO NO
Table 8 The 2009 LTEIP awards were tested in November 2012. Absolute Compound Annual Growth rate (CAGR) in TSR over the three year performance period was 5.8%. This resulted in no loan forgiveness being available.
For
per
sona
l use
onl
y

38
Directors’ Report – Remuneration Report
Orica Limited 38
C.3.4 Loans to Executive KMP under Group long term incentive plans For the year ended 30 September 2013
Opening balance
$
Advances
during FY13 (1)
$
Other repayments
during FY13 (2)
$
Cash repayments
during FY13 (3)
$
Closing balance
$
Interest free value
$
Highest indebtedness
$ Current Executive Directors I K Smith 7,969,695 7,687,488 - 205,089 15,452,094 724,303 15,572,279 N A Meehan 4,412,566 1,793,739 - 1,460,303 4,746,002 248,936 4,784,249 Current Executive KMP A M Andrew 279,001 889,695 - 148,249 1,020,447 42,943 1,165,316 T J Edmondstone 1,182,147 918,391 - 598,206 1,502,332 72,290 1,514,291 C B Elkington 2,694,841 1,262,791 - 837,113 3,120,519 159,825 3,145,610 R Hoggard 488,856 1,162,330 - 251,369 1,399,817 60,875 1,410,771 A J P Larke 3,470,224 1,274,542 - 1,151,185 3,593,581 188,623 3,622,587 Former Executive KMP J R Beevers (4) 4,017,105 - - 4,017,105 - 40,880 4,017,105 P McEwan (5) 2,508,392 - - 2,508,392 - 53,538 2,508,392 G J Witcombe (6) 3,458,832 - - 3,458,832 - 57,141 3,458,832 Total Executive Key Management Personnel
30,481,659 14,988,976 - 14,635,843
30,834,792
1,649,354 41,199,432
Table 9 (1) Under LTEIP, eligible executives are provided with an interest free, non-recourse loan from the Group for the sole purpose of acquiring shares in Orica. Executives must apply net cash dividends to the repayment of the loan balance, and executives may not deal with the shares while the loan remains outstanding. Accounting Standards require that shares issued under employee incentive share plans in conjunction with non-recourse loans are to be accounted for as options. As a result, the amounts receivable from employees in relation to these loans have not been recognised in the financial statements. (2) Constitutes loan forgiveness amounts under LTEIP . No loan forgiveness was granted during the year. (3) Constitutes repayments including after tax dividends paid on the shares applied against the loan, repayment of loan on vesting of LTEIP and forfeiture of LTEIP options. (4) J R Beevers ceased employment on 1 October 2012. The Board determined that his Dec 2009 LTEIP grant would be tested as normal in November 2012 and he remained entitled to the capital appreciation on the 2009 LTEIP grant. He was also entitled to retain his Dec 2010 and Dec 2011 LTEIP grants on cessation of employment with the loans to be repaid by 31 December 2012. No loan forgiveness was granted. The Dec 2010 and Dec 2011 LTEIP grants were subsequently surrendered in full settlement of the loan because the value of the shares was less than the outstanding loan balance at 31 December 2012. (5) P McEwan ceased employment on 2 April 2013. The Board determined that she was entitled to retain her Dec 2010 LTEIP grant with the loan to be settled by 3 June 2013. The Dec 2010 LTEIP shares were subsequently surrendered in full settlement of the loan because the value of the shares was less than the outstanding loan balance at 3 June 2013. The Dec 2011 LTEIP grant was forfeited on cessation of employment. (6) G J Witcombe ceased employment on 24 December 2012. The Board determined that he was entitled to retain his Dec 2010 and Dec 2011 LTEIP grants with the loans to be repaid by 23 January 2013. No loan forgiveness was granted.
C.3.5 Equity instruments granted to and exercised by Executive KMP As outlined in C.3.4, although shares allocated to Executive KMP under LTEIP are “shares” for legal and taxation purposes, Accounting Standards require that they be treated as “options” for accounting purposes. Share rights and retention rights are also treated as options for accounting purposes. The value of “options” granted during the year and the value of any “options” granted in a previous year that were exercised during the year relating to Executive KMP is set out below. The value of the “options” granted, as valued by PricewaterhouseCoopers (PwC), is the fair value calculated at grant date using an adjusted form of the Black Scholes option pricing model.
For the year ended 30 September 2013
Options Granted Number
Options Granted
(1) (2) (3)
$
% of Total Remuneration
received as Options
Options Exercised (4)
Number
Options Exercised (4)
$ Current Executive Directors I K Smith 293,080 2,614,274 50.6% - - N A Meehan (5) 68,385 609,994 18.0% 84,912 852,684 Current Executive KMP A M Andrew 33,919 302,557 45.5% 5,889 36,785 T J Edmondstone 35,013 312,316 25.2% 24,590 55,137 C B Elkington (5) 48,143 429,436 25.7% 49,773 529,391 R Hoggard 44,313 395,272 30.3% 10,103 69,663 A J P Larke (5) 48,591 433,432 22.8% 64,979 616,432 Former Executive KMP J R Beevers (5) - - - 88,667 973,428 P McEwan (5) - - - 46,941 464,855 G J Witcombe - - - 141,970 321,476 Total Executive Key Management Personnel
571,444 5,097,281 -
517,824 3,919,851
Table 10 (1) Accounting Standards require that shares issued under employee incentive share plans in conjunction with non-recourse loans are to be accounted for as options. As a result, the amounts receivable from eligible executives in relation to these loans have not been recognised in the financial statements.
Orica Annual Report 2013
For
per
sona
l use
onl
y

39
Directors’ Report – Remuneration Report
Orica Limited 39
Further details are set out in sections C.3, G and H of this report. (2) The LTEIP options have been valued by PwC at $8.92 per option. The benefit of the options granted under the December 2009 and subsequent LTEIP offers may lapse during future years if the executives cease employment with the Group before the end of the three year performance period. (3) The minimum potential value of grants made during the year under LTEIP is nil. (4) Includes LTEIP and, where applicable, Executive Retention Scheme Rights. The value of each LTEIP “option” exercised is the market value of Orica shares on the date of exercise, less the exercise price paid (ie effectively the outstanding loan balance at that date of $23.52 per option for all KMPs other than A Andrew and R Hoggard whose outstanding loan balance at that date was $23.20 per option). The value of each Executive Retention Scheme Right is the market value of Orica shares on the date of exercise as the exercise price was nil. (5) N A Meehan, J R Beevers, C B Elkington, A J P Larke and P McEwan exercised rights under the Retention Rights Plan. Further details are set out in section D.2 and H.
C.3.6 Compliance with Orica’s corporate governance policies KMPs are required to comply with Orica’s “Guidelines in dealing with Securities” at all times and in respect of all Orica shares held, including shares held under LTEIP or any other employee share plan. In addition, KMPs are prohibited from using any Orica shares as collateral in any margin loan or derivative arrangement.
Section D. Service Agreements and the Executive Retention Scheme D.1 Executive KMP Service Agreements
Remuneration and other terms of employment for the Executive KMP are formalised in service agreements. All of the Executive KMP have contracts of no fixed term except for Ian Smith whose agreement is for a defined period which ends on 27 February 2017 (with an option to extend the contract by agreement between Ian Smith and the Company for a further term). Should the Company wish to terminate any of the Executive KMP (except Ian Smith) for convenience, the Company must provide the executive a payment equal to one times their average fixed annual remuneration over the preceding three years. Should the Company wish to terminate Ian Smith, it must provide him with six months notice together with a severance payment equal to six months fixed annual remuneration. All of the Executive KMP must provide the Company with six months notice if they wish to resign. Each of the Executive KMP has also agreed to restraints and non-solicitation undertakings as part of their service agreements, which will apply upon cessation of their employment to protect the legitimate business interests of Orica.
D.2 Executive Retention Scheme Following the announcement in late 2011 of the retirement of Graeme Liebelt and the appointment of Ian Smith as Chief Executive Officer and Managing Director to take effect in early 2012, the Board approved retention arrangements being offered to a select group of senior executives, including the Executive Director Finance (but excluding the then Managing Director). As the transition to a new Managing Director can lead to a period of uncertainty for senior executives and leave them more susceptible to outside job offers, this program was instituted to secure the services of those executives whom the Board considered would be beneficial in maintaining the momentum of Orica’s strategy during the Managing Director’s transition period. In return for the retention arrangements, participating executives agreed to a reduction in their historically agreed ‘grandfathered’ contractual termination entitlements to ensure that they will fall within the current limits on termination payments that may be made to Orica’s key management personnel pursuant to the Corporations Act. Share rights (ie rights to allocated fully paid ordinary shares in Orica) under the Executive Retention Scheme vested on 31 March 2013 and one share was allocated for each vested share right that was exercised. The share rights had a fair value of $23.08 per right. As the share rights formed part of a retention grant, no performance conditions (other than service) applied. Refer section H of the Remuneration Report for further details of the scheme. No further retention grants were made during 2013. With an internal restructure across Orica’s entire global operation adopting more of a functional model, it was decided that John Beevers and Greg Witcombe, who left the Group after the end of financial year 2012, had both satisfied the terms applicable to the retention bonus. John Beevers’ rights vested and Greg Witcombe became entitled to a cash retention bonus of $592,552 which was paid on 2 April 2013. Details of the share rights exercised during the year by current members and former members of the Executive KMP, are as follows:
Name Share Rights Exercised Executive Directors N A Meehan (2) 25,869 Executive KMP C B Elkington (2) 16,142 A J P Larke (2) 18,381 Former Executive KMP J R Beevers (1) 34,487 P McEwan (2) 13,367
(1)As indicated above, J R Beevers, who left the Group on 1 October 2012, satisfied the terms applicable to his rights and the rights vested on 31 March 2013. (2) Although the Rights vested on 31 March 2013, under the terms of Orica’s Guidelines for dealing in securities N A Meehan, C B Elkington, A J P Larke and P McEwan were restricted from disposing of any shares acquired following vesting of the Share Rights until 7 May 2013.
For
per
sona
l use
onl
y

40
Directors’ Report – Remuneration Report
Orica Limited 40
Section E. Non-Executive Directors’ Remuneration E.1 Overview of remuneration policy and principles
The key principles relating to Non-Executive Directors’ remuneration are set out below:
Principle Comment
Remuneration is structured to preserve independence whilst creating alignment
To preserve independence and impartiality, Non-Executive Directors are not entitled to any form of incentive payments and the level of their fees is not set with reference to measures of Company performance.
However, to create alignment between Directors and shareholders, the Board has adopted guidelines that encourage Non-Executive Directors to hold (or have a benefit in) shares in the Company equivalent in value to at least one year’s base fees. Such holdings must be acquired in a manner of the Director’s choosing (subject to Orica’s Guidelines for dealing in securities), using personal funds and includes shares held in superannuation accounts or other entities controlled by the Non-Executive Director.
Aggregate Board and Committee fees are approved by shareholders
The current aggregate fee pool for Non-Executive Directors of $2,500,000 was approved by shareholders at the Company’s 2010 Annual General Meeting. These fees exclude superannuation benefits and other payments in accordance with rule 48.1 of Orica’s constitution. Notwithstanding rule 48.1 of the constitution, the Company does, in practice, pay both superannuation and committee fees to the Non-Executive Directors out of the maximum aggregate fee pool.
There was no increase to Directors’ fees in financial year 2013, in addition to no increase being made in financial year 2012. The Board will review Directors’ fees in 2014.
Fees are set by reference to key considerations
Board and Committee fees are set by reference to a number of relevant considerations including: • responsibilities and time commitment attaching to the role of Director; • the Company’s existing remuneration policies; • survey data sourced from external specialists; • fees paid by comparable companies; and • the level of remuneration required to attract and retain directors of the appropriate calibre.
Flexibility in how fees are received
Non-Executive Directors can elect how they wish to receive their total fees – ie. as a contribution of cash, superannuation contributions or charitable donations.
No retirement benefits Generally, no additional benefits are paid to the Non-Executive Directors upon their retirement from office. The Chairman, P J B Duncan, however, has a grandfathered retirement entitlement of $154,800 (preserved as at July 2004 with no indexation).
Orica Annual Report 2013
For
per
sona
l use
onl
y
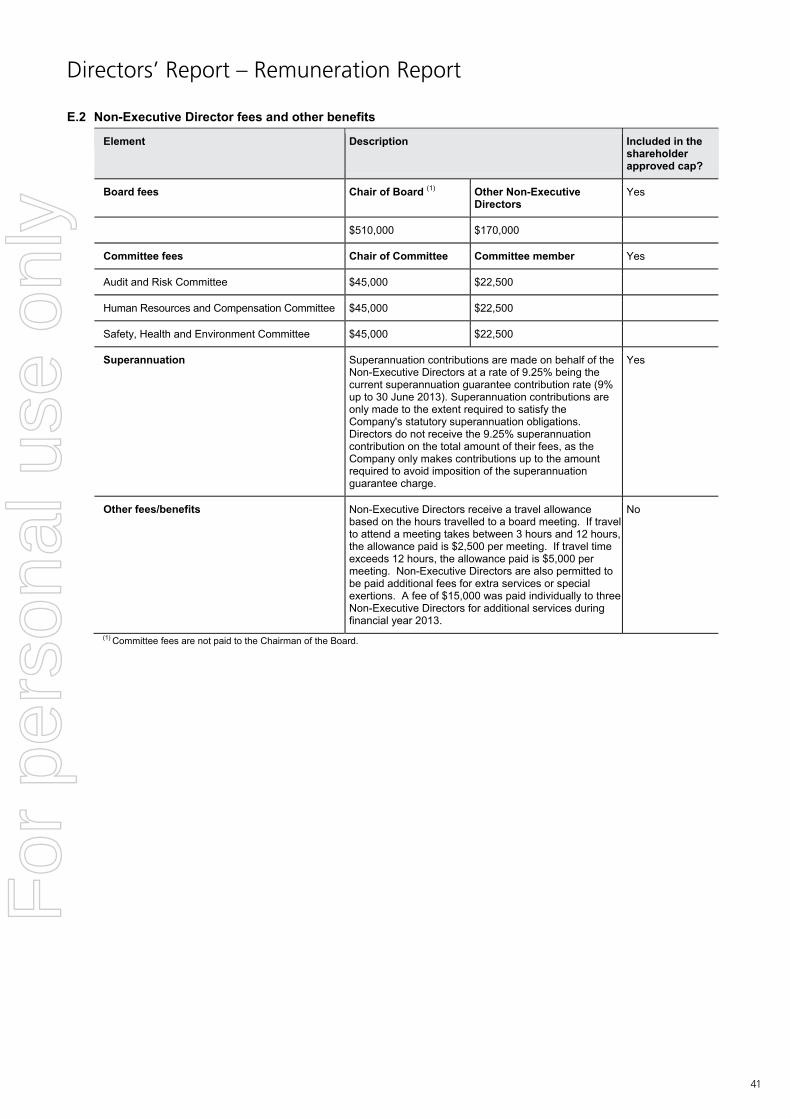
41
Directors’ Report – Remuneration Report
Orica Limited 41
E.2 Non-Executive Director fees and other benefits
Element Description Included in the shareholder approved cap?
Board fees Chair of Board (1) Other Non-Executive Directors
Yes
$510,000 $170,000
Committee fees Chair of Committee Committee member Yes
Audit and Risk Committee $45,000 $22,500
Human Resources and Compensation Committee $45,000 $22,500
Safety, Health and Environment Committee $45,000 $22,500
Superannuation Superannuation contributions are made on behalf of the Non-Executive Directors at a rate of 9.25% being the current superannuation guarantee contribution rate (9% up to 30 June 2013). Superannuation contributions are only made to the extent required to satisfy the Company's statutory superannuation obligations. Directors do not receive the 9.25% superannuation contribution on the total amount of their fees, as the Company only makes contributions up to the amount required to avoid imposition of the superannuation guarantee charge.
Yes
Other fees/benefits Non-Executive Directors receive a travel allowance based on the hours travelled to a board meeting. If travel to attend a meeting takes between 3 hours and 12 hours, the allowance paid is $2,500 per meeting. If travel time exceeds 12 hours, the allowance paid is $5,000 per meeting. Non-Executive Directors are also permitted to be paid additional fees for extra services or special exertions. A fee of $15,000 was paid individually to three Non-Executive Directors for additional services during financial year 2013.
No
(1) Committee fees are not paid to the Chairman of the Board.
For
per
sona
l use
onl
y
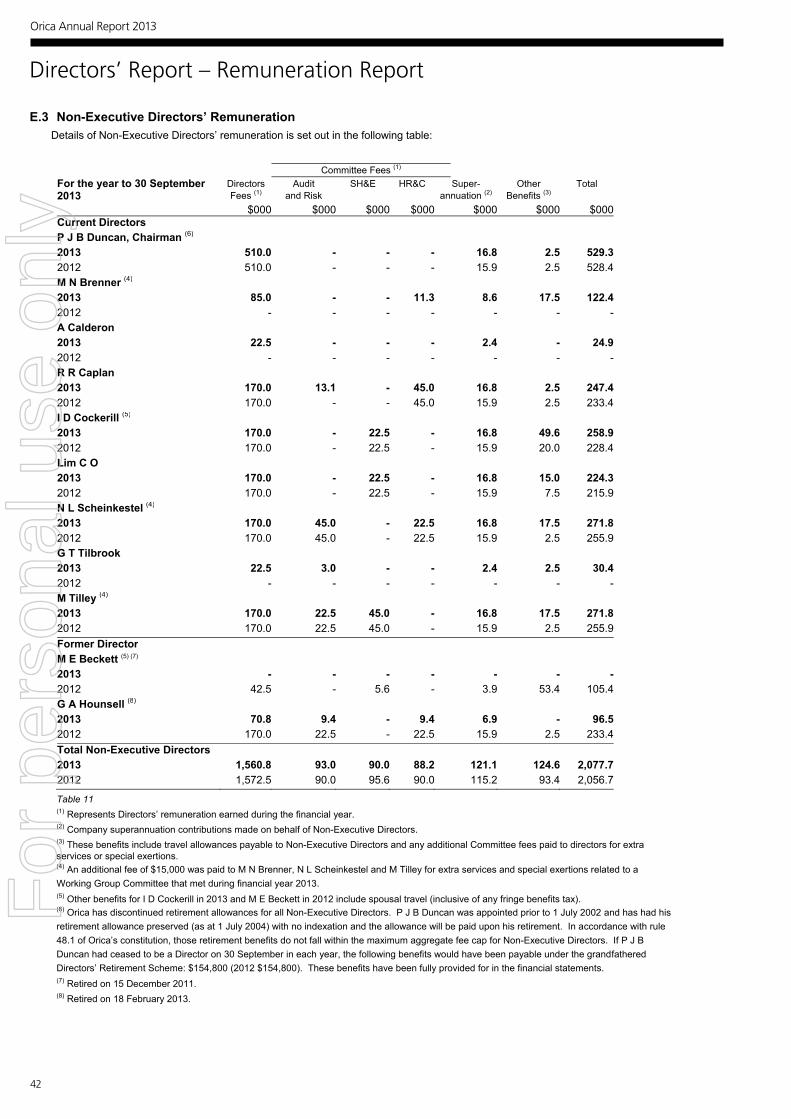
42
Directors’ Report – Remuneration Report
Orica Limited 42
E.3 Non-Executive Directors’ Remuneration Details of Non-Executive Directors’ remuneration is set out in the following table:
Committee Fees (1) For the year to 30 September 2013
Directors Fees (1)
Audit and Risk
SH&E HR&C
Super- annuation (2)
Other Benefits (3)
Total
$000 $000 $000 $000 $000 $000 $000Current Directors P J B Duncan, Chairman (6) 2013 510.0 - - - 16.8 2.5 529.32012 510.0 - - - 15.9 2.5 528.4M N Brenner (4) 2013 85.0 - - 11.3 8.6 17.5 122.42012 - - - - - - -A Calderon 2013 22.5 - - - 2.4 - 24.92012 - - - - - - -R R Caplan 2013 170.0 13.1 - 45.0 16.8 2.5 247.42012 170.0 - - 45.0 15.9 2.5 233.4I D Cockerill (5) 2013 170.0 - 22.5 - 16.8 49.6 258.92012 170.0 - 22.5 - 15.9 20.0 228.4Lim C O 2013 170.0 - 22.5 - 16.8 15.0 224.32012 170.0 - 22.5 - 15.9 7.5 215.9N L Scheinkestel (4) 2013 170.0 45.0 - 22.5 16.8 17.5 271.82012 170.0 45.0 - 22.5 15.9 2.5 255.9G T Tilbrook 2013 22.5 3.0 - - 2.4 2.5 30.42012 - - - - - - -M Tilley (4) 2013 170.0 22.5 45.0 - 16.8 17.5 271.82012 170.0 22.5 45.0 - 15.9 2.5 255.9Former Director M E Beckett (5) (7) 2013 - - - - - - -2012 42.5 - 5.6 - 3.9 53.4 105.4G A Hounsell (8) 2013 70.8 9.4 - 9.4 6.9 - 96.52012 170.0 22.5 - 22.5 15.9 2.5 233.4Total Non-Executive Directors 2013 1,560.8 93.0 90.0 88.2 121.1 124.6 2,077.72012 1,572.5 90.0 95.6 90.0 115.2 93.4 2,056.7
Table 11 (1) Represents Directors’ remuneration earned during the financial year. (2) Company superannuation contributions made on behalf of Non-Executive Directors. (3) These benefits include travel allowances payable to Non-Executive Directors and any additional Committee fees paid to directors for extra services or special exertions. (4) An additional fee of $15,000 was paid to M N Brenner, N L Scheinkestel and M Tilley for extra services and special exertions related to a Working Group Committee that met during financial year 2013. (5) Other benefits for I D Cockerill in 2013 and M E Beckett in 2012 include spousal travel (inclusive of any fringe benefits tax). (6) Orica has discontinued retirement allowances for all Non-Executive Directors. P J B Duncan was appointed prior to 1 July 2002 and has had his retirement allowance preserved (as at 1 July 2004) with no indexation and the allowance will be paid upon his retirement. In accordance with rule 48.1 of Orica’s constitution, those retirement benefits do not fall within the maximum aggregate fee cap for Non-Executive Directors. If P J B Duncan had ceased to be a Director on 30 September in each year, the following benefits would have been payable under the grandfathered Directors’ Retirement Scheme: $154,800 (2012 $154,800). These benefits have been fully provided for in the financial statements. (7) Retired on 15 December 2011. (8) Retired on 18 February 2013.
Orica Annual Report 2013
For
per
sona
l use
onl
y
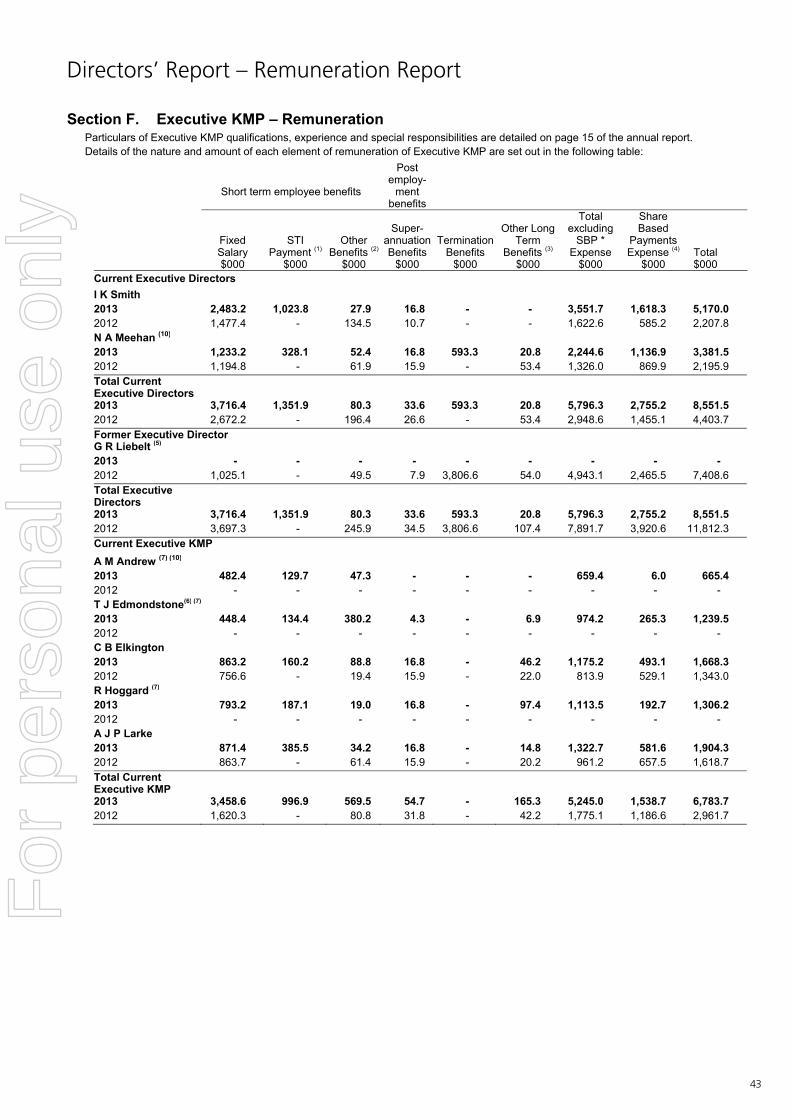
43
Directors’ Report – Remuneration Report
Orica Limited 43
Section F. Executive KMP – Remuneration Particulars of Executive KMP qualifications, experience and special responsibilities are detailed on page 15 of the annual report. Details of the nature and amount of each element of remuneration of Executive KMP are set out in the following table:
Short term employee benefits
Post employ-
ment benefits
Fixed Salary $000
STI Payment (1)
$000
Other Benefits (2)
$000
Super-
annuation Benefits
$000
TerminationBenefits
$000
Other Long
Term Benefits (3)
$000
Total excluding
SBP * Expense
$000
Share Based
PaymentsExpense (4)
$000
Total $000
Current Executive Directors I K Smith 2013 2,483.2 1,023.8 27.9 16.8 - - 3,551.7 1,618.3 5,170.02012 1,477.4 - 134.5 10.7 - - 1,622.6 585.2 2,207.8 N A Meehan (10) 2013 1,233.2 328.1 52.4 16.8 593.3 20.8 2,244.6 1,136.9 3,381.52012 1,194.8 - 61.9 15.9 - 53.4 1,326.0 869.9 2,195.9 Total Current Executive Directors
2013 3,716.4 1,351.9 80.3 33.6 593.3 20.8 5,796.3 2,755.2 8,551.52012 2,672.2 - 196.4 26.6 - 53.4 2,948.6 1,455.1 4,403.7 Former Executive Director G R Liebelt (5) 2013 - - - - - - - - -2012 1,025.1 - 49.5 7.9 3,806.6 54.0 4,943.1 2,465.5 7,408.6 Total Executive Directors
2013 3,716.4 1,351.9 80.3 33.6 593.3 20.8 5,796.3 2,755.2 8,551.52012 3,697.3 - 245.9 34.5 3,806.6 107.4 7,891.7 3,920.6 11,812.3 Current Executive KMP
A M Andrew (7) (10) 2013 482.4 129.7 47.3 - - - 659.4 6.0 665.42012 - - - - - - - - - T J Edmondstone(6) (7) 2013 448.4 134.4 380.2 4.3 - 6.9 974.2 265.3 1,239.52012 - - - - - - - - - C B Elkington 2013 863.2 160.2 88.8 16.8 - 46.2 1,175.2 493.1 1,668.32012 756.6 - 19.4 15.9 - 22.0 813.9 529.1 1,343.0 R Hoggard (7) 2013 793.2 187.1 19.0 16.8 - 97.4 1,113.5 192.7 1,306.22012 - - - - - - - - - A J P Larke 2013 871.4 385.5 34.2 16.8 - 14.8 1,322.7 581.6 1,904.32012 863.7 - 61.4 15.9 - 20.2 961.2 657.5 1,618.7 Total Current Executive KMP
2013 3,458.6 996.9 569.5 54.7 - 165.3 5,245.0 1,538.7 6,783.72012 1,620.3 - 80.8 31.8 - 42.2 1,775.1 1,186.6 2,961.7
For
per
sona
l use
onl
y

44
Directors’ Report – Remuneration Report
Orica Limited 44
Short term employee benefits
Post employ-
ment benefits
Fixed Salary $000
STI Payment (1)
$000
Other Benefits (2)
$000
Super-
annuation Benefits
$000
TerminationBenefits
$000
Other Long
Term Benefits (3)
$000
Total excluding
SBP * Expense
$000
Share Based
PaymentsExpense (4)
$000
Total $000
Former Executive KMP J R Beevers (6) (8) 2013 4.2 - 0.3 - 976.7 - 981.2 668.0 1,649.22012 1,130.6 - 473.4 - - 95.2 1,699.2 944.7 2,643.9 P McEwan (9) 2013 319.2 34.2 (0.5) 8.6 - - 361.5 182.2 543.72012 623.7 - 7.4 15.9 - - 647.0 493.4 1,140.4 G J Witcombe 2013 192.3 - 610.9 8.2 846.8 3.4 1,661.6 308.7 1,970.32012 849.1 - 19.2 15.9 - 29.0 913.2 402.0 1,315.2 Total Former Executive KMP 2013 515.7 34.2 610.7 16.8 1,823.5 3.4 3,004.3 1,158.9 4,163.22012 2,603.4 - 500.0 31.8 - 124.2 3,259.4 1,840.1 5,099.5 Total Executive KMP 2013 3,974.3 1,031.1 1,180.2 71.5 1,823.5 168.7 8,249.3 2,697.6 10,946.92012 4,223.7 - 580.8 63.6 - 166.4 5,034.5 3,026.7 8,061.2 Total 2013 7,690.7 2,383.0 1,260.5 105.1 2,416.8 189.5 14,045.6 5,452.8 19,498.42012 7,921.0 - 826.7 98.1 3,806.6 273.8 12,926.2 6,947.3 19,873.5
Table 12 * Share Based Payments (SBP). (1) STI Payment includes payments relating to 2013 performance accrued but not paid until financial year 2014. (2) These benefits include relocation costs, car parking, medical costs, movement in annual leave accrual, spousal travel and costs associated with services related to employment (inclusive of any applicable fringe benefits tax) and for G J Witcombe include a retention bonus of $592,552 (refer to Section D.2). (3) This benefit includes the movement in long service leave accrual. (4) Includes the value calculated under AASB 2 Share Based Payments to Executive KMP which vest over three years. Value only accrues to the KMP when performance conditions have been met. Each year, the Board may decide to allocate long term incentives to Executive KMP. The Share Based Payments expense in table 12 represents the expense required under Accounting Standards to be expensed during the year in respect of current and past long term incentive allocations to Executive KMP. These amounts are therefore not amounts actually received by Executive KMP during the year. The mechanism which determines whether or not long term incentives vest in the future is described in section C.3, D.2 and note 36 (a). (5) G R Liebelt departed from the Group on 31 March 2012. In addition to his statutory entitlements to accrued leave, under the terms of G R Liebelt’s service agreement, he was entitled to a severance payment of $3,806,550 upon cessation of his employment (equivalent to 1.5 times his fixed remuneration). G R Liebelt also participated in the Company’s STI Plan through to the date of cessation of employment under which he was entitled to a pro rata STI payment upon cessation. No amount was paid to G R Liebelt following testing of the applicable performance targets. Additionally, as a participant in LTEIP, the Board determined that, notwithstanding his cessation of employment, G R Liebelt would continue to participate in the LTEIP offers that remain ‘on foot’ and his participation would be treated in accordance with the relevant LTEIP rules in the same manner as all other participating executives. (6) For overseas based executives, other benefits include up to 100% of relocation and travel allowances, reimbursement of accommodation and living away from home expenses, health insurance, family travel and taxation expenses. (7) The amounts disclosed relate to remuneration paid from the date of the Executives’ appointment as a KMP. (8) J R Beevers ceased employment on 1 October 2012. The Board determined that his Dec 2009 LTEIP grant would be tested as normal in November 2012 and he remained entitled to the capital appreciation on the 2009 LTEIP grant. He was also entitled to retain his Dec 2010 and Dec 2011 LTEIP grants on cessation of employment with the loans to be repaid by 31 December 2012 and these subsequently lapsed because the value of the shares was less than the outstanding loan balance at 31 December 2012. The market value of the forfeited options, based on the Orica share price at the lapse date was $2,698,811. (9) P McEwan ceased employment on 2 April 2013. The Board determined that she was entitled to retain her Dec 2010 LTEIP grant with the loan to be settled by 3 June 2013 and these subsequently lapsed because the value of the shares was less than the outstanding loan balance at 3 June 2013. The Dec 2011 LTEIP grant was forfeited on cessation of employment. The market value of the forfeited options, based on the Orica share price at the lapse date was $1,584,829. (10) N A Meehan, under a Deed of Release dated September 2013, ceased employment on 31 October 2013 and A Andrew ceased employment on 1 November 2013. As a participant in LTEIP, the Board determined in November 2013 that, notwithstanding his cessation of employment, N A Meehan would continue to participate in the LTEIP offers that remain ‘on foot’ and his participation would be treated in accordance with the relevant LTEIP rules in the same manner as all other participating executives with the relevant share based payments expense under accounting standards being included 50% in his 2013 remuneration with the balance to be included in 2014. In addition to his statutory entitlements to accrued leave, under the terms of N A Meehan’s service agreement, he was entitled to a severance payment of $1,186,598 upon cessation of his employment (equivalent to 1.0 times his fixed remuneration), 50% of which, under accounting standards, is included in his 2013 remuneration with the balance to be included in 2014. The Board has determined that A Andrew’s December 2010 LTEIP grant will be tested as normal in November 2013 and she will be entitled to any capital appreciation on this grant. Other LTEIP options held by A Andrew will lapse on her cessation of employment.
Orica Annual Report 2013
For
per
sona
l use
onl
y

45
Directors’ Report – Remuneration Report
Orica Limited 45
Section G. Equity instruments held by Executive KMP
The number of equity instruments that comprise LTEIP and share rights held by Executive KMP is shown in the following table: For the year ended 30 September 2013
Grant date
Granted during FY13
Exercised during
FY13(1) (2) Lapsed
Outstanding at year
end
Exercise price
$
Value of
options at grant date (3)
$
Value of options included in
compensation for the year (3)
$Current Executive Directors I K Smith 24 Feb 12 - - - 305,302 N/A 2,842,362 1,003,186 7 Feb 13 293,080 - - 293,080 N/A 2,614,274 615,123N A Meehan 15 Dec 09 - 59,043 - - N/A 525,483 43,790 17 Dec 10 - - - 59,754 N/A 552,725 207,272 19 Dec 11 - - - 62,289 N/A 498,935 270,256 9 Jan 12 (4) - 25,869 - - N/A 597,057 238,823 7 Feb 13 68,385 - - 68,385 N/A 609,994 376,761Current Executive KMP A M Andrew 15 Dec 09 - 5,889 - - N/A 52,412 4,368 17 Dec 10 - - - 5,710 N/A 52,818 17,606 19 Dec 11 - - - 2,912 N/A 63,889 (15,972) 7 Feb 13 33,919 - - 33,919 N/A 302,557 -T J Edmondstone 15 Dec 09 - 24,590 - - N/A 218,851 18,238 17 Dec 10 - - - 24,530 N/A 226,903 75,634 19 Dec 11 - - - 13,387 N/A 293,710 97,904 7 Feb 13 35,013 - - 35,013 N/A 312,316 73,486R Hoggard 15 Dec 09 - 10,103 - - N/A 89,935 7,495 17 Dec 10 - - - 10,227 N/A 94,600 31,533 19 Dec 11 - - - 8,302 N/A 182,146 60,715 7 Feb 13 44,313 - - 44,313 N/A 395,272 93,005C B Elkington 15 Dec 09 - 33,631 - - N/A 299,316 24,943 17 Dec 10 - - - 34,036 N/A 314,833 104,944 19 Dec 11 - - - 42,742 N/A 342,363 114,121 9 Jan 12 (4) - 16,142 - - N/A 372,557 148,023 7 Feb 13 48,143 - - 48,143 N/A 429,436 101,044A J P Larke 15 Dec 09 - 46,598 - - N/A 414,722 34,560 17 Dec 10 - - - 47,159 N/A 436,221 145,407 19 Dec 11 - - - 48,669 N/A 389,839 129,946 9 Jan 12 (4) - 18,381 - - N/A 424,233 169,693 7 Feb 13 48,591 - - 48,591 N/A 433,432 101,984 Former Executive KMP J R Beevers (5) 15 Dec 09 - 54,180 - - N/A 482,202 40,184 17 Dec 10 - - 53,224 - N/A 492,322 164,107 19 Dec 11 - - 54,427 - N/A 435,960 145,320 9 Jan 12 (4) - 34,487 - - N/A 795,960 318,384P McEwan (6) 15 Dec 09 - 33,574 - - N/A 298,809 24,901 17 Dec 10 - - 33,978 - N/A 314,297 104,766 19 Dec 11 - - 35,390 - N/A 283,474 (70,869) 9 Jan 12 (4) - 13,367 - - N/A 308,510 123,404G J Witcombe 15 Dec 09 - 46,598 - - N/A 414,722 34,560 17 Dec 10 - 47,159 - - N/A 436,221 145,407 19 Dec 11 - 48,213 - - N/A 386,186 128,729Table 13 (1) The combination of shares and the loan provided to fund those shares under LTEIP constitutes an option under AASB 2. These options vest over three years. Under the terms of LTEIP, the loan must be repaid before the Executive KMP can deal with the shares. Accordingly, the exercise period of these options is the loan repayment period, which commences following the testing of the performance condition, typically in November after the annual results announcement, and continues through to February of the following year. The options expire if the loan is not repaid within the repayment window. (2) There were no amounts outstanding on shares issued as a result of the exercise of the options. (3) The option valuation prepared by PwC uses methodologies consistent with assumptions that apply under an adjusted form of the Black Scholes option pricing model and reflects the value (as at grant date) of options held at 30 September 2013. (4) Share rights under the Executive Retention Scheme – refer section D.2. (5) J R Beevers ceased employment on 1 October 2012. The Board determined that his Dec 2009 LTEIP grant would be tested as normal in November 2012 and he remained entitled to the capital appreciation on the 2009 LTEIP grant. He was also entitled to retain his Dec 2010 and Dec 2011 LTEIP grants on cessation of employment with the loans to be repaid by 31 December 2012 and these subsequently lapsed because the value of the shares was less than the outstanding loan balance at 31 December 2012. The value of the forfeited options, based on the Orica share price at the lapse date was $2,698,811. (6) P McEwan ceased employment on 2 April 2013. The Board determined that she was entitled to retain her Dec 2010 LTEIP grant with the loan to be settled by 3 June 2013 and these subsequently lapsed because the value of the shares was less than the outstanding loan balance at 3 June 2013. The Dec 2011 LTEIP grant was forfeited on cessation of employment. The value of the forfeited options, based on the Orica share price at the lapse date was $1,584,829.
For
per
sona
l use
onl
y
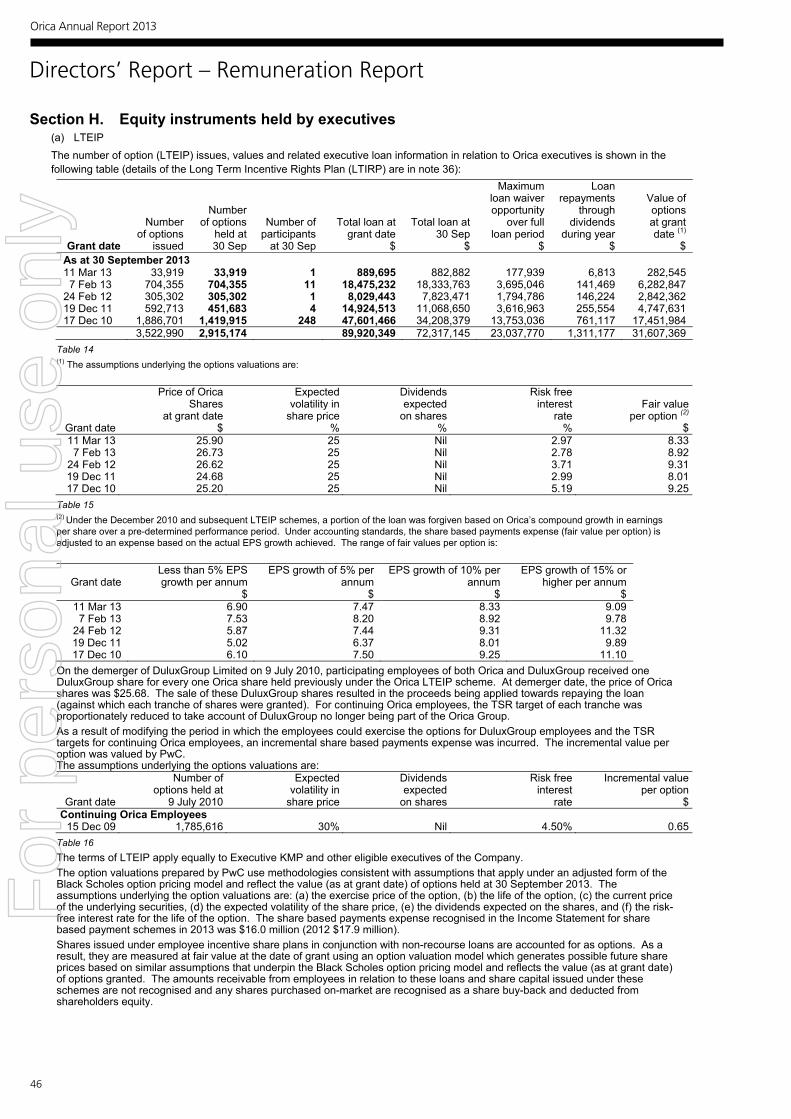
46
Directors’ Report – Remuneration Report
Orica Limited 46
Section H. Equity instruments held by executives (a) LTEIP The number of option (LTEIP) issues, values and related executive loan information in relation to Orica executives is shown in the following table (details of the Long Term Incentive Rights Plan (LTIRP) are in note 36):
Grant date
Number of options
issued
Number of options
held at 30 Sep
Number of participants
at 30 Sep
Total loan at grant date
$
Total loan at30 Sep
$
Maximum loan waiver opportunity
over full loan period
$
Loan repayments
through dividends
during year$
Value of options
at grant date (1)
$ As at 30 September 2013 11 Mar 13 33,919 33,919 1 889,695 882,882 177,939 6,813 282,545 7 Feb 13 704,355 704,355 11 18,475,232 18,333,763 3,695,046 141,469 6,282,847 24 Feb 12 305,302 305,302 1 8,029,443 7,823,471 1,794,786 146,224 2,842,362 19 Dec 11 592,713 451,683 4 14,924,513 11,068,650 3,616,963 255,554 4,747,631 17 Dec 10 1,886,701 1,419,915 248 47,601,466 34,208,379 13,753,036 761,117 17,451,984 3,522,990 2,915,174 89,920,349 72,317,145 23,037,770 1,311,177 31,607,369
Table 14 (1) The assumptions underlying the options valuations are:
Grant date
Price of Orica Shares
at grant date $
Expected volatility in
share price%
Dividends expected on shares
%
Risk free interest
rate %
Fair value per option (2)
$11 Mar 13 25.90 25 Nil 2.97 8.33
7 Feb 13 26.73 25 Nil 2.78 8.9224 Feb 12 26.62 25 Nil 3.71 9.3119 Dec 11 24.68 25 Nil 2.99 8.0117 Dec 10 25.20 25 Nil 5.19 9.25
Table 15 (2) Under the December 2010 and subsequent LTEIP schemes, a portion of the loan was forgiven based on Orica’s compound growth in earnings per share over a pre-determined performance period. Under accounting standards, the share based payments expense (fair value per option) is adjusted to an expense based on the actual EPS growth achieved. The range of fair values per option is:
Grant date
Less than 5% EPS growth per annum
$
EPS growth of 5% per annum
$
EPS growth of 10% per annum
$
EPS growth of 15% or higher per annum
$ 11 Mar 13 6.90 7.47 8.33 9.09 7 Feb 13 7.53 8.20 8.92 9.78 24 Feb 12 5.87 7.44 9.31 11.32 19 Dec 11 5.02 6.37 8.01 9.89 17 Dec 10 6.10 7.50 9.25 11.10
On the demerger of DuluxGroup Limited on 9 July 2010, participating employees of both Orica and DuluxGroup received one DuluxGroup share for every one Orica share held previously under the Orica LTEIP scheme. At demerger date, the price of Orica shares was $25.68. The sale of these DuluxGroup shares resulted in the proceeds being applied towards repaying the loan (against which each tranche of shares were granted). For continuing Orica employees, the TSR target of each tranche was proportionately reduced to take account of DuluxGroup no longer being part of the Orica Group. As a result of modifying the period in which the employees could exercise the options for DuluxGroup employees and the TSR targets for continuing Orica employees, an incremental share based payments expense was incurred. The incremental value per option was valued by PwC. The assumptions underlying the options valuations are:
Grant date
Number of options held at
9 July 2010
Expectedvolatility in
share price
Dividendsexpected
on shares
Risk free interest
rate
Incremental value per option
$ Continuing Orica Employees
15 Dec 09 1,785,616 30% Nil 4.50% 0.65Table 16 The terms of LTEIP apply equally to Executive KMP and other eligible executives of the Company. The option valuations prepared by PwC use methodologies consistent with assumptions that apply under an adjusted form of the Black Scholes option pricing model and reflect the value (as at grant date) of options held at 30 September 2013. The assumptions underlying the option valuations are: (a) the exercise price of the option, (b) the life of the option, (c) the current price of the underlying securities, (d) the expected volatility of the share price, (e) the dividends expected on the shares, and (f) the risk-free interest rate for the life of the option. The share based payments expense recognised in the Income Statement for share based payment schemes in 2013 was $16.0 million (2012 $17.9 million). Shares issued under employee incentive share plans in conjunction with non-recourse loans are accounted for as options. As a result, they are measured at fair value at the date of grant using an option valuation model which generates possible future share prices based on similar assumptions that underpin the Black Scholes option pricing model and reflects the value (as at grant date) of options granted. The amounts receivable from employees in relation to these loans and share capital issued under these schemes are not recognised and any shares purchased on-market are recognised as a share buy-back and deducted from shareholders equity.
Orica Annual Report 2013
For
per
sona
l use
onl
y

47
Directors’ Report – Remuneration Report
Orica Limited 47
(b) Retention Rights No Retention Rights remained outstanding as at 30 September 2013. The number of Retention Rights allocations in financial year 2012 (refer to section D.2) and their values in relation to Orica executives is shown in the following table: As at 30 September 2012
Grant date
Vesting date
Number of rights
issued
Number of rights held at
30 September 12
Number of participants at
30 September 12
Value of rights at grant date (1)
$ 09 Jan 12 31 March 13 108,246 108,246 5 2,498,318
(1) The assumptions underlying the rights valuations are:
Grant date
Price of Orica Shares
at grant date $
Expected volatility in
share price%
Dividends expected on shares
%
Risk free interest
rate %
Fair value per right (2)
$ 09 Jan 12 24.24 25 4 3.48 23.08
(2) The option valuations prepared by PwC use methodologies consistent with assumptions that apply under an adjusted form of the Black Scholes option pricing model and reflect the value (as at grant date) of options held at 30 September 2012. The assumptions underlying the option valuations are: (a) the exercise price of the option, (b) the life of the option, (c) the current price of the underlying securities, (d) the expected volatility of the share price, (e) the dividends expected on the shares, and (f) the risk-free interest rate for the life of the option.
For
per
sona
l use
onl
y

48
Directors’ Report
Orica Limited
48
Rounding The amounts shown in this report and in the financial statements have been rounded off, except where otherwise stated, to the nearest tenth of a million dollars, the Company being in a class specified in the ASIC Class Order 98/100 dated 10 July 1998.
This Directors’ Report is signed on behalf of the Board in accordance with a resolution of the directors of Orica Limited. P J B Duncan Chairman Dated at Melbourne this 11th day of November 2013.
Orica Annual Report 2013
For
per
sona
l use
onl
y

49
49KPMG, an Australian partnership and a member firm of the KPMG network of independent member firms affiliated with KPMG International Cooperative (“KPMG International”), a Swiss entity.
Liability limited by a scheme approved under Professional Standards Legislation.
Lead Auditor’s Independence Declaration under Section 307C of the Corporations Act 2001
To: the directors of Orica Limited
I declare that, to the best of my knowledge and belief, in relation to the audit for the financial year ended 30 September 2013 there have been:
(i) no contraventions of the auditor independence requirements as set out in the Corporations Act 2001 in relation to the audit; and
(ii) no contraventions of any applicable code of professional conduct in relation to the audit.
KPMG
Gordon Sangster Partner
Melbourne
11 November 2013
For
per
sona
l use
onl
y

50
Income Statement For the year ended 30 September
Orica Limited
50
2013 2012Notes $m $m
Sales revenue (3) 6,898.1 6,674.1Other income (3) 43.0 67.5
ExpensesChanges in inventories of finished goods and w ork in progress 35.9 47.9Raw materials and consumables used and finished goods purchased for resale (3,343.7) (3,306.0)Share based payments (16.0) (17.9)Other employee benefits expense (1,230.6) (1,109.3)Depreciation expense (4c) (247.9) (214.7)Amortisation expense (4c) (36.5) (36.7)Purchased services (322.7) (283.7)Repairs and maintenance (196.1) (182.6)Impairment of goodw ill (29) (5.7) (367.2)Outgoing freight (326.2) (302.7)Lease payments - operating leases (66.9) (67.0)Other expenses (233.3) (283.7)Share of net profit of associates accounted for using the equity method (11) 33.4 37.4
(5,956.3) (6,086.2)Profit from operations 984.8 655.4
Net financing costsFinancial income (4a) 34.2 32.9Financial expenses (4b) (184.4) (161.1)Net financing costs (150.2) (128.2)
Profit before income tax expense 834.6 527.2Income tax expense (5) (213.4) (103.4)Net profit for the year 621.2 423.8
Net profit for the year attributable to:Shareholders of Orica Limited 601.6 402.8Non-controlling interests 19.6 21.0Net profit for the year 621.2 423.8
cents centsEarnings per shareEarnings per share attributable to ordinary shareholders of Orica Limited:
Total attributable to ordinary shareholders of Orica Limited: Basic (6) 165.4 109.2 Diluted (6) 165.2 109.1
The Income Statement is to be read in conjunction w ith the notes to the financial statements set out on pages 55 to 125.
Consolidated
Orica Annual Report 2013
For
per
sona
l use
onl
y

51
Statement of Comprehensive Income For the year ended 30 September
Orica Limited
51
2013 2012Notes $m $m
Profit for the year 621.2 423.8
Other comprehensive income
Items that may be reclassified subsequently to profit or loss:Cash flow hedges Effective portion of changes in fair value (5c) 15.0 3.5 Transferred loss to Income Statement (5c) (4.1) (9.4) Tax on cash flow hedges (5c) (3.3) 1.7Net Cash flow hedges 7.6 (4.2)
Exchange differences on translation of foreign operations Exchange gain/(loss) on translation of foreign operations (5c) 157.6 (103.6) Net gain/(loss) on hedge of net investments in foreign subsidiaries (5c) 178.9 (99.8) Tax benefit/(expense) on exchange differences on translating foreign operations (5c) 23.5 (18.4)Net exchange differences on translation of foreign operations 360.0 (221.8)
Items that will not be reclassified subsequently to profit or loss:Retained earnings Actuarial benefits/(losses) on defined benefit plans (5c)(38) 24.9 (58.0) Tax (expense)/benefit on actuarial benefits/(losses) on defined benefit plans (5c)(38) (7.7) 16.5Net retained earnings 17.2 (41.5)
Other comprehensive income for the year 384.8 (267.5)Total comprehensive income for the year 1,006.0 156.3
Attributable to: Shareholders of Orica Limited 973.4 142.6 Non-controlling interests 32.6 13.7Total comprehensive income for the year 1,006.0 156.3
The Statement of Comprehensive Income is to be read in conjunction w ith the notes to the financial statementsset out on pages 55 to 125.
Consolidated
Orica Annual Report 2013
For
per
sona
l use
onl
y
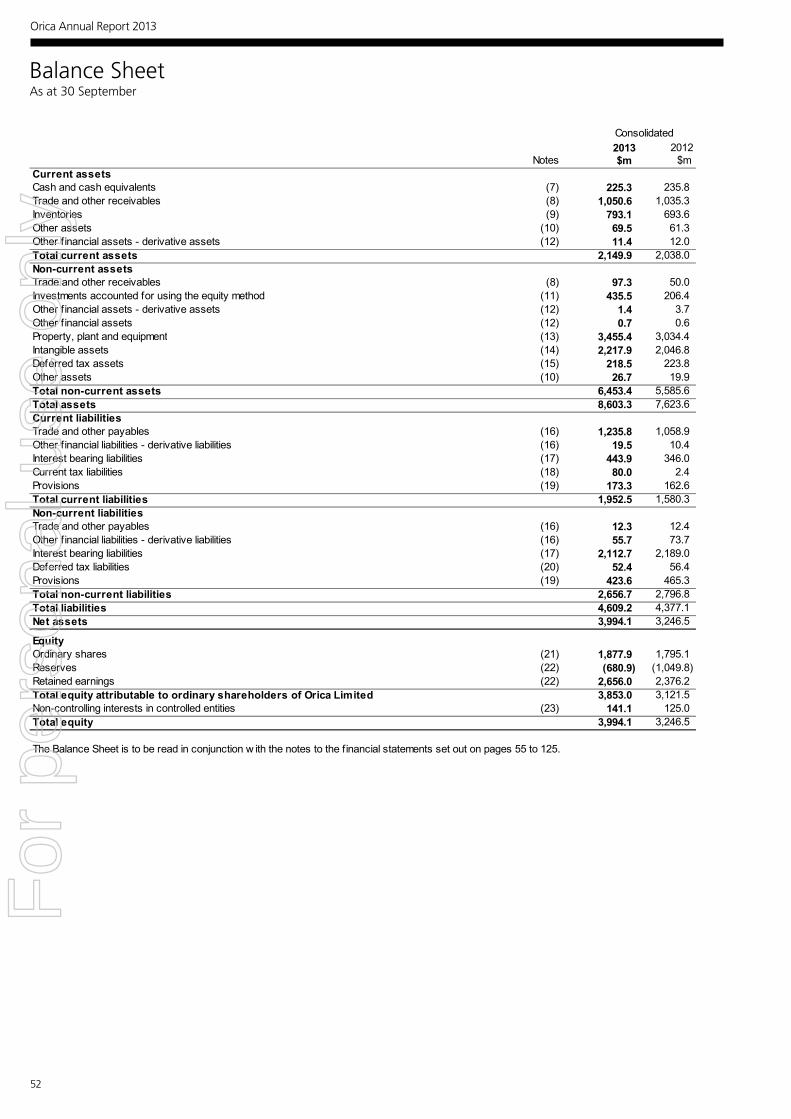
52
Balance Sheet As at 30 September
Orica Limited
52
2013 2012Notes $m $m
Current assetsCash and cash equivalents (7) 225.3 235.8 Trade and other receivables (8) 1,050.6 1,035.3 Inventories (9) 793.1 693.6 Other assets (10) 69.5 61.3 Other financial assets - derivative assets (12) 11.4 12.0 Total current assets 2,149.9 2,038.0 Non-current assetsTrade and other receivables (8) 97.3 50.0 Investments accounted for using the equity method (11) 435.5 206.4 Other financial assets - derivative assets (12) 1.4 3.7 Other financial assets (12) 0.7 0.6 Property, plant and equipment (13) 3,455.4 3,034.4 Intangible assets (14) 2,217.9 2,046.8 Deferred tax assets (15) 218.5 223.8 Other assets (10) 26.7 19.9 Total non-current assets 6,453.4 5,585.6 Total assets 8,603.3 7,623.6 Current liabilitiesTrade and other payables (16) 1,235.8 1,058.9 Other financial liabilities - derivative liabilities (16) 19.5 10.4 Interest bearing liabilities (17) 443.9 346.0 Current tax liabilities (18) 80.0 2.4 Provisions (19) 173.3 162.6 Total current liabilities 1,952.5 1,580.3 Non-current liabilitiesTrade and other payables (16) 12.3 12.4 Other financial liabilities - derivative liabilities (16) 55.7 73.7 Interest bearing liabilities (17) 2,112.7 2,189.0 Deferred tax liabilities (20) 52.4 56.4 Provisions (19) 423.6 465.3 Total non-current liabilities 2,656.7 2,796.8 Total liabilities 4,609.2 4,377.1 Net assets 3,994.1 3,246.5
EquityOrdinary shares (21) 1,877.9 1,795.1 Reserves (22) (680.9) (1,049.8) Retained earnings (22) 2,656.0 2,376.2 Total equity attributable to ordinary shareholders of Orica Limited 3,853.0 3,121.5 Non-controlling interests in controlled entities (23) 141.1 125.0 Total equity 3,994.1 3,246.5
The Balance Sheet is to be read in conjunction w ith the notes to the financial statements set out on pages 55 to 125.
Consolidated
Orica Annual Report 2013
For
per
sona
l use
onl
y

53
Stat
emen
t of
Cha
nges
in E
quity
Fo
r th
e ye
ar e
nded
30
Sept
embe
r
Oric
a Li
mite
d
53
Ord
inar
y sh
ares
Reta
ined
ea
rnin
gsSh
are
base
d pa
ymen
ts
rese
rve
Cash
flow
he
dgin
g re
serv
e
Fore
ign
curr
ency
tra
nsla
tion
rese
rve
Equi
ty re
serv
e ar
isin
g fr
om
purc
hase
of n
on-
cont
rollin
g in
tere
sts
Tota
lSt
ep-U
p Pr
efer
ence
Se
curit
ies
Non-
cont
rollin
g in
tere
sts
Tota
l equ
ity
$m
$m
$m
$m
$m
$m
$m
$m
$m
$m
2012
Bala
nce
at 1
Oct
ober
201
11,
749.
92,
363.
465
.4(1
1.5)
(715
.5)
(187
.4)
3,26
4.3
490.
012
1.3
3,87
5.6
Prof
it fo
r the
yea
r-
402.
8-
-
- -
402.
8-
21.0
423.
8O
ther
com
preh
ensi
ve in
com
e-
(41.
5)-
(4.2
)(2
14.5
)-
(260
.2)
- (7
.3)
(267
.5)
Tota
l com
preh
ensi
ve in
com
e fo
r th
e ye
ar-
361.
3-
(4.2
)(2
14.5
)-
142.
6-
13.7
156.
3Tr
ansa
ctio
ns w
ith o
wne
rs, r
ecor
ded
dire
ctly
in e
quity
Tota
l cha
nges
in c
ontri
bute
d eq
uity
45.2
- -
-
- -
45.2
- 1.
246
.4Sh
are-
base
d pa
ymen
ts e
xpen
se-
- 17
.9 -
-
- 17
.9-
-
17.9
Recl
assi
ficat
ion
to in
tere
st b
earin
g lia
biliti
es-
(10.
0)-
-
- -
(10.
0)(4
90.0
) -
(5
00.0
)Di
vest
men
t of n
on-c
ontro
lling
inte
rest
s -
0.3
- -
-
- 0.
3-
(1.2
)(0
.9)
Divi
dend
s/di
strib
utio
ns-
(338
.8)
- -
-
- (3
38.8
)-
-
(338
.8)
Divi
dend
s de
clar
ed/p
aid
to n
on-c
ontro
lling
inte
rest
s-
- -
-
- -
- -
(10.
0)(1
0.0)
Bala
nce
at th
e en
d of
the
year
1,79
5.1
2,37
6.2
83.3
(15.
7)(9
30.0
)(1
87.4
)3,
121.
5-
125.
03,
246.
520
13Ba
lanc
e at
1 O
ctob
er 2
012
1,79
5.1
2,37
6.2
83.3
(15.
7)(9
30.0
)(1
87.4
)3,
121.
5-
125.
03,
246.
5Pr
ofit
for t
he y
ear
- 60
1.6
- -
-
- 60
1.6
- 19
.662
1.2
Oth
er c
ompr
ehen
sive
inco
me
- 17
.2-
7.6
347.
0-
371.
8-
13.0
384.
8To
tal c
ompr
ehen
sive
inco
me
for
the
year
- 61
8.8
- 7.
634
7.0
- 97
3.4
- 32
.61,
006.
0Tr
ansa
ctio
ns w
ith o
wne
rs, r
ecor
ded
dire
ctly
in e
quity
Tota
l cha
nges
in c
ontri
bute
d eq
uity
82.8
- -
-
- -
82.8
- 4.
086
.8Sh
are-
base
d pa
ymen
ts e
xpen
se-
- 16
.0 -
-
- 16
.0-
-
16.0
Acq
uisi
tion
of n
on-c
ontro
lling
inte
rest
s-
- -
-
- (1
.7)
(1.7
)-
(1.6
)(3
.3)
Dive
stm
ent o
f non
-con
trollin
g in
tere
sts
- -
- -
-
- -
- (0
.4)
(0.4
)Di
vide
nds/
dist
ribut
ions
- (3
39.0
)-
-
- -
(339
.0)
- -
(3
39.0
)Di
vide
nds
decl
ared
/pai
d to
non
-con
trollin
g in
tere
sts
- -
- -
-
- -
- (1
8.5)
(18.
5)Ba
lanc
e at
the
end
of th
e ye
ar1,
877.
92,
656.
099
.3(8
.1)
(583
.0)
(189
.1)
3,85
3.0
- 14
1.1
3,99
4.1
The
Stat
emen
t of C
hang
es in
Equ
ity is
to b
e re
ad in
con
junc
tion
with
the
note
s to
the
finan
cial
sta
tem
ents
set
out
in p
ages
55
to 1
25.
Orica Annual Report 2013
For
per
sona
l use
onl
y

54
Statement of Cash Flows For the year ended 30 September
Orica Limited
54
2013 2012Notes $m $m
Inflows/ Inflow s/(Outflows) (Outflow s)
Cash flows from operating activitiesReceipts from customers 7,615.4 7,069.6Payments to suppliers and employees (6,307.7) (6,239.9)Interest received 34.0 32.9Borrow ing costs (187.3) (191.1)Dividends received 25.2 31.2Other operating revenue received 20.9 15.5Net income taxes paid (141.8) (174.1)Net cash flows from operating activities (26) 1,058.7 544.1Cash flows from investing activitiesPayments for property, plant and equipment (542.3) (586.5)Payments for intangibles (30.3) (42.4)Payments for purchase of investments (201.1) (40.9)Payments for purchase of businesses/controlled entities (27) (2.7) (13.8)Payments of deferred consideration from prior acquisitions - (29.3)Proceeds from sale of property, plant and equipment 31.3 28.5Proceeds from sale of investments 1.3 8.0Proceeds from sale of businesses/controlled entities (28) 0.5 2.5Net cash flows used in investing activities (743.3) (673.9)Cash flows from financing activitiesProceeds from long term borrow ings 6,585.1 7,284.5Repayment of long term borrow ings (6,776.2) (7,178.3)Net movement in short term financing 112.1 235.1Payments for finance leases (1.1) (5.4)Proceeds from issue of ordinary shares 39.4 24.3Proceeds from issue of shares to non-controlling interests 4.0 1.2Payments for buy-back of ordinary shares - LTEIP (9.6) (19.9)Dividends paid - Orica ordinary shares (286.0) (289.1)Distributions paid - Step-Up Preference Securities - (11.1)Dividends paid - non-controlling interests (18.8) (8.5)Net cash (used in)/from financing activities (351.1) 32.8Net decrease in cash held (35.7) (97.0)Cash at the beginning of the year 227.9 343.3Effects of exchange rate changes on cash 13.9 (18.4)Cash at the end of the year (26) 206.1 227.9
The Statement of Cash Flow s is to be read in conjunction w ith the notes to the financial statements set out on pages 55 to 125.
Consolidated
Orica Annual Report 2013
For
per
sona
l use
onl
y

55
Notes to the Financial Statements For the year ended 30 September 2013
Orica Limited
55
1 Accounting policies 56
2 Segment report 63
3 Sales revenue and other income 67
4 Specific profit and loss income and expenses 67
5 Income tax expense 68
6 Earnings per share (EPS) 71
7 Cash and cash equivalents 72
8 Trade and other receivables 72
9 Inventories 75
10 Other assets 75
11 Investments accounted for using the equity method 76
12 Other financial assets 77
13 Property, plant and equipment 78
14 Intangible assets 80
15 Deferred tax assets 81
16 Trade and other payables 81
17 Interest bearing liabilities 82
18 Current tax liabilities 83
19 Provisions 83
20 Deferred tax liabilities 85
21 Contributed equity 86
22 Reserves and retained earnings 88
23 Non-controlling interests in controlled entities 89
24 Parent Company disclosure - Orica Limited 90
25 Dividends and distributions 91
26 Notes to the statement of cash flows 92
27 Businesses and non-controlling interests acquired 93
28 Businesses disposed 94
29 Impairment testing of goodwill 95
30 Commitments 96
31 Auditors’ remuneration 97
32 Critical accounting judgements and estimates 97
33 Contingent liabilities 99
34 Financial and capital management 101
35 Events subsequent to balance date 110
36 Employee share plans 111
37 Related party disclosures 114
38 Superannuation commitments 116
39 Investments in controlled entities 122
40 Deed of cross guarantee 125
Orica Annual Report 2013
For
per
sona
l use
onl
y

56
Notes to the Financial Statements For the year ended 30 September 2013
Orica Limited
56
1. Accounting policies The significant accounting policies adopted in preparing the financial report of Orica Limited (‘the Company’ or ‘Orica’) and of its controlled entities (collectively ‘the consolidated entity’ or ‘the Group’) are stated below to assist in a general understanding of this financial report.
(i) Basis of preparation The financial report has been prepared on a historical cost basis, except for derivative financial instruments and investments in financial assets (other than controlled entities and associates) which have been measured at fair value. The carrying values of recognised assets and liabilities that are hedged items in fair value hedges, and are otherwise carried at cost, are adjusted to record changes in the fair value attributable to the risks that are being hedged.
(ii) Statement of compliance The financial report is a general purpose financial report which has been prepared by a for-profit entity in accordance with the requirements of applicable Australian Accounting Standards and the Corporations Act 2001 and complies with International Financial Reporting Standards (IFRS) adopted by the International Accounting Standards Board. The financial statements were approved by the Board of Directors on 11 November 2013. The financial report is presented in Australian dollars which is Orica’s functional and presentation currency. This financial report has been prepared on the basis of Australian Accounting Standards on issue that are effective or early adopted by Orica as at 30 September 2013. Except as described below, the accounting policies applied by the Group in the financial report are the same as those applied by the consolidated entity in its consolidated financial report for the year ended 30 September 2013. The standard relevant to Orica that has been adopted during the year is: AASB 2011-9 Amendments to Australian Accounting
Standards – Presentation of Items of Other Comprehensive Income - applicable for annual reporting periods beginning on or after 1 July 2012.
This standard has had no significant impact on the financial statements. The standards relevant to Orica that have not been early adopted are: Effective for Orica from 1 October 2013: Consolidated Financial Statements and Joint Arrangements AASB 10 Consolidated Financial Statements – applicable
for annual reporting periods beginning on or after 1 January 2013.
AASB 11 Joint Arrangements – applicable for annual reporting periods beginning on or after 1 January 2013.
AASB 12 Disclosure of Interests in Other Entities – applicable for annual reporting periods beginning on or after 1 January 2013.
AASB 127 Separate Financial Statements – applicable for annual reporting periods beginning on or after 1 January 2013.
AASB 128 Investments in Associates and Joint Ventures – applicable for annual reporting periods beginning on or after 1 January 2013.
AASB 2011-7 Amendments to Australian Accounting Standards arising from the Consolidation and Joint Arrangements Standards – applicable for annual reporting periods beginning on or after 1 January 2013.
AASB 2012-10 Amendments to Australian Accounting Standards – Transition Guidance and Other Amendments.
These standards revise the definition of control and the types of joint arrangements. It is expected that Yara Pilbara Nitrates Pty Ltd will be accounted for as a jointly controlled entity instead of an investment accounted for using the equity method and for Orica Mining Services Pilbara Pty Ltd to be accounted for as an investment accounted for using the equity method instead of consolidated. These changes are not expected to have a material effect on net profit for the year (although line items in the Income Statement will change) nor on Shareholders Equity (although line items in the Balance Sheet will change). Employee benefits AASB 119 Employee Benefits – applicable for annual
reporting periods on or after 1 January 2013. AASB 2012-6 Amendments to Australian Accounting
Standards – Mandatory Effective Date of AASB 9 and Transition Disclosures.
If the new standard had been adopted in the current period, the provision balance as at 30 September 2012 would have reduced by approximately $10 million and profit after income tax for 2013 would have been approximately $9 million lower. The major ongoing effect of the employee benefits standard is that the expected return on assets in defined benefit funds are limited to the discount rates applied to the net defined benefit asset or liability. Fair Value measurement AASB 13 Fair Value Measurement – applicable for
annual reporting periods beginning on or after 1 January 2013.
AASB 2011-8 Amendments to Australian Accounting Standards arising from AASB 13 – applicable for annual reporting periods beginning on or after 1 January 2013.
AASB 2011-10 Amendments to Australian Accounting Standards arising from AASB 119 (September 2011) - applicable for annual reporting periods beginning on or after 1 January 2013. These standards are expected to impact mainly on disclosures in the financial statements.
Other standards AASB 2011-4 Amendments to Australian Accounting
Standards to Remove Individual Key Management Personnel Disclosure Requirements – applicable for annual reporting periods beginning on or after 1 July 2013.
AASB 2012-2 Amendments to Australian Accounting Standards – Disclosures – Offsetting Financial Assets and Financial Liabilities - applicable for annual reporting periods beginning on or after 1 January 2013.
Orica Annual Report 2013
For
per
sona
l use
onl
y

57
Notes to the Financial Statements For the year ended 30 September 2013
Orica Limited
57
1. Accounting policies (continued) AASB 2012-5 Amendments to Australian Accounting
Standards arising from Annual Improvements 2009–2011 Cycle - applicable for annual reporting periods beginning on or after 1 January 2013.
These standards are expected to impact mainly on disclosures in the financial statements. Standards taking effect from 1 October 2014 and later AASB 2012-3 Amendments to Australian Accounting
Standards – Offsetting Financial Assets and Financial Liabilities - applicable for annual reporting periods beginning on or after 1 January 2014.
AASB 9 Financial Instruments - applicable for annual reporting periods beginning on or after 1 January 2015.
AASB 2009-11 Amendments to Australian Accounting Standards arising from AASB 9 – [AASB 1, 3, 4, 5, 7, 101, 102, 108, 112, 118, 121, 127, 128, 131, 132, 136, 139, 1023 & 1038 and Interpretations 10 & 12] - available for annual reporting periods beginning on or after 1 January 2013
AASB 2010-7 Amendments to Australian Accounting Standards arising from AASB 9 (December 2010) – available for annual reporting periods on or after 1 January 2013.
AASB 2013-3 Amendments to AASB 136 – Recoverable Amount Disclosures for Non-Financial Assets - applicable for annual reporting periods beginning on or after 1 January 2014.
The consolidated entity expects to adopt these standards in the 2015 and subsequent financial years - however the financial impact of adopting the new or amended standards has not yet been determined.
(iii) Consolidation The consolidated financial statements are prepared by combining the financial statements of all the entities that comprise the consolidated entity, being the Company (the parent entity) and its subsidiaries as defined in Accounting Standard AASB 127 Consolidated and Separate Financial Statements. Consistent accounting policies are employed in the preparation and presentation of the consolidated financial statements. On acquisition, the assets, liabilities and contingent liabilities of a subsidiary are measured at their fair values at the date of acquisition. Any excess of the cost of acquisition over the fair values of the identifiable net assets acquired is recognised as goodwill. If, after reassessment, the fair values of the identifiable net assets acquired exceed the cost of acquisition, the excess is credited to the Income Statement in the period of acquisition. The non-controlling interest’s share of net assets is stated at their proportion of the fair values of the assets and liabilities and contingent liabilities recognised of each subsidiary. The consolidated financial statements include the information and results of each subsidiary from the date on which the Company obtains control until such time as the Company ceases to control such entity. In preparing the consolidated financial statements, all intercompany balances, transactions and unrealised profits arising within the consolidated entity are eliminated in full.
(iv) Revenue recognition Sales revenue External sales are measured at the fair value of the consideration received or receivable, net of returns, trade discounts and volume rebates. External sales are recognised when the significant risks and rewards of ownership are transferred to the purchaser, recovery of the consideration is probable, the associated costs and possible return of goods can be estimated reliably, there is no continuing management involvement with the goods, and the amount of revenue can be measured reliably.
Other income Profits and losses from sale of businesses, controlled entities and other non-current assets are recognised when there is a signed unconditional contract of sale. Dividends are recognised in the Income Statement when declared. Construction contracts Contract revenue and expenses are recognised on an individual contract basis using the percentage of completion method when the stage of contract completion can be reliably determined, costs to date can be clearly identified and total contract revenue and costs to complete can be reliably estimated. Stage of completion is measured by reference to an assessment of physical work completed to date as a percentage of estimated total work for each contract. An expected loss is recognised immediately as an expense.
(v) Financial income & borrowing costs Financial income Financial income includes interest income on funds invested and the non designated portion of the net investment hedging derivatives. These are recognised in the Income Statement as accrued. Borrowing costs Borrowing costs include interest, unwinding of the effect of discounting on provisions, amortisation of discounts or premiums relating to borrowings and amortisation of ancillary costs incurred in connection with the arrangement of borrowings, including lease finance charges. Borrowing costs are expensed as incurred unless they relate to qualifying assets. Where funds are borrowed specifically for the production of a qualifying asset, the interest on those funds is capitalised, net of any interest earned on those borrowings. Where funds are borrowed generally, borrowing costs are capitalised using a weighted average interest rate.
(vi) Research and development costs Research costs are expensed as incurred. Development costs are expensed as incurred except when it is probable that future economic benefits associated with the item will flow to the consolidated entity, in which case they are capitalised. (vii) Share based payments Equity settled share based payments are externally measured at fair value at the date of grant using an option valuation model. This valuation model generates possible future share prices based on similar assumptions that underpin relevant option pricing models and reflects the value (as at grant date) of options granted. The assumptions underlying the options valuations are: (a) the exercise price of the option, (b) the life of the option, (c) the current price of the underlying securities, (d) the expected volatility of the share price, (e) the dividends
For
per
sona
l use
onl
y

58
Notes to the Financial Statements For the year ended 30 September 2013
Orica Limited
58
1. Accounting policies (continued) expected on the shares and (f) the risk-free interest rate for the life of the option. The fair value determined at the grant date of the equity settled share based payments is expensed in the Income Statement on a straight-line basis over the relevant vesting period. The amount recognised is adjusted to reflect the actual number of share options that vest, except for those that fail to vest due to vesting conditions not being met. For the December 2010 and subsequent years issues under the Long Term Equity Incentive Plan, the share based payment expense will be adjusted to an expense based on actual EPS growth achieved. Shares issued under employee incentive share plans in conjunction with non-recourse loans are accounted for as options. As a result, the amounts receivable from employees in relation to these loans and share capital issued under these schemes are not recognised and any shares purchased on-market are recognised as a share buy-back and deducted from shareholders equity.
(viii) Carbon emissions Allocated carbon emissions permits are recognised at nil value. Carbon emissions permits purchased to meet the Group's settlement requirements are initially recorded at cost within intangible assets. A liability is recognised when the Group’s carbon emissions exceed the emissions permits held. The liability together with any net gain resulting from the sale of permits is recognised in other expenses. Liabilities are measured at nominal value up to the level of allocated permits held and at the cost of purchased permits up to the level of purchased permits held.
(ix) Taxation Income tax on the profit or loss for the year comprises current and deferred tax and is recognised in the Income Statement. Current tax is the expected tax payable on the taxable income for the year, using tax rates enacted or substantively enacted at reporting date, and any adjustments to tax payable in respect of previous years. Under AASB 112 Income Taxes, deferred tax balances are determined using the balance sheet method which calculates temporary differences based on the carrying amounts of an entity's assets and liabilities in the balance sheet and their associated tax bases. Current and deferred taxes attributable to amounts recognised directly in equity are also recognised in equity. The amount of deferred tax provided will be based on the expected manner of realisation of the asset or settlement of the liability, using tax rates enacted or substantively enacted at reporting date. A deferred tax asset will be recognised only to the extent that it is probable that future taxable profits will be available against which the asset can be utilised. Deferred tax assets will be reduced to the extent it is no longer probable that the related tax benefit will be realised. Tax consolidation Orica Limited is the parent entity in the tax consolidated group comprising all wholly-owned Australian entities.
Due to the existence of a tax sharing agreement between the entities in the tax consolidated group, the parent entity recognises the tax effects of its own transactions and the current tax liabilities and the deferred tax assets arising from unused tax losses and unused tax credits assumed from the subsidiary entities. Current tax income/expense, deferred tax liabilities and deferred tax assets arising from temporary differences of the members of the tax-consolidated group are recognised in the separate financial statements of the members of the tax-consolidated group using the ‘separate taxpayer within group’ approach by reference to the carrying amounts of assets and liabilities in the separate financial statements of each entity and the tax values applying under tax consolidation. In accordance with the tax sharing agreement, the subsidiary entities are compensated for the assets and liabilities assumed by the parent entity as intercompany receivables and payables and for amounts which equal the amounts initially recognised by the subsidiary entities. There is no adjustment for tax consolidation contribution by (or distribution to) equity participants.
(x) Inventories Inventories are valued at the lower of cost and net realisable value. Net realisable value is the estimated selling price in the ordinary course of business less the estimated cost of completion and selling expenses. Cost is based on the first-in, first-out or weighted average method based on the type of inventory. For manufactured goods, cost includes direct material and fixed overheads based on normal operating capacity. For merchanted goods, cost is net cost into store.
(xi) Construction work in progress Where the Group manufactures equipment for sale, the work in progress is carried at cost plus profit recognised to date based on the value of work completed less progress billings and less provision for foreseeable losses allocated between amounts due from customers and amounts due to customers. (xii) Trade and other receivables Trade and other receivables are recognised at their cost less any impairment losses. Collectability of trade and other receivables is reviewed on an ongoing basis. Debts that are known to be uncollectible are written off. An impairment loss is recognised when there is objective evidence that the Group will not be able to collect amounts due according to the original terms of the receivables.
(xiii) Investments accounted for using the equity method Investments in associates are accounted for in the consolidated financial statements using the equity method of accounting. Associates are those entities over which the consolidated entity exercises significant influence but does not control.
(xiv) Other financial assets The consolidated entity’s interests in financial assets other than controlled entities and associates are stated at market value. Investments in subsidiaries and associates are accounted for in the financial statements at their cost of acquisition.
Orica Annual Report 2013
For
per
sona
l use
onl
y

59
Notes to the Financial Statements For the year ended 30 September 2013
Orica Limited
59
1. Accounting policies (continued) (xv) Non-current assets held for sale and disposal groups Immediately before classification as held for sale, the measurement of the assets (and all assets and liabilities in a disposal group) is reassessed in accordance with applicable accounting standards. Then, on initial classification as held for sale, non-current assets and disposal groups are recognised at the lower of carrying amount and fair value less costs to sell. Impairment losses on initial classification as held for sale are included in the Income Statement. The same applies to gains and losses on subsequent remeasurement. Classification as a disposal group occurs when the operation meets the criteria to be classified as held for sale.
(xvi) Property, plant and equipment and depreciation Property, plant and equipment are stated at cost less accumulated depreciation and impairment. Cost includes expenditure that is directly attributable to the acquisition of the item. Subsequent costs are included in the asset’s carrying amount or recognised as a separate asset, as appropriate, only when it is probable that future economic benefits associated with the item will flow to the consolidated entity and the cost of the item can be measured reliably. Property, plant and equipment, other than freehold land, is depreciated on a straight-line basis at rates calculated to allocate the cost less the estimated residual value over the estimated useful life of each asset to the consolidated entity. The assets' residual values, useful lives and depreciation methods are reviewed, and adjusted if appropriate each financial year. Estimated useful lives of each class of asset are as follows: Buildings and improvements 25 to 40 years Machinery, plant and equipment 3 to 40 years Profits and losses on disposal of property, plant and equipment are taken to the Income Statement. As required under AASB 116, Property, plant and equipment, Orica reviewed and changed the estimate of useful lives and depreciation rates of major ammonium nitrate manufacturing plants during the year. The effect of this change in estimate was to reduce the depreciation expense for this year and future years by approximately $24 million per year.
(xvii) Leased assets Leases under which the consolidated entity assumes substantially all the risks and benefits of ownership are classified as finance leases. Other leases are classified as operating leases. Assets under finance lease are capitalised at the present value of the minimum lease payments and amortised on a straight-line basis over the period during which benefits are expected to flow from the use of the leased assets. A corresponding liability is established and each lease payment is allocated between finance charges and reduction of the liability. Operating leases are not capitalised and lease rental payments are taken to the Income Statement on a straight-line basis.
(xviii) Intangible assets Identifiable intangibles Amounts paid for the acquisition of identifiable intangible assets are capitalised at the fair value of consideration paid determined by reference to independent valuations. Identifiable intangible assets with a finite life (customer contracts, patents, software, brand names, trademarks and licences) are amortised on a straight-line basis over their expected useful life to the consolidated entity, being up to thirty years. Identifiable intangible assets with an indefinite life (brand names and trademarks) are not amortised but the recoverable amount of these assets is tested for impairment at least annually as explained under impairment of assets (see note xxvi). Unidentifiable intangibles Where the fair value of the consideration paid for a business acquisition exceeds the fair value of the identifiable assets, liabilities and contingent liabilities acquired, the difference is treated as goodwill. Goodwill is not amortised but the recoverable amount is tested for impairment at least annually as explained under impairment of assets (see note xxvi). Subsequent expenditure Subsequent expenditure on capitalised intangible assets is capitalised only when it increases the future economic benefits embodied in the specific asset to which it relates. All other expenditure is expensed as incurred.
(xix) Interest-bearing liabilities Interest-bearing liabilities are initially recognised at fair value less attributable transaction costs. Subsequent to initial recognition, interest-bearing liabilities are stated at amortised cost with any difference between cost and redemption value being recognised in the Income Statement over the period of the liabilities on an effective interest basis. Amortised cost is calculated by taking into account any issue costs and any discount or premium on issuance. Gains and losses are recognised in the Income Statement in the event that the liabilities are derecognised.
(xx) Provisions A provision is recognised when there is a legal or constructive obligation as a result of a past event and it is probable that a future sacrifice of economic benefits will be required to settle the obligation, the timing or amount of which is uncertain and a reliable estimate of the liability is able to be assessed. If the effect is material, a provision is determined by discounting the expected future cash flows (adjusted for expected future risks) required to settle the obligation at a rate that reflects current market assessments of the time value of money and the risks specific to the liability. The unwinding of the effect of discounting on provisions is recognised as a borrowing cost. Environmental Estimated costs for the remediation of soil, groundwater and untreated waste that have arisen as a result of past events are provided for where a legal or constructive obligation exists and a reliable estimate of the liability is able to be assessed.
For
per
sona
l use
onl
y

60
Notes to the Financial Statements For the year ended 30 September 2013
Orica Limited
60
1. Accounting policies (continued) However, where the cost relates to land held for resale then, to the extent that the expected realisation exceeds both the book value of the land and the estimated cost of remediation, the cost is capitalised as part of the holding value of that land.For sites where there are uncertainties with respect to what Orica’s remediation obligations might be or what remediation techniques might be approved and no reliable estimate can presently be made of regulatory and remediation costs, no amounts have been capitalised, expensed or provided for. Decommissioning The present value of the estimated costs of dismantling and removing an asset and restoring the site on which it is located are recognised as an asset within property, plant and equipment which is depreciated on a straight line basis over its estimated useful life and a corresponding provision is raised where a legal or constructive obligation exists. At each reporting date, the liability is remeasured in line with changes in discount rates, timing and estimated cash flows. Any changes in the liability are added or deducted from the related asset, other than the unwinding of the discount which is recognised as borrowing costs in the Income Statement. Self insurance The Group self-insures for certain insurance risks. Outstanding claims are recognised when an incident occurs that may give rise to a claim and are measured at the cost that the entity expects to incur in settling the claims. Employee entitlements Provisions are made for liabilities to employees for annual leave, sick leave and other current employee entitlements that represent the amount for which the consolidated entity has a present obligation. These have been calculated at nominal amounts based on the wage and salary rates that the consolidated entity expects to pay as at each reporting date and include related on-costs. Liabilities for employee entitlements which are not expected to be settled within twelve months of balance date, such as long service leave, are accrued at the present value of future amounts expected to be paid. The present value is determined using interest rates applicable to government guaranteed securities with maturities approximating the terms of the consolidated entity’s obligations. A liability is recognised for bonus plans on the achievement of predetermined bonus targets and the benefit calculations are formally documented and determined before signing the financial report. Contingent liabilities on acquisition of controlled entities A provision is recognised on acquisition of a business for contingent liabilities of that business. Superannuation Contributions to defined contribution superannuation funds are taken to the Income Statement in the year in which the expense is incurred. For each defined benefit scheme, the cost of providing pensions is charged to the Income Statement so as to recognise current and past service costs, interest cost on defined benefit obligations, and the effect of any curtailments or settlements, net of expected returns on plan assets. All actuarial gains and losses are recognised in other
comprehensive income. The consolidated entity’s net obligation in respect of defined benefit pension plans is calculated by estimating the amount of future benefit that employees have earned in return for their service in the current and prior periods; that benefit is discounted to determine its present value, and the fair value of any plan assets is deducted. The discount rate is the yield at the balance sheet date on high quality corporate bonds or in countries where there is no deep market in such bonds, the market yields on government bonds that have maturity dates approximating the terms of the consolidated entity’s obligations. The calculation is performed annually by a qualified actuary using the projected unit credit method. Restructuring and employee termination benefits Provisions for restructuring or termination benefits are only recognised when a detailed plan has been approved and the restructuring or termination has either commenced or been publicly announced, or firm contracts related to the restructuring or termination benefits have been entered into. Costs related to ongoing activities are not provided for. Onerous contracts A provision for onerous contracts is recognised after impairment losses on assets dedicated to the contract have been recognised and when the expected benefits are less than the unavoidable costs of meeting the contractual obligations. A provision is recognised to the extent that the contractual obligations exceed unrecognised assets.
(xxi) Trade and other payables Dividends A liability for dividends payable (including distributions on the Step-Up Preference Securities) is recognised in the reporting period in which the dividends are declared, for the entire undistributed amount, regardless of the extent to which they will be paid in cash.
(xxii) Foreign currency Functional currency Items included in the financial statements of each of the Group’s entities are measured using the currency of the primary economic environment in which the entity operates (the functional currency). Foreign currency transactions Transactions in foreign currencies are translated at the foreign exchange rate ruling at the date of the transaction. Monetary assets and liabilities denominated in foreign currencies at the balance sheet date are translated to the functional currency of the entity at the foreign exchange rate ruling at that date. Foreign exchange differences arising on translation are recognised in the Income Statement. Non-monetary assets and liabilities that are measured at historical cost in a foreign currency are translated using the exchange rate ruling at the date of the transaction. Non-monetary assets and liabilities denominated in foreign currencies that are measured at fair value are translated to the functional currency of the entity at foreign exchange rates ruling at the dates the fair value was determined. Financial statements of foreign operations The assets and liabilities of foreign operations, including
Orica Annual Report 2013
For
per
sona
l use
onl
y

61
Notes to the Financial Statements For the year ended 30 September 2013
Orica Limited
61
1. Accounting policies (continued) goodwill and fair value adjustments arising on consolidation, are translated to Australian dollars at foreign exchange rates ruling at the balance sheet date. The revenues and expenses of foreign operations, excluding foreign operations in hyperinflationary economies, are translated to Australian dollars at rates approximating the foreign exchange rates ruling at the dates of the transactions. The revenues and expenses of foreign operations in hyperinflationary economies are translated to Australian dollars at the foreign exchange rates ruling at the balance sheet date. Foreign exchange differences arising on retranslation are recognised directly in a separate component of equity. Prior to translating the financial statements of foreign operations in hyperinflationary economies, the financial statements, including comparatives, are restated to account for changes in the general purchasing power of the local currency. The restatement is based on relevant price indices at the balance sheet date. Net investment in foreign operations Exchange differences arising from the translation of the net investment in foreign operations, and of related hedges are taken to the translation reserve. They are released into the Income Statement upon disposal.
(xxiii) Financial instruments The consolidated entity uses financial instruments to hedge its exposure to foreign exchange and interest rate risks arising from operational, financing and investment activities. In accordance with its treasury policy, the consolidated entity does not hold or issue financial instruments for trading purposes. However, financial instruments that do not qualify for hedge accounting, but remain economically effective, are accounted for as trading instruments. Financial instruments are recognised initially at cost. Subsequent to initial recognition, financial instruments are stated at fair value. The gain or loss on remeasurement to fair value is recognised immediately in the Income Statement. However, where financial instruments qualify for hedge accounting, recognition of any resultant gain or loss depends on the nature of the item being hedged. Hedging Cash flow hedges Where a financial instrument is designated as a hedge of the variability in cash flows of a recognised asset or liability, or a highly probable forecasted transaction, the effective part of any gain or loss on the financial instrument is recognised in other comprehensive income. When the forecasted transaction subsequently results in the recognition of a non-financial asset or non-financial liability, the associated cumulative gain or loss is removed from equity and included in the initial cost or other carrying amount of the non-financial asset or liability. If a hedge of a forecasted transaction subsequently results in the recognition of a financial asset or a financial liability, then the associated gains and losses that were recognised directly in equity are reclassified into the Income Statement in the same period or periods during which the asset acquired or liability assumed affects the Income Statement. For cash flow hedges, other than those covered by the preceding two policy statements, the associated cumulative
gain or loss is removed from other comprehensive income and recognised in the Income Statement in the same period or periods during which the hedged forecast transaction affects the Income Statement. The ineffective part of any gain or loss is recognised immediately in the Income Statement. When a hedging instrument expires or is sold, terminated or exercised, or the entity revokes designation of the hedge relationship but the hedged forecast transaction is still expected to occur, the cumulative gain or loss at that point remains in equity and is recognised in accordance with the above policy when the transaction occurs. If the hedged transaction is no longer expected to take place, then the cumulative unrealised gain or loss recognised in equity is recognised immediately in the Income Statement. Fair value hedges The consolidated entity uses fair value hedges to mitigate the risk of changes in the fair value of its foreign currency borrowings from foreign currency and interest rate fluctuations over the hedging period. Under a fair value hedge gains or losses from remeasuring the fair value of the hedging instrument are recognised in the Income Statement, together with gains or losses in relation to the hedged item. Hedge of monetary assets and liabilities When a financial instrument is used to hedge economically the foreign exchange exposure of a recognised monetary asset or liability, hedge accounting is not applied and any gain or loss on the hedging instrument is recognised in the Income Statement. Investments in debt and equity securities Financial instruments held for trading are classified as current assets and are stated at fair value, with any resultant gain or loss recognised in the Income Statement. Other financial instruments held by the consolidated entity classified as being available-for-sale are stated at fair value, with any resultant gain or loss recognised directly in equity, except for impairment losses and, in the case of monetary items such as debt securities, foreign exchange gains and losses. Where these investments are derecognised, the cumulative gain or loss previously recognised directly in other comprehensive income is recognised in the Income Statement. Where these investments are interest-bearing, interest calculated using the effective interest method is recognised in the Income Statement. The fair value of financial instruments classified as held for trading and available for sale is their quoted market price at the balance sheet date. Financial instruments classified as held for trading or available for sale investments are recognised/derecognised by the consolidated entity on the date it commits to purchase/sell the investments. Securities held to maturity are recognised/ derecognised on the day they are transferred to/by the consolidated entity. Hedge of net investment in foreign operations The portion of the gain or loss on an instrument used to hedge a net investment in a foreign operation that is determined to be an effective hedge is recognised directly in the foreign currency translation reserve in equity. The ineffective portion is recognised immediately in the Income Statement.
For
per
sona
l use
onl
y

62
Notes to the Financial Statements For the year ended 30 September 2013
Orica Limited
62
1. Accounting policies (continued) Anticipated transactions Foreign currency transactions are translated at the exchange rate prevailing at the date of the transaction. Foreign currency receivables and payables outstanding at balance date are translated at the exchange rates current at that date. Exchange gains and losses on retranslation of outstanding receivables and payables are taken to the Income Statement. Where a hedge transaction is designated as a hedge of the anticipated purchase or sale of goods or services, purchase of qualifying assets, or an anticipated interest transaction, gains and losses on the hedge, arising up to the date of the anticipated transaction, together with any costs or gains arising at the time of entering into the hedge, are deferred and included in the measurement of the anticipated transaction when the transaction has occurred as designated. Any gains or losses on the hedge transaction after that date are included in the Income Statement. The net amount receivable or payable under open swaps, forward rate agreements and futures contracts and the associated deferred gains or losses are not recorded in the Income Statement until the hedged transaction matures. The net receivables or payables are then revalued using the foreign currency, interest or commodity rates current at balance date. When the anticipated transaction is no longer expected to occur as designated, the deferred gains and losses relating to the hedged transaction are recognised immediately in the Income Statement. Gains and losses that arise prior to and upon the maturity of transactions entered into under hedge strategies are deferred and included in the measurement of the hedged anticipated transaction if the transaction is still expected to occur as designated. If the anticipated transaction is no longer expected to occur as designated, the gains and losses are recognised immediately in the Income Statement.
(xxiv) Cash and cash equivalents Cash includes cash at bank, cash on hand and deposits at call which are readily convertible to cash on hand and which are used in the cash management function and are disclosed for the purposes of the Statement of Cash Flows net of bank overdrafts.
(xxv) Share capital When share capital recognised as equity is repurchased, the amount of the consideration paid, including directly attributable costs, is recognised as a deduction from total equity. Transaction costs of an equity transaction are accounted for as a deduction from equity, net of any related income tax benefit. Step-Up Preference Securities Step-Up Preference Securities (SPS) were included in equity. A provision for distributions payable was recognised in the reporting period in which the distributions were declared (refer to note 21). SPS were repurchased for $100 per SPS on 29 November 2011.
(xxvi) Impairment of assets The carrying amount of Orica’s and the Group’s non-current assets excluding defined benefit fund assets and deferred tax assets is reviewed at each reporting date to determine whether there are any indicators of impairment. If such indicators exist, the asset is tested for impairment by comparing its recoverable
amount to its carrying amount. The recoverable amount of an asset is determined as the higher of fair value less costs to sell and value in use. The recoverable amount is estimated for each individual asset or where it is not possible to estimate for individual assets, it is estimated for the cash generating unit to which the asset belongs. A cash generating unit (CGU) is the smallest identifiable group of assets that generate cash inflows largely independent of the cash inflows of other assets or group of assets with each CGU being no larger than a segment. CGUs to which goodwill has been allocated are aggregated so that the level at which impairment testing is performed reflects the lowest level at which goodwill is monitored for internal reporting purposes, subject to being at no greater than the segments reported in note 2. Goodwill acquired in a business combination is allocated to groups of CGUs that are expected to benefit from the synergies of the combination. In calculating recoverable amount, the estimated future cash flows are discounted to their present values using a pre-tax discount rate that reflects the current market assessments of the risks specific to the asset or cash generating unit. Cash flows are estimated for the asset in its present condition and therefore do not include cash inflows or outflows that improve or enhance the asset’s performance or that may arise from future restructuring. An impairment loss is recognised whenever the carrying amount of an asset or its CGU exceeds its recoverable amount. Impairment losses are recognised in the Income Statement. Impairment losses recognised in respect of cash generating units are allocated first to reduce the carrying amount of any goodwill allocated to cash generating units and then to reduce the carrying amount of the other assets in the unit. Reversals of impairment An impairment loss is reversed if the subsequent increase in recoverable amount can be related objectively to an event occurring after the impairment loss was recognised. An impairment loss is reversed only to the extent that the asset’s carrying amount does not exceed the carrying amount that would have been determined, net of depreciation or amortisation, if no impairment loss had been recognised. An impairment loss in respect of goodwill is not reversed.
(xxvii) Goods and services tax Revenues, expenses, assets and liabilities other than receivables and payables, are recognised net of the amount of goods and services tax (GST), except where the amount of GST incurred is not recoverable from the relevant taxation authorities. In these circumstances, the GST is recognised as part of the cost of acquisition of the asset or as part of an item of expense. The net amount of GST recoverable from, or payable to, the relevant taxation authorities is included as a current asset or liability in the Balance Sheet. Cash flows are included in the Statement of Cash Flows on a gross basis. The GST components of cash flows arising from investing and financing activities which are recoverable from, or payable to, the relevant taxation authorities are classified as operating cash flows.
Orica Annual Report 2013
For
per
sona
l use
onl
y
63
Notes to the Financial Statements For the year ended 30 September 2013
Orica Limited
63
1. Accounting policies (continued)
(xxviii) Rounding The amounts shown in the financial statements have been rounded off, except where otherwise stated, to the nearest tenth of a million dollars, the Company being in a class specified in the ASIC Class Order 98/100 dated 10 July 1998.
(xxix) Comparatives Where applicable, comparatives have been adjusted to disclose them on the same basis as current period figures.
2. Segment report Segment information is presented in respect of the consolidated entity’s internal management structure as reported to the Group’s Chief Operating Decision Maker (CODM). The CODM for the Group has been assessed as the Group’s Managing Director. Following the Orica restructure from 1 October 2012, the segments have been re-evaluated and the comparative period has been restated. The consolidated entity’s operations have been divided into seven reportable segments comprising: Mining Services: Australia/Pacific, North America, Latin America, EMEA (Europe, Middle East & Africa) and Other; Chemicals and Other. The consolidated entity's policy is to transfer products internally at negotiated commercial prices. Other income includes royalties, profit on sale of property, plant and equipment, profit from the sale of businesses and controlled entities and foreign currency gains. The major products and services from which the above segments derive revenue are:
Defined reportable segments Products/services Mining Services* - Australia/Pacific - North America - Latin America - EMEA - Other**
Manufacture and supply of commercial explosives and blasting systems to the mining and infrastructure markets, the provision of ground support services in mining and tunnelling and supply of sodium cyanide for gold extraction.
Chemicals Manufacture, distribution and trading of a broad range of industrial and specialty chemicals for use in a wide range of industries, which include water treatment, pulp and paper, food and beverage, construction and mining.
Other Minor activities, operation of the Botany Groundwater Recycling Business, non-operating assets, corporate and support costs and financial items such as foreign currency gains/losses.
*Mining Services includes Mining Chemicals (previously included in Chemicals) and former Minova (previously disclosed as a separate segment). **Mining Services Other segment includes Mining Services global head office, global hub activities (including research and development, global purchasing and supply chain), other support costs and Asia. Prior period comparative segment information has been restated.
For
per
sona
l use
onl
y

64
Not
es t
o th
e Fi
nanc
ial S
tate
men
ts
For
the
year
end
ed 3
0 Se
ptem
ber
O
rica
Lim
ited
64
2.S
egm
ent r
epor
t (co
ntin
ued)
Repo
rtabl
e se
gmen
ts20
13
$m
Mining Services Australia/Pacific
Mining Services North America
Mining Services Latin America
Mining Services EMEA
Mining Services Other
Eliminations
Total Mining Services
Chemicals
Other
Eliminations
Consolidated
Rev
enue
Exte
rnal
sal
es1,
974.
01,
390.
195
6.7
922.
750
5.6
-
5,74
9.1
1,14
6.5
2.5
-
6,89
8.1
Inte
r-se
gmen
t sal
es11
5.5
181.
940
.615
.781
2.3
(1,1
44.9
)21
.152
.30.
3(7
3.7)
-
To
tal s
ales
reve
nue
2,08
9.5
1,57
2.0
997.
393
8.4
1,31
7.9
(1,1
44.9
)5,
770.
21,
198.
82.
8(7
3.7)
6,89
8.1
Oth
er in
com
e (1
)(0
.8)
17.7
13.0
(0.9
)11
.7-
40.7
2.5
(0.2
)-
43.0
Tota
l rev
enue
and
oth
er in
com
e2,
088.
71,
589.
71,
010.
393
7.5
1,32
9.6
(1,1
44.9
)5,
810.
91,
201.
32.
6(7
3.7)
6,94
1.1
Res
ults
623.
310
8.9
86.7
63.8
110.
0 -
99
2.7
92.0
(99.
9) -
98
4.8
Fina
ncia
l inc
ome
34.2
Fina
ncia
l exp
ense
(184
.4)
Prof
it be
fore
inco
me
tax
expe
nse
834.
6In
com
e ta
x ex
pens
e(2
13.4
)Pr
ofit
afte
r in
com
e ta
x ex
pens
e62
1.2
Prof
it at
tribu
tabl
e to
non
-con
trolli
ng in
tere
sts
(19.
6)60
1.6
Segm
ent a
sset
s2,
969.
81,
128.
277
4.3
1,09
1.7
1,18
5.4
-
7,14
9.4
839.
261
4.7
-
8,60
3.3
Segm
ent l
iabi
litie
s40
9.9
199.
322
5.9
242.
429
3.7
-
1,37
1.2
221.
03,
017.
0 -
4,
609.
2N
et A
sset
s2,
559.
992
8.9
548.
484
9.3
891.
7 -
5,
778.
261
8.2
(2,4
02.3
) -
3,
994.
1In
vest
men
ts a
ccou
nted
for u
sing
the
equi
ty m
etho
d23
9.6
152.
93.
48.
929
.6-
434.
41.
00.
1-
435.
5Ac
quis
ition
s of
PPE
and
inta
ngib
les
281.
369
.140
.947
.678
.9-
517.
822
.538
.1-
578.
4Im
pairm
ent o
f int
angi
bles
-
-
-
-
5.7
-
5.7
-
-
-
5.7
Impa
irmen
t of i
nven
torie
s4.
22.
50.
32.
91.
8 -
11
.71.
1 -
-
12
.8Im
pairm
ent o
f tra
de re
ceiva
bles
1.0
1.6
0.1
3.4
3.6
- 9.
71.
8-
- 11
.5Im
pairm
ent o
f inv
estm
ents
-
-
-
0.3
-
-
0.3
-
-
-
0.3
Dep
recia
tion
101.
035
.421
.430
.825
.6 -
21
4.2
30.2
3.5
-
247.
9Am
ortis
atio
n3.
812
.90.
37.
08.
8 -
32
.80.
63.
1 -
36
.5
2.3
2.1
0.8
0.9
4.4
-
10.5
1.1
4.4
-
16.0
Shar
e of
ass
ocia
tes
net p
rofit
equ
ity a
ccou
nted
(1.2
)33
.41.
10.
2-
- 33
.5(0
.1)
- -
33.4
(
1) In
clud
es fo
reig
n cu
rrenc
y ga
ins/
loss
es in
var
ious
repo
rtabl
e se
gmen
ts.
Prof
it/(lo
ss) b
efor
e in
divi
dual
ly m
ater
ial i
tem
s, n
et
finan
cing
cos
ts a
nd in
com
e ta
x ex
pens
e
Non
-cas
h ex
pens
es o
ther
than
dep
reci
atio
n an
d am
ortis
atio
n: -
shar
e ba
sed
paym
ents
Net
pro
fit fo
r th
e pe
riod
att
ribut
able
to s
hare
hold
ers
of O
rica
Lim
ited
Orica Annual Report 2013
For
per
sona
l use
onl
y

65
Not
es t
o th
e Fi
nanc
ial S
tate
men
ts
For
the
year
end
ed 3
0 Se
ptem
ber
O
rica
Lim
ited
65
2.S
egm
ent r
epor
t (co
ntin
ued)
Rep
orta
ble
segm
ents
2012
$m
Mining Services Australia/Pacific
Mining Services North America
Mining Services Latin America
Mining Services EMEA
Mining Services Other
Eliminations
Total Mining Services
Chemicals
Other
Eliminations
Consolidated
Rev
enue
Exte
rnal
sal
es1,
881.
61,
338.
091
1.9
938.
049
6.1
-
5,56
5.6
1,10
6.6
1.9
-
6,67
4.1
Inte
r-se
gmen
t sal
es12
4.2
171.
233
.813
.174
2.5
(1,0
20.6
)64
.292
.80.
3(1
57.3
) -
To
tal s
ales
reve
nue
2,00
5.8
1,50
9.2
945.
795
1.1
1,23
8.6
(1,0
20.6
)5,
629.
81,
199.
42.
2(1
57.3
)6,
674.
1O
ther
inco
me
(1)
10.5
5.2
2.7
30.3
8.0
-
56.7
4.2
6.6
-
67.5
Tota
l rev
enue
and
oth
er in
com
e2,
016.
31,
514.
494
8.4
981.
41,
246.
6(1
,020
.6)
5,68
6.5
1,20
3.6
8.8
(157
.3)
6,74
1.6
Res
ults
518.
414
4.2
83.8
135.
412
7.7
-
1,00
9.5
100.
4(8
7.3)
-
1,02
2.6
Fina
ncia
l inc
ome
32.9
Fina
ncia
l exp
ense
(161
.1)
Prof
it be
fore
inco
me
tax
expe
nse
894.
4In
com
e ta
x ex
pens
e(2
23.2
)Pr
ofit
afte
r in
com
e ta
x ex
pens
e67
1.2
Prof
it at
tribu
tabl
e to
non
-con
trolli
ng in
tere
sts
(21.
0)Pr
ofit
afte
r in
com
e ta
x ex
pens
e be
fore
indi
vidu
ally
mat
eria
l ite
ms
attr
ibut
able
to s
hare
hold
ers
of O
rica
Lim
ited
650.
2In
divi
dual
ly m
ater
ial i
tem
sG
ross
indi
vidu
ally
mat
eria
l ite
ms
- (3
07.2
)-
-
(60.
0 )-
(367
.2)
- -
- (3
67.2
)Ta
x on
indi
vidu
ally
mat
eria
l ite
ms
- 11
9.8
- -
-
- 11
9.8
- -
- 11
9.8
Indi
vidu
ally
mat
eria
l ite
ms
attri
buta
ble
to s
hare
hold
ers
of O
rica
Lim
ited
(187
.4)
- -
(6
0.0)
- (2
47.4
)-
- -
(247
.4)
402.
8
Segm
ent a
sset
s2,
497.
51,
023.
764
2.5
995.
01,
004.
6 -
6,
163.
382
6.6
633.
7 -
7,
623.
6Se
gmen
t lia
bilit
ies
364.
121
5.4
147.
522
8.2
202.
0 -
1,
157.
220
5.2
3,01
4.7
-
4,37
7.1
Net
Ass
ets
2,13
3.4
808.
349
5.0
766.
880
2.6
-
5,00
6.1
621.
4(2
,381
.0)
-
3,24
6.5
Inve
stm
ents
acc
ount
ed fo
r usi
ng th
e eq
uity
met
hod
40.6
127.
32.
98.
227
.1 -
20
6.1
0.3
-
-
206.
4Ac
quis
ition
s of
PPE
and
inta
ngib
les
289.
163
.768
.677
.412
7.6
-
626.
424
.923
.0 -
67
4.3
Impa
irmen
t of P
PE0.
2 -
-
-
-
-
0.
2 -
-
-
0.
2Im
pairm
ent o
f int
angi
bles
-
307.
2 -
-
60
.0 -
36
7.2
-
-
-
367.
2Im
pairm
ent o
f inv
ento
ries
0.9
0.5
1.0
0.4
-
-
2.8
1.4
-
-
4.2
Impa
irmen
t of t
rade
rece
ivabl
es -
0.
20.
11.
81.
1 -
3.
20.
7 -
-
3.
9Im
pairm
ent o
f inv
estm
ents
-
-
-
-
-
-
-
-
0.1
-
0.1
Dep
recia
tion
89.5
39.1
16.6
22.9
14.9
-
183.
028
.13.
6 -
21
4.7
Amor
tisat
ion
3.7
12.5
1.1
6.5
8.9
-
32.7
0.7
3.3
-
36.7
2.2
1.8
0.7
1.2
4.0
-
9.9
1.3
6.7
-
17.9
Shar
e of
ass
ocia
tes
net p
rofit
equ
ity a
ccou
nted
-
36.6
1.0
-
-
-
37.6
(0.2
) -
-
37
.4
(1
) In
clude
s fo
reig
n cu
rrenc
y ga
ins/
loss
es in
var
ious
repo
rtabl
e se
gmen
ts.
Prof
it/(lo
ss) b
efor
e in
divi
dual
ly m
ater
ial i
tem
s, n
et
finan
cing
cos
ts a
nd in
com
e ta
x ex
pens
e
Non
-cas
h ex
pens
es o
ther
than
dep
reci
atio
n an
d am
ortis
atio
n: -
shar
e ba
sed
paym
ents
Net
pro
fit fo
r th
e pe
riod
att
ribut
able
to s
hare
hold
ers
of O
rica
Lim
ited
For
per
sona
l use
onl
y

66
Notes to the Financial Statements For the year ended 30 September
Orica Limited
66
2. Segment report (continued)Geographical segmentsThe presentation of the geographical segments is based on the geographical location of customers. Segment assets are based onthe geographical location of the assets.
2013$m A
ustra
lia
Uni
ted
Sta
tes
of
Am
eric
a
Oth
er *
Con
solid
ated
Revenue from external customersExternal sales from continuing operat ions 2,398.1 840.6 3,659.4 6,898.1Location of non-current assetsNon-current assets ** 2,521.8 728.6 2,982.4 6,232.8
2012$m A
ustra
lia
Uni
ted
Sta
tes
of
Am
eric
a
Oth
er *
Con
solid
ated
Revenue from external customersExternal sales from continuing operat ions 2,329.1 833.3 3,511.7 6,674.1Location of non-current assetsNon-current assets ** 2,120.6 652.7 2,583.8 5,357.1
** Excluding: other financial assets, deferred tax assets and post-employment benefit assets.
* Other than Australia and United States of America, sales to other countries are individually less than 10% of the consolidated entity's total revenues.
Orica Annual Report 2013
For
per
sona
l use
onl
y

67
Notes to the Financial Statements For the year ended 30 September
Orica Limited
67
2013 2012$m $m
3. Sales revenue and other income
Sales revenue 6,898.1 6,674.1
Other incomeRoyalty income - 0.3Other income 20.9 15.0Net foreign currency gains 12.1 15.7Profit from sale of businesses/controlled entities/investments - 3.7Profit on sale of property, plant and equipment 10.0 32.8Total other income 43.0 67.5 `
Consolidated
4. Specific profit and loss income and expenses
a) Financial income:Interest income received/receivable from: external parties 34.2 32.9Total financial income 34.2 32.9
b) Financial expenses:Borrow ing costs paid/payable to: external parties 188.3 192.7 capitalised interest (11.9) (38.1) unw inding of discount on provisions 7.7 5.9 finance charges – finance leases 0.3 0.6Total financial expenses 184.4 161.1
Net financing costs 150.2 128.2
c) Profit before income tax expense is arrived at after charging/(crediting):Depreciation on property, plant and equipment: buildings and improvements 25.2 22.1 machinery, plant and equipment 222.7 192.6Total depreciation on property, plant and equipment 247.9 214.7Amortisation of intangibles 36.5 36.7Amounts provided for: trade receivables impairment 11.5 3.9 doubtful debts – other receivables - 0.1 employee entitlements 53.4 55.6 environmental liabilities 22.5 36.2 inventory impairment 12.8 4.2 investment impairment 0.3 0.1 restructuring and rationalisation provisions 2.0 1.0 decommissioning 1.6 - other provisions 7.3 11.5Bad debts w ritten off to impairment allow ance 5.0 2.0Bad debts w ritten off in respect of other receivables 0.1 0.5Lease payments – operating leases 66.9 67.0Loss on disposal of businesses/controlled entities 0.4 - Research and development 47.1 46.8
For
per
sona
l use
onl
y

68
Notes to the Financial Statements For the year ended 30 September
Orica Limited
68
Consolidated
2013 2012$m $m
5. Income tax expensea) Income tax expense recognised in the income statementCurrent tax expense
Current year 209.7 129.0Deferred tax 4.0 (21.2)(Over)/under provided in prior years (0.3) (4.4)
Total income tax expense in income statement 213.4 103.4
b) Reconciliation of income tax expense to prima facie tax payableIncome tax expense attributable to profit before individuallymaterial itemsPrima facie income tax expense calculated at 30%on profit before individually material items 250.4 268.3Tax effect of items w hich (decrease)/increase tax expense:
variation in tax rates of foreign controlled entities (16.1) (10.7)tax (over)/under provided in prior years (0.3) (4.4)non allow able share based payments 4.8 5.4non allow able goodw ill w ritten off 1.7 - non taxable profit on sale of property, plant and equipment - (5.3)other foreign deductions (34.4) (33.8)sundry items 7.3 3.7
Income tax expense attributable to profit before individuallymaterial items 213.4 223.2
Income tax benefit attributable to individually material itemsPrima facie income tax (benefit)/expense calculated at 30%on loss from individually material items - (110.2)Tax effect of items w hich (decrease)/increase tax expense:
variation in tax rates of foreign controlled entities - (27.6)non allow able impairment of intangibles - former Minova segment - 18.0
Income tax benefit attributable toloss from individually material items - (119.8)
Income tax expense reported in the income statement 213.4 103.4
2012Gross Tax Net Gross Tax Net
$m $m $m $m $m $m
4. Specific profit and loss income and expenses (continued)d) Profit after income tax includes the followingindividually material items of (expense)/income:
Impairment of intangiblesWrite dow n of goodw ill in Mining Services - North America and Other Segments (1) - - - (367.2) 119.8 (247.4)Individually material items - - - (367.2) 119.8 (247.4) Non-controlling interests in individually material items - - - - - - Individually material items attributable to shareholders of Orica - - - (367.2) 119.8 (247.4)
(1) In financial year 2012, the carrying value of intangibles in the former Minova segment w ere w ritten dow n by $367.2m to their recoverable amount.
2013
Orica Annual Report 2013
For
per
sona
l use
onl
y

69
Notes to the Financial Statements For the year ended 30 September
Orica Limited
69
5. Income tax expense (continued)c) Income tax recognised in comprehensive income: Consolidated
2013 2012$m $m $m $m $m $m
Before tax
Tax (expense)
benefitNet of tax
Before tax
Tax (expense)
benefitNet of tax
Net gain/(loss) on hedge of net investments in foreign subsidiaries 178.9 23.5 202.4 (99.8) (18.4) (118.2)Cash flow hedges - Effective portion of changes in fair value 15.0 (4.5) 10.5 3.5 (1.1) 2.4- Transferred to Income Statement (4.1) 1.2 (2.9) (9.4) 2.8 (6.6)Exchange gains/(losses) on translation of foreign operations 157.6 - 157.6 (103.6) - (103.6)Actuarial benefits/(losses) on defined benefit plans 24.9 (7.7) 17.2 (58.0) 16.5 (41.5)
372.3 12.5 384.8 (267.3) (0.2) (267.5)
d) Recognised deferred tax assets and liabilities Balance Sheet Income Statement
2013 2012 2013 2012Consolidated Notes $m $m $m $mDeferred tax assets
Trade and other receivables 3.9 2.1 (1.8) (0.1)Inventories 14.7 12.4 (2.3) 1.4Property, plant and equipment 26.7 14.8 (11.9) (4.1)Intangible assets 51.7 62.5 10.8 (49.6)Trade and other payables 42.4 34.6 (7.8) 11.8Interest bearing liabilities 57.2 39.8 16.3 32.8Provision for employee entitlements 34.4 30.0 (4.4) (3.4)Provision for retirement benefit obligations 44.6 56.1 3.8 7.9Provisions for restructuring and rationalisation 0.8 1.1 0.3 0.6Provisions for environmental 49.5 53.1 3.6 11.0Provisions for decommissioning 3.1 3.2 0.1 - Tax losses 109.5 78.6 (54.2) 12.0Other items 1.7 4.1 2.4 1.2Deferred tax assets 440.2 392.4
Less set-off against deferred tax liabilities (221.7) (168.6)Net deferred tax assets (15) 218.5 223.8
Deferred tax liabilitiesInventories 6.9 5.2 1.7 0.3Property, plant and equipment 189.1 148.0 41.1 19.2Intangible assets 27.7 29.8 (2.1) (58.7)Interest bearing liabilities 24.5 20.4 4.1 (0.4)Undistributed profits of foreign subsidiaries 14.0 11.1 2.9 0.6Other items 11.9 10.5 1.4 (3.7)Deferred tax liabilities 274.1 225.0
Less set-off against deferred tax assets (221.7) (168.6)Net deferred tax liabilities (20) 52.4 56.4Deferred tax expense/(benefit) 4.0 (21.2)
For
per
sona
l use
onl
y

70
Notes to the Financial Statements For the year ended 30 September
Orica Limited
70
5. Income tax expense (continued)e) Unrecognised deferred tax assets and liabilities
Consolidated2013 2012
$m $mTax losses not booked 6.5 5.5 Capital losses not booked 35.4 33.9 Temporary differences not booked 0.9 0.9
Geographical analysis of tax losses not booked at 30 September 2013: Tax Capitallosses losses Expiry date
$m $mAustralia 0.6 34.7 IndefiniteOther 5.9 0.7 Betw een 2014 and 2031
6.5 35.4
f) Unrecognised temporary differencesConsolidated
2013 2012$m $m
Temporary differences relating to investments in subsidiaries forw hich deferred tax liabilities have not been recognised 898.5 703.9
Unrecognised deferred tax liabilities relating to the above temporary differences 83.0 68.2
g) Taxes paid in 2013 Income taxes:Orica operates in a number of countries around the w orld and is subject to local tax rules in each of those countries.
The tax expense for the year w as $213.4 million on a profit before income tax of $834.6 million giving an effective tax rate ofof 25.6%.
This varies from the standard Australian tax rate of 30% due primarily to different tax rates in countries that Orica operates in as w ellas non taxable income and non allow able deductions in various countries.
The amount of income tax paid is show n below and differs from the tax expense due to the timing of tax payments to tax authorities and differences betw een the timing of deductions for accounting and tax purposes.
Other taxes:In various jurisdictions around the w orld, Orica pays taxes based on the amount of w age and salary payments to its employees. The amounts paid are show n below .
In addition, in various jurisdictions, Orica is required to charge its customers goods and services tax, value added tax and similar taxes and obtains a deduction for similar taxes paid to its suppliers. The net amount paid in relation to the taxes is show n below .
Taxes paid by the Group during during the year were as follows:2013
$mIncome taxes:Income taxes paid including w ithholding taxes 141.8
Other taxes:Taxes on w ages and salaries paid by the employer 52.3 Net Goods and Services Tax/Value Added Taxes paid 186.3 Total taxes paid 380.4
Orica Annual Report 2013
For
per
sona
l use
onl
y

71
Notes to the Financial Statements For the year ended 30 September
Orica Limited
71
2013 2012$m $m
6. Earnings per share (EPS) (i) As reported in the income statement
Reconciliation of earnings used in the calculation of EPS attributable to ordinary shareholders of Orica LimitedNet profit for the period 621.2 423.8Net profit for the period attributable to non-controlling interests (19.6) (21.0)Distribution on Orica Step-Up Preference Securities (net of tax benefit)* - (8.9)Earnings used in calculation of basic EPS attributable to ordinary shareholders of Orica Limited 601.6 393.9* On 13 October 2011 Orica decided to repurchase the SPS and the SPS w ere reclassif ied to interest bearing liabilities from that date.Until 12 October 2011 the SPS w ere treated as equity for accounting purposes.
Number NumberWeighted average number of shares used as the denominator:
Number for basic earnings per share 363,687,959 360,571,799Effect of executive share options and rights 577,759 523,432Number for diluted earnings per share 364,265,718 361,095,231
The follow ing Orica Long Term Equity Incentive Plans (LTEIP) and Long Term Incentive Rights Plans (LTIRP) have not been includedin the calculation for diluted earnings per share as they are not dilutive:
Issue date: Exercisable betw een: - 26 Jun 2009 - 18 Nov 11 to 23 Jan 12 - 5,670 - 15 Dec 2009 - 19 Nov 12 to 23 Jan 13 416,002 1,553,482 - 17 Dec 2010 - 19 Nov 13 to 23 Jan 14 1,536,003 1,718,641 - 19 Dec 2011 - 18 Nov 14 to 23 Jan 15 495,724 464,427 - 24 Feb 2012 - 18 Nov 14 to 23 Jan 15 305,302 183,181 - 7 Feb 2013 - 18 Nov 15 to 23 Jan 16 453,489 - - 11 Mar 2013 - 18 Nov 15 to 23 Jan 16 18,214 -
Consolidated
2013 2012Cents Cents
per share per share
Total attributable to ordinary shareholders of Orica LimitedBasic earnings per share 165.4 109.2 Diluted earnings per share 165.2 109.1
(ii) Adjusted for individually material items$m $m
Reconciliation of earnings used in the calculation of EPS adjusted for individually material itemsattributable to ordinary shareholders of Orica LimitedNet profit for the period 621.2 423.8Net profit for the period attributable to non-controlling interests (19.6) (21.0)Distribution on Orica Step-Up Preference Securities (net of tax benefit) - (8.9)Adjusted for individually material items - 247.4Earnings used in calculation of diluted EPS attributable to ordinary shareholders of Orica Limited 601.6 641.3
Cents Centsper share per share
Total attributable to ordinary shareholders of Orica Limited before individually material itemsBasic earnings per share 165.4 177.9 Diluted earnings per share 165.2 177.6
Consolidated
For
per
sona
l use
onl
y

72
Notes to the Financial Statements For the year ended 30 September
Orica Limited
72
Consolidated2013 2012
$m $m
7. Cash and cash equivalentsCash at bank and on hand 202.9 206.3Deposits at call external 22.4 29.5
225.3 235.8
(i) Fair valuesThe directors consider the net carrying amount of cash and cash equivalents to approximate their fair value due to their short termto maturity.
Consolidated2013 2012
$m $m
8. Trade and other receivablesCurrentTrade receivables (i) external 933.2 892.7 associated companies 12.3 4.1Less allow ance for impairment (i) (ii) external (19.2) (12.7)
926.3 884.1Other receivables (iii) external 124.4 151.7Less allow ance for impairment (iii) (iv) external (0.1) (0.5)
124.3 151.21,050.6 1,035.3
Non-currentOther receivables (vii) external (1) (2) 97.3 49.6 retirement benefit surplus (see note 38) - 0.4
97.3 50.0
(1) Includes $18.6 million (2012 $18.6 million) that was paid to the Australian Tax Office (ATO) during the year ended 30 September 2012 in relation to a tax audit. The ATO is currently conducting a tax audit in relation to a financing arrangement by Orica of its US group between 2004 and 2006. The ATO has issued amended assessments in relation to the 2004, 2005 and 2006 years totalling $50.6 million (including interest and penalties). Orica has objected to all three assessments. In accordance with the ATO administrative practice, Orica has paid 50% of the primary tax and interest arising from the assessments, which has been recognised as a non-current receivable (see also note 33 c iv).
(2) Financial year 2013 includes $6.8 million paid to the Central Tax Office of Norway (CTO) during the year ended 30 September 2013 and a deferred tax asset in relation to prior years' tax losses of $23.3m that has been utilised to offset the tax liability in respect of a tax audit relating to the transfer of the Dyno Nobel house brand in conjuction with Orica's acquistion of the Dyno Nobel's explosives business in the the 2005 income year. Orica has objected against the reassessment. While the tax audit is in progress, Orica is required to settle the remaining liability of approximately $16.4 million as they fall due between 2014 and 2054. The tax paid and the deferred tax asset offset totalling $30.1 million has been recognised as a non-current receivable (see also note 33 c iii).
Orica Annual Report 2013
For
per
sona
l use
onl
y

73
Notes to the Financial Statements For the year ended 30 September
Orica Limited
73
8. Trade and other receivables (continued)(i) Trade receivables and allowance for impairmentThe ageing of trade receivables and allow ance for impairment is detailed below :
Consolidated Consolidated2013 2013 2012 2012
Gross Allowance Gross Allow ance$m $m $m $m
Not past due 765.6 - 753.5 - Past due 0 - 30 days 69.9 (0.7) 67.9 (0.1)Past due 31 - 60 days 29.7 (0.4) 27.7 (0.1)Past due 61 - 90 days 15.5 (0.4) 11.2 (0.1)Past due 91 - 120 days 8.0 (0.2) 5.2 (0.1)Past 120 days 56.8 (17.5) 31.3 (12.3)
945.5 (19.2) 896.8 (12.7)
Trade receivables are carried at amounts due. Receivables that are not past due and not impaired are considered recoverable.Payment terms are generally 30 days from end of month of invoice date. A risk assessment process is used for all accounts, w itha stop credit process in place for most long overdue accounts. Credit insurance cover is obtained w here appropriate.
The collectability of trade receivables is assessed continuously and at balance date specific allow ances are made for any doubtful trade receivables based on a review of all outstanding amounts at year end. Bad debts are w ritten off during the yearin w hich they are identified.
The follow ing basis has been used to assess the allow ance for doubtful trade receivables:- a statistical approach to determine the historical allow ance rate for various tranches of receivables;- an individual account by account assessment based on past credit history; and- prior know ledge of debtor insolvency or other credit risk.
No material security is held over trade receivables.Trade receivables have been aged according to their due date in the above ageing analysis.There are no individually significant receivables that have had renegotiated terms that w ould otherw ise, w ithout that renegotiation,have been past due or impaired.
(ii) Movement in allowance for impairment of trade receivablesThe movement in the allow ance for impairment in respect of trade receivables is detailed below :
Consolidated2013 2012
$m $m
Opening balance (12.7) (12.9)Allow ances made during the year (11.5) (3.9)Additions through acquisition of entities - (0.8)Reductions through disposal of entities 0.1 - Allow ances utilised during the year 5.0 2.0Allow ances w ritten back during the year 1.0 1.7Foreign currency exchange differences (1.1) 1.2Closing balance (19.2) (12.7)
For
per
sona
l use
onl
y

74
Notes to the Financial Statements For the year ended 30 September
Orica Limited
74
8. Trade and other receivables (continued)(iii) Current other receivables and allowance for impairment
Consolidated Consolidated2013 2013 2012 2012
Gross Allowance Gross Allow ance$m $m $m $m
Not past due 120.3 - 140.1 - Past due 0 - 30 days 0.1 - 2.9 - Past due 31 - 60 days - - 2.6 - Past 120 days 4.0 (0.1) 6.1 (0.5)
124.4 (0.1) 151.7 (0.5)Other receivables generally arise from transactions outside the usual operating activities of the consolidated entity. Interest may be charged w here the terms of repayment exceed agreed terms.Other receivables are carried at amounts due. Payment terms vary. A risk assessment process is used for all accounts, w ith a stopcredit and follow up process in place for most long overdue accounts.Other receivables have been aged according to their due date in the above ageing analysis.
The collectability of other receivables is assessed at balance date and specific allow ances are made for any doubtful receivables based on a review of all outstanding amounts at year end. Bad debts are w ritten off during the year in w hich they are identified.There are no individually significant receivables that have had renegotiated terms that w ould otherw ise, w ithout that renegotiation,have been past due or impaired.
(iv) Movement in allowance for impairment of current other receivablesThe movement in the allow ance for impairment in respect of current other receivables is detailed below :
Consolidated2013 2012
$m $m
Opening balance (0.5) (1.2)Allow ances made during the year - (0.1)Allow ances utilised during the year 0.1 0.5Allow ances w ritten back during the year 0.3 0.2Foreign currency exchange differences - 0.1Closing balance (0.1) (0.5)
(v) Fair valuesThe net carrying amount of trade and other receivables approximates their fair values. For receivables w ith a remaining life of less than one year, carrying value reflects fair value. All other significant receivables are discounted to determine carrying value and fair value.The maximum exposure to credit risk is the carrying value of receivables. No material collateral is held as security over any of thereceivables.
Orica Annual Report 2013
For
per
sona
l use
onl
y

75
Notes to the Financial Statements For the year ended 30 September
Orica Limited
75
10. Other assetsCurrentPrepayments and other assets 69.5 61.3
69.5 61.3Non-currentPrepayments and other assets 26.7 19.9
26.7 19.9
Consolidated2013 2012
$m $m
9. InventoriesRaw materials and stores 342.2 278.6Work in progress 28.1 24.9Finished goods 422.8 390.1
793.1 693.6* Inventories have been show n net of provision for impairment of $19.7 million (2012 $12.4 million).
8. Trade and other receivables (continued)
(vi) Concentrations of credit riskThe consolidated entity is exposed to the follow ing concentrations of credit risk in regards to its current trade and other receivables:
Consolidated2013 2012
% %Mining Services:- Australia/Pacific 16.8 19.1- North America 12.4 12.2- Latin America 14.0 13.4- EMEA 21.1 21.9- Mining Other 16.7 14.8Chemicals 16.8 15.8Other 2.2 2.8
100.0 100.0
2013 2012 % %
Australia 24.9 28.1New Zealand 2.8 2.6Asia 18.9 16.5North America 10.1 9.4Latin America 21.9 22.0Europe 17.0 17.0Other 4.4 4.4
100.0 100.0
(vii) Non current receivables All non current receivables are carried at amounts that approximate their fair value. As at 30 September none are past due. None areconsidered impaired.
For
per
sona
l use
onl
y

76
Notes to the Financial Statements For the year ended 30 September
Orica Limited
76
2013 2012 2013 2012% % $m $m
11. Investments accounted for using the equity methodBalance
Name Principal activity dateBeijing Sino-Australia Orica Watercare Technology and Equipment Co. Ltd (1) Sale of w ater treatment equipment and resin 30 Sep 45.0 45.0 0.2 0.3Botany Industrial Park Pty Limited Facility management service 30 Sep 33.4 33.4 - - Exor Explosives Limited (6) Manufacture and sale of explosives 31 Dec 50.0 50.0 0.3 0.6FiReP Holding AG (11) Manufacture and sale of strata support and
ventilation products 31 Dec 25.0 25.0 2.7 2.4
Geneva Nitrogen LLC (7) Manufacture and sale of explosives 30 Sep 50.0 50.0 9.0 7.3Geodynamics B.V. (8) (d) Manufacture and sale of explosives 31 Dec - - - - Irish Mining Emulsion Systems Ltd (9) Manufacture and sale of explosives 30 Sep 50.0 50.0 0.4 0.2Kitikmeot Blasting Services Inc. (2) Explosives service provider 31 Oct 49.0 49.0 0.5 0.4MicroCoal Inc. (7) (e) Development and commercialisation of coal
dew atering process 31 Dec - 41.8 - -
Mineral Carbonation International PtyLimited (b) Develop carbon capture technology 30 Sep 39.9 - 0.1 - MSW-Chemie GmbH (10) Manufacture and sale of explosives 31 Dec 31.5 31.5 0.5 0.5Nelson Brothers, LLC (7) Manufacture and sale of explosives 31 Dec 50.0 50.0 29.2 25.3Nelson Brothers Mining Services LLC (7) Supply of explosives 31 Dec 50.0 50.0 24.0 20.6Orica Graneles S.A. (3) (b) Import and distribution of amino acids for
animal feed 31 Dec 50.0 - 0.8 -
Orica-UMMC LLC (5) Manufacture and sale of explosives 31 Dec 50.0 50.0 4.1 3.7Pigment Manufacturers of Australia Non-operating company 31 Dec 50.0 50.0 - - LimitedPIIK Limited Partnership (2) Sale of explosives 30 Sep 49.0 49.0 - - Sahtu Explosives Limited (2) Explosives service provider 31 Oct 49.0 49.0 - - Southw est Energy LLC (7) Sale of explosives 30 Sep 50.0 50.0 90.1 73.6Sprew a Sprengmittel GmbH (10) Sale of explosives 31 Dec 24.0 24.0 0.8 0.7SVG&FNS Philippines Holdings Inc (12) Investment company 31 Dec 40.0 40.0 - - Thai Nitrate Company Ltd (13) (f) Manufacture and sale of explosives 31 Dec 50.0 50.0 29.6 27.1Tlicho Blasting Services Inc. (2) Explosives service provider 31 Oct 49.0 49.0 0.1 0.1Troisdorf GmbH (10) Holder of operating permits 30 Sep 50.0 50.0 - - Ulaex SA (14) Manufacture and sale of explosives 31 Dec 50.0 50.0 3.4 2.9Wurgendorf GmbH (10) Holder of operating permits 31-Dec 50.0 50.0 0.1 0.1Yara Pilbara Nitrates Pty Ltd (a) (c) Manufacture and sale of explosives 31 Dec 45.0 45.0 239.6 40.6
435.5 206.4
Entities are incorporated in Australia except: (1) China, (2) Canada, (3) Chile (4) Mexico, (5) Russia, (6) UK, (7) USA, (8) Holland, (9) Ireland, (10) Germany, (11) Sw itzerland, (12) Philippines, (13) Thailand, (14) Cuba.
(e) Disposed of in 2013.
Ownership Carrying amount
(f) Orica holds its 50% equity interest in Thai Nitrate Company Ltd (TNC) through tw o subsidiary companies, Orica Norw ay AS (39%) and Ammonium Nitrate Development and Production Limited (11%). The remaining 50% equity interest in TNC is held by TPI Polene PLC (TPIP), an entity listed on the Thailand Stock Exchange, and four individuals associated w ith TPIP. The South Bangkok Civil Court issued a judgement on 5 October 2011 that Orica Norw ay AS transfer its 39% shareholding in TNC to TPIP for a consideration equal to the relevant portion of TNC's net asset value at June 2006, less dividends paid since that date.
(a) Acquired in 2012.(b) Acquired in 2013.
In July 2013, the Thai Court of Appeals overturned the earlier decision of the South Bangkok Civil Court and upheld Orica Norw ay AS's right to retain its 39% shareholding in TNC. The matter has been further appealed to the Supreme Court of Thailand, but no decision has yet been handed dow n.
Consolidated
(c) Previously Burrup Nitrates Pty Ltd.(d) Disposed of in 2012.
Orica Annual Report 2013
For
per
sona
l use
onl
y
77
Notes to the Financial Statements For the year ended 30 September
Orica Limited
77
12. Other financial assetsCurrent - other financial assets - derivative assets (i) cross currency interest rate sw aps - net investment 0.3 4.9 forw ard foreign exchange contracts/options 11.1 7.0 interest rate sw aps - 0.1
11.4 12.0 Non-current - other financial assets - derivative assets (i) cross currency interest rate sw aps - debt principal 0.5 - cross currency interest rate sw aps - net investment - 0.5 interest rate sw aps 0.9 3.2
1.4 3.7
Non-current - other financial assetsInterest in unlisted entities 0.7 0.6
0.7 0.6
(i) Derivative assetsRefer to note 34 for details on the financial risk management and use of derivative financial instruments.
11. Investments accounted for using the equity method (continued)Consolidated2013 2012
$m $mResults of associatesShare of associates’ profit from ordinary activities before income tax 33.4 37.4Share of associates’ income tax expense relating to profit from ordinary activities - - Share of associates’ net profit equity accounted 33.4 37.4
Share of post-acquisition accumulated profits/(losses) and reserves attributable to associatesShare of associates’ accumulated losses at the beginning of the year (0.7) (6.9)Share of associates’ net profit equity accounted 33.4 37.4Less dividends from associates (25.2) (31.2)Share of associates’ accumulated profits/(losses) at the end of the year 7.5 (0.7)Movements in carrying amounts of investmentsCarrying amount of investments in associates at the beginning of the year 206.4 172.1Investments in associates acquired during the year 201.1 40.9Investments in associates disposed of/consolidated as a subsidiary during the year - (6.0)Adjustment to deferred consideration - 5.0Impairment of investments (0.3) (0.1)Share of associates’ net profit equity accounted 33.4 37.4Less dividends from associates (25.2) (31.2)Effects of exchange rate changes 20.1 (11.7)Carrying amount of investments in associates at the end of the year 435.5 206.4
Summary of profit and loss and balance sheets of associates on a 100% basisThe aggregate revenue, net profit after tax, assets and liabilities of associates are:Revenue 714.6 709.6 Net profit after tax 69.8 78.7 Assets 669.6 397.0 Liabilities 153.9 113.2
For
per
sona
l use
onl
y
78
Notes to the Financial Statements For the year ended 30 September
Orica Limited
78
2013 2012$m $m
13. Property, plant and equipmentLand, buildings and improvements at cost 738.6 621.8 accumulated depreciation (210.3) (163.5) Total carrying value 528.3 458.3
Machinery, plant and equipment Gross book value at cost 4,747.0 4,155.4 under finance lease 35.7 34.5
4,782.7 4,189.9 Accumulated depreciation at cost (1,842.6) (1,603.2) under finance lease (13.0) (10.6)
(1,855.6) (1,613.8) Net carrying value at cost 2,904.4 2,552.2 under finance lease 22.7 23.9 Total carrying value 2,927.1 2,576.1
Total net carrying value of property, plant and equipment 3,455.4 3,034.4
(i) Capitalised borrowing costsInterest amounting to $9.4 million (2012 $35.3 million) w as capitalised to property, plant and equipment, calculated at the average rate of 5.7% (2012 5.7%).(ii) Significant assets under construction (1)
Included in Property, Plant and Equipment is an amount of $305.8 million (2012 $182.6 million) of assets under construction relating to:
2013 2012$m $m
Kooragang Island plant uprate 189.1 109.0Nanling detonator plant 116.7 73.6
305.8 182.6
Consolidated
Consolidated
(1) Note that the assets under construction balances are translated at year end foreign exchange rates and includes capitalised interest on the projects.
Orica Annual Report 2013
For
per
sona
l use
onl
y

79
Notes to the Financial Statements For the year ended 30 September
Orica Limited
79
13. Property, plant and equipment (continued)(iii) ReconciliationsReconciliations of the carrying values of property, plant and equipment at the beginning and end of the years are set out below :
Land, M achinery,buildings and plant and
improvements equipment TotalConsolidated $m $m $m2012Carrying amount at the beginning of the year 01-Oct-2011 398.2 2,311.5 2,709.7 Additions 103.2 525.8 629.0 Disposals (15.3) (13.2) (28.5) Additions through acquisition of entities (see note 27) - 4.7 4.7 Disposals through disposal of entities (see note 28) - (1.1) (1.1) Depreciation expense (22.1) (192.6) (214.7) Impairment of property, plant and equipment - (0.2) (0.2) Foreign currency exchange differences (5.7) (58.8) (64.5) Carrying amount at the end of the year 30-Sep-2012 458.3 2,576.1 3,034.4 2013Additions 90.3 455.2 545.5 Disposals (9.2) (6.5) (15.7) Depreciation expense (25.2) (222.7) (247.9) Foreign currency exchange differences 14.1 125.0 139.1 Carrying amount at the end of the year 30-Sep-2013 528.3 2,927.1 3,455.4
For
per
sona
l use
onl
y
80
Notes to the Financial Statements For the year ended 30 September
Orica Limited
80
2013 2012$m $m
14. Intangible assetsGoodw ill 2,354.9 2,158.6 Less accumulated impairment losses (451.6) (401.4) Total net book value of goodw ill 1,903.3 1,757.2
Patents, trademarks and rights 134.2 124.0 Less accumulated amortisation (60.5) (57.5) Total net book value of patents, trademarks and rights 73.7 66.5
Brand names 20.0 18.1 Less accumulated amortisation (15.2) (11.7) Total net book value of brand names 4.8 6.4
Softw are 172.9 132.8 Less accumulated amortisation (57.7) (45.6) Total net book value of softw are 115.2 87.2
Customer contracts and relationships 269.4 243.5 Less accumulated amortisation (148.5) (114.0) Total net book value of customer contracts and relationships 120.9 129.5
Total net book value of intangibles 2,217.9 2,046.8
Consolidated
Reconciliations of the carrying values of intangible assets at the beginning and end of the years are set out below :
Patentstrademarks
and CustomerGoodwill rights Brand names Software contracts Total
Consolidated $m $m $m $m $m $m 2012Carrying amount at the beginning of the year 2,214.9 74.3 8.7 49.1 158.4 2,505.4 Additions - 0.6 - 44.7 - 45.3 Additions through acquisition of entities (see note 27) 4.5 2.4 - - - 6.9 Fair value adjustment on prior year acquisitions (see note 27) 2.0 - - - - 2.0 Disposals through disposalof entities (see note 28) (0.2) - - - - (0.2) Amortisation expense - (8.7) (2.1) (5.9) (20.0) (36.7) Impairment expense (see note 29) (367.2) - - - - (367.2) Foreign currency exchange differences (96.8) (2.1) (0.2) (0.7) (8.9) (108.7) Carrying amount at the end of the year 1,757.2 66.5 6.4 87.2 129.5 2,046.82013Additions - - - 32.9 - 32.9 Disposals through disposalof entities (see note 28) (0.2) - - - - (0.2) Amortisation expense - (4.7) (2.2) (7.4) (22.2) (36.5) Impairment expense (see note 29) (5.7) - - - - (5.7)Foreign currency exchange differences 152.0 11.9 0.6 2.5 13.6 180.6Carrying amount at the end of the year 1,903.3 73.7 4.8 115.2 120.9 2,217.9
Capitalised borrowing costsInterest amounting to $2.5 million (2012 $2.8 million) w as capitalised to intangibles assets, calculated at the average rate of 5.7% (2012 7.0%).
Orica Annual Report 2013
For
per
sona
l use
onl
y

81
Notes to the Financial Statements For the year ended 30 September
Orica Limited
81
16. Trade and other payablesCurrent Trade payables external 1,019.1 854.3 associated companies 1.5 1.5 Other payables external 215.2 203.1
1,235.8 1,058.9
Current - other financial liabilities - derivative liabilitiesDerivative financial instruments cross currency interest rate sw aps - debt principal - 4.9 cross currency interest rate sw aps - net investment 6.0 0.1 forw ard foreign exchange contracts 13.5 5.4
19.5 10.4
Non-current Other payables external 12.3 12.4
12.3 12.4
Non-current - other financial liabilities - derivative liabilitiesDerivative financial instruments cross currency interest rate sw aps - debt principal 32.7 45.4 cross currency interest rate sw aps - net investment 10.0 6.5 interest rate sw aps 13.0 21.8
55.7 73.7
Significant terms and conditions
Fair valuesThe carrying amount of trade and other payables approximate their fair values due to their short term nature.
Derivative financial instrumentsRefer to note 34 for details on the financial risk management of derivative financial instruments.
Trade and other payables, including expenditures not yet billed, are recognised w hen the consolidated entity becomes obliged to make future payments as a result of a purchase of goods or services. Trade payables are normally settled w ithin 60 days from invoice date or w ithin the agreed payment terms w ith the supplier. Trade and other payables are non-interest bearing and include liabilities in respect of trade financing w ithin the normal operating cycle of the business.
2013 2012$m $m
15. Deferred tax assetsNet deferred tax assets (see note 5) 218.5 223.8
Consolidated
For
per
sona
l use
onl
y

82
Notes to the Financial Statements For the year ended 30 September
Orica Limited
82
2013 2012$m $m
17. Interest bearing liabilitiesCurrent Unsecured bank overdrafts 19.2 7.9 commercial paper 377.2 292.3 other short term borrow ings 33.4 6.2 other loans private placement (1) - 38.4 export f inance facility (2) 12.7 - Lease liabilities (see note 30) 1.4 1.2
443.9 346.0 Non-current Unsecured bank loans 159.1 743.1 other loans private placement (1) 1,870.0 1,347.2 export f inance facility (2) 75.9 89.9 other 2.6 2.7 Lease liabilities (see note 30) 5.1 6.1
2,112.7 2,189.0
(1) Private placement
(2) Export finance facility
Fair valuesThe carrying amounts of the consolidated entity's current and non-current interest bearing liabilities approximatetheir fair values. The fair values have been calculated by discounting the expected future cash flow s at prevailing market interestrates as at 30 September 2013 varying from 0.1% to 5.0% (2012 0.1% to 4.3%) depending on the type of borrow ing.
Assets pledged as securityThe carrying amounts of assets pledged as security for current and non-current interest bearing liabilities are:
2013 2012$m $m
Finance leasesProperty, plant and equipment 22.7 23.9
22.7 23.9 In the event of default by Orica, the rights to the leased assets transfer to the lessor.
Defaults and breachesDuring the current and prior year, there w ere no defaults or breaches of covenants on any loans.
Consolidated
Consolidated
Loans provided to Orica Limited in f inancial year 2010 by Australia’s export credit agency (Export Finance and Insurance Corporation), and by banks, guaranteed by Germany's export credit agency (Euler Hermes Kreditversicherungs-AG (Hermes)).
Orica Limited guaranteed senior notes issued in the US private placement market in 2003, 2005, 2010 and 2013. The notes have maturities betw een 2015 and 2030 (2012: betw een 2012 and 2030).
Orica Annual Report 2013
For
per
sona
l use
onl
y

83
Notes to the Financial Statements For the year ended 30 September
Orica Limited
83
2013 2012 $m $m
18. Current tax liabilitiesProvision for income tax 80.0 2.4
Consolidated
19. ProvisionsCurrentEmployee entitlements 80.6 75.3Restructuring and rationalisation 4.7 3.7Environmental 69.5 61.3Decommissioning 2.0 2.1Other 16.5 20.2
173.3 162.6Non-currentEmployee entitlements 53.8 46.4Retirement benefit obligations (see note 38) 214.1 240.9Environmental 118.5 141.4Decommissioning 10.2 8.7Contingent liabilities on acquisition of controlled entities 15.9 17.4Other 11.1 10.5
423.6 465.3Aggregate employee entitlementsCurrent 80.6 75.3Non-current 267.9 287.3
348.5 362.6
ReconciliationsReconciliations of the consolidated carrying amounts of provisions at the beginning and end of thecurrent financial year are set out below :
Current provision - restructuring and rationalisation $mCarrying amount at the beginning of the year 3.7 Provisions made during the year 2.0 Provisions w ritten back during the year (0.2) Payments made during the year (1.0) Foreign currency exchange differences 0.2 Carrying amount at the end of the year 4.7
Consolidated
For
per
sona
l use
onl
y

84
Notes to the Financial Statements For the year ended 30 September
Orica Limited
84
19. Provisions (continued)
Current provision - environmental $mCarrying amount at the beginning of the year 61.3 Provisions made during the year 21.1Provisions w ritten back during the year (5.3)Payments made during the year (36.1)Provision transferred from non-current 26.2Foreign currency exchange differences 2.3 Carrying amount at the end of the year 69.5
Current provision - decommissioningCarrying amount at the beginning of the year 2.1 Payments made during the year (0.2) Provision transferred from non-current 0.1 Carrying amount at the end of the year 2.0
Current provision - otherCarrying amount at the beginning of the year 20.2 Provisions made during the year 6.5 Provisions w ritten back during the year (9.9) Payments made during the year (0.8) Provision transferred from non-current 0.1 Foreign currency exchange differences 0.4 Carrying amount at the end of the year 16.5
Non-current provision - environmentalCarrying amount at the beginning of the year 141.4 Provisions made during the year 1.4Provisions w ritten back during the year (8.1)Payments made during the year (0.2)Unw inding of discount on provisions (see note 4) 7.7Provision transferred to current (26.2)Foreign currency exchange differences 2.5 Carrying amount at the end of the year 118.5
Consolidated
Orica Annual Report 2013
For
per
sona
l use
onl
y

85
Notes to the Financial Statements For the year ended 30 September
Orica Limited
85
2013 2012 $m $m
20. Deferred tax liabilitiesNet deferred tax liabilities (see note 5) 52.4 56.4
Consolidated
19. Provisions (continued)
Non-current provision - decommissioning $mCarrying amount at the beginning of the year 8.7 Provisions made during the year 1.6Provision transferred to current (0.1)Carrying amount at the end of the year 10.2
Non-current provision - contingent liabilities on acquisition of controlled entitiesCarrying amount at the beginning of the year 17.4 Payments made during the period (2.2)Foreign currency exchange differences 0.7 Carrying amount at the end of the year 15.9
Non-current provision - otherCarrying amount at the beginning of the year 10.5 Provisions made during the year 0.8 Payments made during the period (0.7) Provision transferred to current (0.1) Foreign currency exchange differences 0.6 Carrying amount at the end of the year 11.1
Environmental provisionEstimated costs for the remediation of soil, groundw ater and untreated w aste that have arisen as a result of past events havebeen provided w here a legal or constructive obligation exists and a reliable estimate of the liability is able to be assessed(refer to notes 32 and 33).
Consolidated2013 2012
$m $mTotal environmental provision comprises:Botany Groundw ater remediation 59.2 55.9Hexachlorobenzene (HCB) w aste remediation 35.7 39.8Botany Mercury remediation 18.2 15.7Dyno Nobel sites remediation 17.2 25.6Seneca remediation 8.6 11.2Yarraville remediation 18.0 19.5Villaw ood remediation 15.5 16.7Other environmental provisions 15.6 18.3Total environmental provisions 188.0 202.7
Decommissioning provisionA provision is recognised for the present value of the estimated costs of dismantling and removing an asset and restoring the site onw hich it is located w here a legal or constructive obligation exists and a reliable estimate of the liability is able to be assessed(refer to note 32).
Contingent liabilities on acquisition of controlled entitiesA provision is recognised on acquisition of a business for contingent liabilities of that business.
Other provisionThe Group self-insures for certain insurance risks. Outstanding claims are recognised w hen an incident occurs that may give rise to a claim and are measured at the cost that the entity expects to incur in settling the claims.
Consolidated
For
per
sona
l use
onl
y

86
Notes to the Financial Statements For the year ended 30 September
Orica Limited
86
2013 2012$m $m
21. Contributed equityIssued and fully paid:Ordinary shares - 368,203,632 (2012 365,642,802) 1,877.9 1,795.1Step-Up Preference Securities - nil (2012 nil) (1) - - Balance at end of year 1,877.9 1,795.1
Consolidated
Movements in issued and fully paid shares of Orica since 1 October 2011 w ere as follow s:Number Issue
Details Date of shares price $ $m Ordinary sharesOpening balance of ordinary shares issued 1-Oct-11 363,966,570 1,749.9Shares issued under the Orica dividend reinvestment plan (note 25) 9-Dec-11 1,040,467 24.40 25.4Shares issued under the Orica dividend reinvestment plan (note 25) 2-Jul-12 635,765 24.18 15.4Share movements under the Orica LTEIP plan (Remuneration Report) (3) - 3.0Shares issued under the Orica GEESP plan (note 36) (2) - 1.4Balance at end of the year 30-Sep-12 365,642,802 1,795.1
Shares issued under the Orica dividend reinvestment plan (note 25) 14-Dec-12 1,043,714 23.92 25.0 Shares issued under the Orica dividend reinvestment plan (note 25) 1-Jul-13 1,335,231 20.96 28.0 Share movements under the Orica LTEIP plan (Remuneration Report) (3) 181,885 28.4 Shares issued under the Orica GEESP plan (note 36) (2) - 1.4 Balance at end of the year 30-Sep-13 368,203,632 1,877.9
Step-Up Preference SecuritiesOpening balance - gross (1) 1-Oct-2011 5,000,000 100.00 500.0Opening balance - costs (1) (10.0)Reclassif ication to interest bearing liabilities 13-Oct-2011 (5,000,000) 100.00 (500.0)Transfer to retained earnings 13-Oct-2011 10.0Balance at end of the year 30-Sep-12 - -
(2) Shares issued under the Orica general employee exempt share plan.
(1) Shares issued and costs incurred in 2006 pursuant to the Step-Up Preference Securities issued in accordance w ith the prospectus dated 17 February 2006. Until 12 October 2011 the SPS w ere treated as equity for accounting purposes. SPS w ere repurchased for $100 per SPS on 29 November 2011.
Orica Annual Report 2013
For
per
sona
l use
onl
y

87
Notes to the Financial Statements For the year ended 30 September
Orica Limited
87
21. Contributed equity (continued)Number Issue
Details Date of shares price * $ $m (3) Share movements under the Orica LTEIP plans (Remuneration Report section H)2011/2012Shares bought back Various - (19.9) Shares issued - loan repayment Various - 22.9Movement for the year 30-Sep-12 - 3.0
2012/2013Shares issued 14-Feb-13 81,811 26.23 - Shares issued 2-Apr-13 100,074 23.81 - Shares bought back Various - (9.6) Shares issued - loan repayment Various - 38.0Movement for the year 30-Sep-13 181,885 28.4
Under the LTEIP, eligible executives are provided w ith a three year, interest free, non-recourse loan from Orica for the sole purpose of acquiring shares in Orica. Executives may not deal w ith the shares w hile the loan remains outstanding and any dividends paidon the shares are applied (on an after-tax basis) tow ards repaying the loan. The shares issued to the executives are either purchasedon market, issued as new shares by Orica or reissued unvested shares by Orica. Shares issued under this plan in conjunction w ithnon-recourse loans are accounted for as options. As a result, the amounts receivable from employees in relation to these loans arenot recognised in the f inancial statements. Shares issued under this plan are recognised as shares issued at nil value, w ith a sharebased payments expense recognised in the income statement based on the value of the options. Shares purchased on-market underthe plans are recognised as a share buy-back. Repayments of share loans are recognised as share capital. The LTEIP vests after three years.
* Issue price w as based on VWAP (volume-w eighted average price) at the time of issue.
The amounts recognised in the f inancial statements of Orica in relation to executive share optionsduring the f inancial year w ere:
2013 2012 $m $m
Bought back ordinary share capital (9.6) (19.9)
Consolidated
LTEIP options over unissued shares (refer to Remuneration Report Section H):
Balance Issued Exercised Lapsed Balance Issued Exercised Lapsed BalanceExercisable betw een 30 Sep 11 during during during 30 Sep 12 during during during 30 Sep 13
year year year year year year 18 Nov 15 - 23 Jan 16 - - - - - 33,919 - - 33,91918 Nov 15 - 23 Jan 16 - - - - - 704,355 - - 704,35518 Nov 14 - 23 Jan 15 - 305,302 - - 305,302 - - - 305,30218 Nov 14 - 23 Jan 15 - 592,713 - - 592,713 - (48,213) (92,817) 451,68319 Nov 13 - 23 Jan 14 1,799,507 - (18,216) (95,702) 1,685,589 - (47,159) (218,515) 1,419,91519 Nov 12 - 23 Jan 13 1,634,031 - (26,640) (75,801) 1,531,590 - (1,527,773) (3,817) - 18 Nov 11 - 23 Jan 12 40,580 - (40,580) - - - - - - 18 Nov 11 - 23 Jan 12 2,270,963 - (2,265,048) (5,915) - - - - - Total 5,745,081 898,015 (2,350,484) (177,418) 4,115,194 738,274 (1,623,145) (315,149) 2,915,174
Rights over unissued shares (refer to note 36 and Remuneration Report section H):
Balance Issued Exercised Lapsed Balance Issued Exercised Lapsed BalanceVesting date 30 Sep 11 during during during 30 Sep 12 during during during 30 Sep 13
year year year year year year 19 Dec 15 - - - - - 24,293 - - 24,29319 Dec 15 - - - - - 717,397 - (74,081) 643,316 4 Mar 15 - - - - - 3,836 - - 3,83619 Dec 14 - 664,845 - (15,680) 649,165 - - (89,522) 559,643 4 Mar 14 - - - - - 3,835 - - 3,83530 Nov 13 - 7,942 - - 7,942 - - - 7,94215 Oct 13 - - - - - 4,885 (4,885) - - 31 Mar 13 - 108,246 - - 108,246 - (108,246) - - 01 Sep 13 - 6,148 - - 6,148 - (6,148) - - Total - 787,181 - (15,680) 771,501 754,246 (119,279) (163,603) 1,242,865
For
per
sona
l use
onl
y

88
Notes to the Financial Statements For the year ended 30 September
Orica Limited
88
Notes Consolidated2013 2012
$m $m
22. Reserves and retained earnings(a) ReservesShare based payments 99.3 83.3Cash flow hedging (8.1) (15.7)Foreign currency translation (583.0) (930.0)Equity - arising from purchase of non-controlling interests (189.1) (187.4)Balance at end of the year (680.9) (1,049.8)Movement in reserves during the yearShare based payments Balance at beginning of year 83.3 65.4 Share based payments expense 16.0 17.9 Balance at end of the year 99.3 83.3Cash flow hedging Balance at beginning of year (15.7) (11.5) Movement for period 10.9 (5.9) Tax effect of movement in cash flow hedge reserve (3.3) 1.7 Balance at end of the year (8.1) (15.7)Foreign currency translation Balance at beginning of year (930.0) (715.5) Translation of overseas controlled entities at the end of the year 323.5 (196.1) Tax effect of translation of overseas controlled entities at the end of the year 23.5 (18.4) Balance at end of the year (583.0) (930.0)Equity - arising from purchase of non-controlling interests Balance at beginning of year (187.4) (187.4) Purchase of non-controlling interests (see note 27) (1.7) - Balance at end of the year (189.1) (187.4)
(b) Retained earningsRetained earnings at the beginning of the year 2,376.2 2,363.4Profit after income tax attributableto shareholders of Orica 601.6 402.8Defined benefit fund superannuation movement (net of tax) (38) 17.2 (41.5)Transfer of cost related to issue of Step-Up Preference Securities - (10.0)Disposal of non-controlling interests - 0.3Dividends/distributions: (25) Step-Up Preference Securities distributions - (11.1) Less tax credit on Step-Up Preference Securities distributions - 2.2 Ordinary dividends – interim (142.5) (137.9) Ordinary dividends – final (196.5) (192.0)Retained earnings at end of the year 2,656.0 2,376.2
Share based payments reserveThe amount charged to the share based payments reserve each year represents the share based payments expense.
Cash flow hedging reserveThe amount in the cash flow hedging reserve represents the cumulative net change in the fair value of cash flow hedging instrumentsrelated to hedged transactions that have not yet occurred.
Foreign currency translation reserveThe foreign currency translation reserve records the foreign currency differences arising from the translation of foreign operations, the translation of transactions that hedge net investment in a foreign operation or the translation of foreign currency monetary items forming part of the net investment in a foreign operation.
Equity reserve arising from purchase of non-controlling interestsThe equity reserve represents the excess of the cost of investment in purchasing non-controlling interests in subsidiaries over the net assets acquired and non-controlling interests share of goodw ill at the date of original acquisition of the subsidiary. The movement for the year ended 30 September 2013 relates to purchase of 20% non-controlling interests in JV Minova Kazakhstan Limited Liability Partnership.
Orica Annual Report 2013
For
per
sona
l use
onl
y
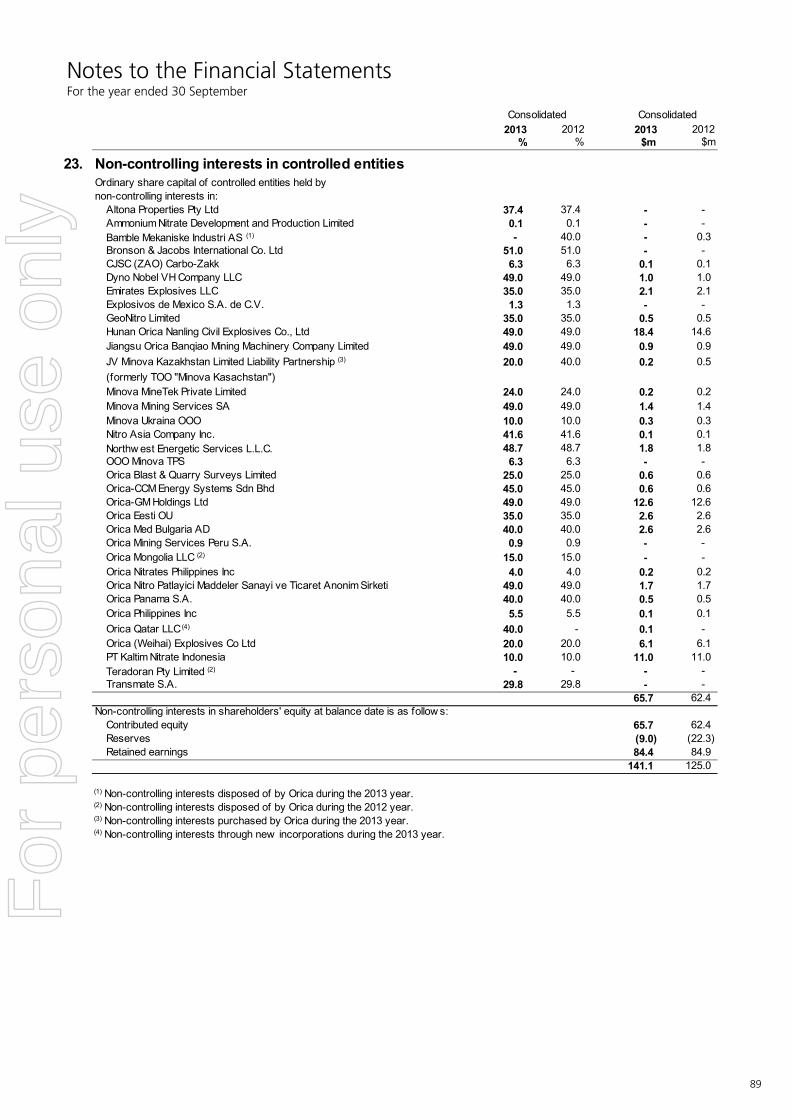
89
Notes to the Financial Statements For the year ended 30 September
Orica Limited
89
2013 2012 2013 2012% % $m $m
23. Non-controlling interests in controlled entitiesOrdinary share capital of controlled entities held bynon-controlling interests in: Altona Properties Pty Ltd 37.4 37.4 - - Ammonium Nitrate Development and Production Limited 0.1 0.1 - - Bamble Mekaniske Industri AS (1) - 40.0 - 0.3 Bronson & Jacobs International Co. Ltd 51.0 51.0 - - CJSC (ZAO) Carbo-Zakk 6.3 6.3 0.1 0.1 Dyno Nobel VH Company LLC 49.0 49.0 1.0 1.0 Emirates Explosives LLC 35.0 35.0 2.1 2.1 Explosivos de Mexico S.A. de C.V. 1.3 1.3 - - GeoNitro Limited 35.0 35.0 0.5 0.5 Hunan Orica Nanling Civil Explosives Co., Ltd 49.0 49.0 18.4 14.6 Jiangsu Orica Banqiao Mining Machinery Company Limited 49.0 49.0 0.9 0.9 JV Minova Kazakhstan Limited Liability Partnership (3) 20.0 40.0 0.2 0.5 (formerly TOO "Minova Kasachstan") Minova MineTek Private Limited 24.0 24.0 0.2 0.2 Minova Mining Services SA 49.0 49.0 1.4 1.4 Minova Ukraina OOO 10.0 10.0 0.3 0.3 Nitro Asia Company Inc. 41.6 41.6 0.1 0.1 Northw est Energetic Services L.L.C. 48.7 48.7 1.8 1.8 OOO Minova TPS 6.3 6.3 - - Orica Blast & Quarry Surveys Limited 25.0 25.0 0.6 0.6 Orica-CCM Energy Systems Sdn Bhd 45.0 45.0 0.6 0.6 Orica-GM Holdings Ltd 49.0 49.0 12.6 12.6 Orica Eesti OU 35.0 35.0 2.6 2.6 Orica Med Bulgaria AD 40.0 40.0 2.6 2.6 Orica Mining Services Peru S.A. 0.9 0.9 - - Orica Mongolia LLC (2) 15.0 15.0 - - Orica Nitrates Philippines Inc 4.0 4.0 0.2 0.2 Orica Nitro Patlayici Maddeler Sanayi ve Ticaret Anonim Sirketi 49.0 49.0 1.7 1.7 Orica Panama S.A. 40.0 40.0 0.5 0.5 Orica Philippines Inc 5.5 5.5 0.1 0.1 Orica Qatar LLC (4) 40.0 - 0.1 - Orica (Weihai) Explosives Co Ltd 20.0 20.0 6.1 6.1 PT Kaltim Nitrate Indonesia 10.0 10.0 11.0 11.0 Teradoran Pty Limited (2) - - - - Transmate S.A. 29.8 29.8 - -
65.7 62.4 Non-controlling interests in shareholders' equity at balance date is as follow s: Contributed equity 65.7 62.4 Reserves (9.0) (22.3) Retained earnings 84.4 84.9
141.1 125.0
(1) Non-controlling interests disposed of by Orica during the 2013 year.(2) Non-controlling interests disposed of by Orica during the 2012 year.(3) Non-controlling interests purchased by Orica during the 2013 year.(4) Non-controlling interests through new incorporations during the 2013 year.
Consolidated Consolidated
For
per
sona
l use
onl
y
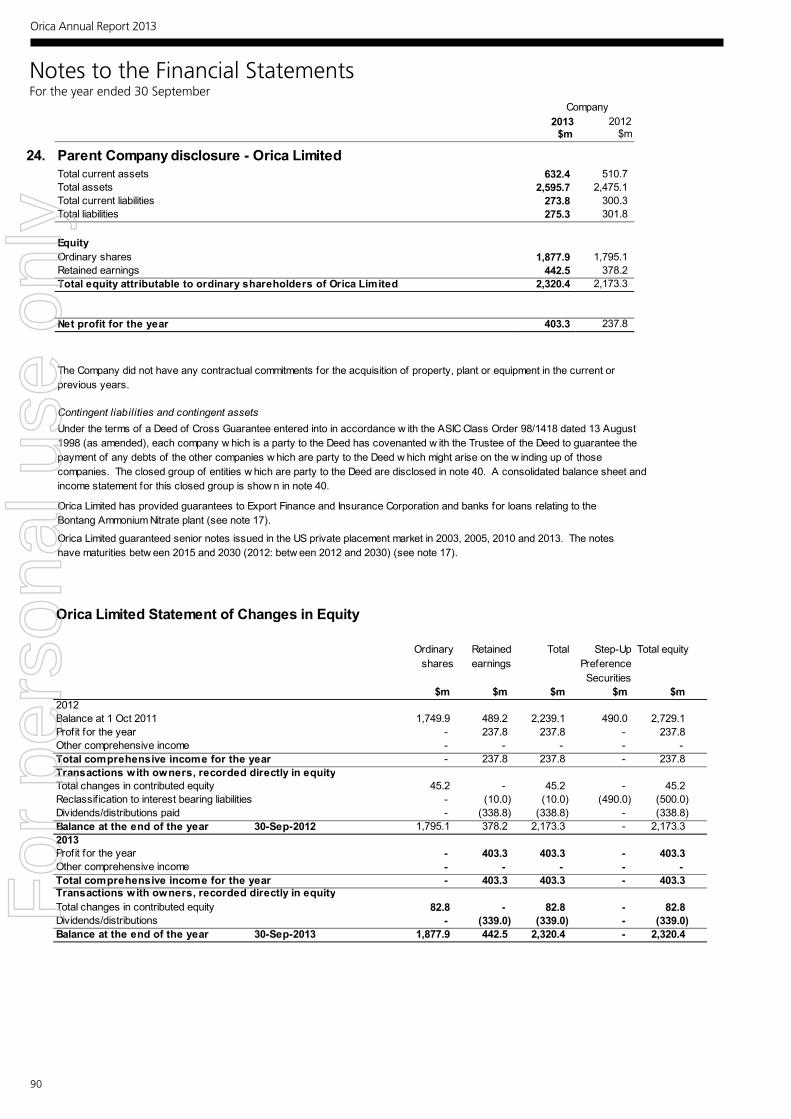
90
Notes to the Financial Statements For the year ended 30 September
Orica Limited
90
2013 2012$m $m
24. Parent Company disclosure - Orica LimitedTotal current assets 632.4 510.7 Total assets 2,595.7 2,475.1 Total current liabilities 273.8 300.3 Total liabilities 275.3 301.8
EquityOrdinary shares 1,877.9 1,795.1 Retained earnings 442.5 378.2Total equity attributable to ordinary shareholders of Orica Limited 2,320.4 2,173.3
Net profit for the year 403.3 237.8
Orica Limited guaranteed senior notes issued in the US private placement market in 2003, 2005, 2010 and 2013. The notes have maturities betw een 2015 and 2030 (2012: betw een 2012 and 2030) (see note 17).
Company
Under the terms of a Deed of Cross Guarantee entered into in accordance w ith the ASIC Class Order 98/1418 dated 13 August 1998 (as amended), each company w hich is a party to the Deed has covenanted w ith the Trustee of the Deed to guarantee the payment of any debts of the other companies w hich are party to the Deed w hich might arise on the w inding up of those companies. The closed group of entities w hich are party to the Deed are disclosed in note 40. A consolidated balance sheet and income statement for this closed group is show n in note 40.
The Company did not have any contractual commitments for the acquisition of property, plant or equipment in the current or previous years.
Contingent liabilities and contingent assets
Orica Limited has provided guarantees to Export Finance and Insurance Corporation and banks for loans relating to the Bontang Ammonium Nitrate plant (see note 17).
Orica Limited Statement of Changes in Equity
Ordinary shares
Retained earnings
Total Step-Up Preference Securities
Total equity
$m $m $m $m $m 2012Balance at 1 Oct 2011 1,749.9 489.2 2,239.1 490.0 2,729.1Profit for the year - 237.8 237.8 - 237.8Other comprehensive income - - - - - Total comprehensive income for the year - 237.8 237.8 - 237.8Transactions with owners, recorded directly in equityTotal changes in contributed equity 45.2 - 45.2 - 45.2Reclassification to interest bearing liabilities - (10.0) (10.0) (490.0) (500.0)Dividends/distributions paid - (338.8) (338.8) - (338.8)Balance at the end of the year 30-Sep-2012 1,795.1 378.2 2,173.3 - 2,173.32013Profit for the year - 403.3 403.3 - 403.3Other comprehensive income - - - - - Total comprehensive income for the year - 403.3 403.3 - 403.3Transactions with owners, recorded directly in equityTotal changes in contributed equity 82.8 - 82.8 - 82.8Dividends/distributions - (339.0) (339.0) - (339.0)Balance at the end of the year 30-Sep-2013 1,877.9 442.5 2,320.4 - 2,320.4
Orica Annual Report 2013
For
per
sona
l use
onl
y
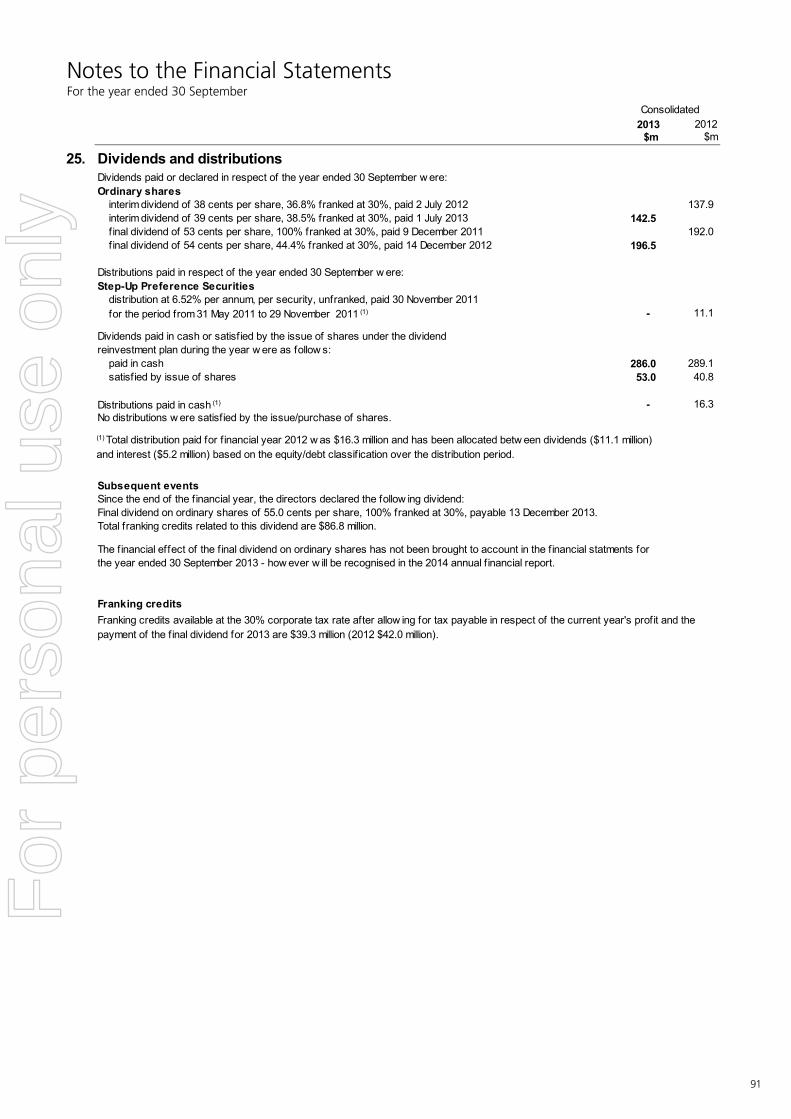
91
Notes to the Financial Statements For the year ended 30 September
Orica Limited
91
2013 2012 $m $m
25. Dividends and distributionsDividends paid or declared in respect of the year ended 30 September w ere:Ordinary shares interim dividend of 38 cents per share, 36.8% franked at 30%, paid 2 July 2012 137.9 interim dividend of 39 cents per share, 38.5% franked at 30%, paid 1 July 2013 142.5 f inal dividend of 53 cents per share, 100% franked at 30%, paid 9 December 2011 192.0 f inal dividend of 54 cents per share, 44.4% franked at 30%, paid 14 December 2012 196.5
Distributions paid in respect of the year ended 30 September w ere: Step-Up Preference Securities distribution at 6.52% per annum, per security, unfranked, paid 30 November 2011 for the period from 31 May 2011 to 29 November 2011 (1) - 11.1
Dividends paid in cash or satisfied by the issue of shares under the dividendreinvestment plan during the year w ere as follow s: paid in cash 286.0 289.1 satisfied by issue of shares 53.0 40.8
Distributions paid in cash (1) - 16.3No distributions w ere satisfied by the issue/purchase of shares.
Subsequent eventsSince the end of the financial year, the directors declared the follow ing dividend:Final dividend on ordinary shares of 55.0 cents per share, 100% franked at 30%, payable 13 December 2013.Total franking credits related to this dividend are $86.8 million.
The financial effect of the final dividend on ordinary shares has not been brought to account in the financial statments forthe year ended 30 September 2013 - how ever w ill be recognised in the 2014 annual financial report.
Franking creditsFranking credits available at the 30% corporate tax rate after allow ing for tax payable in respect of the current year's profit and the payment of the final dividend for 2013 are $39.3 million (2012 $42.0 million).
Consolidated
(1) Total distribution paid for financial year 2012 w as $16.3 million and has been allocated betw een dividends ($11.1 million) and interest ($5.2 million) based on the equity/debt classification over the distribution period.
For
per
sona
l use
onl
y

92
Notes to the Financial Statements For the year ended 30 September
Orica Limited
92
2013 2012Notes $m $m
26. Notes to the statement of cash flowsReconciliation of cashCash at the end of the year as show n in the statements of cash flow s is reconciled to the relateditems in the balance sheet as follow s: Cash (7) 225.3 235.8 Bank overdraft (17) (19.2) (7.9)
206.1 227.9
Reconciliation of profit from ordinary activities after income tax to net cash flows from operating activitiesProfit from ordinary activities after income tax expense 621.2 423.8Depreciation and amortisation 284.4 251.4Share based payments expense 16.0 17.9Share of associates' net (profit)/loss after adding back dividends received (8.2) (6.2)Finance charges - finance leases 0.3 0.6Unw inding of discount on provisions 7.7 5.9(Decrease)/increase in net interest payable (0.4) (4.2)(Increase)/decrease in net interest receivable (0.2) 0.1Impairment of intangibles 5.7 367.2Impairment of property, plant and equipment - 0.2Impairment of inventories 12.8 4.2Impairment of investments 0.3 0.1Net loss/(profit) on sale of businesses and controlled entities/investments 0.4 (3.7)Net profit on sale of property, plant and equipment (10.0) (32.8)Changes in w orking capital and provisions excluding the effects ofacquisitions and disposals of businesses/controlled entities increase in trade and other receivables (76.2) (90.4) increase in inventories (113.8) (82.2) decrease in net deferred taxes (9.6) (37.1) increase/(decrease) in payables and provisions 257.2 (224.2) increase/(decrease) in income taxes payable 71.1 (46.5)Net cash flows from operating activities 1,058.7 544.1
Consolidated
Orica Annual Report 2013
For
per
sona
l use
onl
y

93
Notes to the Financial Statements For the year ended 30 September
Orica Limited
93
27. Businesses and non-controlling interests acquiredAccounting standards require the fair value of the net assets acquired to be recognised. These f inancial statements include the preliminary purchase price allocation of acquired net assets. Accounting standards permit a measurement period during w hich acquisition accounting can be f inalised follow ing the acquisition date. The measurement period shall not exceed one year from the acquisition date.
Consolidated - 2013Acquisition of businesses and controlled entitiesDuring f inancial year 2013 the consolidated entity has not acquired any businessess or entities.
Acquisition of non-controlling interest:JV Minova Kazakhstan Limited Liability Partnership, on 12 April 2013 Orica acquired additional 20%.
Tota l2013 $m Decrease in non-controlling interests (1.6) Equity reserve (1.7) `
Deferred consideration 0.6Total consideration (2.7)
Consolidated - 2012Acquisition of businesses and controlled entitiesThe consolidated entity acquired the follow ing businesses and entities (100% unless stated otherw ise):
BusinessesBusiness assets of Atlas Copco MAI GmbH on 6 October 2011.
Book Fair value Amended values adjustments Total Acquisitions (1)
2012 $m $m $m $mConsideration cash paid 13.8 - 13.8 - Outflow of cash 13.8 - 13.8 - Total consideration 13.8 - 13.8 - Fair value of net assets of businesses/controlled entities acquired trade and other receivables - - - (0.8) inventories 2.5 - 2.5 - property, plant and equipment 4.7 - 4.7 - intangibles 2.4 - 2.4 - provision for employee entitlements (0.3) - (0.3) - provision for environmental - - - (1.4) provision for deferred tax - - - 0.2
9.3 - 9.3 (2.0)Goodw ill on acquisition 4.5
(1) Amendments made in f inancial year 2012 but related to acquisitions made prior to f inancial year 2012.
Results contributed by acquired entities since acquisition date: $mRevenue for the year 25.2EBITDA for the year 2.6
The unaudited operating revenue and earnings before interest, tax, depreciation and amortisation for the acquiredbusinesses and entities for the tw elve months to 30 September 2012 are as follow s:
$mOperating revenue 25.2EBITDA 2.6
The unaudited information at the time of acquisition w as compiled by Orica management based on f inancial information available to Orica during due diligence and assuming no material transactions betw een Orica and the acquired businesses. Goodw ill on the purchase of these entities is attributable mainly to the skills and technical talent of the acquired businesses'w ork forces and the synergies expected to be achieved from integrating these businesses. None of the goodw ill recognised is expected to be deductible for income tax purposes.F
or p
erso
nal u
se o
nly

94
Notes to the Financial Statements For the year ended 30 September
Orica Limited
94
28. Businesses disposedDisposal of businesses/controlled entitiesThe follow ing businesses and controlled entities w ere disposed of:2013:Bamble Mekaniske Industri AS on 1 October 2012 (60% holding).
2012:Teradoran Pty Limited on 10 February 2012 (67.0% holding).
2013 2012$m $m
Consideration cash received 0.2 2.0 cash disposed - (0.1) debt disposed 0.3 0.6Inf low of cash 0.5 2.5Net consideration 0.5 2.5Carrying value of net assets of businesses/controlled entities disposed trade and other receivables 1.4 1.2 inventories 1.5 1.3 property, plant and equipment - 1.1 intangibles 0.2 0.2 other assets - 0.3 investment 0.2 - payables and interest bearing liabilities (1.8) (0.7) provision for employee entitlements (0.2) (0.3)
1.3 3.1Less non-controlling interests at date of disposal (0.4) (0.9)
0.9 2.2(Loss)/prof it on sale of business/controlled entities (0.4) 0.3
Consolidated
Orica Annual Report 2013
For
per
sona
l use
onl
y

95
Notes to the Financial Statements For the year ended 30 September
Orica Limited
95
29. Impairment testing of goodwillFor the purposes of impairment testing, goodw ill is allocated to cash generating units (CGU), or groups of cash generating units expectedto benefit from the synergies. Each unit or group of units to w hich goodw ill has been allocated shall: - represent the low est level at w hich is internally monitored; and - not be larger than a segment.Follow ing the Orica restructure, w hich took effect from 1 October 2012, Orica's reporting segments w ere re-evaluated. Goodw ill is internally monitored at the new segment level. Accordingly, impairment testing of goodw ill is undertaken at the segment level.
The carrying amounts of goodw ill in each segment are as follow s: Consolidated
2013 2012$m $m
Mining Services:- Australia/Pacific 891.4 835.9- North America 269.8 246.7- Latin America 207.5 194.2- EMEA 328.3 301.3- Other 60.4 41.3Chemicals 145.9 137.8Total 1,903.3 1,757.2
The recoverable amount of goodw ill w ith indefinite lives is assessed based on value in use. The value in use calculationsuse cash flow projections based on actual operating results and the operating budgets and forecasts approved by the Boardof Directors. Cash flow projections are calculated using the 2014 budgeted/forecast cash flow s and industry grow th rates going forw ard.
The discount rates for each CGU w ere calculated using rates based on an external assessment of the Group's pre-tax w eightedaverage cost of capital in conjunction w ith risk specific factors to the countries in w hich the CGUs operate. The pre-tax discount rates applied in the discounted cash flow model range betw een 10% and 21% (2012 9% - 23%). Foreign currency cashflow s are discounted using the functional currency of the CGUs and then translated to Australian Dollars using the closingexchange rate.
The key assumptions regarding the range of discount and grow th rates used in the calculation of value in use are as follow s:
Terminal TerminalDiscount Grow th Rates Discount Grow th Rates Rates Rates Rates Rates2013 2013 2012 2012
% % % %Mining Services:- Australia/Pacif ic 15.0% - 15.6% 0.0% - 6.0% 13.5% - 19.5% 2.6% - 6.8%- North America 13.2% - 13.2% 0.0% - 2.0% 13.5% - 15.7% 0.0% - 3.6%- Latin America 17.8% - 17.8% 0.0% - 10.1% 13.5% - 22.5% 0.0% - 10.3%- EMEA 10.0% - 20.7% 0.0% - 10.2% 9.7% - 22.6% 0.0% - 15.6%- Other 12.6% - 19.0% 0.0% - 10.2% 12.7% - 19.1% 0.0% - 8.5%Chemicals 13.6% - 13.6% 0.0% - 2.9% 13.5% - 14.5% 0.0% - 5.3%
The impairment charge for intangibles w ith indefinite lives during the 2013 year relates to a specif ic asset in the MiningServices - Other Segment w hile the impairment charge for intangibles w ith indefinite lives during the 2012 year related to the Minova former segment.
2013 2012$m $m
Goodw ill 5.7 367.2Total 5.7 367.2
The value in use calculations are sensitive to changes in discount rates, earnings and foreign exchange rates varying from the assumptions and forecast data used in the impairment testing. As such, sensitivity analysis w as undertaken to examine the effect of a change in a variable on each CGU.
Consolidated
For
per
sona
l use
onl
y

96
Notes to the Financial Statements For the year ended 30 September
Orica Limited
96
2013 2012$m $m
30. CommitmentsCapital expenditure commitmentsCapital expenditure on property, plant and equipment andbusiness acquisitions contracted but not provided for and payable: no later than one year 22.2 60.5 later than one, no later than five years - 1.6
22.2 62.1
Lease commitmentsLease expenditure contracted for at balance date but notrecognised in the financial statements and payable: no later than one year 71.8 64.0 later than one, no later than five years 147.8 147.5 later than five years 41.7 31.6
261.3 243.1
Representing: cancellable operating leases 155.2 158.8 non-cancellable operating leases 106.1 84.3
261.3 243.1
Non-cancellable operating lease commitmentspayable: no later than one year 26.4 19.6 later than one, no later than five years 58.3 49.6 later than five years 21.4 15.1
106.1 84.3
Finance lease commitments payable: no later than one year 1.4 1.2 later than one, no later than five years 5.0 5.2 later than five years 1.0 2.1
7.4 8.5Less future finance charges (0.9) (1.2)Present value of minimum lease payments provided for as a liability 6.5 7.3
Representing lease liabilities: (see note 17) current 1.4 1.2 non-current 5.1 6.1
6.5 7.3
Consolidated
In financial year 2012 Orica Ltd announced that it has agreed to form a joint venture w ith Yara and Apache to build a 330,000 tonnes per annum industrial grade ammonium nitrate plant on the Burrup Peninsula. The joint venture is ow ned 45% (Orica), 45% (Yara) and 10% (Apache). Construction of the plant is expected to have a capital cost of approximately US$800 million and be completed by the end of 2015. At 30 September 2013, approximately $128.9 million (2012 38.2 million) has been paid to the joint venture entity for construction costs.
Orica Annual Report 2013
For
per
sona
l use
onl
y

97
Notes to the Financial Statements For the year ended 30 September
Orica Limited
97
32. Critical accounting judgements and estimates Management determines the development, selection and disclosure of the consolidated entity’s critical accounting policies, estimates and accounting judgements and the application of these policies and estimates. Management necessarily makes estimates and judgements that have a significant effect on the amounts recognised in the financial statements. Estimates and judgements are continually evaluated and are based on historical experience and other factors, including reasonable expectations of future events. Management believes the estimates used in preparing the financial report are reasonable and in accordance with accounting standards. Changes in the assumptions underlying the estimates may result in a significant impact on the financial statements. The most critical of these assumptions and judgements are: Contingent liabilities In the normal course of business, contingent liabilities may arise from product-specific and general legal proceedings, from guarantees or from environmental liabilities connected with current or former sites. Where management are of the view that potential liabilities have a low probability of crystallising or it is not possible to quantify them reliably, they are disclosed as contingent liabilities. These are not provided for in the financial statements but are disclosed in note 33. Environmental and decommissioning provisions The business of the Group is subject to a variety of laws and regulations in the jurisdictions in which it operates or maintains properties. Provisions for expenses (refer to note 19) that may be incurred in complying with such laws and regulations are set aside if environmental inquiries or remediation measures are probable and the costs can be reliably estimated. For sites where there are uncertainties with respect to what Orica’s remediation obligations might be or what remediation techniques might be approved and no reliable estimate can presently be made of regulatory and remediation costs, no amounts have been provided. It is also assumed that the methods planned for environmental remediation will be able to treat the issues within the expected time frame. It is difficult to estimate the future costs of environmental remediation because of many uncertainties, particularly with regard to the status of laws, regulations and the information available about conditions in various countries and at individual sites. Significant factors in estimating the costs include the work of external consultants and/or internal experts, previous experiences in similar cases, expert opinions regarding environmental programs, current costs and new developments affecting costs, management’s interpretation of current environmental laws and regulations, the number and financial position of third parties that may become obligated to participate in any remediation activities on the basis of joint liability and the remediation methods which are likely to be deployed. Changes in the assumptions underlying these estimated costs may impact future reported results. Subject to these factors, but taking into consideration experience gained to date regarding environmental matters of a similar nature, Orica believes the provisions to be appropriate based upon currently available information. However, given the inherent difficulties in estimating liabilities in this area, it cannot be guaranteed that additional costs will not be incurred beyond the amounts provided. It is possible that final resolution of these matters may require expenditures to be made in excess of established provisions over an extended period of time that may result in changes in timing of anticipated cash flows from those assumed and in a range of amounts that cannot be reasonably estimated.
2013 2012$000 $000
31. Auditors’ remunerationTotal remuneration received, or due and receivable, by the auditors for: Audit services Auditors of the Company – KPMG Australia – Audit and review of financial reports 4,914 4,834 – Other regulatory audit services 592 356 Auditors of the Company – overseas KPMG firms – Audit and review of financial reports (1) 1,994 1,795
7,500 6,985 Other services (2)
Auditors of the Company – KPMG Australia – other assurance services - 52
- 527,500 7,037
(2) The Board Audit and Risk Committee must approve any other services provided by KPM G above a value of $100,000 per assignment and it also reviews and approves at year end other services provided by KPM G below a value of $100,000. The guidelines adopted by KPM G for the provision of other services ensure their statutory independence is not compromised.
Consolidated
(1) Fees paid or payable for overseas subsidiaries' local lodgement purposes.
From time to time, KPM G, the auditors of Orica, provide other services to the Group, which are subject to strict corporate governance procedures adopted by the Company which encompass the selection of service providers and the setting of their remuneration.
For
per
sona
l use
onl
y

98
Notes to the Financial Statements For the year ended 30 September
Orica Limited
98
32. Critical accounting judgements and estimates (continued) In respect of the Botany groundwater (New South Wales, Australia) contamination, Orica is continuing to conduct extensive remediation activities, including the operation of a Groundwater Treatment Plant, to treat the groundwater at Botany, which is contaminated with pollutants from historical operations. A provision exists (refer to note 19) to cover the estimated costs associated with remediation until 2018. Costs are expected to be incurred after this date, but it is not possible to predict the time frame over which remediation will be required or the form the remediation will take and therefore it is not possible to reliably estimate any associated costs. In light of ongoing discussions with regulatory authorities and following an assessment of currently available technologies to treat the contamination, Orica intends to maintain a provision at current levels that takes into account the estimated costs associated with remediation commitments over this period. The provision will continue to be re-evaluated based on future regulatory assessments and advancements in appropriate technologies. Orica is committed to finding a solution for destruction of its HCB waste. There are no facilities to treat the HCB waste in Australia and Orica's export applications have been unsuccessful. Given the complex technical, social and political aspects of the HCB waste, Orica continues to safely store the waste. A provision has been established in respect of this matter (refer to note 19). Orica received results indicating elevated concentrations of mercury in soil and groundwater at the southern end of the Botany site and at adjacent offsite locations. Orica started remediating the site in May 2011 using a soil washing technology to remove mercury. The soil washing plant was not able to sustain adequate reliable operation and Orica decided to suspend the works. Orica submitted a new remediation action plan which satisfied the NSW Environment Protection Authority requirements, and Orica restarted works in August 2013. A provision has been established for remediation activities in respect of this matter. Legal proceedings The outcome of currently pending and future legal, judicial, regulatory, administrative and other proceedings of a litigious nature (“Proceedings”) cannot be predicted with certainty. Thus, an adverse decision in Proceedings could result in additional costs that are not covered, either wholly or partially, under insurance policies and that could significantly impact the business and results of operations of the Group. Proceedings as a rule raise difficult and complex legal issues and are subject to many uncertainties and complexities including, but not limited to, the facts and circumstances of each particular case, issues regarding the jurisdiction in which each Proceeding is brought and differences in applicable law. Upon resolution of any pending Proceedings, the Group may be forced to incur charges in excess of the presently established provisions and related insurance coverage. It is possible that the financial position, results of operations or cash flows of the Group could be materially affected by an unfavourable outcome of those Proceedings. Proceedings are evaluated on a case-by-case basis considering the available information, including that from legal counsel, to assess potential outcomes. Where it is considered probable that a future obligation will result in an outflow of resources, a provision is recorded in the amount of the present value of the expected cash outflows if these are deemed to be reliably measurable. Warranties and Indemnities In the course of acquisitions and disposals of businesses and assets, Orica routinely negotiates warranties and indemnities across a range of commercial issues and risks, including environmental risks associated with real property. Management uses the information available and exercises judgement in the overall context of these transactions, in determining the scope and extent of these warranties and indemnities. In assessing Orica’s financial position, management relies on warranties and indemnities received, and considers potential exposures on warranties and indemnities provided. It is possible that the financial position, results of operations and cash flows of the Group could be materially affected if circumstances arise where warranties and indemnities received are not honoured, or for those provided, circumstances change adversely. Defined benefit superannuation fund obligations The expected costs of providing post-retirement benefits under defined benefit arrangements relating to employee service during the period are charged to the income statement. Any actuarial gains and losses, which can arise from differences between expected and actual outcomes or changes in actuarial assumptions, are recognised immediately in the statement of comprehensive income. In all cases, the superannuation costs are assessed in accordance with the advice of independent qualified actuaries but require the exercise of significant judgement in relation to assumptions for future salary and superannuation increases, long term price inflation and investment returns. While management believes the assumptions used are appropriate, a change in the assumptions used may impact the earnings and equity of the Group. Property, plant and equipment and definite life intangible assets The Group’s property, plant and equipment and intangible assets, other than indefinite life intangible assets, are depreciated/amortised on a straight line basis over their useful economic lives. Management reviews the appropriateness of useful economic lives of assets at least annually and any changes to useful economic lives may affect prospective depreciation rates and asset carrying values. Financial instruments at fair value The Group measures a number of financial instruments at fair value. These fair values are based on observable market data which is used to estimate future cash flows and discount them to present value. Management's aim is to use and source this data consistently from period to period. While management believes the assumptions used are appropriate, a change in assumptions would impact the fair value calculations.
Orica Annual Report 2013
For
per
sona
l use
onl
y

99
Notes to the Financial Statements For the year ended 30 September
Orica Limited
99
32. Critical accounting judgements and estimates (continued) Impairment of assets The Group reviews the carrying amounts of its tangible and intangible assets to determine whether there is any indication that those assets are impaired. In making the assessment for impairment, assets that do not generate independent cash flows are allocated to an appropriate cash generating unit (CGU). The recoverable amount of those assets, or CGUs, is measured as the higher of their fair value less costs to sell or value in use. Management necessarily applies its judgement in allocating assets that do not generate independent cash flows to appropriate CGUs. For the purposes of impairment testing, goodwill is allocated to cash generating units, or groups of cash generating units expected to benefit from the synergies. Each unit or group of units to which goodwill has been allocated shall represent the lowest level at which is internally monitored and not be larger than a segment. Following the Orica restructure, which took effect from 1 October 2012, Orica’s reporting segments were re-evaluated. Goodwill is internally monitored at the new segment level. Accordingly, impairment testing of goodwill is undertaken at the segment level. The determination of value in use requires the estimation and discounting of future cashflows. The estimation of the cashflows considers information available at balance date which may result in cashflows deviating from actual developments. This includes, among other things, expected revenue from sales of products, the return on assets, future costs and discount rates. Subsequent changes to the CGU allocation or to the timing and quantum of cash flows may impact the carrying value of the respective assets. Current asset provisions In the course of normal trading activities, management uses its judgement in establishing the net realisable value of various elements of working capital – principally inventory and accounts receivable. Provisions are established for obsolete or slow moving inventories, bad or doubtful receivables and product warranties. Actual expenses in future periods may be different from the provisions established and any such differences would impact future earnings of the Group. Taxation The Group is subject to income taxes in Australia and jurisdictions where it has foreign operations. Significant judgement is required in determining the worldwide provision for income taxes. There are many transactions and calculations undertaken during the ordinary course of business for which the ultimate tax determination is uncertain. The Group recognises liabilities for tax issues based on estimates of whether additional taxes will be due. Where the final tax outcome of these matters is different from the amounts that were initially recorded, such differences will impact the current and deferred tax provision in the period in which such determination is made. In addition, deferred tax assets are recognised for deductible temporary differences and unused tax losses only if it is probable that future taxable profits are available to utilise those temporary differences and losses, and the tax losses continue to be available having regard to the nature and timing of their origination and compliance with the relevant tax legislation associated with their recoupment. Assumptions are also made about the application of income tax legislation. These assumptions are subject to risk and uncertainty and there is a possibility that changes in circumstances or differences in opinions will alter outcomes which may impact the amount of deferred tax assets and deferred tax liabilities recorded on the Balance Sheet and the amount of tax losses and timing differences not yet recognised. In these circumstances, the carrying amount of deferred tax assets and liabilities may change, resulting in an impact on the earnings of the Group.
33. Contingent liabilities (a) Environmental (a) (i) General In accordance with the current accounting policy, for sites where the requirements have been assessed and are capable of reliable measurement, estimated regulatory and remediation costs have been capitalised, expensed as incurred or provided for. For environmental matters where there are significant uncertainties with respect to the extent of Orica’s remediation obligations or the remediation techniques that might be approved, no reliable estimate can presently be made of regulatory and remediation costs and any costs are expensed as incurred. There can be no assurance that new information or regulatory requirements with respect to known sites or the identification of new remedial obligations at other sites will not require additional future provisions for environmental remediation and such provisions could be material. Orica has entered into arrangements with the relevant regulatory authorities for a number of sites to investigate land and groundwater contamination and, where appropriate, undertake voluntary remediation activities on these sites. Where reliable estimates are possible and remediation techniques have been identified for these sites, provisions have been established in accordance with current accounting policy. Orica is investigating suitable remediation options for Dense Non-Aqueous Phase Liquid (DNAPL) source areas at Botany giving rise to the groundwater contamination which is being remediated by the Groundwater Treatment Plant. No provision has been established for remediation activities in respect of DNAPL as a reliable estimate is not possible at this time. (a)(ii) Environmental Prosecutions The NSW Environment Protection Authority has issued legal proceedings against Orica in relation to environmental incidents at the Botany and Kooragang Island sites that occurred during 2010 and 2011. Orica has entered guilty pleas to the charges
For
per
sona
l use
onl
y

100
Notes to the Financial Statements For the year ended 30 September
Orica Limited
100
33. Contingent liabilities (continued) involved in those legal proceedings. A sentencing and mitigation hearing of those proceedings was conducted in December 2012. The proceedings are currently adjourned pending a decision by the New South Wales Land and Environment Court. Orica is also the subject of legal proceedings issued by the Victorian Environment Protection Authority in relation to an incident involving fluorosilicic acid that occurred in September 2010 in Gippsland, Victoria. Orica is yet to enter a plea in relation to the alleged offences in those proceedings. It is probable that Orica will incur penalties as a consequence of these legal proceedings. However where it is not possible to reliably assess the amount of any such fines or other penalties, no provisions have been made with respect to these environmental prosecutions. (b) WorkCover Prosecutions The New South Wales WorkCover Authority has issued two sets of legal proceedings against Orica Australia in relation to two separate incidents at the Kooragang Island site on 9 November 2011. Orica Australia is yet to enter a plea in relation to the alleged offences in those legal proceedings. (c) Taxation (c) (i) Investigations and audits Consistent with other companies of the size and diversity of Orica, the Group is the subject of ongoing information requests, investigations and audit activities by Tax and Regulatory Authorities in jurisdictions in which Orica operates. Orica co-operates fully with the Tax and Regulatory Authorities. It is possible that Orica may incur fines and/or other penalties as a consequence of these investigations and audits. (c) (ii) Brazilian Tax Action The Brazilian Taxation authority is claiming unpaid taxes relating to the 1997 financial year of approximately $25 million. ICI Plc, the vendor of the business to Orica, has been notified to preserve Orica's rights under the tax indemnity obtained upon acquisition of the business which provides indemnity for amounts exceeding certain limits. The Brazilian Taxation authority has been granted security over the Lorena site as well as a bank guarantee of up to approximately $9 million. (c) (iii) Norway Tax Action The Tax Office in Norway has issued a final assessment for tax and interest amounting to approximately $32.5 million, resulting from a reassessment of Orica Norway’s tax return for the 2005 income year relating to a transfer of the Dyno Nobel house brand in conjunction with Orica’s acquisition of Dyno Nobel’s explosives business. Orica has received external legal advice and is pursuing this matter through an administrative complaints process. Orica has paid a portion of the primary tax and interest arising from the assessment, which has been recognised as a non-current receivable. (c) (iv) Australian Tax Action The Australian Taxation Office (“ATO”) has issued amended assessments in relation to the 2004, 2005 and 2006 years totalling $50.6m in relation to a financing arrangement by Orica of its US group between 2004 and 2006. Orica has received external legal advice and objected against all three assessments. In accordance with the ATO administrative practice, Orica has paid 50% of the primary tax and interest arising from the assessments, which has been recognised as a non-current receivable. (d) Guarantees, indemnities and warranties The consolidated entity has entered into various long term supply contracts. For some contracts, minimum charges are
payable regardless of the level of operations, but the levels of operations are expected to remain above those that would trigger minimum payments.
There are a number of legal claims and exposures which arise from the ordinary course of business. There is significant uncertainty as to whether a future liability will arise in respect of these items. The amount of liability, if any, which may arise cannot be reliably measured at this time.
The consolidated entity has entered into various sales contracts where minimum savings are guaranteed to customers and such savings are expected to be achieved in the ordinary course of business.
There are guarantees relating to certain leases of property, plant and equipment and other agreements arising in the ordinary course of business.
Contracts of sale covering companies and assets which were divested during the current and prior years include commercial warranties and indemnities to the purchasers.
Orica Limited guaranteed senior notes issued in the US private placement market in 2003, 2005, 2010 and 2013. The notes have maturities between 2015 and 2030.
Orica Annual Report 2013
For
per
sona
l use
onl
y
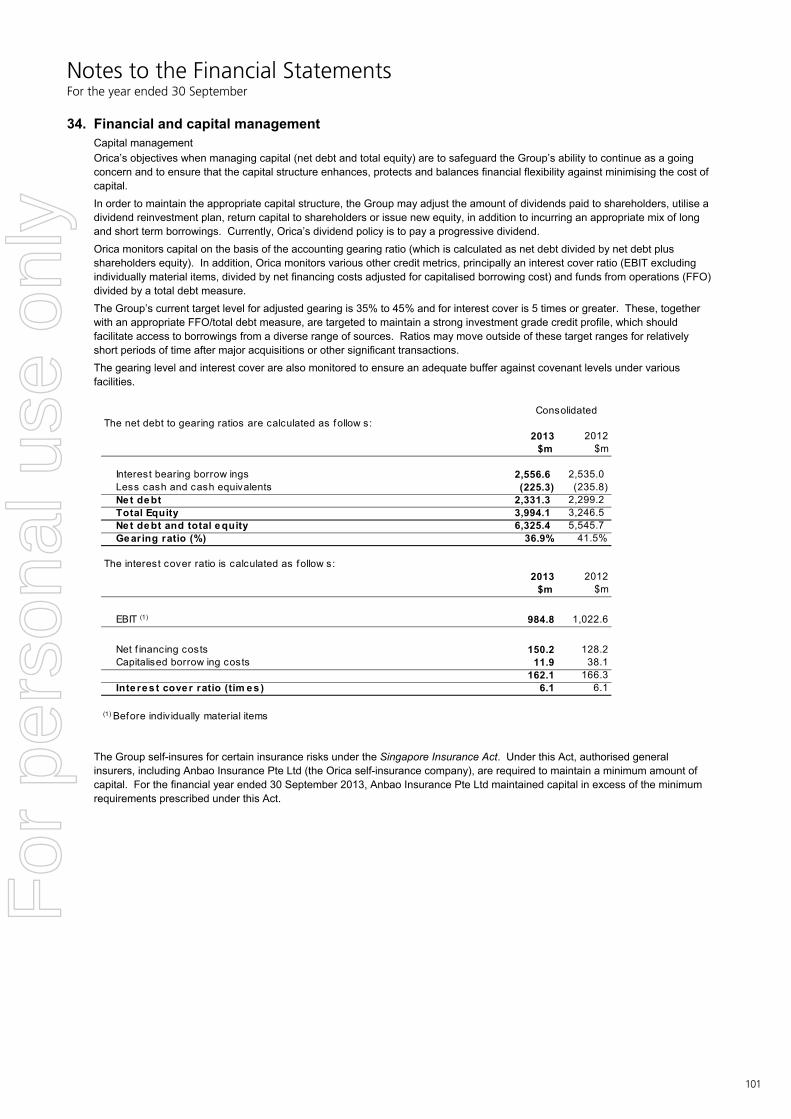
101
Notes to the Financial Statements For the year ended 30 September
Orica Limited 101
34. Financial and capital management Capital management Orica’s objectives when managing capital (net debt and total equity) are to safeguard the Group’s ability to continue as a going concern and to ensure that the capital structure enhances, protects and balances financial flexibility against minimising the cost of capital. In order to maintain the appropriate capital structure, the Group may adjust the amount of dividends paid to shareholders, utilise a dividend reinvestment plan, return capital to shareholders or issue new equity, in addition to incurring an appropriate mix of long and short term borrowings. Currently, Orica’s dividend policy is to pay a progressive dividend. Orica monitors capital on the basis of the accounting gearing ratio (which is calculated as net debt divided by net debt plus shareholders equity). In addition, Orica monitors various other credit metrics, principally an interest cover ratio (EBIT excluding individually material items, divided by net financing costs adjusted for capitalised borrowing cost) and funds from operations (FFO) divided by a total debt measure. The Group’s current target level for adjusted gearing is 35% to 45% and for interest cover is 5 times or greater. These, together with an appropriate FFO/total debt measure, are targeted to maintain a strong investment grade credit profile, which should facilitate access to borrowings from a diverse range of sources. Ratios may move outside of these target ranges for relatively short periods of time after major acquisitions or other significant transactions. The gearing level and interest cover are also monitored to ensure an adequate buffer against covenant levels under various facilities.
The Group self-insures for certain insurance risks under the Singapore Insurance Act. Under this Act, authorised general insurers, including Anbao Insurance Pte Ltd (the Orica self-insurance company), are required to maintain a minimum amount of capital. For the financial year ended 30 September 2013, Anbao Insurance Pte Ltd maintained capital in excess of the minimum requirements prescribed under this Act.
ConsolidatedThe net debt to gearing ratios are calculated as follow s:
2013 2012$m $m
Interest bearing borrow ings 2,556.6 2,535.0Less cash and cash equivalents (225.3) (235.8)Net debt 2,331.3 2,299.2Total Equity 3,994.1 3,246.5Net debt and total equity 6,325.4 5,545.7Gearing ratio (%) 36.9% 41.5%
The interest cover ratio is calculated as follow s:2013 2012
$m $m
EBIT (1) 984.8 1,022.6
Net f inancing costs 150.2 128.2Capitalised borrow ing costs 11.9 38.1
162.1 166.3Inte res t cover ratio (tim es ) 6.1 6.1
(1) Before individually material items
For
per
sona
l use
onl
y

102
Notes to the Financial Statements For the year ended 30 September
Orica Limited 102
34. Financial and capital management (continued) Financial risk factors The Group’s principal financial risks are associated with foreign exchange, interest rate, liquidity and credit risk. The Group’s overall risk management program seeks to mitigate these risks and reduce the volatility of Orica’s financial performance. Financial risk management is carried out centrally by the Group’s Treasury department under policies approved by the Board of Directors. The Board provides written principles for overall risk management and policies covering specific areas, such as foreign exchange, interest rate and credit risk as well as the use of derivative and non-derivative financial instruments and the investment of excess liquidity. Orica enters into derivative instruments for risk management purposes only. Derivative transactions are entered into to hedge the risks relating to underlying physical positions arising from business activities. Derivative transactions to hedge risks such as interest rate and foreign currency movements principally include interest rate swaps, cross currency interest rate swaps, forward exchange contracts and vanilla European option contracts. Classification of financial assets and financial liabilities The Group’s principal financial instruments comprise cash and cash equivalents, receivables, payables, interest bearing liabilities and derivatives. For measurement purposes the Group classifies financial assets and financial liabilities into the following categories: (a) financial assets and liabilities at fair value through profit and loss, (b) loans and other receivables and (c) financial liabilities at amortised cost. The Group does not have any financial assets categorised as held-to-maturity or as available-for-sale. Financial assets and liabilities at fair value through profit and loss This category combines financial assets and liabilities that are held for trading. A financial asset or liability is classified in this category if it is acquired principally for the purpose of selling in the short term or if it is so designated by management. The Group holds a number of derivative instruments for economic hedging purposes under Board approved risk management policies, which do not meet the criteria for hedge accounting under Accounting Standards. These derivatives are required to be categorised as held for trading. Assets and liabilities in this category are classified as current if they are either held for trading or are expected to be realised within 12 months of the balance sheet date (refer notes 12 and 16). Movements in the fair value of those derivatives that meet the accounting criteria as cash flow hedges and are designated as such are recognised in to the cash flow hedge reserve in equity. Loans and other receivables Loans and other receivables are non-derivative financial assets with fixed or determinable payments that are not quoted in an active market. They are included in current assets, except where maturities are greater than 12 months after the balance sheet date when they are classified as non-current. Loans and receivables are classified as ‘receivables’ in the balance sheet (refer note 8). Amortised cost Financial liabilities measured in this category are initially recognised at their fair value and are then subsequently re-measured at amortised cost using the effective interest rate method. This includes the Group’s short-term non-derivative financial instruments (refer note 16) and its interest bearing liabilities (refer note 17). Risks and mitigation The risks associated with the financial instruments and the policies for minimising these risks are detailed below: Interest rate risk management Interest rate risk refers to the risk that the value of a financial instrument or cash flows associated with the instrument will fluctuate due to changes in market interest rates. The Group is primarily exposed to interest rate risk on outstanding interest bearing liabilities. Non-derivative interest bearing assets are predominantly short-term liquid assets. Interest bearing liabilities issued at fixed rates expose the Group to fair value interest rate risk while borrowings issued at a variable rate give rise to cash flow interest rate risk. Interest rate risk on long-term interest bearing liabilities is managed by adjusting the ratio of fixed interest debt to variable interest debt. This is managed within policies determined by the Orica Board of Directors via the use of interest rate swaps and cross currency interest rate swaps. Under the policy, up to 90% of debt with a maturity of less than one year can be fixed. This reduces on a sliding scale to year five where a maximum 50% of debt with a maturity of between five and ten years can be fixed. Beyond this, a maximum 25% of the debt with a maturity of between ten and twenty years can be fixed. The Group operated within this range during both the current year and the prior year and as at September, the fixed rate borrowings after the impact of interest rate swaps and cross currency swaps were $1,098 million (2012 $761 million).
Orica Annual Report 2013
For
per
sona
l use
onl
y

103
Notes to the Financial Statements For the year ended 30 September
Orica Limited 103
34. Financial and capital management (continued)
Foreign exchange risk management Foreign exchange risk - transactional Foreign exchange risk refers to the risk that the value of a financial commitment, recognised asset or liability or cash flow will fluctuate due to changes in foreign currency rates. The Group is exposed to foreign exchange risk primarily due to significant sales and/or purchases denominated, either directly or indirectly, in currencies other than the functional currencies of the Group’s subsidiaries. In regard to foreign currency risk relating to sales and purchases, the Group hedges up to 100% of committed exposures. Anticipated exposures are hedged by applying a declining percentage of cover the further the time to the transaction date. Only exposures that can be forecast to a high probability are hedged. Transactions can be hedged for up to five years. The derivative instruments used for hedging purchase and sale exposures are bought vanilla option contracts and forward exchange contracts. Forward exchange contracts may be used only under Board policy for committed exposures and anticipated exposures expected to occur within 12 months. Bought vanilla option contracts may be used for all exposures. These contracts are designated as cash flow hedges and are recognised at their fair value. The currencies giving rise to this risk are primarily U.S. Dollar (USD), Euro (EUR), Canadian Dollar (CAD), New Zealand Dollar (NZD), Norwegian Kroner (NOK), Swedish Kronor (SEK) and Great Britain Pound (GBP).
Inte res t Rate Sens itivity
2013 2012$m $m
Effect on profit be fore tax increase /(decrease )If interest rates w ere 10% higher, w ith all other variables held constant (1.0) (3.2)If interest rates w ere 10% low er, w ith all other variables held constant 1.0 3.2
Effect on profit afte r tax increase /(decrease )If interest rates w ere 10% higher, w ith all other variables held constant (0.7) (2.2)If interest rates w ere 10% low er, w ith all other variables held constant 0.7 2.2
Effect on shareholders ' equity increase /(decrease )If interest rates w ere 10% higher, w ith all other variables held constant 1.0 0.8If interest rates w ere 10% low er, w ith all other variables held constant (1.0) (0.8)
Consolidated
The table below show s the ef fect on prof it f rom operations, net prof it af ter tax and shareholders' equity if interest rates at year end had been 10% higher or low er based on the relevant interest rate yield curve applicable to the underlying currency the borrow ings or derivatives are denominated in (including Australian dollars, Euros, Canadian dollars, New Zealand dollars and United States dollars) w ith all other variables held constant, taking into account all underly ing exposures and related hedges and does not include the impact of any management action that might take place if these events occurred. A sensitivity of 10% has been selected as this is considered reasonable given the current level of both short-term and long-term interest rates. Directors cannot nor do not seek to predict movements in interest rates.
For
per
sona
l use
onl
y
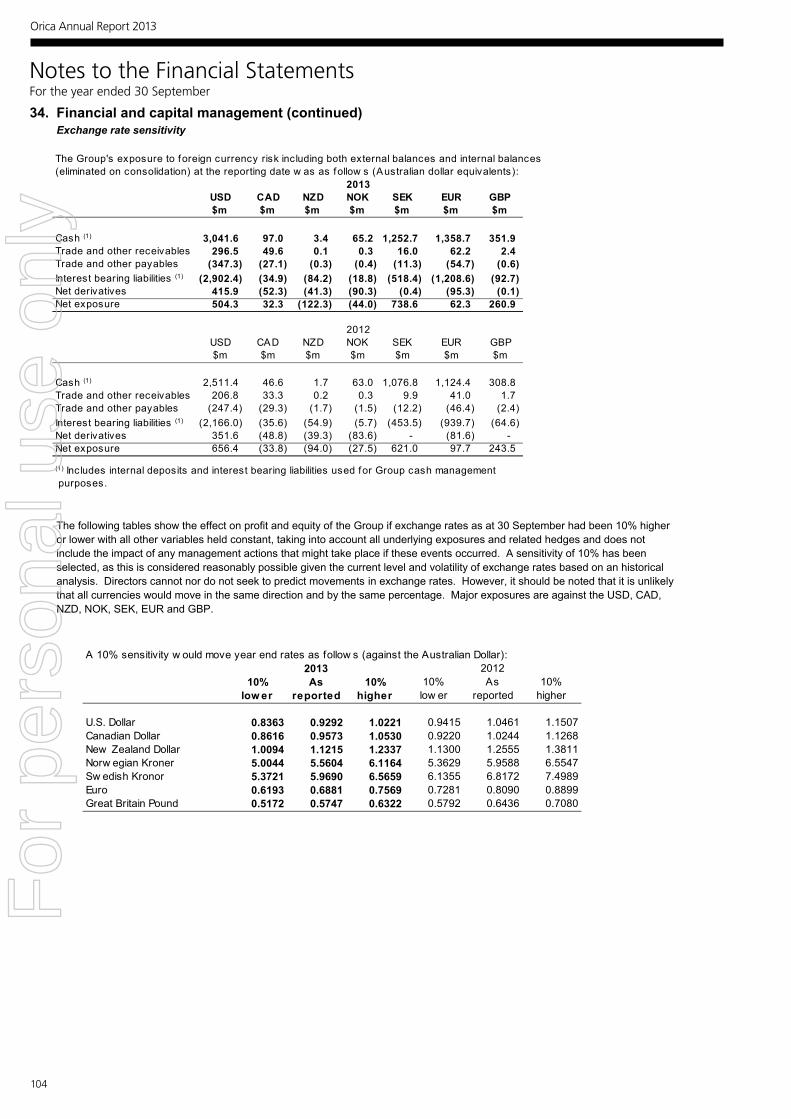
104
Notes to the Financial Statements For the year ended 30 September
Orica Limited 104
34. Financial and capital management (continued) Exchange rate sensitivity
The following tables show the effect on profit and equity of the Group if exchange rates as at 30 September had been 10% higher or lower with all other variables held constant, taking into account all underlying exposures and related hedges and does not include the impact of any management actions that might take place if these events occurred. A sensitivity of 10% has been selected, as this is considered reasonably possible given the current level and volatility of exchange rates based on an historical analysis. Directors cannot nor do not seek to predict movements in exchange rates. However, it should be noted that it is unlikely that all currencies would move in the same direction and by the same percentage. Major exposures are against the USD, CAD, NZD, NOK, SEK, EUR and GBP.
The Group's exposure to foreign currency risk including both external balances and internal balances (eliminated on consolidation) at the reporting date w as as follow s (Australian dollar equivalents):
USD CAD NZD NOK SEK EUR GBP$m $m $m $m $m $m $m
Cash (1) 3,041.6 97.0 3.4 65.2 1,252.7 1,358.7 351.9Trade and other receivables 296.5 49.6 0.1 0.3 16.0 62.2 2.4Trade and other payables (347.3) (27.1) (0.3) (0.4) (11.3) (54.7) (0.6)Interest bearing liabilities (1) (2,902.4) (34.9) (84.2) (18.8) (518.4) (1,208.6) (92.7)Net derivatives 415.9 (52.3) (41.3) (90.3) (0.4) (95.3) (0.1)Net exposure 504.3 32.3 (122.3) (44.0) 738.6 62.3 260.9
USD CAD NZD NOK SEK EUR GBP$m $m $m $m $m $m $m
Cash (1) 2,511.4 46.6 1.7 63.0 1,076.8 1,124.4 308.8Trade and other receivables 206.8 33.3 0.2 0.3 9.9 41.0 1.7Trade and other payables (247.4) (29.3) (1.7) (1.5) (12.2) (46.4) (2.4)Interest bearing liabilities (1) (2,166.0) (35.6) (54.9) (5.7) (453.5) (939.7) (64.6)Net derivatives 351.6 (48.8) (39.3) (83.6) - (81.6) - Net exposure 656.4 (33.8) (94.0) (27.5) 621.0 97.7 243.5
(1) Includes internal deposits and interest bearing liabilities used for Group cash management purposes.
2013
2012
A 10% sensitivity w ould move year end rates as follow s (against the Australian Dollar):
10% As 10% 10% As 10%low er reported higher low er reported higher
U.S. Dollar 0.8363 0.9292 1.0221 0.9415 1.0461 1.1507Canadian Dollar 0.8616 0.9573 1.0530 0.9220 1.0244 1.1268New Zealand Dollar 1.0094 1.1215 1.2337 1.1300 1.2555 1.3811Norw egian Kroner 5.0044 5.5604 6.1164 5.3629 5.9588 6.5547Sw edish Kronor 5.3721 5.9690 6.5659 6.1355 6.8172 7.4989Euro 0.6193 0.6881 0.7569 0.7281 0.8090 0.8899Great Britain Pound 0.5172 0.5747 0.6322 0.5792 0.6436 0.7080
2013 2012
Orica Annual Report 2013
For
per
sona
l use
onl
y

105
Notes to the Financial Statements For the year ended 30 September
Orica Limited 105
34. Financial and capital management (continued)
The ef fect on prof it f rom operations, net prof it af ter tax and shareholders' equity of amovement in individual exchange rates on both external balances and internal balances(eliminated on consolidation) of Cash, Trade and other receivables, Trade and other payables, Interest bearing liabilities and net derivatives at the end of the reporting date w ould be as follow s:
(10%) 10% (10%) 10%$m $m $m $m
Effect on profit/(loss ) from operations from a m ovem ent in:U.S. Dollar (0.8) (1.8) (0.8) (2.0)Canadian Dollar 3.7 (3.0) 0.8 (0.7)New Zealand Dollar (0.6) 0.4 (1.0) 0.8Norw egian Kroner - - (0.2) 0.2Sw edish Kronor 0.5 (0.4) (0.3) 0.3Euro 1.4 (1.4) (0.5) 0.4Great Britain Pound (0.1) 0.1 - -
Effect on ne t profit/(loss ) afte r tax from a m ovem ent in:U.S. Dollar (0.6) (1.3) (0.5) (1.4)Canadian Dollar 2.6 (2.1) 0.6 (0.5)New Zealand Dollar (0.4) 0.3 (0.7) 0.6Norw egian Kroner - - (0.1) 0.1Sw edish Kronor 0.3 (0.2) (0.2) 0.2Euro 1.0 (1.0) (0.4) 0.3Great Britain Pound - - - -
Increase /(decreas e ) on shareholders ' equity from a m ovem ent in:U.S. Dollar 63.9 (49.8) 52.9 (39.2)Canadian Dollar 1.5 (1.2) (2.6) 2.1New Zealand Dollar (4.9) 4.0 (7.3) 5.9Norw egian Kroner (1.9) 1.6 (2.2) 1.8Sw edish Kronor 59.3 (48.5) 48.3 (39.5)Euro 13.8 (11.3) 10.0 (8.0)Great Britain Pound 23.0 (18.8) 18.9 (15.5)
2013 2012
For
per
sona
l use
onl
y

106
Notes to the Financial Statements For the year ended 30 September
Orica Limited 106
34. Financial and capital management (continued) Foreign currency risk - translational Foreign currency earnings translation risk arises primarily as a result of earnings in USD, NZD, NOK, SEK, Chilean Peso (CLP), Mexican Peso (MXN) and CAD being translated into AUD. Derivative contracts to hedge earnings exposures do not qualify for hedge accounting under Accounting Standards. However, Board approved policy allows hedging of this exposure in order to reduce the volatility of full year earnings resulting from changes in exchange rates. At 30 September 2013, the fair value of these derivatives was $nil (2012 $nil). Foreign currency net investment translation risk is managed within policies determined by the Board of Directors. Hedging of exposures is undertaken centrally by the Group’s Treasury department primarily through originating debt in the currency of the foreign operation or by raising debt in a different currency and effectively swapping the debt to the currency of the foreign operation (see below cross currency interest rate swaps under interest rate risk management). The remaining translation exposure is managed, where considered appropriate, through forward foreign exchange derivative instruments or cross currency swaps. Gains and losses resulting from these hedging activities are recorded in the foreign currency translation reserve within the equity section of the balance sheet and offset against the foreign exchange impact resulting from the translation of the net assets of foreign operations. Thirty two percent of the Group’s investment in foreign operations was hedged in this manner as at 30 September 2013 (2012 26.0%). As at reporting date, derivative instruments designated as hedging net investment exposures had a fair value of $108.6 million loss (2012 $81.0 million loss). Credit risk management Credit risk represents the loss that would be recognised if counterparties failed to meet their obligations under a contract or arrangement. The Group has exposure to credit risk on all financial assets included within the balance sheets. For discussion on how this risk in relation to receivables is managed refer to note 8. In regards to credit risk arising from derivatives and cash, this is the credit exposure to financial institutions that are counterparties to derivative contracts and cash deposits, with a positive fair value from Orica’s perspective. As at 30 September 2013, the sum of all contracts with a positive fair value was $12.8 million (2012 $15.7 million). To manage this risk, the Group restricts dealings to highly rated counterparties approved within its credit limit policy. The higher the credit rating of the counterparty, the higher the Group’s allowable exposure is to that counterparty under the policy. The Group does not hold any credit derivatives to offset its credit exposures.
Orica Annual Report 2013
For
per
sona
l use
onl
y

107
Notes to the Financial Statements For the year ended 30 September
Orica Limited 107
34. Financial and capital management (continued)
Liquidity r isk m anagem entLiquidity risk arises f rom the possibility that there w ill be insuf f icient funds available to make payment as and w hen required.The Group manages this risk via: - maintaining an adequate level of undraw n committed facilities in various currencies that can be draw n upon at short notice; - using instruments that are readily tradeable in the f inancial markets; - monitoring duration of long term debt; - spreading, to the extent practicable, the maturity dates of long-term debt facilities; and - comprehensively analysing of all inf low s and outf low s that relate to f inancial assets and liabilities.Facilities available and the amounts draw n and undraw n are as follow s:
2013 2012$m $m
Unsecured bank overdraft facilitiesUnsecured bank overdraf t facilities available 113.7 105.3Amount of facilities undraw n 94.5 97.4Com m itted s tandby and loan facilitiesCommitted standby and loan facilities available 4,232.4 3,724.1Amount of facilities unused 2,114.7 1,505.5
The bank overdraf ts are payable on demand and are subject to an annual review . The repayment dates of the committedstandby and loan facilities range f rom 6 May 2014 to 25 October 2030 (2012 24 October 2012 to 25 October 2030).The contractual maturity of the Groups' f ixed and f loating rate f inancial instruments and derivatives are show n in thetable below . The amounts show n represent the future undiscounted principal and interest cash f low s:
ConsolidatedLe ss
than 1 year
1 to 2 years
2 to 5 years
Over 5 years
Less than 1
year1 to 2 years
2 to 5 years
Over 5 years
$m $m $m $m $m $m $m $mNon-derivative f inancial assets
Cash 225.3 - - - 235.8 - - - Trade and other receivables (1) 1,050.6 97.3 - - 1,035.3 49.6 - -
Derivative f inancial assets 1,271.1 52.4 153.5 427.6 871.2 50.7 137.7 396.9Financial assets 2,547.0 149.7 153.5 427.6 2,142.3 100.3 137.7 396.9
Non-derivative f inancial liabilitiesTrade and other payables (1) 1,235.8 12.3 - - 1,058.9 12.4 - - Bank overdraf ts 19.2 - - - 7.9 - - - Bank loans 5.6 5.6 167.4 - 37.4 540.7 250.2 - Export f inance facility 14.0 13.8 40.2 25.7 1.8 1.8 5.5 96.6Other short term borrow ings 33.4 - - - 6.2 - - - Private placement 82.1 346.6 606.4 1,462.4 100.2 60.3 800.5 858.0Other long term borrow ings - 1.6 1.0 - - 1.7 1.0 - Lease liabilities 1.7 1.3 3.4 1.0 1.3 1.5 3.3 2.1
Derivative f inancial liabilities 1,286.8 58.0 197.0 484.0 878.7 61.2 186.0 470.8Financial liabilities 2,678.6 439.2 1,015.4 1,973.1 2,092.4 679.6 1,246.5 1,427.5
Net outf low (131.6) (289.5) (861.9) (1,545.5) 49.9 (579.3) (1,108.8) (1,030.6)
(1) Excludes derivative f inancial instruments.
As at 30 Septem ber 2013 As at 30 September 2012
For
per
sona
l use
onl
y

108
Notes to the Financial Statements For the year ended 30 September
Orica Limited 108
34. Financial and capital management (continued)
Cash flow hedges Cash flow hedges are used to hedge exposures relating to borrowings and ongoing business activities, where there is a highly probable sale, purchase or settlement commitment in foreign currencies. Foreign exchange transactions The hedging of foreign exchange transactions is described under foreign currency risk above. The fair value of forward exchange contracts and options used as hedges of foreign exchange transactions at 30 September 2013 was a net $2.4 million loss (2012 $1.6 million gain), comprising assets of $11.1 million (2012 $7.0 million) and liabilities of $13.5 million (2012 $5.4 million). Gains and losses recognised in the cash flow hedge reserve on all foreign currency hedges of anticipated purchases and sales and the timing of their anticipated recognition as part of sales or purchases are:
Net deferred (gains)/losses 2013 2012
Term $m $m
Not later than one year (0.2) (0.6) Total (0.2) (0.6) The terms of the forward exchange contracts have been negotiated to match the terms of the commitments. The portion of the gain or loss on the hedging instrument that is determined to be an effective hedge is recognised directly in equity. When the hedged asset or liability affects the Income Statement, the Group transfers the related amount deferred in equity into the Income Statement. Interest rate swap contracts Interest rate or cross currency interest rate swaps are classified as cash flow hedges if they are used to transfer floating rate debt into fixed rate debt and they are stated at fair value. All gains and losses attributable to the hedged risk are taken directly to equity and reclassified into the Income Statement when the interest expense is recognised. All swaps are matched directly against the appropriate loans and interest expense. There was a derivative liability of $13.0 million as at 30 September 2013 (2012 $21.8 million). The notional amounts of interest rate swaps as summarised below represent the contract or face values of these derivatives. The notional amounts do not represent amounts exchanged by the parties. The amounts to be exchanged are net settled and will be calculated with reference to the notional amounts and the pay and receive interest rates determined under the terms of the derivative contracts. Each contract involves quarterly or semi-annual payment or receipt of the net amount of interest: 2013
$m2012
$mFloating to fixed swaps One to five years 350.0 350.0
Fair value hedges Cross currency interest rate and interest rate swap contracts During the period the Group held cross currency interest rate and interest rate swaps to mitigate the Group’s exposure to changes in the fair value of foreign denominated debt from fluctuations in foreign currency and interest rates. The hedged items designated were a portion of the Group’s foreign currency denominated borrowings. The changes in the fair values of the hedged items resulting from movements in exchange rates and interest rates are offset against the changes in the value of the cross currency interest rate and interest rate swaps. The objective of this hedging is to convert foreign currency borrowings to floating rate Australian dollar borrowings. For the Group, re-measurement of the hedged items resulted in a loss before tax of $25.5 million (2012 $20.8 million gain) and the changes in the fair value of the hedging instruments resulted in a gain before tax of $25.5 million (2012 $20.0 million loss) resulting in a net gain before tax of $nil million (2012 $0.8 million gain) recorded in finance costs. The fair value of these swaps at 30 September 2013 was $66.7 million (2012 $39.3 million), comprising assets of $86.8 million (2012 $84.0 million) and liabilities of $20.1 million (2012 $44.7 million). Derivatives not designated in a hedging relationship Certain derivative instruments do not qualify for hedge accounting, despite being commercially valid economic hedges of the relevant risks. Changes in the fair value of any derivative instruments that do not qualify for hedge accounting are recognised immediately in the Income Statement (for example, changes in the fair value of vanilla bought European options used to hedge translation of foreign earnings).
Orica Annual Report 2013
For
per
sona
l use
onl
y

109
Notes to the Financial Statements For the year ended 30 September
Orica Limited 109
34. Financial and capital management (continued) Interest rate swaps The change in fair value of swaps executed as economic hedges for which hedge accounting was not applied was nil for the financial year ending 30 September 2013 (2012 nil). Fair values of derivatives The carrying value of derivatives disclosed in notes 12 and 16 equal their fair values. Valuation techniques include where applicable, reference to prices quoted in active markets, discounted cash flow analysis, fair value of recent arm’s length transactions involving the same instruments or other instruments that are substantially the same, and option pricing models. The fair value of forward exchange contracts are calculated by reference to forward exchange market rates for contracts within similar maturity profiles at the time of valuation. The fair values of cross currency interest rate swaps and interest rate swaps and other financial liabilities measured at fair value are determined using valuation techniques which utilise data from observable markets. Assumptions are based on market conditions existing at each balance date. The fair value is calculated as the present value of the estimated future cash flows using an appropriate market based yield curve, which is independently derived and representative of Orica’s cost of borrowings. Fair value hierarchy
- Level 1: quoted prices (unadjusted) in active market for identical assets or liabilities;- Level 2: inputs other than quoted prices included w ithin Level 1 that are observable for the asset or liability,either directly (i.e., as prices) or indirectly (i.e., derived f rom prices); and- Level 3: inputs for the asset or liability that are not based on observable market data (unobservable inputs).
Leve l 1 Leve l 2 Leve l 3 Total30 Septem ber 2013 $m $m $m $m
Derivative f inancial assets - 12.8 - 12.8Derivative f inancial liabilities - (75.2) - (75.2)
- (62.4) - (62.4)
30 Septem ber 2012
Derivative f inancial assets - 15.7 - 15.7Derivative f inancial liabilities - (84.1) - (84.1)
- (68.4) - (68.4)
During the current and previous year there w ere no transfers betw een the fair value hierarchy levels.
The table below analyses f inancial instruments carried at fair value, by valuation method. The dif ferent levels have been def ined as follow s:
For
per
sona
l use
onl
y

110
Notes to the Financial Statements For the year ended 30 September
Orica Limited
110
35. Events subsequent to balance date On 11 November 2013, the directors declared a final dividend of 55.0 cents per ordinary share payable on 13 December 2013. The financial effect of this dividend is not included in the financial statements for the year ended 30 September 2013 and will be recognised in the 2014 financial statements. The directors have not become aware of any other significant matter or circumstance that has arisen since 30 September 2013, that has affected or may affect the operations of the consolidated entity, the results of those operations, or the state of affairs of the consolidated entity in subsequent years, which has not been covered in this report.
Orica Annual Report 2013
For
per
sona
l use
onl
y

111
Notes to the Financial Statements For the year ended 30 September
Orica Limited
111
36. Employee share plans Employees’ options entitlement Other than the LTEIP shares which are treated as options for accounting purposes, the Long Term Incentive Rights Plan (LTIRP), the Sign-on and the Retention Rights Plans, there are no other options over Orica shares outstanding at 30 September 2012 or 30 September 2013. (a) (i) Long Term Incentive Rights Plan (LTIRP) In financial year 2012 LTIRP was adopted as the long term incentive component of remuneration for senior executives (excluding the Executive Committee) selected by the Board based on the role of the individual in guiding the future success of the Company. Invitations to participate in LTIRP are made on the following basis: Senior executives are granted a number of rights, which vest upon the satisfaction of the relevant performance hurdle. The
number of rights granted to each employee is based on a specified percentage in the range of 15% to 60% of their fixed remuneration, depending on the individual’s role and responsibility.
Each right is an entitlement to be allocated one ordinary share in Orica (or such other number adjusted in accordance with the terms of the LTIRP rules).
Rights are unlisted and do not carry any dividend or voting rights. Shares allocated upon vesting of rights may be either newly issued shares or existing shares acquired on market. As the LTIRP is offered to senior executives below the Executive Committee level, it was considered more appropriate to set
a single hurdle representing a minimum level of acceptable performance before vesting should occur, rather than the aggressive conditions applicable to LTEIP. The relevant performance hurdle is based on Orica achieving 2% EPS compound growth per annum over three years.
Holders of rights that leave the consolidated entity prior to the end of the performance period will, in general, forfeit their rights. The Board has discretion to allow a number of rights to be tested and vest if the holder leaves due to death, disability or other Board approved reasons.
The fair value of these long term incentives are expensed over the three year vesting period. The number of LTIRP issued, values and related information is shown in the following table:
Grant date
Vesting date
Number of rights
issued
Number of rights held at
30 September 2013
Number of rights held at
30 September 2012
Number of participants
at 30 September
2013
Number of participants
at 30 September
2012
Value of rights at grant date (1)
$ 19 Dec 11 19 Dec 14 664,845 559,643 649,165 279 310 14,586,699 19 Dec 12 19 Dec 15 717,397 643,316 - 291 - 15,754,038 1 April 13 19 Dec 15 24,293 24,293 - 5 - 533,960 1,406,535 1,227,252 649,165 575 310 30,874,697
(1) The assumptions underlying the rights valuations are:
Grant date
Price of Orica Shares
at grant date $
Expected volatility in
share price%
Dividends expected on shares
%
Risk free interest
rate %
Fair value per right (2)
$ 19 Dec 11 24.68 25 4 2.99 21.9419 Dec 12 24.70 25 4 2.77 21.961 April 13 24.45 25 4 2.88 21.98
(2) The option valuations prepared by PwC use methodologies consistent with assumptions that apply under an adjusted form of the Black Scholes option pricing model and reflect the value (as at grant date) of options held at 30 September. The assumptions underlying the option valuations are: (a) the exercise price of the option, (b) the life of the option, (c) the current price of the underlying securities, (d) the expected volatility of the share price, (e) the dividends expected on the shares, and (f) the risk-free interest rate for the life of the option.
For
per
sona
l use
onl
y

112
Notes to the Financial Statements For the year ended 30 September
Orica Limited
112
36. Employee share plans (continued) (a) (ii) Sign-on Rights Allocations For a select group of senior managers who join Orica post allocation of a LTIRP grant (and generally having forgone at-risk remuneration from their previous employer) rights may be allocated at the discretion of the Orica Board. Allocations are made on the following basis: Employees are granted a number of rights, which vest upon the satisfaction of a time based hurdle, generally aligned to their
anniversary of joining Orica. The number of rights granted to each employee is based on either a specified percentage of their fixed remuneration, or a
straight dollar value. The value is determined on an individual basis, but generally aligned to either their future LTIRP grant percentage or the foregone at-risk remuneration from their previous employer.
Each right is an entitlement to be allocated one ordinary share in Orica. Rights are unlisted and do not carry any dividend or voting rights. Shares allocated upon vesting of rights may be either newly issued shares or existing shares acquired on market. Holders of rights that leave the consolidated entity prior to the end of the performance period will, in general, forfeit their
rights. The Board has discretion to allow a number of rights to be tested and vest if the holder leaves due to death, disability or other Board approved reason.
Sign-on Rights allocations, values and related information is shown in the following table: Grant date
Vesting date
Number of rights
issued
Number of rights held at
30 September 2013
Number of rights held at
30 September 2012
Number of
participants at 30 September
2013
Number of
participants at 30 September
2012
Value of rights at grant date (1)
$ 19 Dec 11 30 Nov 13 7,942 7,942 7,942 1 1 181,554 1 Sep 12 1 Sep 13 6,148 - 6,148 - 1 143,064 15 Oct 12 30 Jun 13 4,885 - - - - 121,197 11 Mar 13 4 Mar 14 3,835 3,835 - 1 - 95,492 11 Mar 13 4 Mar 15 3,836 3,836 - 1 - 91,872 26,646 15,613 14,090 3 2 633,179
(1) The assumptions underlying the rights valuations are:
Grant date
Price of Orica Shares
at grant date $
Expected volatility in
share price%
Dividends expected on shares
%
Risk free interest
rate %
Fair value per right(2)
$ 19 Dec 11 24.68 25 4 3.13 22.86
1 Sep 12 24.20 25 4 2.86 23.2715 Oct 12 25.51 25 4 2.58 24.8111 Mar 13 25.90 25 4 2.88 24.9011 Mar 13 25.90 25 4 2.90 23.95
(2) The option valuations prepared by PwC use methodologies consistent with assumptions that apply under an adjusted form of the Black Scholes option pricing model and reflect the value (as at grant date) of options held at 30 September. The assumptions underlying the option valuations are: (a) the exercise price of the option, (b) the life of the option, (c) the current price of the underlying securities, (d) the expected volatility of the share price, (e) the dividends expected on the shares, and (f) the risk-free interest rate for the life of the option.
Orica Annual Report 2013
For
per
sona
l use
onl
y

113
Notes to the Financial Statements For the year ended 30 September
Orica Limited
113
36. Employee share plans (continued) (b) (i) General Employee Exempt Share Plan - Australia The General Employee Exempt Share Plan (GEESP) has operated since 1998. It is administered by Link Market Services Limited. Invitations are made to eligible employees as determined by the Board on the following basis: shares acquired are either newly issued shares or existing shares acquired on market; employees are each entitled to acquire shares with a market value of approximately $1,000 per year; employees salary sacrifice the value of the shares by equal twelve monthly deductions since the date of acquisition; employees who leave the consolidated entity must salary sacrifice any remaining amount prior to departure; and employees cannot dispose of the shares for a period of three years from date of acquisition or until they leave their
employment with the consolidated entity, whichever occurs first.
Grant date
Date shares
become unrestricted
Number of participants at30 September
2013
Number of participants at 30 September
2012
Shares held at 30 September
2013
Shares held at 30 September
2012 10 Jan 11 10 Jan 14 1,155 1,248 45,045 48,672
9 Jan 12 9 Jan 15 1,247 1,352 51,127 55,432 8 Jan 13 8 Jan 16 1,375 - 52,250 -
148,422 104,104 (b) (ii) General Employee Exempt Share Plan - New Zealand A separate GEESP has operated for New Zealand employees since 1999. It is administered internally. Invitations are made to eligible employees as determined by the Board on the following basis: shares acquired are either newly issued shares or existing shares acquired on market; employees are each entitled to acquire shares with a market value of approximately NZ$780 per year; employees salary sacrifice the value of the shares by equal deductions between the date of acquisition and 30 September
the following year; employees who leave the consolidated entity because of redundancy, retirement or sickness, have the option to salary
sacrifice any remaining amounts prior to departure, if they wish to retain their shares; employees who leave the consolidated entity because of resignation, will be paid the market value of the shares in proportion
to their contributions to date; and employees cannot dispose of the shares for a period of three years from date of acquisition or until they leave their
employment with the consolidated entity and they are entitled to retain their shares, whichever occurs first. After the period of three years, employees may submit a Notice of Withdrawal to release some or all of their shares.
Grant date
Date shares
become unrestricted
Number of participants at 30 September
2013
Number of participants at 30 September
2012
Shares held at 30 September
2013
Shares held at 30 September
2012 1 Oct 09 30 Sept 12 33 63 858 1,638 1 Oct 10 30 Sept 13 63 75 1,449 1,725 1 Oct 11 30 Sept 14 63 80 1,701 2,160 1 Oct 12 30 Sept 15 80 - 1,920 -
5,928 5,523
For
per
sona
l use
onl
y

114
Notes to the Financial Statements For the year ended 30 September
Orica Limited
114
37. Related party disclosures (a) Key Management Personnel compensation summary As deemed under AASB 124 Related Parties Disclosures, Key Management Personnel (KMP) include each of the directors, both executive and non-executive, and those members of the Executive Committee who have authority and responsibility for planning, directing and controlling the activities of Orica. In this report, “Executive KMP” refers to the KMP other than the Non-Executive Directors. Non–Executive Directors have oversight of the strategic direction of the Group but no direct involvement in the day to day management of the business. A summary of the Key Management Personnel compensation is set out in the following table:
Consolidated 2013
$000 2012 $000
Short term employee benefits 13,271.2 10,689.2 Other long term benefits 189.5 273.8 Post employment benefits 226.2 213.3 Share-based payments 5,452.8 6,947.3 Termination benefits 2,416.8 3,806.6 21,556.5 21,930.2
Information regarding individual directors and executives compensation and some equity instruments disclosure as permitted by Corporation Regulation 2M.3.03 is provided in the remuneration report section of the directors’ report. (b) Key Management Personnel’s transactions in shares and options The relevant interests of Key Management Personnel in the share capital of the consolidated entity are:
As at 30 September 2013
Balance1 October
2012 Acquired (1)
Netchangeother (2)
Fully paid ordinary shares held at 30 September
2013 (3)
Non-Executive Directors P J Duncan 15,936 - - 15,936M N Brenner * - - - -A Calderon * - - - -R R Caplan 11,291 6,989 - 18,280I Cockerill 6,094 137 - 6,231Lim C O 11,000 - - 11,000N L Scheinkestel 21,126 3,265 - 24,391G T Tilbrook * - 4,000 - 4,000M Tilley 6,329 - - 6,329Former G A Hounsell ** 12,359 273 - 12,632 84,135 14,664 - 98,799 As at 30 September 2012
Balance
1 October 2011 Acquired (1)
Net changeother (2)
Fully paid ordinary shares held at 30 September
2012 (3)
Non-Executive Directors P J Duncan 15,936 - - 15,936R R Caplan 8,825 2,466 - 11,291I Cockerill 6,000 94 - 6,094G A Hounsell 11,918 441 - 12,359Lim C O 1,000 10,000 - 11,000N L Scheinkestel 18,032 3,094 - 21,126M Tilley 6,329 - - 6,329Former M E Beckett ** 78,235 1,700 - 79,935 146,275 17,795 - 164,070* M N Brenner was appointed as a director on 8 April 2013. A Calderon and G T Tilbrook were appointed as directors on 14 August 2013. ** Closing balance is at cessation of directorship.
Orica Annual Report 2013
For
per
sona
l use
onl
y
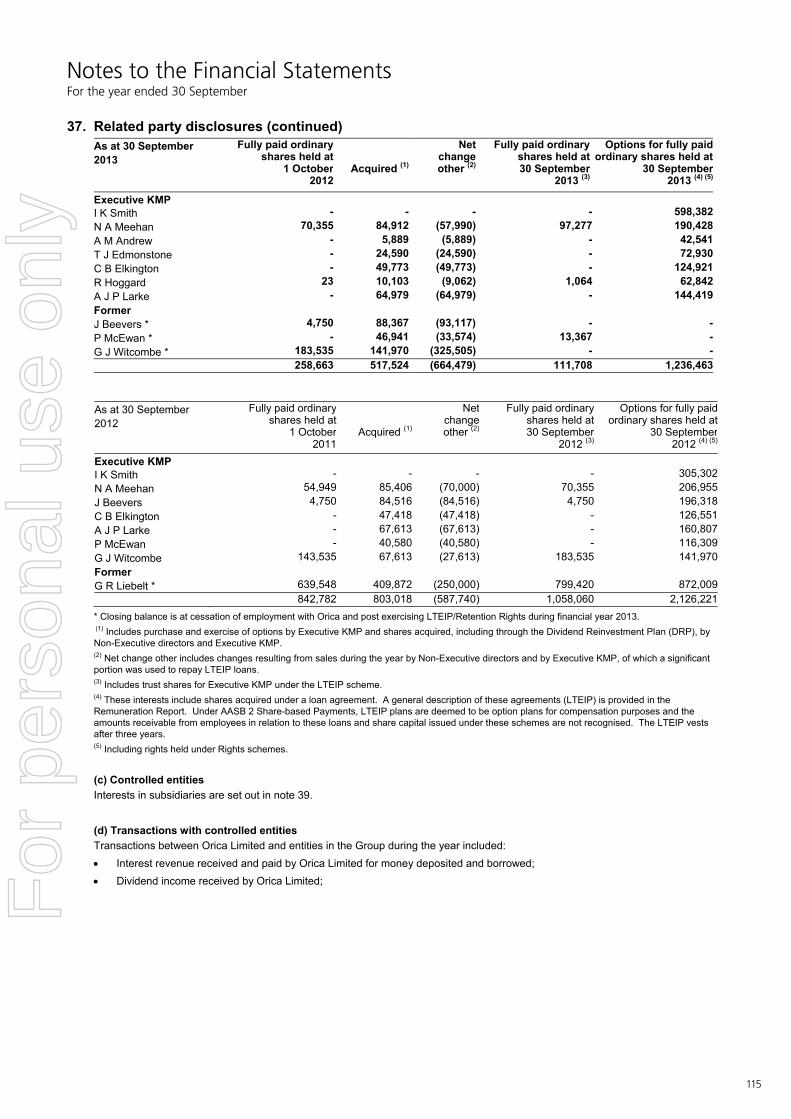
115
Notes to the Financial Statements For the year ended 30 September
Orica Limited
115
37. Related party disclosures (continued) As at 30 September 2013
Fully paid ordinary shares held at
1 October2012
Acquired (1)
Netchangeother (2)
Fully paid ordinary shares held at 30 September
2013 (3)
Options for fully paidordinary shares held at
30 September 2013 (4) (5)
Executive KMP I K Smith - - - - 598,382N A Meehan 70,355 84,912 (57,990) 97,277 190,428A M Andrew - 5,889 (5,889) - 42,541T J Edmonstone - 24,590 (24,590) - 72,930C B Elkington - 49,773 (49,773) - 124,921R Hoggard 23 10,103 (9,062) 1,064 62,842A J P Larke - 64,979 (64,979) - 144,419Former J Beevers * 4,750 88,367 (93,117) - -P McEwan * - 46,941 (33,574) 13,367 -G J Witcombe * 183,535 141,970 (325,505) - - 258,663 517,524 (664,479) 111,708 1,236,463 As at 30 September 2012
Fully paid ordinaryshares held at
1 October 2011
Acquired (1)
Net changeother (2)
Fully paid ordinary shares held at
30 September 2012 (3)
Options for fully paidordinary shares held at
30 September 2012 (4) (5)
Executive KMP I K Smith - - - - 305,302N A Meehan 54,949 85,406 (70,000) 70,355 206,955J Beevers 4,750 84,516 (84,516) 4,750 196,318C B Elkington - 47,418 (47,418) - 126,551A J P Larke - 67,613 (67,613) - 160,807P McEwan - 40,580 (40,580) - 116,309G J Witcombe 143,535 67,613 (27,613) 183,535 141,970Former G R Liebelt * 639,548 409,872 (250,000) 799,420 872,009 842,782 803,018 (587,740) 1,058,060 2,126,221* Closing balance is at cessation of employment with Orica and post exercising LTEIP/Retention Rights during financial year 2013. (1) Includes purchase and exercise of options by Executive KMP and shares acquired, including through the Dividend Reinvestment Plan (DRP), by Non-Executive directors and Executive KMP. (2) Net change other includes changes resulting from sales during the year by Non-Executive directors and by Executive KMP, of which a significant portion was used to repay LTEIP loans. (3) Includes trust shares for Executive KMP under the LTEIP scheme. (4) These interests include shares acquired under a loan agreement. A general description of these agreements (LTEIP) is provided in the Remuneration Report. Under AASB 2 Share-based Payments, LTEIP plans are deemed to be option plans for compensation purposes and the amounts receivable from employees in relation to these loans and share capital issued under these schemes are not recognised. The LTEIP vests after three years. (5) Including rights held under Rights schemes.
(c) Controlled entities Interests in subsidiaries are set out in note 39. (d) Transactions with controlled entities Transactions between Orica Limited and entities in the Group during the year included: Interest revenue received and paid by Orica Limited for money deposited and borrowed; Dividend income received by Orica Limited;
For
per
sona
l use
onl
y
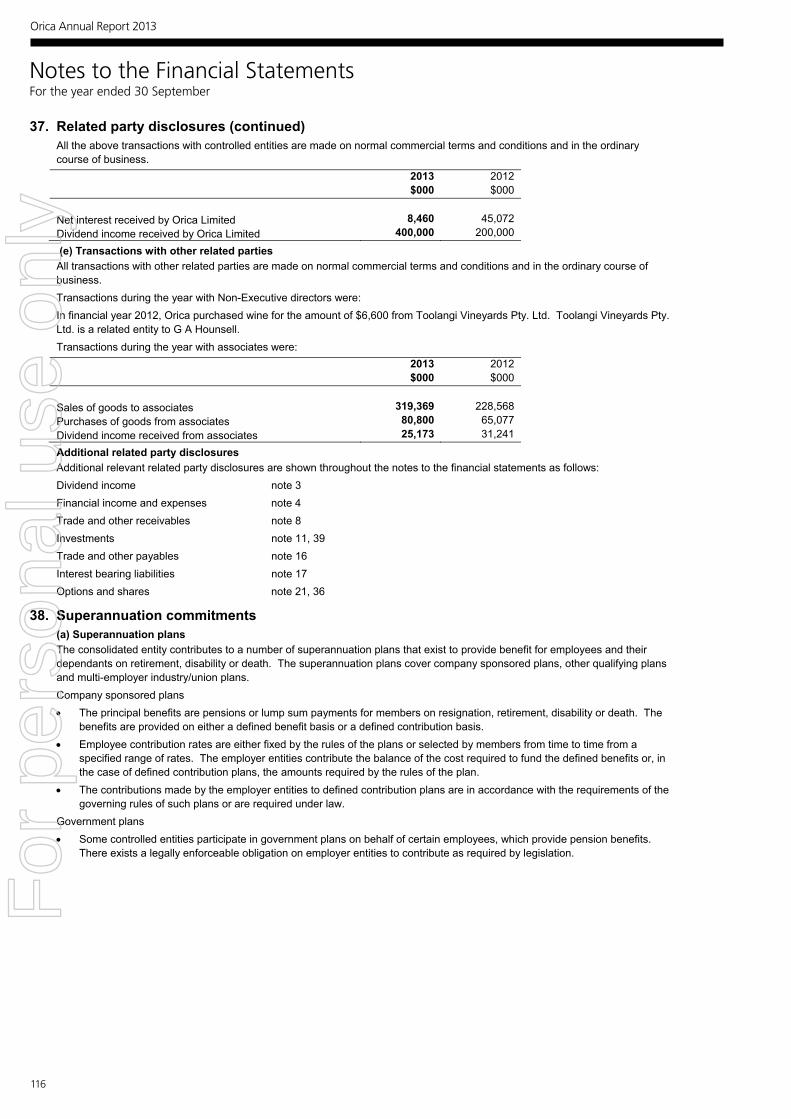
116
Notes to the Financial Statements For the year ended 30 September
Orica Limited
116
37. Related party disclosures (continued) All the above transactions with controlled entities are made on normal commercial terms and conditions and in the ordinary course of business.
2013 2012 $000 $000 Net interest received by Orica Limited 8,460 45,072 Dividend income received by Orica Limited 400,000 200,000
(e) Transactions with other related parties All transactions with other related parties are made on normal commercial terms and conditions and in the ordinary course of business. Transactions during the year with Non-Executive directors were: In financial year 2012, Orica purchased wine for the amount of $6,600 from Toolangi Vineyards Pty. Ltd. Toolangi Vineyards Pty. Ltd. is a related entity to G A Hounsell. Transactions during the year with associates were:
2013 2012 $000 $000 Sales of goods to associates 319,369 228,568 Purchases of goods from associates 80,800 65,077 Dividend income received from associates 25,173 31,241
Additional related party disclosures Additional relevant related party disclosures are shown throughout the notes to the financial statements as follows: Dividend income note 3 Financial income and expenses note 4 Trade and other receivables note 8 Investments note 11, 39 Trade and other payables note 16 Interest bearing liabilities note 17 Options and shares note 21, 36
38. Superannuation commitments (a) Superannuation plans The consolidated entity contributes to a number of superannuation plans that exist to provide benefit for employees and their dependants on retirement, disability or death. The superannuation plans cover company sponsored plans, other qualifying plans and multi-employer industry/union plans. Company sponsored plans The principal benefits are pensions or lump sum payments for members on resignation, retirement, disability or death. The
benefits are provided on either a defined benefit basis or a defined contribution basis. Employee contribution rates are either fixed by the rules of the plans or selected by members from time to time from a
specified range of rates. The employer entities contribute the balance of the cost required to fund the defined benefits or, in the case of defined contribution plans, the amounts required by the rules of the plan.
The contributions made by the employer entities to defined contribution plans are in accordance with the requirements of the governing rules of such plans or are required under law.
Government plans Some controlled entities participate in government plans on behalf of certain employees, which provide pension benefits.
There exists a legally enforceable obligation on employer entities to contribute as required by legislation.
Orica Annual Report 2013
For
per
sona
l use
onl
y
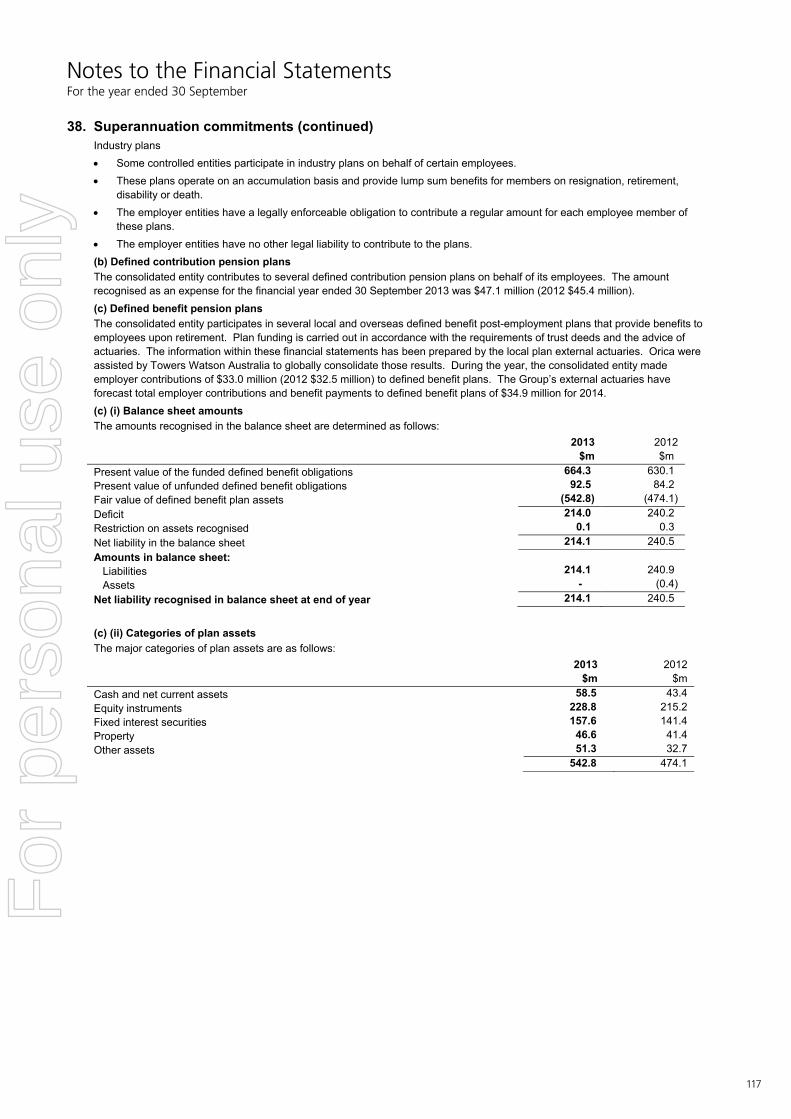
117
Notes to the Financial Statements For the year ended 30 September
Orica Limited
117
38. Superannuation commitments (continued) Industry plans Some controlled entities participate in industry plans on behalf of certain employees. These plans operate on an accumulation basis and provide lump sum benefits for members on resignation, retirement,
disability or death. The employer entities have a legally enforceable obligation to contribute a regular amount for each employee member of
these plans. The employer entities have no other legal liability to contribute to the plans. (b) Defined contribution pension plans The consolidated entity contributes to several defined contribution pension plans on behalf of its employees. The amount recognised as an expense for the financial year ended 30 September 2013 was $47.1 million (2012 $45.4 million). (c) Defined benefit pension plans The consolidated entity participates in several local and overseas defined benefit post-employment plans that provide benefits to employees upon retirement. Plan funding is carried out in accordance with the requirements of trust deeds and the advice of actuaries. The information within these financial statements has been prepared by the local plan external actuaries. Orica were assisted by Towers Watson Australia to globally consolidate those results. During the year, the consolidated entity made employer contributions of $33.0 million (2012 $32.5 million) to defined benefit plans. The Group’s external actuaries have forecast total employer contributions and benefit payments to defined benefit plans of $34.9 million for 2014. (c) (i) Balance sheet amounts The amounts recognised in the balance sheet are determined as follows: 2013 2012 $m $m Present value of the funded defined benefit obligations 664.3 630.1 Present value of unfunded defined benefit obligations 92.5 84.2 Fair value of defined benefit plan assets (542.8) (474.1) Deficit 214.0 240.2 Restriction on assets recognised 0.1 0.3 Net liability in the balance sheet 214.1 240.5 Amounts in balance sheet: Liabilities 214.1 240.9 Assets - (0.4) Net liability recognised in balance sheet at end of year 214.1 240.5
(c) (ii) Categories of plan assets The major categories of plan assets are as follows: 2013 2012 $m $m Cash and net current assets 58.5 43.4 Equity instruments 228.8 215.2 Fixed interest securities 157.6 141.4 Property 46.6 41.4 Other assets 51.3 32.7 542.8 474.1
For
per
sona
l use
onl
y

118
Notes to the Financial Statements For the year ended 30 September
Orica Limited
118
38. Superannuation commitments (continued) c) (iii) Reconciliations 2013 2012 $m $m Reconciliation of present value of the defined benefit obligations: Balance at the beginning of the year 714.3 642.2 Current service cost 16.9 14.3 Interest cost 28.1 27.9 Actuarial (gains)/losses (8.5) 72.7 Contributions by plan participants 2.9 3.3 Benefits paid (32.4) (35.5) Settlements/curtailments (0.9) (0.1) Exchange differences on foreign funds 36.4 (10.5) Balance at the end of the year 756.8 714.3 Reconciliation of the fair value of the plan assets: Balance at the beginning of the year 474.1 437.3 Expected return on plan assets 30.7 29.4 Actuarial gains 16.2 13.9 Contributions by plan participants 2.9 3.3 Contributions by employer 33.0 32.5 Benefits paid (32.4) (35.5) Settlements/curtailments (0.9) (0.8) Exchange differences on foreign funds 19.2 (6.0) Balance at the end of the year 542.8 474.1 The fair value of plan assets does not include any amounts relating to the consolidated entity’s own financial instruments, property occupied by, or other assets used by, the consolidated entity. (c) (iv) Amounts recognised in the income statement The amounts recognised in the income statement are as follows: 2013 2012 $m $m Current service cost 16.9 14.3 Interest cost 28.1 27.9 Expected return on plan assets (30.7) (29.4) Curtailment or settlement losses - 0.7 Total included in employee benefits expense 14.3 13.5 (c) (v) Principal actuarial assumptions The principal actuarial assumptions used were as follows: 2013 2012 Discount rate 2.43% - 10.83% 2.25% - 9.20% Expected return on plan assets 4.00% - 9.62% 4.00% - 9.62% Future salary increases 2.25% - 8.00% 2.25% - 7.00% Future inflation 1.75% - 5.20% 1.75% - 4.50% Future pension increases 0.10% - 5.20% 0.10% - 4.50% Healthcare cost trend rates (ultimate) 4.40% - 4.50% 4.40% - 4.50%
Orica Annual Report 2013
For
per
sona
l use
onl
y

119
Notes to the Financial Statements For the year ended 30 September
Orica Limited
119
38. Superannuation commitments (continued) A one percentage point change in assumed healthcare cost trend rates would have the following effects: One
percentage point
increase $m
One percentage
point decrease
$m Effect on the aggregate of the service cost and interest cost 0.4 (0.3)Effect on the defined benefit obligation 3.5 (2.8) (c) (vi) Historic summary Amounts for the current and previous periods are as follows: 2013 2012 2011 2010 2009 $m $m $m $m $mDefined benefit plan obligation 756.8 714.3 642.2 631.8 715.7Plan assets (542.8) (474.1) (437.3) (439.0) (545.8)Restriction on assets recognised 0.1 0.3 1.1 4.9 2.9Deficit 214.1 240.5 206.0 197.7 172.8 Experience adjustments arising on plan liabilities - loss/(gain) 14.9 5.5 (4.7) 8.8 (7.5)Experience adjustments arising on plan assets - gain/(loss) 16.2 14.2 (20.8) (8.4) (61.4)Actual return on plan assets 46.9 43.6 9.0 26.8 (19.2) (c) (vii) Amounts included in the statement of comprehensive income 2013 2012 $m $m Net actuarial gains/(losses) 24.7 (58.8) Change in the effect of asset ceiling 0.2 0.8 Total gains/(losses) recognised via the Statement of Comprehensive Income 24.9 (58.0) Tax (expense)/benefit on total gains/(losses) recognised via the Statement of Comprehensive Income
(7.7) 16.5
Total gains/(losses) after tax recognised via the Statement of Comprehensive Income 17.2 (41.5)
The consolidated entity has elected under AASB 119 Employee Benefits, to recognise all actuarial gains/losses in the Statement of Comprehensive Income. The cumulative amount of net actuarial losses/gains (before tax) included in the Statement of Comprehensive Income as at 30 September 2013 is $174.3 million - loss (2012 $199.2 million - loss). (c) (viii) Expected rate of return on assets assumption The overall expected rate of return on assets assumption is determined by weighting the expected long-term rate of return for each asset class by the target allocation of plan assets to each class. The rates of return used for each class are net of investment tax and investment fees and are used in calculating the employee benefits expense. Starting 1 October 2013, the expected rate of return on assets will no longer be used to determine employee benefits expense, as it is replaced by interest income on assets, calculated using the discount rate, in accordance with the revisions to AASB 119 (refer to (c) (ix)).
For
per
sona
l use
onl
y
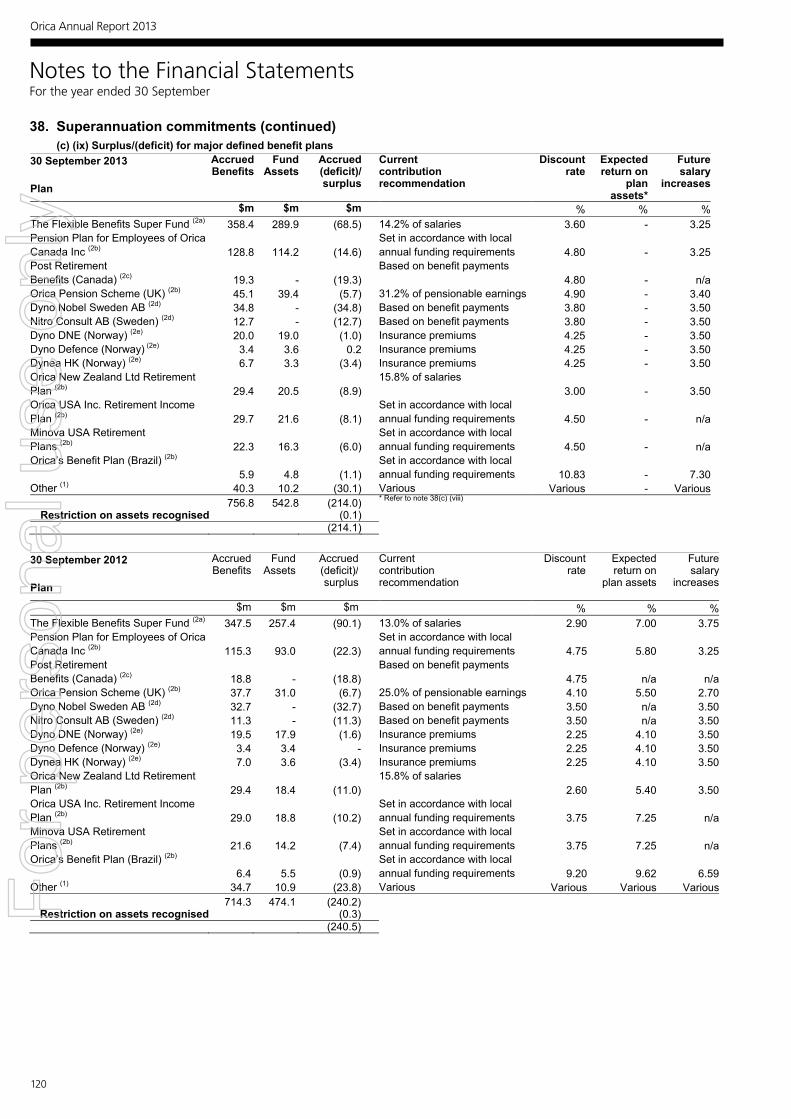
120
Notes to the Financial Statements For the year ended 30 September
Orica Limited
120
38. Superannuation commitments (continued) (c) (ix) Surplus/(deficit) for major defined benefit plans
30 September 2013 Plan
Accrued Benefits
Fund Assets
Accrued (deficit)/surplus
Currentcontribution recommendation
Discount rate
Expected return on
plan assets*
Future salary
increases
$m $m $m % % %The Flexible Benefits Super Fund (2a) 358.4 289.9 (68.5) 14.2% of salaries 3.60 - 3.25Pension Plan for Employees of Orica Canada Inc (2b) 128.8 114.2 (14.6)
Set in accordance with local annual funding requirements 4.80 - 3.25
Post Retirement Benefits (Canada) (2c) 19.3 - (19.3)
Based on benefit payments 4.80 - n/a
Orica Pension Scheme (UK) (2b) 45.1 39.4 (5.7) 31.2% of pensionable earnings 4.90 - 3.40Dyno Nobel Sweden AB (2d) 34.8 - (34.8) Based on benefit payments 3.80 - 3.50Nitro Consult AB (Sweden) (2d) 12.7 - (12.7) Based on benefit payments 3.80 - 3.50Dyno DNE (Norway) (2e) 20.0 19.0 (1.0) Insurance premiums 4.25 - 3.50Dyno Defence (Norway) (2e) 3.4 3.6 0.2 Insurance premiums 4.25 - 3.50Dynea HK (Norway) (2e) 6.7 3.3 (3.4) Insurance premiums 4.25 - 3.50Orica New Zealand Ltd Retirement Plan (2b) 29.4 20.5 (8.9)
15.8% of salaries 3.00 - 3.50
Orica USA Inc. Retirement Income Plan (2b) 29.7 21.6 (8.1)
Set in accordance with local annual funding requirements 4.50 - n/a
Minova USA Retirement Plans (2b) 22.3 16.3 (6.0)
Set in accordance with local annual funding requirements 4.50 - n/a
Orica’s Benefit Plan (Brazil) (2b) 5.9 4.8 (1.1)
Set in accordance with local annual funding requirements 10.83 - 7.30
Other (1) 40.3 10.2 (30.1) Various Various - Various756.8 542.8 (214.0) * Refer to note 38(c) (viii)
Restriction on assets recognised (0.1)(214.1)
30 September 2012 Plan
Accrued Benefits
Fund Assets
Accrued (deficit)/surplus
Current contribution recommendation
Discount rate
Expected return on
plan assets
Future salary
increases
$m $m $m % % %The Flexible Benefits Super Fund (2a) 347.5 257.4 (90.1) 13.0% of salaries 2.90 7.00 3.75Pension Plan for Employees of Orica Canada Inc (2b) 115.3 93.0 (22.3)
Set in accordance with local annual funding requirements 4.75 5.80 3.25
Post Retirement Benefits (Canada) (2c) 18.8 - (18.8)
Based on benefit payments 4.75 n/a n/a
Orica Pension Scheme (UK) (2b) 37.7 31.0 (6.7) 25.0% of pensionable earnings 4.10 5.50 2.70Dyno Nobel Sweden AB (2d) 32.7 - (32.7) Based on benefit payments 3.50 n/a 3.50Nitro Consult AB (Sweden) (2d) 11.3 - (11.3) Based on benefit payments 3.50 n/a 3.50Dyno DNE (Norway) (2e) 19.5 17.9 (1.6) Insurance premiums 2.25 4.10 3.50Dyno Defence (Norway) (2e) 3.4 3.4 - Insurance premiums 2.25 4.10 3.50Dynea HK (Norway) (2e) 7.0 3.6 (3.4) Insurance premiums 2.25 4.10 3.50Orica New Zealand Ltd Retirement Plan (2b) 29.4 18.4 (11.0)
15.8% of salaries 2.60 5.40 3.50
Orica USA Inc. Retirement Income Plan (2b) 29.0 18.8 (10.2)
Set in accordance with local annual funding requirements 3.75 7.25 n/a
Minova USA Retirement Plans (2b) 21.6 14.2 (7.4)
Set in accordance with local annual funding requirements 3.75 7.25 n/a
Orica’s Benefit Plan (Brazil) (2b) 6.4 5.5 (0.9)
Set in accordance with local annual funding requirements 9.20 9.62 6.59
Other (1) 34.7 10.9 (23.8) Various Various Various Various714.3 474.1 (240.2)
Restriction on assets recognised (0.3) (240.5)
Orica Annual Report 2013
For
per
sona
l use
onl
y
121
Notes to the Financial Statements For the year ended 30 September
Orica Limited
121
38. Superannuation commitments (continued) (1) Other international plans comprise the following:
Dyno Nobel HK (Norway)
Dyno Nobel Retirement Plans (Mexico)
Eurodyn (Europe)
Excess Plan (Canada)
High Income Earners Arrangement (Canada)
Indian Explosives Limited Employees Management Staff Superannuation
Indian Explosives Limited Employees Superannuation Fund
Indian Explosives Limited Gratuity Fund
Indian Explosives Limited Management Staff Leave Encashment Scheme
Indian Explosives Limited Management Staff Pension (DB) Fund
Indian Explosives Limited Non-Management Staff Leave Encashment Scheme
International Pension Plan (Canada & Australia)
Jubilee (Europe)
Minova Carbotech Pension Plans (Germany)
Minova Holding Pension Plans (Germany)
Old Age Part-time Program (Incentives for Early Retirement) (Europe)
Orica Belgium
Orica Europe GmbH & Co. KG
Orica Germany
Orica USA Inc. Retiree Medical Plan
Philippine Explosives Corporation Factory Workers Retirement Plan
Philippine Explosives Corporation Monthly-Paid Employees Retirement Plan
Self-insured Long-Term Disability (LTD) plan (Canada)
(2) The major defined benefit plans of the consolidated entity are categorised as follows: (a) Funded lump sum retirement benefits based on final average pensionable earnings; (b) Funded pension retirement benefits based on final average pensionable earnings; (c) Post retirement life, dental and medical coverage; (d) Unfunded pension retirement benefits based on final average pensionable earnings; and (e) Arrangements for each Norway entity are a combination of funded and unfunded pension benefits based on final average pensionable earnings.
For
per
sona
l use
onl
y

122
Notes to the Financial Statements For the year ended 30 September
Orica Limited
122
39. Investments in controlled entitiesThe c onsolidated financ ial statements inc orporate the assets, liabilities and results of the fo llowing c ontrolled entities held during 2012 and 2013:
Name of Entity Plac e ofinc orporationif other thanAustralia
Name of Entity Plac e ofinc orporationif other thanAustralia
Com panyOrica Limited Controlle d Entitie sACF and Shirleys Pty Ltd (d) JV Minova Kazakhstan Limited Liability Partnership KazakhstanActive Chemicals Chile S.A . Chile (formerly TOO "Minova Kasachstan")A laska Pacif ic Pow der Company USA LLC Orica Logistics RussiaA ltona Properties Pty Ltd (d) Marplex Australia (Holdings) Pty LtdAminova International Limited Hong Kong Marplex Australia Pty Ltd Ammonium Nitrate Development and Thailand Mining Quarry Services SPRL Belgium Production Limited Minova AG Sw itzerlandAnbao Insurance Pte Ltd Singapore Minova A rnall Sp. z o.o. PolandAndean Mining & Chemicals Limited Jersey Minova Asia Pacif ic Ltd Taiw anArboleda S.A Panama Minova Australia Pty LtdASA Organizacion Industrial S.A . de C.V . Mexico Minova Bohemia s.r.o. Czech RepublicAustralian Fertilizers Pty Ltd (d) Minova BWZ GmbH GermanyBamble Mekaniske Industri AS (f ) Norw ay Minova CarboTech GmbH GermanyBarbara Limited UK Minova Carbotech Tunnelling Engineering ChinaBeijing Ruichy Minova Synthetic China (Shanghai) Company Limited Material Company Limited Minova Codiv S.L. SpainBrasex Partic ipacoes Ltda (e) Brazil Minova Ekochem S.A . PolandBronson and Jacobs (H.K.) Limited Hong Kong Minova Holding GmbH GermanyBronson and Jacobs (Shanghai) International China Minova Holding Inc USA Trading Co. Ltd Minova International Limited UKBronson & Jacobs (GZFTZ) Ltd (c) China Minova Ksante Sp. z o.o. PolandBronson & Jacobs International Co. Ltd Thailand Minova MAI GmbH AustriaBronson & Jacobs (Malaysia) Sdn Bhd Malaysia Minova Mexico S.A . de C.V . MexicoBronson & Jacobs Pty Ltd Minova MineTek Private Limited IndiaBronson & Jacobs (S.E. Asia) Pte Limited Singapore Minova Mining Services SA ChileBronson & Jacobs (Shanghai) Chemical China Minova Nordic AB Sw edenTrading Co., Ltd (c) Minova Romania S.R.L. RomaniaBST Manufacturing, Inc. USA Minova Ukraina OOO UkraineChemnet Pty Limited (d) Minova (Tianjin) Co., Ltd. ChinaCJSC (ZAO) Carbo-Zakk Russia Minova USA Inc USAControladora DNS de RL de CV Mexico Minova Weldgrip Limited UKCurasalus Insurance Pty Ltd (d) Mintun 1 Limited UKCyantif ic Instruments Pty Ltd (d) Mintun 2 Limited UKDansel Business Corporation Panama Mintun 3 Limited UKDyno Nobel Nitrogen AB (c) Sw eden Mintun 4 Limited UKDyno Nobel VH Company LLC USA MMTT Limited UKD.C. Guelich Explosive Company USA Nitedals Krudtvaerk AS Norw ayEastern Nitrogen Pty Ltd (d) Nitro Asia Company Inc. PhilippinesEmirates Explosives LLC United Arab Emirates Nitro Consult AB Sw edenEmrick & Hill., Inc USA Nitro Consult AS Norw ayEngineering Polymers Pty Ltd (d) Nitroamonia de Mexico S.A de C.V . MexicoEurodyn Sprengmittel GmbH Germany Nobel Industrier AS Norw ayExplosivos de Mexico S.A . de C.V . Mexico Nordenf jeldske Spraengstof AS Norw ayExplosivos Mexicanos S.A . de C.V . Mexico Northw est Energetic Services LLC USAFortune Properties (A lrode) (Pty) Limited South A f rica Nutnim 1 Limited UKFS Resin (Pty) Limited South A f rica Nutnim 2 Limited UKForbusi Importadora e Exportadora Ltda Brazil OOO Minova RussiaGeoNitro Limited Georgia OOO Minova TPS RussiaHallow ell Manufacturing LLC USA Orica-CCM Energy Systems Sdn Bhd MalaysiaHebben & Fischbach Chemietechnik GmbH Germany Orica-GM Holdings Limited UKHunan Orica Nanling Civil Explosives Co., Ltd China Orica Argentina S.A .I.C. A rgentinaIndian Explosives Limited India Orica Australia Pty Ltd (a) Industry Project Consultants Pty Ltd (d) Orica Australia Securities Pty Ltd (d)Initiating Explosives Systems Pty Ltd (a) Orica Belgium S.A . BelgiumInternational Project Advisors Pty Ltd (d) Orica Blast & Quarry Surveys Limited UKJiangsu Orica Banqiao Mining Machinery China Orica Boliv ia S.A . Boliv ia Company Limited Orica Brasil Ltda BrazilJoplin Manufacturing Inc. USA Orica Brasil Produtos Quimicos Ltda Brazil
Orica Annual Report 2013
For
per
sona
l use
onl
y

123
Notes to the Financial Statements For the year ended 30 September
Orica Limited
123
39. Investments in controlled entities (continued)Name of Entity Plac e of
inc orporationif other thanAustralia
Name of Entity Plac e ofinc orporationif other thanAustralia
Orica Caledonie SAS New Caledonia Orica Mining Services Portugal S.A . PortugalOrica Canada Inc Canada Orica Mining Services (Thailand) Limited ThailandOrica Canada Investments ULC Canada Orica Mongolia LLC MongoliaOrica Caribe, S.A . Panama Orica Mountain West Inc. USAOrica Centroamerica S.A . Costa Rica Orica Mozambique Limitada MozambiqueOrica Chemicals A rgentina S.A . Argentina Orica Nelson Quarry Services Inc. USAOrica Chemicals Chile S.A . Chile Orica Netherlands Finance B.V . HollandOrica Chemicals Colombia S.A .S. Colombia Orica New Zealand Finance Limited NZOrica Chemicals Peru S.A . Peru Orica New Zealand Ltd NZOrica Chemicals Trading Agency (Beijing) China Orica New Zealand Securities Limited NZCo., Ltd. Orica New Zealand Superfunds Securities Ltd NZOrica Chile Distribution S.A . Chile Orica Nitrates Philippines Inc PhilippinesOrica Chile S.A . Chile Orica Nitratos Peru S.A . PeruOrica CIS CJSC Russia Orica Nitro Patlayic i Maddeler Sanayi ve TurkeyOrica Clarendon NZ Limited New Zealand Ticaret Anonim SirketiOrica Clarendon Pty Ltd (d) Orica Nitrogen LLC USAOrica Colombia S.A .S. Colombia Orica Nominees Pty Ltd (d)Orica Czech Republic s.r.o. Czech Republic Orica Norw ay AS Norw ayOrica Denmark A /S Denmark Orica Norw ay Holdings AS Norw ayOrica Dominicana S.A . Dominican Orica Panama S.A . Panama
Republic Orica Philippines Inc PhilippinesOrica Eesti OU Estonia Orica Poland Sp. z.o.o. PolandOrica Europe FT Pty Ltd (d) Orica Portugal, S.G.P.S., S.A . PortugalOrica Europe Investments Pty Ltd (d) Orica Qatar LLC (b) QatarOrica Europe Management GmbH Germany Orica Securities (UK) Limited UKOrica Europe Pty Ltd & Co KG Germany Orica Servicos de Mineracao Ltda BrazilOrica Explosives Holdings Pty Ltd Orica Share Plan Pty Limited (d)Orica Explosives Holdings No 2 Pty Ltd Orica Senegal SARL SenegalOrica Explosives Holdings No 3 Pty Ltd (d) Orica Singapore Pte Ltd SingaporeOrica Explosives Research Pty Ltd (d) Orica Slovakia s.r.o. SlovakiaOrica Explosives Technology Pty Ltd Orica Solomon Islands Pty Limited Solomon Is landsOrica Explosives (Thailand) Co Ltd Thailand Orica South A f rica (Proprietary) Limited South A f ricaOrica Explosivos Industriales, S.A . Spain Orica St. Petersburg LLC RussiaOrica Export Inc. USA Orica Sw eden AB Sw edenOrica Fiji Ltd Fiji Orica Sw eden Holdings AB Sw edenOrica Finance Limited Orica Tanzania Limited TanzaniaOrica Finance Trust Orica UK Limited UKOrica Finland OY Finland Orica US Holdings General Partnership USAOrica GEESP Pty Ltd (d) Orica USA Inc. USAOrica Germany GmbH Germany Orica U.S. Services Inc. USAOrica Ghana Limited Ghana Orica Venezuela C.A . VenezuelaOrica Grace US Holdings Inc. USA Orica Watercare Inc. USAOrica Holdings Pty Ltd (d) Orica (Weihai) Explosives Co Ltd ChinaOrica Ibéria, S.A . Portugal Orica Zambia Limited ZambiaOrica IC Assets Holdings Limited Partnership OriCare Canada Inc. CanadaOrica IC Assets Pty Ltd Oricorp Comercial S.A . de C.V . MexicoOrica IC Investments Pty Ltd (d) Oricorp Mexico S.A . de C.V . MexicoOrica International IP Holdings Inc. USA Penlon Proprietary Limited (d)Orica International Pte Ltd Singapore Project Grace Holdings UKOrica Investments (Indonesia) Pty Limited (d) Project Grace Incorporated USAOrica Investments (NZ) Limited NZ Project Grace UKOrica Investments (Thailand) Pty Limited (d) PT Baktijala Kencana Citra IndonesiaOrica Investments Pty Ltd (a) PT Kalimantan Mining Services IndonesiaOrica Japan Co. Ltd Japan PT Kaltim Nitrate Indonesia IndonesiaOrica Kazakhstan Joint Stock Company Kazakhstan PT Orica Mining Services IndonesiaOrica Logistics Canada Inc. Canada Retec Pty Ltd (d)Orica Mauritania SARL Mauritania Rui Jade International Limited Hong KongOrica Med Bulgaria AD Bulgaria Sarkem Pty Ltd (d)Orica Mining Services (Namibia) Namibia Southern Blasting Services, Inc. USA (Proprietary) Limited Sprengmittelvertrieb in Bayern GmbH GermanyOrica Mining Services (Hong Kong) Ltd Hong Kong Sprengstof f -Verw ertungs GmbH GermanyOrica Mining Services Peru S.A . Peru Stratabolt Products (Pty) Limited South A f ricaOrica Mining Services Pilbara Pty Ltd Stratabolt (Pty) Limited South A f rica
For
per
sona
l use
onl
y
124
Notes to the Financial Statements For the year ended 30 September
Orica Limited
124
39. Investments in controlled entities (continued) Name of Entity Plac e of
inc orporationif other thanAustralia
Taian Ruichy Minova Ground Control China Technology Co., LtdTec Harseim Do Brazil Ltda BrazilTransmate S.A. BelgiumWhite Lightning Holding Co Inc Philippines
(a) These controlled entities have each entered into a Deed of Cross Guarantee w ith Orica in respect of relief granted f rom specif ic accounting and f inancial reporting requirements in accordance w ith the ASIC Class Order 98/1418.(b) Incorporated in 2013.(c) In liquidation.(d) Small proprietary company - no separate statutory accounts are prepared.(e) Merged in 2013.(f ) Divested in 2013.
Orica Annual Report 2013
For
per
sona
l use
onl
y

125
Notes to the Financial Statements For the year ended 30 September
Orica Limited
125
2013 2012 $m $m
40. Deed of cross guaranteeEntities w hich are party to a Deed of Cross Guarantee, entered into in accordance w ith ASIC Class Order 98/1418dated 13 August 1998 (as amended), are disclosed in note 39. A consolidated income statement and consolidatedbalance sheet for this closed group is show n below .
Summarised balance sheetCurrent assetsCash and cash equivalents 1,701.9 1,592.2Trade and other receivables 327.1 281.8Inventories 222.1 169.8Other assets 12.1 12.0Total current assets 2,263.2 2,055.8Non-current assetsTrade and other receivables 23.2 21.9Investments accounted for using the equity method 241.5 42.3Other financial assets 3,243.0 3,228.4Property, plant and equipment 1,163.3 1,089.5Intangible assets 236.0 81.7Deferred tax assets 176.0 151.1Other assets 19.6 14.2Total non-current assets 5,102.6 4,629.1Total assets 7,365.8 6,684.9Current liabilitiesTrade and other payables 511.5 439.2Interest bearing liabilities 321.9 654.1Current tax liabilities 57.7 44.7Provisions 108.2 33.7Total current liabilities 999.3 1,171.7Non-current liabilitiesTrade and other payables 5.2 5.1Interest bearing liabilities 3,320.1 2,494.9Deferred tax liabilities 142.6 112.8Provisions 223.0 255.7Total non-current liabilities 3,690.9 2,868.5Total liabilities 4,690.2 4,040.2Net assets 2,675.6 2,644.7EquityOrdinary shares 1,877.9 1,795.1Reserves 372.3 359.8Retained profits 425.4 489.8Total equity attributable to ordinary shareholders of Orica 2,675.6 2,644.7
Summarised income statement and retained profitsProfit before income tax expense 368.1 252.6Income tax expense (103.4) (107.7)Profit from operations 264.7 144.9Retained profits at the beginning of the year 489.8 717.6Actuarial losses recognised directly in equity 9.9 (23.9)Dividends/distributions:Step-Up Preference Securities distributions - (11.1)Less tax credit on Step-Up Preference Securities distributions - 2.2Transfer of cost related to issue of Step-Up Preference Securities - (10.0)Ordinary dividends – interim (142.5) (137.9)Ordinary dividends – final (196.5) (192.0)Retained profits at the end of the year 425.4 489.8
Closed Group
For
per
sona
l use
onl
y

126
Directors’ Declaration
Orica Limited
126
I, Peter John Benedict Duncan, being a director of Orica Limited, do hereby state in accordance with a resolution of the directors that in the opinion of the directors, (a) the consolidated financial statements and notes, set out on pages 50 to 125, and the Remuneration report in the Directors’ report, set out on pages 25 to 47, are in accordance with the Corporations Act 2001, including:
(i) giving a true and fair view of the financial position of the consolidated entity as at 30 September 2013 and of its performance for the financial year ended on that date; and (ii) complying with Australian Accounting Standards and the Corporations Regulations 2001; and
(b) there are reasonable grounds to believe the Company will be able to pay its debts as and when they become due and payable. There are reasonable grounds to believe that the Company and the controlled entities identified in note 39 will be able to meet any obligations or liabilities to which they are or may become subject to by virtue of the Deed of Cross Guarantee between the Company and those controlled entities pursuant to ASIC Class Order 98/1418. The directors have been given the declarations required by Section 295A of the Corporations Act 2001 from the Managing Director and Chief Financial Officer for the financial year ended 30 September 2013. The directors draw attention to note 1 (ii) to the financial statements, which includes a statement of compliance with International Financial Reporting Standards.
P J B Duncan Chairman Dated at Melbourne this 11th day of November 2013.
Orica Annual Report 2013
For
per
sona
l use
onl
y

127
.
127KPMG, an Australian partnership and a member firm of the KPMG network of independent member firms affiliated with KPMG International Cooperative (“KPMG International”), a Swiss entity.
Liability limited by a scheme approved under Professional Standards Legislation.
Independent auditor’s report to the members of Orica Limited
Report on the financial report
We have audited the accompanying financial report of Orica Limited (the Company), which comprises the consolidated balance sheet as at 30 September 2013, and consolidated income statement and consolidated statement of comprehensive income, consolidated statement of changes in equity and consolidated statement of cash flows for the year ended on that date, notes 1 to 40 comprising a summary of significant accounting policies and other explanatory information and the directors’ declaration of the Group comprising the Company and the entities it controlled at the year’s end or from time to time during the financial year.
Directors’ responsibility for the financial report
The directors of the Company are responsible for the preparation of the financial report that gives a true and fair view in accordance with Australian Accounting Standards and the Corporations Act 2001 and for such internal control as the directors determine is necessary to enable the preparation of the financial report that is free from material misstatement whether due to fraud or error. In note 1, the directors also state, in accordance with Australian Accounting Standard AASB 101 Presentation of Financial Statements, that the financial statements of the Group comply with International Financial Reporting Standards.
Auditor’s responsibility
Our responsibility is to express an opinion on the financial report based on our audit. We conducted our audit in accordance with Australian Auditing Standards. These Auditing Standards require that we comply with relevant ethical requirements relating to audit engagements and plan and perform the audit to obtain reasonable assurance whether the financial report is free from material misstatement.
An audit involves performing procedures to obtain audit evidence about the amounts and disclosures in the financial report. The procedures selected depend on the auditor’s judgement, including the assessment of the risks of material misstatement of the financial report, whether due to fraud or error. In making those risk assessments, the auditor considers internal control relevant to the entity’s preparation of the financial report that gives a true and fair view in order to design audit procedures that are appropriate in the circumstances, but not for the purpose of expressing an opinion on the effectiveness of the entity’s internal control. An audit also includes evaluating the appropriateness of accounting policies used and the reasonableness of accounting estimates made by the directors, as well as evaluating the overall presentation of the financial report.
We performed the procedures to assess whether in all material respects the financial report presents fairly, in accordance with the Corporations Act 2001 and Australian Accounting Standards, a true and fair view which is consistent with our understanding of the Group’s financial position and of its performance.
We believe that the audit evidence we have obtained is sufficient and appropriate to provide a basis for our audit opinion.
For
per
sona
l use
onl
y

128
Orica Limited 128
Independence
In conducting our audit, we have complied with the independence requirements of the Corporations Act 2001.
Auditor’s opinion
In our opinion:
(a) the financial report of the Group is in accordance with the Corporations Act 2001, including: (i) giving a true and fair view of the Group’s financial position as at 30 September 2013 and of its
performance for the year ended on that date; and (ii) complying with Australian Accounting Standards and the Corporations Regulations 2001.
(b) the financial report also complies with International Financial Reporting Standards as disclosed in note 1.
Report on the remuneration report
We have audited the Remuneration Report included in the directors’ report for the year ended 30 September 2013. The directors of the company are responsible for the preparation and presentation of the remuneration report in accordance with Section 300A of the Corporations Act 2001. Our responsibility is to express an opinion on the remuneration report, based on our audit conducted in accordance with auditing standards.
Auditor’s opinion
In our opinion, the remuneration report of Orica Limited for the year ended 30 September 2013, complies with Section 300A of the Corporations Act 2001.
KPMG
Gordon Sangster Partner
Melbourne
11 November 2013
Orica Annual Report 2013
For
per
sona
l use
onl
y

129
Orica Limited
129
Shareholders' StatisticsAs at 5 November 2013
Distribution of ordinary shareholders and shareholdingsSize of holding
1 – 1,000 41,384 64.88% 17,125,880 4.65%1,001 – 5,000 19,610 30.74% 40,568,430 11.02%5,001 – 10,000 1,888 2.96% 12,958,581 3.52%10,001 – 100,000 829 1.30% 16,058,736 4.36%100,001 and over 74 0.12% 281,492,025 76.45%Total 63,785 100.00% 368,203,652 100.00%
Included in the above total are 2,330 shareholders holding less than a marketable parcel of 24 shares.The holdings of the 20 largest holders of fully paid ordinary shares represent 72.27% of that class of shares.
Twenty largest ordinary fully paid shareholdersShares
135,197,094 36.72%47,153,559 12.81%29,704,906 8.07%11,653,965 3.17%6,364,849 1.73%6,190,161 1.68%5,880,724 1.60%5,425,160 1.47%3,686,607 1.00%2,711,626 0.74%2,557,983 0.69%1,368,960 0.37%1,343,743 0.36%1,332,407 0.36%1,071,612 0.29%1,067,271 0.29%1,000,000 0.27%
956,146 0.26%713,359 0.19%711,574 0.19%
Total 266,091,706 72.27%
Register of substantial shareholdersThe names of substantial shareholders in the company, and the number of fully paid ordinary shares in w hich each has an interest,as disclosed in substantial shareholder notices to the Company on the respective dates, are as follow s:14 October 2013 Harris Associates 42,387,401 11.55%23 October 2013 Perpetual Trustees 20,186,322 5.48%
UBS Nominees Pty Ltd
UBS Wealth Management Australia Nominees Pty Ltd The Senior Master of the Supreme Court COMMON FUND NO 3
Australian United Investment Company Limited
RBC Investor Services Australia Nominees Pty Limited <PIIC A/C>Gw ynvill Investments Pty Ltd
HSBC Custody Nominees (Australia) Limited <NT-COMNWLTH SUPER CORP A/C>
HSBC Custody Nominees (Australia) LimitedJP Morgan Nominees Australia LimitedNational Nominees LimitedCITICORP NOMINEES PTY LIMITED
RBC Investor Services Australia Nominees Pty Limited <PI POOLED A/C>JP Morgan Nominees Australia Limited <CASH INCOME A/C>
BNP Paribas Nominees Pty Ltd <DRP>
Citicorp Nominees Pty Limited <COLONIAL FIRST STATE INV A/C>RBC Investor Services Australia Nominees Pty Limited <BKCUST A/C>Australian Foundation Investment Company Limited Argo Investments Limited
AMP Life Limited
Number of sharesNumber of holders
% of total
BNP Paribas Nominees Pty Ltd <AGENCY LENDING DRP A/C>
Orica Annual Report 2013
For
per
sona
l use
onl
y

130
Ten Year Financial Statistics
Orica Limited
130
Orica consolidated 2013 2012$m $m
Sales 6,898.1 6,674.1Earnings before depreciation, amortisation, net borrow ing costs and tax 1,269.2 1,274.0Depreciation and amortisation (excluding goodw ill) (284.4) (251.4)Goodw ill amortisation - - Earnings before net borrowing costs and tax (EBIT) 984.8 1,022.6Net borrow ing costs (150.2) (128.2)Individually material items before tax - (367.2)Taxation expense (213.4) (103.4)Non-controlling interests (19.6) (21.0)Profit/(loss) after tax and individually material items 601.6 402.8Individually material items after tax attributable to members of Orica Limited - (247.4)Profit after tax before individually material items net of tax 601.6 650.2Dividends/distributions 339.0 341.0
Current assets 2,149.9 2,038.0Property, plant and equipment 3,455.4 3,034.4Investments 435.5 206.4Intangibles 2,217.9 2,046.8Other non-current assets 344.6 298.0Total assets 8,603.3 7,623.6Current borrow ings and payables 1,699.2 1,415.3Current provisions 253.3 165.0Non current borrow ings and payables 2,180.7 2,275.1Non current provisions 476.0 521.7Total liabilities 4,609.2 4,377.1Net assets 3,994.1 3,246.5Equity attributable to ordinary shareholders of Orica Limited 3,853.0 3,121.5Equity attributable to Step-Up Preference Securities holders - - Equity attributable to non-controlling interests 141.1 125.0Total shareholders’ equity 3,994.1 3,246.5
Number of ordinary shares on issue at year end millions 368.2 365.6Weighted average number of ordinary shares on issue millions 363.7 360.6Basic earnings per ordinary share before individually material items cents 165.4 177.9 including individually material items cents 165.4 109.2
Dividends per ordinary share cents 94.0 92.0Dividend franking % 74.5 41.3Dividend yield (based on year end share price) % 4.7 3.7
Closing share price range – High $27.31 $27.97Low $17.61 $22.40Year end $20.06 $24.87
Stockmarket capitalisation at year end $m 7,386.1 9,092.5Net tangible assets per share $ 4.44 2.94
Profit margin (earnings before net borrow ing costs and tax/sales) % 14.3 15.3Net debt 2,331.3 2,299.2Gearing (net debt/net debt plus equity) % 36.9 41.5Interest cover (EBIT/net borrow ing costs excluding capitalised interest) times 6.1 6.1Net capital expenditure on plant and equipment (Cash Flow) (511.0) (558.0)Capital expenditure on acquisitions (Cash Flow) (2.2) (11.3)Return on average shareholders' funds before individually material items % 17.3 18.9 including individually material items % 17.3 11.7
Note: Income statements prior to 2005 and balance sheets prior to 2004 are stated under accounting standards used prior to the adoption ofInternational Financial Reporting Standards.
Orica Annual Report 2013
For
per
sona
l use
onl
y

131
Ten Year Financial Statistics
Orica Limited
131
2011 2010 2009 2008 2007 2006 2005 2004 2003$m $m $m $m $m $m $m $m $m
6,182.3 6,539.3 7,411.0 6,544.1 5,527.2 5,359.2 5,126.7 4,610.5 3,958.61,252.5 1,340.9 1,330.2 1,188.8 995.9 814.6 741.3 724.2 617.5(224.2) (239.5) (247.7) (218.7) (183.2) (156.9) (140.4) (137.7) (155.1)
- - - - - - - (33.2) (20.1)1,028.3 1,101.4 1,082.5 970.1 812.7 657.7 600.9 553.3 442.3(123.5) (127.6) (133.5) (157.7) (122.6) (92.2) (102.5) (72.3) (60.7)
- 715.6 (139.6) (41.6) (22.3) 70.8 (187.7) (46.6) (208.7)(241.4) (334.7) (228.0) (203.5) (154.4) (74.9) (88.8) (80.9) (59.3)(21.1) (36.0) (39.6) (27.7) (25.7) (22.3) (13.6) (25.7) (12.9)642.3 1,318.7 541.8 539.6 487.7 539.1 208.3 327.8 100.7
- 642.9 (104.3) (32.7) (10.1) 158.8 (131.6) 2.2 (169.6)642.3 675.8 646.1 572.3 497.8 380.3 339.9 325.6 270.3359.5 1,098.3 378.0 326.0 303.7 207.1 190.6 156.6 50.0
1,985.2 1,831.9 1,994.4 2,458.2 1,955.2 2,479.7 1,781.6 1,699.6 1,282.62,709.7 2,235.2 2,075.0 2,052.3 1,742.9 1,603.1 1,593.7 1,514.4 1,436.8
172.1 162.6 168.3 209.3 125.6 125.9 49.1 48.4 86.42,505.4 2,510.9 2,756.5 3,012.6 2,055.5 1,141.3 634.3 588.3 441.7
255.8 248.8 360.0 275.4 335.2 362.8 252.5 335.2 307.87,628.2 6,989.4 7,354.2 8,007.8 6,214.4 5,712.8 4,311.2 4,185.9 3,555.31,229.0 1,215.5 1,316.9 1,777.8 1,625.4 981.0 958.9 1,165.4 683.3
228.4 343.4 298.8 301.8 332.3 319.1 218.7 215.1 169.61,769.3 1,305.1 1,279.8 1,107.2 1,098.6 1,272.5 1,287.2 755.7 812.7
525.9 492.8 485.9 502.6 530.5 472.0 326.9 510.3 309.23,752.6 3,356.8 3,381.4 3,689.4 3,586.8 3,044.6 2,791.7 2,646.5 1,974.83,875.6 3,632.6 3,972.8 4,318.4 2,627.6 2,668.2 1,519.5 1,539.4 1,580.53,264.3 3,032.7 3,370.7 3,731.5 2,076.7 2,126.6 1,327.9 1,334.5 1,384.9
490.0 490.0 490.0 490.0 490.0 490.0 - - - 121.3 109.9 112.1 96.9 60.9 51.6 191.6 204.9 195.6
3,875.6 3,632.6 3,972.8 4,318.4 2,627.6 2,668.2 1,519.5 1,539.4 1,580.5
364.0 362.1 360.0 359.2 307.9 309.2 273.1 270.1 277.6357.5 355.5 353.9 320.0 306.3 300.8 272.8 273.5 277.9
173.5 185.6 174.6 170.0 149.5 126.4 124.6 119.0 97.2173.5 366.4 145.2 159.8 146.3 179.2 76.3 119.8 36.2
90.0 95.0 97.0 94.0 89.0 74.0 71.0 68.0 52.078.9 73.7 35.1 36.2 34.8 40.5 32.4 41.2 21.13.8 3.7 4.1 4.5 3.0 3.3 3.4 3.9 4.3
$27.75 $27.75 $24.15 $32.18 $33.90 $26.45 $21.55 $17.55 $12.47$21.44 $21.95 $11.30 $20.95 $21.78 $17.78 $14.32 $11.92 $8.15$23.48 $25.71 $23.50 $20.95 $30.10 $22.47 $21.00 $17.30 $12.008,546.7 9,310.0 8,459.0 7,525.2 9,268.2 6,948.1 5,735.2 4,672.0 3,331.2
2.08 1.44 1.71 2.00 0.07 3.19 2.53 2.76 3.40
16.6 16.8 14.6 14.8 14.7 12.3 11.7 12.0 11.21,408.1 1,051.6 1,094.5 1,020.5 1,305.7 302.1 1,112.1 977.3 877.0
26.6 22.4 21.6 19.1 33.2 10.2 42.3 38.8 35.76.4 7.5 7.8 6.1 6.6 7.1 5.9 7.7 7.3
(646.6) (517.3) (345.6) (394.8) (280.9) (329.2) (234.9) (126.9) (43.6)(60.9) (162.1) (107.3) (866.2) (917.7) (875.6) (59.2) (253.9) (415.7)
17.7 18.3 16.0 16.9 19.2 19.3 25.5 23.9 19.617.7 35.7 13.4 15.9 18.8 27.3 15.6 24.1 7.3
For
per
sona
l use
onl
y

132
Annual General Meeting10.30am Thursday, 30 January 2014
ANZ Pavilion, Arts Centre, Level 8, 100 St.Kilda Road, Melbourne VIC 3000
Stock Exchange listingOrica’s shares are listed on the Australian Securities Exchange (ASX) and are traded under the code ORI.
Orica Share registryLink Market Services Limited Level 12, 680 George Street, Sydney NSW 2000
Locked Bag A14 Sydney South, NSW, 1235
Telephone: 1300 301 253 (for callers within Australia)
International: +61 2 8280 7111
Facsimile: +61 2 9287 0303
Email: [email protected]
Website: www.linkmarketservices.com.au/orica
Tax and Dividend Payments For Australian registered shareholders who have not quoted their Tax File Number (TFN) or Australian Business Number (ABN), the Company is obliged to deduct tax at the top marginal rate plus Medicare levy from unfranked and/ or partially franked dividends. If you have not already quoted your TFN/ABN, you may do so by contacting the Share Registrar or by registering your TFN/ABN at their website at: www.linkmarketservices.com.au/orica.
Dividend PaymentsYour dividends will be paid in Australian dollars by cheque, mailed to the address recorded on the share register. Why not have us bank your dividend payments for you? How would you like to have immediate access to your dividend payment? Your dividend payments can be credited directly into any nominated bank, building society or credit union account in Australia.
Dividends paid by direct credit appear in your account as cleared funds, thus allowing you to access them on payment date. You may elect to receive your dividends by way of direct credit by completing an application form available by contacting the Share Registrar or enter the details at their website at www.linkmarketservices.com.au/orica.
Shareholders should be aware that any cheques that remain uncashed for more than twelve months from a dividend payment are required to be handed over to the State Revenue Office Victoria under the Unclaimed Money Act. Shareholders are encouraged to cash cheques promptly or to have their dividends directly deposited into their bank accounts.
Dividend reinvestment PlanThe Dividend Reinvestment Plan (DRP) enables Orica’s fully paid ordinary shareholders having a registered address or being resident in Australia or New Zealand to reinvest all or part of their dividends in additional Orica fully paid ordinary shares. Applications are available from the Share Registrar.
Consolidation of Multiple HoldingsIf you have multiple issuer sponsored holdings that you wish to consolidate into a single account, please notify the Share Registrar in writing, quoting your full registered names and Securityholder Reference Number (SRN) for these accounts and nominating the account to which the holdings are to be consolidated.
Change of Name and/or AddressFor issuer-sponsored holdings: please notify the Share Registrar in writing if you change your name and/or address (please supply details of your new/previous name, your new/previous address and your SRN), or change the details online at their website at www.linkmarketservices.com.au/orica.
For CHESS/broker sponsored holdings: please notify your broker in writing if you change your name and/or address.
Share EnquiriesShareholders seeking information about their shareholding or dividends should contact Orica’s Share Registrar, Link Market Services Limited. Contact details are above. Callers within Australia can obtain information on their investments with Orica by calling the Investor Line on 1300 301 253. This is a 24-hour, seven days a week service. Before you call, make sure you have your SRN or Holder Identification Number (HIN) handy. You can do so much more online via the internet; visit their website: www.linkmarketservices.com.au/orica.
Shareholder Information
Orica Annual Report 2013
For
per
sona
l use
onl
y

133
Access a wide variety of holding information, make some changes online or download forms. You can:
• check your current and previous holding balances;
• choose your preferred annual report options;
• update your address details;• update your bank details;• confirm whether you have lodged your
TFN or ABN exemption;• register your TFN/ABN;• check transaction and dividend history;• enter your email address;• check the share prices and graphs;• download a variety of instruction forms;• subscribe to email announcements.You can access this information via a security login using your SRN or HIN as well as your surname (or company name) and postcode (must be the postcode recorded on your holding record).
Orica CommunicationsOrica’s website www.orica.com offers shareholders details of the latest share price, announcements to the ASX, investor and analyst presentations, webcasts and the Chairman’s and Managing Director’s AGM addresses. The website also provides further information about the Company and offers insights into Orica’s businesses. Orica’s printed communications include the Annual Report and the Company Overview report.
We can now provide electronic dividend statements, notices of meeting and proxy forms.
Electronic transmission enhances shareholder communication, results in significant cost savings for the Company and is more environmentally friendly. Shareholders wishing to receive all communications electronically should visit the Share Registrar’s website: www.linkmarketservices.com.au/orica to register their preference.
Shareholders may elect to receive a copy of the Annual Report or notification by email when the Annual Report is available online at www.orica.com. If you do not make an Annual Report election you will not receive a copy of the Annual Report.
If you wish to change your Annual Report election, please contact the Share Registrar or visit their website: www.linkmarketservices.com.au/orica.
Copies of reports are available on request.
Telephone: +61 3 9665 7111
Facsimile: +61 3 9665 7937
Email: [email protected]
The Sustainability Report is now available online on the Orica website: www.orica.com. It provides a review of the Company’s performance in the twelve months to 30 September.
AuditorsKPMG
Orica limitedABN 24 004 145 868
Registered address and head office: Level 3, 1 Nicholson Street East Melbourne, Victoria 3002 Australia
Postal address: GPO Box 4311 Melbourne, Victoria 3001
Telephone: +61 3 9665 7111
Facsimile: +61 3 9665 7937
Email: [email protected]
Website: www.orica.com
Investor relationsTelephone: +61 3 9665 7844
Email: [email protected]
For
per
sona
l use
onl
y

134
31 March 2014 Orica Half year End13 May 2014 Half Year Profit and Interim Dividend Announced2 June 2014 Books Close for 2014 Interim Ordinary Dividend1 July 2014 Interim Ordinary Dividend Paid
30 September 2014 Orica year End19 November 2014 Full Year Profit and Final Dividend Announced3 December 2014 Books Close for 2014 Final Ordinary Dividend19 December 2014 Final Ordinary Dividend Paid
29 January 2015 Annual General Meeting 2014* Timing of events is subject to change
Shareholder Timetable*
Orica Annual Report 2013
For
per
sona
l use
onl
y

135
This page was left blank intentionally.
For
per
sona
l use
onl
y

136
This page was left blank intentionally.
For
per
sona
l use
onl
y

Precinc
t.com
.au
For
per
sona
l use
onl
y

Orica
Annual
2013
Orica Limited ABN 24 004 145 868
Head Office: 1 Nicholson Street East Melbourne Victoria 3002 Australia
Postal Address: GPO Box 4311 Melbourne Victoria 3001
Telephone: +61 3 9665 7111
Facsimile: +61 3 9665 7937
Email: [email protected]
Web: www.orica.com
Cover and text: Revive Pure Silk 100% Recycled is certified carbon neutral and FSC 100% Recycled certified. It is manufactured process chlorine free (PCF) by an ISO 14001 certified mill.
For
per
sona
l use
onl
y