report back on council budget motions · 2019-02-26 · 2 . agenda report back on council motions:...
TRANSCRIPT

February 26, 2019
Report Back on Council Budget Motions

2
Agenda
Report back on Council motions:
A. Budgeting changes between 2008 to 2018
1. General operating budget growth trends 2008-2018
2. Key drivers of growth
B. Baseline financial review of financial capacity
C. Budget process – timeline for engagement with Council

3
What we’ve heard from Council
Provide Council with baseline information to
enable financial decisions
Involve Council early and throughout the budget
process
Improve engagement with businesses and
residents, and what is important to them Cost of living, willingness and ability to pay for quality services

4
A. 1. Budgeting changes 2008-2018

5
Council Motion:
– THAT Council refer C of the motion entitled “Restoring Line-by-Line
Budgets for the City of Vancouver”, as moved at the Standing Committee on Policy and Strategic Priorities on November 15, 2018, back to staff with direction, to report back to City Council with a high-level memorandum on the differences of how City of Vancouver Budgets are reported in the years of 2008 to 2018.

6
Highlights
• The city has grown 48.8% over the last 10 years – After adjusting for inflation the growth is 29.1%
• Differences in budgeting practices has made it challenging to compare services and metrics over the 10 year period

7
Previous 3rd party reviews of the budget:
In 2013, following PwC best practices review: o Best practice budgeting looks at what we are trying to
achieve and how do we measure it through metrics, including:
• Public Engagement • Budgeting for Results • Budget information for Council • Streamlining the budget process

8
Previous 3rd party reviews of the budget:
In report released by C.D. Howe Institute in Nov 2018: o In 2011, City of Vancouver received an overall grade of C o In 2018, City of Vancouver received an overall grade of A-
o One of the highest scores among Canadian municipalities
o GFOA Distinguished budget presentation award (2018) o Based on best practice criteria for local government

9
Budgeting changes between 2008 and 2018
• Service planning and metrics
– Strategic practice to align financial resources with performance – Improve transparency and accountability – 2018 includes 300 line items of metrics (0 in 2008)
• 5-Year Plan view
– enables informed planning and decision-making – Shows multi-year financial impacts of current budgeting decisions – best practice and is required of BC Municipalities under the BC Community Charter
• PSAB financial reporting requirements
– Increases comparability between the budget and financial statements

10
High-level differences in how City of Vancouver budgets were reported in the years of 2008 to 2018:
1. Consolidated budgeting
2. Gross vs. net budgeting
3. Shared support services model
4. Departmental reorganizations
5. Staffing
Budgeting changes between 2008 and 2018

11
– best practice and requirement in order for the City to achieve its high scoring in the annual C.D. Howe evaluation of municipal budgets
– includes additional line-by-line budgets for all City funds and entities and a consistent financial statement format
1. Consolidated budgeting
Funds
Operating Capital PEF CFF Sinking Fund
Entities
PNE PHC VAHA /VAHEF
Harbour Park
Hastings Institute EasyPark VCVC VEC
2018 Consolidated budget
Operating Capital
Funds
PNE
2008 budget
Other entities with separate budgets

12
2. Gross vs. net budgeting
– Gross budgeting is a best practice and a key criteria for C.D. Howe and GFOA budget evaluations
– Both revenue and expenditures are recorded as a higher amount compared to net budgets, particularly for departments with large external funding sources such as the Vancouver Police Department and the Vancouver Park Board. This restatement will appear as an expenditure increase when it is not.
Revenues $ 100M – Property Taxation $ 100M – BIA levies $ 10M – BIA disbursements <$10M>
Expenditures $ 100M
Balanced Budget $ 0
Revenues $110M – Property Taxation $ 100M – BIA levies $ 10M
Expenditures $ 110M – Other Expenditures $ 100M – BIA disbursements $ 10M
Balanced Budget $ 0
2008 NET BUDGETING
2018 GROSS BUDGETING

13
3. Shared support services model • Beginning in 2010,
– a number of city-wide functions were centralized under a shared services model to provide consistent city-wide support services in a cost effective way
– some departmental staff performing a city-wide support functions were centralized (for example, facilities, finance, HR, IT and communications)
– new department configurations will impact the comparability of departmental budgets
Engineering
Community Services
IT FM A/P
IT FM A/P
Engineering Community Services
REFM FM FM
Support Departments
Finance
A/P A/P
IT
IT IT
After Shared services review
2008 COV Post Consolidation

4. Departmental reorganizations
2008 City of Vancouver
Engineering
Sustainability
Community Services
Planning
…… Support Departments
2018 City of Vancouver
Engineering Planning, Design,
Sustainability
Sustainability
Arts, Culture, and Community
Services …… Support
Departments

15
5. Staffing
• Staffing reports included only permanent FTE o Regular full-time (RFT) o Regular part-time (RPT)
• In 2015, started measurement in All Full-time Equivalents (FTEs):
Based on number of hours worked Comprehensive view of staffing trends Best practice to include All employee types
Permanent FTE
Temporary FTE
Permanent Full-time
equivalent RFT and RPT
RFT and RPT
TFT and Aux
2008 Budget 2018 Budget

16
Operating budget trend 2008-2018
Inflation-adjusted growth in the operating budget from 2008 to 2018 is 29.1% or a compounded annual rate of 2.6%
Revenue streams have grown at different rates. Property tax revenue inflation-adjusted growth has been 2.2% (includes new tax revenue from new construction and other tax-related revenues)
Growth has been funded through user fees and other revenues in addition to property tax
Operating Budget ($000)Major Growth Areas
2008 Approved
Budget
2018 Approved
Budget
Net Change 2018/2008
(%)
Net Change(%) 2018/2008
Adjusted for Inflation
Compounded Annual Growth (CAGR)
Inflation Adjusted
CAGR 2008-2018
Total Revenues 945,879 1,407,293 48.8% 29.1% 4.1% 2.6%Major Growth Areas by CAGR
Property taxes 549,585 789,894 43.7% 24.7% 3.7% 2.2%Other revenue 243,896 342,943 40.6% 22.0% 3.5% 2.0%Utility Fees 152,398 274,455 80.1% 56.3% 6.1% 4.6%
Total Expenditures & Transfers 945,879 1,407,293 48.8% 29.1% 4.1% 2.6%*Property taxation compounded growth of 3.6% includes growth in new construction and other tax related revenues such as PILS…etc**Source: 2008 audited financial statements; these may not be apples to apples comparison. Additional work is required.
17
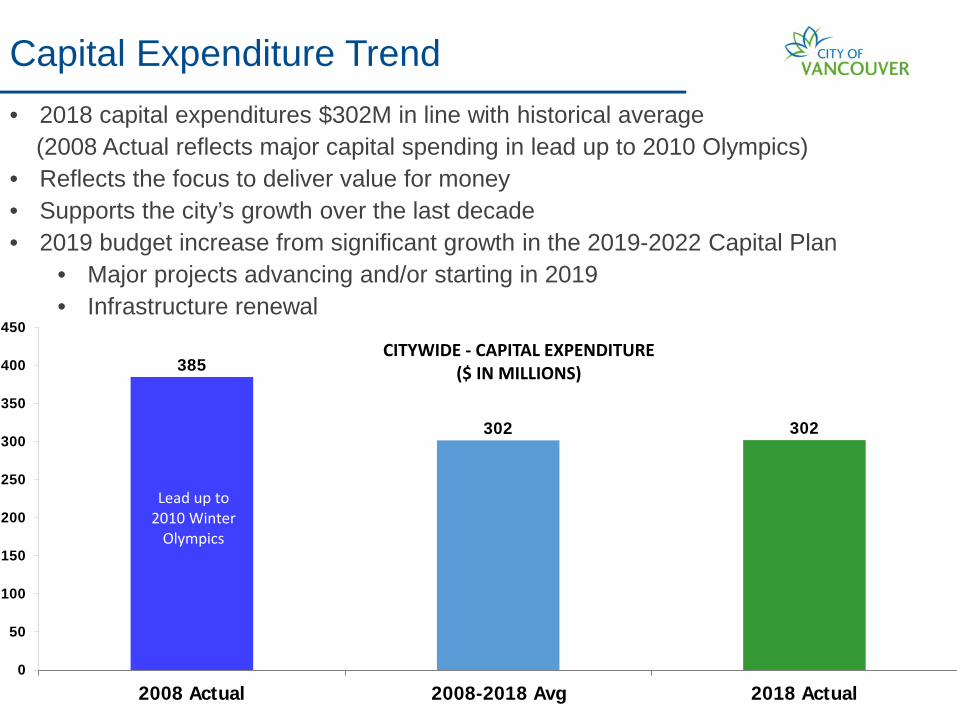
Capital Expenditure Trend • 2018 capital expenditures $302M in line with historical average (2008 Actual reflects major capital spending in lead up to 2010 Olympics) • Reflects the focus to deliver value for money • Supports the city’s growth over the last decade • 2019 budget increase from significant growth in the 2019-2022 Capital Plan
• Major projects advancing and/or starting in 2019 • Infrastructure renewal
385
302 302
0
50
100
150
200
250
300
350
400
450
2008 Actual 2008-2018 Avg 2018 Actual
CITYWIDE - CAPITAL EXPENDITURE ($ IN MILLIONS)
Lead up to 2010 Winter
Olympics

18
Vancouver Services Review
In 2009, Council directed the City Manager to review the City’s businesses, service delivery practices and general operations in order to mitigate future burdens on the residential and business tax payer through:
– An examination of savings or shared service improvement opportunities in the
City’s provision of internal services, including information technology, human resources, legal services, accounts payable, purchasing, time entry, payroll, security, building maintenance, yards and other services.
– An examination of City reserves and the five City funds to identify and report possible changes of process and structure to produce efficiencies, opportunities or cost reductions.
– An examination of City activities to identify those not mandated by legislation, no longer a priority, of questionable efficacy, or otherwise a candidate for reduction or elimination.
– Any other change in business practices that could produce efficiencies or cost reductions.

19
Transformational initiatives
• Since 2010, the City has undertaken a number of initiatives to improve efficiency and transform operations:
– Business Transformation: Electronic Pay Statements ePAY, Bylaw adjudication, Permits and Licenses, Procure-to-Pay, Web, Capital Program
– Shared services created for IT, Sanitation, AP, Procurement and Capital
– Initiated a new Procurement Policy and transitioning to Centralized Procurement
– Created the City’s first 10 Year Capital Strategic Outlook – Attendance management – Continuous Process Improvement (CPI) – Inventory and warehouse management

20
Supply Chain Shared Services
Moving From: Inconsistent and non-standard processes (e.g., purchase requisitions, contracts, bid documents)
Redundancy of effort (e.g., departments buying the same goods and services separately)
Contracts and purchase orders not pre-approved or executed by authorized staff
Lack of transparency of information
Poor segregation of duties
Moving To: Improved efficiency, centralized
and standardized procedures
Savings on procurement activities
Transparency of procurement information
Sustainable and ethical procurement Integrated
Dedicated co-located buying staff
Standardized contract and bid documents and templates
Specialized knowledge leveraged
Prequalification of vendors

21
Capital Program
Why? • Need for improved annual capital budget reporting • Under optimized city-wide project oversight for project
delivery • Need for longer-term capital investment strategy Results: • Service-based approach to capital • Improved linkages between fiscal capacity and spending • Improved capital plan format

22
A. 2. drivers of growth

23
Key drivers of growth
A. Utilities
B. Wages and headcount
C. Licence and development volume
D. Downloading of provincial costs

24
Drivers of budget growth
Drivers: regional utility charges, capital renewal
Driver: collective agreement wage
growth
10 year Population growth ~ 10%

25
A. Regional Utilities growth
CPI 19.7%
Above CPI 41%
$0.00
$20.00
$40.00
$60.00
$80.00
$100.00
$120.00
$140.00
$160.00
2008 Budget 2018 Budget
Regional Utility Charges
61% growth

26
B. Wages
0 %
5 %
10 %
15 %
20 %
25 %
30 %
35 %
40 %
45 %
COMPOUNDED ANNUAL WAGE INCREASES
CPI - Vancouver CUPE Police Fire
(2018 Forecast)
CPI 19.7% CUPE 29.6% POLICE 38.1% FIRE 38.4%
Compounded Increase from 2008 to 2018
Public safety wages have grown almost 19% above CPI CUPE wages have grown 10% above CPI

27
B. Regular staffing levels remained flat for most of the past 10 years • Growth in 2009 (and subsequent decrease) related to the 2010 Olympics • Growth since 2017 driven by permit and licencing staffing, increased
capital plan activity to support renewal and growth, public safety operational review staffing, regularization of temporary staff
* Source data is from Human Resources and based on Active Regular full-time Count of staff as of last day of each month
2008 2009 2010 2011 2012 2013 2014 2015 2016 2017 2018

28
C. Permitting volume
0%
5%
10%
15%
20%
25%
30%
Permit volumeincrease
Staffing increase
Permit volume growth and staffing 2008-2016 • Original need was for 150
staff
• Beginning in 2018, 85 new staff added over the two years to improve wait times
• The difference is being met through process improvement efficiencies

29
D. Downloading of Provincial costs
Cost pressures passed to the City for: • Childcare • Mental health • Policing DNA costs $0.6M per year since 2016
• Employer Health Tax $15M in 2019
• Affordable housing • Homelessness
Going forward: new partnership opportunities, ongoing need for investment
Spending on housing and homelessness increased by $5M since 2008, including: o $2.5M Non-market housing costs o $1.4M Street homelessness o $0.5M Outreach staff and support costs o $0.4M Interim housing lease and support o $0.2M Affordable housing team salaries

30
Citywide DCL Allocation 2008 vs 2018
• The Citywide DCL allocation dedicated to non-core city amenities increased from 37% to 49% of DCLs (5% to13% for childcare and 32% to 36% for housing).
• Increased inclusionary zoning and density bonus for housing
Replacement Housing
36%
Transportation25%
Parks18%
Childcare13%
Utilities8%
Citywide DCL Revenue Allocation 2018

31
Summary
• Inflation-adjusted 10 year budget growth of 29% • Major drivers:
– Metro utility charges – public safety wages – only limited staff growth (permitting) – productivity improvements helped offset population growth of
10% and wage growth well above inflation

32
B. Baseline Financial Review
Financial Sustainability & Resilience

33
Council Motion – Report back end of Feb 2019 with draft Terms of Reference for an
Independent Oversight Committee to undertake a baseline review of City finances, and a recommended budget and timeline for the Committee’s work, with an expectation that the Committee report back to Council by the end of Q2 2019 to help inform the 2020 budget planning process.
– The review will: • Give the new Council a baseline of knowledge so any financial decisions
made going forward can be informed ones; • Provide Council an understanding of what the current and projected
financial capacity is of the City and what contingencies, risks, and assumptions have been considered in that determination;
• A review will also help Council identify potential opportunities for efficiencies.

34
Financial Review
• Staff support a3rd party review which would: – provide council with a summary of the current state of the city’s
financial capacity to aid in decision making. – provide staff with a 3rd party perspective on the work done to date
on financial health, capacity and sustainability – Provide 3rd party insights on best practice and opportunies for the
future to address financial pressures and help build capacity for growth
• Since 2011, significant focus to: – evaluate and measure the City’s financial health – develop long-term financial sustainability strategies – Implement actions which reflect these strategies – reflected in the
2019-2022 Capital Plan • This information is available to help develop a baseline report
for Council.

35
Understanding current state, opportunities and challenges
Fiscal Limitation
Municipalities manage 60% of infrastructure
in Canada, and get only 8-10 cents of each
tax dollar
New/upgraded infrastructure & amenities needed to support a growing city
Aging infrastructure requires more maintenance & renewal over the next decade
Emerging priorities – seismic, climate change, resilience – require proactive action

36
A growing proportion of existing assets are aging
Fire halls & police stations
1886
120,000 Population
1911 1936 1961 1986 2011
260,000 385,000 430,000 605,000
Water & sewer pipes
Major roads
Active transportation
Parks: Stanley, Hastings, Queen E, Jericho, Vanier, Seawall
Childcare Social housing
Recreation centres Libraries
Museums/theatres
Rapid transit
2036
~730,000

37
New infrastructure & amenities needed to support growth

38
Significant Opportunities
Provincial Funding
Investment of provincial funding in Vancouver (housing, childcare,
rapid transit)
Development
Development contributions to deliver new infrastructure & amenities to support
growth
Partnership
Extraordinary opportunity to
leverage federal & provincial
partnership & funding on
infrastructure renewal
Housing
Significant alignment
with National Housing
Strategy & Provincial
30-point Plan for Housing Affordability
Rapid Transit
Significant planned
expansions to rapid transit
system

39
Financial Sustainability Guiding Principles
Vision: Provide exceptional service to Vancouver residents and businesses in a fiscally prudent and financially sustainable manner.
Fiscal Prudence Asset Management
Affordability & Cost Effectiveness
• Maintain assets in a state of good repair • Optimize capital investments to meet public and economic needs while achieving value for the investment

40
Strategic Capital Planning Guiding Principles
Vision • Inspire a vibrant, inclusive and safe city with a resilient local economy • Advance public policy goals and strategic priorities of City Council & Boards (Park, VPL & VPD) • Align with the City’s corporate strategic plan and long-term financial plan • Integrate environmental, operational and financial sustainability principles • Be adaptive to emerging priorities and changing demographics
Innovation • Partner strategically with senior levels of government, charitable & non-profit organizations, and
private sector • Optimize service delivery through business transformation, co-location and functional integration • Maximize value for investments through creative design and planning, and strategic procurement and
resourcing • Be opportunistic and nimble
Strategic Planning • Rationalize network of public amenities and services across agencies (City, VSB, NPOs, etc.) to
enhance collaboration and synergies • Consider repurposing, right-sizing, relocation, co-location and decommission of existing assets as part
of renewal strategy • Build flexible, adaptable and expandable spaces to accommodate changing demographics and future
growth • Phase in large-scale, high impact capital programs/projects to mitigate financial impact • Synchronize multi-project timing to maximize efficiencies and economy of scale
Financial Sustainability Guiding Principles apply

41
10 YEARS 4 YEARS 1 YEAR
ALIGNMENT & PRIORITIZATION
Anticipated strategic outcomes
Shorter-term priorities
LONG-TERM (ASPIRATION) SHORT-TERM (REALITY)
CAPITAL STRATEGIC OUTLOOK
CAPITAL PLAN CAPITAL BUDGET
Project approval
SERVICE STRATEGIES
Long-term policy goals
Funding envelope Fixed funding
Program priorities & specific projects
Detailed info about projects
Every 4 years Every 4 years Every year
LONG-TERM
Short-term Plan Nested in Long-term Strategies

42
• Capital planning incorporates development contributions
• Public benefit strategies incorporate new & renewal of infrastructure & amenities
Integrated Community & Capital Planning

43
B. Baseline Financial Review
Financial Health and Sustainability Metrics

44
Moody's S&P
Aaa AAAAa1 AA+Aa2 AAAa3 AA-A1 A+A2 AA3 A-
Baa1 BBB+Baa2 BBB+Baa3 BBB-
Moody’s Aaa
(January 2019)
• high liquidity level
• strong debt affordability
• solid governance & financial management practices enable consistent, positive fiscal outcomes
• long-term financial planning
• experienced financial management provides solid fiscal policy anchor and leads to positive fiscal outcome, reduce new borrowing and sustain large liquidity cushion
S&P Global AAA
(February 2019)
Credit rating is a key financial health indicator. AAA from both rating agencies affirm the City’s strong financial position.
The City is Rated Aaa / AAA
CoV->

45
The City has Two Triple-A Credit Ratings
Aaa
Aa1
Aa2
Aa3
NotRated
Vancouver Calgary Edmonton Regina Winnipeg London Ottawa Toronto Montreal Quebec
Moody's Investors Service
AAA
AA+
AA
AA-
NotRated
Vancouver Calgary Edmonton Regina Winnipeg London Ottawa Toronto Montreal Quebec
S&P Global Ratings
Note: No other B.C. local municipalities are rated because they borrow through the MFABC (which is rated Aaa/AAA)

46
It takes fiscal discipline & rigor to achieve AAA
2009 - Negative outlook re. Olympic
Village debt
Moody’s Investors Service/ S&P Global Ratings
Aaa / AAA Aa1 / AA+ Aa2 / AA
2001 2005 2010 2015 2018
+ $100M debt
+ $600M debt + $700M debt 2014 - Olympic Village
debt repaid
It doesn’t take much to get downgraded…it takes a lot to get upgraded…

47
Can the City borrow more?
Current Net Debt Projection
Olympic Village Add’l debt ~$150M over 10 yrs
to support asset renewal
Water Utility fully transitioned from debt to pay-as-you-go (2012-18)
Sewer Utility started in 2015, to continue in future Capital Plans

48
(City) Metric #1 - Debt Service as % of Op Revenue
Limit
(6% interest)

49
(Credit Rating) Metric #2 - Interest as % of Op Revenue
Limit
Target
(6% interest)

50
(Credit Rating) Metric #3 – Net Debt as % of Op Revenue
Limit
Target
(6% interest)

51
Are City taxes & fees competitive?

52
Do we have the right funding tools?
In 2018, the City started collecting Empty Homes Tax Proceeds are to be reinvested in affordable housing
The City has sought new funding tools such as revenue sharing of Provincial taxes (e.g. Property Transfer Tax), Traffic Camera Fines, Wireless Utility Taxes, and other property
tax enhancements.

53
B. Baseline Financial Review
Putting Financial Sustainability into practice

54
Long Term Financial Strategies: Capital Planning
• Maintain long-term financial health
• Uphold strong credit ratings (AAA)
• Minimize tax & fee impacts on businesses and residents
Align capital investments with the City’s financial & debt capacity
• Optimize the “municipal toolkit”
• Set acceptable & achievable service level
• Explore transformative service models

55
Long Term Financial Strategies: A Balancing Act - When to Pay
Pay In Advance: Set aside $ in reserves to fund future capital projects
The City takes a very careful approach to take on debt, and is acknowledged by the strong credit ratings & favorable borrowing rates.
Pay-As-You-Go: Use current $$ (taxes & fees)to fund regular, ongoing capital work
Pay Over Time: Borrow for major capital projects that benefit current & future residents & businesses, typically in 10-yr term

56
Long Term Financial Strategies: A Balancing Act - When to Pay

57
Long Term Financial Strategies: A Balancing Act - Who Pays
Taxes & Fees: Typically fund ongoing operating & capital work
While it is senior governments’ mandate to deliver transit, social housing & childcare, the City has used its regulatory tools & $$ to enable these
essential amenities to support residents & workers in Vancouver.
Developer Contributions: The City’s Financing Growth Policy (2004) stipulates that new & expanded amenities & infrastructure to support growth be funded through development contributions
External Partnerships: Leverage innovative partnership & funding opportunities to optimize tax $$

58
Long Term Financial Strategies: Development Contributions
Tools & Use: • Development Cost Levies (DCLs) are paid by most new development helping to fund:
Parks, Childcare, Affordable Housing & Engineering
• Density Bonusing contributions apply when increased floor space under existing zoning is granted in exchange for providing public amenities and affordable housing
• Community Amenity Contributions (CACs) are in-kind or cash contributions for public amenities when City Council allows additional development through rezoning
Principles: • New development pays its fair share of growth costs
• Transparent system
• Rates and contributions respect needs assessments and development economics
• Align with city public policy goals
Approval of any capital project requires that eligible funding is available to provide for all expenditures anticipated for the project.

59
Long Term Financial Strategies: Broad Public Support (2019-22 Capital Plan)
• 93% support maintaining the City’s strong credit ratings and keeping debt at manageable level
• 70% support using developer contributions to fund new infrastructure and amenities
• 92% support advocating for and pursuing senior government funding to support the City’s capital program

60
B. Baseline Financial Review
Terms of Reference

61
Financial Review Terms of Reference
• Staff support Council’s motion to engage a 3rd party to report on the current state of the City’s financial capacity as a baseline to support future budget decisions by Council.
• Staff have also identified that there is significant financial pressure to respond to the increasing needs of Vancouver as a growing city – including needs for service delivery, infrastructure renewal, increased amenities and increased scope of services that have traditionally been the responsibility of senior levels of government.
• Staff recommend Terms of Reference for a 3rd party that would achieve both the objectives of Council to better understand the city’s baseline financial position as well as to work with staff to understand municipal best practices and identify opportunities to address our growing demand by building our capacity for growth through improvements to our current service delivery and revenue models. The Terms of Reference would include 2 phases

62
Financial Review Terms of Reference A) Baseline Financial review:
– Review of Staff’s financial sustainability and capacity analysis including financial health metrics and targets
– Provide 3rd party insights and perspectives and identify risk, opportunities, and feedback on key financial sustainability and capacity metrics
– Develop a baseline report to summarize for Council a baseline of knowledge of the City’s current financial status and health and key financial challenges over the next 10 years to inform decision-making in the 2020 budget process
B) Building Capacity for Growth:
– Identify municipal, public and private sector best practices aligned to the City’s baseline situation, identifying appropriate benchmarking comparators appropriate to the City of Vancouver context;
– Identify initiatives for a limited set of key impact areas that are sufficient in size and scope to achieve financial sustainability targets over the next 10 years considering estimated cost and service demand growth.

63
Financial Review Terms of Reference Timeframe:
– Phase A: • Short term focus building on existing staff information. • RFP will be issued in March, with work to begin in April • Report back by June to provide information to inform 2020 budget process
– Phase B: • Initiatives would be developed based on a 10 year outlook, with a focus on:
– Deliverables in the 3-5 year timeframe, and – Quick wins identified for the upcoming budget year;
• Report back by September 2019 to inform work plans for 2020 to address key initiative areas. Quick Wins to be incorporated into 2020 budget.
Budget:
– Approximately $50 - 100,000, to be finalized following an RFP process. Funding for this work would be from prioritizing within the existing 2019 operating budget.
Future work and budget:
– Following completion of Phase B, the City may choose to action the recommended initiatives. Staff and/or consulting work associated with those initiatives would require an additional budget outside of this ToR.

64
C. Proposed budget process timeline

65
Council Motion
– THAT Council direct staff report back in Q1 2019 with a plan for an enhanced budget development process for the upcoming 2020 fiscal year and future fiscal years that includes:
• A strategy planning session with Council early in each fiscal year to
review and establish strategic directions and priorities;
• Budget workshops with Council to establish an iterative and informed budget development process, including proposed property tax increases as well as savings and spending proposals.

66
Proposed budget process timeline
Feb – March
•Preparing for the budget cycle
•Mid-Feb - Report back to Council on high-level differences in the budget between 2008-2018
•Early March -Information sharing for Council on 2020 budget process
April – July
• Setting the stage for the 2020 budget and 5 Year Plan
• April – Special Meeting of Council - Strategic Priority Setting
• May/June – 2nd Information Sharing including Civic Service Satisfaction Survey results
• June – Report back to council on Baseline review
• July – Budget Outlook presented to council
Sept – Oct.
• Building the 2020 Budget
• September/October – Additional Information Sharing
Nov – Dec
•Finalizing the Budget
•November - Budget Consultation
•December Council Meeting – Council motions for proposed amendments •Final approval of budget
Denotes budget direction from Council Budget information shared with Council
Public Engagement throughout the budget process

67
What we’ve heard – Public Engagement
• Include the voices of the underrepresented groups and small business in a deeper way before the Budget is developed.
– low income and Participatory budgeting is showing us how communities can make decisions about the budget
• Transferring the emphasis from going later in the year to earlier in the year to hear what residents and businesses tell us about their services and satisfaction
• Be open to new ideas and working towards new ways to explain the city’s budget process.

68
In conclusion
A lot of important work done to date Many challenges and opportunities ahead
Important to maintain strong financial health and look for
opportunities to learn from other cities to be more competitive

69
Questions