report card 2018 - environment protection authority
TRANSCRIPT


Report Card 2018–19
2
Summary
A Report Card is made for the water quality in Port Phillip Bay, Western Port and the
Gippsland Lakes and their catchments every year (Figure 1). Environment Protection
Authority Victoria (EPA), Melbourne Water and the Department of Environment, Land,
Water & Planning (DELWP) monitor the water quality in these regions for use in the report.
The Report Card uses key indicators of environmental water quality to calculate an overall
score for a 12-month period, which generates a rating of ‘Very Poor’, ‘Poor’, ‘Fair’, ‘Good’
or ‘Very Good’. This Report Card includes results from July 2018 to June 2019.
Over the 2018–19 period, water quality in the bays, lakes and waterways was similar to
previous years, or in some cases, marginally better.
Water quality was mostly ‘Very Good’ or ‘Good’ for rivers in the elevated areas where
most rivers originate (the upper catchment). Water quality declined to ‘Poor’ or ‘Very Poor’
as the rivers moved through rural, agricultural and urbanised areas in the foothills and
coastal plains of the lowlands (the mid and lower catchments, respectively). In the bays
and lakes, water quality was mostly ‘Very Good’ or ‘Good’ for areas that are able to mix
with the open ocean. Like the catchments, water quality was worse where rivers transport
pollutants from urban and industrial areas.
Rainfall data from the Bureau of Meteorology shows that Victoria had below average
rainfall in 2018–19. These dry conditions would have reduced the volume of stormwater
run-off, which can carry pollutants and impact waterways. The dry conditions resulted in
less freshwater input to the bays and lakes. However, some locations, such as Corinella
(Western Port), Lake Wellington (Gippsland Lakes), and waterways in urban and rural
settings continued to be influenced by pollutants in the sediments.
This year, water quality was assessed against environmental quality objectives in the
State Environment Protection Policy (Waters) (SEPP (Waters)). These updated objectives
better reflect overall condition and an improved scientific understanding of these aquatic
ecosystems.
The annual Report Card has been available on the Yarra & Bay website since 2013.
This year, Report Card 2018–19 is a stand-alone report instead of a series of web pages.
Contents
Summary ....................................................................................................................... 2
Contents ........................................................................................................................ 2
What is the Report Card? ............................................................................................... 3
How are the scores calculated? ...................................................................................... 3
New objectives for analysing water quality ...................................................................... 3
Weather in 2018–19....................................................................................................... 3
Port Phillip Bay and catchment ....................................................................................... 4
Western Port and catchment .......................................................................................... 6
Gippsland Lakes and catchment..................................................................................... 8
Further information ...................................................................................................... 10
Figure 1: Location of Port Phillip Bay, Western Port, Gippsland Lakes (dark shading) and their catchments (light shading).

Report Card 2018–19
3
What is the Report Card?
The Report Card provides a snapshot of water quality in Port Phillip Bay, Western Port,
Gippsland Lakes and the waterways in their catchments for 2018–19. These bays and
lakes are the largest coastal waterbodies in Victoria. The waterways form a complex
network of rivers, wetlands and estuaries. They are of immense cultural, economic and
environmental value. For information on the suitability of waterways for recreational use
based on microbiological indicators, see our Yarra Watch and Beach Report programs.
How are the scores calculated?
Key indicators of water quality are assessed against Victorian environmental quality
objectives for relevant indicatators in the SEPP (Waters) and combined to calculate an
overall water quality index score (WQI) out of 10 that corresponds to a rating of Very Poor
to Very Good (Table 1). WQI scores are determined for the 12-month period from July
2018 to June 2019.
The water quality indicators used for catchment waterway sites are:
• dissolved oxygen
• metals
• nutrients (total nitrogen and total phosphorous)
• pH
• salinity (except for estuarine sites where the salinity is not used)
• water clarity.
The indicators used for bay and lake sites are:
• algae (chlorophyll-a)
• dissolved oxygen
• metals, where available
• nutrients (total nitrogen for Port Phillip Bay and Western Port and total phosphorous for the Gippsland Lakes)
• salinity
• water clarity.
These are key indicators that gauge the overall condition of aquatic ecosystems. The
scores are summarised at the catchment and bay scale by considering the area of the
sub-catchments and marine zones that each site or sites represents and calculating area-
weighted average scores.
New objectives for analysing water quality
WQI scores are calculated based on attainment of environmental quality objectives for
relevant indicators in the SEPP (Waters). SEPP (Waters) replaces SEPP (Waters of
Victoria) and its schedules, and SEPP (Groundwaters of Victoria). A summary of how
objectives were developed for SEPP (Waters) is available in Development of indicators
and objectives for SEPP (Waters) (EPA publication 1733).
Weather in 2018–19
In 2018–19, the weather in Victoria was relatively dry compared with the long-term
average (Figure 2). The Gippsland region and parts of the upper Yarra catchment were
particularly dry, with rainfall well below average conditions.
Weather fluctuations influence WQI scores. Long-term dry spells can result in reduced
river flows, decreased run-off of pollution into waterways, increases in salinity and more
frequent or prolonged algal blooms. Conversely, wetter conditions can increase transport
of stormwater-derived pollutants (including nutrients and sediment) from the catchment
into waterways and the bays.
Figure 2: Victorian rainfall decile ranges from 1 July 2018 to 30 June 2019. (Source: © Commonwealth of Australia 2020, Bureau of Meteorology.)
Table 1: Water quality index (WQI) scoring categories for Report Card.
Water quality index score
Rating Description
8–10 Very Good High quality waterways generally unimpacted by
pollution
6–8 Good Meets Victorian water quality objectives
4–6 Fair Some evidence of stress
2–4 Poor Under considerable stress
0–2 Very Poor Under severe stress

Report Card 2018–19
4
Port Phillip Bay and catchment
Port Phillip Bay is a large, shallow embayment, 1,930 km2 in size. It is surrounded by a
catchment of 10,000 km2 that is mostly rural, but has large urban areas around its
shoreline including Victoria’s two largest cities: Melbourne and Geelong. The Yarra,
Maribyrnong, and Werribee are major river systems with flows linking the hills and
mountains in the upper forested reaches to rural properties and townships, rivers,
wetlands and the bay. Connected to Bass Strait by a narrow entrance, water in the bay
has a long residence time (the average amount of time water spends in an area) of about
400 days. It is a popular location for recreational activities including boating, fishing and
swimming, and it supports Victoria’s largest recreational fisheries.
The Report Card for Port Phillip Bay and catchment waterways is calculated using data
from Melbourne Water and EPA. Melbourne Water monitor water quality at more than 100
sites in the catchment. EPA monitors water quality at six sites in the bay. Only sites that
have a minimum of six samples within the 12-month period are used to calculate the score
so that the Report Card reflects as far as possible the prevailing conditions across
the year.
In 2018–19, water quality in Port Phillip Bay and its catchment varied from ‘Very Good’ in
areas of the bay, to ‘Very Poor’ in highly urbanised waterways of the catchment.
Catchment Report Card
Port Phillip Bay comprises six catchments: Yarra, Werribee, Maribyrnong, Dandenong,
Mornington and Bellarine (Figure 3).
Yarra catchment
The Yarra catchment is home to more than one-third of Victoria’s population. Overall,
water quality in the Yarra catchment was ‘Poor’ in 2018–19, however, conditions have
improved since 2000 (Figures 4 and 5).
Water quality was ‘Good’ in the upper reaches of the Yarra catchment in forested areas,
but declined to ‘Very Poor’ as it flowed into the urban areas of Melbourne.
Figure 4: WQI scores for 2018–19 for the Yarra catchment. Grey bars are the individual indicators used to calculate the overall WQI score. White and grey background shading corresponds to the WQI
score ranges shown in Table 1.
Figure 5: Historical WQI scores for the overall Yarra catchment. Colour indicates WQI score for
each year.
Werribee, Maribyrnong, Dandenong and Mornington catchments
Water quality was ‘Good’ in the forested upper Werribee and Maribyrnong catchments,
‘Very Poor’ in the highly urbanised areas of the Dandenong and Mornington catchments
(Figure 3).
Bellarine catchment
The Bellarine catchment is outside Melbourne Water’s service area. Waterwatch data is
available for the Bellarine, however, it is not collected in a way consistent with the data
collected in the other catchments used in this Report Card. Therefore, a WQI score cannot
be calculated for Bellarine catchment and no WQI score is reported here. Figure 3: Location and WQI scores of Melbourne Water’s monitoring sites in the Port Phillip catchment. Colour indicates WQI score for each site in 2018–19.

Report Card 2018–19
5
Bay Report Card
Overall, water quality in Port Phillip Bay was ‘Good’ in 2018–19. Higher nutrient and
salinity levels, due to dry weather, resulted in a ‘Fair’ rating for these parameters
(Figure 6).
Figure 6: WQI scores for Port Phillip Bay in 2018–19. Grey bars are the individual indicators used to calculate the overall WQI score. White and grey background shading corresponds to the WQI score
ranges shown in Table 1.
Figure 7: Historical WQI scores for Port Phillip Bay.
EPA has six monitoring locations in Port Phllip Bay (Figure 8). Conditions in Port Phillip
Bay have remained relatively steady since 2002 with overall water quality fluctuating
between ‘Good’ to ‘Very Good’ annually (Figure 7). Port Phillip Bay has a large volume,
mixes with clean oceanic waters from Bass Strait over time, and supports natural
processes that remove nutrients from water. This means, even though the rivers and
streams entering Port Phillip Bay introduce water of poor quality (Figure 3), the bay has a
strong capacity to clean itself and maintain good water quality (Figure 8).
Dromana
Dromana had ‘Very Good’ water quality because the southern area of Port Phillip Bay is
well flushed with oceanic water from Bass Strait due to regular tidal exchange.
Central Bay and Patterson River
The Central Bay area, including Patterson River, had ‘Very Good’ water quality. Water
quality can decline during periods of very high rainfall. Increased flows from the Werribee
and Yarra Rivers, following rain, transports high levels of nutrients and sediments to the
northern and eastern parts of the bay, stimulating algal growth and reducing light clarity.
Corio Bay, Long Reef and Hobsons Bay
Corio Bay, Long Reef and Hobsons Bay had ‘Good’ water quality but were influenced by
river flows, run-off and stormwater that carry pollutants, such as nutrients, sediments
and metals.
Figure 8: Locations and WQI scores of EPA long-term marine monitoring sites in Port Phillip Bay.
Rainfall data from the Bureau of Meteorology showed the 2018–19 period had below-
average rainfall, and areas of the Yarra catchment had particularly low rainfall (Figure 2).
These conditions would have reduced the volume of polluted stormwater run-off. Dry
years also cause elevated salinity in Port Phillip Bay, with less freshwater inputs to counter
evaporation, resulting in Bay waters being saltier than oceanic waters in Bass Strait.

Report Card 2018–19
6
Western Port and catchment
Western Port is a well-flushed, semi-enclosed bay, 680 km2 in size, with two large islands
(Phillip Island and French Island) that constrain water flow. The catchment is 3,400 km2
and is largely rural (70%), with state reserves (20%) in the upper catchment, and a fast-
growing urban growth corridor.
Waterways in the catchment flow through areas that have been highly modified to support
rural and green wedge land use, but it also supports significant environmental values,
including vegetated areas near the Bunyip State Park and Strzelecki Ranges. The
northern and eastern areas of the bay are mostly intertidal mudflats dominated by
catchment inflows from the Bunyip, Lang Lang and Bass Rivers. The western and
southern areas are highly influenced by tidal exchange with Bass Strait waters.
The Report Card for Western Port and its catchment is calculated using data from
Melbourne Water and EPA. In 2018–19, water quality varied from ‘Good’ in areas of the
upper catchment and the bay, to ‘Very Poor’ in highly urbanised or intensive agricultural
areas of the catchment.
Figure 9: Historical WQI scores for the overall Western Port catchment.
Catchment Report Card
Overall, the water quality in Western Port catchment’s waterways was ‘Poor’ for 2018–19.
Since 2000, scores for the Western Port catchment have remained relatively steady over
time and mostly shown ‘Poor’ water quality (Figure 9).
Melbourne Water routinely collects water samples across waterways of the Western Port
catchment to assess how water quality is changing over time. Not all monitored sites
produce a WQI score every year due to insufficient or unsuitable data. In 2018–19, 15
sites in the Western Port catchment were used to calculate the WQI score (Figure 10).
Water quality was ‘Good’ in the upper catchment of the Bunyip and Tarago River system,
Cardinia Creek and Lang Lang River. Water quality then declined to ‘Poor’ or ‘Very Poor’
in waterways in the mid and lower catchment as the land use changes into rural,
agricultural and urbanised areas.
The Western Port catchment has been significantly altered by vegetation clearing, draining
of the Koo Wee Rup swamp and the progressive growth of agriculture and urban areas.
The resulting altered drainage regimes and intensive land uses present significant
challenges for maintaining water quality in these rivers and streams.
Figure 10: Location and WQI scores of Melbourne Water’s monitoring sites in the Western Port catchment.
Report Card 2018–19
7
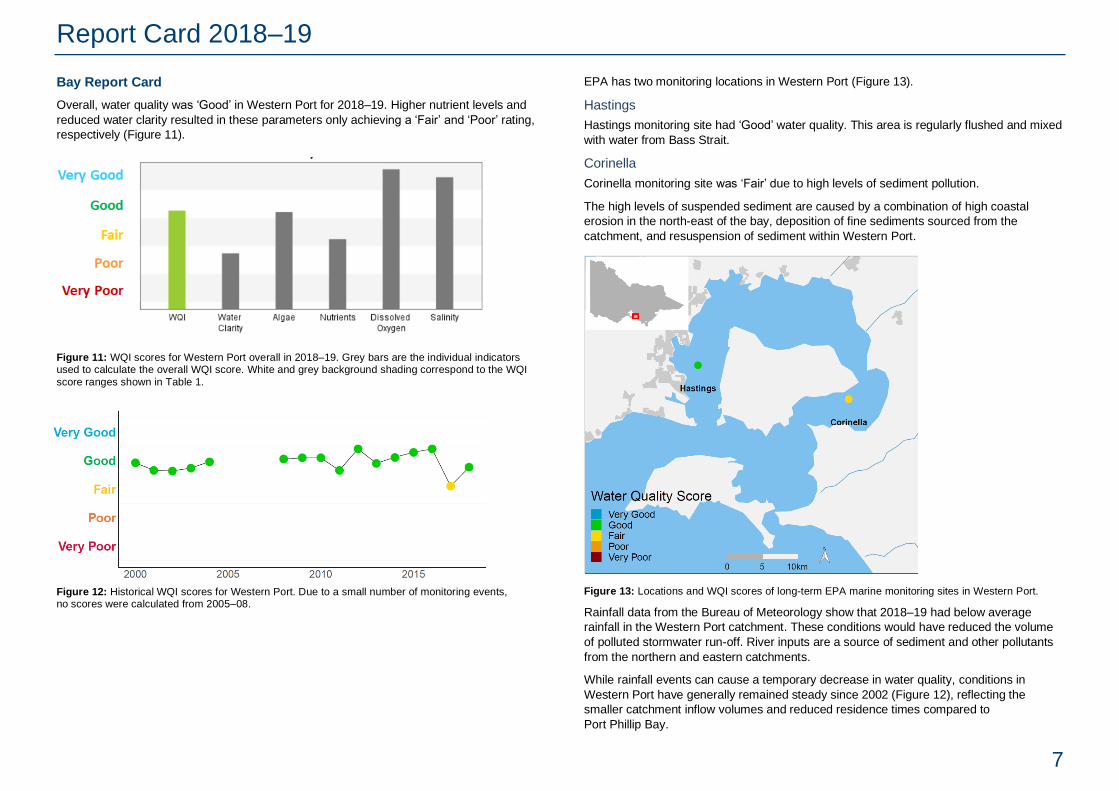
Bay Report Card
Overall, water quality was ‘Good’ in Western Port for 2018–19. Higher nutrient levels and
reduced water clarity resulted in these parameters only achieving a ‘Fair’ and ‘Poor’ rating,
respectively (Figure 11).
Figure 11: WQI scores for Western Port overall in 2018–19. Grey bars are the individual indicators used to calculate the overall WQI score. White and grey background shading correspond to the WQI
score ranges shown in Table 1.
Figure 12: Historical WQI scores for Western Port. Due to a small number of monitoring events, no scores were calculated from 2005–08.
EPA has two monitoring locations in Western Port (Figure 13).
Hastings
Hastings monitoring site had ‘Good’ water quality. This area is regularly flushed and mixed
with water from Bass Strait.
Corinella
Corinella monitoring site was ‘Fair’ due to high levels of sediment pollution.
The high levels of suspended sediment are caused by a combination of high coastal
erosion in the north-east of the bay, deposition of fine sediments sourced from the
catchment, and resuspension of sediment within Western Port.
Figure 13: Locations and WQI scores of long-term EPA marine monitoring sites in Western Port.
Rainfall data from the Bureau of Meteorology show that 2018–19 had below average
rainfall in the Western Port catchment. These conditions would have reduced the volume
of polluted stormwater run-off. River inputs are a source of sediment and other pollutants
from the northern and eastern catchments.
While rainfall events can cause a temporary decrease in water quality, conditions in
Western Port have generally remained steady since 2002 (Figure 12), reflecting the
smaller catchment inflow volumes and reduced residence times compared to
Port Phillip Bay.

Report Card 2018–19
8
Gippsland Lakes and catchment
The Gippsland Lakes are a series of large, shallow coastal lagoons, 354 km2 in size, and
approximately 70 km in length. The lakes are connected to Bass Strait by a narrow,
artificially maintained channel at Lakes Entrance. The catchment is 20,600 km2 consisting
of mostly state reserves, forests and national parks (60%) and rural land (39%).
Five major river systems drain directly into the lakes and out into Bass Strait through
the entrance.
The Report Card for Gippsland Lakes and the catchments is calculated using data from
DELWP and EPA. In 2018–19, water quality varied from ‘Very Good’ in the majority of the
catchments, to ‘Poor’ in the lower reaches of main rivers and Lake Wellington (Figure 14).
Catchment Report Card
Figure 15: Historical WQI scores for the Gippsland catchment.
Overall, the water quality in Western Gippsland was ‘Good’ and in Eastern Gippsland was
‘Very Good’ in 2018–19. Scores have remained steady over time in both the western and
eastern catchments (Figure 15).
In the Gippsland catchments, the forested areas on the slopes of the Great Dividing
Range maintained ‘Very Good’ water quality with low levels of salinity and nutrients due to
minimal human impact. Historic clearing of vegetation for agriculture and mining has
impacted water quality in some areas, such as the upper Tambo River. Urbanisation has
impacted water quality along the lower reaches of the main rivers.
Figure 14: Location and WQI scores of DELWP’s monitoring sites in the Gippsland Lakes catchment.

Report Card 2018–19
9
Lakes Report Card
EPA has five monitoring locations in the Gippsland Lakes (Figure 18). Monitoring locations
closer to the entrance to Bass Strait (Shaving Point, Lake King) had better water quality
due to greater tidal exchange. Inland monitoring locations (Lake Wellington, Lake Victoria)
were impacted by polluted water discharging from rivers in the catchment.
Overall, water quality was ‘Poor’ in Lake Wellington and ‘Good’ in the eastern lakes (Lake
Victoria, Lake King) during 2018–19 (Figures 16 and 17).
Figure 16: WQI scores for Lake Wellington in 2018–19. Grey bars are the individual indicators used
to calculate the overall WQI score. White and grey background shading corresponds to the WQI score ranges shown in Table 1.
Figure 17: WQI scores for eastern lakes (Lake Victoria, Lake King) in 2018–19. Grey bars are the individual indicators used to calculate the overall WQI score. White and grey background shading
corresponds to the WQI score ranges shown in Table 1.
Figure 18: Locations and WQI scores of EPA’s long-term marine monitoring sites in Gippsland Lakes.
Historically, water quality in Lake Wellington has typically been rated as ‘Poor’ or ‘Very
Poor’ (Figure 19). The three sites in Lake King show more inter-annual variability due to
fluctuating climatic conditions.
Figure 19: Historical WQI scores for Lake Wellington. Due to a small number of monitoring events, no scores were calculated for some years between 2001–2006.
In the 2018–19 period, the Gippsland region experienced drought. This reduced the
volume of water coming into the Gippsland Lakes from rivers. This water would bring
pollutants such as sediment and nutrients.
Lake Wellington is a sink for sediments, nutrients and contaminants. Wind and waves
within the shallow waters of the lake can resuspend sediments and nutrients. Algal blooms
often develop because of the high availability of nutrients. These processes are reflected
in the ‘Poor’ WQI score in 2018–19 (Figure 16), even though rainfall was low. By contrast,
decreased river inputs of catchment derived sediments and nutrients entering the deeper
and more stratified Eastern Lakes resulted in ’Good‘ water quality in 2018–19.

Report Card 2018–19
10
Further information
For further information or to request water quality data, please contact:
• DELWP (Gippsland catchments): [email protected]
• EPA Victoria (Port Phillip Bay, Western Port and the Gippsland Lakes):
• Melbourne Water (Port Phillip and Western Port catchments):