report documentation page form approved ...s staffing, and thus labor costs, is at the appropriate...
TRANSCRIPT

REPORT DOCUMENTATION PAGE Form ApprovedOMB No. 0704-0188
The public reporting burden for this collection of information is estimated to average 1 hour per response, including the time for reviewing instructions, searching existing data sources,gathering and maintaining the data needed, and completing and reviewing the collection of information. Send comments regarding this burden estimate or any other aspect of this collection ofinformation, Including suggestions for reducing the burden, to Department of Defense, Washington Headquarters Services, Directorate for Information Operations and Reports (0704-0188),1215 Jefferson Davis Highway, Suite 1204, Arlington, VA 22202-4302. Respondents should be aware that notwithstanding any other provision of law, no person shall be subject to anypenalty for failing to comply with a collection of information if it does not display a currently valid OMB control number.PLEASE DO NOT RETURN YOUR FORM TO THE ABOVE ADDRESS.1. REPORT DATE (DD-MM-YYYY) 2. REPORT TYPE 3. DATES COVERED (From - To)
29062005 Final Report I July 2004 to July 20054. TITLE AND SUBTITLE 5a. CONTRACT NUMBER
Evaluating Operating Room Turnaround Times and Cancellations atEisenhower Army Medical Center 5b. GRANT NUMBER
5c. PROGRAM ELEMENT NUMBER
6. AUTHOR(S) 5d. PROJECT NUMBER
William L. Amsink CPT, AN
5e. TASK NUMBER
5f. WORK UNIT NUMBER
7. PERFORMING ORGANIZATION NAME(S) AND ADDRESS(ES) 8. PERFORMING ORGANIZATION
Eisenhower Army Medical Center REPORT NUMBER
Bld 300 Hospital RoadFt Gordon, GA 30905
9. SPONSORING/MONITORING AGENCY NAME(S) AND ADDRESS(ES) 10. SPONSOR/MONITOR'S ACRONYM(S)
U.S. Army Medical Department Center and SchoolBLDG 2841 MCCS-HFB (Army-Baylor Program in Healthcare Administration)3151 Scott Road, Suite 1411 11. SPONSOR/MONITOR'S REPORTFt Sam Houston, TX 78234-6135 NUMBER(S)
4-0512. DISTRIBUTION/AVAILABILITY STATEMENT
Approved for public release; distribution is unlimited
13. SUPPLEMENTARY NOTES
14. ABSTRACT
Two costly problems in the operating room (OR) are lengthy turnaround times between surgical cases and the waste of resourcesand OR time due to high cancellation rates. By reducing turnaround time, staff overtime can be reduced and more cases can bescheduled during the day. Archival data were reviewed on 3727 surgical cases from a U.S. Government medical facility database.This study describes the inefficient use of the current operating room management software system, and identifies strategies toimprove operating room efficiency by analyzing the most common causes of delays and cancellations using accurate data andmeaningful reports. Personal accountability, teamwork, scheduling, and accurate data are all major factors in improving efficiency.
15. SUBJECT TERMS
16. SECURITY CLASSIFICATION OF: 17. LIMITATION OF 18. NUMBER 19a. NAME OF RESPONSIBLE PERSONa. REPORT b. ABSTRACT c. THIS PAGE ABSTRACT OF Education Technician
PAGESLU 48 19b. TELEPHONE NUMBER (Include area code)
(210) 221-6443
Standard Form 298 (Rev. 8/98)Prescribed by ANSI Std. Z39.18
'1 ti

Evaluating Turnaround 1
Running Head: EVALUATING OPERATING ROOM EFFICIENCY
Evaluating Operating Room Turnaround Times and Cancellations at
Dwight D. Eisenhower Army Medical Center
Graduate Management Project
William L. Amsink, CPT, U.S. Army
United States Army-Baylor University
Graduate Program in Health Care Administration
10 June, 2005
20060315 122

Evaluating Turnaround 2
Abstract
Two costly problems in the operating room (OR) are lengthy
turnaround times between surgical cases and the waste of
resources and OR time due to high cancellation rates. By
reducing turnaround time, staff overtime can be redpced and more
cases can be scheduled during the day. Archival data were
reviewed on 3727 surgical cases from a U.S. Government medical
facility database. This study describes the inefficient use of
the current operating room management software system, and
identifies strategies to improve operating room efficiency by
analyzing the most common causes of delays and cancellations,
using accurate data, and developing meaningful reports. Personal
accountability, teamwork, scheduling, and accurate data are all
major factors in improving efficiency.
Evaluating Tumaround 3
Table of Contents
Introduction 4
Dwight D. Eisenhower Army Medical Center 4
Conditions That Prompted the Study 6
Statement of the Problem 7
Literature Review 8
Purpose 23
Methods and Procedures 24
Results 28
Discussion 33
Conclusion and Recommendations 40
Figure Captions 46
Figures 48
References 49
Evaluating Turnaround 4
Introduction
Overview of Dwight D. Eisenhower Army Medical Center (DDEAMC)
DDEAMC was originally built as the Camp Gordon Station
Hospital in 1941 to provide care for World War II casualties
(Eisenhower Army Medical Center, 2004). At the peak of the war,
DDEAMC was capable of handling 1,600 inpatients. After the war,
there was little need for such a large facility and DDEAMC was
closed in 1946. The hospital reopened with the threat of the
Cold War, and fluctuated in size during the Korean and Viet Nam
Wars. During the Korean War, officials realized that the medical
facility was in poor repair and needed to be replaced in order
to become a viable medical treatment facility to meet the future
needs of the Army. A new medical center with research and
teaching capabilities in addition to the fundamental patient
care mission was planned. Construction began on April 23, 1971.
The facility was dedicated on April 24, 1975, but it would not
be ready for its first patient until April of the next year
(Eisenhower Army Medical Center, 2004).
The mission of DDEAMC is similar to that of most Army
medical facilities: supporting the readiness and health care of
our active duty forces and providing quality health care to
eligible beneficiaries in the Southeastern Region (Eisenhower
Army Medical Center, 2004). DDEAMC has a current capacity of 150
inpatient beds and encompasses 28 different specialty clinics
Evaluating Turnaround 5
that provide care to a population of over 1,000,000
beneficiaries from eight states and Puerto Rico (Eisenhower Army
Medical Center, 2004). The average daily workload consists of 70
inpatients, 43 admissions, 1,164 outpatient visits, 20 surgical
procedures, and filling over 3,000 prescriptions (Patient
Administration Department, 2002). DDEAMC was the first
designated Department of Defense Specialized Treatment Service
(STS) Facility for Cardiac Surgery and Interventional Cardiology
in 1996. Prior to the STS designation, DDEAMC was performing
approximately 180 cardiac cases per year; however, since the
designation, the number of cases increased to over 300 per year
(Eisenhower Army Medical Center, 2004). The increase in cardiac
caseload is essential to the teaching and education mission of
the facility.
Approximately 115 residents and interns are currently in
training at DDEAMC. The graduate medical education department at
DDEAMC includes programs in family practice, internal medicine,
general surgery, oral surgery, orthopedic surgery, transitional
internship, clinical psychology, surgical podiatry, health care
administration, and nurse anesthesia (Graduate Medical Education
Office, 2004). DDEAMC is also the training site for several
technical specialties for enlisted soldiers, such as the 91W
licensed practical nurse program, the physician assistant
program, and laboratory and x-ray technologists (Graduate
Evaluating Turnaround 6
Medical Education Office, 2004). Students from the Health
Professional Scholarship Program and the Uniformed Services
University of the Health Sciences also train at DDEAMC.
Conditions that prompted the study
Civilian healthcare facilities, whether for-profit or not-
for-profit, are not funded in the same manner as military
hospitals. Nevertheless, military hospital commanders are under
the same financial pressures as civilian hospital executives.
Factors such as increasing demand for services, elevated patient
expectations, and high costs for technology-intensive
treatments, mean that commanders must ensure that all aspects of
hospital services offer value to beneficiaries while keeping the
costs to the taxpayers as low as possible (Nicholson, 1997).
Surgical services are the second most costly area to operate at
the medical center, trailing only pharmacy services, and is thus
under constant fiscal scrutiny. The DDEAMC command is always
looking for new ways to improve the cost, quality, and access of
the military healthcare system, which prompted me to evaluate
the details of the surgical services.
Statement of the problem or question
Defining the problem gives a reason for doing the research
and work necessary to complete the project and provides a sense
Evaluating Turnaround 7
of direction for the evidence gathering action (Bardach, 2000).
A well-structured definition of the problem allows for a project
that is manageable and is likely to be completed within the time
constraints of the project (Bardach, 2000).
DDEAMC's annual operating budget for surgical services is
nearly $18 million. Even with this robust budget, the facility
cannot afford to waste money by paying to staff underutilized
operating rooms and paying unnecessary overtime. Paying to
maintain excess capacity or inefficient usage of surgical
resources in one area means that other areas of need go
underfunded. Evaluating the turnaround time and efficiency of
the surgical services will provide the DDEAMC administration
with the information necessary to determine if the surgical
service's staffing, and thus labor costs, is at the appropriate
level. If excess capacity or correctable inefficiencies exist,
then labor costs could be significantly reduced by decreasing
the number of operating rooms used daily. In order to determine
if this is possible, this study will evaluate OR turnaround
times, which are a crucial factor in maintaining efficient OR
usage. Efficiency is, simply, maximizing the utilization of
available resources. Efficiency can be subdivided into
allocative, technical, and productive efficiency. Allocative
efficiency pertains to the distribution of limited resources; it
is not possible to reallocate resources without taking the

Evaluating Turnaround 8
resources from somewhere else (Clewer & Perkins, 1998).
Technical efficiency, also called cost efficiency and
operational efficiency, is the production of a given quantity of
output with the lowest cost combination (Clewer & Perkins,
1998). Productive efficiency means that the output unit is
produced with the least possible quantity of input, or
equivalently, maximum output with maximum input, which minimizes
the amount of waste (Clewer & Perkins, 1998). Productivity
measures are considered essential for strategic management
because they allow for comparison to benchmarks, history, and
competition (Griffith, 1999).
I hypothesize that if DDEAMC could consistently reduce
operating room turnaround time to the industry goal of 30
minutes or less, the amount of fully staffed operating rooms
could be reduced. Further, I hypothesize that if the current
case scheduling system improved, the utilization rate of the
operating rooms would also increase, which would also support
the objective of closing one of the operating room suites.
Literature review
The volatile combination of rising costs, declining
reimbursements, uncertain economy, and an increasing demand for
healthcare services poses a remarkable challenge for healthcare
professionals. The way that hospitals generate profit has
Evaluating Turnaround 9
changed dramatically over the past three decades. In the 1970s
and 1980s, most of a hospital's revenue was derived from
inpatient stays. There was little incentive to improve
efficiency; longer hospital stays meant larger profits. This has
changed--profits previously generated from inpatient diagnostic
procedures are diminishing, because these procedures are now
done on an outpatient basis with costly, sophisticated equipment
such as MRIs and CT scanners (Jackson, 2002). Additionally, with
enhancements in surgical technology, procedures that would have
previously required a lengthy hospital stay are now done through
minimally invasive techniques that enable quicker patient
recovery and shorter hospital stays (Jackson, 2002).
General accounting practice classifies the OR as a cost
center that is typically responsible for 20-40% of a hospital's
costs. Conversely, it has mistakenly been assumed that the OR
contributes roughly the same percentage of revenue back to the
hospital (Jackson, 2002). A survey of more than 200 hospital
executives revealed that 60% of executives thought that the 20-
40% cost/profit margin was accurate (Jackson, 2002). However,
the Towers Perrin actuarial firm reports 68% of hospital
revenues are surgery related, and this figure does not include
ancillary services such as lab and radiology procedures, which
are often generated by surgical procedures (Jackson, 2002).

Evaluating Turnaround 10
According to E.C. Murphy, the typical healthcare
organization is 2,000% more complex than the average business
and has five times as much regulatory oversight (Mailhot, 1996).
The typical operating room serves the needs of dozens of
surgeons, thousands of patients, and has interactions with
almost every department in the hospital--all while under the
scrutiny of the Joint Commission on Accreditation of Healthcare
Organizations (JCAHO), the Occupational Safety and Health
Administration (OSHA), the Food and Drug Administration (FDA),
the Centers for Disease Control and Prevention (CDC), the state,
and other regulatory bodies (Mailhot, 1996). With the tremendous
amount of oversight, changes in technology, changes in practice,
and changes in reimbursement, managing surgical services is a
complex, multifactorial task.
Running the OR is much more complex than the sum of the
individual variables that make up the parts. In addition to
quality care, the goal of any surgical services manager is to
ensure efficiency and proper utilization of the ORs. OR
efficiency is maximized by reducing the amount of time that an
OR is not being used for revenue-generation, that is, surgical
time (Dexter, Macario, 2004). Efficiency is achieved through
managing the many variables, such as having instrument sets
ready and lowering room turnover times, that affect the number
of cases completed in the allotted time.

Evaluating Turnaround 11
Utilization of the OR is determined by comparing the
difference between the time an OR is available for use and total
time (including turnover time) it is used for cases. For
example, if an OR is staffed for eight hours, and the last case
of the day ends after six hours, there are two hours of under-
utilization. This is a utilization rate of 75% (Dexter, 2003).
Extensive research has been done with the intent of increasing
OR utilization and therefore increase profits.
OR managers must focus on cost control and cost reduction
by finding ways to control supply inventory, standardize
equipment, and decrease practice variation (Mailhot, 1996). Many
variables must be considered when trying to improve OR
utilization: OR efficiency, unused OR time, overused OR time,
turnover time, staffing, supply sets, scheduled or block time,
bed availability, scheduling staff, scheduling patients, missing
paperwork, missing equipment, and cancellations are just a few
of the variables.
One of the most prevalent means of increasing OR
utilization is implementing the use of information management
(IM) and information technology (IT) systems. Operating room
data from the surgical IM system at Yale-New Haven Children's
Hospital indicated that only 26% of their scheduled first cases
start on time (Caramico, Kain, Gaal, Rimar, 1998), while the
best in practice boasts a 76% rate (Healthcare Financial

Evaluating Turnaround 12
Management, 2002). The reasons cited for the late cases were
late arrivals of the patient, nurse, surgeon, or
anesthesiologist. More details within each category were
recorded, such as premedication needed, no consent, equipment
delays, etc. The data were then posted near the recovery room
for the staff to view. After two months, 286 first cases were
analyzed, and the data from these cases showed a significant
increase in the number of first cases that started on time
(p=0.001) (Caramico, Kain, Gaal, Rimar, 1998). Perioperative
managers at Yale-New Haven Children's Hospital used the
introduction of this daily data feedback to increase the
efficiency of the operating room by getting the operating rooms
to start on time, merely by raising group consciousness. OR
management software is a very useful tool that can use
historical data as a baseline for measuring improvement and
competitive benchmarking.
Benchmarking has recently crossed industry lines to
identify breakthroughs in thinking. Benchmarking is typically
thought of as a comparison of some measure of quality or
performance factor among similar facilities. However, the
concept of benchmarking has evolved into four generations (Marco
& Hart, 2001). The first generation is referred to as reverse
engineering. This is done when a competitor's product is
analyzed and the desired attributes are copied (Marco & Hart,
Evaluating Turnaround 13
2001). Second generation benchmarking is done by making
comparisons of processes with competitors (Marco & Hart, 2001).
Third-generation benchmarking is also a comparison of process,
but the comparison is made to non-competitors outside one's own
industry, such as comparing scheduling operating rooms to
scheduling airline flights (Marco & Hart, 2001). The fourth
generation is strategic benchmarking, which entails developing a
systematic process for process evaluation and performance
improvement (Marco & Hart, 2001). Similar economic decisions are
made across industries to allow the process of third-generation
benchmarking. For example, with an average operating margin of
10%, the airline industry cannot afford to keep extra airplanes
around in case a plane has mechanical problems. Likewise, with
margins even lower than the airline industry, most hospitals
cannot afford to maintain fully staffed operating rooms, which
means excess capacity, because of inefficiencies in scheduling
and turnover (Marco & Hart, 2001).
Although OR practices have greatly improved in recent
years, approximately 50% of second cases do not start on time
because of preceding procedure overruns (Lebowitz, 2003). This
can be improved-- an effective use of IT systems is implementing
a computerized scheduling system that tracks historical data
about a specific surgeon and procedure combination to
approximate case duration. An accurate time estimate of each
Evaluafing Tumaround 14
procedure will reduce the amount of procedure-overrun time
(Lebowitz, 2003). One of the limitations with relying on
historical data is the insufficient amount of data on
infrequently performed surgeries or uncommon surgeon/surgery
combinations might be inadequate to provide reliable estimates.
In these cases, Lebowitz suggests using surrogate data: either
an average of all surgical times at the hospital for that
procedure or national data (2003). However, even with near-
perfect procedure estimates, variability in surgical procedures
is inevitable and on-time procedures should not be promised to
anyone. Uncertainty of procedure times is compounded as the
variability of each case is transmitted to each subsequent
procedure. Hence, the procedures that start later in the day
have less reliable start times than those scheduled earlier in
the day (Lovejoy & Li, 2002). This is the primary reason
surgeons prefer earlier start times and have an aversion to
later start times (Lovejoy & Li, 2002). Furthermore, practice
improvements must be addressed in many areas in order to improve
efficiency enough to increase overall OR utilization. One
important area that is often scrutinized, and is the focus of
this paper, is turnaround time or turnover time.
Turnaround time is defined as the total time that starts
when a surgeon leaves the OR after completing a case and ends
when a surgeon arrives in the OR for the next case (Adams,

Evaluating Turnaround 15
Warner, Hubbard, & Goulding, 2004). One of the greatest
dissatisfiers for the surgeons in the OR is the time they have
to wait between cases. Excessive turnaround time also affects
patients; they can become more anxious, frightened, and
frustrated the longer they have to wait. The nursing staff often
find themselves trying to console these irritable, unhappy
patients corralled in a holding area where they wait for
surgery.
Decreasing turnaround time is often the first objective
when trying to improve OR efficiency. Surgeons expect the time
from patient-out to patient-in to be kept to a minimum, Usually
30 minutes or less. The cost benefits of decreasing the
turnaround time are that staff overtime pay can be reduced and
more cases can be scheduled during the day. More cases per day
mean increased revenue and fewer patients on the wait list.
Valley Baptist Medical Canter in Harlingen, Texas, realized that
decreasing turnaround time is vital to maintaining the
hospital's margin. The hospital needed to become more efficient
because of the potential loss of surgical procedures to
competitive ambulatory surgery centers and other hospitals.
(Adams, Warner, Hubbard, & Goulding, 2004). The hospital
initiated the Six Sigma quality process. Six Sigma is a highly
disciplined process that helps the hospital measure, in
statistical terms, how many defects they have in a process and

Evaluating Tumaround 16
systematically determine how to eliminate them in order to get
as close to zero defects as possible (Adams, et al., 2004).
While Six Sigma shares several similarities with other quality
improvement initiatives such as Total Quality Management and
Continuous Quality Improvement (Adams, et al., 2004), Six Sigma
places emphasis on hard data, statistical tools, tracking
measures, and sustaining improvements (Adams, et al., 2004).
Valley Baptist also used an operating room scheduling
system (ORSOS) database to measure their turnaround data (Adams,
et al., 2004). The data during a base period established a mean
total turnaround time of 60.9 minutes with a standard deviation
of 23.8 minutes. The goal was a total time of 60 minutes with a
20-minute patient-out to patient-in time. Their current patient-
out to patient-in time is 22.8 minutes (a surgical center in
Chicago boasts a turnaround time of 10 to 15 minutes, allowing
one surgeon, using four rooms, to complete 28 cataract surgeries
in one day [Crain's Chicago Business, 2004]). Regression
analysis was used on three components of overall turnaround
time. When using the Six Sigma system, the component that showed
the greatest amount of variation would be the first process area
to focus on improving.
The results of the initiative revealed statistically
significant improvements in several areas. The patient-out to
patient-in time decreased 32%, standard deviation decreased 15%,
Evaluating Turnaround 17
and the cases outside specification decreased from 49% to 26%.
The surgeon-out to surgeon-in time was also reduced 32% (Adams,
et al., 2004). The study revealed that factors such as the time
of day and the day of the week, which were thought to have an
effect on turnaround time, showed no statistical significance
(Adams, et al., 2004).
Valley Baptist Medical Center employed several tactics to
improve their efficiency. First, they developed a systematic
approach to identify and improve one process at a time. Software
systems and the Six Sigma processes were then used to track and
analyze data. The Six Sigma initiative of continuous
communication became a very important part of the management and
quality culture (Adams, et al., 2004). The improvements
resulting from the process changes should allow an increase of
11 cases per month for General Surgery, the service studied, and
a potential of adding 42 cases per month if the process changes
can be applied to all surgery areas, for a total of 504
additional cases per year (Adams, et al., 2004). With the
average surgical service's contribution margin of $1225 per
case, the potential increase in revenue from the additional
cases would be $617,400 per year, excluding additional revenue
from ancillary services (Adams, et al., 2004).
The common frustrations that most medical facilities face
such as lack of block time, inefficient scheduling, delays,
Evaluating Turnaround 18
cancellations, and poor utilization are very costly and can be
difficult to correct. Sometimes facilities need to hire outside
consultants to objectively evaluate internal processes. With a
4% decrease in market share, an OR schedule that is nearly
impossible to access, and a loss of $1,800 for every unused OR
hour, one Midwest academic medical center called in physician
consultants to evaluate their OR turnaround process (Young &
Mazzei, 2003). The 750-bed facility's current turnaround time
averaged 85 minutes and the nurse turnover rate was 40% (Young &
Mazzei, 2003).
The processes that were recommended by the consultant group
can be replicated in any surgical setting:
1. Develop a surgical executive committee of executive
and medical leaders and key surgical leaders.
2. Appoint an anesthesiologist to direct perioperative
services. This person controls the OR schedule and
room assignments.
3. Allow the committee to collaborate in creating
guidelines for block time utilization. For example,
setting the OR utilization rate at 85% will ensure
that surgeons use their scheduled time.
4. Measure utilization monthly and provide surgeons
with a utilization report that includes OR time
Evaluating Turnaround 19
blocks, utilization, total OR time, and cases
cancelled.
5. Block time should be adjusted according to the
surgeon's utilization rate over a three month
period.
The first facility that adopted these recommendations increased
their market share 5% in the first 18 months (Young & Mazzei,
2003).
With so much effort committed to increasing the number of
scheduled cases, one must not forget to evaluate the reasons for
the cancellations of the surgical procedures that were already
on the schedule. The United Kingdom Audit Commission estimated
almost 78,000 operations in that country were cancelled in one
year alone due to equipment repair, operating room
refurbishment, and infection control (The Journal of Healthcare
Design & Development, 2003).
Staffing is another factor that affects the efficiency of
the OR that should be considered in process improvement.
Staffing, usually the second largest OR expense, after supplies,
is often linked to case volume. Experienced OR nurses and
support staff are expensive, and important parts of the flow in
the OR. An unpredictable OR schedule can lead to unnecessary
overtime. OR managers must know how much it costs to operate a
room per hour during normal work hours as well as after normal
Evaluating Turnaround 20
hours. After-hours salaries are much higher. Therefore, over-
utilization of the OR must be watched very closely. Managers
cannot afford to pay excessive overtime to add a low revenue-
producing elective case at the end of the day. Knowing the
baseline revenue that will be generated for each type of
procedure is valuable to the OR manager faced with making a
decision to proceed with a late elective case, a decision that
can be interpreted in terms of increased cost versus decreased
patient satisfaction. However, in a military facility, revenue
will not likely be produced for a late running case. Therefore,
it is imperative that the military OR manager know how much the
operating cost per hour is for after hour cases.
The operating room has traditionally been a major revenue
generator for hospitals. However, a recent industry study
indicates that the average OR runs at approximately 68%
capacity. With high fixed costs, excess capacity, and expensive
labor, the OR represents a significant opportunity for cost
control improvement (Healthcare Financial Management, 2002). In
a study comparing the clinical productivity of anesthesia
groups, private practice groups were shown to generate higher
revenue than academic groups because of the longer times per
procedure for the academic group (Abouleish, Prough, Whitten,
Zornow, Lockhart, Conlay & Abate, 2002). Typically, an academic
group has a higher portion of nonpaying or poorly paying

Evaluating Turnaround 21
patients and would have to work greater hours to generate the
same amount of revenue as the private practice group (Abouleish,
et al., 2002). Working longer hours to keep pace with private
civilian facilities would not earn a military facility more
revenue and could actually be costlier due to overtime labor
expenses.
Although these examples are from civilian hospitals, they
still have similarities with the dilemmas facing military
surgical services managers. This study was conducted in a
military hospital with several variables that are unique to the
military. Staffing at military hospitals is constantly in flux;
high turnover, departures for long term training, changes of
duty station, deployments, and employing activated reservists to
fill vacancies caused by deployed staff members all result in OR
staff constantly changing. A-second-factor that civilian
facilities do not contend with regularly is the fact that all
military providers are paid a salary that is not contingent on
case volume. A logical assumption would be to infer there is
little incentive for military surgeons to maximize the number of
cases performed. However, the work ethic of military surgeons
can vary from those on active duty only to pay back medical
school tuition, to surgeons dedicated to serving their country
to the best of their ability regardless of monetary rewards. A
third unique variable is that military beneficiaries do not pay
Evaluating Turnaround 22
directly for health care. Moreover, it is very difficult to get
patients to divulge information about third-party insurance
because they fear their premiums may go up, their policy may be
cancelled, or they feel that they are entitled to "free" health
care and should not have to resort to other insurance. They do
not understand that using alternate insurance will potentially
increase the benefits and services that they will use in the
military healthcare system.
Purpose
The purpose of this paper was to determine if reducing
turnover time would improve the efficiency of the operating
rooms enough to decrease the number of fully staffed rooms.
Increased operating room efficiency will decrease wait list
times, increase staff morale, and increase patient satisfaction.
Additionally, DDEAMC could save thousands of dollars in annual
labor costs by decreasing the amount of full time OR staff.
Methods and Procedures
The events measured in this study were turnaround time,
room availability/use, and cancellation rate. Data from DDEAMC's
operating room management software system (ORMA) will be
compiled in SPSS (Statistical Program for the Social Sciences).
Part of any research analysis is to ensure that the tool used to
Evaluating Turnaround 23
evaluate the problem is both valid and reliable. Validity
refers to the extent to which a test measures what it is
actually intended to measure. Reliability has to do with the
accuracy and precision of the measurement tool. Reliability is
a necessary contributor to validity but alone is not a
sufficient condition for validity (Cooper & Schindler, 2003).
Archival data from 1 January-31 December, 2004 was used in this
study.
Turnaround Time
Turnaround time has typically been defined as the total
time from when a surgeon leaves the OR after completing a case
to the time the surgeon arrives in the OR for the next case
(Adams, Warner, Hubbard, & Goulding, 2004). However, a
preliminary examination of the data has revealed that the time
the surgeon enters and leaves the operating room was not
recorded. Thus, for the purpose of this study turnaround time
was measured as the time period between one patient leaving the
room and the next one entering. Descriptive ratio datum was
calculated for average and standard deviations for turnaround
time. A categorical nominal measure was constructed for delayed
and on-time procedures. A procedure was considered delayed if
the turnaround time exceeded 45 minutes. For the first cases of
the day, a delay is defined as any procedure that starts 45
minutes past its scheduled starting time. Multiple regression

Evaluating Turnaound 24
was performed to determine which variables significantly
contribute to delay. The list of variables which were encoded in
the database that were loaded in the model and examined in the
analysis is displayed in Table 1. Finally, an ANOVA was
performed using the loaded variables.
Table 1.
A List of Variables Examined
Operating Room
Surgeon
Order in the day
First surgery of the day
Last surgery of the day
Number of surgeries in that Operating Room in one day
Month
Day of the week
Priority
If the surgery was delayed
Delay in minutes
Reason for the delay
Turnaround time
Nursing minutes
Evaluating Turnaround 25
Variables
The turnaround time is the dependent variable and the
independent variables are the factors that delay the operating
room turnover time: nursing, anesthesia, surgeon, housekeeping,
central medical supply (CMS), laboratory, patient, x-ray, and
other.
Data Collection
Data from DDEAMC's operating room management software
system (ORMA) was used to determine OR usage and turnover times.
All procedures that were performed in the operating rooms at
DDEAMC during the 2004 calendar year, a sum of 3722 procedures,
were included in the database. Eighteen instances were dropped
from the data set due to incomplete recording of data necessary
for the statistical analysis. The procedures were classified as
follows: 3444 were routine, 182 semi-emergencies, 48
emergencies, and 30 were coded as TSA (time space available).
The operating rooms were used for regularly scheduled cases on
241 out of 365 days and used an additional four days for
emergency procedures.
Nine separate categories were constructed for possible
reasons for delay and were as follows: no reason given,
anesthesia, central medical supply (CMS), housekeeping, OR,
patient, surgeon, ward, and other. A chi-square was performed
with the null hypothesis that the reasons for the delay would be
Evaluafing Turnaround 26
equally distributed across all conditions. The preliminary
results indicated support of the alternative hypothesis, that
delays were caused significantly more often by some reasons than
others, p<.01, (the long version of the statistic, 2(df=8,
n=216)= 109.67, p<.01). However, when the entire data set was
examined, no reason was recorded for the delay in over 31% of
delayed cases. The omission of data, which will be discussed in
the Results section, was a major factor in the outcome of the
study.
Results
One of the findings of this study was that DDEAMC's OR
turnaround times did not meet the industry standard of 30
minutes. In the course of this study, several problems that need
to be addressed to improve the turnaround time and therefore the
efficiency of the OR were uncovered. The study was originally
intended to focus on several separate steps that combine to make
up the total turnaround time. Although the operating room
management software that is used in the OR has the data fields
necessary to identify the specific areas of the turnaround time
that could benefit most from process analysis and improvement,
gathering the data turned out to be more complex than running a
query and analyzing the data. It turns out that the OR staff
does not track of some of the key data needed to measure the
specific areas that were originally intended to address. The

Evaluating Turnaound 27
inconsistent and inaccurate use of ORMA and incomplete data
collection are the first major findings of this study, which
will be discussed in depth later in this paper.
In order to determine exactly which part of the turnover
process should be analyzed first, the data on the times of four
different steps of the turnover process were needed. However,
the times needed for analysis were not being entered into the
ORMA system. The only time that was recorded was the patient-out
to patient-in time. Having data from only one of four periods
greatly decreased the utility of the data obtained from ORMA.
Operating room use and scheduling
The number of possible days for regularly scheduled
surgeries (241) was multiplied by the number of operating rooms
(8) to produce a baseline operating room availability of 1928
rooms for the entire year. The data reflects that at least one
surgery was scheduled in each room on each of the regularly
available rooms 87.75% of the time. Thus, of the 1928 rooms
available on regularly scheduled days, a room went unused 240
times. an other words, on average, one room was not used per
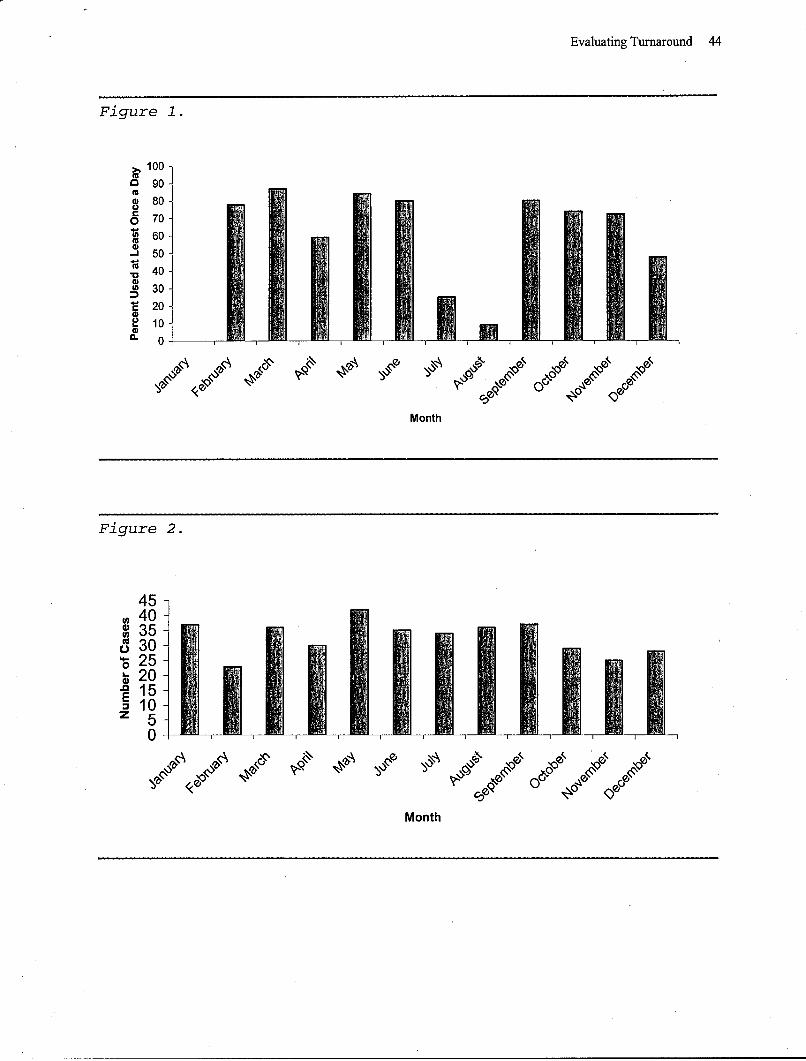
day. Figure 1 shows the percentage of days that the least
frequently used operating room per month was utilized. An
average of 2.64(SD=I.03) procedures were performed in each room
per day. Although a room was used on a given day, rooms were not
utilized to their full capacity. Approximately 10% of the time
Evaluating Turnaround 28
(373 instances), the procedures scheduled in a room were
completed by 1230. Furthermore, in 208 instances, procedures in
a particular room were completed by 1130, or 86% of the 241
operational days.
Across all months, the average number of days the least-
utilized operating room had at least one surgical procedure
performed in it was 57.9% of the time, with a standard deviation
of 30.58%. The minimum usage occurred in January, when no
surgeries were scheduled in one room for the entire month, while
March was the highest, with the least-used room being scheduled
for at least one surgery 86.9% of the potential days (see Figure
1).
Delays
A total of 859 procedures, or 23.19%, were delayed. An
analysis was performed to determine the items relating to delay.
One model focused primarily on scheduling factors (order in the
day, number of procedures scheduled in the room, etc.) while the
other model examined human performance issues (surgeon,
priority, reason for the delay, etc.). Of the two models, only
the first model, scheduling, accounted for enough variance,
69.87%, to permit further analysis. The failure of the human
performance model to account for enough variance may be
attributed to incomplete record keeping. For example, of the 859
delayed cases, 274 (31.89%) did not list a reason for the delay.
Evaluating Turnaound 29
The number of missing explanations, combined with a similar
number of delays listed as "other" under the main categories of
delay: anesthesia, surgeon, nursing, OR, and CMS, are the
reasons why the human performance model only accounted for
38.74% variance. Additionally, approximately 15% of the delay
reasons were ill defined, listing up to five reasons for delay,
without recording the most significant reason.
Delays were most strongly associated with the overall
busyness of an operating room and the order in the day the
procedure occurred. That is, as the number of procedures per
room increased, the procedure was more likely to be delayed; and
if the procedure occurred later in the day, the procedure was
even more likely to be delayed. Regardless of how many
procedures were conducted per operating room, the final
procedure of the day was also likely to be delayed. Finally,
unlike the Valley Baptist study mentioned earlier, delays were
more prevalent on the days later in the week and in the
beginning months of the year.
Procedures that ran past 1530
A total of 392 procedures (10.58%) of all procedures
extended past 1530. An average of 1.63 (SD=0.28) procedures per
day lasted past 1530. The percentages of procedures that lasted
past 1530, by priority status, are as follows: routine: 82.4%,

Evaluating Turnaound 30
semi-emergency: 11.99%, emergency: 3.57%, and TSA: 2.04% (time
space available).
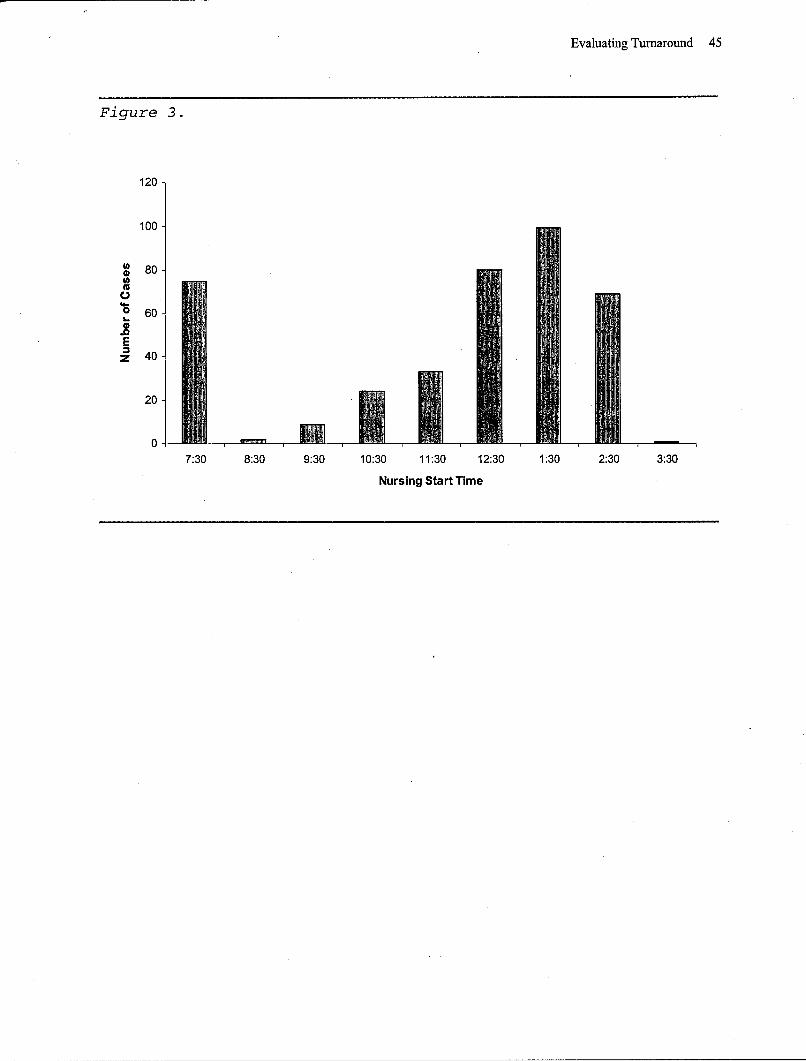
For procedures that ran past 1530, those that had nursing
start times before 0800 were delayed 13.33% of the time while
those that started after 0800'were delayed 54.43% of the time.
The average delay for cases starting before 0800 was 38.33
minutes (SD= 19.55) while the average delay for the cases
starting after 0800 was 66.82 minutes (SD= 81.00). Figure 2
shows the number of cases that went past 1530 per month.
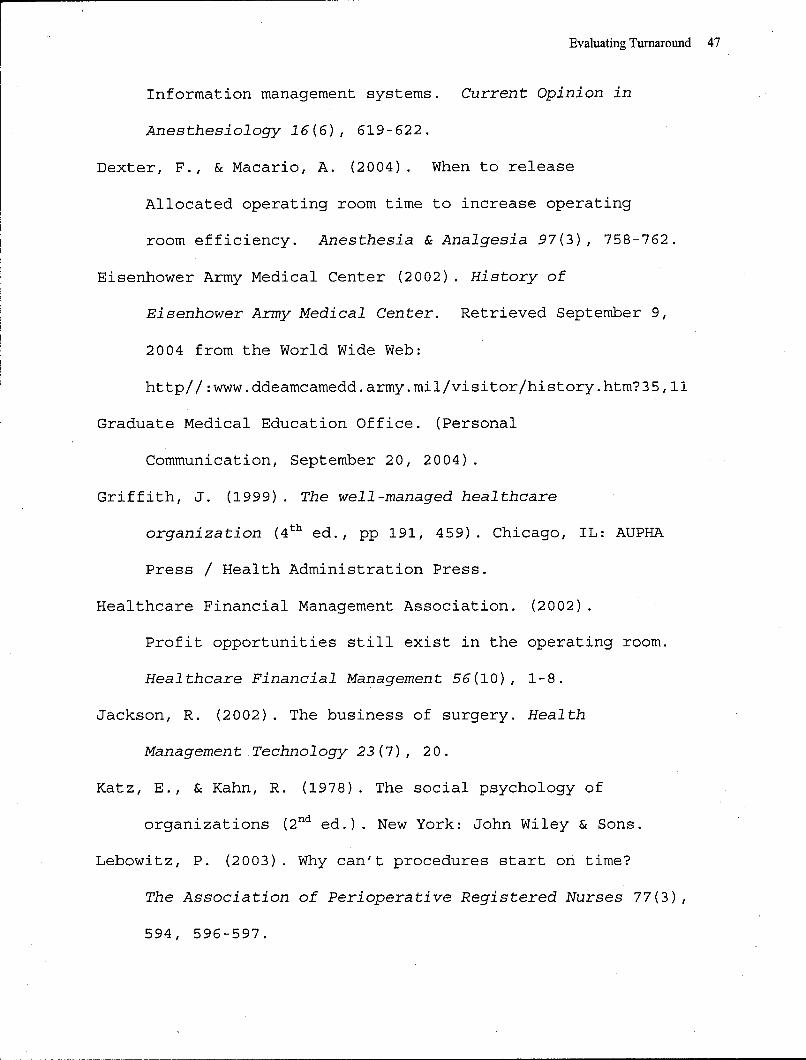
For procedures that lasted later than 1530, the first
procedure of the day was less likely to be delayed than
subsequent procedures. While 26% of procedures that lasted past
1530 were the only procedure of the day in that room, they were
still delayed 37.3% of the time, also, 91.1% of the procedures
that lasted past 1530 were the last procedures of the day and
experienced delays 44.3% of the time. Figure 3 shows the number
of cases that ran past 1530 relative to the time the patient was
in the room (see Figure 3).
A total of 138 procedures (an average of slightly more than
one every other day) started after 1330. These cases involved
210 or fewer nursing minutes. Although not all of these
procedures could be scheduled in an open operating room earlier
in the day, a significant proportion can be rescheduled to
improve efficiency and reduce overtime.

Evaluating Tumaround 31
Discussion
Incomplete data available
Initially, the factors affecting turnaround time were to be
analyzed by dividing turnaround time into four separate periods.
However, DDEAMC's staff did not utilize the data collection
fields in ORMA that would make this possible. DDEAMC staff only
collect data on one of the four time periods, the third period,
patient-out to patient-in. Dividing the turnaround time into
four periods would allow more precise analysis by associating
the many room turnaround processes to the period and order in
which they take place. Only measuring the patient-out to
patient-in time does not accurately account for any delays that
take place before or after the patient enters the room. For
example, suppose the patient enters the room at 0800, but the
nursing staff consumes a longer than average time with patient
preparation and positioning, or that the anesthesiologist has
difficulty intubating the patient. Any delays such as these will
not be accurately accounted for. The next time that was normally
recorded was the procedure start time. If the procedure had a
patient-in time of 0800, and a start time of 1000, a 120-minute
delay goes unexplained. The current operating room management
system software, ORMA, has a data field for delay reasons in the
comment section of the patient record, but it only records the
Evaluating Turnaround 32
reason for the delay, not the amount of time attributed to each
delay and any analysis of delay times would not be possible.
Closer analysis of period three, patient-out to patient-in,
will not isolate the time it takes to clean up the room, from
the preparation time for the incoming patient; nor does it
isolate a delay with the incoming patient after the room is
clean. The delay will not be accurately attributed to the
incoming patient; furthermore, it could also be assumed there
was a long cleanup time from the prior patient. As before, even
if a patient delay reason is noted in ORMA, the amount of time
lost from the delay will not be accurately captured.
Gaps in ORMA
Other problems exist with ORMA's data collection features.
For example, if there is not a follow-on case, a turnover time
is not listed. Thus, if there is no follow-on procedure, there
is no patient-in time, which ends the turnover period. The ORMA
record may reflect that a case was delayed and may state a
reason for the delay, but the data are of limited utility for
process improvement because the turnover time for all single-
case rooms, 12.95% of all cases, was totally omitted. For the
480 single case rooms of 2004, there was no accounting of the
setup time, patient prep time, room cleaning time, or delay
time; and as revealed earlier, the inaccurate recording of the

Evaluating Turnaround 33
reasons for delay reasons makes the data that was collected of
dubious validity.
In an effort to get an accurate measurement of turnover
time for every case, the time recorded must not depend on the
existence of a following case. After all, every case has a set-
up time, a patient prep time, and a clean-up time, regardless of
what follows. Further analysis of the original four measurement
periods reveals that even four periods will not entirely allow
case turnover times to be attributed to individual cases.
Capturing data on the four turnover periods will allow for more
accurate accounting of turnover times, reasons for delays, and
the length of those delays. In fact, this could be ideally
refined further. A compelling argument could be made to divide
turnaround time into as many as five time periods, which will
account for the following: Set-up start, Set-up complete,
Patient in Room, Prep Start, Prep End, Procedure Start,
Procedure End, Patient out of room, and Room Clean (Mowbray,
2003).
The problem of inaccurate turnover time accountability at
DDEAMC can be attributed to two factors: the insufficiency of
the methodology of recording times and the amount of missing
data. During the course of this research, OR staff members were
interviewed to determine the cause for the inconsistent
documentation. One staff member indicated that he enters delay

Evaluating Turnaround 34
reasons if the delay is greater than 15 minutes, but this is not
a policy and is not consistently practiced among the staff. Some
nurses may use a 20- or 30-minute threshold and, as revealed by
the data, some nurses do not list a reason for the delay no
matter how long it is.
The ORMA system is plagued with poor and improper
utilization in other areas that directly affect the utilization
on the operating room. For instance, while investigating the
cancellation rate, which is the percent of cases that are
cancelled within 24 hours of the scheduled operation date, I
discovered that the inaccuracy of the cancellation data, as
reported, renders it of little use.
Cancellations
The interest in the cancellation data stemmed from trying
to find specific ways to improve efficiency and utilization of
the operating room. Knowing the resources consumed in the
patient pre-operation process, reducing the number of
cancellations would save a tremendous amount of resources. My
reasoning behind this is that, while trying to reduce the time
involved in the turnover process is achievable, there is an
average of two turnovers per room. Thus, it is highly unlikely
that enough time will be saved in which to perform an additional
operation by reducing turnover time alone. The monthly average
cancellation rate for 2004 was 22.41 cases, or 6.05%, for 269
Evaluating Turnaround 35
cases annually. This rate also understates the problem, as
previously mentioned, this only accounts for cases that are
cancelled within 24 hours of the procedure date. The total
number of cases cancelled m'ore than 24 hours before the surgery
date is unknown.
"Ghost" cases
While researching information about cancellations, I
interviewed a medical clerk and made another important
discovery. The cancellation data that are captured are
inaccurate. By the clerk's own admission, she stated that almost
every cancellation that she completes is recorded under the same
reason because she picks the first reason on the menu. She also
said there are too many reasons on the list to take the time to
find the right one. A review of the cancellation data confirms
that 90% of the cancellations she entered had the same
explanation, abnormal lab/x-ray/EKG. Furthermore, the clerk
revealed that many of the cases that are cancelled are "ghost
cases" that are never intended to go to the operating room. A
"ghost case" is when a doctor submits a patient's name for a
surgery to reserve a slot so that it is not released to another
service.
Examining the data collected by ORMA system begs the
question: what is the utility of the reports that are generated?
The ORMA system specialist generates several reports each month:

Evaluating Turna•ound 36
a report for the monthly Morbidity and Mortality meeting, the
cancellation report, a 4-6 week schedule, a transcription
report, a list of active duty soldiers waiting for orthopedic
surgeries for more than 30 days, and finally a report to record
specimens and implants. It does not appear that any of the
reports generated are used to improve operating room efficiency.
The data that could potentially be useful is flawed: I have
explained the inaccuracies of the cancellation report and
detailed the scheduling inaccuracies caused by "ghost patients."
As it stands, ORMA's utility as an OR process improvement and
tracking tool is very limited the way it is currently utilized.
Process improvement
Process improvement (PI) is always an important topic; the
DDEAMC operating room was recently directed to look at the
turnover times as a process improvement project. However, after
the project members looked at the data that is currently being
recorded, alternative solutions had to be improvised to track
useful data. The staff began collecting baseline data on a new
form generated solely for the PI project. Now, the same staff
that does not feel they have the time to enter important data in
the ORMA system will have to keep track of yet another form and
another place to list times. The mere fact that the ORMA data
was not useful for a common study of turnover time supports the
conclusions, findings, and recommendations of this study. The
Evaluating Turnaround 37
data collection for this PI project is ongoing and I suspect
that the new and separate form may obscure the results and the
utility of the entire project due the "Hawthorne Effect."
Recommendations that will enhance PI initiatives are encompassed
in the Conclusions and Recommendations section under the
Accurate Reports and Data sections of this paper.
Conclusions and Recommendations
Healthcare organizations can be described in terms of six
key dimensions: production, boundary spanning, maintenance,
adaptation, management, and governance (Katz & Kahn, 1978). The
boundary spanning function focuses on the external environment
in areas such as technology, reimbursement, and regulation. The
adaptation function focuses on the information obtained from
boundary spanning, with knowledge of the organizations
production and support systems, to anticipate and adjust to
needed changes such as modification of existing programs,
services, design, or strategy. The adaptation function
emphasizes the organization's innovation by creating necessary
changes, which is what this study reflects, the need for change
(Shortell & Kaluzny, 2000).
The overarching factor that needs to be at the engine of
change, one that must be corrected before any attempt is made to
improve OR turnover time, utilization, or efficiency, is the
Evaluating Turnaround 38
utilization of the ORMA system. The following recommendations
are almost entirely related to the utilization of the ORMA
system.
Utilizing ORMA
The Chain of Command must insist on the accurate and
complete data entry and record keeping. Personnel must
understand the importance of the data and realize that it must
be complete and accurate, even if there is not a PI project
going on. The strategic goals and objectives of the
organizational leaders must be clear, concise, and disseminated
to the lowest level. Everyone must realize that they are part of
a team, thoroughly understand their role, and must help improve
the OR work environment.
Accurate Reports
It is vital to generate useful reports based on accurate
data. New reports must be generated for operating room process
improvement. After all, why track processes if we are not trying
to improve them, and how are we going to improve the process if
the data are fictitious? Just stating that erroneous and
misleading reports, such as the cancellation report, are a waste
of valuable resources, does not begin to substantiate the
problem. The system needs to be reviewed to determine what data
are being collected and how it is used. The staff must do their
part to improve the organization. The personnel need to know the

Evaluating Turnaround 39
importance of the reports that they generate and how they are
used to improve the organization. If the use and importance of
the reports are not fully understood, the personnel that play a
role generating the reports will not realize the value. If the
reports are considered to be of little value, the bits of data
that make up the reports will hold even less value and the
utility of the reports will continue to be dismal.
Meaningful Data
The data that are collected for the reports need to be as
accurate and complete as possible. This means eliminating
"ghost" patients, and accurately recording delay and
cancellation reasons. Vague and erroneous information has no
place in healthcare or the operating room; the data collected
must measure what it is intended to measure. The data collection
and reports need to be carefully reviewed and improved. The data
should be in a form that is accurate, useful, easy to access,
and review.
Scheduling Control
The current system allows providers and administrative
personnel to schedule cases, among them "ghost" cases. A staff
member familiar with the scheduling system suggested
implementing a centralized scheduling system that reduces free
access. The data reflects that in 241 possible operating days,
208 rooms finished by 11:30, and 373 rooms finished by 12:30.

Evaluating Turnaround 40
Thus, there should not be a need to create "ghost" cases as
placeholders so another service does not get available rooms.
After all, there is a system in place to turn over unused OR
time within five days of the surgery date. If a service does not
have actual cases booked by then, then the service does not have
a backlog problem and should not be causing havoc on the system
by scheduling a "ghost" case, canceling it, then scheduling a
real case so close to the operation date, causing a preoperative
workup rush, and perhaps a real patient cancellation.
Furthermore, DDEAMC has almost 20% of the rooms finished by
1230, which includes the current 66-minute average turnover time
and an average of two turnovers per room. If this time is
reduced to the standard of 30 minutes the finish times would
reflect that 46% of the rooms would be finished by 1300, leaving
sufficient OR. time for many procedures. However, the average
amount of turnovers by 1230 should be less than the overall
turnover average, and thus the 46% calculation may be higher
than achievable.
Excess OR Capacity
Despite incomplete and occasionally inaccurate data, the
fact remains that DDEAMC should be able to utilize the existing
ORs more efficiently. The data that were analyzed reflects that
there was an empty room nearly every day. A limitation of the
data is that it is unknown which days were available. The data

Evaluating Turnaround 41
also reveals that there was a room closed for the entire month
of January with no decrease in caseload. This indicates that a
room can be closed without reducing volume. However, there was a
slight increase in overtime cases for January with 37. In 2004,
an average of 32.67 cases per month ran past 1530. The amount of
overtime cases ranged from 23 in February to 42 in May.
With one room open on 240 days, 10% of rooms finished by
1130, 20% by 1230, a turnover average of 66 minutes, and a room
closed for an entire month with no decrease in volume or
increase in overtime, being able to close one operating room on
a daily basis is definitely accomplishable.
The changes that need to be implemented should not be met
with intense resistance, because the study is data driven by the
information that the OR staff inputs into ORMA and in the
patient's medical record. However, a realistic strategy must
represent an accepted consensus about what should be done,
incorporating the needs of the customers, providers, and the
organization (Griffith, 1999). The strategies suggested need not
please everyone, but no group can be so dissatisfied that it
will withhold critical support (Griffith, 1999). Any
improvements in streamlining the workflow should enhance
predictability, increase patient and staff satisfaction, and
increase OR utilization.
Evaluating Turnaround 42
In summary, the engine of change for making the ORs more
efficient needs to be focused on the ORMA system, or any future
OR management system. The current system is not being used to
its potential. The current reports are not helpful for
improving efficiency. The data that is entered into the system
is minimal, full of inconsistencies, erroneous, or missing
completely. To get the OR on the right track for the future, the
tracking methodology in the OR needs refinement, data input
needs improvement, and better reports need to be developed.
However, for the changes to be effective, the goals and
objectives of the OR leaders must be aligned with the strategic
goals and objectives of the organizational leaders. The staff
that use the ORMA system need to know the importance to their
role and how the mission, vision, and values of the organization
start with them.
Evaluating Turnaround 43
Figures Captions
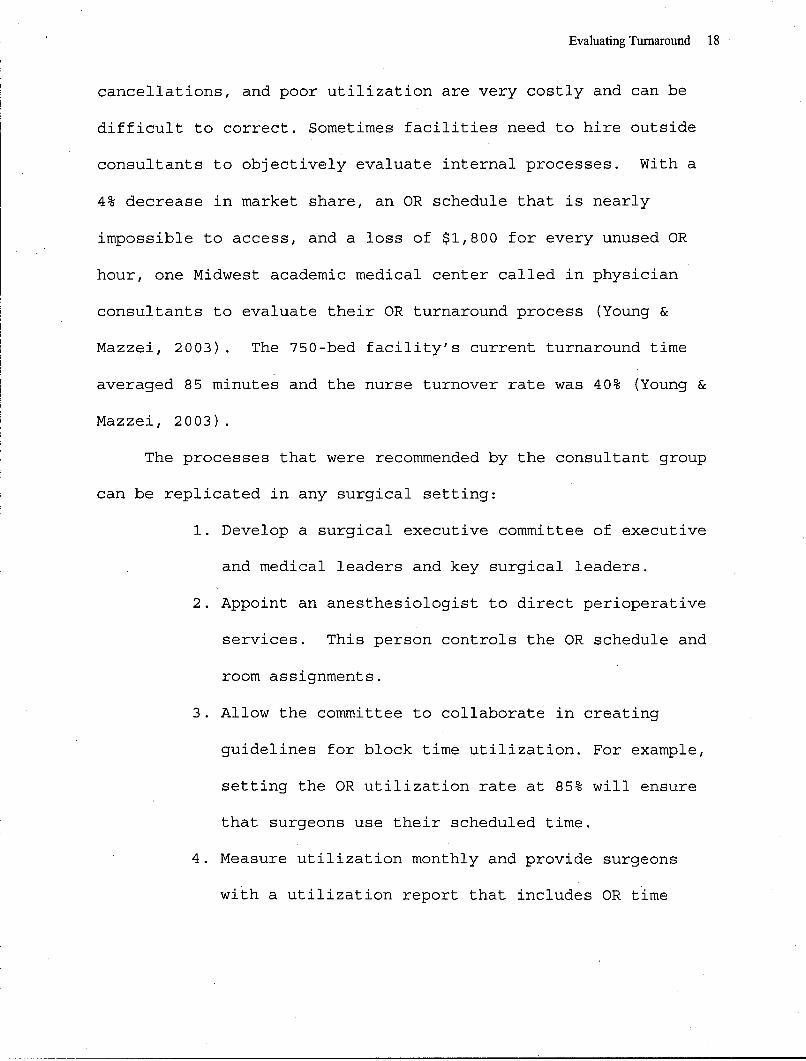
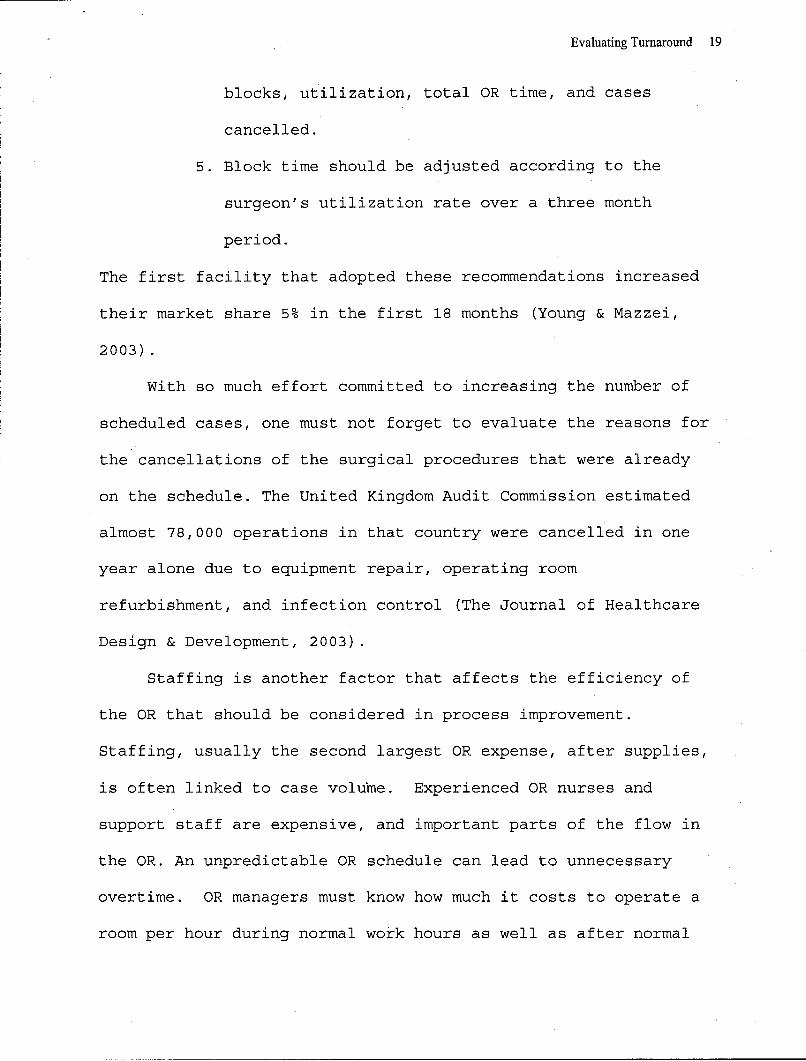
Figure 1. The percent of possible days the least-used OR was
used per month in 2004 (N=241).
Figure 2. The number of cases per month that ran past 1530. The
yearly average for 2004 was 32.67 per month (N=3722).
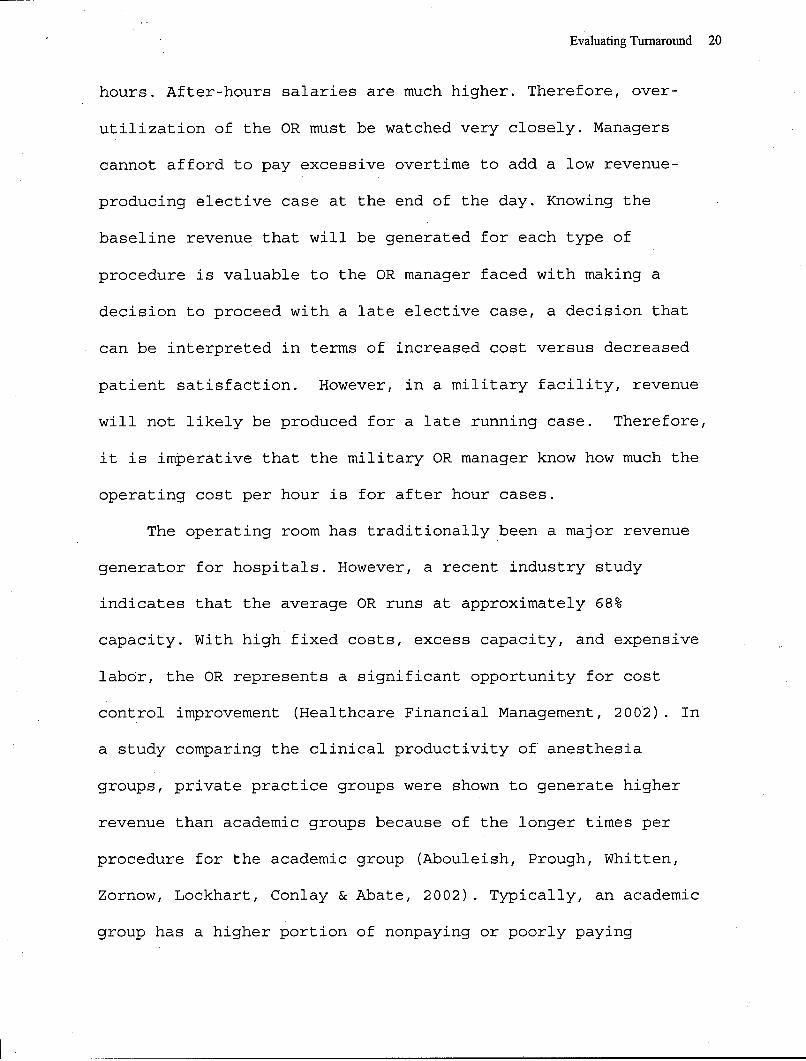
Figure 3. The number of cases that ran past 1530 relative to the
time the patient was in the room (N=3722).
Evaluating Turnaround 44
Figure 1.
>~100
090
0 70W 60
50 50
.~40-
30 30S20-
2 0 -
10 10
Month
Figure 2.
45
30 -
0 251 ~ 1 ~ -- 17
0*
Month

Evaluating Turnaround 44
Figure 1.
0100
S80-0
50 - M1
S20
0 1Month
Figure 2.
50
40-
3 0-(0
ES10-
0
C; e*00 Q
Month
Evaluating Turnaround 45
Figure 3.
120
100
* 80
o 60-
Ez 40-
20
7:30 8:30 9:30 10:30 11:30 12:30 1:30 2:30 3:30
Nursing Start Time

Evaluating Turnaround 46
References
Abouleish, A., Prough, D., Whitten, C., Zornow, M.,
Lockhart, A., Conlay, L., & Abate, J. (2002). Comparing
clinical productivity of anesthesia groups.
Anesthesiology, 97(3), Retrieved September 9, 2004 from the
World Wide Web:
http://home.mdconsult.com/das/article/body/40604317-
2/jorg=journal&source=mi&sp=12499860=29
Adams, R., Warner, P., Hubbard, B., & Goulding, T. (2004).
Decreasing turnaround time between general surgery cases: A
six sigma initiative. The Journal of Nursing
Administration 34(3), 140-148.
Bardach, E. (2000). A practical guide to policy analysis.
New York: Chatham Bridges Press.
Caramico, L., Kain, Z., Gaal, D., & Rimar, S. (1998). Data
feedback system: A modality to improve operating room
efficiency. Anesthesia & Analgesia 86(2S), 26S.
Clewer, A., & Perkins, D. (1998). Economics for Health Care
Management. New York: Prentice Hall.
Cooper, D., & Schindler, P. (2003). Business Research
Methods (pp. 215). New York: McGraw-Hill.
Crain's Chicago Business (2004). How many surgeries in a
day? Crain's Chicago Business 27(17), 13.
Dexter, F. (2003). Operating room utilization:
Evaluating Turnaround 47
Information management systems. Current Opinion in
Anesthesiology 16(6), 619-622.
Dexter, F., & Macario, A. (2004). When to release
Allocated operating room time to increase operating
room efficiency. Anesthesia & Analgesia 97(3), 758-762.
Eisenhower Army Medical Center (2002). History of
Eisenhower Army Medical Center. Retrieved September 9,
2004 from the World Wide Web:
http//:www.ddeamcamedd.army.mil/visitor/history.htm?35,11
Graduate Medical Education Office. (Personal
Communication, September 20, 2004).
Griffith, J. (1999). The well-managed healthcare
organization (4 th ed., pp 191, 459). Chicago, IL: AUPHA
Press / Health Administration Press.
Healthcare Financial Management Association. (2002).
Profit opportunities still exist in the operating room.
Healthcare Financial Management 56(10), 1-8.
Jackson, R. (2002). The business of surgery. Health
Management Technology 23(7), 20.
Katz, E., & Kahn, R. (1978). The social psychology of
organizations ( 2 nd ed.). New York: John Wiley & Sons.
Lebowitz, P. (2003). Why can't procedures start on time?
The Association of Perioperative Registered Nurses 77(3),
594, 596-597.

Evaluating Turnaround 48
Lovejoy, W.,& Li, Y. (2002). Hospital operating room
expansion. Management Science 48(11), 1369-1387.
Marco, A.,& Steven, H. (2001). Cross-Industry
benchmarking: Is it applicable to the operating room?
Quality Management in Health Care 9(2), 1-5.
Mowbray, A. (2003). Time required to set up for and
clean up after a case should be attributed to the actual
case in measuring actual turnover time. Anesthesia &
Analgesia 97(2), 605.
Nicholson, K. (1997). Testing times. The Journal for
Healthcare Design & Development 28(8), 51.
Shortell, S., & Kaluzny, A. (2000). Health care management:
Organization, design, and behavior (S.J. Williams,
Ed.) ( 4 th ed. pp. 18).
The Journal for Healthcare Design & Development. (2003).
Cutting the cancellations. The Journal for
Healthcare Design & Development 34(3), 18.
Young, D., & Mazzei, W. (2003). Improved OR management
alleviates common frustrations. Managed Healthcare
Executive 13(7), 37.