report drawn up by
TRANSCRIPT

Report drawn up by:
Aakkula, Jyrki (chapter 6)Ahlstedt, Jaana (layout, editor)Helin, Janne (chapter 5)Jansik, Csaba (chapter 2.4)Karhula, Timo (chapter 4.1)Knuuttila, Marja (chapter 1.1)Koikkalainen, Kauko (chapter 5)Koivisto, Anu (chapter 2.3)Kujala, Sanna (chapter 1.3)Latukka, Arto (chapter 4.3)Miettinen, Antti (chapter 5)Myyrä, Sami (chapter 4.2)Niemi, Jarkko (chapter 2.2)Niemi, Jyrki (chapter 2.4, 3, summary, editor)Onkalo, Pirjo (chapter 6)Rantamäki-Lahtinen, Leena (chapter 1.2)Tauriainen, Jukka (chapter 4.3)Tuomisto, Jussi (chapter 2.1)Turunen, Harri (chapter 4.1)Vanninen, Leena (chapter 4.4)Voutilainen, Olli (chapter 6)
English translation by:
Kola, Jaana
Cover design: Ben RydmanCover picture: Fanny Churberg, Burn-Beaten Landscape in Uusimaa (probably 1872)The painting belongs to the Art Foundation Merita, photo by Seppo Hilpo
Fanny Churberg (1845–1892) was a painter and art critic. She also did arts and crafts and was one of the founders of the Friends of Finnish Handicraft. During her short, about ten-year career as an artist she studied in Düsseldorf and Paris, which influenced her work a great deal. Her paintings are characterised by powerful use of a broad brush and colours that highlight the opposites. The themes often come from the nature. The Burn-Beaten Landscape in Uusimaa (oil on canvas) shows birches in rough, rocky terrain, and a typical Finnish farming landscape with a lake and forest in the back.

Taloustutkimus
JULKAISUJA 107a
Finnish Agricultureand Rural Industries 2007
Edited byJyrki Niemi and Jaana Ahlstedt
Maa- ja elintarviketalouden tutkimuskeskusAgrifood Research FinlandEconomic ResearchPUBLICATIONS 107a
ISBN 978-951-687-146-5ISSN 1458-2996
CopyrightMTT Economic Research, Agrifood Research Finland
PublisherMTT Economic Research, Agrifood Research Finland,
Luutnantintie 13, 00410 Helsinki, Finlandhttp://www.mtt.fi/english/research/economic/economic.html
Sales and distributionMTT Economic Research, Agrifood Research Finland,
Luutnantintie 13, 00410 Helsinki, FinlandTel. +358 9 560 80, fax +358 9 563 1164
e-mail: [email protected]
PrintingVammalan Kirjapaino Oy 2007

Preface
Finnish agricultural policy became more transparent as the beneficiaries of agricultural support were published in 2006. Besides the judicial reforms, the Taloustohtori Internet service opened by the Agrifood Research Finland MTT / Economic Research provides free access to information on agriculture and agricultural policy in a completely new way. Taloustohtori produces comprehensive, reliable and highly detailed information on the economy of Finnish farms in a form desired by the user. The access to information is restricted only by data protection concerning individual enterprises, which the system respects absolutely. In 2007 the system will be expanded to show the economic position of Finnish farms in a wider context among the other European farms.
Despite the great steps towards transparency and openness in agricultural policy, no similar progress was made on the agricultural and food product market. No real transparency was achieved on the markets and as yet there are no indications that the trend would turn towards this at least in the near future – in fact, the current trend is quite the opposite. The tendency to incorporate agricultural producers even more tightly to the business operations of the food industry and trade continues. This is expected to result in efficiency gains but it also involves certain alarming features because of the strong concentration of power within the food chain. One major challenge in the future will be how the even more strongly integrated markets in the food chain can be made sufficiently transparent to ensure fair and open competition. There is a lot of work to be done, also for the authorities and researchers.
I hope that this annual review helps to lead the reader to the sources of information, thus making its own contribution to the transparency of the food market, as well as agricultural and food policy.
The MTT wishes to thank Professor Jyrki Niemi and Research Secretary Jaana Ahlstedt for compiling and editing this publication as well as all the researchers who took part in the writing process.
Helsinki 30 April 2007
Kyösti PietolaDirector of Economic ResearchAgrifood Research Finland MTT

Contents
Summary ............................................................................................................ 5
1. Operating environment of agriculture ............................................................ 10 1.1. Agriculture and food sector in the national economy .............................. 10 1.2. Rural enterprises .................................................................................... 16 1.3. Finnish farm ........................................................................................... 20
2. Agricultural and food market ......................................................................... 24 2.1. Arable crops ........................................................................................... 24 2.2. Livestock production .............................................................................. 29 2.3. Horticultural production ........................................................................ 36 2.4. Food market ........................................................................................... 42
3. Agricultural policy ......................................................................................... 49 3.1. Common agricultural policy of the EU .................................................. 49 3.2. National aid ........................................................................................... 52
4. Economic situation of agriculture .................................................................. 56 4.1. Agricultural income ................................................................................ 56 4.2. Productivity development in agriculture ................................................. 58 4.3. Development of the economic result and profitability of enterprises ....... 59 4.4. Production costs of agriculture ............................................................... 64
5. Agriculture and the environment ................................................................... 66 5.1. Environmental impacts of agriculture ..................................................... 66 5.2. Pressures for change in agri-environmental policy ................................... 68 5.3. Agri-environmental support in 2007–2013 ............................................ 69 5.4. Water protection .................................................................................... 72
6. Rural and regional policy ............................................................................... 76 6.1. Typology of rural areas and their development ........................................ 77 6.2. Rural Development Programme for Mainland Finland ........................... 79 6.3. ERDF action programmes for main regions ........................................... 80 6.4. ESF Programme for Mainland Finland ................................................... 82 6.5. Challenges for rural and regional policy .................................................. 83
Appendices ......................................................................................................... 88
Special topics
Is there a connection between agriculture and food security? .............................. 14Welfare of production animals ............................................................................ 34Constructing corporate social responsibility in the food production chain – from words to action .......................................................................................... 40The “health” check of the CAP: structural adjustments and forthcoming reforms .............................................................................................................. 54Biogas opportunities on Finnish farms ................................................................ 74Diversified farms – junction for the development of agriculture and countryside ......................................................................................................... 85

5
SUMMARY
During 2006 no major processes were pre-pared in the agricultural and rural policy of the EU. The focus was in the imple-mentation of the CAP and sugar reforms decided earlier and the national preparati-on of the regional and rural development programmes for the programming period 2007–2013.
The implementation of the single payment scheme (SPS) introduced in the CAP reform of 2003 started in Finland in the beginning of 2006. Now most of the agricultural support payments funded by the EU are managed through the SPS. To be eligible for payments under the SPS the farms must meet the so-called cross-comp-liance conditions, i.e. maintain arable lands in good agricultural condition and see that certain minimum requirements concerning animal welfare and the environment are met.
The introduction of the SPS involved quite dramatic changes, which means that the schedule for implementing the reform was very tight. However, almost all Finnish farms received the payments under the SPS in December 2006.
The year 2007 will not bring along similar changes as the introduction of the SPS in 2006. However, certain revisions will be made in the content of the agri-envi-ronmental support scheme and in national aids.
WTO negotiations ran aground
The WTO negotiations aimed at further liberalisation of the world trade should have been completed in 2006, but the ne-gotiations came to a deadlock in Geneva in July 2006. This may not be final, but it is possible that it will take years before the solutions are at hand. The disruption of the process known as the Doha round was a serious setback especially for the ad-
vocates of the liberalisation of agricultural trade. Accusations began to fly around im-mediately after the Geneva meeting. In par-ticular, heavy criticism has been targeted to the United States.
It is inevitable, however, that trade liberalisation will continue. The negotia-tions will be resumed and the documents of the Doha round will again be brought out. This means that, before long, the EU will also have to dismantle its border protection and support payments to agriculture.
Bulgaria and Rumania joined the EU
The accession of Bulgaria and Rumania to the EU in the beginning of 2007 completed the extensive round of EU enlargement, which had already brought eight East Eu-ropean countries and Malta and Cyprus to the EU in 2004. After the two most recent members the EU became a community of 27 Member States and almost 500 milli-on EU citizens. More than 15 million of these gain their livelihood from agriculture, which means that the farming population of the EU has almost doubled from the time before the enlargement of 2004.
Eastern enlargement increased the ag-ricultural area of the EU by almost 45%, but the production volumes of the majo-rity of agricultural products grew by only 20–25%. The growth in the gross value added of agriculture is only 11%. This shows very clearly that a significant share of the production potential of the Central and East European countries is not being utilised as yet.
The changes on the food market and agricultural policy are also reflected in the peripheral regions of the Union, like Fin-land. However, the enlargement did not have any dramatic repercussions, at least in the short term. The enlargement was a na-tural continuation of the earlier trend and
6
the internationalisation process. It opens new export opportunities for Finnish opportunities, but there are also threats as the competition gets even tighter.
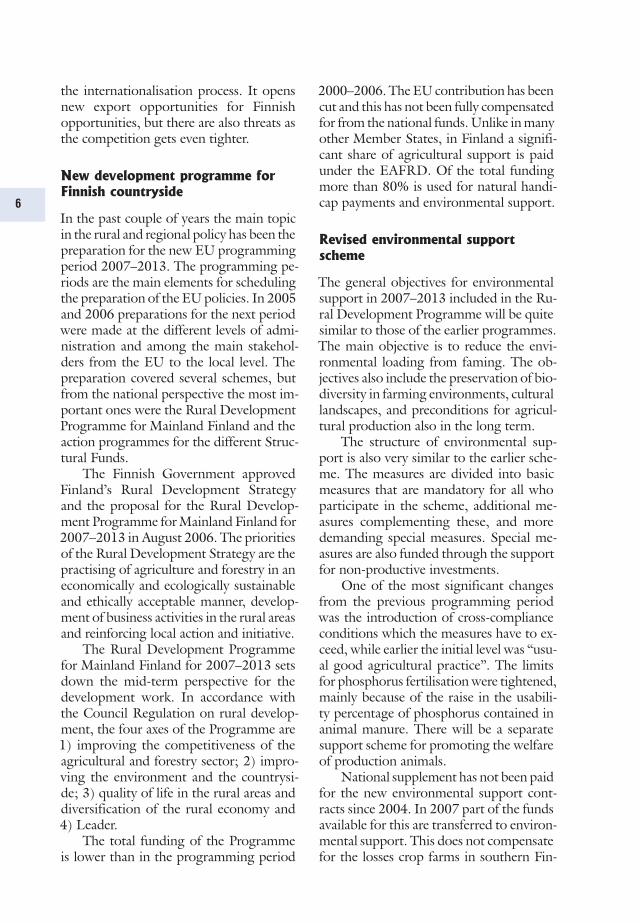
New development programme for
Finnish countryside
In the past couple of years the main topic in the rural and regional policy has been the preparation for the new EU programming period 2007–2013. The programming pe-riods are the main elements for scheduling the preparation of the EU policies. In 2005 and 2006 preparations for the next period were made at the different levels of admi-nistration and among the main stakehol-ders from the EU to the local level. The preparation covered several schemes, but from the national perspective the most im-portant ones were the Rural Development Programme for Mainland Finland and the action programmes for the different Struc-tural Funds.
The Finnish Government approved Finland’s Rural Development Strategy and the proposal for the Rural Develop-ment Programme for Mainland Finland for 2007–2013 in August 2006. The priorities of the Rural Development Strategy are the practising of agriculture and forestry in an economically and ecologically sustainable and ethically acceptable manner, develop-ment of business activities in the rural areas and reinforcing local action and initiative.
The Rural Development Programme for Mainland Finland for 2007–2013 sets down the mid-term perspective for the development work. In accordance with the Council Regulation on rural develop-ment, the four axes of the Programme are 1) improving the competitiveness of the agricultural and forestry sector; 2) impro-ving the environment and the countrysi-de; 3) quality of life in the rural areas and diversification of the rural economy and 4) Leader.
The total funding of the Programme is lower than in the programming period
2000–2006. The EU contribution has been cut and this has not been fully compensated for from the national funds. Unlike in many other Member States, in Finland a signifi-cant share of agricultural support is paid under the EAFRD. Of the total funding more than 80% is used for natural handi-cap payments and environmental support.
Revised environmental support
scheme
The general objectives for environmental support in 2007–2013 included in the Ru-ral Development Programme will be quite similar to those of the earlier programmes. The main objective is to reduce the envi-ronmental loading from faming. The ob-jectives also include the preservation of bio-diversity in farming environments, cultural landscapes, and preconditions for agricul-tural production also in the long term.
The structure of environmental sup-port is also very similar to the earlier sche-me. The measures are divided into basic measures that are mandatory for all who participate in the scheme, additional me-asures complementing these, and more demanding special measures. Special me-asures are also funded through the support for non-productive investments.
One of the most significant changes from the previous programming period was the introduction of cross-compliance conditions which the measures have to ex-ceed, while earlier the initial level was “usu-al good agricultural practice”. The limits for phosphorus fertilisation were tightened, mainly because of the raise in the usabili-ty percentage of phosphorus contained in animal manure. There will be a separate support scheme for promoting the welfare of production animals.
National supplement has not been paid for the new environmental support cont-racts since 2004. In 2007 part of the funds available for this are transferred to environ-mental support. This does not compensate for the losses crop farms in southern Fin-

7
Agricultural support in Finland, million euros.
2005 2006preliminary 2007estimate
Support financed by EUCAP payments 515 541 555
Support co-financed by EULFA support 421 420 423Environmental support 293 294 322
National supportNorthern support 330 327 328National support for Southern Finland 99 97 94National supplement to environmental support 55 55 2National supplement to the LFA support 120 119 119Other national support 15 13 30
Total 1,848 1,866 1,883EU contribution 791 774 766National financing 1,057 1,092 1,117
land, which means that the cultivation of special crops will become less attractive.
New proposals on agricultural policy
The competitiveness of Finnish agriculture and position of the food sector were the main concerns of the working group that discussed the future alternatives of Finnish agricultural policy. The working group was chaired by Permanent Secretary of State Raimo Sailas from the Ministry of Finance and it submitted its final report to Minister of Agriculture and Forestry Juha Korkeaoja in January 2007.
The working group considered that the competitiveness of the agricultural and food sector should be improved by suppor-ting the growth of expanding farms and control of the growth process. Apart from supporting investments, the efficiency of the use of arable lands should be improved by developing the land leasing regulations and through land consolidation operations. The working group would not place admi-nistrative barriers to the growth in the farm size and would allow the concentration of farming in Finland.
The working group suggests that the transfers of farms to the next generation would be exempted from the inheritance
tax. On-farm bioenergy production for won use, other than road transportation, should also be exempt from tax.
Advanced biotechnology is considered indispensable for improving competitive-ness in the food chain and in bioenergy production. The working group would like to promote the utilisation of gene techno-logy in the breeding of crops that are suited to the Finnish conditions.
Negotiations under Article 141
a major challenge for 2007
The farmers in southern Finland will again be faced with a period of great uncertainty as Finland and the European Commission prepare for the negotiations on whether Finland will be allowed to pay coupled sup-port to livestock, horticulture and green-house farms in southern Finland after 2007. This support scheme is founded on Article 141 of the Accession Treaty of Finland. The negotiation positions are well known: the Commission sees Article 141 as a transitio-nal, Finland as a permanent arrangement.
This is the fourth time when the future of support under Article 141 is being nego-tiated, and in each of the earlier processes the support has decreased. The last negotia-tions in 2003 were extremely difficult, and

8
Development of agricultural income in 1994–2006.
� � �
� � �
� �
� �
� �
� �
� �
� � � � � � � � � � � � � � � � � � � � � � �
� � � � � �
� � �
� � � �
� �
very likely this will also be the case in the upcoming negotiations. The EU Agricul-ture Commissioner Mariann Fischer Boel seems to consider that the time has come to replace the support under Article 141 by other agricultural policy instruments.
Fourth year of downhill in
agricultural income
The incomes of the agricultural and horti-cultural sectors fell for the fourth year in a row. In 2006 the agricultural income total-led € 893 mill., which is 8%, almost € 83 mill., less than the year before. The main reason for this was the growth in the costs by almost 4%.
In recent years the total costs of agri-culture and horticulture have risen mainly due to the rapid increase in oil prices, which influences not only the direct energy costs but also many other cost items indirectly. The rise in the prices of machinery and implements has also exceeded the general rate of inflation.
In 2006 the total return on agriculture and horticulture exceeded for the first time the limit of € 4 bill. The sales return was about € 2.1 bill. and the support payments totalled about € 1.9 bill.
Most of the sales return, € 1.4 bill., came from livestock production, € 0.3 bill. came from crop production and € 0.4 bill.
from horticulture.The return on livestock production was
about the same as the year before as the increase in the return on cattle slaughtered in 2006 compensated for the lower returns on milk and poultry meat. Return on beef rose by almost 7% as a result of the favou-rable price trend.
Higher producer prices and growth in barley trade increased the sales return on cereals by about 4% in 2006. The return on oilseed plants rose by as much as 42% as the trade volumes increased by almost 20% and producer prices by about 18%.
Value of horticultural production
grew
The value of horticultural production rose by more than 4% from 2005. The yields of most of the vegetables grown in the open suffered from the dry conditions in the summer of 2006, but the smaller supp-ly was reflected in the prices, which were higher than the year before. The smaller yields in the production in the open also increased the demand for greenhouse pro-ducts so that the demand for these stayed high all through the summer and the prices were higher than in 2005.
Record year in food exports
Finnish food exports hit an all-time record in 2006. The value of food ex-ports totalled € 1.1 bill., which is al-most 12% more than the year before. The value of food imports to Finland rose by 8% to € 2.8 bill.
In 2006 the food prices in Finland rose by 1.5%. The annual change in the consumer price index was 1.4%, which means that the food prices follow the average trend of inflation quite closely.
In the long term the food prices have risen somewhat more rapidly than the overall consumer price index.

9
Number of active farms and agricultural income in 1994–2006.
Numberof farms
Change fromprevious year
%
Change from1994
%
Agricultural income at 2006 prices, € million
Index1992–94
average: 100
2006 68,766 –0.5 –33 893 59
2005 69,088 –2.8 –33 993 652004 71,100 –1.3 –31 1,099 722003 72,000 –1.9 –30 1,152 762002 73,386 –2.7 –29 1,191 782001 75,384 –3.2 –27 1,161 762000 77,896 –5.2 –24 1,114 731999 82,142 –4.1 –20 1,051 691998 85,690 –3.0 –17 1,006 661997 88,370 –3.2 –14 1,222 811996 91,281 –4.5 –11 1,268 841995 95,562 –7.2 –7 1,452 961994 103,0001 1,658 109
1 Estimate of the MTT Economic Research, Agrifood Research Finland.
Sources: Total calculation of the MTT Economic Research, Agrifood Research Finland, Support register of the Ministry
of Agriculture and Forestry (MMM).
From 2000 until 2006 the price of food in nominal terms rose by 10.9%, while the rise in the overall consumer price index was 8.1%.
Further concentration of food
industry and trade
In recent years there have been several ma-jor reorganisation processes in the Finnish food retail sector. Now two large chains, the S Group and K Group, dominate the competition for the leading position on the market. The concentration of the sales is reflected both in the market shares of the leading chains and in the decrease in the number of retail outlets. Each year the ma-jor food trading chains gain a larger share of the food sales in Finland.
Tightening price competition between the retail chains is also reflected in the food industry. International mergers and other arrangements targeted at growth in the size of food industry companies have increased rapidly in recent years.
In 2006 there were significant reorga-nisation processes especially in the dairy
and meat companies. In the dairy sector the biggest news of the year was the entry of the largest dairy in Europe, the Danish-Swedish Arla Foods, in Finland. In No-vember 2006 Arla Foods bought the se-cond largest Finnish fairy company Ingman Foods, which supplies about a quarter of the packaged milk and yoghurt in Finland. Ingman Foods should be transferred comp-letely into foreign ownership in about three years.
The two largest meat processing com-panies in Finland, Atria and HK Ruokatalo, continued their internationalisation pro-cess. The corporate arrangement between the HK Ruokatalo and Swedish Meats was completed in January 2007.
The mergers of food companies in the Nordic countries reflect the aspiration of the companies to strengthen their market position in the Baltic Sea region before the entry of the large European companies. The reorganisation processes concern not only the dairy and meat sectors, but simi-lar arrangements have already been carried through in the brewery, confectionary and bakery industries.
10
1. OPERATING ENVIRONMENT OF AGRICULTURE
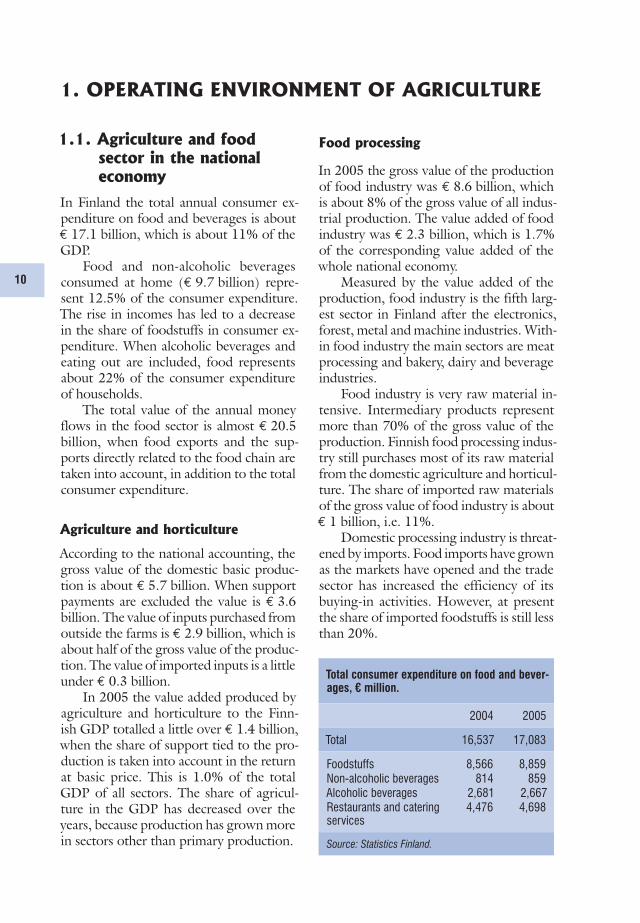
Total consumer expenditure on food and bever-ages, € million.
2004 2005
Total 16,537 17,083
Foodstuffs 8,566 8,859Non-alcoholic beverages 814 859Alcoholic beverages 2,681 2,667Restaurants and catering services
4,476 4,698
Source: Statistics Finland.
1.1. Agriculture and food
sector in the national
economy
In Finland the total annual consumer ex-penditure on food and beverages is about € 17.1 billion, which is about 11% of the GDP.
Food and non-alcoholic beverages consumed at home (€ 9.7 billion) repre-sent 12.5% of the consumer expenditure. The rise in incomes has led to a decrease in the share of foodstuffs in consumer ex-penditure. When alcoholic beverages and eating out are included, food represents about 22% of the consumer expenditure of households.
The total value of the annual money flows in the food sector is almost € 20.5 billion, when food exports and the sup-ports directly related to the food chain are taken into account, in addition to the total consumer expenditure.
Agriculture and horticulture
According to the national accounting, the gross value of the domestic basic produc-tion is about € 5.7 billion. When support payments are excluded the value is € 3.6 billion. The value of inputs purchased from outside the farms is € 2.9 billion, which is about half of the gross value of the produc-tion. The value of imported inputs is a little under € 0.3 billion.
In 2005 the value added produced by agriculture and horticulture to the Finn-ish GDP totalled a little over € 1.4 billion, when the share of support tied to the pro-duction is taken into account in the return at basic price. This is 1.0% of the total GDP of all sectors. The share of agricul-ture in the GDP has decreased over the years, because production has grown more in sectors other than primary production.
Food processing
In 2005 the gross value of the production of food industry was € 8.6 billion, which is about 8% of the gross value of all indus-trial production. The value added of food industry was € 2.3 billion, which is 1.7% of the corresponding value added of the whole national economy.
Measured by the value added of the production, food industry is the fifth larg-est sector in Finland after the electronics, forest, metal and machine industries. With-in food industry the main sectors are meat processing and bakery, dairy and beverage industries.
Food industry is very raw material in-tensive. Intermediary products represent more than 70% of the gross value of the production. Finnish food processing indus-try still purchases most of its raw material from the domestic agriculture and horticul-ture. The share of imported raw materials of the gross value of food industry is about € 1 billion, i.e. 11%.
Domestic processing industry is threat-ened by imports. Food imports have grown as the markets have opened and the trade sector has increased the efficiency of its buying-in activities. However, at present the share of imported foodstuffs is still less than 20%.

11
Estimated money flows in the Finnish food sector in 2005.
� � � �
� � � �
� � � �
� � �� � � �
� � � �
� � �
� � � �
Total € 20.5 billion
Food industry
Other industries(Agricultural trade, business services, transportation, etc.)
Agriculture
Restaurant and catering services
Product taxes
Import of other inputs
Food tradeFood imports
Domestic trade in foodstuffs
In addition to the primary production and processing sectors, the role of the whole-sale and retail trade is also highly signifi-cant in the domestic food chain. The func-tions of trade include the sale of food prod-ucts to the consumer and raw materials and other inputs to the other operators in the food chain.
The share of wholesale and retail trade in the food expenditure of consumers is about € 2.5 billion. Domestic food trade is founded on chains of wholesalers and retailers, where the buying-in operations have been centralised. Food trade is not as dependent on domestic basic production as the Finnish food industry.
The position of trade in the food chain relative to the domestic raw material pro-duction and food industry has strength-ened. The trade sector is able to take ad-vantage of the competition between the domestic food companies and between the domestic companies and foreign ones.
Finnish food trade is still largely in the hands of domestic chains. The entry of the German food chain Lidl on the Finn-ish market in 2002 increased the price com-petition in food trade. The more and more efficient and international food chain is go-ing to put the value and significance of the domestic origin into a serious test.
Foreign trade in foodstuffs
In 2006 the value of food imports was about € 2.8 billion, which is about 5% of the total value of imports. The value of ex-ports was about € 1 billion, which is about 2% of the total value of exports. Both food imports and exports grew in 2006. The for-eign trade balance of the food sector is still weakened by the import of other produc-tion inputs, such as fuels and chemicals.
Some of the imported foods are pri-mary products which cannot be produced in Finland or the quantities produced are not sufficient. Some imported products are processed further in Finland. The share of cross-trading, i.e. both import and export of the same types of products (e.g. cheeses, beverages and confectionary) has increased. Exports also include unprocessed or low value-added agricultural raw materials.
Taxes and support in the food sector
The State functions in the food chain as it collects taxes and allocates financial sup-port to agriculture. Taxes are collected in the prices of food and purchased inputs and as income taxes on the output of the production.
In 2005 the taxes collected on food-stuffs totalled € 4.0 billion. The total tax revenue decreased slightly due to the

12
Employment shares of agriculture and food industry (%) in different regions. Source: Alueellinen työssäkäyntitilasto (Regional employment statistics) 2004, Statistics Finland.
� � � � � � � � � �
� � � � � � � � � � � � � � � � � � � � � � � � � � � �� � � � � � � � � � � � � � � � � � � � � � � � �� � � � � � � � � � � � � � ! � ! ! � � � � � �� � � � � � � � � � � � � � � � �
" � � � � � � � # � � � ! � ! � � � � �
$ ! � � � � # � � � ! � ! � � � � �% � � � & ' $ � � !
# � � � ! � ! � � � � �
( ! � ) ! � � ' $ � � !* ! � � � � + � � � � � �
+ � � � � �* ! � � � � # � � � ! � ! � � � � �
, � & ' - � � � � � �$ � � � . � � � �
+ � � � � ' / & � �$ ! � � � � + � � ) � � �
" � � � � � � � 0 � � � � � �1 � � � � � � � � ' $ � ! � �
+ � � � � � � � . � !2 � 3 � � � �
4 � � � �
( & � ) & � ' / & � �( � � . � � � � �- � � � � � �
5 � ! � � � � ! � � � � �
reduction in alcohol tax. However, the growth in the consumption of food and beverages in turn increases the tax revenue. In 2006 the revenue from the tax on food is estimated at € 4.2 billion.
The annual return of the value added tax (VAT) on food is about € 1.4 billion and that of alcoholic beverages is € 0.5 bil-lion. The return of the 22% value added tax on restaurant services is € 1 billion and that of the tax on alcohol is about € 1 billion. Taxes are also collected on soft drinks.
The 17% VAT on foodstuffs is high compared to the EU average. As the Parlia-mentary election is getting closer, demands have again been raised to lower the VAT on food. This finds support among farm-ers and representatives of food industry and trade. Those who oppose this doubt whether the reduction would be reflected in the consumer price.
In 2006 the support payments to Finn-ish agriculture and horticulture totalled € 1.9 billion. Support is funded by the EU or nationally or co-funded by the EU and the State. Of the total support 40% comes from the EU and 60% is funded nationally.
Impacts of the food sector on
regional economies
In terms of volumes agricultural produc-tion is concentrated to the best produc-tion regions in western and south-western Finland. However, other types of produc-tion are also concentrated to southern Fin-land, which is why the relative role of ag-riculture may not be that great. Instead, in more remote areas and especially in eastern and northern parts of the country the eco-nomic impacts of agriculture are far more significant.
In Ostrobothnia in north-west Finland and Savo region in the south-east agricul-ture yields 4 to 8% of the production, tak-ing account of support payments to agri-culture.
The demand induced by agricul-ture is significant for regional economies. Through the purchased inputs of agricul-ture the value added created totals about € 1 billion a year. Most of the purchases benefit the regional economies directly, es-pecially agricultural trade, feedmills and transportation.
Like agriculture, most of the food in-

13
The GDP share of agriculture and the food sector, at basic price (current prices).
Year 0Sectors
total
010, 014Agricultureand related
services
DA Manufacture of
foodstuffs, beverages and tobacco
010, 014Agricultureand related
services
DA Manufacture of
foodstuffs, beverages and tobacco
€ million € million € million % %
2005 136,381 1,417 2,334 1.0 1.7
2004 132,621 1,455 2,295 1.1 1.72003 126,585 1,455 2,369 1.1 1.92002 125,699 1,612 2,362 1.3 1.92001 122,489 1,602 2,207 1.3 1.82000 115,167 1,522 1,818 1.3 1.61999 106,217 1,375 2,097 1.3 2.01998 101,365 1,242 2,097 1.2 2.11997 92,909 1,578 2,077 1.7 2.2
Source: National Accounts 1997–2005, Statistics Finland. Revised figures.
dustry is located in southern and western Finland. Food industry is the most signifi-cant in South Ostrobothnia, where it rep-resents 7% of the production. The role of food industry is also particularly significant in certain other regions, e.g. in Häme and Uusimaa in southern Finland.
Direct and indirect employment
effects of the food chain
In 2006 the number of people employed in agriculture was almost 91,000 persons, which is 3.7% of the employed labour force. The number of people employed in agri-culture has fallen along with the number of farms. Regionally agriculture may be a very important employer because these jobs are located in regions where the other types of production are less common.
By purchasing production inputs ag-riculture employs about 20,000 persons. These jobs are mainly located in popula-tion and municipal centres, not in the rural areas. Food processing industry employs about 37,200 persons. Most of the about 1,900 food processing companies are small or medium-sized companies that employ less than 250 persons. Thus the few very large companies are decisive in terms of the
employment in the food sector. 67% of the persons employed in the sector work in the largest food companies.
Some of the food companies process local raw materials so that the jobs are lo-cated close to primary production. The need to concentrate production into few-er and larger units reduces the number of both places of business and the people em-ployed in the sector, especially in the largest companies. Some of the small food compa-nies, for example bakeries, take advantage of the local demand.
Food industry also employs indirectly in the packaging and transportation busi-ness, wholesale trade and in various kinds of business services. Altogether Finnish ag-riculture and food industry employ about 200,000 persons.
While the jobs in primary production and processing are decreasing, more and more people find employment in restau-rants and catering services and in food trade. Restaurants and catering services employ about 60,000 and food trade more than 50,000 persons. When the employ-ment effect of restaurants, catering services and food trade in other sectors is taken into account, the whole food sector employs al-most 300,000 persons.

14
Is there a connection between agriculture and food security?
Hannes Kulmala, Deputy Director General, National Emergency Supply Agency
We may approach this question from various perspectives. Agricultural production depends on external inputs. The supply of e.g. feedingstuffs and related logistics must be ensured. Functioning world market is a precondition for the supply of ammonia and, through this, nitrogen fertilisers. One hot topic these days is the fuel self-suffi-ciency of farms. Electricity blackouts have shown how important the sources of auxil-iary power are. Getting the farms’ products to the market depends on the logistics of the food industry.
Food supply and security in Finland is largely based on domestic production. This principle was again confirmed in the Government decision on the security of supply. The role of agriculture and forestry as producers of domestic bioenergy has received a great deal of emphasis.
The above could easily lead to the simple conclusion that, if we ensure the supply of inputs to agriculture, this will then take care of the security of supply for the rest of the society. In practice, however, the matter is not as straightforward. In this article I shall focus on the significance of agriculture for securing the food supply of our coun-try in the long term in the light of some development scenarios.
Operating conditions of agriculture
Visions of the future of Finnish agriculture have been put forward in various recent studies and reports. Agriculture is at the intersection of several, partly conflicting pol-icy factors. Global market policy highlights competitiveness and production efficiency, which causes great pressures to the EU and Finnish agricultural policy. Because of the production conditions in Finland, our competitive position is anything but favourable. Environmental policy sets its own limitations to the production. The limitations are fully understandable from the environmental policy perspective, but they do restrict the possibilities to maximise the production. In such a conflicting policy environment it is quite difficult to construct a clear and straightforward emergency supply policy that would guarantee a sufficient level of production.
The common target of the different visions is to maintain farming in all parts of Finland. Multifunctional agriculture has been considered to produce automatically the security of supply, which is one of the public goods produced by agriculture. However, the realised development may not always follow the visions. Let us think about the situation in the sugar sector. Pressures on the EU’s sugar policy from the world mar-ket and the production policy of the EU led to a situation where sugar production in Finland had to be reduced. Because of this, our security of supply for the part of sugar is now based on international markets instead of national production.
Is this an isolated, exceptional trend or could the same take place in the other pro-duction sectors? Should we prepare for a situation where the positive visions are not realised and other products are faced with a similar fate as sugar? Growth in bioenergy production may alleviate the adjustment of the agriculture sector to a situation where the market conditions for the preservation of extensive food production no longer exist. Bioenergy production may become an important income source to compensate

15
for the decrease in food production. Such development would have important impacts on the national security of supply.
Food industry and trade
The above trends are closely linked to the structural development of food industry. During the EU membership the Finnish food industry has adjusted to changes in the operating conditions by concentrating production and improving logistics. All this has its limits, and new strategies need to be developed. Finnish food industry has been expanding outside the national borders, with the aim of gaining a strong position on the Baltic markets. This calls for high investments in the years and decades to come, which means that stricter comparisons will be made between foreign investments and investments in domestic capacity. A situation where higher volumes are searched for from a broader market area may force the domestic operations to further improve the efficiency of their logistics models. This means that the geographical areas for raw ma-terial purchases and deliveries of feedingstuffs as well as production volumes may be considerable smaller than at present. Production in Finland would concentrate to an even smaller area and the focus would be on high-quality foodstuffs with higher con-tribution margins, such as functional foods. This might not be a catastrophe for agri-culture, considering the higher raw material prices allowed by this kind of production and the possibility to increase bioenergy production mentioned above. However, as re-gards the domestic emergency supply such a situation would be something quite new.
The trade sector is often blamed for pushing the production of domestic food pro-duction into an increasingly difficult situation. The trade justifies its actions by say-ing that this is the only way to operate in free market conditions. On the other hand, the purchasing and distribution network of the trade sector is indispensable for the functioning of the supply chain from the farm to the consumers’ table. If the trend in food supply from national markets to a market area that comprises the whole Baltic Sea region is realised, the role of the service network of the trade sector will become even more important.
Are we facing major changes?
The trends described above are neither the inevitable nor desirable ones, but they re-flect the possible future scenarios which must be taken into account in planning the security of supply. The questions to be raised are: Have different options received suf-ficient attention in the scenarios? Have the security of supply, policy factors involved and the connections between these and agricultural production been analysed enough? Will the food and energy supply be competing for the same resources in the future, or will they support each other? In the future, can we continue to link emergency supply closely to the national market or should we regard this as a question that involves a broader market area?
The development depends of numerous factors, and a long-term study of these should include a sufficient number of options and a more diversified range of potential scenarios that at present. In the future Finnish agriculture may not produce security of supply in the same way as today, but it will continue to make a significant contribu-tion to ensuring a certain level of basic security. The connection between food security and agriculture exists, but its content is linked to the development of the operating environment.

16
1.2. Rural enterprises
About a third of the Finnish population live in rural areas, i.e. postal code areas where the population density is fewer than 50 persons/km2. This means that the income of the rural population and rural industries are highly significant for the national econ-omy. The concept “rural area” can be de-fined in a number of ways, depending on the perspective.
Small rural enterprises can be divided into three groups: farms engaged in basic agricultural production, diversified farms and other small rural enterprises. In basic agricultural production, farms are engaged in agriculture and farm forestry. Diversified farms practise both agriculture and forestry and non-agricultural entrepreneurial activi-ty. The third category comprises small rural enterprises with no connection to farms.
In 2005 there were over 131,500 small rural enterprises, of which 34% were en-gaged in basic agriculture, 18% were di-versified farms and 47% were other small enterprises. During the EU membership the total number of small rural enterpris-es has fallen as the number of basic farms has decreased very strongly. The number and relative share of diversified farms and other small rural enterprises has increased slightly.
Agriculture and farm forestry are still the most important rural industries. In 2005 there were about 45,200 farms en-gaged in basic agricultural production in Finland. The structure of Finnish agricul-ture is presented in further detail in Chap-ter 1.3.
Diversifi ed farms
In 2005 the number of farms practising another industry besides agriculture was 24,300, which is 35% of the Finnish farms. The number of diversified farms grew by 11% from 2000 and 3% from 2003. En-gaging in different kinds of activities has
traditionally been common among farm-ers, but in the 1990s new kinds of opera-tions were started more than ever before. Starting other business activities is often connected to changes in the operating en-vironment of farms, creating new demand for the products and services, while new challenges to agriculture may have encour-aged the farm families to seek new sources of livelihood. New operations have been started especially in the service sector.
However, there is a great deal of varia-tion within the group of diversified farms. Of the diversified farms in 2005 about 60% had engaged in other business activ-ity besides agriculture for at least five years and about 15% of them had started this after 2003. It can be estimated that each years about 1,800 active farms start up and about 1,300 farms quit business activities in other fields. In 2005 the number of di-versified farms was the greatest in Varsi-nais-Suomi and South Ostrobothnia, but in proportion to the total number of farms the number of diversified farms was the highest in Lapland, Uusimaa (southern-most Finland) and the Åland Islands. The farms engage in various kinds of activities. The most common ones are machine con-tracting (41% of diversified farms), tour-ism and various other services. In recent years the number of diversified farms en-gaged in the production of renewable en-ergy has grown rapidly and energy produc-tion has become the largest industrial sec-tor.
More than a third of the diversified farms practice more than one business ac-tivity besides agriculture. These are often connected to agriculture so that the farm equipment, buildings, land or products are used and the owner of the farm, the spouse, other family member or a partner in a farm company is involved in the other business.
Most of these activities (65% of farms) were also taxed together with agriculture under the Agricultural Tax Act. About a

17Number of diversified farms in 2000, 2003 and 2005.
Sector 2000 2003 2005
Diversified farms, total 21,838 23,551 24,295
Primary production other than agriculture and forestry 744 1,328 1,815
Fish, crayfish etc. farming on farms 112 102 64Fur farming 632 647 510Reindeer husbandry * 423 574Fishing * 156 144Other primary production * * 523
Industry 4,786 4,140 3,753
Food processing 1,065 846 684Other further processing 134 78 152Wood processing 1,349 1,134 889Handicraft 274 337 277Production of renewable energy 648 701 820Peat production 311 267 217Manufacturing of metal products 625 580 541Other manufacturing 380 197 173
Construction** * 697 881
Trade 1,056 1,234 1,299
Services 15,019 16,143 16,547
Tourism, accommodation, recreation services 2,272 2,041 1,865Contracting 8,880 9,039 10,013Care services 263 249 234Transportation 1,055 1,083 833Services to business * 736 680Horse husbandry services (renting of stables, horse training) * 717 734Real estate maintenance, cleaning and environmental management services
* * 264
Other services 2,549 2,278 1,924
Other 233 * *
*Different classification of sectors, this sector not accounted for in the year concerned.**Clearing, demolition and groundwork building included in machine contracting.
Source: Information Centre of the Ministry of Agriculture and Forestry.
third of the other business activities prac-tised on diversified farms are included in the Register of Enterprises and Establish-ments of the Statistics Finland.
Other business activities on farms are usually quite small in scale. In 2005 on 39% of the farms their turnover was less than € 10,000. However, on about 7% of these farms the turnover of other busi-ness activity was more than € 200,000. In
2005 these other activities employed about 22,300 AWU and about 46,950 persons were involved in these. Most of the work was done by the farm families, but the role of hired labour has been growing. In 2000 the other business activities on farms em-ployed a total of 11,300 persons outside the farm families (3,100 AWU), while five years later their number had risen to almost 15,000 and labour input to 7,600 AWU.

18
Trends in the number and staff of small rural enterprises in different types of rural areas in 1990–2004 (1990=1). Source: Rural business register.
�
� 6 �
� 6
� 6
� 6 �
�
� 6 �
� 6
- � � � � '
� � ) � � � � �
� � � � � � � � � � �
7 � � � �
� � � � � � � � �
� � � � �
$ 3 � � � � � �
3 ! 3 � � � � � �
� � � � � � � � � � �
% � � � � 3 � � � � � $ � �
�
� 6 �
� 6
� 6
� 6 �
�
� 6 �
� 6
� 8 8 �
� 8 8 �
� 8 8 �
� � � �
� � � �
� � �
- � � � � '
� � ) � � � � �
� � � � � � � � � � �
7 � � � �
� � � � � � � � �
� � � � �
$ 3 � � � � � �
3 ! 3 � � � � � �
� � � � � � � � � � �
Other small rural enterprises
In 2004 the number of enterprises includ-ed in the register of small rural enterpris-es was 69,600, of which 62,000 were not linked to a farm. Small enterprise means a company with one place of business with a turnover of at least € 8,409 which em-ploys less than 20 persons. Their turnover totalled € 13.9 billion and they employed 112,900 persons (entrepreneur + staff). In 1997–2004 the number of small enterpris-es grew by 9%, staff 15% and turnover by as much as 29%.
The number of small industrial compa-nies in the rural areas was about the same in 2004 as in the previous years. Since 1997 the number of industrial companies in rural areas and their staff in the whole country has grown by 2% and their turno-ver by 29%. Differences between regions and sectors are great. The number of rural companies in the building sector has in-creased since 1997. In 2004 their number was 12,300 and they employed 21,000 persons. The number of small rural en-terprises in the wholesale and retail busi-ness has decreased by 4% from 1997, but their staff has grown by 3% and turnover by 9%. In the service sector the number of enterprises has been growing rapidly. Since 1997 their number had increased by 15% to a total of 29,300 in 2004. They employ
44,100 persons and their total turnover is € 3.7 billion.
There are regional differences in the number and structural development of small rural enterprises. The number of en-terprises has grown in rural heartland ar-eas and urban-adjacent rural areas, while in the sparsely populated rural areas it has stayed about the same. Because the share of new enterprises is greater in rural heartland areas and urban-adjacent rural areas, their average size is somewhat smaller than the average size of enterprises in sparsely pop-ulated rural areas.
In 2004 there were about 2,000 en-terprises in the rural areas whose number of staff exceeded the limit for a “small” enterprise (20 employees) or which had more than one place of business. These em-ployed about 55,800 persons and their to-tal turnover was € 9.2 billion. About 42% of these were engaged in manufacturing in-dustry, 27% in trade and 27% in services.
In recent decades rural tourism has re-ceived considerable emphasis in rural pol-icy as a significant industry with good de-velopment prospects. According to the reg-ister of small rural enterprises, there are about 3,600 enterprises offering tourism, accommodation and recreation services in the countryside which are not linked to a farm and about 1,900 diversified farms en-gaged in tourism. A considerable number

19
of enterprises are excluded from the official statistics. The total year-round accommo-dation capacity of rural tourism enterprises is estimated at 30,000 bed places.
Manufacturing industry employs about 17% of the people working in small ru-ral enterprises, while in the whole country 13% of the staff of small enterprises work in manufacturing industry. Especially food and wood processing companies are char-acteristically located in the rural areas: 57% of the small food companies and 70% of small wood processing plants are in the countryside.
Equine industry
Equine industry is a rapidly growing ac-tivity, which relies heavily on the rural re-sources and local strengths. Equine indus-try comprises the raising of horses, care services for horses, training, riding schools and related tourism. The total number of stables in Finland is over 15,000 and about a quarter of these are companies. About 70% of the stables operate on farms.
Each year about 100–200 new enter-prises are established in the sector, which now employs altogether about 10,000 peo-ple, 4,000 of them full-time. The number of new jobs created annually is estimated at 250–500. In addition to this, feed pro-duction, trade, building, manufacture of equipment, veterinary medicine, competi-tions, and training and advice employ over 5,000 persons full-time or part-time time. The number of horses has grown by about 40% since 1995. In 2005 there were about 70,000 horses in Finland, of which about 40% were owned by farm enterprises. An estimated 90,000 ha of arable land is tied to the production of basic feed for horses.
Estimated according to the total costs, the money flows in equine indus-tries are about € 0.34 billion. Trotting is a very popular sport in Finland. Altogether 8,000 horses start off each year at trot-ting races and the annual turnover of bet-ting in horse races totals about € 250 mil-
lion. About 50,000 persons enjoy trotting races and totalizator wagering as a hobby. The number of riding schools and stables offering horse activities approved by the Equestrian Federation of Finland is more than 200 and riding is a hobby for about 140,000 persons. The number of horse owners is 35,000.
In the past five years altogether about € 80 million has been invested in the op-erating environment of horse husbandry (stables, riding manages, etc.). In the next five years these investments are estimated to total over € 115 million. The invest-ments made correspond to 40–50% of the investments in pig houses and 50–75% of those in cattle buildings.
Fur farming
In 2006 there were about 1,400 fur farms in Finland. According to the Finnish Fur Breeders’ Association, fur production em-ploys directly about 5,000–6,000, and in-directly 10,000 persons. In terms of num-bers the most common fur animals are blue fox and mink. Other fur animals farmed in Finland are silver fox, finnraccoon and Eu-ropean polecat. Great fluctuations in the trade cycle are characteristic to the field. 98% of the fur production is exported. Fin-land produces 50% of the blue foxes sold in the world. The annual revenue from fur exports totals about € 150 million.
Reindeer herding
Reindeer herding is a highly significant ru-ral business in northern Finland, also in terms of other activities such as tourism. In the reindeer herding year 2004/2005 the number of reindeer owners was 5,100, which is almost a quarter less than ten years earlier, but the number of reindeer has stayed about the same. In 2004/2005 the number of reindeer totalled about 207,200, of which 116,700 were slaughtered. In 2003/2004 the production of reindeer meat totalled about 2.55 million kg.

20
Number of farms receiving agricultural support in 1996–2006.
1996 1997 1998 1999 2000 2001 2002 2003 2004 2005 2006
Whole country 91,281 88,370 85,690 82,142 77,896 75,384 73,386 72,000 71,100 69,088 68,766
Southern Finland1 41,351 39,998 38,623 37,037 35,319 34,192 33,375 32,771 32,245 31,272 30,967Eastern Finland 16,652 16,067 15,446 14,658 13,675 13,219 12,935 12,630 12,498 12,121 12,173Central Finland 23,694 22,914 22,072 21,108 20,019 19,443 19,023 18,656 18,458 17,986 17,947Northern Finland 9,584 9,391 9,549 9,339 8,883 8,530 8,053 7,943 7,899 7,709 7,679
1Main regions of Uusimaa and Åland according to NUTS II have been included in Southern Finland.
Source: Support register of the Ministry of Agriculture and Forestry/Information Centre.
Number of farms receiving agricultural support in 1995 and 2006 (main regions of Uusimaa and Åland according to NUTS II have been included in Southern Finland). Source: Support register of the Ministry of Agriculture and Forestry/Information Centre.
� 8 8 � � � �
� � � 8 �
�
� � � � � �
� � � � � �
� � � � � �
� � � � �
� � � � � � � � � �
Eastern Finland
NorthernFinland
Whole country
�
� � � � � �
� � � � � �
� � � � � �
� � � � �
� � � � � �
� � � � � �� � � � � �
� 8 8 � � � �
�
� � � � � �
� � � � � �
� � � � � �
� � � � �
� � � � � �
� 8 8 � � � �
8 � 8 � � � � 8
� 8 8 � � � � �
� � � � � �
� � � � � �
� � � � � �
� � � � �
� � � � � �
� � � 8
� � � 8 �
8 � � � �
� � �
�
� � � � � �
� � � � �
� � � � �
� � � � � �
� � � � � � �
� 8 8 � � � �
Central Finland
SouthernFinland
1.3. Finnish farm
Number and size
distribution of farms
In 2006 the total number of farms (over 1 ha) which had applied for agricultural support was about 68,700. During the eleven years of the EU member-ship (1995–2006) the number of Finnish farms has fallen by 28% (2.9% annually) from 95,562 by about 26,800 farms. Propor-tionally the decrease has been the greatest in eastern Finland (31%) and the smallest in northern Fin-land (23%), while in both central and southern Finland the number of farms has fallen by 28%.
From 2005 until 2006 the number of farms which applied for support fell by about 320 (0.5%). In both absolute and relative terms decrease in the number of farms was smaller than the long-term average. Dur-ing the EU membership the de-crease was the greatest in 1995–1996 and 1999–2000, when the number of farms fell by about 4,000, which is about 5% of the total number of farms.
While the number of farms is decreas-ing rapidly, the average farm size is on the increase. In 1995–2006 the average size of farms receiving agricultural support grew
by 43.3% from 22.8 ha of arable land to 32.6 ha. The annual growth in the average farm size has varied from 0.5 ha to 1.5 ha. The growth is due to both the decrease in

21
Size class distribution and average arable area of farms receiving agricultural support in 20061.
Whole countryArable land Southern Finland2 Eastern Finland Central Finland Northern Finland 1995 2006
Number of farms %
Number of farms %
Number of farms %
Number of farms %
Numberof farms
%
Numberof farms %
<10 ha 5,682 18 2,935 24 3,722 21 1,714 22 22,850 24 14,053 2110–20 ha 6,593 21 3,057 25 4,387 25 1,504 20 30,698 32 15,541 2320–30 ha 5,087 16 2,076 17 3,190 18 1,184 15 19,669 21 11,537 1730–50 ha 6,245 20 2,336 19 3,572 20 1,550 20 15,414 16 13,703 2050–100 ha 5,439 18 1,457 12 2,455 14 1,354 18 5,706 6 10,705 16>100 ha 1,799 6 249 2 523 3 348 5 784 1 2,919 4
Number of farms 30,845 12,110 17,849 7,654 95,121 68,458
Average arable area, ha/farm 35.75 28.15 30.34 30.50 22.77 32.62
1The figures do not include horticultural enterprises if they have no fields under cultivation.2Main regions of Uusimaa and Åland according to NUTS II have been included in Southern Finland.
Source: Support register of the Ministry of Agriculture and Forestry/Information Centre.
Area of leased arable land (ha) in 1996–2006.
� � �
� � �
� �
� � �
� �
� � �
� � �
� � �
�
8 8 � 8 � 8 8 � � � � � � � � � � �
� � � � � � � �
�
the number of small farms and increase in the number of large farms.
The structural change is reflected in the proportional share of the different size cat-egories: in the past eleven years the share of farms with less than 20 ha has fallen from 56% to 43% and the share of farms with more than 50 ha has almost tripled from 7% to 20%. However, the share of small farms is still high in Finland, and the very large farms with more than 100 ha of ar-able land represent only about 4% of the Finnish farms.
About two-thirds of the growth in the farm size in 1995–2006 has occurred through leasing. In 2006 the total cul-tivated arable area of farms receiving agricultural support was 2.28 million ha, and about 696,000 ha (30%) of this was leased. In 2005 the leasing of arable land decreased for the first time and in 2006 the leased area fell fur-ther by about 9,000 ha. The leased ar-able area in 2004 was about 50,000 ha larger than in 2006. There is consid-erable regional variation in the leased area: in the territory of the Lapland and Åland Employment and Econom-ic Development Centres almost 41%
of the arable area is leased, while in cen-tral Finland and Ostrobothnia the share of leased area is less than 30%.
The machine capacity needed for arable farming is quite high relative to the average cultivated area. Besides the small farm size, this is due to the short growing season and uncertain cultivation conditions. Coopera-tion in the use of machinery is difficult due to the short optimal periods for cultivation measures and harvesting and small size of the parcels, which does not allow farmers to take full advantage of efficient machines. In 2006 the average size of base parcels was

22
2.39 ha. It varied from over 3 ha in south-ern Finland to less than 2 ha in eastern and northern Finland.
Finnish agriculture is based on family farms: in 2006 88.4% of farms receiving support were privately owned and 10.4% were owned by heirs and family compa-nies and corporations. Cooperatives, lim-ited companies and production rings own 0.8% of the farms and 0.1% are owned by the State, municipalities, schools and parishes.
The average age of farmers is 50 years. Since 1995 the average age of farmers has risen by almost three years, partly as a re-sult of the small number of farms trans-ferred to the next generation.
Production structure of farms
Measured by the number of farms, the pro-duction structure of Finnish agriculture has changed considerably during the EU mem-bership. The share of livestock farms has fallen while the share of crop farms has in-creased clearly. In 2006 34% of the farms which applied for support were livestock farms and 61% were crop farms, while in 1995 the share of livestock farms was 52% and that of crop farms was 39%. How-ever, no major change has occurred in the share of livestock production in the return at market price, which was 83% in 2006.
In 2006 about 15,000 farms practised dairy husbandry as their main production line. This is about 22% of the farms that re-ceived agricultural support. In 1995–2006 the number of dairy farms fell by about 17,000, by about 6.7% a year. Based on the total value of the production dairy hus-bandry is still the most significant type of agricultural production in Finland. In re-cent years it has accounted for about half of the return on agricultural production at market price (48% in 2006). Proportion-ally the share of dairy farms is the greatest in eastern and northern Finland (36%).
In 2006 the number of farms special-
ising in pig husbandry was about 2,960, which is about 4.3% of the farms that applied for support. In 1995–2006 the number of pig farms fell by almost 52.5%, i.e. 6.6% per year. Of the pig farms 1,079 specialised in piglet production, 907 farms specialised in pigmeat and 973 farms prac-tised combined pig production. Most of the piglet and pigmeat farms are located in southern and western Finland. Pigmeat represents about 15% of the return on ag-ricultural production at market price, and in terms of the value of the production it is the second most important agricultural product after milk.
In 2006 about 4,240 farms (6.3% of all farms), specialised in beef production, and the share of beef in the value of agri-cultural production was almost 11%. In 1995–2006 the number of these farms fell by about 4,800, which is almost 7% per year. The number of beef farms fell much more rapidly during the first years in the EU than in 2001–2006.
The number of poultry farms was 928, which is about 1.3% of the farms that ap-plied for support. During the EU mem-bership the number of poultry farms has decreased the most, by about 7.5% per year. In 2006 about 59% of these special-ised in egg production, 28% in poultry meat production and 13% were breeding units. The regional distribution is similar to that of pig husbandry, i.e. the produc-tion is concentrated to southern and west-ern Finland
Well over a half of the farms that re-ceive agricultural support specialise in crop production (61%). This is the only main agricultural sector where the number of farms has been growing in recent years. In 2006 there were about 4,400 crop farms more than in 1995. More than half of the crop farms are located in southern Finland and about a quarter are in central Finland. In 2006 the share of crop production in the return on agricultural production at market price was over 17%.

23
Distribution of farms receiving agricultural support according to production line in 2006 (main regions of Uusimaa and Åland according to NUTS II have been included in Southern Finland). Source: Support register of the Ministry of Agriculture and Forestry/Information Centre.
Beef production 4.3%Poultry production 1.9%
Dairy husbandry 12.5%
Other 5.0%
Pig husbandry 5.3%
Crop production 71.1%
Southern Finland
Other 7.5%
Cropproduction 44.0%Dairy
husbandry 36.3%
Poultry production 0.5%
Pig husbandry 1.7%
Beef production 10.0%
Eastern Finland
CentralFinland
Cropproduction59.3%Dairy husbandry
22.4%
Other 4.8%
Pig husbandry 5.6%
Beef production 6.3%Poultry production 1.5%
Cropproduction 48.3%Dairy
husbandry 35.0%
Other 7.9%
Pig husbandry 1.3%Beef production 7.3%
Poultry production 0.2%
Northern FinlandWhole country
Cropproduction60.6%Dairy husbandry
21.8%
Other 5.7%
Pig husbandry 4.3%
Beef production 6.2%Poultry production 1.3%
Forest is an integral part of Finnish farms. In 2006 the average forest area of farms receiving agricultural support was 46 ha. Regional variation is great: in central Finland the average forest area of farms is
less than 30 ha, while in Lapland it is over 100 ha. The income from forestry per farm is the highest in South Savo and lowest in Åland.

24
2. AGRICULTURAL AND FOOD MARKET
2.1. Arable crops
The crop year 2006 was quite normal. The total cereal yield was 3.789 bill. kg, which was 7% lower than in 2005. The total grass yield was well below the average and espe-cially the second yield remained poor in certain regions. The total silage yield was 28% smaller than in 2005.
Weather conditions
The average temperature of 2006 var-ied from a little under 7 degrees Celsius in the south to –0.7 degrees in northern Lapland. In the whole country the aver-age temperature of the year was about one degree higher than the average of the years 1971–2000.
The growing period of 2006 was a little longer than normal. In the south it started at about the usual time (22 April), but it lasted longer in the autumn (until 27 October). In the south the growing peri-od was 189 days. In central Finland it was also a little longer than the average, 175 days. In the north the growing period was 104 days; it started two weeks ahead of the normal (4 May), but it ended at about the usual time
Besides being longer than the average, the growing period was also very intensive. The temperature sum was well above the average: in Helsinki it was 1,777 degrees (long-term average 1,364), in Jyväskylä 1,447 degrees (1,142) and in Sodankylä 998 degrees (786).
In southern and western Finland and along the coast of Ostrobothnia the sum-mer was the driest ever. In most parts of the country there was about a third more sunshine than usually. Abundant rains to-wards the end of the year wetted the soil and filled the riverbeds also in the dry re-gions. October was the rainiest month of the year. Record high precipitation in Fin-
land in October, 228 mm, was measured in Vihti, south-central Finland.
Total precipitation in most parts of the country was 500–560 mm, on the coast and in northern Lapland 400–450 mm. This is 16–26% below the normal.
Areas and yields
The surface area of Finland is 33.8 mill. ha, of which about 2.3 mill. ha is utilised agri-cultural area. The share of agricultural area of the total surface area is only 6.8%, while the average in the EU is 46.7%.
The total cultivated area (incl. fallow) is 2,259,000 ha. Since 2000 the cultivat-ed area has grown steadily by altogether 71,500 ha.
Compared to 2005 the cereal area de-creased by 3%, while grass area stayed about the same. In the past couple of years the cereal area has decreased slightly, while the grass area has grown. The trend in the cultivation area of all cereals was the op-posite compared to the past few years: the area under barley turned into a decreased (5%), while the oats area increased by 2%. Of the bred cereals the area of winter wheat grew by 73%, spring wheat area fell by 14% and area under rye grew by 52%. Pasture area decreased by 4% and the area under dry hay grew by 17%.
Cereal production in Finland in 2006 totalled 3,790 mill. kg, which is 269 mill. kg (7%) less than the year before. In gen-eral we cannot talk about any serious crop damages, because the average yields were higher than the ten-year average, except for oats and winter wheat. However, the regional differences were considerable. In Uusimaa and Kymenlaakso in southern Finland the yields of all cereals were lower than in 2005, while in the other regions the yields of different cereals varied and in many regions the average yields were even better than the year before. The cereal

25
production of 2006 satisfies the do-mestic demand, except for rye and bred wheat.
The area under fodder cereals was 935,000 ha and the total yield was 3,052 mill. kg, which is 5% low-er than in 2005. Both the area and hectarage yields of fodder cereals fell by 2–3%. The hectarage yield of oats was 3,500 kg/ha and that of oats was 2,920 mill. kg. The quality of fodder cereals was excellent. For 90% of the fodder barley, about 1,350 mill. kg, the weight per hectolitre was over 64 kg and for 93% of the oat yield it was over 52 kg.
In 2006 the total yield of bread cereals was 735 mill. kg, which is 12% less than the year before. This is mainly due to the reduction in the production area of spring wheat, although there was also some reduc-
Total yield without straw in 1985–2005, f.u./ha.
Harvested areas and yields of main crops in 2005 and 2006.
2005 2006Area Yield Total Area Yield Total
1,000 ha 100 kg/ha million kg 1,000 ha 100 kg/ha million kg
Winter wheat 11.6 38.5 45 20.2 31.0 63Spring wheat 203.2 37.2 756 172.1 36.1 621Rye 14.2 22.9 32 21.8 23.3 51Barley 594.0 35.4 2,103 563.5 35.0 1,972Oats 345.4 31.1 1,073 352.7 29.2 1,029Mixed cereals 16.3 29.4 48 18.8 27.3 51Peas 3.7 22.0 8 4.2 21.2 9Potatoes 28.9 257.0 743 28.0 205.3 576Sugar beets 31.2 379.3 1,183 23.8 399.4 952Dry hay 107.1 35.3 338 125.4 33.3 417Green fodder 16.4 116.1 190 15.0 90.7 136Silage 397.5 174.0 6,915 384.4 132.7 5,102Turnip rape 72.6 13.8 100 99.6 13.8 137Rape 3.9 14.6 6 7.3 15.4 11Camelina 1.9 - - 5.3 12.8 7Pasture 91.5 87.9Other crops 40.8 43.5
Total 1,980.2 3,6161 6,7962 1,966.2 .. ..
Set aside and managed uncultivated arable land
241.0 253.4
1 f.u./ha without straw, 2 million f.u. without straw.
Source: Information Centre of the Ministry of Agriculture and Forestry.
� � � � � � �
� �
�
� �
� �
� � � � � � � � �
tion in the hectarage yield. The total yield of spring wheat was 621.4 mill. kg, which is 18% less than in 2005. The average yield was 3,600 kg/ha, which is 3% lower than the year before. The average yield of win-ter wheat was 3,100 kg/ha, which is 19%

26
Yields of main crops in Finland from 1986 to 2006. Source: Information Centre of the Ministry of Agriculture and Forestry.
� � � � � � � � � � �
� � � � �
� �
�
� �
� �
� � � � �
� �
� � �
� �
� � �
� � � � �
� �
� �
�
� �
� �
� � � � � � � � � � �
� �
� �
�
� �
� �
� � � � �
� � � � � � � � � � �
� � � � �
� �
� �
�
� �
� �
� � � � � � � � � � �
� � � � �
� �
� �
�
� �
� �
� � � �
� � � � � � � � � � � � � � � � � � � � � �
� � � � � �
� � �
� � � � � � �
� � � � � �
� � � ! � � " � � � �
lower than in 2005.Even if the area under spring wheat fell
between 2005 and 2006, in the past seven years it has grown almost 1.5 fold. Annual variation in the cultivation area of winter wheat has been great. The growth in the wheat area has been founded on more high-yielding varieties, changes in payments for the crop sector, trends in market prices and changes in the production structure of farms.
The total yield of wheat harvested in 2006 was 684 mill. kg, of which 42% meets the quality requirements of mills. Here the quality standard for mills has been defined so that the protein content must be at least 12.5%, weight per hectolitre 78 kg and Hagberg falling number 180. Of the spring wheat yield 43% met the quality standards for mills and 93% was fit for in-tervention. The main reason why some of the wheat did not qualify for milling was

27
Market prices of cereals in Finland from 2002 to 2006. Source: Information Centre of the Ministry of Agriculture and Forestry.
� � � � � � �
� �
� �
� �
�
�
# � � � �
� � � � � �
� �� � � � � � �
� �
� � � � � � �
� � �
� � � �
� �
� �
� �
�
�
� �
� �� � � � � � �
low protein content. In some of the wheat offered for intervention the protein con-tent was too low and the Hagberg falling number was below the intervention limit of 220. Of the winter wheat 26% qualified for milling and 68% was fit for interven-tion. Low protein content was the main problem also for winter wheat.
The annual domestic need for wheat is more than 700 mill. kg, and thus self-suf-ficiency in wheat was not quite reached in 2006. Wheat consumption has been grow-ing in the past few years, both in milling and as fodder.
The total yield of rye was 50.9 mill. kg, which was 57% higher than the year before. Almost all of the rye harvested in 2006 meets the quality standards for bred cere-als, i.e. minimum weight per hectolitre of 71 kg and Hagberg falling number 120.
The area sown with winter cereals in autumn 2006 was much larger than the year before. The rye area grew by 20,000 ha and wheat area by 40,000 ha from the area harvested in the same autumn. The area sown with wheat was almost double the harvested area.
The total silage yield was 5,102 mill. kg, which was 26% smaller than the year before. Because of the drought the second yield was very small in some re-gions. The total yield of dry hay was 417 mill. kg, which is 10% higher than the
year before. The area of dry hay grew by 17% to 125,400 ha. The area under silage was 384,400 ha, which was a little small-er than the year before. The pasture area was 87,900 and the fresh fodder area was 15,000. Both fell slightly from the previ-ous year.
The total potato yield was 575.7 mill. kg, which was 22% lower than the year before. The potato yield was the lowest in the past couple of decades. The average hectarage yield was 20,530 kg, which is 20% lower than in 2005. Since 1990 the cultivation area of potatoes has been fall-ing steadily at a rate of about 2% a year. In 2006 the potato area was 28,000 ha.
The yield of sugar beets totalled 951.9 mill. kg, which was 20% lower than in 2005. The cultivated area fell by 24% from the year before to a total of 23,800 ha. The average yield of 39,940 was 5% higher than in 2005. The quality of most of the crop was good, but the heavy rains in the autumn increased the amount of dirt. The average sugar content was 15.49%.
In 2006 the cultivation area of oilseed crops exceeded 100,000 ha for the first time. Another significant trend was the considerably increase in the cultivation of oilseed rape. In 2006 turnip rape and oilseed rape were cultivated on 106,900 ha and the yield totalled 148 mill. kg. The total yield was the highest ever, and 40%

28
Market prices of cereals in 2006, €/1,000 kg1.
Rye Wheat Barley Oats
Finland 136.37 103.58 100.11 106.33Sweden 107.47 102.24 95.09 101.98France 119.92 103.88 90.74 164.362
Spain 121.86 132.55 123.02 137.71
1The prices of the 1st half of the year as unweighted
averages. 2Data for France indexed from the price in 2000.
Source: Eurostat.
Market prices of cereals in Finland from 1996 to 2006, €/1,000 kg.
Rye Wheat Barley Oats
2006 139.81 110.50 102.00 107.26
2005 118.41 106.20 99.51 87.132004 120.90 119.80 106.51 87.322003 124.88 126.66 105.57 92.212002 126.57 131.79 106.00 104.382001 131.31 132.36 109.66 111.372000 131.19 134.55 119.41 117.731999 142.96 137.91 122.78 114.371998 146.32 142.96 122.78 111.001997 149.69 148.01 124.46 117.731996 151.37 153.05 126.14 124.46
Source: Information Centre of the Ministry of Agricul-
ture and Forestry (Grain bulletin and Monthly Review of Agricultural Statistics).
higher than the year before. The average hectarage yield was 1,390 kg. The quality of both turnip rape and oilseed rape was also good: 99% of the yield meets the qual-ity standards of oil pressing industry.
Market prices for arable crops
On average the prices paid for all cereals in 2006 were 9% higher than the year before. The average price for fodder barley, € 102/tonne, was 3% higher than the year before. The price rose steadily and towards the end of the year the demand was high. For malt-ing barley the situation was the opposite: the average price of € 114/tonne was 1% lower than the year before. However, to-wards the end of the year the demand for malting barley increased as well and the prices rose in late autumn. In December 2006 the price was € 129/tonne.
In 2006 the oats prices were higher than the year before all through the year, and in December a record high level during the EU membership was reached, almost 136 €/tonne. During the autumn the prices rose from the opening price in August by as much as 41%. The average price quoted for the whole year was 107.26 €/tonne, which is 23% higher than the year before. In 2006 the prices paid for oats were higher than the barley prices. The last time this was the case was in 2001. The price of maize, which is the main competitor of oats on the world’s fodder cereal market, has risen strongly in the Chicago Grain Exchange, which has been reflected in the world mar-
ket price for oats. The prices have been ris-ing despite the high oats yield harvested in the largest producer country Canada. Oats is not included in the intervention system, which is why it is more sensitive to price fluctuations than the other cereals.
The average prices for bread cereals, es-pecially rye, were higher than the year be-fore. The average price for wheat was 4% and that for rye was 18% higher than in 2005. In December the price of rye rose to a little under 162 €/tonne, which is the highest price in ten years. In Novem-ber 2006 all of the wheat in the Finnish intervention stocks, altogether 26.7 mill. kg, was sold to a single buyer at a price of 136.3–140.2 €/tonne.
In 2006 the average price for turnip rape and oilseed rape was 20% higher than in 2005. The price is determined accord-ing to the world market prices quoted in MATIF in Paris. The average price for food potato was 163.30 €/tonne, which was 3% lower than in 2005, but as the yield har-vested in 2006 fell by 22% from the year before due to the drought, the price started to rise quite rapidly in the autumn. In De-cember the potato price was already 202.60 €/tonne. Changes in the supply influence the potato prices a great deal.

29
Milk production and the amount of milk delivered to dairies in Finland from 1996 to 2006.
$ � � � � � % & � ' � � % !
� � � � ( � � � & � � % � & � � � � � �
) � � � � % ! � � � � � � �
� � � � � � � � � � �
� � �
� � � �
� � �
� �
� � � �
� � �
� � �
2.2. Livestock production
Milk
The amount of milk delivered to dairies in 2006 totalled about 2,279 mill. litres, which was 0.6% (14 mill. litres) less than the year before. The protein content rose and fat content fell slightly from the year before. One likely reason for the reduc-tion in milk production volume was the decrease in silage yield by 28%.
Milk production in Finland fell 36 mill. litres short of the national quota for the period that ended in 2006. According to the forecast of the Gallup Food and Farm Facts, in the quota period 2006/2007 milk production in Finland will remain 70 mill. litres (3%) below the national quota. In 2007 the production volume should be the same as in 2006, 2,279 mill. litres.
In December 2006 the dairies re-ceived milk from 13,899 farms, of which 123 were organic farms. The number of farms delivering milk to dairies fell by 1,462 (9.5%) during 2006. In December 2006 the number of dairy cows fell below 299,000, which was 14,500 cows (4.6%) less than the year before.
The average yield of dairy cows was 7,438 litres, which was 2.8% higher than in 2005. The average herd size grew by 1.1 cows. In December 2006 the average herd size was 21.5 cows.
The consumption of liquid milk to-talled 704 mill. litres, which is 0.2% less than in 2005. The consumption of butter-milk and curd milk decreased as well. The consumption of different types of creams grew. The consumption of yoghurt in-creased by 9%, production by 2% and im-ports by more than a third.
The production of butter increased by 0.5% and domestic consumption by 7% from 2005. The stocks of butter in-creased and butter exports decreased. The consumption of butter-vegetable oil mix-es decreased by 7% and manufacture by 4%. The production of powders fell by 1% from 2005.
Both cheese consumption and produc-tion increased by 3% from the year before. The production of Edam cheeses increased at the cost of other domestic cheeses. The sale of domestic cheese spreads grew by 6%. Cheese imports increased by 17% and exports by 12%. Imports represent about a third of cheese consumption.
Beef
In 2006 a total of 85 mill. kg of beef was produced in Finland, which was 0.5% more than the year before. Beef consump-tion totalled 95.2 mill. kg. According to a forecast of the Gallup Food and Farm Facts, in 2007 beef production will decrease to
84.1 mill. kg, while consumption should be about the same as in 2005 and 2006.
The average slaughter weights of bovines continued to rise. The av-erage slaughter weight of cows was 264 kg (+3 kg), that of bulls was 324 kg (+5 kg) and heifers 233 kg (+6 kg). In six years the average slaugh-ter weight of bulls has risen by almost 50 kg.
The slaughtering of young bovines decreased by 4% from 2005, but the number of cows slaughtered grew by 7%. The poor grass crop yield

30
Production of beef, pigmeat, poultry meat and eggs in Finland from 1996 to 2006.
* � � ) � � �
� � � �
+ � � �* % � � � � � � ) � � �
) � � � � % ! � � �
� � � � � � � � � � �
� �
�
� �
�
�
encouraged the producers to early slaugh-terings in the autumn. In 2006 altogeth-er 152,000 bulls and 103,000 cows were slaughtered. The number of calves born was 331,900 (–2%). The number of calves delivered to other farms fell by 3%.
The number of farms specialised in beef production fell by 5% from 2005, but the number of suckler cow farms grew by about 10% and the number of suckler cows by 12%. In the beginning of December 2006 there were altogether 40,000 suckler cows in Finland. Suckler cow production is expected to continue to grow in 2007.
Beef exports increased by 54% to 2.4 mill. kg. Almost all beef exports went to Sweden. Beef imports grew by 6% to 14.4 mill. kg. Beef was imported mainly from Sweden, Brazil, Ireland and Germany.
Beef production in the EU decreased by 2.5% in 2006. The demand has returned to the level where it was before the BSE cri-ses of the 1990s. The European Commis-sion has estimated that by the end of the decade beef production in the EU is going to fall by 4–5%.
Pigmeat
In 2006 pigmeat production totalled a little over 207.8 mill. kg (+2%) and consump-tion was 180.2 mill. kg (+3%). Produc-tion increased especially in the early part of the year, when there were distur-bances on the poultry market. The av-erage slaughter weight of pigs rose to 84.6 kg (+2%). The number of pigs slaughtered was 2.2 mill. (+0.5%). Domestic pigmeat sold very well on the Christmas market, and the media even told that domestic ham might run out before Christmas.
Pigmeat exports grew by almost a fifth to 48.1 mill. kg. The share of ex-ports in the production rose to 23%. Most of the exports go to Russia, Estonia, Sweden and Japan, which altogether represent almost 74% of
the carcass meat exports. Most of the pig-meat imports and exports of Finland are carcass meat. The share of Russia in carcass meat exports rose from 22 to 38%.
Pigmeat imports to Finland totalled 17.7 mill. kg in 2006 (+16%). The im-port of processed meat products grew by 10% and carcass meat imports by 14%. The most important trade partners were Denmark and Germany, which in recent years have accounted for 75–80% of car-cass meat imports, and Sweden and Ger-many for the part of processed meats. Pig-meat imports represented 10% of the con-sumption.
The number of piglets per sow in-creased by 0.2%. The number of piglets traded for rearing increased by 3%. Finland exports very few live animals, but in 2006 25,000 piglets were exported to Sweden, corresponding to about 1% of the annual pigmeat production potential in Finland.
Structural change has been very strong in pig husbandry. The number of farms rear-ing sows fell by 8.3%, but the number of sows decreased by only 1.3%. About a fifth of the sows were reared in units with more than 300 sows. The share of piglets (27%) reared in production units with more than 200 sows has tripled in 2000–2005.
According to a forecast by the Gallup Food and Farm Facts, pigmeat production should rise to 211 mill. kg in 2007 (+1%).
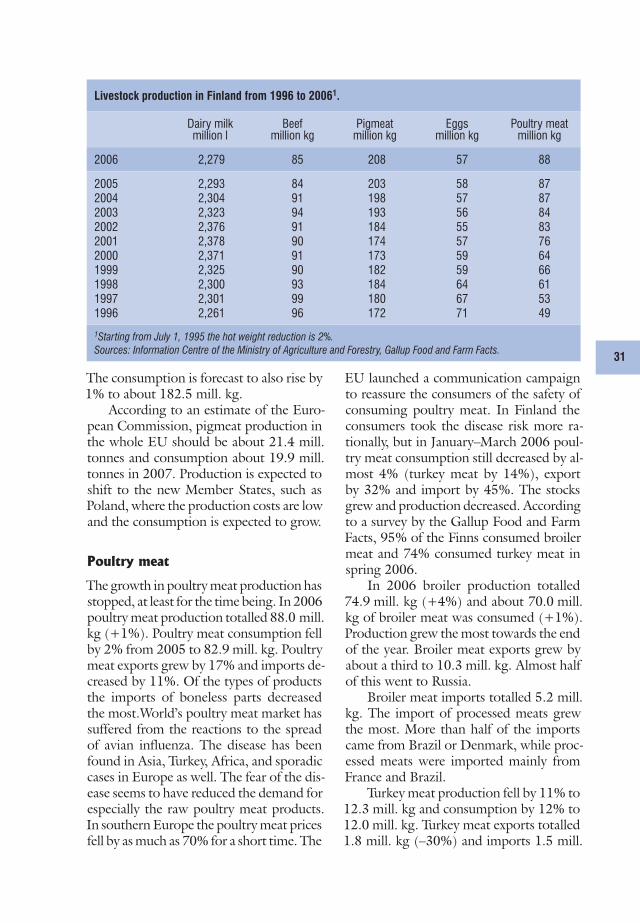
31
Livestock production in Finland from 1996 to 20061.
Dairy milk Beef Pigmeat Eggs Poultry meatmillion l million kg million kg million kg million kg
2006 2,279 85 208 57 88
2005 2,293 84 203 58 872004 2,304 91 198 57 872003 2,323 94 193 56 842002 2,376 91 184 55 832001 2,378 90 174 57 762000 2,371 91 173 59 641999 2,325 90 182 59 661998 2,300 93 184 64 611997 2,301 99 180 67 531996 2,261 96 172 71 49
1Starting from July 1, 1995 the hot weight reduction is 2%.
Sources: Information Centre of the Ministry of Agriculture and Forestry, Gallup Food and Farm Facts.
The consumption is forecast to also rise by 1% to about 182.5 mill. kg.
According to an estimate of the Euro-pean Commission, pigmeat production in the whole EU should be about 21.4 mill. tonnes and consumption about 19.9 mill. tonnes in 2007. Production is expected to shift to the new Member States, such as Poland, where the production costs are low and the consumption is expected to grow.
Poultry meat
The growth in poultry meat production has stopped, at least for the time being. In 2006 poultry meat production totalled 88.0 mill. kg (+1%). Poultry meat consumption fell by 2% from 2005 to 82.9 mill. kg. Poultry meat exports grew by 17% and imports de-creased by 11%. Of the types of products the imports of boneless parts decreased the most.World’s poultry meat market has suffered from the reactions to the spread of avian influenza. The disease has been found in Asia, Turkey, Africa, and sporadic cases in Europe as well. The fear of the dis-ease seems to have reduced the demand for especially the raw poultry meat products. In southern Europe the poultry meat prices fell by as much as 70% for a short time. The
EU launched a communication campaign to reassure the consumers of the safety of consuming poultry meat. In Finland the consumers took the disease risk more ra-tionally, but in January–March 2006 poul-try meat consumption still decreased by al-most 4% (turkey meat by 14%), export by 32% and import by 45%. The stocks grew and production decreased. According to a survey by the Gallup Food and Farm Facts, 95% of the Finns consumed broiler meat and 74% consumed turkey meat in spring 2006.
In 2006 broiler production totalled 74.9 mill. kg (+4%) and about 70.0 mill. kg of broiler meat was consumed (+1%). Production grew the most towards the end of the year. Broiler meat exports grew by about a third to 10.3 mill. kg. Almost half of this went to Russia.
Broiler meat imports totalled 5.2 mill. kg. The import of processed meats grew the most. More than half of the imports came from Brazil or Denmark, while proc-essed meats were imported mainly from France and Brazil.
Turkey meat production fell by 11% to 12.3 mill. kg and consumption by 12% to 12.0 mill. kg. Turkey meat exports totalled 1.8 mill. kg (–30%) and imports 1.5 mill.

32
Market prices for livestock products in certain EU countries in 20061, €/100 kg.
Milk Pigmeat (E)
Beef (bull)
Poultry meat2
Eggs3
Finland 33.55 133.07 264.32 192.45 78.15Sweden 28.28 139.39 271.52 168.40 150.74Denmark 28.83 128.25 298.17 152.53 136.61Estonia 24.25 139.80 193.43 146.20 86.95Germany 26.64 153.99 301.56 175.63 85.82France 28.81 138.65 328.38 173.12 84.13
1For milk the average of January–September, 2Sale price
of slaughterhouses, 3Sale price of packaging plants.
Source: European Commission.
kg (–26%). In the export of carcass meat the share of Russia and Estonia is about two-thirds. Most of the imports come from Brazil and Germany. The import of proc-essed meat from Germany and especially Brazil increased considerably. The share of domestic production in turkey meat con-sumption rose by 2.4% to 87.2%
The Gallup Food and Farm Facts esti-mates that in 2007 broiler meat consump-tion will total 70.2 mill. kg and produc-tion 75.4 mill. kg. The production and consumption of turkey meat are also ex-pected to rise again. The forecast for both is 12.5 mill. kg.
Eggs
In 2006 egg production totalled 57 mill. kg, which is 2% less than the year before. Egg consumption was a little over 48 mill. kg (+0.5%). The consumption of egg prod-ucts decreased by 3% but the consumption of shell eggs grew by 1%. Hens kept in bat-tery cages still produced 87% of the eggs, even if traditional battery cages should be abolished by 2012.
The total egg exports fell for the first time in years. A total of 10 mill. kg of eggs were exported (–10%). Export of shell eggs decreased by 18% and that of egg products by 37%. Because of the low price some producers refused to place eggs on the mar-ket for some time, producers in south-west
Finland planned to export eggs to Europe for higher producer price, and there was discussion on whether the members of the same family owning production capacity for more than 20,000 hens are eligible for full support payments.
Producer prices
The market prices of livestock products in the other EU Member States influence their prices in Finland, but the Finnish prices also have special characteristics. For example, the market prices for pigmeat and milk usually vary less in Finland than in most other EU countries. In Finland there is oversupply in eggs, and their producer price is low compared to the other parts of the EU.
The prices paid to the Finnish milk producers are slightly higher than the pric-es paid to the producers in the EU on av-erage. In 2006 the average producer price for milk (incl. quality price premiums) was 32.75 €/100 l (–1%). In addition to this, the average of 7.47 €/100 l was paid as
The producer prices of the most important live-stock products in Finland from 1996 to 2006 including production support (€/100 kg, milk €/100 l). The figures include estimated retro-active payments.
Milk Beef Pig-meat
Poultry meat
Eggs
2006 34.97 212 126 109 62
2005 35.22 205 128 114 602004 35.75 190 120 117 742003 36.68 186 115 117 802002 36.83 190 137 120 792001 36.26 208 150 117 692000 34.97 206 129 111 821999 34.44 216 113 112 741998 34.48 224 126 116 651997 34.87 209 140 114 611996 34.12 223 134 113 70
Source: Information Centre of the Ministry of Agricul-
ture and Forestry.

33
4–5% lower than the average in the EU. The average price for beef was 2.12 €/kg and that for bull meat was 2.50 €/kg. The price for bull and cow meat rose by 4% and that for heifer meat by 5%.
The EU beef market is quite sta-ble. The Commission has controlled the rise in producer prices and the re-sulting growth of imports by reduc-ing the use of export subsidies. Ac-cording to a forecast by the OECD, meat consumption and foreign trade in meat are going to increase on the world market, which may raise the
world market prices for beef, pork and poultry meat.
The producer price for meat of fatten-ing pigs was 1.30 €/kg and for all pigmeat 1.26 €/kg. The average price for pigmeat in Finland was about 10% below the EU av-erage. The purchase price of piglets (25 kg) varied between € 54 and 55. In Finland the producer price for pigmeat was exception-ally stable in 2005–2006. For example, the price for Grade E pigmeat varied between 1.35 and 1.40 €/kg.
The producer price for poultry meat decreased by 4–5% from 2005. The av-erage price was 1.15 €/kg. The producer price for broiler meat fell from 1.12 €/kg in January 2006 to 1.09 €/kg in December. The previous time when the price of broiler
was this low was in winter 1999/2000. The average producer price for turkey meat was 1.47 €/kg (–4%).
The average producer price for eggs in 2006 was 0.62 €/kg (+3%). In January–February the price paid for eggs coming from battery cage units was as low as 0.51 €/kg, which was 16–17% lower than the year before. The producer prices began to rise in the autumn and in December the price exceeded 0.70 €/kg. At times the sale price of packaging plants in Finland was as much as 0.2 €/kg be-low the EU average.
Producer prices of beef, pigmeat, poultry meat and eggs in Finland from 2002 to 2006. Source: Information Cen-tre of the MInistry of Agriculture and Forestry.
� � � � � �
� �� � � � � � �
� �
�
� �
�
�
� � � �
* � � ) � � �
* % � � � � � � ) � � �
+ � � �
Producer price of milk in Finland from 2002 to 2006. Source: Information Centre of the MInistry of Agricul-ture and Forestry.
� � � � � � � � � ��
� �
�
�
� �
�
$ � � � � � � ! ' � � � � % & � ' � � % ! � � � % � �
$ � � � � � � , ' � � � � % & � ' � � % ! � � � % � �
� �� � � � � � �
production aid. Adjustments according to the protein and fat content of milk paid the quality premium of about 2.26 €/l. The fi-nal price for milk will only be known when the dairies complete their financial state-ments and the retroactive payments based on the result are decided. In 2005 the aver-age retroactive payment was 2.22 €/100 l.
The seasonal variation of the producer price for milk is quite strong in Finland. In October 2006 the price paid to the produc-ers for milk with standard fat and protein content (norm milk) was 34.07 €/100 l, which was € 6.93 less than in May.
The average producer price for beef in Finland rose by 3% from 2005, but re-mained below the EU average. In the long term the beef prices in Finland have been

34
Welfare of production animals
Antti Miettinen and Kauko Koikkalainen
The welfare of production animals is founded on a sufficient supply of feed and water, good health, as well as appropriate production conditions and treatment of the animals. The animals must also be allowed to fulfil their species-specific behavioural needs.
Besides the ethical and biological considerations, the welfare of production animals involves significant economic aspects, because the measures relating to animal welfare also influence the profitability of the production and international competitiveness of the Finnish livestock sector. Measures that improve animal welfare usually increase the production costs, but better animal health and welfare may improve the yields and re-turns. The price paid for the product may also be higher, if the consumers are willing to pay for the improved welfare of the animals.
Current status of animal welfare in Finland
Measuring the welfare of production animals in a clear and unambiguous way is dif-ficult. Welfare can be assessed, for example, through the condition of the animals and keeping facilities along with the behaviour and productivity of the animals. The health of Finnish production animals as regards infectious animal diseases is very good, but there is room for improvement in preventing the production-related illnesses.
According to the environmental indicator for cattle farms developed by the advi-sory organisation ProAgria, the status of the keeping facilities and care of production animals was quite good on Finnish dairy and beef cattle farms in 2004. There was still work to be done to improve the management of the relative air humidity of the live-stock buildings, size and structure of the stalls and exposure of animals to draught.
The Member States of the European Union are obligated to enforce the compliance with the directives concerning the welfare of production animals through on-the-spot checks of farms. In 2005, shortcomings were found on 35% of the inspected calf farms, 25% of pig farms and 15% of chicken farms. In the rearing of calves, the shortcom-ings typically concerned too small group pens and availability of drinking water. On pig farms, the most common problem was the lack of stimulants (such as straw). The service pens of boars were too small and an automatic alarm system for air-condition-ing was lacking on some farms. In some cases the daily inspections of the automatic drinking equipment had been neglected. On chicken farms, the most usual shortcom-ing was the lack of equipment for smoothing the nails.
Improving animal welfare
Studies have show that the person caring for the animals is the most important individ-ual factor influencing animal welfare. The actions of the society also influence animal welfare in various ways. Animal welfare legislation ensures that the minimum require-ments for the keeping facilities, rearing conditions, care and treatment are met. The EU has issued directives concerning all production animals with separate directives for pigs, calves and laying hens. National provisions on animal welfare requirements are set down in the Animal Welfare Act and Decree and decisions and decrees of the Ministry

35
of Agriculture and Forestry. In addition to legislation on the keeping of animals, there are also statutes concerning the transportation and slaughtering of animals.
From the beginning of 2007, the animal protection requirements have been con-trolled as part of the cross-compliance conditions included in the agricultural support schemes. Cross-compliance conditions are based on the current legislation. Meeting the cross-compliance conditions is a criterion for the full payment of the single farm payments, natural handicap payments (LFA) and agri-environmental payments. In case of minor animal protection violations, the support may be reduced or partly re-covered. In severe cases, it is possible to pay no support at all or recover all of the sup-port paid.
Voluntary welfare programmes contribute to keeping of animals in accordance with the good production practice. National healthcare of production animals focuses on preventing diseases and improving productivity. The national animal healthcare stand-ard has been defined for five different production sectors. The work on the healthcare of production animals is coordinated in cooperation between the Association for Ani-mal Disease Prevention ETT and Finnish Food Safety Authority Evira.
Promoting the welfare of production animals was an additional agri-environmen-tal measure for livestock farms in the programming period 2000–2006. The keeping facilities and ventilation have been improved by means of financial support for the renovation of production buildings. Agricultural investment aid has been granted for investments in free range chicken houses and chicken houses with battery cages as well as replacing cages with activity cages.
Animal welfare payments
Promoting the welfare of production animals is becoming a voluntary development measure and one of the criteria for allocating EU support for agriculture as of 2008. At first, only cattle and pig farms may select the measure concerning the welfare of production animals. The commitments are made for five years. The animal welfare measure consists of the basic and additional conditions. The main goal of the basic conditions is to improve the health and, through this, the welfare of production ani-mals. They include, among other things, meeting the national healthcare requirements for production animals. Additional conditions include conditions that are common to all farms and species-specific conditions. They lay down more detailed requirements concerning the improvement of the pens and keeping conditions, grazing and exercise. Farms may select 0–2 additional conditions.
Animal welfare payments compensate the farmers for the net costs and income losses due to the welfare measure. When calculating the net costs and income losses, the benefits to the farmers’ private economy resulting from the measure are deducted from the costs and income losses due to actions that go beyond the statutory require-ments. The calculation principle is the same as in agri-environmental support. Farmers also receive compensation for the transaction costs of the measure. The support per livestock unit for the basic measures will probably be € 17.50 for bovines and € 5 for pigs. The maximum annual support per farm is € 5,000. It is difficult to size up the total funding needed for this new measure, but the amount to be allocated annually is estimated at over € 10 million.

36
Areas under horticultural production in 2000–2006, ha1.
2000 2001 2002 2003 2004 2005 2006
Production in the open, total 16,948 16,515 16,466 16,469 16,025 15,417 15,468
Vegetables grown in the open 9,107 8,797 8,918 8,983 8,837 8,254 8,327Berries 7,355 7,200 7,004 6,886 6,552 6,495 6,470Fruits 486 519 544 600 636 667 671
Greenhouse production, total 398 400 400 398 399 405 404
Vegetable production 234 236 237 236 239 245 243Ornamental plants 164 164 164 163 161 160 161
1The real horticulture area is a little larger, because some of the production is not included in support schemes.
Source: Ministry of Agriculture and Forestry, Support Register.
2.3. Horticultural production
In Finland horticultural production com-prises vegetable production in the open, cultivated berries and apples, nursery pro-duction and greenhouse production. In some context the production of mush-rooms and cultivation of potatoes under cover are also included in horticulture.
Area and number of enterprises
The total horticulture area was about the same in 2005 and 2006, about 15,470 ha. Of the horticulture sectors the area of vegetable production in the open grew slightly from the year before to about 8,330 ha.
The area under the cultivation of ber-ries has been decreasing in the past decade. In 2006 it fell by 25 ha from the year be-fore to about 6,470 ha. The decrease did not cause any significant reduction in the total yield, which stayed about the same as before thanks to more efficient produc-tion methods. In general, however, berry production is characterised by considerable annual variations in the yield, because the yield depends a great deal on the weather conditions.
The production area of fruits, mainly apples, has grown in recent years to about 670 ha in 2006. Greenhouse area has been
about the same in the past couple of years, about 404 ha. Of the greenhouse area about 243 ha was used for vegetable pro-duction and 161 ha for the production of ornamental plants.
According to the Horticultural Enter-prise Register, there were altogether 6,288 enterprises in the sector in 2005. Of these, 5,014 practised horticultural production in the open, i.e. vegetable, berry, fruit or nursery production, and 2,231 enterprises engaged in greenhouse production. Some of the enterprises engaged in both green-house production and production in the open.
Weather conditions
The growing season for production in the open started at the usual time and the weather was warm in the spring. How-ever, in the beginning of May the weath-er turned colder, and in some places the temperatures fell as low as –10oC. Frost caused less damage on berry and fruit plan-tations than was feared and the crop dam-ages remained small. The growing season of 2006 was exceptionally dry and warm, which lowered the yields in almost all hor-ticultural production sectors. Plants with deep roots, such as currants and apples, suffered the least from the drought, while salad crops suffered the most because, in

37
the warm weather ripened the berries very quickly. The quality of other berries was also good.
The amount of apples harvested in 2006 was about normal and the quality was good, even if the fruits ripened earlier than usually because of the warm weather.
Production in the open
According to the Horticultural Enterprise Register, based on the cultivation area (5,240 ha) the most common outdoor vegetables in Finland are garden pea, car-rot, onion and white cabbage, which alto-gether represented 62% of the total veg-etable production area in 2005. Between
2004 and 2005 the production area of leek, parsnip and gar-den pea fell the most, by about 15% each. Instead, the areas un-der turnip, spinach and broccoli grew by about 10%. 24% of the area used for outdoor vegetable production was covered by con-tracts with the processing indus-try, most of these for garden pea, carrot, beetroot and gherkin.
In the berry sector strawber-ry is by far the most significant product based on both the cul-tivation area and total yield. The share of strawberry of the area of berry plantations that yield a crop was 52% (3,100 ha) and the strawberry yield of 10 mill. kg ac-counted for 77% of the total out-put. The second most important berries cultivated in Finland are black and green currant (31% of the area of crop-yielding planta-tions) and the third is raspberry (7% of the area). Contracts with the processing industry cover about 18% of the berry produc-tion. Black and green currants are by far the most significant berries included in these contracts: these
Areas under the most important horticultural products grown in the open and yields in 2005.
Area Yield Totalha kg/ha 1,000 kg
Vegetables grown in the open
Garden pea 2,004 2,525 5,896Carrot 1,732 33,569 56,987Onion 925 23,149 23,602White cabbage 583 30,216 17,929Cauliflower 419 9,120 3,825Beetroot 417 33,636 14,009Swede 409 34,558 14,127Gherkin 321 35,180 11,289Chinese cabbage 307 18,132 5,559Other plants 1,285
Total 8,400 20,721 174,048– share of contract production 2,032 24,892 50,580
Berries and apples1
Strawberry 3,055 3,290 10,050Black and green currant 1,802 990 1,784Raspberries 418 1,454 608Other berries 578
Total 5,853 2,243 13,130– share of contract production 1,037 1,896 1,966
Apple 534 6,756 3,610
1Crop yielding area
Source: Information Centre of the Ministry of Agriculture and Forestry,
Register of Horticulture Enterprises 2005.
addition to the effect of drought and high temperatures, the windy weather increased evaporation and the already high need for irrigation. Low precipitation could be compensated for by irrigation quite well and significant drops in the yields were avoided. The quality of the crop was good or even excellent.
The early strawberry crop ripened, as expected, by the end of June and the har-vesting of the main crop started in early July. Like in the case of vegetables grown in the open the strawberry crop remained a little lower than before as the berries were small because of the drought, but the quality was good. The strawberry season of 2006 was short but intense, because

38
Producer prices for the most important horticultural products in 2000–2006, €/kg.
2000 2001 2002 2003 2004 2005 2006
Greenhouse production
Rose (€/unit) 0.32 0.32 0.32 0.36 0.40 0.41 0.41Tomato 0.99 1.18 1.12 1.15 1.16 1.15 1.17Cucumber 1.08 0.98 1.05 1.16 1.08 0.99 1.04
Production in the open
White cabbage 0.17 0.21 0.32 0.38 0.33 0.27 0.37Onion 0.42 0.41 0.52 0.50 0.47 0.33 0.44Carrot 0.41 0.48 0.39 0.47 0.45 0.37 0.40Strawberry 2.01 1.66 2.33 3.52 3.05 2.68 2.25
Sources: Finnish Association of Fruit and Berry Growers, Kasvistieto Ltd., Glasshouse Growers Association.
Areas under greenhouse vegetables (m2) and yields (kg/m2) in 2005.
Area Yield Total1,000 m2 kg/m2 1,000 kg
Total1 2,620 28 74,236
Tomato 1,178 32 37,996Cucumber 779 42 32,371Other vegetables 660
1Does not include potted vegetables.
Source: Information Centre of the Ministry of Agricul-
ture and Forestry, Register of Horticulture Enterprises
2005.
account for almost 70% of the area covered by the contracts.
The most important fruit cultivated in Finland is apple. Apples were cultivated on about 646 ha, which represented 96% of the cultivation area of fruits. In 2005 the area of nurseries was 628 ha.
Greenhouse production
Of the greenhouse area 60% is used for vegetable production and 40% for the pro-duction of ornamental plants. The most important greenhouse vegetables are to-mato and cucumber, which represent 75% of the total cultivation area of greenhouse vegetables (potted vegetables are not in-cluded). In 2005 the production area of to-mato was about the same as the year before, about 118 ha. The cucumber area has also stayed about the same in the past few years, and in 2004–2005 it grew by 2 ha to 78 ha. In 2005 supplementary lighting was used on about 22 ha of the tomato area and 21 ha of the cucumber area. Tomato was cul-tivated in 664 enterprises and greenhouse cucumber in 466 enterprises.
In 2005 the production area of potted vegetables was 201 ha. The most impor-tant plant is lettuce, which represents 79% of the area. In 2005 altogether 90 enter-prises produced a total of 64 mill. potted vegetables.
In 2005 there were 856 enterprises which produced ornamental plants on a to-tal area of 171 ha. The production of orna-mental plants comprises cut flowers, bulb flowers, potted plants and bedding plants. The cultivation area has stayed about the same in recent years. Cut flowers repre-sent 22% of the cultivation area. The most significant cut flower is rose, but its pro-duction area has been falling steadily since 1990 to 28 ha in 2005. Measured by the number of plants the production of bulb flowers increased by 10% in 2004–2005. Tulip is by far the most significant bulb flower grown in Finland.
In 2005 almost 12 mill. flowering pot-ted plants were produced. The most pop-ular flowering potted plants are poinsettia,

39
begonia elatior hybrids and kalanchoe. The production of bedding plants to-talled over 45 mill. and the most com-mon plants are violet (28%), petunia (12%) and lobelia (10%).
Horticultural product market
Strong variations are characteristic to the producer prices of horticultural products. Usually the producer price is low during the main crop season, when the domestic supply is high. The supply decreases during the stor-age period, which raises the producer prices. It should be kept in mind that the annual prices for vegetables grown in the open include output from two different years: the crop of 2005 was still being sold from the stocks in the early part of 2006 and the growing season of 2006 did not in-fluence the prices until the summer.
The prices of greenhouse vegetables vary by the season in the same way as those of vegetables grown in the open. Even if today domestic greenhouse vegetables are present on the market round the year, the supply is much smaller in the winter. Be-sides the small supply, the more demand-ing production technology during the win-ter raises the production costs, which in turn leads to higher prices compared to the summer season.
Producer prices for greenhouse cucumbers and to-matoes from 2004 to 2006, €/kg. Source: Kasvistie-to Ltd.
� �
� �
� � �
� �
� � �
�
� �
- � ' � ) . � �
/ % ) � � %
� � � �
� � � � � �
Producer prices for certain vegetables grown in the open from 2004 to 2006, €/kg. Source: Kasvistieto Ltd.
� � � �
� � � �
- � � � % �
� ! � % !
- � . . � � �
� �
� �
� �
� �
� �
� �
� � �
� � �
In 2006 the market situation of hor-ticultural products was quite good and major congestions were avoided. Because of the good crop year in 2005 there was a lot of that year’s crop in the stocks in 2006, which is why the prices for onions and white cabbage in the early part of the year were much lower than in the two per-vious years.
Drought in the growing season of 2006 reduced the yields of vegetables grown in the open. The decrease in their supply was reflected in the prices of the crop of 2006, which were higher than the year before. This is reflected in the price statistics after June, when last year’s crop was no long-er present on the market. One reason for the great demand for horticultural prod-
ucts was the poor crop also in home gardens because of the drought and insufficient irrigation.
The reduction in the yields of pro-duction in the open was also reflected in the demand for greenhouse veg-etables. The consumers used green-house vegetables more than usually because of the occasional small sup-ply of outdoor vegetables. This is why the demand for greenhouse vegeta-bles stayed high all through the sum-mer and the price during the summer season was also higher than in the pre-vious year.

40
Constructing corporate social responsibility in the food production chain – from words to action
Juha-Matti Katajajuuri and Sari Forsman-Hugg
The possibilities of consumers to make food choices based on their own values from the perspective of corporate social responsibility (CSR) are quite limited, because suitable information for this is not available. This means that the food chain is not as transparent as it is often assumed to be. Some consumers and citizens would like to have access to information on all parts and stages of the food production chain, not only on the quality and price of the final product. They would like to know about the origin of the raw material, animal welfare, and working conditions of farmers and staff of food companies. Some reflect on how fair and just the distribution of income in the food chain is, while others are concerned about pollution and the environment. Information on the different aspects of CSR is also important for the administration for the planning and design of appropriate policy instruments.
Responsible food production means that the whole production chain takes account of the impacts of its actions on the society. Widely accepted approach to CSR is based on the traditional triple bottom line with three dimensions: economic, social and environmental responsibility. CSR implies a wider perspective than the view that com-panies act in compliance with the legal norms and produce safe food that meets the basic quality criteria. Reinforcing responsible practices is also one of the two priority areas in the National Quality Strategy for the Finnish Food Sector.
For most large companies the publication of an annual CSR report has become a routine. One slight problem in those reports is that they tend to bring out, quite selec-tively, the positive aspects concerning the company. CSR is, however, also concerned with managing the unwanted impacts. The CSR reports do not tell how responsibility is constructed in the everyday operations of the company – not to say anything about the chain perspective. This means that based on the CSR reports it is impossible to assess the responsibility of the entire production chain. The GRI (Global Report-ing Initiative) has become a commonly accepted approach to the reporting of CSR. According to this, the CSR reports must address must address all the stages of the pro-duction process that have relevance to the CSR.
Constructing a commensurate set of concepts for responsibility is a challenging task, because CSR is not an absolute concept, but it is similar to, for example, the concept of sustainable development. The objectives and perspectives regarding these evolve and change over time. Constructing the content of CSR in the food chain is particularly difficult because the actors in the chain, including consumers, have no uniform perception of what CSR means. CSR in the food chain is a multidimensional issue, which often involves conflicting values especially between the economic respon-sibility and other aspects of responsibility.
CSR as competitive advantage?
Even if the responsibility of companies is often criticised to be a matter of high-sound-ing phrases rather than concrete action, in many companies responsibility aspects have already been integrated into the strategic management. Certain pioneer companies in

41
the food chain are also considering the possibility of providing product-specific infor-mation on the CRS issues. In Finnish food companies there is unutilised potential in taking advantage of CSR as a strategic competition factor. In an ideal situation the companies are capable of responding to the CSR questions of consumers through their products and actions. This may turn into a competitive advantage when respon-sible actions are turned into product-specific information and products are labelled in a way that is reflected in purchasing decisions.
The companies have not as yet fully internalised the view that financially profitable business activity does not exclude the allocation of resources to the development of social and environmental responsibility. Economic responsibility sets the foundation for everything else: companies must see to their profitability and growth because, if this is not in order, they will not be able to bear their social responsibility, either. Re-sponsible action does not exclude an opportunistic way of doing business. For exam-ple, news about lay-offs sound very unpleasant. However, improving the efficiency of the operations guarantee the continuity of business, which otherwise might be at risk. From the perspective of CSR it may be more important how open and transparent the communication about lay-offs is and how the people who have lost their jobs are taken care of.
Cooperation between research and companies in constructing responsibility
The research institutes have also accepted the challenge of developing product-specific information on CSR issues in the food chain. The MTT Agrifood Research Finland and National Consumer Research Centre, together with the companies, have launched a three-year research project1 on what responsibility means, how it can be measured, and to what extent responsibility can be linked all the way to the product level. This research project represents a new kind of approach to constructing the content of responsibility, where the content is constructed and concretised through the supply chains of three products: rye bread, broiler meat products and margarine.
Traditional research must give way when the content of responsibility is constructed in cooperation and through interaction between research and companies. The research project combines, among other things, the compilation of extensive data, action re-search and stakeholder workshops. The researchers follow, observe and interview the representatives of the company chains and collect detailed data on the operation prin-ciples and activities of the production chains. Based on the background information for workshop participants the consumers and other stakeholders assess – in interac-tion with the companies – which elements are important as regards CSR and how responsible the actions of the food chain and its companies are. Through this the project approaches the challenge of measuring CSR.
The project offers the actors in the food chain, consumers and other stakeholders a unique opportunity to organise and promote consumer and stakeholder-oriented dis-cussion on CSR in the food sector. The equation of developing product-specific infor-mation on CSR in the food chain is challenging, but the researchers consider it by no means impossible. At the moment the MTT Agrifood Research Finland is in charge of the launch the first environmental responsibility report of the whole food sector.
1Enhancing corporate social responsibility in the Finnish food chain with a stakeholder dialogue
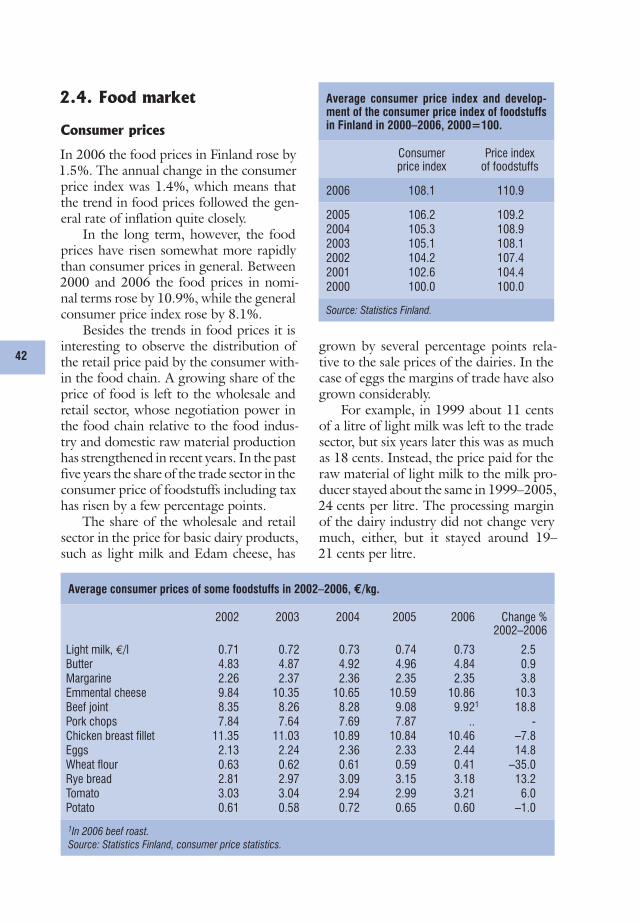
42
Average consumer price index and develop-ment of the consumer price index of foodstuffs in Finland in 2000–2006, 2000=100.
Consumerprice index
Price indexof foodstuffs
2006 108.1 110.9
2005 106.2 109.22004 105.3 108.92003 105.1 108.12002 104.2 107.42001 102.6 104.42000 100.0 100.0
Source: Statistics Finland.
Average consumer prices of some foodstuffs in 2002–2006, €/kg.
2002 2003 2004 2005 2006 Change % 2002–2006
Light milk, €/l 0.71 0.72 0.73 0.74 0.73 2.5Butter 4.83 4.87 4.92 4.96 4.84 0.9Margarine 2.26 2.37 2.36 2.35 2.35 3.8Emmental cheese 9.84 10.35 10.65 10.59 10.86 10.3Beef joint 8.35 8.26 8.28 9.08 9.921 18.8Pork chops 7.84 7.64 7.69 7.87 .. -Chicken breast fillet 11.35 11.03 10.89 10.84 10.46 –7.8Eggs 2.13 2.24 2.36 2.33 2.44 14.8Wheat flour 0.63 0.62 0.61 0.59 0.41 –35.0Rye bread 2.81 2.97 3.09 3.15 3.18 13.2Tomato 3.03 3.04 2.94 2.99 3.21 6.0Potato 0.61 0.58 0.72 0.65 0.60 –1.0
1In 2006 beef roast.
Source: Statistics Finland, consumer price statistics.
2.4. Food market
Consumer prices
In 2006 the food prices in Finland rose by 1.5%. The annual change in the consumer price index was 1.4%, which means that the trend in food prices followed the gen-eral rate of inflation quite closely.
In the long term, however, the food prices have risen somewhat more rapidly than consumer prices in general. Between 2000 and 2006 the food prices in nomi-nal terms rose by 10.9%, while the general consumer price index rose by 8.1%.
Besides the trends in food prices it is interesting to observe the distribution of the retail price paid by the consumer with-in the food chain. A growing share of the price of food is left to the wholesale and retail sector, whose negotiation power in the food chain relative to the food indus-try and domestic raw material production has strengthened in recent years. In the past five years the share of the trade sector in the consumer price of foodstuffs including tax has risen by a few percentage points.
The share of the wholesale and retail sector in the price for basic dairy products, such as light milk and Edam cheese, has
grown by several percentage points rela-tive to the sale prices of the dairies. In the case of eggs the margins of trade have also grown considerably.
For example, in 1999 about 11 cents of a litre of light milk was left to the trade sector, but six years later this was as much as 18 cents. Instead, the price paid for the raw material of light milk to the milk pro-ducer stayed about the same in 1999–2005, 24 cents per litre. The processing margin of the dairy industry did not change very much, either, but it stayed around 19–21 cents per litre.

43
Consumption of milk products, margarine, meat and eggs per capita in 1996–2006, kg.
Liquid milk1
Butter Marga rine Cheese Ice-cream(litres)
Beef2 Pigmeat2 Poultry meat
Eggs3
2006e 181.0 2.7 .. 19.1 13.6 18.5 34.3 15.8 9.4
2005 184.8 2.7 6.6 18.6 14.0 18.6 33.5 16.1 9.42004 186.2 2.6 6.6 18.4 13.2 18.6 33.8 16.0 9.42003 185.1 2.4 6.8 16.7 13.7 18.0 33.5 15.8 9.32002 190.0 3.0 7.6 16.6 13.5 17.9 31.9 15.4 9.72001 191.7 3.5 7.8 16.5 13.3 17.9 32.7 14.5 9.72000 193.9 3.8 7.7 16.5 13.5 19.0 33.0 13.2 10.11999 195.8 3.9 8.1 16.6 13.9 18.8 34.3 12.6 10.01998 198.5 4.3 8.4 15.9 13.2 19.2 34.1 11.9 10.31997 199.4 4.5 8.5 14.8 13.8 19.3 32.2 10.7 10.41996 203.8 4.9 8.6 14.8 13.4 19.1 32.9 9.9 11.0
1 Including liquid milk, sour milk products and cream.2 Hot weight reduction of 2% has been made in slaughter weights from July 1995.3 Method of statistical compilation changed from January 2001. Sources: Gallup Food and Farm Facts, Information Centre of the Ministry of Agriculture and Forestry.
Composition of the consumer price of light milk and rye bread in 2005.
Agriculturalproducer(0.24 €/l)
Industry(0.21 €/l)
Trade(0.18 €/l)
Value added tax(0.11 €/l)
32.5%
28.6%
14.5%
24.4%
Light milk, (0.74 €/l)
Agricultural producer(0.13 €/kg)
Milling, bakery and logistics(1.58 €/kg)
Trade(0.98 €/kg)
Value added tax(0.46 €/kg) 4.1%
50.2%
14.5%
31.1%
Rye bread, (3.15 €/kg)
Rising retail margins and a declining share for the farmer have come during a period of considerable change in the struc-ture of both the retail and wholesale sec-tors. The concentration of the retail sector, with fewer outlets and the growth of the large supermarket chains, has been partic-ularly rapid in Finland. The two leading retail chains of food and daily goods in-creased their market share from 55 per cent in 1990 to more than 73 per cent by 2006. The increased concentration of retail pow-er means that large retail outlets now exert
significantly more control over others in the food supply chain.
The Finnish food sector is not alone in witnessing a growth in retail margins. This phenomenon appears to be happening across other EU markets where falling farm gate prices don’t always lead to the fall in retail prices, which increases retail margins. This reflects the increased market power of the retail sector, although some other factors, including more value-added at the retail level, including better service and a greater variety, play a certain role as well.

44
Structural changes in retail trade
The sales of groceries and daily con-sumer goods have grown steadily in recent years. In 2006 they totalled € 12,404 mill., which is 4.2% higher than the year before. The sales volume grew by 3.0% and the prices increased by 1.2%. Between 1995 and 2006 the sales of groceries and daily consumer goods at nominal prices have risen by almost 40%.
Sales prices actually declined in 2004–2005, which reflects the tightening competition in the retail sector. Because of the harsh price competition the domestic companies in the trade sector have been forced into various kinds of structural re-arrangements to maintain their profitabil-ity. Better efficiency and cost savings have been achieved through more disciplined chain businesses.
The share of large companies in the sales of groceries and daily consumer goods is growing year by year. The concentration of the sales is reflected both in the number of retail stores and in the market shares of the leading chains. The number of small shops and village stores in the rural and sparsely populated areas has fallen to a half since Finland joined the EU in 1995.
In 1995 the number of small retail stores was still almost 2,300, but only
Value of retail sales in Finland. Source: AC Nielsen.
� � � � � � � � � � � � � �
�
�
�
�
�
� �
� �
� � . � � � � % !
Market shares of retail companies in 2000–2006.
2000 2001 2002 2003 2004 2005 2006
S Group 28.9 30.5 31.1 31.1 34.3 35.9 39.9K Group 37.6 36.5 36.0 35.8 35.3 33.9 33.4Tradeka/Elanto 12.4 12.6 12.9 12.7 10.0 10.8 11.9Spar1 9.1 8.7 8.1 7.4 6.8 6.2 0.5Other 12.0 11.7 11.9 13.0 13.6 13.2 14.3Total 100 100 100 100 100 100 100
1M group since 2006.
Source: AC Nielsen.
1,100 of these survived until 2005 and their share in the sales had decreased from 11% to 6%. During the same period the share of hypermarkets in the sales grew from 15% to 24% and the share of large supermar-kets from 20% to as high as 32%. In the beginning of 2007 the total number of re-tail outlets was 3,942 and 56% of the sales took place in the 649 largest stores (hyper-markets and big supermarkets).
In recent years significant reorgani-sations have taken place among the larg-est chains. Now there are two main play-ers competing on the Finnish market. The market share of the S Group has increased rapidly and by the merger of HOK-Elanto it reached the K Group in 2004 and over-took it in 2005.
The share of the K Group has been diminishing in the past few years but the share of the third largest chain Tradeka has
turned to an increase lately. In autumn 2006 the K Group announced that the decrease in the market share had stopped and sales had started to grow towards the end of the year.
The share of Spar diminished to a fraction. The combined share of the other companies has increased by 1 percentage point. The share of the German discount giant Lidl, which has spread rapidly on the Finnish market, continued to grow slightly in 2006 amounting to 4.1%. Its share was estimated at 1.8% in 2003 and 3.7% in 2005.

45
Key figures on the Finnish food industry in 1995–2005.
1995 1996 1997 1998 1999 2000 2001 2002 2003 2004 2005
Turnover (at current price, bill. €) 7.7 7.8 8.0 7.8 7.5 7.9 8.3 8.4 8.5 8.9 8.9Turnover (at 2003 price, bill. €) 8.8 8.8 9.0 8.6 8.2 8.4 8.5 8.5 8.5 8.9 8.8Personnel (thousands) 44.9 44.6 44.2 42.8 40.7 39.9 38.6 38.0 38.2 37.5 36.7Real turnover per person (thousand €) 172 175 182 183 184 198 214 220 222 237 242
Source: Statistics Finland, Finnish Enterprises 1995–2005.
Turnover per person in the food industries. Sources: Statistics Finland, Finnish enterprises 1995–2005.
*1997 instead of 1995.
� � � � � 0
� �
� �
� �
* � � ' � ! � � � % � � ' � � ! � �
� � % ) � � � � � % � � �
� � � � 1
� � � � 1
� � � 1
� � � � � 1
� � 0 � � 1
� � � 0 1
� � 1
� � � � 1
� � � 1
� � � � 1
� � � 1
� � � � 1
� � � 1
� � � 1
� � � � 1
� � � � � � � � ! % ( � � � � � � � � � % ! � 2 � � % � � � ! & � � 3
$ � � � � � % ' � � � � ! � � � ! & � � � � � � � � � �
4 � � � � � % ' � � � � ! �
4 � � � � � � ! & � ( � � � � � . � � � � % ' � � � � ! �
$ � ! � � � ' � � � � � % � � � � ! � � � ! & � � ! � ) � � � % � � � � ! & � � � �
$ � ! � � � ' � � � � � % � � & � � � � � � % & � ' � � � � ! & � � ' � 5 ' � � � )
$ � ! � � � ' � � � � � % � � ) � � � � ! � � � % & � ' � �
$ � ! � � � ' � � � � � % � � � � � � ' �
$ � ! � � � ' � � � � � % � � � ! � ) � � � � � � &
$ � ! � � � ' � � � � � % � � � % � � � . � � � &
� � � � � � ) � ! � � � ' � � � � 6
$ � ! � � � ' � � � � � % � � ' % ' % � � � ' � % ' % � � � � � � ! & � � " � � � �
� � � � � � � % % & � ) � ! � � � ' � � � �
$ � ! � � � ' � � � � � % � � & � � � � � � � & � � � ' % � % � � ' � . � ( � � � � � � 6
� � � � � ) � ! � � � ' � � � �
$ � ! � � � ' � � � � � % � � ) � ! � � � � � " � � � � �
One major event in the Finnish re-tail business was the gradual disappear-ance of the Spar shops taken over by the S Group from Finnish towns and villages. The acquisition raised the market share of S Group by 2 percentage points in 2006. The remaining independent Spar shops established a group of their own, the M Group, which has sought additional part-ners among the other retail chains. Their market share was 0.5% in 2006.
Food industry
Structural changes in the retail sector create serious challenges to the domestic food in-dustry. It is becoming more and more dif-ficult to maintain the negotiating power
against the concentrating retail chains. In their efforts to improve the logistics the re-tail chains purchase a growing share of the foodstuffs from large processors, but the structural changes in the wholesale and re-tail sector are also putting large food com-panies to a serious test.
The progress of both private labels and the discount chain concept are push-ing down the food prices. Competitive ten-dering to produce private label products, threat of imports, and the low price level and narrow product range of the discount stores tighten the competition between the domestic suppliers and reduce the mar-gins of production. The processors have responded to the challenges by improv-ing the efficiency and outsourcing certain

46
Structural change among sub-sectors of Finnish food industry.
2005
Meat 25.7%
Fish 1.3%Fruit-vegetable 5.3%
Dairy 23.2%Milling 2.5%Feedingstuffs 5.5%
Bakery 10.9%
Sugar 3.1%Confectionary 3.8%
Other 4.7%Alcoholic drinks 3.1%
Brewery 8.4% Tobacco 0.2%
Vegetableoil 2.3%
Turnover of Finnish meat and dairy industry and certain other sub-sectors of food industry at 2003 prices.
2004
Meat 25.2%
Fish 1.3%Fruit-vegetable 5.5%
Dairy 22.7%Milling 2.6%Feedingstuffs 5.6%
Bakery 10.9%
Sugar 3.4%Confectionary 3.7%
Other 4.6%Alcoholic drinks 3.0%
Brewery 8.7% Tobacco 0.7%
Vegetable oil 2.2%
$ � � � � ! �
� � � � � �
� � � " � ! � � � ) � � � � ! �� ! & � ) � ! � � � � � " � � � �
4 � � & � ! � � � � � � �
� � � � � � 0 � �
� � ) � � � � % ! �
� �
�
�
�
�
�
� �
� � �
� �
� � �
�
� � ) � � � � % ! �
� � � � � � 0 � �
� � � � �
$ � � �
production stages as well as through spe-cialisation.
In 2005 the turnover of the food indus-try fell by almost € 15 million to € 8.9 bill. At fixed prices the turnover of the sector decreased by 0.8% from the previous year. The turnover still exceeded the level of 1995 and was almost as high as in 1997, the best year during the early part of the EU membership, which was a highly suc-cessful time for Finnish exports. However, the growth trend seems to have stopped after 2004.
The decline in 2005 was due to the slight decrease in the domestic sales. The share of exports in the turnover was still almost 11% in 2005, which is 0.6 per-centage point higher than the year before. The export share remains clearly behind
the record reached in 1997, when almost 13% of the turnover came from the export market.
Employment in the food industry continued its downward trend. In 2005 the staff decreased by 850 employees, i.e. 2.3%. As a result of this and the increased sales revenues, there was some improve-ment in the turnover per person, which rose by 2% to € 242,000 in 2005.
There were certain differences in the development of the turnover per person between sub-sectors. However, compared to 1995 the figures for 2005 showed that there had been growth in all sub-sectors ex-cept in starch manufacture. The reason for this is the exit of the largest starch producer with the highest productivity of labour.

47
There was some growth in the larg-est sectors of food industry between 2004 and 2005. The turnover of meat industry in real terms rose by 0.6% and that of dairy industry by 0.9%. In the other sectors, i.e. bakery, milling and feed industry, process-ing of fruits and vegetables, and brewer-ies and production non-alcoholic beverag-es, the turnover in real terms decreased by 2–4%. The turnover of sugar industry fell by as much as 12%.
Because of the above structural chang-es, the meat and dairy industries strength-ened their position in Finnish food indus-try. In 2005 meat industry accounted for 25.7% and dairy industry for 23.2% of the total turnover of food industry. Both sub-sectors managed to increase its share by 0.5 percentage point from the year before.
The year 2006 saw several major events in the meat and dairy industry. The two largest meat companies, Atria and HK Ruokatalo, reinforced their international operations. Towards the end of 2006 they competed for the ownership of the largest meat company in Sweden, Swedish Meats. The sale of Swedish Meats to HK Ruokata-lo was finalised in January 2007.
In the dairy sector the biggest event of the year was the entry of the largest Euro-pean dairy company, the Danish-Swedish Arla Foods, on the Finnish market. In No-vember 2006 Arla bought the second largest Finnish dairy company Ing-man Foods. Ingman supplies about a quarter of the packaged milk and yoghurt and about one-tenth of the cheeses in Finland. The Finnish com-pany will be transferred to foreign ownership in three years.
The mergers of food companies in the Nordic countries reflect the desire of the companies to reinforce their market position in the Baltic Sea region before the arrival of the large European manufactures on these mar-kets. The reorganisations do not con-cern only the meat and dairy sectors,
Exports and imports of agricultural products (CN 01–24) in 1992–2006, € million. Source: National Board of Customs.
�
� � �
� �
� � �
� �
�
� ) � � � � % !
� � � � � � � � �� � � �� �
+ , % � �
7 ) % � �
but similar operations have already been carried out in the Nordic brewery, confec-tionary and bakery industries.
Foreign trade
In 2006 Finnish food exports hit an all-time record. The value of food exports to-talled € 1,104 mill., which is as much as 14% higher than the year before. The val-ue of food imports to Finland was € 2,810 mill., which was 8% more than in the pre-vious year.
This means that, despite the record-high exports, the deficit in the food trade balance grew by over € 60 mill. from € 1,643 mill. to € 1,706 mill. Tradition-ally the deficit has been due to the exten-sive import of fruits, vegetables, raw cof-fee, alcoholic beverages and tobacco. Other significant import articles are cheeses and cereal products.
Most of the food imports to Finland come from the old EU Member States, mainly from Germany, Sweden and the Netherlands. In 2003–2006 the share of non-EU countries decreased from 25.7% to 24.6%.
Import from the new Member States which entered the Union in 2004 (EU-10) has been growing steadily, but this has not led to any dramatic changes in the total
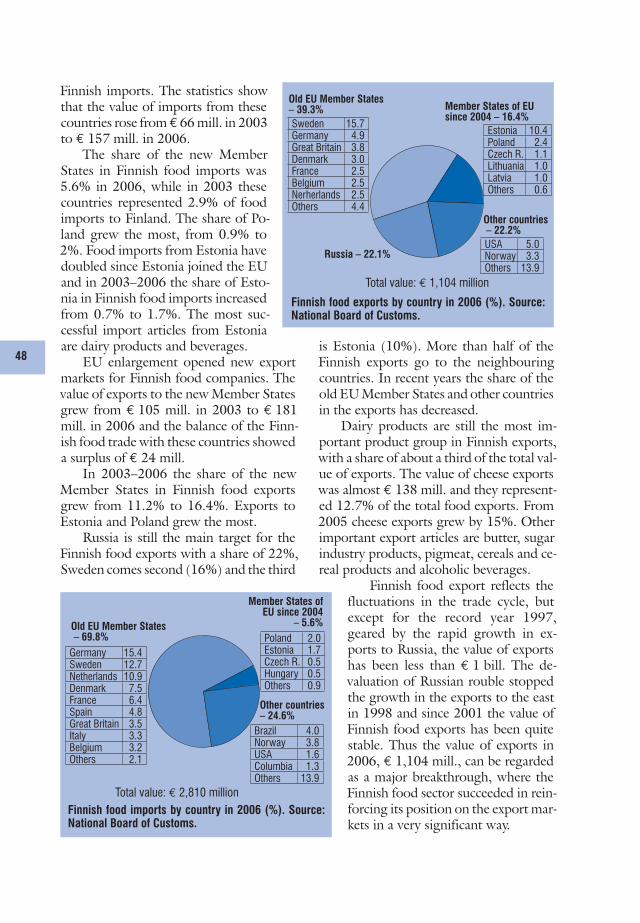
48
Finnish imports. The statistics show that the value of imports from these countries rose from € 66 mill. in 2003 to € 157 mill. in 2006.
The share of the new Member States in Finnish food imports was 5.6% in 2006, while in 2003 these countries represented 2.9% of food imports to Finland. The share of Po-land grew the most, from 0.9% to 2%. Food imports from Estonia have doubled since Estonia joined the EU and in 2003–2006 the share of Esto-nia in Finnish food imports increased from 0.7% to 1.7%. The most suc-cessful import articles from Estonia are dairy products and beverages.
EU enlargement opened new export markets for Finnish food companies. The value of exports to the new Member States grew from € 105 mill. in 2003 to € 181 mill. in 2006 and the balance of the Finn-ish food trade with these countries showed a surplus of € 24 mill.
In 2003–2006 the share of the new Member States in Finnish food exports grew from 11.2% to 16.4%. Exports to Estonia and Poland grew the most.
Russia is still the main target for the Finnish food exports with a share of 22%, Sweden comes second (16%) and the third
is Estonia (10%). More than half of the Finnish exports go to the neighbouring countries. In recent years the share of the old EU Member States and other countries in the exports has decreased.
Dairy products are still the most im-portant product group in Finnish exports, with a share of about a third of the total val-ue of exports. The value of cheese exports was almost € 138 mill. and they represent-ed 12.7% of the total food exports. From 2005 cheese exports grew by 15%. Other important export articles are butter, sugar industry products, pigmeat, cereals and ce-real products and alcoholic beverages.
Finnish food export reflects the fluctuations in the trade cycle, but except for the record year 1997, geared by the rapid growth in ex-ports to Russia, the value of exports has been less than € 1 bill. The de-valuation of Russian rouble stopped the growth in the exports to the east in 1998 and since 2001 the value of Finnish food exports has been quite stable. Thus the value of exports in 2006, € 1,104 mill., can be regarded as a major breakthrough, where the Finnish food sector succeeded in rein-forcing its position on the export mar-kets in a very significant way.
Russia – 22.1%
Finnish food exports by country in 2006 (%). Source: National Board of Customs.
Sweden 15.7Germany 4.9Great Britain 3.8Denmark 3.0France 2.5Belgium 2.5Nerherlands 2.5Others 4.4
Old EU Member States– 39.3%
Estonia 10.4Poland 2.4Czech R. 1.1Lithuania 1.0Latvia 1.0Others 0.6
Member States of EU since 2004 – 16.4%
USA 5.0Norway 3.3Others 13.9
Other countries – 22.2%
Total value: € 1,104 million
Finnish food imports by country in 2006 (%). Source: National Board of Customs.
Total value: € 2,810 million
Germany 15.4Sweden 12.7Netherlands 10.9Denmark 7.5France 6.4Spain 4.8Great Britain 3.5Italy 3.3Belgium 3.2Others 2.1
Old EU Member States – 69.8%
Brazil 4.0Norway 3.8USA 1.6Columbia 1.3Others 13.9
Other countries– 24.6%
Poland 2.0Estonia 1.7Czech R. 0.5Hungary 0.5Others 0.9
Member States of EU since 2004
– 5.6%

49
Finnish agricultural policy has been under constant change for years. Especially the common agricultural policy of the EU has changed quite dramatically in recent years. The new single payment scheme of the EU (SPS), which comprises most of the pay-ment to agriculture financed by the EU, was introduced in Finland in 2006.
The year 2007 should not bring along a similar overhaul of the payments as the introduction of the SPS. However, the con-tent of the agri-environmental support will be revised and there will be some changes in the national aid as well. The range of agricultural support measures will be com-plemented by payments relating to animal welfare and non-production investments.
3.1. Common agricultural
policy of the EU
The EU markets of agricultural products are steered by administrative means in the same way as in most other industrialised countries. Common policy is implement-ed through common organisations of the markets for specific products. The ba-sic idea is that the fall of the prices within the EU below a certain level is prevented by means of public inter-vention, while the prices of imported foodstuffs are raised to the EU level through import duties. Exports are subsidised by export refunds.
As a result of the policy reforms of 1992, 1999 and 2003, the inter-vention prices of cereals, beef and milk in the EU were lowered closer to the world market prices. The price reductions have been compensated for by means of direct payments, which is why support based on the area or number of animals (headage and area related payments) have gained a cen-tral position in the product-specific price and market organisations.
3. AGRICULTURAL POLICY
� � � � � � � � � � � � � � � �
� � � � � � � � � � � � � �
� � � � � � � � � �
� � � � � � � � � � � � � �
� � � � � � � � � � � � � �
� � � � �
� � � � � � � � � � � � �
� � � �
� � � � � ! � " � � # � $ � � � $ ! � ! � " � � #
� � � � % %
The price system of the EU.
The EU markets are also regulated by means of production quotas and payment entitlements. The Finnish quotas and en-titlements have been defined in the Acces-sion Treaty.
Agricultural policy reform
As a result of the reform of the common ag-ricultural policy agreed in June 2003 most of the payments for arable crops and live-stock have been decoupled from the pro-duction and a new single payment scheme (SPS) has been set up in the Member States. Most of the payments financed by the EU alone are now included in the SPS, and new conditions relating to the environ-ment, maintaining the productivity of the land, food safety, animal welfare and occu-pational safety have been incorporated into the scheme (cross-compliance).
The reform includes so-called modula-tion, in which a gradually increasing share of the CAP support is transferred to rural development measures through the EU budget. Modulation does not apply to the
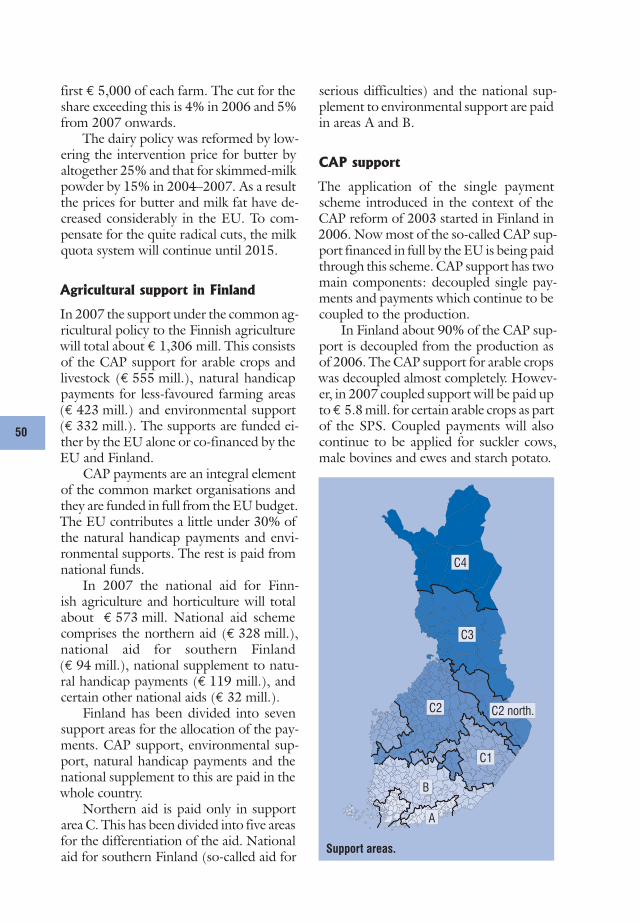
50
Support areas.
& ' � � � � � (
& )
& *
& '
& +
,
!
first € 5,000 of each farm. The cut for the share exceeding this is 4% in 2006 and 5% from 2007 onwards.
The dairy policy was reformed by low-ering the intervention price for butter by altogether 25% and that for skimmed-milk powder by 15% in 2004–2007. As a result the prices for butter and milk fat have de-creased considerably in the EU. To com-pensate for the quite radical cuts, the milk quota system will continue until 2015.
Agricultural support in Finland
In 2007 the support under the common ag-ricultural policy to the Finnish agriculture will total about € 1,306 mill. This consists of the CAP support for arable crops and livestock (€ 555 mill.), natural handicap payments for less-favoured farming areas (€ 423 mill.) and environmental support (€ 332 mill.). The supports are funded ei-ther by the EU alone or co-financed by the EU and Finland.
CAP payments are an integral element of the common market organisations and they are funded in full from the EU budget. The EU contributes a little under 30% of the natural handicap payments and envi-ronmental supports. The rest is paid from national funds.
In 2007 the national aid for Finn-ish agriculture and horticulture will total about € 573 mill. National aid scheme comprises the northern aid (€ 328 mill.), national aid for southern Finland (€ 94 mill.), national supplement to natu-ral handicap payments (€ 119 mill.), and certain other national aids (€ 32 mill.).
Finland has been divided into seven support areas for the allocation of the pay-ments. CAP support, environmental sup-port, natural handicap payments and the national supplement to this are paid in the whole country.
Northern aid is paid only in support area C. This has been divided into five areas for the differentiation of the aid. National aid for southern Finland (so-called aid for
serious difficulties) and the national sup-plement to environmental support are paid in areas A and B.
CAP support
The application of the single payment scheme introduced in the context of the CAP reform of 2003 started in Finland in 2006. Now most of the so-called CAP sup-port financed in full by the EU is being paid through this scheme. CAP support has two main components: decoupled single pay-ments and payments which continue to be coupled to the production.
In Finland about 90% of the CAP sup-port is decoupled from the production as of 2006. The CAP support for arable crops was decoupled almost completely. Howev-er, in 2007 coupled support will be paid up to € 5.8 mill. for certain arable crops as part of the SPS. Coupled payments will also continue to be applied for suckler cows, male bovines and ewes and starch potato.

51
Agricultural support based on the CAP in Finland (financed in full and part-financed by the EU), € mil-lion.
2002 2003 2004 2005prelim. 2006prelim. 2007e
Total 1,148 1,167 1,223 1,229 1,255 1,310
CAP income support 443 456 502 515 541 555Support for arable crops 345 345 362 351Other area-based support 10 10 10 10CAP support for animals 88 101 130 154
Compensatory allowances 422 422 424 421 420 423EU contribution 129 132 133 132 131 118National financing 293 290 291 289 289 305
Environmental support 283 289 297 293 294 332EU contribution 153 162 158 144 102 93National financing 130 127 139 149 192 239
EU financing, total 725 750 793 791 774 766National financing, total 423 417 430 438 481 544
According to the cross-compliance conditions included in the CAP support, the arable lands must be kept in good farm-ing condition and minimum requirements for animal welfare and state of the environ-ment must be met. Finland has also decid-ed that if a farmer sets aside more than the mandatory area, this managed, uncultivat-ed land must be under grass to be eligible for the payment.
In Finland the single payment scheme is implemented as the so-called hybrid model. Former CAP payments are con-verted into payment entitlements, which consist of a regional flat-rate payment and possible farm-specific top-ups. The values of the payment entitlements were estab-lished at the end of 2006.
Natural handicap payments (LFA)
Certain rural regions in the EU have been defined as less favoured areas. The purpose of natural handicap payments (LFA sup-port; term ‘compensatory allowances’ used in 2000–2006), is to ensure the continua-tion of farming in these regions and keep them populated. In Finland this support covers the whole cultivated area of about 2.16 mill. ha.
In 2006 the LFA support paid to Finn-ish farmers totalled € 420 mill. and the amount budgeted for 2007 is € 423 mill. The support is 150 €/ha in area A, 200 €/ha in areas B and C1 and 210 €/ha in ar-eas C2–C4.
Environmental support
Agri-environmental support introduced in 1995 compensates the farmers for income losses resulting from the reduction in the production and increased costs as the farm-ers give a commitment to undertake meas-ures aimed to reduce environmental load-ing caused by agriculture. The aims also include the reduction of erosion on arable lands and increasing the amount of humus in the soil.
In 2006 environmental support paid to Finnish farmers totalled € 294 mill. and the amount budgeted for 2007 is € 332 mill. Most of the agri-environmental contracts ended in 2006 and from 2007 onwards contracts under the support system of the new programming period 2007–2013 will be applied. The revised environmental sup-port scheme is presented in more detail in Chapter 5.3.

52
Agricultural support in 2002–2007, € million.
' - . . .
+ - / 0 .
+ - 0 . .
+ - ' 0 .
+ - . . .
/ 0 .
' 0 .
0 . .
.
� � � � � �
' . . ' ' . . * ' . . ) ' . . 0 ' . . 1 ' . . /
) ) * ) 0 1 0 . ' 0 + 0 0 ) + 0 0 0
& ! � � � � � �
) ' ' ) ' ') ' ) ) ' +
� 2 ! � � � � �
) ' . ) ' *
' 3 * ' 3 4 ' 4 / ' 4 *� � � � � � � � � � � � � � � � �
' 4 ) * * '
0 4 0 1 . '0 3 4 1 + 4 1 + +
$ � � � � � � � � � � �
0 / *
3.2. National aid
The national aids paid in Finland comprise the northern aid, national aid for southern Finland, national supplements to compen-satory allowances (natural handicap pay-ments) and environmental support, and certain other forms of support. The aim is to ensure the preconditions for Finnish agriculture in different parts of the country and sectors of agricultural production.
The principles to be applied in deter-mining the level and regional distribution of national aid were agreed in the member-ship negotiations. The aid may not increase production, nor may the total amount of support exceed the level before the EU membership. The aid was to be degressive over the transitional period, because the competitiveness of Finnish agriculture was expected to improve thanks to the increase in the farm size and other adaptation.
The national aid for agriculture and horticulture paid for the production of 2006 totalled € 611 mill. and about € 573 mill. have been allocated for this purpose for 2007. Aid is paid on the basis of the area and number of animals and as addi-tional price for milk. The aid for horticul-ture is paid as storage aid, area payments for horticultural production in the open
and aid for greenhouse production.The most significant change in the na-
tional aid in 2006 was that now the na-tional aid for milk was paid up to the farm-specific reference amount of milk. Manage-ment of the payments was transferred from dairies to agricultural administration. The greatest change in 2007 is the abolition of the national supplement to the environ-mental support.
Northern aid
The Accession Treaty of Finland (Article 142) allows the payment of national north-ern aid to areas north of the 62nd parallel and adjacent areas (support area C). A lit-tle over 1.4 mill., which is 55.5% of the cultivable arable area in Finland, is eligible for this aid.
Northern aid consists of milk produc-tion aid and aids based on the number of animals and cultivated area. The northern scheme also includes the aid for greenhouse production, storage aid for horticultural products and wild berries and mushrooms and headage-related aid for reindeer.
Northern aid paid for the production of 2006 totalled about € 327 mill., of which € 200 mill. was paid as northern aid for milk production and € 105 mill. as north-
ern aid based on livestock units.
National aid for southern
Finland
The national aid for southern Finland, i.e. support areas A and B, is based on Article 141 of the Accession Treaty. This article has allowed the payment of aid due to serious difficulties resulting from the accession to the EU, but it does not define the con-cept of serious difficulties in any more detail or limit the duration of the measure.
The Finns have interpreted
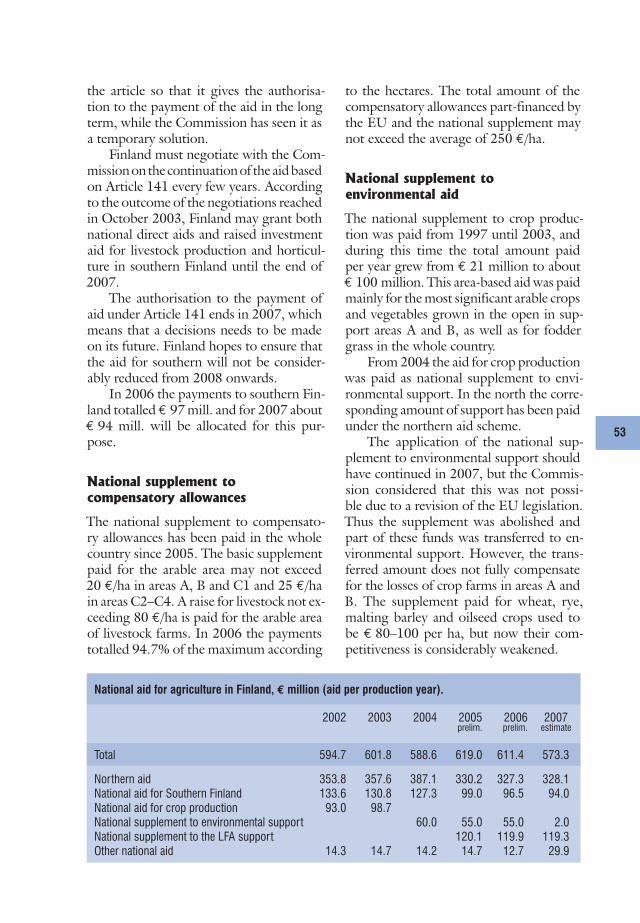
53
National aid for agriculture in Finland, € million (aid per production year).
2002 2003 2004 2005prelim.
2006prelim.
2007estimate
Total 594.7 601.8 588.6 619.0 611.4 573.3
Northern aid 353.8 357.6 387.1 330.2 327.3 328.1National aid for Southern Finland 133.6 130.8 127.3 99.0 96.5 94.0National aid for crop production 93.0 98.7National supplement to environmental support 60.0 55.0 55.0 2.0National supplement to the LFA support 120.1 119.9 119.3Other national aid 14.3 14.7 14.2 14.7 12.7 29.9
the article so that it gives the authorisa-tion to the payment of the aid in the long term, while the Commission has seen it as a temporary solution.
Finland must negotiate with the Com-mission on the continuation of the aid based on Article 141 every few years. According to the outcome of the negotiations reached in October 2003, Finland may grant both national direct aids and raised investment aid for livestock production and horticul-ture in southern Finland until the end of 2007.
The authorisation to the payment of aid under Article 141 ends in 2007, which means that a decisions needs to be made on its future. Finland hopes to ensure that the aid for southern will not be consider-ably reduced from 2008 onwards.
In 2006 the payments to southern Fin-land totalled € 97 mill. and for 2007 about € 94 mill. will be allocated for this pur-pose.
National supplement to
compensatory allowances
The national supplement to compensato-ry allowances has been paid in the whole country since 2005. The basic supplement paid for the arable area may not exceed 20 €/ha in areas A, B and C1 and 25 €/ha in areas C2–C4. A raise for livestock not ex-ceeding 80 €/ha is paid for the arable area of livestock farms. In 2006 the payments totalled 94.7% of the maximum according
to the hectares. The total amount of the compensatory allowances part-financed by the EU and the national supplement may not exceed the average of 250 €/ha.
National supplement to
environmental aid
The national supplement to crop produc-tion was paid from 1997 until 2003, and during this time the total amount paid per year grew from € 21 million to about € 100 million. This area-based aid was paid mainly for the most significant arable crops and vegetables grown in the open in sup-port areas A and B, as well as for fodder grass in the whole country.
From 2004 the aid for crop production was paid as national supplement to envi-ronmental support. In the north the corre-sponding amount of support has been paid under the northern aid scheme.
The application of the national sup-plement to environmental support should have continued in 2007, but the Commis-sion considered that this was not possi-ble due to a revision of the EU legislation. Thus the supplement was abolished and part of these funds was transferred to en-vironmental support. However, the trans-ferred amount does not fully compensate for the losses of crop farms in areas A and B. The supplement paid for wheat, rye, malting barley and oilseed crops used to be € 80–100 per ha, but now their com-petitiveness is considerably weakened.
54
The “health check” of the CAP: structural adjustments and forthcoming reforms
Ellen Huan-Niemi
The Common Agricultural Policy (CAP) brought together the farm policies of the six original members of the European Union (EU) under the Treaty of Rome in 1957. What does the future hold for the CAP, half a century old, in the coming years after enlarging to 27 members in 2007? According to a report by the European Commis-sion, there are clear indications that the problem of under-employment and relative poverty is increasing in the more remote rural areas of the EU. In the enlarged EU-27, some four to six million full-time workers are expected to leave the farming industry by 2014. Furthermore, hidden unemployment on farms can amount to around five million people. These trends highlight the major challenge for future agricultural and rural policy: maintenance of incomes and viable communities in the less advantaged rural areas of the EU.
EU Farm Commissioner Mariann Fischer Boel emphasised: in future, farm incomes will increasingly depend on market returns. The future of the CAP does not lie in con-tinuing official support of agricultural markets or even farm incomes. She predicted that there would be an increase in the number of part-time farmers who would need a second income to cope with the forthcoming cuts in EU subsidies and to survive the next decade. The CAP and markets are constantly evolving. Thus, farmers will have to look for sources of income other that the sale of raw materials produced on their farms. Farming during the weekend and having a job in the nearest city will increas-ingly become normal.
Pressures leading to the CAP “health check”
The European Commission expects that the continued restructuring and modernisa-tion of agriculture will place a heavy burden on the less favoured rural areas. Spending for market and income support policies under Pillar 1 will eventually fall to 32% of the total EU budget in 2013 from more than 70% in the early 1980s. EU leaders have committed in the EU Summit to a root-and-branch review of all aspects of EU budgetary spending to be undertaken in 2009 and reflect on the CAP’s future beyond 2013. The amount of funding dedicated to Pillar 1 will probably decline further after the CAP budgetary framework ends in 2013. There will be tremendous pressure on the financing of the CAP from 2013 onwards because the ten new EU member states that were receiving only 25% of the full EU rate in 2004 will receive 100% of the CAP support level applicable in the current EU. This predicament is further compounded in 2007 with the accession of Romania and Bulgaria.
The general way ahead for the CAP will be made clear with the forthcoming “health check” on the existing CAP policies in 2008. The ‘health check’ will include a debate about future CAP reforms such as abolishing production quotas, set-aside, and inter-vention for all cereals; eliminating country-specific arrangements; capping subsidies; further decoupling of direct payments to farmers; and a higher rate of compulsory modulation for direct payments. Potential further simplification of the CAP in a po-litical nature will be following the simplification work on the CAP that dates back to
55
1992. The European Commission has proposed to establish a single Common Market Organisation (CMO) for all agricultural products to replace the existing 21 CMOs. The European Commission hopes the technical simplification will enter into force in 2008. Commissioner Fischer Boel believes that it will be in everyone’s interest if the transition towards the CAP’s future begins as soon as possible.
Abolition of milk quotas and structural adjustments
Key to the evolution of policy in the longer-term will be expectations of farmers. Cer-tainly if milk quotas are to be abolished, producers will need to be made aware well in advance that changes are in the pipeline, and that the capital value of the quotas they hold is set to be stripped away. This has become something of a self-fulfilling prophecy in many member states, including Finland, with the values of milk quotas plunging when the idea of quota abolition is being publicly discussed. The expectation that the milk quota system will be abolished by 2015 is so widespread now that attention is beginning to focus on how this abolition should take place. This would mean intro-ducing specific measures for a transitional period to make the scheme more flexible. Commissioner Fischer Boel suggested that one way of preparing farmers for a change to the system would be to introduce a general expansion of quotas before the system ends. Such an approach would automatically bring about a shift in EU milk production towards the more competitive EU member states, as in a lower-priced environment only the financially viable dairy farmers would be able to expand because the dairy sector is very capital-intensive. The combined effect of falling intervention prices and decoupled premiums would inevitably have the effect of advancing dairy farmer exits across the EU.
The dairy sector is the largest and most important agricultural sector in Finland. Can the Finnish dairy sector survive a “market shakeout” in the EU dairy sector? Fall-ing intervention prices combined with milk quota abolition will drive the market price for milk to rock bottom level. The income of dairy farmers would decline drastically if they cannot increase their income by rapid expansion of their farms. Support payments will decrease due to the decline in funding for Pillar 1 policies. This situation will be further aggravated in Finland with the European Commission’s eagerness to eliminate country-specific arrangements such as national aid payments. Inefficient and poorly managed farms will be driven out of the market. It is vital that provisions should be made to secure the survival and welfare of the efficient milk producers in Finland. The question is whether policy makers and farmers are proactive or reactive. The survival of the Finnish dairy industry will definitely need a proactive stance because the end of the dairy industry would shatter the future of Finnish agriculture.
In any case, EU member states only have milk quotas set until the end of March 2015; the scheme will end if no new legislation is agreed. The EU Council of Ministers could decide simply to extend the milk quota system after 2015, but Commissioner Fischer Boel implied that there is a majority of countries against this proposal. How-ever, if the expectation to end the milk quota system is not generally shared across Europe, then the political case will be much stronger for extending the system. Finland would need to have a powerful alliance to secure a positive outcome for the future of the milk quota system.

56
4. ECONOMIC SITUATION OF AGRICULTURE
Agricultural income at nominal and 2006 prices in 1994–2006e, € million.
Year Total return at nominal
prices
Total costat nominal
prices
Agriculturalincome at
nominal prices
Agriculturalincome at
2006 prices
Annual changeat 2006 prices,
%
2006e 4,014 3,121 893 893 –10.0
2005 3,986 3,011 976 993 –9.72004 3,968 2,897 1,070 1,099 –4.7 2003 3,932 2,811 1,121 1,152 –3.3 2002 3,960 2,812 1,148 1,191 2.6 2001 3,900 2,798 1,102 1,161 4.2 2000 3,753 2,722 1,031 1,114 6.0 1999 3,520 2,579 941 1,051 4.4 1998 3,484 2,594 890 1,006 –17.7 1997 3,609 2,542 1,067 1,222 –3.6 1996 3,650 2,556 1,093 1,268 –12.7 1995 3,759 2,515 1,245 1,452 –12.4 1994 4,270 2,864 1,407 1,658 26.4
4.1. Agricultural income
The returns and costs of agriculture and horticulture as well as the economic result are followed by means of a total calcula-tion made at the MTT Economic Research. Income development is assessed through the concept of agricultural income, which indicates the compensation for farm fami-ly’s labour and capital invested in agricul-ture. Agricultural income is calculated by deducting the total costs from the total return on agriculture.
In 2006 the total return on agriculture and horticulture exceeded € 4.0 bill. for the first time since Finland joined the EU in 1995. The total costs of agriculture and horticulture were € 3.1 bill. and the agri-cultural income totalled € 893 mill. Agri-cultural income fell by 8.5% from the year before to € 83 mill., mainly as a result of the decrease in the return on crop produc-tion and rise in the costs. Now the total agricultural income has been falling for four consecutive years. At real prices the agricultural income of 2006 was as much as 25% lower than in 2002.
According to the total calculation, the return on agriculture and forestry grew by 0.7% in 2006, but the costs increased by 3.7%, mainly because of the rise in input prices as a result of higher oil prices. In 2006 the support payments to agriculture and horticulture were 2%, a little under € 40 mill., higher than in 2005. Support payments totalled € 1.9 bill., which repre-sents a little over 47% of the total return on agriculture and horticulture. The two main components of the support are the payments under the common agricultural policy of the EU and national aids.
In 2006 the sales return on agriculture and horticulture totalled € 2.1 bill. Most of this, € 1.4 bill., comes from livestock production. The sales revenue from crop production was € 0.3 bill. and the revenue from horticultural product sales was € 0.4 bill. The sales return on agriculture and horticulture covers only about 65% of the total costs.
Return on livestock production was about the same as in 2005 as the growth in the return from slaughtered bovines

57
� � �
� �
� � �
� � �
� �� �
� � �
� �
� � �
� � � �
� � �
� � �
� �
Return on agriculture and costs of agriculture in 2006e, € million.
Total € 4,014 million
Milk812
Support 1,891
Horticulture 369
Crop production 288
Otherlivestock584
Other 70
Total € 3,121 million
Fertilizersand lime 212
Fodder 340
Energy 353
Machinery andimplements 661
Buildings 335
Interest andrent payments 268 Other costs
707
Wages andside costs 245
Return on agriculture Costs of agriculture
compensated for the slight decrease in the return on milk and poultry meat. The trend in beef prices was positive and the return on beef rose by almost 4%.
Instead, the return on poultry meat fell by more than 3% despite the rise in the volumes. The return on pigmeat was about the same as the year before, because the growth in volumes by over 2% compen-sated for the slight decrease in the producer price. The return on milk was about the same as before. The volume fell by 0.6% and the producer price was almost the same as in 2005.
The sales revenue of crop production decreased by almost 4% as a result of the clearly smaller total yields of both cereals and potato. The rise in cereal prices and large amounts of barley on the market in-creased the return on cereals by more than 3%.
The return on potato fell by 23% due to the poor crop and decrease in the pro-ducer price. The reduction in the sugar beet area by almost a quarter as a result of the changes in the support system cut the returns by more than a fifth from 2005. Instead, the return on oilseed crops rose by more than 42%. The cultivation area grew by almost 40% and the producer prices rose by about 18%.
Sales revenue of horticulture rose by
more than 4%. The rise in the prices of crops cultivated in the open compensated almost fully for the decrease in the volumes because of the drought. The market return on greenhouse production increased clearly as the prices for tomato and cucumber rose by about a fifth. The higher energy prices and especially more expensive heating fuel were reflected in the costs of horticulture as well.
On the cost side the rapid increase in the prices of fuel and lubricants as well as fertilisers continued in 2006. The fuel costs rose by more than 10%, even if the prices started to fall towards the end of the year.
The rise in the prices of machinery and building exceeded the general rate of in-flation. Instead, the cost of artificial feed fell by about 0.5% and the lower prices reduced the plant protection cost by almost 5%.
Overheads of agriculture grew by more than 4%, following the general price trends. Interest costs rose slightly because of the increase in the credit portfolio of agriculture.
The total calculation of agriculture and horticulture is based on the money flows of the sectors according to calendar years. Changes in the stock of the final products or production inputs are not taken into account.

58
Productivity development in different types of farming in 1995–2004.
Productivity, production volumes and use of inputs in 1992–2006e, when the year 1992 is indicated by 1.
� � � � � � � � � � � � � � � � � � � � � � � � � � � � � �
� � �
� � �
� �
� � �
� � �
� � �
� � �
� �
� � �
� �
� � �
� � � � � � � � � � � �
� � � � � � � � � � � � � � � � �
� � � � � � � � � � � � �
� � � ! � � � ! � � �
" ! � � � � � ! � � �
� � # � � ! � � �
� � � �
� � � �
� � � �
� � � �
� � � �
� � � � � � � � � � � � � � � � �
4.2. Productivity
development in
agriculture
Positive development in the produc-tivity of agriculture is one of the main objectives of the common agricul-tural policy of the EU. Productivity means the ratio between the volume produced and the use of inputs. Pro-ductivity improves if the same use of inputs, such as arable land, labour and capital, yields a larger volume of output or if the same volume of out-put is achieved by means of less input. The predominating trend in Finnish agriculture has been that the production volume has been quite stable while the use of inputs has decreased as a result of the rapid reduction in labour input.
In 2006 the same use of inputs in Finnish agriculture yielded an about 17% higher output than in 1992. The total pro-duction volume was 95% and use of inputs 81% of the levels in 19921. The average productivity growth in agriculture was 1.1% per year.
Improving the competitiveness of Finnish agriculture on the EU market would call for much more rapid produc-tivity growth. The fact that the growth has stagnated to the level of 2000 is quite alarming. From 1992 until 2000 the total use of inputs to achieve the same out-put decreased, but since then the use of inputs has stayed about the same even if the use of labour has decreased in agriculture.
Farmer’s own labour input has fallen to about half since 1992, while there has been some increase in the use of hired labour. The share of the weight on labour in the index for the use of inputs is about a third. Another
third consists of capital costs. The most significant capital items in agriculture are machines, buildings, subsurface drainage and land improvement, and arable land. Last third comes from variable inputs.
In international comparisons differ-ences in productivity trends are often ex-plained through investments in physical production equipment or human capac-ity as well as product development and technical innovation. Attention has also been drawn to basic factors such as stable social conditions, clearly defined rights of ownership, and role of the society on the market.
Based on the productivity develop-ment in Finnish agriculture it seems that investments in product development and
1 Because of the change in measuring labour input
the figures are not comparable with those presented
in the earlier issues of Finnish Agriculture and Rural
Industries.

59
economic and technical innovations must be increased. The fact is, however, that a growing share of the turnover of farms comes from various kinds of support pay-ments that are decoupled from the pro-duction. This may have led to a situation where not all farmers have the true incen-tive to improve productivity. When con-sidering the trends in productivity, support payments are not regarded as products of agriculture.
The productivity development in agri-culture presented here is restricted to the products and inputs which can be traded on the market. The data are based on the total calculation of agriculture, except for the labour input. The calculation does not take account of the externalities of agricul-ture, such as changes in nutrient loading. The figures indicating the production vol-umes and use of inputs have been calcu-lated by the Divisia index method.
4.3. Development of the
economic result
and profi tability of
enterprises
The MTT Economic Research calculates the profitability development of Finn-ish agriculture and horticulture annually on the basis of the records of the profit-ability bookkeeping farms. The results of the about 1,000 bookkeeping farms are weighted so that they indicate the average results of the 44,000 largest Finnish agri-culture and horticulture enterprises. These account for more than 90% of the output of Finnish agriculture. The individual rev-enue and expense items have been allocated as returns and costs to the year of produc-tion in accordance with the accrual princi-ple. The possible transfer of sales income or support payments to the following year does not influence the results of the year. Instead, annual variations in the yields and returns and changes in prices and support
are directly reflected in the annual profit-ability figures.
Development of returns
The gross return of agriculture and horti-culture enterprises grew by about 1.1% to € 97,300 in 2005. Sales return fell by 3%, but the losses were compensated by the increase in support payments by almost 5% to € 40,000 per farm. On average, 59% of the gross return of the bookkeeping farms came from the market and 41% consisted of support payments. Support includes in-vestment aids divided over the economic life of the investment.
Development of costs
The costs per farm increased by almost 3% to € 78,600. After the costs had been de-ducted, the average entrepreneurial income left as compensation for entrepreneur’s labour and equity in 2005 was € 18,700, which is 5.5% lower than in 2004.
When the entrepreneur’s wage claim calculated on the basis of the recorded working hours of 2,640 and hourly wages of agricultural employees of € 12.3 as well as the interest claim for equity, calculated according to a rate of 5%, are deducted from the entrepreneurial income, we arrive at the entrepreneurial profit, where all pro-duction costs are taken into account. This was negative, minus € 23,600. The returns should be this much higher or costs lower in order that the entrepreneur would re-ceive the compensation of € 12.3 for own labour and the 5% return on equity.
Profi tability
When entrepreneurial income is divided by the sum of wage and interest claims we arrive at the profitability coefficient. The profitability coefficient declined to 0.44, which means that entrepreneurs reached, on average, 44 percent of the objective set

60
for wages and interest. So entrepreneurs’ hourly wages were € 5.4 and interest on equity was 2.2%. As a relative concept profitability coefficient is well suited for comparisons between different years as well as farms representing different size classes and production sectors. The fact the profitability coefficient was less than 1 means that entrepreneurial income did not cover the wage and interest claims, which can also be seen in the negative entrepre-neurial profit.
In general, large enterprises are more profitable than small ones and the profit-ability improved from south to north. This is partly due to the distribution of the pro-duction sectors in different parts of Finland. On pig farms the profitability coefficient improved from 0.51 to 0.74 and on cereal farms it declined from 0.30 to 0.26.
Variation and dispersion of
profi tability
In about half of the enterprises the profit-ability coefficient was between 0.09 and 0.68 (lower and upper quartiles). In the best 11% of the enterprises the profitabil-ity coefficient was higher than 1, which means that compensations for an hour of farm family labour and equity were over € 12.3 and 5%, respectively. On about 18% of farms the profitability coefficient was negative, which means that there was no compensation for own labour and eq-uity.
Partly as a result of the low profitabil-ity of cereal farming the profitability was poorer in southern Finland than in central and northern Finland. In most production sectors the profitability was clearly better on large farms than on small farms.
Profi tability of agriculture in
relation to other enterprises
The return on equity and total assets are more appropriate indicators for compari-
sons with other enterprises than profitabil-ity coefficient. When wage claim is deduct-ed from entrepreneurial income, we obtain the net profit left as return on the equity. In 2005 this was € –13,900. When the net profit is divided by the amount of equity, we arrive at the return on equity, –7.1%.
By adding interest payments to the net profit we arrive at the compensation for total assets, which was € –11,400 in 2005. When this is divided by the total capital of the accounting period of € 266,000, we arrive at the return on total assets. In ag-riculture this was negative, the average of
–4.3%, in 2005.
Solvency and liquidity
On average the return on total assets in agriculture and horticulture has been negative. In 2005 only on pig farms the return on total assets was positive. The average return on total assets was –4.3%, and variation between the production sec-tors ranged from 1.3% on pig farms to
–8.2% on horticulture farms. This means that additional capital needs to be invested to continue the production activity in the current extent.
This additional capital may be exter-nal, but often it consists of entrepreneurial income or funding from other operations to ensure liquidity with the same condi-tions as capital invested (forest incomes and salaries, investment subsidies, etc.). This is one reason why the average debt of the enterprises was only about € 74,200 and the equity ratio, i.e. the average share of equity to total capital, is still very high, 73%. However, on very large farms the equity ratio has fallen to 46%.
Because of the growth in the farm size and increased capital intensity, equity grew by 3.2% to € 199,900 in 2005. If we cal-culate 5% of interest on equity, the interest claim for the average equity of the account-ing period was € 9,780.
The equity ratio is improved by the fact

61
that all investment subsidies are included in the equity in the balance sheet. Of the bookkeeping farms about 80% make some investments annually and about 20% of these take advantage of investment subsi-dies. Direct recognition of these as income and excluding them from the balance sheet would distort the equity ratio and give a wrong view of the capital needed for agri-cultural production. Property acquired by means of investment subsidies is included in the balance sheet and depreciations are calculated from this as well. Investment subsidies are recognised as return at the same pace as the value of assets covered by them are being depreciated.
Earnings of farmers compared to
wage earners
When the interest claim of 5% is deducted from entrepreneurial income, the annual earnings in 2005 were € 8,800. By divid-ing this by the 2,640 hours of labour of the farm family we arrive at the hourly earnings, which can be compared with the wages in other sectors. In 2005 the average hourly earnings in agriculture were € 3.4. In about 10% of the enterprises the hourly earnings were more than € 12.3, i.e. the hourly wages of agricultural employees.
Model for result and profi tability
forecasts
The MTT Economic Research has devel-oped a calculation model for forecasting the development in the results and profita-bility of agriculture and horticulture enter-prises. The forecasts for individual enter-prises take account of the development of input and producer prices by product and cost items, changes in payments by types of support and regional changes in average yields for different crops. The forecasts for individual enterprises are weighted to indi-cate the average results of the about 44,000 largest agriculture and horticulture enter-
prises. The forecasts for 2006 are based on the profitability bookkeeping records from 2005.
In the model the production structure and size of the enterprises stay the same as in the previous year, but the changes in the crop yields are taken into account. These changes are based on the regional and crop-specific estimates of the Informa-tion Centre of the Ministry of Agriculture and Forestry. The model does not include the impacts of the development in the farm size and productivity on the economic re-sult.
Forecasts for 2006
According to the forecast, the sum of the sales return and support payments of ag-riculture and horticulture enterprises grew by 0.4% to € 97, 700 in 2006. However, the costs and depreciations increased by 5% to € 82,600. The average entrepre-neurial income left as compensation for labour and equity was € 15,100, which is 19% lower than in 2005.
The cost of farm family’s labour and equity totalled € 42,500. When this is also deducted from the entrepreneurial income, we obtain entrepreneurial profit, which was € –27,400. The growth in support payments and sales return was not suffi-cient to cover the rise in the costs.
If only the 5% interest claim due to equity, about € 9,750, is deducted from the entrepreneurial income of € 15,100, the annual earnings left to the farm fam-ily labour are about € 5,350. When this is divided by the average annual hours of farm family labour, about 2,640 hours, we obtain a concept that is comparable to the hourly pay for wage earners. In agriculture hourly earnings is € 2 per hour.
According to the forecast, the average profitability coefficient fell from 0.44 in 2005 to 0.36 in 2006. This means that the entrepreneur reached 36% of the hourly wage claim of € 12.4 and interest claim

62
of 5%. The coefficient was 0.41 on dairy farms, 0.33 on other cattle farms, 0.51 on pig farms, 0.41 on horticulture farms, 0.16 on cereal farms and 0.36 on other crop farms. The profitability of agriculture and horticulture enterprises declined in all pro-duction sectors and support areas.
Profi tability forecasts for agriculture
from Taloustohtori
Taloustohtori is an online service for pre-senting the profitability bookkeeping records. It was opened for public use by the MTT Economic Research in Decem-ber 2006. The data offered through the service consist of tens of thousands of ta-bles, which can be used for various kinds of result and profitability studies.
Taloustohtori provides the average financial statement calculations of enter-prises representing all production sectors, size classes and regions from the account-ing year 1998 onwards. The user can freely choose the classification categories. The average results given in Taloustohtori are calculated from the records of the book-keeping farms weighted according to the classification by production sector, size class or region selected by the user so that the results can be generalised to show the average results of that specific group of farms.
The result, balance and profitability calculations are available as basic tables from 1998–2005, classified according to the size class, production sector and region for each year. By pressing “omat valinnat/own selection” in the service the user has access to various kinds of reports on differ-ent sectors, size classes and regions in both domestic languages, Finnish and Swedish (the service will be opened also in English in near future). The number of alternative reports is 9 and there are 8 selection crite-ria, of which the user may select the maxi-mum of 4 for each printout. All the result tables of the system are created in real time
from farm-specific data, and the results are weighted according to production sector, size class and/or region selected by the user. Records from individual farms are not available. The selection “background information” presents the methods used in the financial statement calculations, clas-sification of enterprises, weighting, etc.
Improved classifi cation and
weighting system
For the opening of Taloustohtori and results from 2005, the classification and weighting systems of the profitability book-keeping were updated to comply with the most recent calculation principles. How-ever, the methods used for calculating the farm-level-results are the same as before. The number of farm size categories was raised to 7 to reflect more accurately the differences in profitability according to size categories. The standard gross margins for each product were revised and, in accord-ance with the FADN data, intermediary products were included to raise the total standard gross margin of the enterprise. Through this the total standard gross mar-gin of about 40 small farms which used to be excluded from the profitability calcula-tion exceeded the € 9,600 set as the limit for inclusion in the calculation. This weak-ened the overall level of the profitability bookkeeping results.
When calculating the average results according to the region, production sector and size class, the results of individual en-terprises are weighted by the total number of Finnish farms representing the category concerned. Calculation was based on the farm structure surveys of the Information Centre of the Ministry of Agriculture and Forestry, which was done every third year. In the new system the number of farms is calculated annually. To maintain the comparability of the results from different years, the results were recalculated retroac-tively to 1998.

63
Development in the results and profitability of agriculture and horticulture enterprises in 1998–2006e.
� �
�
�
� �
� �
� �
� �
�
�
� � � � � � � � � � � � � � �
" ! � � � � � ! � � � �
� � # �
� � � ! � �
$ � � � � ! � � �
� � � � � �
� � � �
� �
% � � � � � � � � � � � & � � � � � � ' � � � � � � � � � � � ! � � � � � � � ( � � � ! ) � � �
* ! # � � � � � ! � � � � � � � � ( � � � ! ) � � �% � � � � � � � � � � � � ! � � � � � � � �
� �
�
� �
� �
+ � �
+ � �
+ �
+ � �
�
� � � � � �
, � - � �� � � � �
, � - � �� ! � � � �
� � � ! � � . � � � � +� � � � � � �
" ! � � �� ! � � � �
� � # � $ � �� ! � � �
� �
�
� � � �
� � � �
� � �
� � �
� � � �
� � � � � � � � � � � � � � �
" ! � � �� ! � � � �
� � # �
� � � ! � �$ � � � � ! � � �
� � � �
�
� � � �
� � � �
� � �
� � �
� � � �
� � � � � � � � � � � � � � � � � � �
�
� �
/
$
� �
+ � � � �
+ � � � �
�
� � � �
� � � �
� � � �
� � � �
� � � ! � � , � - � �� � � � �
. � � � � +� � � � � � �
" ! � � �� ! � � � �
, � - � �� ! � � � �
� � # � $ � �� ! � � �
Nominal entrepreneurial income according to production sectors
Entrepreneur's profit according toproduction sectors in 2005
Profitability coefficientaccording to production sectors
Profitability coefficient according to support areas
Dispersion of profitability coefficient according to production sectors in 2005
�
� � - � � � � � � �
� � � � � � 0 � ! � � � � �
! � � � ! # �
� � � � ! �
� � ( � � � 0 � ! � � � � �
� � � � � � � � � �

64
Milk production costs in 2005, cents/kg.
Number of cows/farm Averageunder 10 10–20 20–30 30–50 over 50
Variable costs 25.4 24.7 22.6 22.5 22.9 23.4– purchased feed 5.1 5.9 5.5 6.3 6.7 6.0– other livestock expenses 2.3 2.5 2.3 2.3 2.2 2.3– energy 2.7 2.3 2.1 2.0 2.0 2.1– maintenance 3.4 3.4 2.9 2.5 2.9 3.0– other 11.9 10.6 9.8 9.4 9.2 10.0
Fixed costs 54.5 40.0 32.4 29.0 24.5 33.8– cost of farm family labour 43.7 27.2 20.0 14.5 10.0 20.6– depreciations 5.3 7.4 7.4 9.1 9.5 8.0– interest on capital 5.5 5.4 5.0 5.4 5.0 5.2
Production costs, total 79.9 64.7 55.0 51.5 47.4 57.2
4.4. Production costs of
agriculture
High production costs per unit produced have always been one of the main problems in Finnish agriculture. Success on the com-mon European market, where the competi-tion is tightening and producer prices are on the decrease, calls for more attention to the unit costs of farm products and possibilities to reduce them. During the EU membership the farms have increased in size, with the aim of lowering the unit costs and improving their profitability. The production costs of milk and cereals from 1995–2005 presented below are based on the profitability bookkeeping data of the MTT Economic Research. The costs have been deflated to the price level of 2005 by means of the cost-of-living index.
Milk
In 2005 the average production cost of milk was 57.2 cents/kg. The producer price without support was 33.0 cents/kg and the average production support in the whole country was 7.6 cents/kg. In 2005 the unit cost of milk was about a fifth lower than in the beginning of the EU member-ship, mainly as a result of the increase in the farm size and milk yield of dairy cows.
The average arable area of dairy farms included in the calculation was 54 ha and the average number of cows was 29. The average annual milk yield per cow was 8,200 kg. The size of farms has grown strongly during the EU membership: in 2005 the arable area was almost 24 ha larg-er than in 1995 and the number of cows had increased by 12. The annual milk yield per cow had risen, on average, by 1,300 kg over the past decade.
The unit cost of milk decreases as the farm size grows. The labour cost of the farm family, which is one of the fixed costs, is the most important factor explaining the differences in the costs in different farm size classes. On farms with over 50 cows it represented 21% of the unit costs and, on average, it was 63% lower on these farms than on farms with 10–20 cows. Relative to the production volumes the use of hu-man labour is higher than on large farms, where capital is substituted for labour.
Cereals
In 2005 the average production cost of ce-reals on the bookkeeping farms was 42.5 cents/kg. The average market price for all cereals was 10.5 cents/kg.
The unit cost of cereals was about the same in 2005 as in 1995 when Finland
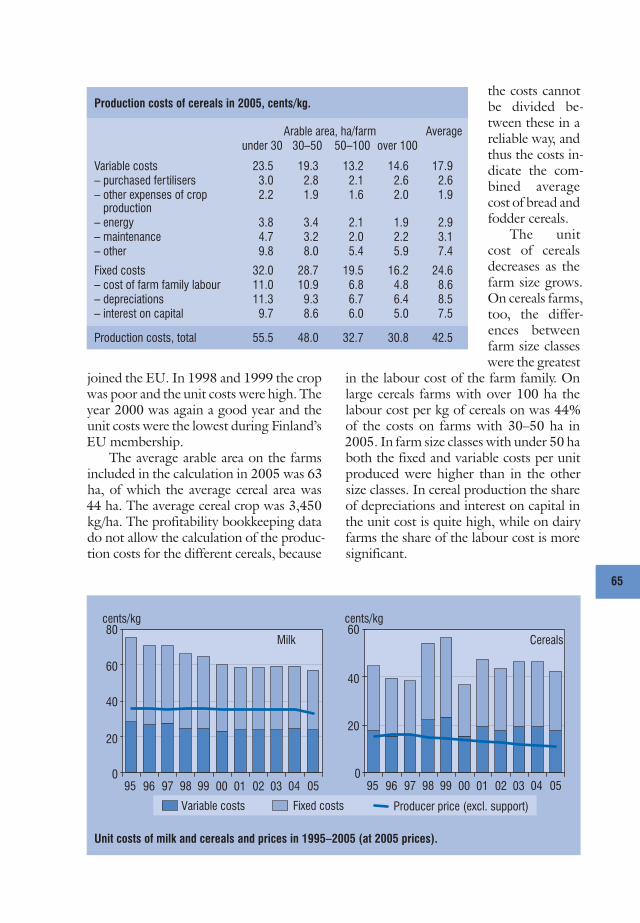
65
the costs cannot be divided be-tween these in a reliable way, and thus the costs in-dicate the com-bined average cost of bread and fodder cereals.
The unit cost of cereals decreases as the farm size grows. On cereals farms, too, the differ-ences between farm size classes were the greatest
in the labour cost of the farm family. On large cereals farms with over 100 ha the labour cost per kg of cereals on was 44% of the costs on farms with 30–50 ha in 2005. In farm size classes with under 50 ha both the fixed and variable costs per unit produced were higher than in the other size classes. In cereal production the share of depreciations and interest on capital in the unit cost is quite high, while on dairy farms the share of the labour cost is more significant.
Unit costs of milk and cereals and prices in 1995–2005 (at 2005 prices).
Production costs of cereals in 2005, cents/kg.
Arable area, ha/farm Averageunder 30 30–50 50–100 over 100
Variable costs 23.5 19.3 13.2 14.6 17.9– purchased fertilisers 3.0 2.8 2.1 2.6 2.6– other expenses of crop production
2.2 1.9 1.6 2.0 1.9
– energy 3.8 3.4 2.1 1.9 2.9– maintenance 4.7 3.2 2.0 2.2 3.1– other 9.8 8.0 5.4 5.9 7.4
Fixed costs 32.0 28.7 19.5 16.2 24.6– cost of farm family labour 11.0 10.9 6.8 4.8 8.6– depreciations 11.3 9.3 6.7 6.4 8.5– interest on capital 9.7 8.6 6.0 5.0 7.5
Production costs, total 55.5 48.0 32.7 30.8 42.5
�
� �
� �
�
�� � � � � 1 2 #
� � � �� �� � � � � � � � � � � � � � � � �� �� � � � � � � � � � � � �
�
� �
� �
�� � � � � 1 2 #
3 ! � � ! ) � � � � � � � � 4 � 5 � � � � � � � � � � � � � � � � � � � � � � � 6 � 5 � � � � � � � � � � � 7
8 � � 2 � � � ! � �
joined the EU. In 1998 and 1999 the crop was poor and the unit costs were high. The year 2000 was again a good year and the unit costs were the lowest during Finland’s EU membership.
The average arable area on the farms included in the calculation in 2005 was 63 ha, of which the average cereal area was 44 ha. The average cereal crop was 3,450 kg/ha. The profitability bookkeeping data do not allow the calculation of the produc-tion costs for the different cereals, because

66
5. AGRICULTURE AND THE ENVIRONMENT
Modern societies direct various kinds of expectations to farming. Apart from pro-ducing staple foods, agriculture should contribute to, for instance, managed and open farming landscapes, biological diver-sity and rural viability. This so-called mul-tifunctional agriculture is not a new issue. In the 1940s, secure food supply received considerable attention, while ensuring the viability of rural areas has been a major topic since the 1970s. The environmen-tal policy of agriculture is closely linked to other trends in the society, because the state has always been active in steering ag-ricultural production. In recent years, the role of environmental amenities as a prod-uct of multifunctional agriculture has be-come increasingly important.
During 2006, the discussion on agri-environmental policy was dominated by the preparation of the Rural Development Programme for 2007–2013. This includes the agri-environmental scheme, which is the main EU instrument for the environ-mental policy of agriculture. The scheme is mandatory for all Member States, and the main goals are to reduce loading on surface waters and groundwater, reduce emissions to air, protect the biodiversity of farming environments and manage the rural landscapes.
The management plans for waters un-der the EU Water Framework Directive should be ready by 2009. The aim of the Directive is to protect, improve and re-store waters so that their chemical and ec-ological status will be good in the whole EU by 2015. In Finland, the agri-environ-mental support is one of the main instru-ments in implementing the measures re-quired by the Directive.
The majority of the agri-environment support contracts under the conditions in force in the programming period 2000–2006 ended in 2006. From the beginning
of 2007, contracts are made under the sup-port scheme of the new programming pe-riod.
In Finland, agri-environmental sup-port is the largest item in the state ex-penditure on environmental protection. In 2005, a total of € 969 million was used for environmental protection and agri-en-vironmental support accounted for about 30% of this, € 293 million.
5.1. Environmental impacts of
agriculture
Agriculture has an important role in main-taining biodiversity and as a producer of rural landscape and recreational services. In the future, agriculture may have a new significant role as a producer of renewable energy. In addition to positive effects, ag-riculture has also negative impacts on the environment, i.e. the soil and its structure, surface waters and groundwater, and the air.
Biodiversity and rural landscape
Agricultural production is based on the utilisation of biological diversity. Simi-larly, many wild plant and animal species have over centuries adjusted to utilising agricultural environments created by man. For some wild species, the changes in their habitats as a result of new and more effi-cient production methods have been too rapid and they have not been capable of adjusting to the new conditions. Especially those organisms which depend on mead-ows and forest pastures have declined and become endangered due to the decrease in grazing and cattle husbandry.
There are fewer species in intensive plant production regions with monoto-nous landscape structure than in regions

67
with extensive and varied plant and animal production. Recently, one major topic has been the so-called high nature value farm-land (HNV farmland) with extensive ag-ricultural production. In Finland, for ex-ample traditional rural biotopes could be such HNV areas, but this calls for further study. Therefore, a research project has been launched to define the HNV areas.
Based on the results of the follow-up studies on the impacts of the Finnish Agri-Environmental Programme (MYTVAS 1 and 2), the agri-environmental measures have contributed to the preservation of bi-odiversity and open farming landscapes. In spite of this, the current measures have not been sufficient to stop the impoverish-ment of the farming environments, which has continued for a long time.
The decline in biodiversity is consid-ered a serious problem because biological diversity is the foundation for the func-tioning of ecosystems and ecosystem serv-ices. Without diversity, the ecosystems are not capable of adjusting to changes in the environment.
Loading of waters
Agriculture is still the greatest single source of nutrient loading on waters. Loading is caused by both arable farming and live-stock production. The Finnish En-vironment Institute estimates that at present about 50% of the nitro-gen loading and 60% of phospho-rus loading comes from agricultural sources.
Nutrients, mainly phosphorus and nitrogen, leach to rivers, lakes and the sea from arable land, causing eutrophication. This can be seen from the turbidity of the water, increase in the algae and the mass blooming of toxic blue-green algae in the summer. Although the emissions have been re-duced, the eutrophication of waters continues and no improvement in the
state of waters has been observed.The use of pesticides began to increase
in Finland towards the end of the 1990s af-ter a long downward trend. The main rea-son for this was the wider use of no-tillage technology and the shift to pesticides that need to be used in larger doses. On the European scale, however, the quantities of pesticides used in Finland are still quite moderate. Since 2004, some decrease has been observed in the use of pesticides.
The load on waters from arable farm-ing depends on the soil structure. Soil compaction reduces the permeability of the soil, which increases the risk of nutri-ent leaching and erosion. It also weakens the nutrient intake of plants, which lowers the utilisation rate of nutrients. Poor per-meability may also increase the release of greenhouse gases.
Emissions to the air
Climate change poses new challenges to Finnish agriculture. The measures to adapt to climate change are likely to change the relative profitability of different crops and production methods. Climate change is also influenced by agriculture. Greenhouse gas emissions from the agricultural sector represent about 9% of the total emissions in Finland. Since 1990, the emissions from
Use of pesticides (active substance g/ha). Source: In-formation Centre of the Ministry of Agriculture and For-estry.
� � � � �
� � �
� � �
� � �
� � �
�
� � � � �
� � � � � � � � � � � � � � �
� � � � � � � � � � � � � � � � � � � �
� � � � � � � � � � � � � �
� � � � � � � �
� � � � � �
! � � � � � �

68
agriculture have decreased by about a fifth as a result of the decrease in agricultural production. In relative terms, the emis-sions from agriculture have decreased even more since the total emissions from other sectors have grown.
Most of the greenhouse gas emissions from agriculture are due to the digestion of ruminant livestock, the decomposition of organic matter in the soil and the de-composition of manure. Minor emission sources include nitrogen fertilisation, lim-ing of arable lands and the use of fossil en-ergy in agriculture. One common feature in all emissions from agriculture is that it is difficult to reduce them without direct-ly influencing the volume of agricultural production.
Agri-environmental regulation
Besides factors causing emissions and en-vironmental load, the structural change in agriculture and growth in the farm size in-crease the environmental risks of farming. Various kinds of administrative measures have been taken to mitigate the negative impacts, including statutory restrictions and support for environmentally sound production practices. The possibility to use taxation as a regulatory means was raised e.g. in the previous Government Programme.
Environmental protection in the agri-cultural sector is influenced by both nation-al and international environmental legisla-tion. National regulation includes, among others, environmental permits and waste legislation. The EU environmental legis-lation related to agriculture includes the Natura 2000 network, the Nitrates Regu-lation issued under the Nitrates Directive and the Water Framework Directive.
The Act on the Organisation of Water Management adopted in 2004 implements the Water Framework Directive in Finland. Water protection is founded on the assess-ment of the status of waters, where the
current status is compared with the nat-ural state. Management plans and action programmes are drawn up for each water management area.
Another significant regulatory instru-ment concerning agriculture is the agri-en-vironmental scheme, which also emphasis-es water protection. Most of the support is directed to measures which contribute to water protection. In contrast, only about 2–3% of the support is used for measures that are primarily targeted at enhancing bi-odiversity. In spite of this, the impact of support on biodiversity is larger, because many of the water protection measures, such as filter strips and headlands, have positive impacts on biodiversity as well.
5.2. Pressures for change in
agri-environmental policy
Agri-environmental policy is faced with pressures due to changes in both the so-ciety and the environment. The agri-envi-ronmental scheme and the overall increase in environmental awareness have shaped the farmers’ attitudes. Consumers’ aware-ness has grown, resulting in pressures on the EU to reform its agricultural policy to respond to the public opinion and de-mands. On the global scale, meeting the obligations relating to the WTO member-ship obliges the EU to reform the support payments to agricultural production.
In view of the implementation of the CAP reform and preparing for the new programming period 2007–2013, the concept of multifunctional agriculture is again topical. Decoupling support from production and the new single payment scheme introduced the cross-compliance conditions, according to which agricultur-al land must be maintained in good agri-cultural and environmental condition.
The implementation of the Water Framework Directive will highlight the need to reduce non-point source water

69
pollution, posing further challenges to ag-riculture. The nutrients stored in waters will alone continue to deteriorate the sta-tus of waters for years. So far the agri-en-vironmental measures have not succeeded in preserving the biodiversity in farming environments. Climate change is going to alter the relative profitability of different crops and increase the risk of spreading new diseases and pests. Rational manage-ment of biosecurity will thus be increas-ingly important in the future.
The development trends in genetical-ly modified and organic production offer both threats and opportunities for future agriculture. At present there is no com-mercial cultivation of genetically modified crops in Finland, but according to an ex-pert study, the introduction of GMO crops in Finland in the near future is very likely. One great challenge is to find out how the coexistence of the different types of pro-duction can be organised in a way that it meets the needs of the society.
The use of rural nature for recreation and tourism and the production of bioen-ergy offer new opportunities for rural ar-eas.
5.3. Agri-environmental
support in 2007–2013
The Ministry of Agriculture and Forestry set up a working group in 2005 to prepare a proposal for the agri-environmental sup-port scheme for mainland Finland in 2007–2013. The working group also drafted a proposal on the organisation of the fol-low-up and evaluation of the agri-environ-mental support scheme and the indicators for this. The proposal included an assess-ment of the current status of agricultural environments, objectives of support and a description of the measures, their ob-jectives and estimated environmental im-pacts. The support levels were calculated for all measures. The working group also
drafted a proposal on support for non-pro-ductive investments and agricultural and forestry areas included in the Natura 2000 network.
The proposal was completed in the spring of 2006. The draft agri-environ-mental support programme was incor-porated in the Rural Development Pro-gramme, which the Finnish Government approved in August 2006 and which was then submitted to the European Commis-sion. The Commission presented the first demands for corrections and additions in early December. Based on these, for exam-ple, the basic measure concerning liming and additional measures concerning the reduction in the need to prevent plant dis-eases and more efficient use of potato cell sap were left out. The cultivation of catch plants in support areas A and B was pro-posed as a new measure. The revised ver-sion of the draft programme was submit-ted to the Commission in mid-December and the Commission reply was expected in January 2007. The implementation of the measures should start in the spring of 2007.
Objectives of agri-environmental
support
The increased effectiveness of the agri-en-vironmental support scheme was required through more careful targeting and re-gional allocation of the measures. The overall objectives are similar to those of the previous programmes. The main goal is to practise agriculture and horticulture in a way that the environmental load is re-duced. The biological diversity of farm-ing environments and conditions for pro-duction in the long run must be ensured. Erosion from arable lands should be re-duced and amount of humus in the soil increased. The means to reach these ob-jectives include more efficient utilisation of plant nutrients, minimising the risks due to the use of pesticides, taking care

70
of biodiversity and animal and plant spe-cies, and management of rural landscapes. Good environmental management creates the conditions for the production of pure and high-quality products. The agri-envi-ronmental scheme should cover 93% of the farmers and 98% of the arable area.
Structure of the scheme
The structure of the new agri-environmen-tal support scheme is similar to the earlier one. The measures are divided into basic measures that are mandatory for all farm-ers, additional measures complementing these and more demanding special meas-ures. As before, specific basic and addition-al measures as well as plant-specific thresh-olds for nitrogen and phosphorus fertili-sation have been established for horticul-ture. Some of the special measures, such as initial restoration of traditional rural bi-otopes and establishment of wetlands, are funded from the support for non-produc-tive investments. Other investments relat-ing to environmental measures are funded under axis 1.
Basic measures
One of the main changes from the previous programme is the abolition of the manda-tory training and acquisition of plant pro-tection manuals. Now the requirement for nitrogen fertilisation is more similar to the earlier additional measure concerning more accurate fertilisation, where the nu-trient need of the plant and soil fertility is taken into account better than the earlier fertilisation base level. The limits for phos-phorus fertilisation were tightened, main-ly because of the raise in the usability per-centage of phosphorus contained in ani-mal manure. In the current programming period, 85% of the phosphorus in manure will be counted as usable. 75% of the liq-uid nitrogen in manure spread in the au-tumn will be taken into account. The in-
ventory of biodiversity sites on farms was introduced as a new basic measure. Now the agri-environmental scheme also covers set aside area that is eligible for payment entitlements. The rate of support for basic measures is 93 €/ha on crop farms and 107 €/ha on livestock farms. The difference is mainly due to the stricter rules for the use of phosphorus as regards the phosphorus contained in manure. In the agri-environ-mental support scheme, a livestock farm is a farm which has at least 0.4 LU/ha of eli-gible area or a total of 25 LU.
Additional measures
The changes in additional measures com-pared with the earlier are greater than in basic measures. Of the earlier measures only plant cover in winter and reduced till-ing was included in the new scheme, but its content was also revised. There will be a separate support scheme for promoting the welfare of production animals. New additional measures applied in the whole country are reduced fertilisation, more accurate nitrogen fertilisation on arable crops, spreading of manure during grow-ing season, nutrient balance, and improv-ing the growing conditions of arable land. Farmers in support areas A and B may also select plant cover or intensified plant cov-er in winter, crop diversification, extensive grassland production, and cultivation of catch plants. The rate of support for the measures varies between 10 and 55 €/ha. In areas A and B, the number of addition-al measures selected may be 1–4 and, in area C it may be 0–2, while in the earli-er scheme the selection of one addition-al measure was mandatory and no more could be selected. The reason for the larger number of measures in areas A and B is the abolition of the national supplement to en-vironmental aid, which thus has now been incorporated in the scheme itself. An im-portant goal of the additional measures is to increase plant cover in winter especially

71
in southern Finland, because the plant cov-er has proven an efficient way of prevent-ing the runoff of phosphorus.
Special measures
The contracts concerning special measures are quite similar to those under the earli-er scheme. The earlier contract concerning conversion into organic production and organic production contract have been combined into a single contract and the measure concerning organic livestock pro-duction introduced in 2005 will be contin-ued. Contracts concerning traditional ru-ral biotopes and multifunctional wetlands are included in the special measures in the new scheme as well. The establishment of multifunctional wetlands and initial resto-ration and fencing of traditional rural bi-otopes are supported through the non-pro-ductive investments introduced as a new type of support. The management of Nat-ura 2000 areas on arable and agricultural lands continues as a special measure in the same way as before. Agri-environmental support is not used for the management of forest areas included in the Natura 2000 network. Payments relating to the imple-mentation of the Water Framework Di-rective were not prepared yet, because the water management plans will not be com-pleted until 2009, while the Rural Devel-opment Programme is being implemented from the beginning of 2007. However, the agri-environmental support scheme will be the main instrument for reaching the objectives set in the Directive. It should be possible to renew the commitment to the support scheme during the contract peri-od if the Water Framework Directive re-quires intensified measures.
Further conditions and impacts of
the measures
One of the most significant changes from the previous programming period was the
introduction of cross-compliance condi-tions which the measures have to exceed, while earlier the initial level was “usual good agricultural practice”. Minimum re-quirements (i.e. maximum limits for use) had to be set for the plant protection prod-ucts and fertilisers so that measures beyond these can be compensated for. Usually, the commitments are made for 5 years, but for valid reasons they may also be long-er. In special cases support may be paid to actors other than farmers. Agri-environ-mental support may be used to compen-sate for the costs and income losses due to the measures and to cover the transaction costs up to 20% of the total costs of the measure. The incentive element included in the earlier scheme can no longer be ap-plied.
Besides the positive impacts on wa-ters, the basic measure concerning head-lands and filter strips and the special meas-ure concerning riparian zones have made a positive contribution to farming land-scapes and biodiversity. The possibility to leave headlands covered with grass also on field margins other than the one bordering on a main ditch or water body allowed in the new programme is positive as regards biodiversity.
Experts consider the special meas-ure concerning traditional rural biotopes as the most significant single measure in terms of biodiversity. In the new program-ming period, the Leader action groups may also apply for support for non-pro-ductive investments for the initial resto-ration of traditional rural biotopes and conclude contracts concerning this special measure. This can be expected to extend regular management measures to further valuable traditional rural biotopes. In the programming period 2007–2013, it is also possible to conclude contracts concerning certain new special measures to enhance biodiversity (habitats of butterflies and bi-odiversity strips on arable lands).

72
5.4. Water protection
Water is a valuable element for the Finns, both as a natural resource and as part of our cultural identity. However, the status of the Baltic Sea is far from good and eu-trophication is widely recognised as a se-rious problem in the inland waters as well. According to the Government Resolution on guidelines for water protection issued in November 2006, by 2015 nutrient load-ing from agriculture should be reduced by at least a third from the average in 2001–2005 (phosphorus by 3,000 t/a and nitro-gen by about 30,000 t/a). The reduction target of 50% by 2005 was not reached, even if in 1995–2006 a total of over € 3 billion was spend on this, including agri-environmental payments. Now the envi-ronmental policy of agriculture has gained new momentum, as the Water Framework Directive of the EU established even more specific quality targets for water bodies.
The objective of the Water Framework Directive is to prevent the decline in the status of surface waters and groundwater, guarantee a good status of waters by 2015, restrict the entry of harmful substances to waters, and reduce the damages caused by floods and drought. The Member States are obligated to ensure that these objec-tives are met in each water area. In Finland
the implementation of the Directive has been started and the Act on the Organi-sation of Water Management entered into force in the beginning of 2005. Finland is divided into eight water management ar-eas and detailed water management plans will be prepared for each of these. The first water management plans until 2015 will be submitted to the Government in 2009.
Water management and agriculture
Nutrient loading from agriculture is non-point source loading which consist of loading from over a million agricultural parcels with highly varied characteristics. Besides the physical characteristics, such as slope and soil type, the water loading from parcels depends on the weather conditions and farming practices. This means that as-sessing and steering the loading from ag-riculture is quite a complex matter. In Fin-land, the calculation of loading is found-ed on a monitoring system established in 1957 which has since then been developed to make it better suited for the monitoring of nutrient loading. At present, the system covers 253 sites, 211 lakes and 5 artificial lakes, and it will be further developed to take the ecological properties better into account, as set down in the Directive.
According to the Directive, the assess-ment of the status of waters takes place by comparing the current sta-tus with an estimated natural state. Hardly any water bodies in farming areas are close to the natural state, but eutrophication is clearly a more serious problem in waters that suffer from agricultural loads. Because the annual variation in the loading due to the weather conditions is great, the role of agriculture is estimated on the basis of average loading. On the ba-sis of small catchment areas in farm-ing regions, it seems that there has been no significant decrease in nu-trient loading, when we look at the
Use of fertilizers (kg/ha). Source: Information Centre of the Ministry of Agriculture and Forestry.
� � � � � � � � � � � � � � � � � � � �
�
� �
� � �
� � �
� � �
� � �
" � � � �
# � � � � �
$ � � � % � � � � �
$ � � � � � � &

73
trend that is independent of runoff. Be-cause of the variation in the hydrological conditions, it is useful to examine the load-ing potential, which does not depend on the natural conditions. This shows more clearly the impact of factors such as annual fertilisation, nutrients fixed in the soil, and plant cover.
As fertilisation is one of the principal factors of nutrient loading, it is also used as an indicator of the loading potential. In 1995–2006, the fertiliser sales per hectare of cultivated land decreased from 92.3 kg to 73.9 kg for nitrogen and from 16.1 kg to 8.6 kg for phosphorus. This did not lead to a corresponding reduction in the yields per hectare. Thus the trend is de-sirable considering both the efforts to re-duce nutrient loading and the profitability of agriculture. However, we should bear in mind that the average per hectare may hide highly varied quantities of fertilisers, whose loading potential may be manifold in parcels that are susceptible to erosion. Certain risk areas load the waters much more than the average. In Finland, 90% of the loading occurs outside the grow-ing season, which means that it is impor-tant to consider what happens between the harvesting and sowing. The trend is also right in this respect, because the agri-envi-ronmental support scheme and legislation have increased plant cover, which reduces erosion, and less manure is spread on the lands in the autumn.
In the new programming period 2007–2013, the agri-environmental sup-port scheme is quite similar to that in the previous period and water protection tar-gets are set for specific water bodies. Thus, we can well expect that the current trend in the loading potential will not be sufficient to reach a good status in all water bodies
by 2015. Especially as regards phospho-rus, the soil reacts very slowly to changes and even significant reductions in the an-nual nutrient balance are not immediately reflected in the loading. The growing unit size and concentration of livestock produc-tion make it difficult to meet the objectives in certain regions. Transporting manure is costly and the decisions on spreading are often made based on the lowest price or the nitrogen content, which means that phosphorus levels may be too high for the plants and the loading potential increases. The pressure to improve the profitability of agriculture pushes towards more effi-cient production and larger units. A new threat to water quality is climate change which is expected to increase precipitation especially outside the growing season.
Work to meet these challenges is be-ing done through the regional water man-agement plans as well as inputs in the re-search and development concerning envi-ronmental regulation in general. Econom-ic studies become increasingly important when the available instruments need to be ranked and the reasoning is explained in the EU and other contexts on the basis of the costs and benefits involved. According to Article 9 of the Water Framework Di-rective, the Member States must apply the polluter pays principle and ensure that dif-ferent sectors, including agriculture, bear their share of the costs of water manage-ment and services. The position of agricul-ture is challenging. Thanks to the exten-sive application of the agri-environmental support scheme in Finland, the costs to be borne by the sector are quite minimal, but the allocation of the costs within the sector is difficult due to, for example, the great variation in the loading potential.

74
Biogas opportunities on Finnish farms
Esa Aro-Heinilä
It is the smell of money, said the late Grandma, proud of her dunghill. Since then some piglets in the backyard has changed into production units with hundreds of pigs. Which means that, if there still is a smell, it is a huge environmental problem, besides meaning that money’s worth of energy releases its odour and evaporates into the air.
Bad smell tells about poor manure treatment and unutilised potential. The gas that evaporates into the air is biogas created in the process where microbes decom-pose organic matter in anaerobic conditions. Of the gas produced from animal ma-nure or other organic matter in a biogas plant, 50–60% is methane (CH4), which is cleanly burning gas. Purified biogas, which corresponds to fossil natural gas, is called biomethane. Biogas can be used for electricity and heat production and, when refined into biomethane, as fuel for machines and transportation.
Besides providing excellent fuel, biogas is a strong greenhouse gas. The climate-warming effect of methane contained in biogas is 20 times that of carbon dioxide. When methane burns it oxidises into carbon dioxide and water. The utilisation of biogas reduces the climate-warming effect of manure or other organic material. In a biogas plant the waste is hygienised and the nitrogen compounds contained in the decompos-ing material are converted into ammonium, into a form that the plants can utilise.
In many parts of the world biogas production is already well known and relatively common. The number of biogas reactors in China is estimated at about 7 million and in India there are about 3 million reactors. However, most of these are simple holes in the ground, coated with bricks, concrete or clay, from which the gas is led to be used as energy for e.g. cooking. Germany is the leading biogas producer in Europe, and there are more than 2,000 reactors on German farms.
In Finland biogas production is getting started, but some more time and financial support will be needed before the technology is in wide use. Building an efficient and automated biogas plant, even on the farm scale, is an investment that costs hundreds of thousands of euros. Besides capital, the construction and use of a biogas plants re-quires special knowledge and skills, and the operators need to be trained. Decompos-ing of manure is not enough to reach profitable business operations, but this calls for the ability to manage several different income sources.
Energy production
Technically the easiest way of utilising biogas is as source of heat. This is already com-mon elsewhere in the world, but still quite rare in Finland. In Finland the production cost of biogas as primary energy varies between 30 and 70 €/MWh, depending on the technology of the plant and the material decomposed. Thus in heating biogas is competitive only as regards fuel oil. One problem in the use of biogas is that the heat produced must be utilised evenly, independent of the weather conditions. Biogas is produced all the time when the plant is in operation, adjusting the plant is slow, and it is difficult to store the gas for more than a few days.
The production of electricity into the network allows the utilisation of biogas ener-gy in more variable conditions as well. In the Nord Pool the average price for electricity of the past three years was 36 €/MWh, which does not cover the costs of producing electricity from biogas. The contribution margin is a little better if electricity can be

75
fed into the network during the daily price peaks (about 70 €/MWh) or used in con-nection with the plant e.g. in livestock buildings. On farms the cost of electricity from the network, excl. VAT, is 60–80 €/MWh. The advantage in the use of electricity on the farm itself is that there are no electricity transmission charges to be paid. However, the only way of making the operations of a plant that produces only electricity and heat appear profitable is to compare it with the most expensive forms of producing electricity and heat.
The use of biomethane purified from biogas as biofuel for transportation would be an attractive alternative, both financially and for environmental reasons. However, this will be restricted for many years to come by the lack of suitable vehicles and methane distribution infrastructure. The spread of natural gas stations obviously promotes the utilisation of methane in transportation.
Biomethane is characteristically a local fuel, because its transportation and storage requires a lot of space and is quite expensive. This problem is also an advantage: it is very unlikely that biomethane would be imported from other countries. The produc-tion of biomethane does not involve similar environmental and social problems as the production of other biofuels for transportation, i.e. palm oil diesel and sugar cane ethanol.
In the future biomethane could be one of the services produced by the rural areas. In the densely populated regions the methane used for transportation would very likely be based on natural gas, but in areas outside the natural gas network methane could be produced by the local farmers. It should be kept in mind, however, that the prof-itability of methane in transportation is based on taxation alone. The excise tax and strategic stockpile fee of methane is only 1.9 €/MWh, while the tax and fee for diesel oil is 32.8 €/MWH and for petrol this is 66.1 €/MWh. More equal taxation of the different types of fuel for transportation would very easily make the use of biogas for transportation completely unprofitable.
Environmental services
By far the most productive income source for biogas plants are the gate charges ob-tained for treating sludge and biowaste from industrial plants and communities. Typi-cally the gate charge is 40–100 €/t, depending on the material and location. At this price level the operations of biogas stations are quite profitable. For example, if 20% of the biomaterial flow of a plant consists of community sludge (gate charge 50 €/t) and the rest is liquid manure, the gate charges represent more than 80% of the income of the plant, while less than 20% comes from the sale of electricity and heat. One prob-lem in the waste treatment service is the quite confusing and undeveloped legislation on whether the processed material may be spread on arable land.
The reduction in the smell is a notable benefit derived from biogas production, but so far there are no markets for this (non-market product). As the size of the animal production units grows and they become more and more concentrated regionally, it is possible that a decomposing obligation will be added to the treatment of manure. This would also be beneficial as regards climate change and water protection. Biogas plants reduce the greenhouse gas emissions in Finland, which means that fewer emis-sion units under the Kyoto Protocol need to be purchased from abroad. Decomposing of material from outside the farm creates a return flow of nutrients to the arable land, which reduces the need for purchased nutrients and, in the long term, the nutrient loading of waters.

76
6. RURAL AND REGIONAL POLICY
Rural and regional development in the EU is founded on various policy programmes, which usually cover a seven-year program-ming period. The past couple of years were used for preparing for the next pro-gramming period 2007–2013. Work was done in different administrative levels and stakeholder groups from the EU to the local level. From the national perspective the most significant policy measures pre-pared for the next period were the Rural Development Programme for Mainland Finland, for which the EU funding comes from the European Agricultural Fund for Rural Development (EAFRD) and action
programmes for Structural Funds (prima-rily the European Regional Development Fund ERDF and European Social Fund ESF).
It is important to plan the action pro-grammes derived from the EU policies so that, besides the general objectives of the EU, they serve the special national rural and regional policy objectives as well as support rural and regional development measures that are not linked to the EU pro-grammes. The action programmes derived from the EU policies and national special programmes adopted by the Government must be reconciled so that the regional
Rural and regional policy framework for the programming period 2007–2013. Source: Ministry of Agriculture and Forestry.
� � � � � � � �
� � � � � �
� � � � � �
� � � � � � � � � � � � � � � � �
� � � � � � � � � � �
� � � � � � � � � !
� � � � � � � � � � " � � �
� � � � � � � !
� � � � � � � # � � � � � � � � � #
� � � � � � � � � � �
� � � � � � � �
� � � � � � � � � � � � �
� � � � � � � � � � � � � �� � � � � � � � �� � � � � � � � � � � �� � � � � � � � � � � � � � � � �� � � � � � �
� � � � � � � �
� � � � � �
� � � � � �
� � � � � � � � � � � $ % � � � � $ �
� � � � � � � � !
� � � � � � � # � � � � � � �
� � � � � �
� � � � � � � � � � � � � � � � � �
� � � � � � � � � � � � � #
� � & � # � � ' � � �
� � � � � �
� � � � � � � � � � � � � " � � � � � � �
� � � � � ( � � � � � � � �
� � � � � � � � � � �
� � � � � � � # � � � � � #
� � & � # � � ' � � � � � � � � � �
) � � � � � � � � � � � ( � �
' � � � � � � � � � � � � � � �
) � � � � � � � � � � � ( � � � � % � � � � � � � � " �
� ( � * � � � �
� � � � � � # � � � � � # �
� � & � # � � ' � � �
� � � � � ' ' �
+ , � � - � � � � � � � � $ !
# � � � # � � � � � #
� � & � # � � ' � � �
� � � � � ' ' �
, . � � � " � � � � " � � � � � � � � � � $ ! �
� � � � # � � � # � � � � � � � � � ' ' �
) � � � " � � � � � � � � � � � � � � � � � � � � � � �
) � � " � � � � � � � � � � ( � � � � % �
� � � � � � � � � � " / � � � � � � � � � �
� � � � � � # � � � � � � � � � � � � � ' ' �
) � � � � � � � � � � � � � � � � � � � � 0 � � 1 $
� � � � � � # � � � � � � � � ' ' �
� � � � � � # � � # � � 2
� � � � � � #
� � � � � ' ' �
3 4 4 5 ) 3 4 + 4 2
� � � � � � � � � � � � � � � � � � � $ � � ( �
� % � � � � � � � � � � � � � � � � � � � � $ � 6 ) � � � � � � #
� � & � # � � ' � � � �
� � � � � ' ' �
� � � � � � � � # � � � � �
� � � � � � # � � � � � � � � � � � � � � � � � ' ' � � � � � �
� � 6 � � � � � � � � � � � � � � ' � � � � � � � �
� � � � � � � � � # � � � � � � # � 6 ) � � � � � � # � 7 � # � � � #
������ ��''��3445)34+8
�����#� �&���'���
��� ��''��3445)34+4
��������(��9�����$������������)34+8!
:�$�������%������������������������"�!
� � � � � � #
� � � � � � � � � � � �
� � � � ' � � �
� � � � � � � � : / � � % � � � � � � � � � �
' � � � � � � � � � � � � � � � � � � �
� � � � 2 � � �
� � � � � � � � � � $ � " � � � � $ !
� � � � � � � � � � � ; � � � � � �� � � � � � � � � � � ; � � � � � � � � � � � � ' ' �
) � � � � � � � � � ( � � 9 � � � � � $ � � � � � $ � � � $

77
special characteristics and needs are taken into account. This is why it is important to give special consideration to the different types of rural areas and their development when planning the policy measures for the programmes and assessing their impacts.
In Finland the rural and regional poli-cy is steered especially by the Rural Devel-opment Strategy, Structural Fund Strategy and Rural Policy Programme. The priority areas in the Rural Development Strategy are the practising of agriculture and for-estry in a manner that is economically and ecologically sustainable as well as ethical, development of business and enterprise in the rural regions, and reinforcing local ac-tion and initiative. The main goal of the Structural Fund Strategy is to strengthen competitiveness, employment and welfare, both nationally and regionally. The Rural Policy Programme aims to address the impacts of decisions made in the different sectors of the society on the rural regions and reinforce cross-sectoral rural develop-ment actions.
This chapter starts by a description of the recent changes in the rural areas, i.e. the development trends in different types of rural areas and how these can be seen in practice. This is followed by a brief discus-sion of the measures under the most sig-nificant EU policy programmes and an as-
sessment of their impacts on the future de-velopment of the rural areas. To conclude, we shall consider the challenges for rural and regional policy as regards the content of the EU policy programmes and how well the different policy programmes work together in support of the rural areas.
6.1. Typology of rural areas
and their development
Finnish rural areas have faced quite dra-matic changes in the past decades. In the 1990s the migration within the country again reached the high levels last seen in the 1970s, leading to depopulation of the countryside and growth of population cen-tres. In the 2000s, however, the concentra-tion of the population has slowed down. The whole country suffered from mass un-employment after the exceptionally deep depression in the early 1990s. Recovering from the depression was particularly dif-ficult in the rural areas.
The reduction in the number of farms and jobs in primary production as a re-sult of the structural change in agriculture highlights the role of other rural industries as regards employment in the countryside. Urban-adjacent rural areas have been able to respond to the structural changes in the
society quite well. The disappearance of jobs in primary production has been compensated for by the growth of the processing and especially serv-ice sectors in a way that has not been possible in the other types of rural areas. Sparse population poses great challenges for regional development, because the regional economies are weak and there is little demand for either products or services. It is dif-ficult to develop and diversify the in-dustries and ensure the basic services.
In Finnish rural policy the rural areas are usually divided into three types, based on a multi-stage method
Number of jobs in 1995–2004. Source: Statistics Fin-land.
60
70
80
90
100
110
120
130
95 96 97 98 99 00 01 02 03 04e
Index, 1995=100
Urban areaUrban-adjacent rural area Rural heartland areaSparsely populated rural areaWhole country

78
Typology of Finnish rural areas in 2006. Source: Kajaani Research and Development Cen-tre of the University of Oulu and Finnish Area Research FAR.
where the classification depends on vari-ables indicating how rural the area is and where the jobs are located, as well as the structure of the region and its industries, economy of farming and farm forestry, and problems and challenges in their develop-ment. The analysis made for the classifica-tion of rural areas may be considered to reflect the socio-economic status and de-velopment so well that the typology can be used for the targeting and differentiation of various kinds of development measures, especially the rural and regional policy.
Compared to the other parts of Eu-rope, Finland is a very sparsely populated country, where the share of the rural pop-ulation is very high. In 2005 more than 1.3 million Finns lived in municipalities located in the rural heartland areas and sparsely populated rural areas. This is why the rural development policies and actions are particularly important in Finland. In 2005, the 432 Finnish municipalities were distributed as follows: 58 urban munici-palities, 89 urban-adjacent municipalities, 142 municipalities representing the rural heartland areas and 143 municipalities in the sparsely populated rural areas.
Most of the municipalities in sparsely populated rural areas are located in east-ern and northern Finland as well as certain parts of central Finland and the west coast. Municipalities representing rural heart-land areas are in southern and western parts of the country. Most of the urban-adjacent municipalities are in southern Finland. If the coalitions of municipalities are not taken into account, compared to the classification of municipalities in 2000 the number of municipalities in the rural heartland areas has decreased consider-ably, while the number of urban-adjacent municipalities and especially the sparsely populated municipalities has grown. This reflects the increasing differentiation of the rural development trends and the divi-sion of municipalities and areas into win-ners and losers.
Based on the socio-economic situa-tion and development, the challenges for regional development measured by all in-dicators are obviously the greatest in the sparsely populated rural areas. Compared to the average of the whole country there are considerable challenges in the develop-ment of the rural heartland areas as well. Instead, in the urban-adjacent rural areas the situation and development is far more positive in the light of the socio-econom-ic indicators. Thus perceiving the whole countryside as the same type of area may give a very wrong picture of the opportu-nities for rural development. Based on the socio-economic indicators, urban-adjacent rural areas are more similar to urban areas than to rural heartland areas or sparsely populated rural areas. The differences in the trends between two kinds of rural areas are very clear, and they are still growing. This means that the population of the rural
Urban area (58)Urban-adjacent rural area (89)Rural heartland area (142)Sparsely populated rural area (143)

79
heartland areas and sparsely populated ru-ral areas will continue to decrease as espe-cially the young and working-age people move to population centres.
6.2. Rural Development
Programme for Mainland
Finland
The Rural Development Programme for Mainland Finland is the most important policy instrument for the rural develop-ment work. The Programme defines the operative content for the EU and national rural development objectives by focusing on three key areas: food economy, envi-ronment, and rural economy and popula-tion.
The four axes of the Programme are: 1) improving the competitiveness of the agricultural and forestry sector; 2) improving the environment and the countryside; 3) quality of life in the ru-ral areas and diversification of the rural economy and 4) Leader. The envisaged total funding for the programming period 2007–2013 is € 6.6 bill., of which the EU contributes 31%, i.e. € 2.1 bill. The total funding is somewhat lower than in the previous programming period because the EU contribution is now smaller and this could not be fully compensated for by means of national funding. However, the new Rural Development Programme dif-fers from the Horizontal Rural Develop-ment Programme 2000–2006 as regards both the structure of the programme and content of the measures, which means that the financial frameworks are not directly comparable with each other. In the new Programme the share of private funding is € 770 mill., and thus the total funding available for the whole programming peri-od is € 7.4 bill. In axis 2 there is no private funding framework.
Axis 1 aims to improve the competi-tiveness of agriculture and forestry by
developing the profitability of the main production sectors, preventing the dete-rioration of the age structure of farmers by means of support for the structural development of family holdings, and pro-moting the diversification of agriculture and holdings. The objectives also include improving the competitiveness of SMEs processing agricultural and natural prod-ucts and developing the production and use of bioenergy. Farmers’ business man-agement skills, environmental awareness and awareness of animal welfare should be improved. Of the EU funding available for axis 1 at least 50% will be allocated for structural development of agriculture and 4% for utilisation of research and pro-moting innovation aimed to develop, in particular, the food, wood and bioenergy sectors. To reach the objectives of the Pro-gramme, a significant share of actions un-der axis 1 will be funded nationally, either as additional national support under the Programme or from external sources.
Axis 2 enhances the status of the en-vironment and rural areas by maintaining open farming landscapes, reducing envi-ronmental load from agriculture, prevent-ing climate change and preserving the bio-logical diversity of farming and forestry environments. The measures to achieve this are the natural handicap payments, agri-environment payments, animal wel-fare payments and non-productive invest-ments. Axis 2 accounts for a major share of the funding for the Programme. Of the EU contribution available for reaching the objectives of axis 2 the minimum of 50% will be allocated to natural handicap pay-ments and the minimum of 30% to agri-environment payments. Funds derived from the modulation of direct agricultural support will be allocated to agri-environ-ment payments.
As regards the comprehensive devel-opment of the rural areas the main instru-ment is axis 3, which aims to improve the quality of life in rural areas and diversify

80
the rural economies by slowing down the decline of the population in sparsely popu-lated rural areas and rural heartland areas, increasing the number of enterprises and jobs in the rural areas, reinforcing the share of women and the young in busi-ness activities, promoting the utilisation of innovation and product development to create employment opportunities in the rural areas, increasing know-how in entre-preneurship and information and other technologies, and making the rural areas increasingly attractive places of residence and for leisure activities.
The measures used in axis 3 are the ex-tension of economic activities outside agri-culture, support for the setting up and de-velopment of enterprises, promoting tour-ism, basic services for industries and rural population, restoration and development of villages, preservation and promotion of rural heritage, and training and communi-cation. These measures support especially the priority objectives of the EU regard-ing the creation of conditions for growth and improving employment. In Finland the Leader methodology (axis 4) will play a major role in reaching the objectives of axis 3. Of the EU contribution available for axis 3 the minimum of 50% will be allocated to the creation of employment opportunities and the minimum of 25% to promoting living and quality of life in the rural areas.
Axis 4, i.e. the Leader methodology, implements strategic and systematic rural development which, in accordance with the bottom-up principle, is founded on the local needs and which produces solutions targeted to specific rural areas for improv-ing the opportunities for employment and earning one’s living. The Leader method-ology is being applied in the whole coun-try and in all axes. The aim of the meth-odology is to bring together and activate new people and actor groups to rural de-velopment work and communicate about the development possibilities, develop the
cooperation between the civic society and public administration and increase cooper-ation between various actors and networks in the local, regional, national and interna-tional context. Of the Community funding for axis 4 the maximum of 20% will be allocated for activation and acquisition of skills on the local level (so-called operative fund) and the maximum of 80% will be allocated for the implementation of local development strategies.
The Ministry of Agriculture and For-estry is responsible for the administration of the Rural Development Programme and for the activity of the paying agency. Depending on the axis and measure, the parties involved in the implementation of measures may be the Rural Departments of the Employment and Economic Devel-opment Centres, local action groups, mu-nicipal rural business authorities and Re-gional Environment Centres. A so-called Rural Network will be set up by means of Programme funding, with the task of sup-porting the Programme work by commu-nicating on the measures and its financing opportunities, organising training on ru-ral development and assisting the authori-ties in various ways. The Rural Network will comprise the authorities and NGOs involved in the implementation of the Programme, various rural development actors and research institutes working in the fields of agriculture and rural affairs.
6.3. ERDF action programmes
for main regions
Action programmes under the European Regional Development Fund (ERDF) have been drawn up for the main regions of southern, western, eastern and north-ern Finland, which are comprised of coali-tions of several regions. The Province of Åland has an ERDF action programme of its own. Axes common to all action pro-grammes are: 1) promotion of business

81
and enterprise with the aim of develop-ing the competitiveness and productiv-ity of enterprises, creating new jobs and preserving the existing jobs in a sustain-able manner; 2) promotion of innovation and networking in support of competence structures and clusters of expertise; 3) and reinforcing the structures of expertise and accessibility and operating environment of the regions, with the aim of strengthen-ing the competitiveness and attractiveness of the regions by improving the access to regions and services and the quality of the environment.
These axes comprise three of the four priorities of Finland’s Structural Fund Strategy, while one of these consists of the European Social Fund (ESF) Programme for Mainland Finland. Most of the funding under the ERDF is allocated to axes 1 and 2. In the ERDF programmes for southern and western Finland there is further axis concerning the development of large ur-ban areas. The programme for all main re-gions includes the thematic concentration of the measures, which in southern Fin-land constitutes an axis of its own (themes for main regions). The purpose of the the-matic concentration is to allocate the re-sources to the most significant measures as regards the development of regions as well as to take account of the special regional characteristics.
The total funding for the ERDF ac-tion programmes is about € 4,265 mill., of which the share of public funding is € 2,307 mill. The EU contributes € 1,098 mill. and the share of national public fund-ing is € 1,209 mill. Private funding is esti-mated at € 1,959 mill. Of the public fund-ing, € 345 mill. goes to southern Finland, 398 mill. to western Finland, 731 mill. to eastern Finland and 623 mill. to northern Finland. These figures include the special funding for eastern and northern Finland from the ERDF based on the sparse popu-lation, which is € 35 per resident, a total of € 359 mill. for the whole programming
period. Of this special funding, € 186 mill. goes to eastern Finland and € 173 mill. to northern Finland. The special funding compensates for the considerable decrease in the funds allocated to Finland from the Structural Funds. In eastern and especially in northern Finland the funding from the ERDF increases from the previous pro-gramming period.
Funding under the ERDF action pro-grammes for southern and western Fin-land is targeted to the most challenging and problematic areas (67%). Funds are also used for the themes for main regions (28%) and for large urban areas excluded from the challenging and problematic are-as (Helsinki, Turku, Tampere and Vaasa re-gions). Because of the diminishing financ-ing available through the Structural Funds and special position of sparsely populated regions, the funding for southern and western Finland decreases considerably from the previous programming period.
The principle in reconciling the ERDF action programmes with the Rural Devel-opment Programme for Mainland Fin-land is that all development measures that are linked to farms are funded under the Rural Development Programme. The ac-tions under the ERDF support and com-plement rural development especially in extensive measures of a regional or even broader scale as well as investments con-cerning the development of connections and infrastructure, living conditions of the residents, services and the environ-ment. Other important actions under the ERDF that support the diversification of rural economies are the development of services for business, research, coopera-tion and networking between actors, and encouraging the introduction of innova-tions whose impacts extend to the coun-tryside as well.
The measures are targeted especially to eastern and northern Finland, sparsely populated regions, and areas in southern and western Finland whose development
82
involves special socio-economic challeng-es. According to the typology of rural ar-eas, the focus is on sparsely populated mu-nicipalities, most of which are located in eastern and northern Finland. In southern and western Finland support is targeted to areas identified as particularly challenging, i.e. mainly municipalities in sparsely popu-lated rural areas and rural heartland areas.
6.4. ESF Programme for
Mainland Finland
In the ESF (European Social Fund) Pro-gramme for 2007–2013 the focus is on improving employment and compe-tence, development of working life and promoting business and enterprise. The programme document consists of various kinds of measures that aim to respond to the most significant national development trends in the employment, industrial and education policy.
The ESF Programme for Mainland Finland is divided into a national and re-gion section, i.e. the ESF programmes for southern, western, northern and eastern Finland. The Province of Åland has a pro-gramme of its own. The envisaged total funding under the ESF Programme for Mainland Finland in the programming pe-riod 2007–2013 is € 1.4 bill., of which the EU contributes € 615 mill. and the share of national funding is € 799 mill. The private sector will also contribute to the financing of the ESF projects, but these amounts have not been estimated as yet. In the new programming period the fund-ing under the ESF will be considerably, i.e. even a third, lower than in the previous programming period.
The public funding for the national section of the ESF Programme is about 545 mill., of which the EU contributes about € 218 mill. The regional sections, i.e. the ESF programmes for southern, western, northern and eastern Finland, are
founded on the key areas of the national strategy and the specific development needs of the regions. The national section is implemented in all parts of Finland ex-cept for eastern Finland, but eastern Fin-land may also participate in the national development programmes within its own financial framework. The public funding for eastern Finland totals € 360 mill., of which the EU contributes € 180 mill. The total public funding for the other parts of Finland is € 510 mill., of which € 218 mill. comes from the EU.
The ESF Programme for Mainland Finland complements the national policy and development programmes. The Pro-gramme consists of four axes, which are implemented nationally and regionally in accordance with the strategy of the ESF. The axes are: 1) development of working organisations, employed labour force and businesses, and increasing entrepreneur-ship (31% of total funding); 2) promot-ing employment and staying in the labour market and preventing exclusion (32% of total funding); 3) development of knowl-edge, innovation and service systems that promote the functioning of the labour market (27% of total funding); and 4) cooperation between Member States and regions in ESF activities (6% of total fund-ing).
The ESF Programme covers the whole country and it may also be used to sup-port rural development. It complements the Rural Development Programme for Mainland Finland for 2007–2013 so that measures under the ESF may be used to improve the competence, occupational health and job satisfaction of entrepre-neurs and staff of rural businesses and the employment of rural residents. The divi-sion of the ESF Programme into the na-tional and regional section makes it possi-ble to address both the broad development challenges and specific regional problems. Eastern Finland has a special position as a convergence region, which means that

83
more funds will be allocated to its develop-ment than to the other main regions. The broad and ambitious objectives combined with the significant reduction in the ESF funding make the successful implementa-tion of the Programme a very challenging task.
6.5. Challenges for rural and
regional policy
During the programming period 2007–2013 the main challenge for rural devel-opment will be the unbalanced financing structure of Rural Development Pro-gramme for Mainland Finland regarding
the different axes. Of the total public fund-ing more than 80% will be used for natural handicap payments and agri-environment payments (axis 2), which cannot be con-sidered to represent truly future oriented rural development. Obviously, the natural handicap payments and agri-environment payments are highly significant for the continuation of agricultural production and maintaining the basic population in the rural areas, but rural development founded on agricultural support will not solve the problems of sparsely populated rural areas and rural heartland areas. Be-cause of the high share of natural handicap payments and agri-environment payments the financing will not be distributed in the
Distribution of the envisaged total public funding for the Rural Development Programme for Mainland Finland (RDPMF), ERDF action programmes for the main regions and ESF Programme for Mainland Finland according to axes (2007–2013).
Programmes/axis or the like
Public funding total, € mill.
EU contribution, € mill.
EU contribution,%
Share of axis orthe like in total
public funding, %RDPMF/Axis 1 504 227 45 7.6RDPMF/Axis 2 5,406 1,514 28 81.6RDPMF/Axis 3 433 195 45 6.5RDPMF/Axis 4 242 109 45 3.7RDPMF/Technical assistance
40 18 45 0.6
Total 6,626 2,062 31 100.0
ERDF/Axis 1 758 356 47 36.1ERDF/Axis 2 725 339 47 34.6ERDF/Axis 3 409 190 46 19.5ERDF/Urban section 34 13 40 1.6ERDF/Themes for main regions
94 37 40 4.5
ERDF/Technical assistance
78 39 50 3.7
Total 2,097 974 46 100.0
ESF/Axis 1 443 195 44 31.4ESF/Axis 2 448 193 43 31.7ESF/Axis 3 380 167 44 26.9ESF/Axis 4 86 37 43 6.1ESF/TTechnical assistance
57 25 43 4.0
Total 1,414 615 44 100.0

84
best possible way from the perspective of regionally balanced development.
Another great challenge in solving the problems in municipal funding is that in the new programming period the munici-palities are expected to contribute more to the project funding. This places the municipalities in an unequal position, be-cause it will be difficult for the municipali-ties whose economy is weak to finance the projects, and they may even be completely excluded from the project activities. The implementation of regional and cross-re-gional projects may also be more difficult than before, because the municipalities will very likely direct their funding share to concrete projects that are physically close and contribute to the employment of the region.
Because of the decrease in funding under Structural Funds in general and special position of the sparsely populated areas, the funding available for southern and western Finland will be considerably reduced from the previous period. This is a major challenge for rural development, because there are municipalities represent-ing especially the rural heartland areas that are faced with serious challenges also in southern and western Finland. The addi-tional special funding from the ERDF alle-viates the situation of eastern and northern Finland to some extent, but the challenges for regional development in the sparsely populated rural municipalities are also far greater than in the other parts of the country.
The European Commission aims to simplify the rural development instru-ments so that rural development would be managed according to the “one-stop scheme”, i.e. through the EAFRD, more clearly than before. The idea is that the ru-ral development challenges and problems will mainly be addressed through the EA-FRD. However, a certain lack of clarity in the linkages between the Structural Funds and EAFRD will continue to be a prob-lem. For example, in the programme doc-uments of the ERDF action programmes, the rural dimension does not stand out as it should, which is why the connection to the Rural Development Programme for Mainland Finland is not very clear. At this stage it is difficult to assess how seam-lessly the measures under the Rural Devel-opment Programme will be linked to the ERDF and ESF programmes and how the reconciliation will be carried out in the dif-ferent axes.
It seems that the rural development in-struments available for the programming period 2007–2013 will not be sufficient to stop the division of rural areas into win-ners and losers. The winners will be the municipalities located in urban-adjacent rural areas and the losers will be in the sparsely populated areas. In certain mu-nicipalities in the rural heartland areas the socio-economic development prospects are quite positive, but many of these are threatened by a decline towards the cate-gory of sparsely populated municipalities.

85
Diversifi ed farms – junction for the development of agriculture and countryside
Hilkka Vihinen1 and Kari Mikko Vesala2
Finnish countryside can no longer depend on agriculture alone, but agriculture is still one of the main elements in the economic and operational framework of the rural ar-eas. Farms engaged in both primary agricultural production and some other business activity are called diversified farm enterprises. In 2005 there were altogether 24,300 diversified farms in Finland, which means that more than a third (35%) of the active Finnish farms practice some other business besides agriculture. The types of activities vary considerably between farms, but in most cases they represent a significant share of the return of the whole farm enterprise. In England almost every tenth farm practices only some other business than conventional primary production. In Finland, too, the diversification of farms could be more clearly put forward as one priority area in the rural and agricultural policy.
Today the diversified farms are a living proof of the fact that farms need not focus only on agriculture, especially primary production. As a cultural concept and financial entity, a farm should no longer be associated only and simply with agriculture.
Diversified farm business is one practical way of responding to the structural change in agriculture. Preparing for the programming period after 2013 will very likely involve at least three major policy issues with significant impacts on agriculture. The export re-funds of the EU are being abolished, which causes difficulties especially in the Finnish dairy sector. The dismantling of the production quotas increases the pressures to move milk production to more favourable regions. And third, it will be increasingly difficult to get through any special arrangements for individual EU Member States. Structural change in agriculture has both economic and social dimensions – both of these merit careful examination. Changes in agriculture are linked to the operating conditions of the whole food sectors and its internationalisation process, but the other question is, how the farmers and farms are going to change. Diversified farm entrepreneurship is one indication of this transition process.
Diversifi ed farms are small rural enterprises
As regards the viability of the socio-economic structure of the rural areas, the small enterprises have a very special function, because their activity is strongly integrated in the social relationships and structures of the countryside, which means that they also make a significant contribution to social cohesion. From this perspective not only the growing businesses but also the enterprises that provide services and jobs are impor-tant in the countryside. The important role of small enterprises makes them an impor-tant instrument for rural development policy in general, not only for employment and economic growth.
The structure of small rural enterprises has often been considered to depend on primary production, with less emphasis on employment and economic growth. The problems of the rural areas, such as long distances and small local markets, become even more apparent as a result of the decline in farming population and migration to population centres. However, we should be cautious about perceiving the structural

86
change in the rural areas as just negative decline to which we have to adjust within the framework dictated by the macro-level political guidance and concentrated mar-ket forces. The changes can also be viewed as new opportunities, and we should focus more on identifying and utilising these. This calls for entrepreneurship, a proactive approach where we are ready to search for new forms of business activity or reorient the conventional practices.
Tools for farm diversifi cation in agricultural and rural policy?
Farm entrepreneurship can be promoted in the context of developing small rural enter-prises in general. However, the diversification of farms seems to have been disregarded in the recent strategies for rural and agricultural policy.
One possible – albeit simplified – categorisation for promoting entrepreneurship is to distinguish the measures targeted to an individual entrepreneur or company from measures relating to the environments functioning as the enabling structures for indi-viduals and companies. The enabling structures for entrepreneurship vary considerably by region, which means that they should be taken into account in promoting rural en-trepreneurship. The promotion policy may also be founded on efforts to support and further the creating and strengthening of environments based on the identification and utilisation of strengths and opportunities relating to regions and sectors which enable and feed innovative business activities. Such environments may be company networks or clusters, or centres or clusters of expertise. From this perspective we are not con-cerned with activating an individual to becoming an entrepreneur, but with the activa-tion and creation of enabling structures which favour and further the entrepreneurship of individuals.
In the promotion of small rural enterprises the regional innovation policy has been linked to the development and concentration of regional strengths and expertise, which reflects the potential role of clusters of expertise and companies as the cornerstone of the innovation policy in the development of rural industries. Successful centres and clusters which already exist in the countryside indicate that various forms of support for establishing these or similar enabling structures that promote the setting up and development of small enterprises may be an appropriate approach in the rural areas as well.
In the first place the promotion of entrepreneurship in the rural areas can be seen in the development and activity launched and steered by the local actors, which differs from development determined from the macro level – such as is often the case in sup-porting basic agriculture. In an approach which highlights the local perspective, for example, the national policy offers legislative and financial frameworks for promoting entrepreneurship, but makes no practical decisions on this. In most rural regions such strategic thinking about the development of small enterprises is still lacking. Especially extending the diversification of farms to new sectors, such as bioenergy or care services, could benefit a great deal from inputs in the analysis and goal-oriented promotion of the enabling structures for business activities included in the innovation policy, in ad-dition to the promotion of individual enterprises.
1 MTT Economic Research2 University of Helsinki, Department of Social Psychology

87
Sources
AC Nielsen. Press releases.C.A.P. Monitor. A continuously up-dated information service on the CAP of the EU. Agra Eu-
rope.Compendium of Laws and Statues.Confederation of Finnish Industries, EK. Available at: http://www.ek.fi. Equine Information Centre.Eurostat. Luxembourg.Forsman-Hugg, S., Paananen, J., Isoniemi, M., Pesonen, I., Mäkelä, J., Jakosuo, K. & Kurppa, S.
2006. Laatu- ja vastuunäkemyksiä elintarvikeketjussa. Maa- ja elintarviketalous 83. Helsinki: MTT.
Finfood. Available at: http://www.finfood.fi. Finnish Food and Drinks Industries’ Federation. Annual report 2004 and 2005.Finnish Forest Reseach Institute. Finnish Statistical Yearbook of Forestry.Finnish Riders’ Association. Statistics.Finnish Trotting and Breeding Association. Statistics.Gallup Food and Farm Facts. Statistics, market surveys, consumption and production forecasts.Information Centre of the Ministry of Agriculture and Forestry. Farm Register, Yearbook of Farm
Statistics, Monthly Review of Agricultural Statistics, Grain bulletin, Hanke 2000 -register.Maaseudun Tulevaisuus -newspaper.Maaseutupoliittinen erityisohjelma 2007-2010, Maaseutupolitiikan yhteisryhmä YTR. Available
at: http://www.maaseutupolitiikka.fi.Malinen, P., Kytölä, L., Keränen, H. & Keränen, R. 2006. Suomen maaseututyypit 2006. Maa- ja
metsätalousministeriö 7/2006. Helsinki: MMM. Ministry of Agriculture and Forestry. Available at: http://www.mmm.fiMinistry of Finance. Economic Survey: January 2007.Ministry of the Interior. Available at: http://www.intermin.fi.Ministry of Labour. Manner-Suomen ESR-ohjelma-asiakirjaesitys 2007-2013. Available at: http://
www.mol.fi.Ministry of Trade and Industry. Toimialaraportit, Toimiala-Infomedia. Available at: http://www.
toimialaraportit.fiNational Board of Customs. Foreign trade statistics.National Consumer Research Centre. Available at: http://www.kuluttajatutkimuskeskus.fi/National Land Survey of Finland. The market price register of real estates.OECD Agricultural OutlookReindeer Herders’ Association. Statistics.Suomen elintarviketalouden laatustrategia ja -tavoitteet. Available at: http://www.laatuketju.fi.State budget 2007. Statistics Finland. National Accounts, Consumer price statistics, Income and Tax Statistics of Ag-
riculture and Forestry, Income Distribution Statistics, Statistical Yearbook of Finland, Register of Enterprises and Establishments.
Statistics of the Agricultural Economics Research Institute. Helsinki.Statistics of the Finnish Fur Farmers Association. Helsinki.Statistics of the Finnish Game and Fisheries Research Institute. Helsinki.Statistics of the Finnish Meteorological Institute. Helsinki.Statistics of the Glasshouse Growers’ Association. Helsinki.Statistics of Kasvistieto Ltd. Helsinki.Statistics of Kemira Agro Ltd. Helsinki.Statistics of the Plant Production Inspection Centre. Helsinki.Statistics of the Theme group for rural holidays. Helsinki.Village Action Association of Finland. Suomen Kylätoiminta ry. Available: http://www.maaseutu-
plus.fi.

88
Producer price index and index of purchase prices of means of agricultural production (2000=100).1
Producer price The index of purchase prices of means agricultural productionindex of Total Goods and Investments Buildings
agriculture2 index services
2006 101.9e 116.1 113.7 121.6 120.5
2005 98.9 110.8 108.2 116.8 114.02004 101.5 107.1 105.1 111.8 109.52003 99.0 104.2 102.5 108.1 106.32002 103.7 102.8 101.5 105.5 104.62001 105.2 102.2 101.8 103.1 102.42000 100.0 100.0 100.0 100.0 100.01999 96.6 95.0 94.2 97.2 96.41998 101.3 96.2 96.4 95.1 95.11997 102.5 97.5 98.4 94.0 93.71996 108.1 95.6 96.4 92.5 89.71995 103.6 94.2 94.6 92.3 90.5
1Indices are based on EU classifications.2Incl. fur production.
Source: Statistics Finland.
Structural change in agiculture.
Number1 Average1 Number of Employed in agriculture2
of farms size of farms, milk suppliers 1,000 % of1,000 hectares 1,000 persons employed
2006 69 33.3 15 91 3.7
2005 70 33.0 16 93 3.92004 72 31.5 17 93 3.92003 74 30.6 18 99 4.22002 75 30.0 19 106 4.52001 77 29.1 21 112 4.72000 80 28.0 22 118 5.11999 .. .. 24 121 5.31998 88 25.0 26 120 5.41997 90 24.0 28 130 6.01996 94 22.9 30 133 6.31995 100 21.7 32 141 6.71994 115 19.2 34 153 7.41993 116 18.8 35 154 7.41992 121 18.1 36 166 7.51991 126 17.7 40 177 7.51990 129 17.3 45 183 7.3
1A farm refers to a unit with more than 1 ha of arable land that practises agriculture or other entrepreneurial activity.
Sources: Information Centre of the Ministry of Agriculture and Forestry, Ministry of Labour.

89
Number of animals in June and the average yield per cow.
Dairy cows Yield per cow Pigs Hens1,000 litres 1,000 1,000
20061 309 7,646 1,436 3,103
20051 319 7,505 1,401 3,12820041 324 7,404 1,365 3,06920031 334 7,251 1,375 3,01620021 348 7,117 1,315 3,21220011 355 6,932 1,261 3,20220001 364 6,786 1,296 3,11019991 372 6,443 1,351 3,36119981 383 6,225 1,401 3,80219971 391 6,183 1,467 4,15219961 392 5,993 1,395 4,18419951 399 5,982 1,400 4,1791994 417 5,869 1,298 4,0901993 426 5,648 1,273 4,0251992 428 5,613 1,298 3,9691991 446 5,619 1,344 4,1381990 490 5,547 1,394 4,845
11.5.
Source: Information Centre of the Ministry of Agriculture and Forestry.
Sales of fertilizers, kg/ha and hectarage yield, f.u./ha.
Nitrogen Phosphorus Potassium F.u.yield(incl. straw)
kg/ha kg/ha kg/ha f.u./ha
2005–06 73.9 8.6 25.3 ..
2004–05 75.0 9.2 25.9 4,8261
2003–04 76.5 9.3 26.4 4,6301
2002–03 80.0 9.8 27.8 4,4781
2001–02 80.5 10.1 28.3 4,6921
2000–01 83.2 10.8 31.1 4,5311
1999–00 84.2 10.4 30.5 4,9001
1998–99 81.0 11.0 31.1 3,1461997–98 85.0 11.4 32.6 2,9801996–97 86.0 11.8 32.5 3,8161995–96 92.3 16.1 34.3 3,7361994–95 101.6 20.0 38.5 3,6551993–94 94.1 19.0 40.0 3,8101992–93 94.3 19.4 39.8 3,9121991–92 92.8 19.9 39.7 3,2691990–91 109.4 26.3 53.4 3,771
1 New feed unit coefficients.
Sources: Kemira, Information Centre of the Ministry of Agriculture and Forestry.

90
Total calculation of agriculture (excl. horticulture) at current prices, million euros.
2000 2001 2002 2003 2004 2005 2006e
CROP PRODUCTIONRye 7.2 7.7 7.1 6.1 5.1 3.4 3.2Wheat 45.6 52.3 48.9 55.2 54.6 53.3 50.9Barley 87.7 99.2 80.4 69.3 67.1 64.3 73.9Oats 50.1 72.1 56.3 45.5 36.9 33.5 31.9Potatoes 54.2 43.1 50.3 38.5 51.2 47.0 33.1Potatoes for processing 21.1 19.5 22.7 18.2 19.2 19.6 17.2Sugar beet 52.7 61.6 47.8 56.8 60.9 51.4 42.8Oil plants 13.6 21.7 22.2 19.8 13.2 18.7 26.7Other crop production 6.1 5.8 6.1 10.5 10.8 8.1 8.2Total 338.3 383.0 342.0 319.9 319.0 299.3 287.8
ANIMAL PRODUCTIONMilk 842.9 867.5 888.9 871.1 844.0 814.2 811.7Beef (excl. veal) 189.0 185.4 168.7 185.5 185.0 177.7 184.6Pork 224.1 261.1 255.9 229.7 246.1 261.6 262.0Mutton 1.1 1.0 1.2 1.1 1.3 1.3 1.4Poultry meat 72.7 92.0 104.2 110.2 111.1 104.5 100.9Eggs 44.7 40.5 45.4 42.4 41.8 34.9 35.4Other animal production 1.0 0.4 0.3 0.2 0.2 0.2 0.2Total 1,375.5 1,447.9 1,464.6 1,440.2 1,429.6 1,394.4 1,396.1
Gross return at market prices 1,713.8 1,830.9 1,806.6 1,760.1 1,748.6 1,693.7 1,683.9
COMPENSATIONS FOR CROP DAMAGES 28.1 1.2 4.0 2.7 2.7 19.6 1.0
INCOME FROM RENTSMeans of production 35.9 36.0 36.0 36.4 36.5 36.8 37.4Buildings and land 29.2 29.3 29.3 29.6 29.7 30.2 31.7Total 65.1 65.3 65.3 66.0 66.2 67.0 69.1
SUBSIDIES Single farm payment scheme 489.6CAP subsidy for fields crops 341.8 343.6 341.1 353.2 366.4 381.5 5.8CAP subsidy for livestock 39.9 78.5 87.7 93.8 88.1 142.3 51.1Other CAP payments 29.7LFA 414.5 418.4 422.1 419.4 420.2 418.3 417.1Environmental subsidies 266.9 274.6 277.4 283.8 290.3 284.1 289.9Subsidy for animal units (nordic subsidy) 97.3 100.5 102.0 105.3 114.1 99.7 99.3Subsidy of animal units (subs. of tr.period) 0.1 0.0 0.0 0.0 0.0 0.0 0.0Subs. for animals slaught. (subs. of tr.period) 0.1 0.0 0.0 0.0 0.0 0.0 0.0Other national subsidies for animals 83.1 78.8 79.6 80.0 78.9 65.1 59.5Subsidy for field area (subs. of tr.period) 0.1 0.0 0.0 0.0 0.0 0.0 0.0Other national subsidies for field areas 113.5 126.7 132.9 147.4 148.1 221.7 230.3Production subsidies - milk 219.1 215.7 230.4 211.5 228.0 185.5 162.9- sugar beet 2.1 0.0 0.0 0.0 0.0 0.0 0.0- potatoes (starch) 0.2 0.0 0.0 0.0 0.0 0.0 0.0
Subsidy paid by the common measures of the EU
1,063.0 1,115.1 1,128.4 1,150.1 1,165.0 1,226.2 1,283.2
National subsidies 515.6 521.7 544.9 544.2 569.1 572.0 551.9Total subsidies 1,578.6 1,636.8 1,673.3 1,691.6 1,734.1 1,798.2 1,835.1
GROSS RETURN TOTAL 3,385.6 3,534.2 3,549.2 3,520.5 3,551.6 3,578.4 3,589.1

91
Total calculation of agriculture (excl. horticulture) at current prices, million euros.
2000 2001 2002 2003 2004 2005 2006e
COSTSFertilizers 168.0 177.0 180.0 176.9 166.5 169.9 179.2Lime 30.3 29.4 32.5 22.8 20.0 21.2 24.5Feed concentrates- mixture 371.5 379.3 378.5 340.7 345.1 335.8 334.8- other 5.1 5.2 5.4 5.3 5.4 5.3 5.3Feed conserving chemicals 20.6 21.0 21.0 20.8 21.6 22.2 23.2Plant protection products 44.5 51.8 49.8 59.2 60.2 64.1 61.0Purchased seeds 39.1 42.0 41.0 46.9 57.5 60.4 54.7Fuel and lubricants 142.4 145.2 145.2 135.6 157.5 199.6 219.8Electricity 63.5 65.4 66.4 79.0 80.0 78.9 83.9Agricultural firewood and timber 10.9 11.2 11.2 7.5 7.5 7.6 7.7Delivery of calves and pigs 8.7 8.7 5.1 5.1 5.3 6.9 6.6Overhead costs 253.7 271.5 272.0 273.1 280.8 290.0 303.1Hired labor costs- wages 82.9 81.0 81.0 90.0 92.1 97.6 100.0- social expenses 57.4 56.1 54.6 60.8 63.2 66.8 68.6Machinery and equipment expenses- depreciations 340.6 344.8 354.8 366.1 381.3 402.2 417.4- maintenance 136.7 139.4 146.4 149.8 155.0 160.0 168.5Equipment 42.5 43.9 44.0 43.9 45.8 48.3 50.1Building expenses- depreciations 227.4 231.9 232.0 235.9 243.1 251.0 264.4- maintenance 40.0 40.8 41.6 42.6 43.5 44.9 46.6Ditches, bridges, etc.- depreciations 65.0 66.3 67.0 68.1 70.2 73.1 77.0- maintenance 20.3 21.1 21.1 21.6 22.1 23.0 23.9Interest payment 130.7 138.6 137.3 126.8 128.4 122.1 124.3Imports of animals 0.5 0.5 0.5 0.6 0.6 0.6 0.6Rent expenses- means of production 40.2 40.7 41.0 41.5 41.5 42.2 43.0- buildings and land 79.7 80.4 81.0 81.9 82.1 84.2 88.3Farmers' share of cost from- accident insurance payment 9.2 9.4 9.4 11.8 11.7 11.6 11.8- outside help 10.9 12.1 13.0 15.2 15.6 16.2 16.2- day-off scheme 2.9 3.5 3.8 4.4 5.2 5.5 6.0
TOTAL COSTS 2,445.3 2,518.1 2,536.4 2,533.9 2,608.8 2,710.8 2,810.0
FARM INCOME EXCL. HORTICULTURE 940.3 1,016.1 1,012.8 986.6 942.8 867.6 779.2

92
Gross return of horticulture at current prices, million euros.
2000 2001 2002 2003 2004 2005 2006e
FIELD PRODUCTIONVegetables 75.8 73.4 80.0 83.3 80.0 76.2 76.5Berries and fruits 32.3 28.5 37.0 39.2 37.2 35.6 34.0Others 18.5 18.5 20.2 20.2 21.2 21.2 21.2Total 126.6 120.4 137.2 142.7 138.4 133.0 131.7
GREENHOUSE PRODUCTIONOrnamental plants 90.1 89.7 110.1 99.6 104.8 96.6 96.4Vegetables 96.6 101.6 112.9 115.2 119.0 124.3 141.0Total 186.7 191.3 223.1 214.8 223.8 220.8 237.4
Gross return at market prices 313.2 311.8 360.3 357.5 362.2 353.8 369.1
SUBSIDIESSubsidies for greenhouses 40.7 40.9 40.5 40.3 40.1 40.1 39.1Subsidies for field production 2.5 2.5 2.0 1.9 2.0 2.0 2.0Other subsidies 11.2 10.5 7.9 11.4 11.8 11.9 14.9Total 54.3 53.9 50.4 53.6 53.9 54.0 56.0
GROSS RETURN TOTAL 367.6 365.7 410.7 411.1 416.1 407.8 425.1
COSTSFertilizers, lime 7.9 7.9 7.7 7.6 7.8 8.2 8.6Plant protection products 5.1 5.1 5.0 5.6 5.6 5.5 5.3Seeds, seedings, plants 14.4 14.5 14.1 13.6 13.4 13.9 14.7Other material 34.4 34.7 34.8 34.8 35.7 36.7 38.8Hired labor costs 73.1 74.5 69.7 65.2 74.7 75.9 75.9Fuel and lubricants 16.9 15.4 14.6 15.7 17.8 23.4 27.4Electricity 16.9 17.1 17.8 21.5 21.8 21.5 22.2Interests paid 15.4 16.4 15.2 15.2 14.5 13.5 12.9Depreciation of machinery 20.3 20.9 21.9 22.3 23.3 24.7 25.3Depreciation of buildings 19.7 20.3 20.7 21.0 21.7 22.5 23.7Depreciation of ditches, etc. 1.6 1.6 1.7 1.7 1.8 1.9 1.9Other costs 50.8 51.3 52.0 52.7 50.5 52.1 54.6
TOTAL COSTS 276.6 279.7 275.2 276.9 288.6 299.8 311.3
HORTICULTURAL INCOME 90.9 86.0 135.4 134.2 127.6 108.0 113.8
Total calculation of agriculture (incl. horticulture) at current prices, million euros.
2000 2001 2002 2003 2004 2005 2006e
RETURN ON AGRICULTURE 3,385.6 3,534.2 3,549.3 3,520.5 3,551.6 3,578.4 3,589.1RETURN ON HORTICULTURE 367.6 365.7 410.7 411.1 416.1 407.8 425.1RETURN, TOTAL 3,753.2 3,899.9 3,960.0 3,931.6 3,967.7 3,986.3 4,014.2
COSTS OF AGRICULTURE 2,445.3 2,518.1 2,536.4 2,533.9 2,608.8 2,710.8 2,810.0COSTS OF HORTICULTURE 276.6 279.7 275.2 276.9 288.6 299.8 311.3COSTS, TOTAL 2,721.9 2,797.8 2,811.6 2,810.8 2,897.3 3,010.6 3,121.3
AGRICULTURAL INCOME 1,031.3 1,102.1 1,148.3 1,120.7 1,070.4 975.6 893.0

93
Agricultural support*.
SUPPORT FINANCED COMPLETELY OR PARTLY BY THE EU IN 2006€/ha or €/unit
Aid area A B C1 C2 C2north C3 C4
DECOUPLED CAP PAYMENTS1, €/ha
Single farm payment scheme, €/ha, 246.6 195.8 195.8 152.7 152.7 152.7 152.7Farm specific top up for beef, €/livestock unit 63 63 63 63 63 63 63Farm specific top up for steer, €/livestock unit 45 45 45 45 45 45 45Farm specific top up for starch potato,€/tonne 17.69 17.69 17.69 17.69 17.69 17.69 17.69Farm specific top up for milk, €/tonne 24.49 24.49 24.49 24.49 24.49 24.49 24.49Farm specific top up for sugar beet, €//tonne 65.54 65.54 65.54 65.54 65.54 65.54 65.54
COUPLED CAP PAYMETS, €/LU
Special beef premium 157.5 157.5 157.5 157.5 157.5 157.5 157.5Special beef premium 200 200 200 200 200 200 200Ewe premium 10.5 10.5 10.5 10.5 10.5 10.5 10.5Slaughtered bull premium 80 80 80 80 80 80 80Slaughtered heifer premium 80 80 80 80 80 80 80
LFA SUPPORT,€/ha
LFA support2 150 200 200 210 210 210 210LFA supplement
- basic payment 20 20 20 25 25 25 25- additional payment for livestock farms3 80 80 80 80 80 80 80
ENVIRONMENTAL SUPPORT, €/ha Crop producing farm Livestock farm
Cereals, oil seed plants, protein crops, grass 107 130Horticulture (vegetables grown in the open etc.) 333 333Horticulture (berry and fruit plants etc.) 484 484Set-aside 0 0
* This appendix includes only the main agricultural products and therefore the list of various support measures is not complete.1 The producers are eligible for the decoupled CAP payments granted on the basis of historical reference quantities established for each producer.2 LFA supplement was cut because of the payment ceilings. In 2006 support was paid up to 94.7% of the maximum support per ha.3 In LFA support a livestock farm is a farm with a minimum stocking density of 0.4 LU/ha or at least 10 LU during the whole commitment period and minimum stocking density of 0.2 LU/ha.

94
2002 2003 2004 2005 2006 2007Unit €/unit €/unit €/unit €/unit €/unit €/unit
NATIONAL SUPPORT FOR AGRICULTURE AND HORTICULTURENATIONAL AID FOR SOUTHERN FINLAND, NORTHERN AID AND AID FOR CROP PRODUCTION
Aid per livestock unitAid for animal husbandry, suckler cowsA and B €/LU 65 63 133 86 83 79C1 €/LU 269 269 309 299 296 295C2 €/LU 269 269 309 299 296 295C2north. and archipelago €/LU 345 345 385 375 372 371C3 €/LU 420 420 460 450 447 446C4 €/LU 605 605 645 635 632 631Aid for animal husbandry, male bovines >6 monthsA and B €/LU 345 336 336 219 211 205C1 €/LU 412 412 477 415 417 414C2 €/LU 420 420 485 423 425 422C2north. and archipelago €/LU 496 496 561 499 501 498C3 €/LU 572 572 637 575 577 574C4 €/LU 757 757 822 760 762 759Aid for animal husbandry, ewes and goatsA and B €/LU 344 333 333 212 207 188C1 €/LU 412 412 482 404 399 390C2 €/LU 420 420 490 412 407 398C2north. and archipelago €/LU 496 496 566 488 483 474C3P1-P2 €/LU 824 824 894 816 811 935C3P3-P4 €/LU 925 925 995 917 912 1,049C4P4 €/LU 1,110 1,110 1,180 1,102 1,097 1,225C4P5 €/LU 1,110 1,110 1,180 1,102 1,097 1,225Aid for animal husbandry, pigsA and B €/LU 294 285 266 215 206 198C1 €/LU 306 297 278 296 284 284C2 €/LU 306 297 278 268 258 246C2north. and archipelago €/LU 387 378 359 308 300 290C3 €/LU 387 378 359 308 300 290C4 €/LU 387 378 359 308 300 290Aid for animal husbandry, hensA and B €/LU 283 275 257 207 203 201C1 €/LU 283 275 257 259 264 276C2 €/LU 286 278 260 238 242 240C2north. and archipelago €/LU 372 364 348 288 292 290C3 €/LU 439 431 413 355 359 357C4 €/LU 439 431 413 355 359 357Aid for animal husbandry, other poultry A and B €/LU 260 252 234 196 186 183C1 €/LU 260 252 234 243 242 251C2 €/LU 265 257 239 225 225 222C2north. and archipelago €/LU 352 344 326 277 278 275C3 €/LU 352 344 326 277 278 275C4 €/LU 352 344 326 277 278 275
Northern aid paid for slaughtered animalsMale bovines C3-C4P1-P2 €/animal 131 131 131 131 131 131P3-P4 €/animal 182 182 182 182 182 182P5 €/animal 333 333 333 333 333 333
- In 2007 livestock premiums for pig husbandry, chickens and other poultry will be paid for 73% of the production in area C1 and 85% of the production in area C2.- In 2007 livestock premiums for ewes and she-goats will be paid for 71% of the production in area C3 and 78% in area C4.

95
2002 2003 2004 2005 2006 2007Unit €/unit €/unit €/unit €/unit €/unit €/unit
HeifersA and B €/animal 111 108 150 119 121 120C1 €/animal 210 210 210 210 270 269C2 €/animal 210 210 210 210 270 269C2north. and archipelago €/animal 259 259 259 259 319 318C3 €/animal 301 301 301 301 361 360C4 €/animal 387 387 387 387 447 446
Production aid for milkA and B cents/l 6.0 5.8 5.6 3.0 3.1 3.0C1 cents/l 8.8 8.8 10.0 7.4 7.5 7.9C2 cents/l 9.4 9.4 10.6 8.0 8.1 8.6C2north. cents/l 10.7 10.7 11.9 9.3 9.4 9.6C3P1 cents/l 13.7 13.7 14.9 12.3 12.4 12.6C3P2 cents/l 15.4 15.4 16.6 14.0 14.1 14.3C3P3-P4 cents/l 18.0 18.0 19.2 16.6 16.7 16.9C4P4 cents/l 22.7 22.7 23.9 21.3 21.4 21.6C4P5 cents/l 31.9 31.9 33.1 30.5 30.6 30.8
Aid for crop productionA area1
Wheat €/ha 105 105 88–1153 88–1153 88–1053
Rye €/ha 160 160 110–1453 99–1293 98–1293
Malting barley €/ha 84 84 73–963 73–963 73–843
Feed grains €/ha 7 9 4–63 4–63 4–63
Grass2 €/ha 202 202 125–1643 98–1293 98–1293
Oil seed plants €/ha 143 143 108–1423 98–1293 98–1293
Sugar beet €/ha 202 202 125–1643 98–1293 98–1293
Starch potatoes €/ha 143 143 108–1423 98–1303 98–1293
Vegetables grown in the open €/ha 446 446 346–4253 333–3923 320–3923
B area1
Wheat €/ha 105 105 88–1153 88–1153 88–1053
Rye €/ha 143 143 110–1453 98–1293 98–1293
Malting barley €/ha 84 84 73–963 73–963 73–843
Feed grains €/ha 7 9 4–63 4–63 4–63
Grass2 €/ha 202 202 125–1643 98–1293 98–1293
Oil seed plants €/ha 143 143 108–1423 98–1293 98–1293
Sugar beet €/ha 202 202 125–1643 98–1293 98–1293
Starch potatoes €/ha 143 143 108–1423 98–1303 98–1293
Vegetables grown in the open €/ha 395 395 346–4253 333–3923 320–3923
C1 area1
Wheat €/ha 105 105 88 56 60 60Rye €/ha 135 135 112 112 112 112Malting barley €/ha 84 84 78 70 70 70Feed grains €/ha 7 9 0 0 0 0Grass2 €/ha 93 95 0 0 0 0Oil seed plants €/ha 140 140 115 100 100 100Sugar beet €/ha 202 250 197 185 185 80Starch potatoes €/ha 168 168 143 133 133 133
1 A and B area national aid for crop production, C area northern aid.2 Aid for forage grass is paid for farms with cattle, sheep, goats and horses. 3 Since 2004 the support for crop production has been paid as national supplement to environmental support. In 2007 the supplement
is paid only to farms which still have an environmental support contract of the period 2000–2006 in force.
- Support levels may be cut due to the ceilings set for the payments.

96
2002 2003 2004 2005 2006 2007Unit €/unit €/unit €/unit €/unit €/unit €/unit
C2 and C2north. areas1
Wheat €/ha 105 105 88 56 60 60Rye €/ha 135 135 112 112 112 112Malting barley €/ha 84 84 78 70 70 70Feed grains €/ha 7 9 0 0 0 0Grass2 €/ha 93 95 0 0 0 0Oil seed plants €/ha 67 67 42 27 27 0Sugar beet €/ha 202 250 197 185 185 80Starch potatoes €/ha 168 168 143 133 133 133C3 areaFeed grains €/ha 7 9 0 0 0 0Grass2 €/ha 93 95 0 0 0 0C4 areaFeed grains €/ha 7 9 0 0 0 0Grass2 €/ha 93 95 0 0 0 0
General area payment C2-C4Cereals and other arable cropsC2, C2north and archipelago €/ha 34 34 34 30 30 30C3 €/ha 50 50 50 46 46 46C4 €/ha 101 101 101 97 97 97Other cropsC2, C2north. and archipelago €/ha 34 34 34 35 35 35C3 €/ha 50 50 50 51 51 51C4 €/ha 101 101 101 102 102 102General area payment for young farmers C1-C4 €/ha 27 27 30 32 32 36Aid for greenhouse products A, B and C2P-C4 over 7 months €/m2 11.4 11.4 11.32-7 months €/m2 5.3 4.8 4.3Aid for greenhouse products C1 and C2over 7 months €/m2 11.4 11.4 12.0 12.8 12.8 12.72-7 months €/m2 5.7 5.7 6.0 5.9 5.3 4.8Northern storage aid for horticulture products (max.)Storages with thermo-control system €/m3 15.0 14.5 14.2 14.2 14.2 14.2Storages without thermo-control system €/m3 10.1 10.1 9.8 9.8 9.8 8.8
Aid during the transitional period: Conversion factors with which the average number of animals is multiplated LU LU LUDairy cows 1 Other bovines >2 years 1 Horses >6 months, Mares for breeding, incl. ponies 1Suckler cows 1 Other bovines 0.5-2 years 0.6 Finnish horses 0.85 Ewes, goats 0.15 Other horses and ponies, 1-3 years 0.6Nordic aid: Conversion factors with which the average number of animals is multiplied LU LU LUSuckler cows 1 Sows, boars 0.7 Hatching broilers and other poultry 0.025Male bovines >2 years 1 Pigs >3 months 0,23 190/223 slaughtered turkey 1Male bovines 0.5-2 years 0.6 13 slaughtered pigs 1 Horses >6 months, Mares for breeding, incl. ponies 1Ewes, goats 0.15 Laying hens 0.013 Finnish horses 0.85 Broilers 0.0053 Other horses and ponies, 1-3 years 0.6 1 A and B area national aid for crop production, C area northern aid.2 Aid for forage grass is paid for farms with cattle, sheeps, goats and horses.
P1 = Province of Oulu: Haukipudas, Kiiminki, Oulu, Utajärvi, Ylikiiminki, Parts of Oulunsalo.P2 = Province of Lapland: Kemi, Keminmaa, Simo, Tervola, Tornio. Province of Oulu: Hailuoto, Hyrynsalmi, Ii, Kuhmo, Kuivaniemi, Yli-IiP3 = Province of Lapland: Kemijärvi, Pello, Ranua, Rovaniemen mlk, Rovaniemi, Ylitornio. Province of Oulu: Pudasjärvi, Puolanka, Suomussalmi, TaivalkoskiP4 = C3: Province of Lapland: Posio. Province of Oulu: Kuusamo. C4: Province of Lapland: Kolari, Pelkosenniemi, Salla, Savukoski; Parts of Kittilä and Sodankylä.P5 = Province of Lapland: Muonio, Enontekiö, Inari, Utsjoki; Parts of Sodankylä and Kittilä. Archipelago: Parts of areas C1 and C2.

Publications of the Agricultural Economics Research Institute
No 93 Forsman, S. 1999. Erilaistaminen ja hintastrategiat elintarvikealan maa seutu -yrityksissä. 166 s.
No 94 Marttila, J. & Ahlstedt, J. (toim.). 2000. Maataloustieteen päivät 2000. Talous ja teknologia. 285 s.
No 95 MTTL 2000. Suomen maatalous ja maaseutuelinkeinot 1999/2000. 95 s.No 95a MTTL 2000. Finnish Agriculture and Rural Industries 1999/2000. 95 p.No 96 Peltola, A. 2000. Viljelijäperheiden monitoimisuus suomalaisilla maatiloilla.
280 s. No 97 MTTL 2001. Suomen maatalous ja maaseutuelinkeinot 2001. 95 s.No 97a MTTL 2001. Finnish Agriculture and Rural Industries 2001. 95 p.
Publications of the Agrifood Research Finland, Economic Research
No 98 Lehtonen, H. 2001. Principles, structure and application of dynamic regional sector model of Finnish agriculture. 265 p.
No 99 Vihinen, H. 2001. Recognising Choice. A Study of the Changing Politics of the Common Agricultural Policy through an Analysis of the MacSharry Reform Debate in Ireland and the Netherlands. 247 p.
No 100 Peltola, J. 2002. Three Approaches to Mathematical Models for Finnish Natural Resource Management. 97 p.
No 101 Niemi, J. & Ahlstedt, J. (toim.). 2002. Suomen maatalous ja maaseutuelin keinot 2002. 94 s.
No 101a Niemi, J. & Ahlstedt, J. (eds.). 2002. Finnish Agriculture and Rural Industries 2002. 94 p.
No 102 Jansik, C. 2002. Determinants and Influence of Foreign Direct Investments in the Hungarian Food Industry in Central and Eastern European Context. An Application of the FDI-Concentration Map Method. 312 p.
No 103 Niemi, J. & Ahlstedt, J. (toim.). 2003. Suomen maatalous ja maaseutuelin keinot 2003. 94 s.
No 103a Niemi, J. & Ahlstedt, J. (eds.). 2003. Finnish Agriculture and Rural Industries 2003. 94 p.
No 104 Niemi, J. & Ahlstedt, J. (toim.). 2004. Suomen maatalous ja maaseutuelin keinot 2004. 94 s.
No 104a Niemi, J. & Ahlstedt, J. (eds.). 2004. Finnish Agriculture and Rural Industries 2004. 94 p.
No 105 Niemi, J. & Ahlstedt, J. (toim.). 2005. Suomen maatalous ja maaseutuelin keinot 2005 - Kymmenen vuotta Euroopan unionissa. 94 s.
No 105a Niemi, J. & Ahlstedt, J. (eds.). 2005. Finnish Agriculture and Rural Industries 2005 - Ten Years in the European Union. 94 p.
No 105b Niemi, J. & Ahlstedt, J. (red.). 2005. Finlands lantbruk och landsbygdsnäringar 2005 - Tio år i Europeiska unionen. 94 s.
No 106 Niemi, J. & Ahlstedt, J. (toim.). 2006. Suomen maatalous ja maaseutuelin keinot 2006. 96 s.
No 106a Niemi, J. & Ahlstedt, J. (eds.). 2006. Finnish Agriculture and Rural Industries 2006. 96 p.