report: engagement benchmarks for downloadable content
TRANSCRIPT

Copyright © 2016 Contently. All rights reserved. contently.com
Report: The First Engagement Benchmarks for Case Studies, White Papers, and Other Downloadable Documentsby Steve Peck
2
Report: The First Engagement Benchmarks for Case Studies, White Papers, and Other Downloadable Documents
Marketers can track almost everything that lives on the web. However, some of the most valuable digital marketing collateral doesn’t live on web pages. Resource-intensive assets like e-books, white papers, sales sheets, case studies, PDFs, and slideshows are crucial for generating leads and nurturing prospects, but marketers have had no real way to track how they perform.
At Contently, that’s a problem we’ve solved through our new technology: Contently Document Analytics. In this report, you’ll discover how people have engaged with marketing documents:
6,250 hours of engagement by
106,687 B2B decision-makers accounting for
18,256 view sessions from
1,776 resources.
Let’s dive in.
Contently Document Analytics

3
Report: The First Engagement Benchmarks for Case Studies, White Papers, and Other Downloadable Documents
Engagement Benchmarks by Industry
Quick Takeaway
Longer assets don’t necessarily equate to more time spent. In fact, readers spend more time per page on shorter resources.
Industry Average View Time
(
Average Document
Length
Median Document
Length
Median View Time (seconds)
Median Per Page
View TimeAverage % Complete
Median % Complete
Average Form
Conversion
All Industries 2.03 13.4 7 51 12 57% 50% 27%
Professional Services 2.27 10.3 7.5 25 13 53% 44% 24%
Software and Internet 2.1 13.5 11 46 12 52% 33% 26%
Publishing 1.96 11.6 8 77 12 63% 75% 31%
Marketing Agencies 1.95 13.2 12 50 11 50% 41% 32%
Healthcare 1.8 6.5 5 43 17 68% 83% 28%
Financial Services 1.35 7 7 48 18 42% 28% 22%

4
Report: The First Engagement Benchmarks for Case Studies, White Papers, and Other Downloadable Documents
ToFu Content: Half the Documents, 9x the Views
Top-of-funnel (ToFu) content like white papers, guides, e-books, and reports represent 53 percent of all resources included in this study. The remaining 47 percent consists of bottom-of-funnel (BoFu) content. These BoFu resources include more product-focused content such as case studies, product overviews, presentations, and data sheets.
ToFu content accounted for over 90 percent of the 182,000 content views included in this study.
35%
30%
25%
20%
15%
10%
5%
0%
Whitepaper eBook Guide Report Case Study Overview Brochure Presentation Data Sheet Webinar Follow-up
% of Total Documents
% of Total Views
TOFU BOFU

5
Report: The First Engagement Benchmarks for Case Studies, White Papers, and Other Downloadable Documents
Lee Odden, CEO, TopRank Marketing“Detecting patterns in how readers consume content should help guide your content marketing strategy. For example, if the vast majority of your audience consumes content on a mobile device, then your content should be skimmable and, of course, optimized for mobile.”
Matt Heinz, President, Heinz Marketing“Content is king, but only if the empire is listening. If you don’t speak to your constituents, you may lose that kingdom fast. For example, C-level targets aren’t going to read 20-page white papers. They will skim through SlideShare decks, watch short videos, and scan bulleted written content. Using podcasts won’t work for older audiences, but millennials who listen to something on their commute to and from work are great targets for that format. If you don’t align with audience preferences, you’re missing out on a huge opportunity to increase engagement, response, and conversion.”
Ardath Albee, CEO and B2B Marketing Strategist, Marketing Interactions“Make sure the topic, tone, and style are relevant to your audience and their context within the buying process. Become a ruthless editor. Longform content can be successful. The problem is that a lot of longform content isn’t compelling all the way through. That’s why people stop reading.”
Alex Schirtzinger, Director of Content Marketing, Salesforce“Campaign goals should drive all other considerations when it comes to creating content. Your objectives should include target segment, persona, and industry—and the type of content produced should reflect those priorities.”
The Experts Weigh In: What Type of Content Should I Create?

6
Report: The First Engagement Benchmarks for Case Studies, White Papers, and Other Downloadable Documents
Though the average length of the documents we analyzed was 13.4 pages, readers only spent an average of 2 minutes and 3 seconds engaging with them. B2B marketers have a very limited amount of time to make an impression with their content, so it’s best to make your point quickly.
Make Your Point in 2 Minutes or Less
AVERAGE VIEW TIME
2:03AVERAGE PAGE LENGTH
13.4MEDIAN VIEW TIME
0:51MEDIAN PAGE LENGTH
7
7
Report: The First Engagement Benchmarks for Case Studies, White Papers, and Other Downloadable Documents
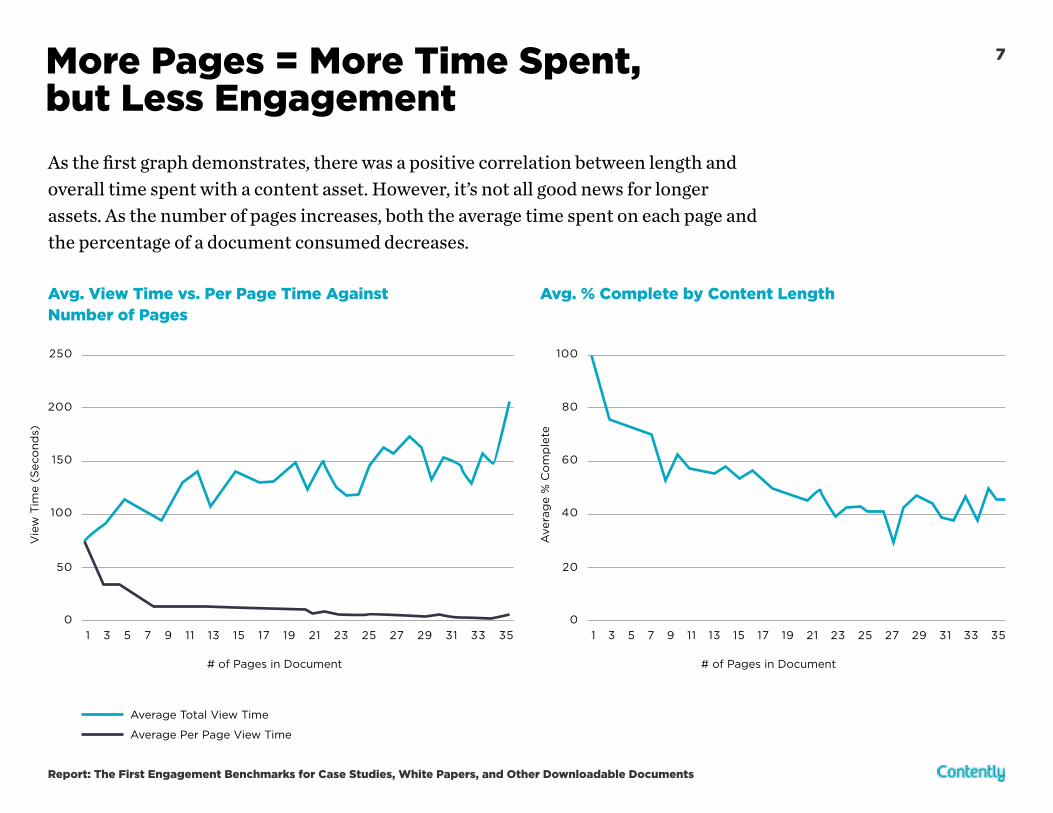
As the first graph demonstrates, there was a positive correlation between length and overall time spent with a content asset. However, it’s not all good news for longer assets. As the number of pages increases, both the average time spent on each page and the percentage of a document consumed decreases.
More Pages = More Time Spent, but Less Engagement
250 100
200 80
150 60
100 40
50 20
0 01 3 5 7 9 11 13 15 17 19 21 23 25 27 29 31 33 35 1 3 5 7 9 11 13 15 17 19 21 23 25 27 29 31 33 35
Avg. View Time vs. Per Page Time Against Number of Pages
Avg. % Complete by Content Length
Average Total View Time
Average Per Page View Time
# of Pages in Document# of Pages in Document
Ave
rag
e %
Co
mp
lete
Vie
w T
ime
(Sec
ond
s)

8
Report: The First Engagement Benchmarks for Case Studies, White Papers, and Other Downloadable Documents
Thirty-five percent of readers will spend less than 30 seconds engaging with your content, and the median time spent was just 51 seconds. These numbers underscore the importance of identifying genuinely engaged readers in the long-tail and nurturing them accordingly. These folks will likely be interested in what you have to say.
Most Readers Spend Less Than a Minute With Your Content
0 1 2 3 4 5 6
Total Time Spent (Minutes)
# o
f V
iew
s
Total Time Spent Related to # of Views
0:51 median
2:03 average
10–20s peak
Above-Average Engaged Readers
9
Report: The First Engagement Benchmarks for Case Studies, White Papers, and Other Downloadable Documents
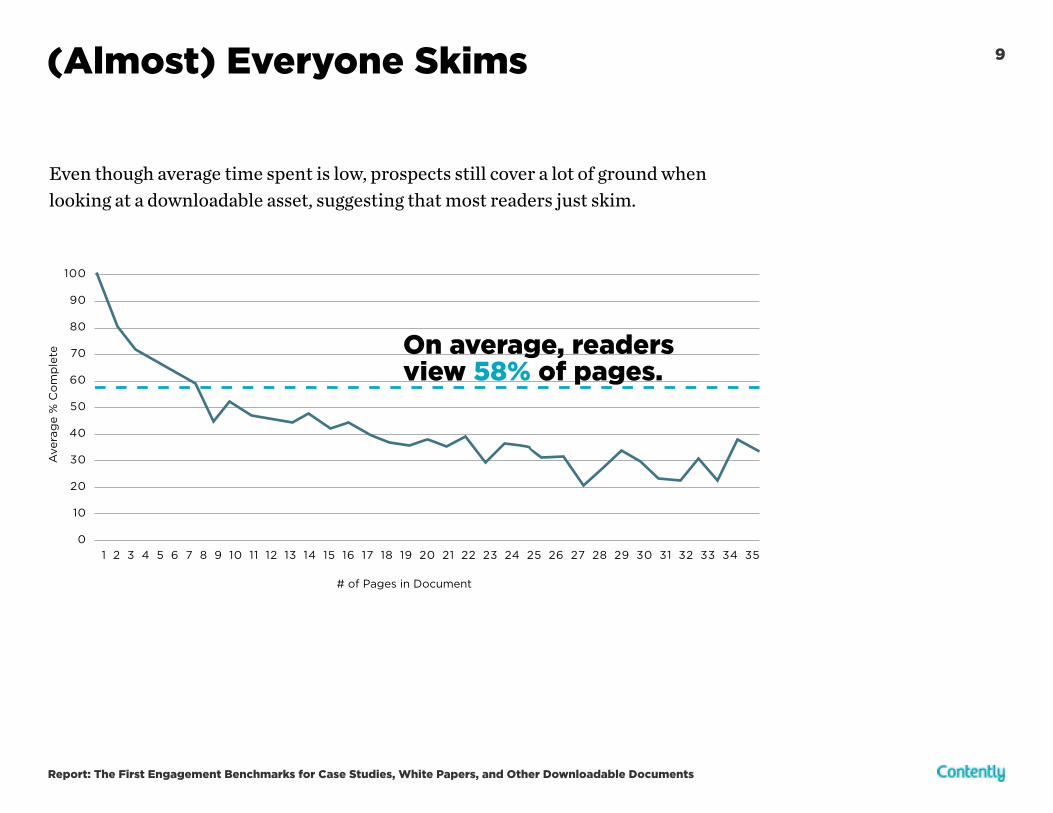
Even though average time spent is low, prospects still cover a lot of ground when looking at a downloadable asset, suggesting that most readers just skim.
(Almost) Everyone Skims
1 2 3 4 5 6 7 8 9 10 11 12 13 14 15 16 17 18 19 20 21 22 23 24 25 26 27 28 29 30 31 32 33 34 35
# of Pages in Document
100
90
80
70
60
50
40
30
10
20
0
Ave
rag
e %
Co
mp
lete On average, readers
view 58% of pages.
10
Report: The First Engagement Benchmarks for Case Studies, White Papers, and Other Downloadable Documents
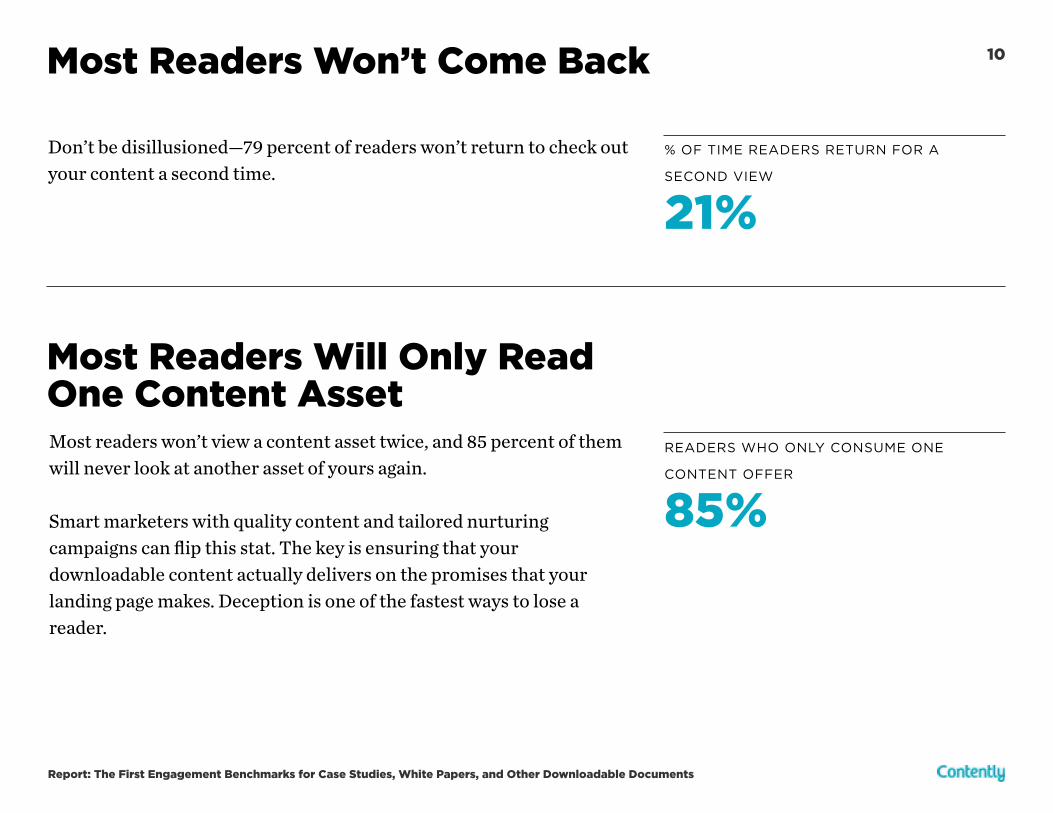
Don’t be disillusioned—79 percent of readers won’t return to check out your content a second time.
Most readers won’t view a content asset twice, and 85 percent of them will never look at another asset of yours again.
Smart marketers with quality content and tailored nurturing campaigns can flip this stat. The key is ensuring that your downloadable content actually delivers on the promises that your landing page makes. Deception is one of the fastest ways to lose a reader.
Most Readers Won’t Come Back
Most Readers Will Only Read One Content Asset
% OF TIME READERS RETURN FOR A
SECOND VIEW
21%
READERS WHO ONLY CONSUME ONE
CONTENT OFFER
85%

11
Report: The First Engagement Benchmarks for Case Studies, White Papers, and Other Downloadable Documents
In addition to downloadable assets, many of today’s B2B marketers leverage video as an important part of their content strategy. This got us thinking about benchmarks for branded video content, so we asked the experts at Wistia to weigh in.
They provided engagement information pulled from their large database of marketing-driven video content. You can see that data, along with third-party data on blog-post engagement, in the table above.
According to these benchmarks, video may be the most effective medium for engaging readers, with the highest average length, median length, average view time, and median view time by a significant margin.
Documents Trump Blog Posts, but Not Video
Content Type
Average Length
Median Length
Average Comparison
Average % Complete
Median View Time
Average View Time
Video
Document
Blog Post
9 min 40 sec
13.4 pages
2,416 words
3 min 4 sec
7 pages
1,600 words
3 min 34 sec
2 min 3 sec
15 seconds
1 min 48 sec
51 seconds
15 seconds
59%
56%
20-28%
11%
27%
7%

12
Report: The First Engagement Benchmarks for Case Studies, White Papers, and Other Downloadable Documents
Nearly 95 Percent of Readers Won’t Print a Document
Only about 5 percent of readers in our study elected to print a document. There’s a negative correlation between document length and a reader’s likelihood to print.
0 5 10 15 20 25 30
# of Pages
% o
f R
ead
ers
Who
Pri
nt
14%
12%
10%
8%
6%
2%
4%
0%
Probability of Print
13
Report: The First Engagement Benchmarks for Case Studies, White Papers, and Other Downloadable Documents
Most Documents Are Read on Desktop
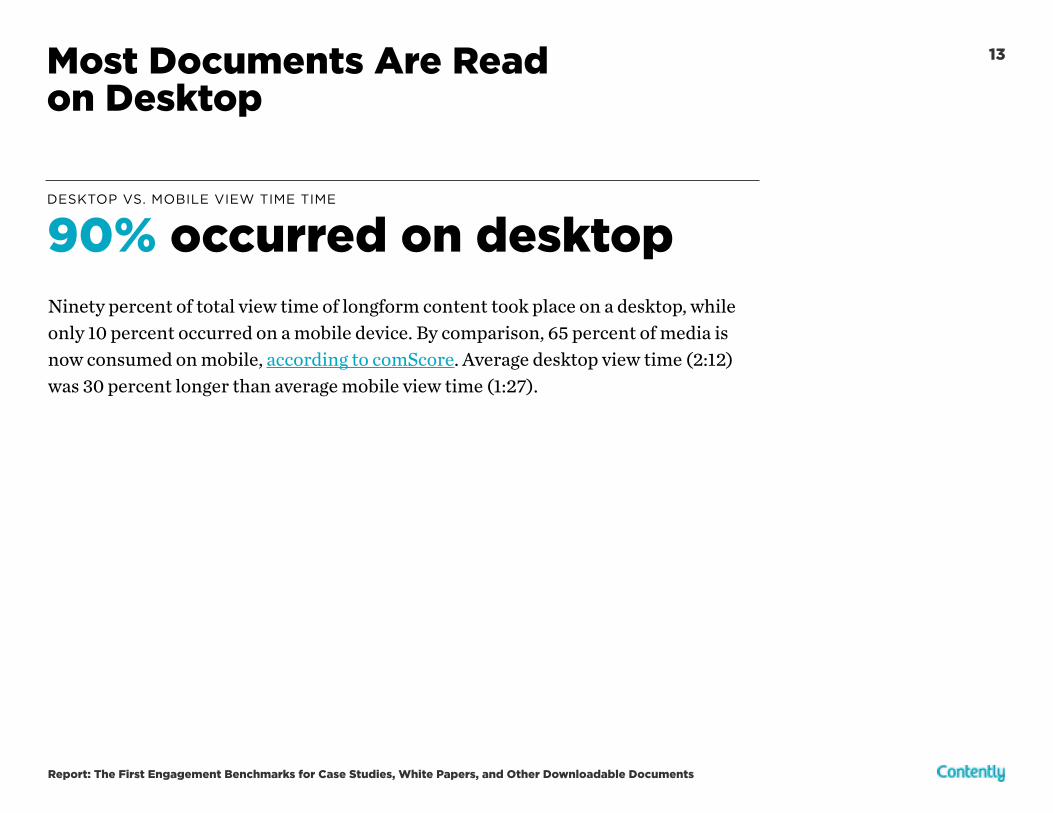
Ninety percent of total view time of longform content took place on a desktop, while only 10 percent occurred on a mobile device. By comparison, 65 percent of media is now consumed on mobile, according to comScore. Average desktop view time (2:12) was 30 percent longer than average mobile view time (1:27).
DESKTOP VS. MOBILE VIEW TIME TIME
90% occurred on desktop

14
Report: The First Engagement Benchmarks for Case Studies, White Papers, and Other Downloadable Documents
Distribution channels heavily impact whether a reader views downloadable content from a desktop or a mobile device. Desktop users are much more likely to access content directly through a company’s website, while mobile users are much more likely to access content sideways through social channels.
If you’re promoting your content heavily through paid social ads, make sure your design and lead forms are optimized for mobile visitors.
Most Mobile Readers Come From Social
B2B Digital Publishers
80%
48%
42%
18%
20%
52%
58%
82%
Sponsored Content Channel % Mobile % Desktop

Introduction 15
Report: The First Engagement Benchmarks for Case Studies, White Papers, and Other Downloadable Documents
Want more insights into the state of content marketing?For more tips, trends, and timely analysis, subscribe to
The Content Strategist.
And if you’d like to talk to someone about
Contently’s services, please reach out to us at
[email protected] or visit contently.com.
Thank you.