report eu 2013 - pandaawsassets.panda.org/downloads/res_report_final.pdf · putting the eu on track...
TRANSCRIPT

Putting the EU on track for 100% renewable energy | Page 1
REPORTEU
2013
Re-energising Europe
PUTTING THE EU ON TRACK FOR 100% RENEWABLE ENERGY

AuthorsAdam White, Project OfficerWWF European Policy [email protected]
Jason Anderson, Head of EU Climate and Energy PolicyWWF European Policy [email protected]
This briefing paper is based on research by Ecofys commissioned by WWF.
WWF received financial support from the Oak Foundation and the European Climate Foundation to carry out this study.
Graphic Design: Lies Verheyen - Mazout.nu
Front cover photo: © Istockphoto / Andrei Radzkou
Published in February 2013 by WWF-World Wide Fund For Nature (Formerly World Wildlife Fund), Brussels, Belgium. Any reproduction in full or in part must mention the title and credit the above-mentioned publisher as the copyright owner.
© Text 2013 WWF. All rights reserved.
WWF is one of the world’s largest and most experienced independent conservation organizations, with over 5 million supporters and a global network active in more than 100 countries.
WWF’s mission is to stop the degradation of the planet’s natural environment and to build a future in which humans live in harmony with nature, by: conserving the world’s biological diversity, ensuring that the use of renewable natural resources is sustainable, and promoting the reduction of pollution and wasteful consumption.
This programme is implemented with the support of the European Union.The contents of this publication are the sole responsibility of WWF and can in no way be taken to reflect the views of the European Union.

KEY FINDINGSEurope has significant untapped potential for cutting energy use and maximising indigenous power sources that could deliver cheaper and more secure energy. However, this potential is at risk because of a lack of political ambition. There is a particular need for greater clarity on policy frameworks for renewable energy and energy efficiency after 2020 – just one investment cycle away.
Based on recent research by ECOFYS1 for WWF, by 2030, the EU:
> could be using at least 38% less energy (compared to a business as usual projection2)
> could be generating more than 40% of its energy from renewable sources,
> and, by doing both, could reduce its energy related greenhouse emissions by 50% compared to 1990 levels.
Achieving such levels would put the EU on track to delivering a 100% renewably powered energy system by 2050 at the latest. It should be noted that while biomass use has been assessed based on the global model3, a more detailed sustainability vision for biomass use in Europe is needed.

© IS
TOC
KP
HO
TO / 1X
PE
RT
Europe has significant untapped potential for cutting energy use and maximising indigenous power sources.

Putting the EU on track for 100% renewable energy | Page 5
CONTENTSKEY FINDINGS
INTRODUCTION - WWF’S VISION
THE CASE FOR IMPLEMENTING THE EU27 2030 ENERGY SCENARIO
RESULTS - THE SCENARIO RESULTS IN DETAILEnergy savings
Energy savings in industry Energy savings in buildings Energy savings in transport
Renewable energy Renewable energy in industry Renewable energy in buildings Renewable energy in transport Bio-energy in detail
THE WWF/ECOFYS RESULTS IN CONTEXT
CONCLUSION
ANNEX: METHOD - A THREE STAGE APPROACH1. Starting with the Ecofys Global 2050 Energy Scenario2. Testing the Scenario3. Refining the Scenario to the EU27 Level
3
7
9
11
121313
14
151617
1720
24
26
28282829

© IS
TOC
KP
HO
TO / Y
UR
IY CH
AB
AN
Based on recent research by ECOFYS for WWF, by 2030, the EU could be generating more than 40% of its energy from renewable sources.

Putting the EU on track for 100% renewable energy | Page 7
INTRODUCTION: WWF’S VISION
In 2011, WWF released The Energy Report. This ground-breaking study, based on the specially commissioned ECOFYS Global Energy Scenario,
showed how, by 2050, the planet’s entire energy needs could be met from renewable sources.
The first step to reaching this goal is to limit energy use in absolute terms. The second step is to scale up energy supply from current renewable generation technologies (prioritising their delivery in order of sustainability - solar, wind, water, geothermal, and only then bio-energy under strict conditions).
Coming amid an increasingly active debate over what should follow current EU climate and energy legislation (the 20-20-20 package4), this briefing paper adapts the Global 2050 Energy Scenario to the EU27 level in 20305. It shows what has to be achieved in Europe over the next two decades in order to keep the option of a fully renewable global energy system within sight. The paper is a timely reminder that the ambitious goal of 100% renewable energy by 2050 is possible, and, in the long term, would save money. It thereby adds further weight to WWF’s calls for post-2020 EU legislation to deliver ambitious targets for energy efficiency, renewable energy, and emissions reductions in a package of coherent and complimentary instruments.
THE PAPER IS A TIMELY REMINDER THAT THE AMBITIOUS GOAL OF
100% RENEWABLE ENERGY BY 2050 IS
POSSIBLE AND WOULD SAVE MONEY.
© IS
TOC
KP
HO
TO / M
AC
IEJ N
OS
KO
WS
KI
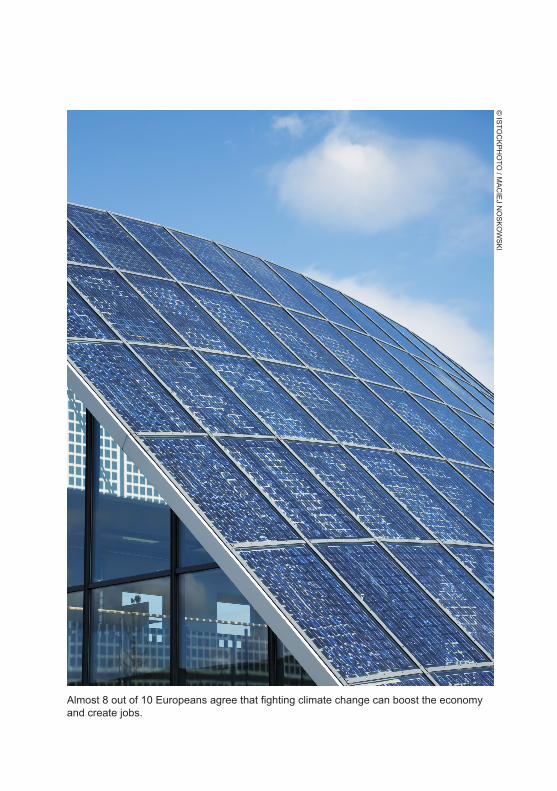
Almost 8 out of 10 Europeans agree that fighting climate change can boost the economy and create jobs.

Putting the EU on track for 100% renewable energy | Page 9
THE CASE FOR IMPLEMENTING THE EU27 2030
ENERGY SCENARIO
As Europe’s economies struggle to recover, renewable energy and energy savings are beacons of hope.
Almost 8 out of 10 Europeans (78%) agree that fighting climate change can boost the economy and create jobs6. Meeting our climate change
and energy targets by 2020 would generate up to 5 million jobs7. Cutting overall emissions by 30% instead of 20% would create up to 6 million new European jobs by 20208. In addition to these significant jobs benefits, by reducing its dependence of fossil fuels the EU would also be able to cut its more than 500 billion euro annual fossil fuel import bill9.
More energy savings and renewable energy are also needed to protect the planet. This summer (2012), more Arctic sea ice melted than ever before - with the result that there was nearly 50% less ice than the 1979 to 2000 average10. The record melt was bigger than the previous record by an area about the combined size of Sweden and Finland. Furthermore, research on the impact of continuing to burn fossil fuels has revealed that the health and environmental costs of generating energy in some countries are higher than the value of that energy once it is produced11.

© IS
TOC
KP
HO
TO / D
E S
AN
TIS PA
OLO
By maximising energy efficiency and savings, the EU has the potential to use 38% less energy by 2030 compared to business as usual projections.

Putting the EU on track for 100% renewable energy | Page 11
RESULTS: THE SCENARIO
RESULTS IN DETAIL
In 2009 the European Union set clear climate and energy objectives to be met by 2020.
Ongoing effort is needed to ensure that these targets are met. However, the long lead-in time required by major energy infrastructure developments means that investors need more than just the 8 years of current policy predictability than the 20-20-20 targets provide. We must now actively consider how our energy system should develop after 2020, so that current benefits are maximised, not squandered. This view is shared by the European Commission, which calls for greater certainty in renewable energy policy after the current regime comes to an end in 202012. WWF’s assessment of what should be achieved in the EU by 2030 in order to secure a 100% renewable European energy system by 2050 is as follows:
• 38%Primaryenergysavings(compared to a business as usual projection13)
• 41%shareofrenewableenergyintotalconsumption
• 50%cutinenergy-relatedGreenhousegasemissions(compared to 1990);
How these results are achieved is laid out in detail on the next pages14.
EU 2020 energy targets:
• EU 2020 energy targets: 20% cut in energy-related greenhouse gas emissions compared to 1990
• 20% of primary energy savings;
• 20% share of renewable energy in total consumption (inc. heating & cooling)
WE MUST NOW ACTIVELY CONSIDER
HOW OUR ENERGY SYSTEM SHOULD
DEVELOP AFTER 2020.

Putting the EU on track for 100% renewable energy | Page 12
Energy SavingsThe EU27 2030 Energy Scenario models significant energy savings, with energy use 38% lower in 2030 than that projected by the 2007 PRIMES baseline used for the 2020 target (22% lower than consumption in 2005).
Figure 1: Development of primary energy demand: comparing PRIMES baselines with TER EU27 results and the EU’s 2020 energy savings target
The results by sector can be seen below:Figure 2: Savings in final energy per sector (Due to rounding, may not always sum)
Sector % savings 2005-30
% of total energy saving
in 2030
Final consumption-
2030 (EJ)
%oftotalfinalenergy savings
in 2030
Industry 31% 39% 10 26%
Buildings 26% 45% 14 37%
Transport 11% 15% 15 38%
TOTAL 22% 100% 39 100%
Mto
e pr
imar
y en
ergy
per
ann
um
Primes 2007 Primes 2009 TER EU 27 EU target
2,000
1,800
1,600
1,400
1,200
1,000
800
600
400
200
02000 2005 2010 2015 2020 2025 2030
The EU27 2030 Energy Scenario
models significant energy savings

Putting the EU on track for 100% renewable energy | Page 13
These energy savings results are based on developments in both activity and intensity in each sector – achieved as set out below:
Energy savings in industry
• In 2030, the aluminium, cement, steel and paper industries have intensity levels that are 60% to 70% of levels measured in 2000. This is achieved through:
- Increased use of recovered input materials; - Ambitious refurbishment of existing plants; - Stringent requirements to use best available technology
(BAT) in all new plants;- Continued improvements in BAT over time.
• Other sectors e.g. food/chemicals have annual efficiency improvements of 2%, which may be obtained through:
- More efficient energy supply; - Improved process optimisation;- Improved efficiency in motor driven systems and
lighting.
Energy savings in buildings
• Measures in buildings lead to a heat intensity15 in 2030 that is 40% (commercial) to 50% (residential) of 2005 levels and electricity intensity that is 90% (commercial) to 120% (residential) of 2005 levels, as follows:
- Existing stock (75% of European buildings in 2030) is retrofitted at rates of up to 2.5% a year. By 2030~45% of the Europe’s existing buildings are retrofitted.
Retrofitting means:• 60% of heating needs abated by insulation and
ventilation systems with heat recovery mechanisms; • 25% of remaining heating and hot water need met
by local solar thermal systems, the rest by heat pumps;
• Cooling provided by local, renewable solutions where possible; and
• Electricity needs increase per floor area due to increased cooling demand.

Putting the EU on track for 100% renewable energy | Page 14
- New stock (25% of European buildings in 2030) is much more energy efficient:
• By 2030 all new buildings will use energy at levels comparable to the German passive house standard and will be powered only by electricity;
• Residual heat demand will be met by passive solar, internal gains, solar thermal installations and heat pumps; and
• There will be some increase in electricity use in buildings because of greater use of appliances and in order to power heat pumps. The increase is only partially offset by more efficiency in these technologies.
Energy savings in transport
• In 2030, transport has intensity levels that are 60% (passenger transport) to 70% (freight transport) of levels measured in 2000. This is achieved through:
- More efficient technologies and uses (trucks with reduced drag, improved air traffic management, reduced fuel needs in hybrid buses);
- Transport electrified as much as possible (electric cars or plug in hybrids in urban environments, and electric rail systems);
- Plug-in hybrids and/or electric vehicles become the main technology choice for light duty vehicles;
- Long-distance trucks become more efficient through improved material choice, engine technology and aerodynamics;
- A shift to fully electrified delivery vans covering ‘the last mile’; and
- As a last step, using fuel from sustainable biomass, where possible.

Putting the EU on track for 100% renewable energy | Page 15
Renewable EnergyFor the total energy system in 2030, renewable energy is envisaged to generate 41% (16 EJ) of the energy need of the 27 EU member states. Both the absolute growth in RES and the decrease in final energy due to efficiency improvements contribute to this growth in the RES share.
Figure 3: Share of renewable energy in each sector in the EU27 2030 scenario
The share of renewable energy in electricity is 65%, and around 43% is provided from supply-driven sources in 2030. The scenario caps the feed-in of variable renewable energy sources (wind and solar) at 45% on average annually in 2030, under the assumption that the electricity grid cannot accept higher shares by then. While significant effort is already required to manage this level of variable supply, additional investment could increase the use of variable renewable energy sources, and thereby increase renewable energy supply overall.
Sector Share of renewables infinalenergyconsumption
Amount of renewable energy
(EJ)
Total amount of energy (EJ)
Industry 41% 4 10
Buildings 49% 7 14
Transport 36% 5 15
TOTAL 41% 16 39
ShareofrenewableenergyinfinalenergydemandintheEU272030scenario
Heat 35%
Fuels (industry and transport) 29%
Electricity 65%
Figure 4: Share of renewable energy in final energy demand in the EU27 2030 scenario

Putting the EU on track for 100% renewable energy | Page 16
The evolution of the overall energy system under the EU27 2030 scenario is represented in the graph on the next page. This overall evolution is broken down by sector in the charts below (NB – ‘Y’ axis scales vary):
Renewable energy in industry
Figure 5: Development of the energy supply from renewable and non-renewable sources to 2030
Figure 6: Energy supply for the industry sector from RES and non-RES sources to 2030
Non RES Bio: Algae Bio: Crops
Bio: Comp.Fellings Bio: Traditionel
Bio: Resid.&Waste Hydropower
Geo:heat Geo:Electricity
Solarthermal Conc.solar:Heat
Conc.solar:Power Photovoltaic solar
Wave & Tidal Wind: Off-shore Wind: On-shore
Non RES RES
60
50
40
30
20
10
0
2000 2005 2010 2015 2020 2025 2030
Fina
l ene
rgy
in E
J pe
r ann
um
16
14
12
10
8
6
4
2
02000 2005 2010 2015 2020 2025 2030
Fina
l ene
rgy
in E
J pe
r ann
um
RES share: 12% 26% 41%
Energy use falls and supply from
renewable sources grows
The share of RES fueling industry
tripples

Putting the EU on track for 100% renewable energy | Page 17
Figure 6: Energy supply for the industry sector from RES and non-RES sources to 2030
Figure 7: Energy supply for the building sector from RES and non-RES sources to 2030
Figure 8: Energy supply for the transport sector from RES and non-RES sources to 2030
Renewable energy in buildings
Renewable energy in transport
Non RES RES
Non RES RES
25
20
15
10
5
02000 2005 2010 2015 2020 2025 2030
Fina
l ene
rgy
in E
J pe
r ann
umRES share: 19% 29% 49%
Fina
l ene
rgy
in E
J pe
r ann
um
20
18
16
14
12
10
8
6
4
2
0
2000 2005 2010 2015 2020 2025 2030
RES share: 6% 15% 36%
The share of RES fueling buildings
more than doubles
The share of RES fueling transport
grows 6-fold

Putting the EU on track for 100% renewable energy | Page 18
It should be noted that the use of different renewable energy sources is limited either by their availability (such as biomass), or by system constraints (such as the ability of electricity grids to accept high proportions of variable renewable supply). Overall, rather than representing the maximum potential to deploy renewable energy, these results represent a scenario result in which the final goal is 100% renewable energy by 2050.
The scenario first calculates final demand by sector and type (see detail on efficiency assumptions above), and then seeks to meet this demand by matching it with increasing shares of renewable energy over time. The demand for renewable energy supply in the scenario is, therefore, either equal to or lower than the deployment potential for renewable energy in Europe.
The development of energy supply by source and by carrier in the different sectors is detailed on the next page.

Putting the EU on track for 100% renewable energy | Page 19
Source 2000 2005 2010 2015 2020 2025 2030
Total electricity (EJ/a) 8.6 9.4 9.8 10.0 10.2 10.5 10.7
Wind: on shore 0.1 0.2 0.6 1.3 1.7 1.9 2.0
Wind: off shore 0.0 0.0 0.0 0.1 0.2 0.3 0.6
Wave & Tidal 0.0 0.0 0.0 0.0 0.0 0.0 0.0
PV Solar 0.0 0.0 0.1 0.4 1.2 1.5 2.0
Concentrated solar: power 0.0 0.0 0.0 0.0 0.0 0.1 0.2
Hydropower 1.3 1.4 1.5 1.6 1.6 1.6 1.7
Geothermal 0.0 0.0 0.0 0.1 0.1 0.1 0.2
Biomass 0.3 0.3 0.3 0.3 0.3 0.3 0.3
Total renewable energy 1.7 1.9 2.5 3.8 5.1 5.8 7.0
Fossil fuels 6.9 7.5 7.2 6.2 5.0 4.6 3.7
Industry Fuels and heat (EJ/a)
11.0 11.1 10.8 10.3 9.6 8.6 7.5
Concentrated solar: heat 0.0 0.0 0.0 0.0 0.0 0.0 0.0
Geothermal 0.0 0.0 0.0 0.0 0.0 0.0 0.0
Biomass 0.2 0.3 0.8 1.3 1.7 2.0 2.3
Total renewable energy 0.2 0.3 0.8 1.3 1.7 2.0 2.3
Fossil fuels 10.9 10.7 10.0 9.0 7.9 6.6 5.2
Building fuels and heat (EJ/a)
12.2 13.6 13.1 12.7 11.1 9.4 7.7
Solar thermal 0.0 0.0 0.1 0.2 0.5 0.7 0.9
Geothermal 0.1 0.1 0.2 0.3 0.5 0.7 1.0
Biomass 1.6 1.4 2.0 1.3 1.1 1.0 1.0
Total renewable energy 1.7 1.5 2.3 1.8 2.1 2.4 2.9
Fossil fuels 10.5 12.0 10.8 10.8 9.0 6.9 4.8
Transport Fuels (EJ/a) 15.0 15.8 16.7 17.3 16.6 14.9 12.3
Biomass 0.1 0.3 0.8 1.4 1.9 2.5 3.5
Total renewable energy 0.1 0.3 0.8 1.4 1.9 2.5 3.5
Fossil fuels 14.8 15.5 15.9 15.9 14.8 12.4 8.8
TOTAL (EJ/a) 46.7 49.9 50.3 50.2 47.5 43.3 38.2
Figure 9: The development of energy supply by source and by carrier in the different sectors
Green = Renewable energy supply increasingRed = Fossil fuel and/or total energy supply reducing

Putting the EU on track for 100% renewable energy | Page 20
Bioenergy in detail
In the Ecofys energy scenario, biomass is the last renewable energy source to be called upon, and is subject to sustainability criteria16. The availability of land for bioenergy cropping is strongly dependent on the assumptions made in the food analysis section of the Global Energy Report. Where possible, conservative assumptions were used. The one notable exception is that an ambitious constraint on the consumption of meat, creating a more sustainable diet, is included17. Since the publication of the global Energy Report, WWF continues to elaborate its recommendations for biomass sustainability criteria with, for example, the publication of recommendations for forest based biomass sustainability criteria18. This study shows that by 2020 more than 10% of the EU’s final energy consumption is expected to come from biomass, which would then represent around half of all renewable energy consumption in Europe. As forest biomass is expected to deliver more than 70% of all biomass used in the EU, WWF urges the EU and Member States to introduce legally binding sustainability criteria for biomass used for electricity, heating and cooling in order to ensure that:
• There is full accounting of carbon emissions from biomass to allow prioritisation of biomass based on their real GHG mitigation potential, as well as the efficient use of biomass.
• There is zero use of valuable land in order to protect biodiversity and the ecosystem services of forests or restricted use in line with the management criteria for these areas.
• There is implementation of sustainability principles for forest management.
• Internationally proclaimed human rights are respected, including customary and statutory tenure and use rights, and the right to give free and prior informed consent.
• These principles are implemented in a credible way
Also published following the release of the global Energy Report, The Living Forests Report19 details WWF’s position on the management of the planet’s forests by setting out WWF’s

Putting the EU on track for 100% renewable energy | Page 21
Group Type of biomass used
Biomass used (finalenergy)
% of Biomass infinalenergyconsumption
% of renewables infinalenergyconsumption
A Waste and Residues only
3.2EJ 8% 31%
B Waste and Residues with complementary fellings20,21 only
4.8EJ 13% 35%
C All available biomass sources (sources in ‘A’ & ‘B’, unprocessed biomass22, crops)
7.2EJ 19% 41%
policy of no net forest loss through deforestation and no net decline in forest quality through degradation – ‘Zero Net Deforestation and Forest Degradation’ (ZNDD).
In order to give more detail on the role of biomass in WWF’s EU27 2030 energy scenario, this report breaks down the supply of biomass into three groups: A, B, and C. The types and use of biomass in final energy consumption under each variation are detailed in table 4 below (NB – Algae is not envisaged to be available for use before 2030):
Figure 10: Biomass use in EU27 2030 scenario
In the global scenario, from which this EU report is derived, biomass sustainability criteria are globally applied, including the principle that all biomass is produced on available land (land not exploited for other ends such as food production)23. This means that group C represents a sustainable level of biomass use, whether that biomass comes from inside the EU or is imported. If sustainability criteria are not fully implemented, however, the consumption of biomass will have to be reduced so as to avoid unsustainable use. Groups B and A are provided

Putting the EU on track for 100% renewable energy | Page 22
to show how biomass consumption could be curtailed towards sources with fewer sustainability concerns (though criteria are still necessary). The impact on both biomass consumption and the total proportion of renewables in Europe’s energy mix is shown. WWF will continue to make the case for the successful development and application of appropriate biomass sustainability legislation, which will be required to secure the maximum sustainable potential for renewables in Europe’s energy mix. This point is particularly relevant in the light of WWF’s ongoing work on the recent European Commission proposed legislation on the Indirect Land Use Change impacts of bioenergy24,25.
Furthermore, as noted above, this report presents the adaptation of a global model to the EU27 level. It is possible that in a technologically advanced and wealthy region, such as the EU, there would be greater use of more sustainable 2nd and 3rd generation biofuels than the global average. This is an outcome that WWF will continue to advocate for, in order that the EU leads a switch to advanced biofuels as quickly as possible.
For scenario C, electricity generation uses the lowest proportion of biomass, while transport uses the highest proportion, as detailed below:
Figure 11: Biomass use in EU27 2030 scenario
Sector % of total biomass use going to each sector
Absolute amount of Biomass supplying sector (EJ)
Electricity 4% 0.3
Heat-Buildings 14% 1.0
Heat – Industry 18% 1.3
Industry fuels 14% 1.0
Transport fuels 49% 3.5
TOTAL 100% 7.2

Sector % of total biomass use going to each sector
Absolute amount of Biomass supplying sector (EJ)
Electricity 4% 0.3
Heat-Buildings 14% 1.0
Heat – Industry 18% 1.3
Industry fuels 14% 1.0
Transport fuels 49% 3.5
TOTAL 100% 7.2
© IS
TOC
KP
HO
TO / E
MIN
E B
AYR
AM
In recent years the EU has led the way on climate and energy matters, now that legacy has to be secured with a strong step forwards.

Putting the EU on track for 100% renewable energy | Page 24
As is stated above, different energy system models are not completely comparable.
The clearest example of this is in the treatment of heat pumps as either an energy savings device, as a renewable energy source, or as both. However, the table below has been produced in order for the EU27 2030 Energy scenario to be considered alongside other similar reports. It should be remembered that WWF’s scenario is the only one with the explicit aim of achieving 100% renewable energy by 2050. This briefing paper shows for the first time what meeting that global goal means at the EU level in 2030.
THE WWF/ECOFYSRESULTS IN CONTEXT
ACHIEVING
100% RENEWABLE ENERGY BY 2050
IS POSSIBLE

Putting the EU on track for 100% renewable energy | Page 25
EU Energy Roadmap
2050 RE-Shaping
Greenpeaceenergy [R]evolution
EREC
WWF/ECOFYS EU27
report
Goal80-95% total greenhouse
gas reduction in 2050None
50-80% RES in 2050
To maximise the share of renewables
in the energy mix
In 2030, EU27 in line with
global vision
of 100% RES by 2050
Nuclear in scenario(s)?
YES NO Phased out in
2040N.A.
Phased out 2040
- 2050
CCS in scenario(s)?
YES NO NO N.A. NO
Hydrogen in scenario(s)?
NO NO YES N.A. YES
Scenario titles
High efficiency
High Renewable
energy
Base-line
High efficiency
RevolutionBase-line
Advanced EU27
Primary energy - Mtoe (EJ)
1452 (61) 1510 (63) Not published 1333 (56) Not published 1169 (49)
Savings26 22,5% 19,4% Not published 29% Not published 38%
Final energy - Mtoe (EJ)
1021 (43) 1092 (46)1479 (62)
1156 (48) 931 (39)1189 (50)
1216 (51) 914 (38)
Renewable energy - Mtoe (EJ/%)
282 341 455 455 389 498 572 377
(12EJ/28%)
(14EJ/31%)
(19EJ/31%)
(19EJ/39%)
(16EJ/42%)
(21EJ/42%)
(24EJ/47%)
(16EJ/41%)
Biomass energy - Mtoe (EJ/%)
163 189 180 180
Not published
236 255 171
(7EJ/16%)
(8EJ/17%)
(8EJ/12%)
(8EJ/16%)
(10EJ/20%)
(11EJ/21%)
(7EJ/19%)
Biomass as % of all RES
58% 55% 40% Not published 47% 45% 45%
RES as % of totalfinalenergy
28% 31% 37%27 48% 42% 42% 48% 41%28
Figure 12: Comparison of decarbonisation scenarios

Putting the EU on track for 100% renewable energy | Page 26
Ambitious increases in renewable energy and energy savings can be achievedintheEU27by 2030.
While they are dependent on the realisation of the developments expected by the models assumptions, it should also be remembered that even these ambitious levels could be exceeded if the requisite policies and support are in put in place. There would be significant benefits from action to deliver the levels of energy savings and renewable energy generation laid out in this report.
In recent years the EU has led the way on climate and energy matters, now that legacy has to be secured with a strong step forwards.
CONCLUSION
IN RECENT YEARS THE EU HAS LED THE WAY ON CLIMATE
AND ENERGY MATTERS, NOW THAT LEGACY HAS TO BE
SECURED WITH A STRONG STEP FORWARDS.

© W
ILD W
ON
DE
RS
OF E
UR
OP
E / IN
AK
I RE
LAN
ZON
/ WW
F
WWF has a vision of a world that is powered by 100% renewable energy sources by 2050.

Putting the EU on track for 100% renewable energy | Page 28
ANNEX:METHOD – A THREE
STAGE APPROACH
A three step approach was used to deliver climate and energy scenario results for the EU27in2030:
1.StartingwiththeEcofysGlobal2050EnergyScenario
The Ecofys Global 2050 Energy Scenario, as commissioned by WWF, demonstrated for the first time that a fully sustainable and renewable global energy system is possible by 2050. The study focuses on detailed developments and practical applications in order to demonstrate how almost all energy carriers, all regions and all sectors of the global energy system can be renewably powered, by 2050. Since its publication, the global scenario has been examined in detail and it has stood up well to scrutiny. However, in order to further strengthen confidence in the scenario, its results were tested against actual progress.
2. Testing the scenario
Figure 1 shows that the global results predicted by the Ecofys scenario and presented in The Energy Report (TER) closely reflect real world developments:
1. Take the ECOFYS global energy scenario commissioned for WWF’s Energy Report as the starting point.
2. Test the results of the global energy scenario against actual progress in key areas.
3. Refine the global energy scenario to the EU27 context in 2030
ACCORDING TO THE ECOFYS GLOBAL 2050 ENERGY SCENARIO, A
FULLY SUSTAINABLE AND RENEWABLE GLOBAL
ENERGY SYSTEM IS POSSIBLE BY 2050.
ABCDEFG

Putting the EU on track for 100% renewable energy | Page 29
Figure 13: Ecofys scenario results compared at the global level (EJ = Exajoules - equal to 10 18 joules).
While it should be noted that a number of underlying factors could have driven these results, it should also be recognised that the Ecofys Global 2050 Energy Scenario remains strong when results are compared at the EU27 level:
NB: While the Global energy report was published in 2011, the model was run from 2005 as the base year.
3.RefiningthescenariototheEU27level
The Ecofys Global 2050 Energy scenario is based on 10 world regions. The region ‘Europe’ in the energy scenario contains the countries of the EU27 plus additional countries within geographic Europe. Therefore, a scaling factor was applied to derive EU27 results. While this is not equivalent to building and running an EU specific model, the difference is expected to be small.
In addition to scaling, a number of important assumptions in the original global scenario (which are mainly set at global or OECD level) have been adapted and updated to better reflect the EU27 context in 2012. Further details on the global and OECD country assumptions that have been updated to the EU27 context can be found in the background document:http://awsassets.panda.org/downloads/report_eu_2030_re_target.pdf
GlobalTERanalysis 2010
IEA statistics 2010
Globaltotalfinalconsumption(EJ) 327 330
RES (EJ) 58 60
RES share 18% 18%
2005 2010
RESshareTEREU27Results 8% 12%
HistoricalRESshareEU27(IEA,2011) 8% 11% (‘09)
HistoricalRESshareEU27(Eurostat) 8% 13%
Figure 14: Ecofys 2050 Energy scenario results compared at the EU27 level.

Putting the EU on track for 100% renewable energy | Page 30
REFERENCES1 ECOFYS – Renewable energy: a 2030 scenario for the EU, 2012, http://awsassets.panda.org/downloads/report_eu_2030_re_target.pdf2 This report uses the same business as usual projection as that used in the development of the EU’s 20% energy
savings target (PRIMES 2007 - http://ec.europa.eu/environment/air/pollutants/models/primes.htm) in order to ensure that the energy savings proposals made in this report are comparable to the current EU target.
3 The Energy Report – 100% Renewable Energy by 2050, WWF, ECOFYS, and the Office for Metropolitan Architecture, 2011: www.panda.org/energyreport
4 http://ec.europa.eu/clima/policies/package/index_en.htm5 In this briefing paper’s graphs, the adapted Energy Scenario results for the European Union in 2030 are labelled
as TER EU27. 6 Eurobarometer 2011 – Special report on climate change: http://ec.europa.eu/clima/news/articles/
news_2011100702_en.htm 7 http://ec.europa.eu/europe2020/pdf/nd/eccomm2012_en.pdf8 http://www.pik-potsdam.de/members/cjaeger/a_new_growth_path_for_europe__synthesis_report.pdf9 http://ec.europa.eu/commission_2010-2014/hedegaard/headlines/news/2012-06-14_01_en.htm10 http://nsidc.org/news/press/2012_seaiceminimum.html11 EN35 External Costs of Electricity Production, European Environmental Agency, 2008 http://www.cire.pl/rynekenergii/podstawa.php?smid=207 12 COMMUNICATION FROM THE COMMISSION TO THE EUROPEAN PARLIAMENT, THE COUNCIL, THE
EUROPEAN ECONOMIC AND SOCIAL COMMITTEE AND THE COMMITTEE OF THE REGIONS, Renewable Energy: a major player in the European energy market, 6.6.2012, COM(2012) 271 final
13 This report uses the same business as usual projection as that used in the development of the EU’s 20% energy savings target (PRIMES 2007), in order to ensure that the energy savings proposals made in this report are comparable to the current EU target.
14 Method section can be read in Annex 115 Energy intensity in buildings is measured in heat or electricity needed per m2 floor space.16 Biomass sustainability criteria were analysed using the following categories (The Energy Report, p.162): • Land
use and food security; • Agricultural and processing inputs; • Complementary fellings; • Residues and waste.17 Section 5.3.5 of the global Energy Report18 WWF’s recommendations for sustainability criteria for forest based biomass, April 2012, http://wwf.panda.org/
about_our_earth/all_publications/?204412/WWFs-recommendations-for-sustainability-criteria-for-forest-based-biomass
19 WWF Living Forest Report, http://awsassets.panda.org/downloads/living_forests_chapter_1_26_4_11.pdf - ZNDD provides some flexibility: it is not quite the same as no forest clearing anywhere, under any circumstances. For instance, it recognizes peoples’ right to clear some forests for agriculture, or the value in occasionally “trading off” degraded forests to free up other land to restore important biological corridors, provided that biodiversity values and net quantity and quality of forests are maintained. In advocating ZNDD by 2020, WWF stresses that: (a) most should be retained– the annual rate of loss of natural or semi-natural forests should be reduced to; and (b) any gross loss or degradation of pristine natural forests would need to be offset by an equivalent area of socially and environmentally sound forest . In this accounting, plantations are not equated with natural forests as many values are diminished when a plantation replaces a natural forest.
20 Complementary fellings consists of woody biomass gained from sustainable harvesting of additional forest growth and of the sustainable share of traditional biomass use (The Energy Report, P179).
21 WWF’s recommendations for sustainability criteria for forest based biomass, April 2012, http://wwf.panda.org/about_our_earth/all_publications/?204412/WWFs-recommendations-for-sustainability-criteria-for-forest-based-biomass
22 Direct use of unprocessed biomass. The unsustainable share of traditional biomass use is phased out over time.23 For more details on the method for assessing available land, please refer to the global Energy Report (Section 5.3
p164 onwards24 Forthcoming: WWF Position Paper on the European Commission’s proposal on indirect land use change25 http://ec.europa.eu/energy/renewables/biofuels/land_use_change_en.htm26 As in the EU 2020 energy savings target of 20% on primary energy, it is compared to the 2007 Primes baseline;
this is 1873 Mtoe in primary energy in 2030.27 This is original number from RE-shaping, not recalculated for heat pumps, since it is not clear how it is treated in
the numbers quoted. This number is therefore not fully comparable to the other scenarios28 In TER heat pumps are treated as energy saving, rather than RE production. In the RES directive heat pumps are
treated as RE production.


Why we are here
www.wwf.eu
To stop the degradation of the planet’s natural environment andto build a future in which humans live in harmony with nature.
100%RECYCLED
• PUTTING THE EU ON TRACK FOR 100% RENEWABLE ENERGYEU
WWF.EU/CLIMATE
100%WWF has a vision of a world powered by 100% renewable energy sources by 2050
95%The EU needs to cut its greenhouse gas emissions by at least 80-95% by 2050 (from 1990 levels)
38%The EU has the potential to use 38% less energy by 2030 compared to business as usual projections
40%The EU could be generating more than 40% of its energy from renewable sources by 2030
50%By combining high energy savings and renewables, the EU could reduce its energy related greenhouse emissions by 50% compared to 1990 levels
Cutting energy related emissions in figures
© 1986 Panda symbol and ® “WWF” Registered Trademark of WWF-World Wide Fund For Nature (formerly World Wildlife Fund), WWF European Policy Office, 168 avenue de Tervurenlaan, Box 20, 1150 Brussels, Belgium. Tel: +32 2 743 88 00, www.wwf.eu