report final - universiteit twenteessay.utwente.nl/60435/1/msc_karin_wijma.pdf · karin ellen...
TRANSCRIPT

Karin Ellen Wijma, 2009 Master thesis Twente University, Industrial Engineering Principals Ir. R.P.E. Paes, Technomed Europe Mr. H.A. Tarya Hidayat, Technomed Asia Supervisor Technomed Ir. R.P.E. Paes, Technomed Europe First supervisor Twente University Dr. P.C. Schuur Second supervisor Twente University Ir. S.J.Maathuis
Kar
in E
llen
Wij
ma
2009
Imp
rovi
ng
logi
stic
inte
ract
ion
s be
twee
n T
ech
nom
ed E
uro
pe
and
T
ech
nom
ed A
sia
-shi
ftin
g re
spon
sibi
liti
es-


iii


i
PREFACE
From March 2008 I have spent my time researching the logistic interactions between Technomed Europe and
Technomed Asia; both companies felt that logistics were not functioning optimal. Getting a grip on the
assignment was not always trivial. The original problem was vague, information not always easily available, and
complex connections typified the problem cluster.
The people at both Technomed Europe and Technomed Asia have been very supportive in helping me finding
my way through the project. I especially want to thank Roel Paes, my supervisor at Technomed Europe and a
crucial factor in my graduation project. He guided me through the project, extracted information from the ERP
system, which was hard work, and drove me to the train station many times.
At Technomed Europe I also want to thank the management for the time they invested in brainstorming with
me, the logistics head Eric Seegers for informing me about the logistic processes, and Mr. John Paes for
thinking along, always expressing his trust, and bringing me cheese and newspapers in Indonesia.
At Technomed Asia I have to thank all of the management for thinking along and always being very
cooperative, it was very pleasurable and comfortable working with them. It was an interesting experience to
come to Padalarang around the same time with the new plant manager Mr. Hari Winarno, and to find out
together what was actually going on at Technomed Asia. I want to thank him for his efforts and also for driving
me home every day. Last but not least I want to thank Mr. Adé Tarya for being very supportive of my work,
looking after my well being during my stay, and for the delicious food he and his wife have provided on several
occasions.
Of course I could not have done the assignment without the help of Peter Schuur and Stephan Maathuis, my
supervisors at Twente University. With their clear vision and wealth of experience they have helped me
structuring the research and the report in a way that I could not have done without them. Their sense of
humor, chattiness and good mood are contagious, which always made our meetings a combination between
useful, interesting, and fun.
I want to thank all of the people mentioned above for not only offering me the opportunity to learn about
logistic processes occurring in international supply chains and applying knowledge in a business environment,
but also for offering the opportunity to have an experience that has left a mark in my character and my world
view for the rest of my life.
Without my father and my late mother I would not have been where I am today. So I want to thank them for
believing in me, paying for my education, and helping me develop an open mind towards people and cultures
that are different (and for many other things).
Karin Wijma
February, 2009

ii
EXECUTIVE SUMMARY
This report contains a research for a graduation project carried out on behalf of Technomed Europe and
Technomed Asia. Together the companies develop, produce, market and sell medical accessories. Problems
arising after the transfer of production activities from Technomed Europe to Technomed Asia, in a faster pace
than planned, formed the main motive for the research.
The research focuses on the logistic interactions between Technomed Europe and Technomed Asia, which are
rapidly becoming more and more complex. The main research question is stated below:
“How to improve the logistic interactions between Technomed Europe and Technomed Asia”
A supply chain framework from literature was used as a guide for identifying and describing ongoing processes
in and between Technomed Europe and Technomed Asia. The first phase of the research was to map the
logistic processes; information about them was not readily available at Technomed and had to be gathered by
the researcher from interviews. Important results from the first phase were the material flow charts for all
products assembled at Technomed Asia (relevant products), a description of the information structure at both
companies, and a description of the control structure of the supply chain.
Within the current, logistical structures, performance measurement is done mainly on an intuitive level. These
intuitive measures are not systematically translated into measurable indicators. Key performance Indicators
(KPIs) were distinguished by holding Technomed’s intuitive measures and problems against a theoretical
framework of KPIs. Among others, important measures of performance are order lead time, forecasting
accuracy, Technomed delivery reliability, and stock levels.
Current performance is poor; total cycle time can take up to 29 weeks, the CODP is located at 10 weeks before
the order, forecasting can be off by 50%, stock takes up 34% of Technomed’s yearly turnover, and 46% of
Technomed’s products is delivered late. Research on the causes of poor performance was widely oriented.
During the research the lack of shared vision at Technomed Europe and Technomed Asia was striking. Both
companies do not work from a common interest or for each other’s interest. They could not do that if they
wanted to, because common interests are not known. Communication between the two companies is very
poor, which sabotages the positive development of the relation between Technomed Europe and Technomed
Asia.
Problems mainly correspond with poor performance, and causes are located in many areas. Furthermore,
problem areas are strongly interrelated; together they form a complex problem cluster. Referring to the main
research question, we find that the focus of the research is on logistic interactions. Prominent logistic problems
were: late and unstructured deliveries and requests from Technomed Europe to Technomed Asia, long lead
times, obsolete inventory, high stock levels, a high amount of backorders, and a lack of information availability.

iii
Due to the strong interconnectedness of the problem cluster, solving these problems will automatically affect
other problem areas in a positive way.
Options for logistical improvement were found from literature and from analyzing all individual steps in the
supply chain. Alternative designs were presented, and after close considerations the researcher and
Technomed management decided it was best to proceed with the following scenario:
• Keeping raw material stock at Technomed Asia
• Keeping strategic inventory at Technomed Asia
• Installing an information management system at Technomed Asia
• Giving Technomed Asia the freedom to make autonomous decision.
The main purposes of keeping raw material stock at Technomed Asia are: to create a less hectic schedule at
Technomed Asia, to reduce the number of problems with customs and tax.
Technomed sells products that, for some customers, are packed in customer specific pouches and boxes.
Keeping strategic inventory in Asia, means that a generic product will be kept in stock, and that this product
will be pouched and packed after an order has come in. This should decrease total end-product stock levels and
the number of stock-outs, by making use of the risk pooling effect. Also it should provide shorter customer
order lead times.
Free decision making at Technomed Asia should reduce the complexity of managing both raw material stock
and strategic inventory and it should also reduce the need for communication, and delays due to the time zone
difference. The information system is suggested as a support for all activities mentioned above.
Calculations on the effect of risk pooling on DSNE stocks show minimal stock reductions of 19.3%, and
maximum stock reduction of 56.8%. The CODP will be located further down the chain, from 10 to 5 weeks
before the incoming order. In these 5 weeks strategic inventory will be picked and packed to order, shipped to
Technomed Europe, be sterilized, and be checked for quality.

iv
Products that could reap benefits from keeping strategic inventory are DSNE, DHNE, DMNE and DCNE. The size
of the benefits depends on the type of contracts that Technomed makes with customers in the future.
Implementation of these changes should be done with great care and not all at once. The information system is
a prerequisite for holding and managing stock at Technomed Asia. This information system should be able to
communicate with Technomed Europe’s information system and it should be validated in order to open the
road to growth of responsibilities for Technomed Asia. Technomed Europe should be the main actor in
implementing and controlling the proposed changes. If implementation is done in close cooperation and in
multiple, monitored steps, in the researcher’s opinion, the possibilities for success and future development will
be great.

v
CONTENTS
Preface ......................................................................................................................................................... i Executive summary ......................................................................................................................................iv List of figures............................................................................................................................................ xviii List of tables.............................................................................................................................................. xxii 1 Introduction ........................................................................................................................................ 1 2 Problem formulation, Research questions and methodology ............................................................... 4
2.1 Problem formulation...................................................................................................................... 5 2.2 Research Questions...................................................................................................................... 6 2.3 Methodology ................................................................................................................................. 9
3 Company Description ....................................................................................................................... 14 3.1 Global overview .......................................................................................................................... 15 3.2 History ........................................................................................................................................ 19 3.3 Organization Technomed Europe............................................................................................... 21 3.4 Organization Technomed Asia .................................................................................................... 24 3.5 Company results ......................................................................................................................... 25
4 Creating a logistic perspective .......................................................................................................... 29 4.1 Supply chains ............................................................................................................................. 31
4.1.1 Customer order decoupling point (CODP)............................................................................ 33 4.2 Strategic, Tactical and Operational management ........................................................................ 34 4.3 Performance measurement ......................................................................................................... 36 4.4 Culture........................................................................................................................................ 41 4.5 Multicultural communication and management ............................................................................ 44 4.6 Conclusion.................................................................................................................................. 49
5 Analyzing Technomed Europe & Technomed Asia............................................................................ 51 5.1 Technomed Europe .................................................................................................................... 54
5.1.1 Products.............................................................................................................................. 55 5.1.2 Material identity ................................................................................................................... 58 5.1.3 Material Flow....................................................................................................................... 60 5.1.4 Information management..................................................................................................... 67 5.1.5 Performance Measurement ................................................................................................. 69 5.1.6 Communication ................................................................................................................... 78 5.1.7 Controlling and operating the supply chain .......................................................................... 79 5.1.8 Cost .................................................................................................................................... 82
5.2 Technomed Asia......................................................................................................................... 82 5.2.1 Material flow........................................................................................................................ 82 5.2.2 Performance measurement ................................................................................................. 82 5.2.3 Communication ................................................................................................................... 82
5.3 Summary .................................................................................................................................... 82 6 Problem Areas ................................................................................................................................. 82
6.1 Problem areas from a Technomed Europe perspective ............................................................... 82 6.1.1 Forecast and planning......................................................................................................... 82 6.1.2 Supplier reliability ................................................................................................................ 82 6.1.3 Vantage ERP system .......................................................................................................... 82 6.1.4 Logistics and flexibility......................................................................................................... 82 6.1.5 Transporting and receiving end products ............................................................................. 82 6.1.6 Communication ................................................................................................................... 82 6.1.7 Conclusion .......................................................................................................................... 82
6.2 Problem areas from a Technomed Asia perspective.................................................................... 82 6.2.1 Customs.............................................................................................................................. 82 6.2.2 Incoming material................................................................................................................ 82 6.2.3 Quality control ..................................................................................................................... 82 6.2.4 Warehouse.......................................................................................................................... 82 6.2.5 Production........................................................................................................................... 82 6.2.6 Communication, some illustrations ...................................................................................... 82 6.2.7 Autonomy............................................................................................................................ 82 6.2.8 Capabilities ......................................................................................................................... 82

vi
6.2.9 Summary ............................................................................................................................ 82 6.3 Categorized problem areas for TE & TA ...................................................................................... 82
7 Theoretical tools for redesigning the supply chain............................................................................. 82 7.1 Supply chain strategy.................................................................................................................. 82
7.1.1 Pareto curve........................................................................................................................ 82 7.1.2 Decoupling point ................................................................................................................. 82 7.1.3 Separation of “Base” and “Surge” Demands ........................................................................ 82
7.2 Risk pooling................................................................................................................................ 82 7.3 ERP............................................................................................................................................ 82 7.4 Conlcusion.................................................................................................................................. 82
8 Solution alternatives and suggestions............................................................................................... 82 8.1 Creating an agile supply chain .................................................................................................... 82
8.1.1 Discussion........................................................................................................................... 82 8.1.2 Summary ............................................................................................................................ 82
8.2 Other stock keeping options........................................................................................................ 82 8.2.1 Discussion........................................................................................................................... 82 8.2.2 Summary ............................................................................................................................ 82
8.3 Single node adjustments............................................................................................................. 82 8.3.2 Summary ............................................................................................................................ 82
8.4 Miscellaneous adjustments ......................................................................................................... 82 8.4.2 Summary ............................................................................................................................ 82
8.5 Suggestions and requests of a more practical nature .................................................................. 82 8.6 Conclusion.................................................................................................................................. 82
9 Selecting the most promising alternative........................................................................................... 82 9.1 Tangible and Intangible advantages of selected alternatives ....................................................... 82
9.1.1 100-level stock .................................................................................................................... 82 9.1.2 400-level stock .................................................................................................................... 82 9.1.3 Information System ............................................................................................................. 82 9.1.4 Autonomous decision making.............................................................................................. 82 9.1.5 Final proposal ..................................................................................................................... 82
10 Implementation strategy ................................................................................................................... 82 10.1 Basic requirements for the proposed changes ......................................................................... 82
10.1.1 Production....................................................................................................................... 82 10.1.2 Warehouse...................................................................................................................... 82 10.1.3 Stock management.......................................................................................................... 82 10.1.4 Printing............................................................................................................................ 82 10.1.5 Traceability...................................................................................................................... 82 10.1.6 Shipping frequency.......................................................................................................... 82 10.1.7 Unexpected situations ..................................................................................................... 82 10.1.8 Information system .......................................................................................................... 82
10.2 Implementation ....................................................................................................................... 82 10.2.1 Making compromises....................................................................................................... 82 10.2.2 Starting point: the information system .............................................................................. 82 10.2.3 Keeping 400-level stock................................................................................................... 82 10.2.4 Keeping 100-level stock................................................................................................... 82
10.3 Summary ................................................................................................................................ 82 11 Conclusion and recommendations.................................................................................................... 82
11.1 Answering the research question............................................................................................. 82 11.1.1 Analysis........................................................................................................................... 82 11.1.2 Problems and causality.................................................................................................... 82 11.1.3 Design and selection ....................................................................................................... 82 11.1.4 Implementation................................................................................................................ 82 11.1.5 Discussion....................................................................................................................... 82
11.2 Recommendations .................................................................................................................. 82 References ................................................................................................................................................ 82 Appendix A: additional material flow charts.......................................................................................... LXXXII

vii
LIST OF FIGURES
Figure 3-1 Concentric needles. Source: (Technomed, 2008)............................................................................... 1
Figure 3-2 Technomed product types and customer types................................................................................. 1
Figure 3-3 Technomed Europe Organigram Source: (Paes, 2007) ..................................................................... 22
Figure 3-4 Organizational chart of Technomed Asia........................................................................................... 1
Figure 4-1 Cultural dimensions; a comparison between Netherlands and Indonesia .......................................... 1
Figure 5-1 Disposable subdermal needles. Source: (Technomed, 2008) ............................................................. 1
Figure 5-2 Material flow of the disposable subdermal needle & Timeline in weeks from CODP and total. .......... 1
Figure 5-3 Material flow of the disposable concentric needle. Total timeline in week and timeline up to CODP displayed. ......................................................................................................................................................... 1
Figure 5-4 Technomed Asia material and information flow................................................................................ 1
Figure 5-5 Exemplary stock card...................................................................................................................... 82
Figure 6-1 Graphical representation of Technomed Europe problem areas........................................................ 1
Figure 6-2 corrective forecast, January 2007 to March 2008.............................................................................. 1
Figure 6-3 The Technomed supplier problem has two dimensions ..................................................................... 1
Figure 6-4 Technomed dilemma visualized........................................................................................................ 1
Figure 6-5 Technomed negative spiral............................................................................................................... 1
Figure 6-6 DCNE material flow and its many quality checks and movements...................................................... 1
Figure 6-7 on time and late deliveries by Technomed Europe............................................................................ 1
Figure 6-8 days late related to customer behavior. Data was sorted according to “days late” (blue line) and displayed in relation to customer behavior (days between order date and need-by date, red dots) ................... 1
Figure 6-9 Late deliveries by Technomed Europe further specified .................................................................... 1
Figure 6-10 Graphical representation of Technomed Asia's problem areas ........................................................ 1
Figure 6-11 Taxes, express delivery versus normal delivery ............................................................................... 1
Figure 6-12 Material travels faster than information ......................................................................................... 1
Figure 6-13 Cause-effect diagram for facility utilization problems...................................................................... 1
Figure 6-14 visual representation of the problem-cluster .................................................................................. 1
Figure 7-1 Pareto curve. Source: Christopher & Towill, 2001 (Christopher & Towill, An Integrated Model for the Design of Agile Supply Chains, 2001). ................................................................................................................ 1
Figure 7-2 Decoupling point. Source: Christopher and Towill, 2001 (Christopher & Towill, An Integrated Model for the Design of Agile Supply Chains, 2001)...................................................................................................... 1

viii
Figure 7-3 Combinations of base and surge demands. Source: Christopher and Towill, 2001 (Christopher & Towill, An Integrated Model for the Design of Agile Supply Chains, 2001).......................................................... 1
Figure 7-4 Information as a means of decision support. Source: (Mason-Jones & Towill, 1999).......................... 1
Figure 8-1 Delaying the CODP decreases customer response time ..................................................................... 1
Figure 8-2 Keeping 450-level stock visualized .................................................................................................... 1
Figure 8-3 Keeping 100-level stock; the current situation .................................................................................. 1
Figure 8-4 Keeping 100-level stock; proposed situation ..................................................................................... 1
Figure 8-5 Grinding in Asia (DCNE supply chain) ................................................................................................ 1
Figure 8-6 Purchasing in Asia............................................................................................................................. 1
Figure 8-7 Expedition at Technomed Asia.......................................................................................................... 1
Figure 9-1 stock levels before and after risk pooling effect ................................................................................ 1
Figure 9-2 real demand versus forecast............................................................................................................. 1
Figure 9-3 final solution as proposed by the researcher..................................................................................... 1
Figure 10-1 Mindmap regarding consequences of keeping stock at Technomed Asia ......................................... 1
Figure 11-1 final proposal ................................................................................................................................. 1
LIST OF TABLES
Table 4-1 framework for supply chain performance measurement. Source: (Gunasekaran, Patelb, & McGaughey, 2004).......................................................................................................................................... 39
Table 4-2 Organizational strategies for managing cultural diversity. Source:(Higgs, 1999)................................ 48
Table 4-3 Potential competitive advantages of different cultures. Source (Higgs, 1999) ................................... 49
Table 5-1 Material codes at Technomed Europe.............................................................................................. 59
Table 6-1 Forecast accuracy as estimated by Technomed Europe sales department .......................................... 1
Table 6-2 Updating the forecast and losing pipeline information ....................................................................... 1
Table 6-3 Technomed supplier reliability......................................................................................................... 82
Table 6-4 overview of total cycle time for all relevant products....................................................................... 82
Table 6-5 Data on lateness, customer behavior and order size ........................................................................ 82
Table 6-6 Reject rates incoming material control at Technomed Asia .............................................................. 82
Table 6-7 Organizational/planning problems................................................................................................... 82
Table 6-8 Problems related to supply .............................................................................................................. 82
Table 6-9 supply chain set up related problems............................................................................................... 82

ix
Table 6-10 Transport, Customs and Taxes related problems ............................................................................ 82
Table 6-11 Problems with incoming shipments at TA....................................................................................... 82
Table 6-12 Physical problems.......................................................................................................................... 82
Table 6-13 Communicational and Cultural problems ....................................................................................... 82
Table 7-1 source: (Fisher, 1997) Matching product types to an appropriate supply chain strategy .................. 82
Table 7-2 Market qualifiers and market winners. Source: Mason-Jones et al. (Mason-Jones, Naylor, & Towill, Engineering the leagile supply chain, 2000)..................................................................................................... 82
Table 7-3 Distinguishing attributes of the lean and agile supply chain. Source: (Mason-Jones, Naylor, & Towill, Engineering the leagile supply chain, 2000)..................................................................................................... 82
Table 7-4 three hybrid strategies and their appropriate market conditions. Source: Christopher & Towill (Christopher & Towill, An Integrated Model for the Design of Agile Supply Chains, 2001) ................................ 82
Table 7-5 Critical success factors (CSFs) in ERP implementation. Source: (Akkermans & Helden van, 2002) ...... 82
Table 8-1 Creating an agile supply chain.......................................................................................................... 82
Table 8-2 other stock keeping options............................................................................................................. 82
Table 8-3 Single node adjustments.................................................................................................................. 82
Table 8-4 Miscellaneous adjustments.............................................................................................................. 82
Table 9-1 Virtual stock in current situation ........................................................................................................ 1
Table 9-2 effect of risk pooling.......................................................................................................................... 1
Table 9-3 old stock levels compared to expected stock levels after implementing 400 level stock...................... 1
Table 9-4 Saving for the s43-438 ....................................................................................................................... 1
Table 10-1 Information system functionality importance ranking .................................................................... 82

x

Introduction
1
1 INTRODUCTION
Production and Logistic Management (P&LM) is one of the tracks within the Industrial Engineering and
Management Master’s degree programme at Twente University. This track focuses on the heart of the design
and control of manufacturing processes in the supply chain from raw material delivery to delivering end
products to customers. In order to obtain a Master’s degree a student participating in the P&LM track has to do
a graduation project. The graduation project, in essence, is about applying knowledge, gained in university,
during a company traineeship. During my graduation project I focussed on finding ways to improve logistic
interactions between Technomed Europe (Netherlands) and Technomed Asia (Indonesia).
In this report we will start out with a problem formulation and posing research questions in chapter 2. After
that we will try to give the reader a feeling for the environment in which the problems exist, by providing a
company description in chapter 3. Once we have a feel for the company it is time to build a logistic perspective
in chapter 4. From this perspective it will follow which subjects are important to focus on from a logistical point
of view. Looking through our newly found logistic glasses we will then analyze the situations at both
Technomed Europe and Technomed Asia in chapter 5 and from our analyzing activities, a chapter with problem
areas at both companies will emerge (chapter 6). A complete overview of all problems is given in subsection
6.3. In chapter 7 we make a choice to study literature that will help us solve flexibility and responsiveness
problems in the supply chain. Some extra literature that was used in the solution direction of the final proposal
is also placed in this chapter. From a literature study in chapter 7 we move to developing scenarios for
improvement in chapter 8. This chapter contains various directions and options for improvement together with
their advantages and drawbacks. This information is summarized in a table in each subsection. The final choice
for a solution is made in chapter 9 (“Selecting the most promising alternative”). This chapter also contains more
detailed information about the advantages of these solutions. We conclude the research with some guidelines
for implementing the solutions in chapter 10, but to finish the report a conclusion and recommendations were
added in chapter 11.

2
2 PROBLEM FORMULATION, RESEARCH QUESTIONS AND METHODOLOGY
In 2004 a joint venture between the Dutch company ‘Paes Beheer BV’ (the holding company of Technomed
Europe) and the Indonesian company AbadiNusa, was established in Bandung, Indonesia. This new company
was named Technomed Asia.
Technomed Asia was intended to be active in the production of medical accessories such as infusion bags for
the Indonesian market and acts as an outsource for its sister company Technomed Europe. The production of
the infusion bags did not take off as well as it should have, and when, in 2005, Technomed Europe got into
trouble, a large amount of its production activities was transferred to Technomed Asia. Moving production
activities from Technomed Europe to Technomed Asia had to be done much faster than planned. The amount
of transferred production processes is ever increasing as is the number of problems connected to this.
Logistic interactions between Technomed Europe and Technomed Asia are getting more and more complex,
and both Technomed Europe and Technomed Asia feel that there is a lot to be gained from optimizing the
logistic interactions.
2.1 PROBLEM FORMULATION
The problem formulation of the assignment was derived from the current situation in which Technomed
Europe makes many shipments to Technomed Asia and back. Both companies felt that there is something to be
gained in the organisation of these interactions. The official problem formulation is stated as following:
“How to improve the logistic interactions between Technomed Europe and Technomed Asia”
The assignment can be divided in multiple parts based on several criteria. If location is used as a criterion we
could say that the assignment consists of a Dutch and an Indonesian part. If the purpose of the research is used
as a criterion we can divide the assignment in two phases, namely a describing and analyzing phase, and a
designing phase. The describing phase can be divided in describing the situation and describing problems that
occur in that situation.
2.2 RESEARCH QUESTIONS
Before commencing the research, we were not entirely sure what it would mean to optimize the logistical
interactions. The initial situation and all its problems were not yet known, and therefore the first part of the
assignment was to identify the logistical processes in the current set-up. Secondly their performance, the
causes of bad performance and other problem areas were determined. In order to improve performance
alternative designs were presented, and finally, a selection was made from these designs, for which a more
detailed implementation plan was written. These four steps are represented in the research questions below.

Problem formulation, Research questions and methodology
3
1.1. What are the current logistic processes occurring between Technomed Europe and Technomed Asia
and the factors that are influencing these processes?
1.2. What are relevant product groups?
1.3. What are relevant logistic Key Performance Indicators?
2.1. What is the performance of the current logistic processes?
2.2. What are the problem areas in the current logistic processes?
3.1. What alternatives can be designed for the current logistic processes?
3.2. What is the expected performance of these alternatives?
3.3. What is the expected best alternative?
4.1. What are the necessary conditions for this alternative to succeed, taking into account circumstances in
Indonesia?
The objective of the study is to give recommendations about ways to improve logistic interactions between
Technomed Europe and Technomed Asia. After answering the research questions Technomed will possess a
document that gives information not only about the current situation and problems, but that also will contain
recommendations on implementation of the best alternative(s), and that will help to prevent problems in the
future.
2.3 METHODOLOGY
The type of research required for my graduation project can be defined as business research, a business
research that focuses on improving a business process and thereby increasing overall performance. The
scientific method for business research is not as well developed as research methods in physical science. That is
why, in business research, it is extra important to justify and explain research methods.
A Business research consists of multiple phases. The first phase is a phase of orientation. In this phase we try to
get an insight into the problem areas (research questions 1.1 to 2.2). Then there is a design phase of possible
solutions for the problems and the selecting of the best option (This is where research questions 3.1 to 3.3
develop their content). Finally there is the implementation design phase (research question 4.1). This last
phase will result in an advice on implementation of the selected solution.
The scope of the research will be reevaluated throughout the project; as the understanding of the problems
grows, the focus will be clearer.
Various strategies for data collection will be used during the research. In addressing research question 1.1
(“What are the current logistic processes occurring between Technomed Europe and Technomed Asia and the
factors that are influencing these processes?”) and 1.2 (“What are relevant product groups?”) data is acquired
through interrogation and communication. This method is also applied to question 1.3 (“What are relevant
logistic Key Performance Indicators”), but in this case information obtained will be combined with information
from a literature study. For describing performance 2 and problem areas 2.2, in addition to previously

4
mentioned sources, primary data from the Technomed ERP system will be used and direct observations can be
made in both companies.
The design of alternatives (3) will be based on the problem areas identified, literature research regarding those
problems, and communication with those people involved, in order to assess attainability. After establishing
expected performance through inserting historical data in the designed situation (3.2), the best alternative
(3.3) will present itself as an attainable, well performing scenario. Implementation strategies and necessities (4)
are mostly retrieved from communication with those involved, but also from a literature study.
Different people will be interviewed during the research. People from different departments, with different
positions, even people from outside the company will be asked questions. Not all answers will have the same
value and because of the qualitative and subjective nature of the information, the information acquired in this
way cannot be interpreted as an absolute truth.

Problem formulation, Research questions and methodology
5

6
Figure 3-2 Technomed product types and customer types
Figure 3-1 Concentric needles. Source: (Technomed,
2008)
3 COMPANY DESCRIPTION
My graduation project is a traineeship on behalf of Technomed Europe and Technomed Asia. To give the reader
a feel for the context of the assignment a company description is given. Roel Paes, Manager Strategic Projects
and Member of the board at Technomed Europe, has written an elaborate company description (Paes, 2007)
from which I did extract and translate most of the information used for this description.
3.1 GLOBAL OVERVIEW
Technomed Europe is situated in Maastricht-Airport,
Netherlands, and Technomed Asia in Padalarang, Indonesia.
Together these two companies develop, produce, market and
sell medical accessories. Technomed Asia is mostly responsible
for the production, while Technomed Europe, besides
producing, also develops, markets and sells products.
Technomed Asia was originally intended to produce medical
infusion bags for the Indonesian market too, but due to
circumstances this project is not yet up and running.
Technomed Europe strives to be seen as a producer of high
quality medical accessories that are offered worldwide to market conform prices. Company philosophy is
described as following:
Ø Listen to the market;
Ø Develop quality products;
Ø Produce in an economical way;
Ø Have products available worldwide at
market-conform prices;
Technomed mainly provides needle and surface
electrodes and sensors that are used in clinical
neurophysiology, apart from this Technomed also
produces some custom-made medical accessories..
Technomed also trades in related products that
they do not produce themselves. This latter group
of products includes medical cables, temperature
probes and other medical diagnosing tools. These
products support or complete their production line
of neurophysiologic accessories.

Company Description
7
Technomed operates worldwide, but their main focus is on North-America, Europe and the Middle-East. In
these countries Technomed sells their products to a vast network of distributors that specialize in selling
medical diagnostic tools.
Technomed Europe also sells products to some 10 OEM companies. OEM relations sell Technomed products
with a private label. 70% of annual turnover is generated by these customers.
3.2 HISTORY
In 1980 a business enterprise called ‘Technomed Medisch-Technisch Adviesbureau’ is founded in Netherlands.
This company acts as a distributor of medical diagnostic tools to Dutch hospitals. In 1987 the company owns its
own distribution network as a result of the representation of several European and North-American producers
of medical accessories. In the same year the company status changes from privately to publicly held. To
support this change, the holding company ‘Paes Beheer BV’ is founded.
In 1994 the company commences its production activities of medical accessories, for which the subsidiary
‘Technomed Engineering BV’ is founded. Because of the constant growth of activities outside Europe the
company begins to operate under the name ‘Technomed Europe’. In 1997 ‘Paes Beheer BV’ ceases all sales
activities on the Dutch market, and focuses entirely on developing and producing medical accessories. From
this moment on the number of OEM customers for existing as well as custom made accessories keeps growing
steadily over time.
In 2004 the joint-venture ‘Technomed Asia’ is established; ‘Paes Beheer BV’ Holds 50% of this venture. In 2005
Technomed Asia is operational and labor intensive production processes are moved to this location.
3.3 ORGANIZATION TECHNOMED EUROPE
Technomed Europe is owned 100% by ‘Paes Beheer BV’. The owner of this holding company used to be the
director and founder of Technomed Europe, but recently this structure changed. ‘Paes Beheer BV’ is 50%
owner of ‘PT Technomed Asia’, the joint-venture partner AbidiNusa owns the other half.
Technomed Europe provides work to 47 employees. Almost half of these employees work in production.
Technomed Europe has three other departments that take care of the company’s core competences. These are
development, quality assurance, and marketing & sales. All other employees work to support these

8
departments.
Figure 3-3 Technomed Europe Organigram Source: (Paes, 2007)
Part of the production process takes place in a clean-room. Such a room provides Technomed Europe with the
possibility to clean and pack sterile products, before sterilization, without any dust particles.
Since 1997 Technomed Europe has her own Research & Development department. Between 8% and 10% of
yearly turnover is spent on product development and improvement of existing processes.
Quality assurance systems at Technomed Europe and Technomed Asia have been certified by TNO with ISO
9001:2000 and ISO 13485:2003. Development- and production processes are described in a quality assurance
system which is why the products are allowed to carry the European CE mark. Furthermore Technomed Europe
is registered with the American ‘Food and Drug Administration’ (FDA), which is why most products have a
‘510K’ that allows them to be exported to the North-American market. Technomed is also certified as a
supplier to the Japanese market.

Company Description
9
3.4 ORGANIZATION TECHNOMED ASIA
Technomed Asia was established in 2004 as a joint-venture between ‘Paes Beheer BV’ and the Indonesian
AbidiNusa. The Technomed Asia factory was built primarily to produce infusion bags intended for the Southeast
Asian Market.
The factory is certified by TNO. The quality system, identical to that of Technomed Europe, and the built-in
clean room made it possible to shift labor intensive production processes to Technomed Asia. Present day,
Technomed Asia has 60 employees.
An organizational chart of Technomed Asia is given in Figure 3-4.
3.5 COMPANY RESULTS
In 2005, after growing steadily every year, Technomed Europe was confronted with three problems that caused
problems especially to their American sales. First of all, due to a technical defect one hundred thousand
needles had to be replaced. The biggest customer bought the biggest competitor, and can provide in its own
needs now. And finally another big customer had copied one of the product lines in China.
Technomed reacted to these problems by lowering their product prices drastically (40% of the margin was lost)
and in this way Technomed managed to keep its market share. In order to be able to do this, 40% of labor
Figure 3-4 Organizational chart of Technomed Asia

10
intensive production activities were transferred to Technomed Asia. In 2005 there was a negative growth and
Technomed Europe ended the year with a big loss.
By cutting down expenses, letting go of personnel and expanding outsourcing activities to Technomed Asia,
Technomed Europe managed to grow again the next year. Technomed Europe also made investments in
projects that will guarantee future growth.
All in all the market in which Technomed Europe operates has changed a lot in the past few years. New
competitors have emerged, and import from China is putting pressure on prices. To deal with the low prices
Technomed Europe will have to bring down cost-prices more and more without reducing product quality. Also
there is a focus now on a more innovative way of working. New product lines are added to spread risk and
partnerships are formed with knowledge centers and Erasmus University in Rotterdam. Other ways of risk
spreading that Technomed tries to attempt are finding new geographical regions to sell their product and
trying to find new applications for existing products.

Company Description
11

12
4 CREATING A LOGISTIC PERSPECTIVE
In order to analyze the current situation, performance and problems we are in need of some perspective. Many
perspectives can be chosen to look at a situation; one might look at a company from a psychological or ethical
perspective or, like the researcher did, mostly from a logistical point of view. So, the question is: what defines
the current situation, performance and problems from a mostly logistical perspective?
Having participated in the “Production & Logistic Management” master’s program, the researcher already
possessed some perspective, but literature had to be consulted in order to determine if that knowledge was
sufficient. First of all literature on supply chains was gathered in order to provide an insight into the different
facets of supply chain design and thus into the building blocks of supply chains. A summary of this information
is given in section 4.1 Supply chains. The information was used as a guideline for analyzing Technomed’s
current situation.
After that an explanation of management and decision making at different levels is given in section 4.2
Strategic, Tactical and Operational . This theory is used as a way for the researcher to know the positioning of
her own suggestions and adjustments, but also as a basis for the following section (4.3 Performance
measurement) in which performance metrics are given for the different levels of the supply chain.
Since the study is carried out in two countries some cultural perspective was added in section 4.4 Culture to get
an initial feel for the cultural differences between Netherlands and Indonesia. Section 4.5 gives extra
information on intercultural communication.
4.1 SUPPLY CHAINS
What aspect of Technomed should a logistics student analyze? The first thing that comes to mind when
products are shipped from one part of the world to another is the concept ‘supply chain’. What is a supply
chain? What are its building blocks? What is its purpose? To determine what a supply chain is actually made of,
literature about designing supply chains was consulted. To design one, all aspects should be taken into account.
According to literature (Vorst & Beulens, 2002) there are four important elements to be considered when
designing a supply chain, namely the following:
“Chain Configuration: The structure, facilities (locations) and means, the number of parties involved and the
roles to be performed by them in the supply chain”
“Chain control structure: The set of decision functions (located at multiple decision layers with different
decision horizons) that govern the execution of operational activities aimed at realizing logistical objectives
within the constraints set by the chain configuration and strategic objectives (e.g. Delivery frequency, order
acceptance policy, production planning structure”, location of CODP, Using ICT or not, batch sizes, etc.).

Creating a logistic perspective
13
“Chain information systems: The systems (with their characteristics) that support decision making and/or are
required to perform operations (e.g. EDI, ERP, APS, etc.)”.
“Chain organization and governance structures, which assign tasks (along with corresponding responsibilities
and authorities) to organizations and persons in the supply chain” (purpose of the chain, performance
indicators, incentives).
Other literature like Stadtler (Stadtler, 2005) coincides with the literature mentioned above. Stadtler finds that
the focus of supply chain management is on the material, information and financial flows and the ultimate aim
to fulfill customer demand and improve competitiveness.
4.1.1 CUSTOMER ORDER DECOUPLING POINT (CODP)
According to Christopher and Towill (Christopher & Towill, 2000) real demand is usually not known through the
whole supply chain. Supply chains tend to hold multiple levels of inventory from the point of raw material
arrivals to the actual market place; inventory held upstream tends to be forecast driven rather than demand
driven. The point at which customer demand can still reach into the supply chain is called the customer order
decoupling point (CODP). It is the point where market “pull” meets forecast’s “push”
4.2 STRATEGIC, TACTICAL AND OPERATIONAL MANAGEMENT
Supply chain planning, decision making, and controlling can be done at the strategic, tactical or operational
level.
Strategic decisions establish the context in which the tactical and operational decisions will have to be made.
Strategic decisions often involve long term decision making in order to achieve long-term corporate objectives.
Tactical decision making encompasses decisions that are made in a mid range time horizon, within the given
structure of the strategic plan. Operational decision making is day to day decision making at the front line of
the company. The following paragraphs show some examples of strategic, tactical and operational decision
making in a supply chain. Examples were retrieved from the article “Decision models in global supply chain
management” (Narasimhan & Mahapatra, 2004).
Examples of strategic decisions to be made in a supply chain are the number, location, and size of warehouses
and distribution centers, partnership with suppliers, distributors, and customers, direct shipping, and third-
party logistics, which products to sell, product design, information technology infrastructure, where-to-make
and what-to-make-or-buy, the location of the CODP.
Whereas tactical decision might be about the following subjects: sourcing contracts and other purchasing
decisions. Production decisions, including contracting, locations, scheduling, and planning process definition.
Inventory decisions, including quantity, location, and quality of inventory. Transportation strategy including
frequency, routes, and contracting.

14
Operational decision making examples are: daily production and distribution planning, including all nodes in
the supply chain. Production scheduling (for each manufacturing facility in the supply chain). Demand planning
and forecasting, sourcing planning, inbound operations, including transportation from suppliers and receiving
inventory. Production operations, outbound operations, order promising.
4.3 PERFORMANCE MEASUREMENT
Gunasekaran et al. (Gunasekaran, Patelb, & McGaughey, 2004) created a framework for supply chain
performance measurement. In this framework they display metrics that can be used for performance
measurement on strategic, tactical and operational levels for different supply chain activities. These
performance metrics can be useful in assessing the current situation and performance at The Technomed
companies.
Supply chain activity/ process
Strategic Tactical Operational
Plan Level of customer perceived value of product, variances
against budget, order lead time, information processing cost, net profit vs. productivity ratio, total cycle time, total cash flow time, product development cycle time
Customer query time, product development cycle time, accuracy of forecasting
techniques, planning process cycle time, order entry methods,
human resource productivity
Order entry methods, human resource productivity
Source Supplier delivery performance, supplier lead-time against
industry norm, supplier pricing against market, efficiency of purchase order cycle time,
efficiency of cash flow method, Supplier booking in procedures
Efficiency of purchase order cycle time, supplier pricing
against market
Make/ Assemble Range of products and services
Percentage of defects, cost per operation hour, capacity
utilization, utilization of economic order quantity
Percentage of defects, cost per operation hour, human resource
productivity index
Deliver Flexibility of service system to meet customer needs,
effectiveness of enterprise distribution planning schedule
Flexibility of service system to meet customer needs,
effectiveness of enterprise distribution planning schedule,
effectiveness of delivery invoice methods, percentage of finished
goods in transit, delivery reliability performance
Quality of delivered goods, on time delivery of goods,
effectiveness of delivery invoice methods, number of faultless
delivery notes invoiced, percentage of urgent deliveries, information richness in carrying out delivery, delivery reliability
performance
Table 4-1 framework for supply chain performance measurement. Source: (Gunasekaran, Patelb, & McGaughey, 2004)
The ultimate performance indicators for a company as a whole indicate how well the company can manage to
keep its competitive advantage over other companies. According to (Thatte, 2007) there are five constructs for
competitive advantage; the ability to compete on the basis of a low price, the ability to deliver such a good
quality and performance that it has added value for the customer, the ability to deliver the right amount of the
right product in the exact moment the customer requires it, the ability to release new products in the market

Creating a logistic perspective
15
Figure 4-1 Cultural dimensions; a comparison between Netherlands and Indonesia
and the ability to release products in the market faster than competitors. Respectively these abilities are
referred to as price, quality, delivery dependability, product innovation and time to market. To score on these
constructs is important, without customers a company has no right to exist. Therefore Technomed Europe
should try to score on them.
4.4 CULTURE
As Technomed Europe and Technomed Asia are situated on different continents, we can say that, with great
probability, there is and will be a difference between the cultures of the two companies and the people
working there.
Hofstede (Hofstede) in his research put together 5 dimensions of culture. These dimensions can be measured
and can give a good indication of how cultures differ from each other. The five dimensions of culture are:
• Power distance index (PDI) “the extent to which the less powerful members of organizations and
institutions (like the family) accept and expect that power is distributed unequally” (Hofstede)
• Individualism (IDV) “the degree to which individuals are inte-grated into groups” (Hofstede)
• Masculinity “the distribution of roles between the genders”, “the assertive pole has been called
'masculine' and the modest, caring pole 'feminine'” (Hofstede)
• Uncertainty avoidance “society's tolerance for uncertainty and ambiguity” (Hofstede)
• Long-term orientation “It can be said to deal with Virtue regardless of Truth” (Hofstede)
The value of the dimensions has been
measured for Indonesia and Netherlands. A
comparison of the two countries is given in
Figure 4-1. A score for Long-term orientation
is not given, but most probably that score is
low, since “values associated with Long Term
Orientation are thrift and perseverance; values
associated with Short Term Orientation are
respect for tradition, fulfilling social
obligations, and protecting one's 'face' ”
(Hofstede) Values associated with short-term
orientation can be observed quite frequent in
Indonesian culture.

16
4.5 MULTICULTURAL COMMUNICATION AND MANAGEMENT
The world trade magazine (BNP Media, 2006) gives some interesting insights as to how improve effectiveness
of intercultural communication. According to them communication is more than merely translating information
from one language to another. The information should be adapted to the social nuances in the culture of the
receiver; one should employ culturally appropriate communication techniques.
Cultural communication dynamics can be translated into terms as humor, grammar, analogies, active or passive
voice and symbolism. Any person communicating in a multicultural setting should take these potential problem
areas in consideration.
Typical problems in intercultural communication take place in the following areas, a direct quote from (BNP
Media, 2006):
• “Culturally inappropriate or confusing analogies, metaphors, puns, idioms and slang
• Cultural references that are inappropriate or could lose meaning (e.g., gender-specific roles, humour,
ethnic, geographical, or historic references)
• Names and slogans that are culturally inappropriate
• Confusing graphics or icons
• Grammar issues (e.g., ambiguous use of direct and indirect objects, gerunds, nouns, adjectives, relative
pronouns, questions in negative form, etc.)”
Type of organization
Perceived impact of cultural diversity on
organization
Strategy for managing the impact of cultural
diversity
Most likely outcomes of strategy
Frequency of perception and
strategy
Parochial: Our way is the
only way
No impact: Cultural diversity has no
recognized impact on the organization
Ignore differences: Ignore the impact of
cultural diversity on the organization
Problems: Problems will occur but they
will not be attributed to culture
Very common
Ethnocentric: Our way is the
best way
Negative impact: Cultural diversity will cause
problems for the organization
Minimize differences: Minimize the sources and impact of cultural diversity
on the organization. If possible, select a mono-
cultural workforce
Some problems and few advantages:
Problems will be reduced as diversity is decreased while the possibility of creating
advantages will be ignored or eliminated; problems will
be attributed to culture
Common
Synergistic: The combi-
nation of our way and their
way may be the best way
Potential negative and positive impacts:
Cultural diversity can simultaneously lead to
problems and advent-ages for the organization
Manage differences: Train organizational
members to recognize cultural differences and
use them to create advantages for the
organization
Some problems and many advantages:
Advantages to the organization will be realized
and recognized; some problems will continue to occur and will need to be
managed
Very uncommon
Table 4-2 Organizational strategies for managing cultural diversity. Source: (Higgs, 1999)
There are three strategies for managing cultural diversity, they are displayed in Table 4-2. If cultural differences
are managed with care, the company may reap from the potential competitive advantages that these cultures
have to offer, as displayed in Table 4-3.

Creating a logistic perspective
17
Power distance
Low Accept responsibility
High Discipline
Individual/collective Individual
Management mobility College
Employee commitment
Uncertainty avoidance Low
Innovation High
Precision
Masculine/feminine Masculine Efficiency
Mass production
Feminine Personal service Custom building
Table 4-3 Potential competitive advantages of different cultures. Source (Higgs, 1999)
4.6 CONCLUSION
Theory gathered in this chapter will be used to analyze Technomed from a logistical point of view. Especially
section 4.1 to 4.3 will help us to perform a logistically complete analysis and to find a basis for continuing the
research. The continuation of the research shall follow from the key performance indicators that will be
identified during the analysis phase. Poor performance will indicate a need for a closer focus on that particular
measure to try to find the causal relations leading to that poor performance. This is done in chapter 6. Section
4.4 and 4.5 were added because the researcher felt it was inappropriate to analyze a global supply chain
without any notion of possible, cultural differences.
Poor performance and problem areas as will be described in chapter 6 (“Problem Areas”) will form
opportunities for improvement; this is what we will focus on in chapter 7 (“Theoretical tools for redesigning the
supply chain”) and chapter 8 (“Solution alternatives and suggestions”).

18
5 ANALYZING TECHNOMED EUROPE & TECHNOMED ASIA
Now that we have acquired a perspective, it is time to start the field work and analyze the current situation.
With the help of literature summarized in chapter 4 (Creating a logistic perspective) we have established
relevant supply chain areas to focus our attention to.
As far as possible, a description of the relevant areas as posed in chapter 4 was given for both Technomed
Europe and Technomed Asia. Material flow from supplier to the end customer, information flow, control
structure, performance measurement and other things will be analyzed in this chapter. In doing so, we will be
answering research questions 1.1, 1.2, 1.3, and 2.1 at least for a part.
The chapter is divided in two main sections; one for Technomed Europe (5.1) and one for Technomed Asia (0).
In the Technomed Europe section we will start with a more elaborate description of the products that are
produced, after which we will proceed among others to the material flow, information management,
performance measurement, financial aspects, and more.
The Technomed Asia section contains information about the material flow through the company, their
information management and performance management. Since Technomed Asia is a relatively small part of the
supply chain as a whole and they do less of the controlling in the chain, the description of their activities is less
elaborate than the description of Technomed Europe’s activities. Both sections have an introduction in which
more detailed information about the structure of the subsections is given.
We conclude with a short summary in section 5.3. In the process of analyzing both companies and the supply
chain, many problems were revealed. These problems are discussed in chapter 6.

Analyzing Technomed Europe & Technomed Asia
19
Figure 5-1 Disposable subdermal needles. Source: (Technomed, 2008)
5.1 TECHNOMED EUROPE
Technomed Europe controls most of the supply chain from raw material to outsourcing assembly to sending
end-product to the customer. In describing the current situation at Technomed we will use the 4 basic
elements of a supply chain as described by Van Der Vorst and Beulens (Vorst & Beulens, 2002). That is to say
chain configuration, chain control structure, chain information systems, and chain organization and governance
structures. First, we will elaborate on relevant products and the information structure attached to them
(section 5.1.1 and 5.1.2), then the material flow of two exemplary products is described in section 5.1.3. From
the focus on products and material items we shift our attention to immaterial aspects of the supply chain. In
section 5.1.4 a short description of the company ERP system is given, after that we briefly describe important
performance indicators in section 5.1.5 and communication (5.1.6), and in 5.1.7 control rules of the chain are
further explained. In the last section 5.1.8 a short, qualitative reflection is given about financial aspects of the
supply chain.
5.1.1 PRODUCTS
Not all of Technomed's products are assembled in the Technomed Asia facility. The products that are produced
in Indonesia can be roughly divided into six product groups: Disposable Subdermal Needles (DSNE), Disposable
Monopolar Needles (DMNE), Disposable Hypodermic Needles (DHNE), Disposable Concentric Needles (DCNE),
Cotop Needles, RCN and SMK, and Disposable Adhesive Surface Electrodes (DASE). Most of these products are
advanced types of needles that can be used for diagnostic, stimulating and treatment purposes except for the
DASE which is a non invasive tool. These products do all have in common that their assembly requires intensive
labor, which is exactly the reason that they are assembled in Technomed Asia.

20
5.1.2 MATERIAL IDENTITY
As the materials, used for production, flow through either of the Technomed companies, their identity will
change. The identity is reflected in the product code and each production step may change the identity. A table
of the used codes is displayed below.
Code Type of material
100 Raw material
200 Subassembly of raw materials or a processed raw material
300 Subassembly containing a 200 level material or a processed 200 level material
400 Assembled product
500 Assembled product inserted in a pouch which is inserted in a box
including instructions for use or in other words the end product. Usually one box contains multiple pouches with products.
Table 5-1 Material codes at Technomed Europe
Up to the 400-level, products of one product (sub-) group tend to be generic. However, pouches and boxes are
customer specific, the main reason being the artwork that is printed on them. There are some exceptions to
this rule, for some products (DCNE and DMNE) a customer specific hub is used in the assembly, which means
the product is not generic up to the 400-level, at least not for all customers. Technomed sells the same
products to different customers, some have their own boxes and others buy the Technomed brand. The
customer specific products have different article numbers than the Technomed product, but in essence the
product is the same. Not all products that are produced at Technomed Asia are sold to multiple customers.
Cotop needles for example are produced only under the Cotop brand. For DSNE, DHNE, DCNE and DMNE the
number and type of customers varies with time.
5.1.3 MATERIAL FLOW
Material flow of the 6 relevant product groups was analyzed and mapped. To include them all in this chapter
would be superfluous, but the complete overview can be found in “Appendix A: additional material flow
charts”. Two examples have been chosen to reflect the variety in Technomed's material flow. The DSNE
material flow figure XX is the simplest flow in the company. All of the other five product groups follow the
same path as the DSNE from the Customer Order Decoupling Point (CODP). DSNE material flow will be used as
the main reference throughout the report. Yet to be able to asses another set of problems that Technomed

Analyzing Technomed Europe & Technomed Asia
21
encounters it is necessary to incorporate a second exemplary material flow of the DCNE. The DCNE material
flow, in its turn, is the most complex material flow at Technomed.
5.1.3.1 DSNE MATERIAL FLOW
As stated before, the DSNE flowchart is the least complex of all Technomed material flows. There is virtually no
branching going on and all is straight forward. The first time materials enter the Technomed environment is
when they arrive there after being ordered several weeks before. Some of the materials need to undergo
quality checks and therefore they are placed in a quarantine area, until they are released by quality control.
Other materials are of such reliable quality that they are accepted immediately, without a quality check. It is
Important to notice that the yellow (three day) quality
check box in Figure 5-2 displays the critical path. In reality
there is a bypass for the products that are not checked for
quality. Samples for approval are usually taken in the
Netherlands and not in Technomed Asia because the
knowledge and the (expensive) equipment are located at
Technomed Europe.
Figure 5-2 Material flow of the disposable subdermal needle & Timeline
in weeks from CODP and total.
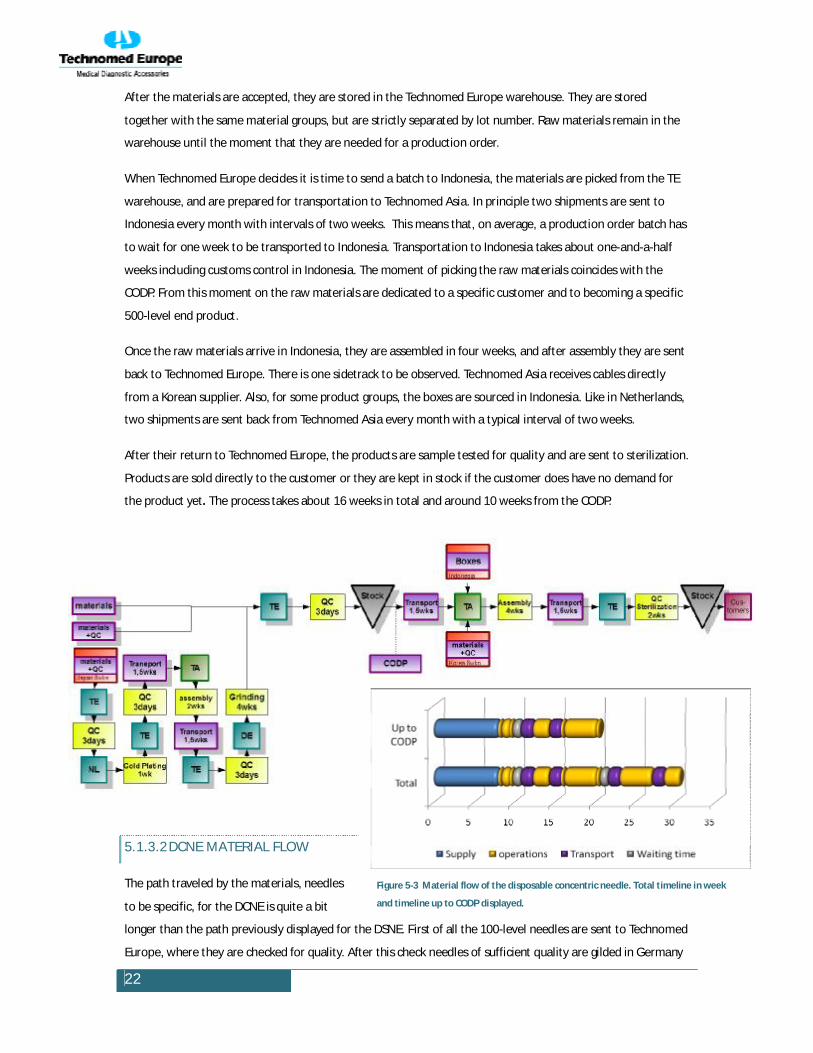
22
After the materials are accepted, they are stored in the Technomed Europe warehouse. They are stored
together with the same material groups, but are strictly separated by lot number. Raw materials remain in the
warehouse until the moment that they are needed for a production order.
When Technomed Europe decides it is time to send a batch to Indonesia, the materials are picked from the TE
warehouse, and are prepared for transportation to Technomed Asia. In principle two shipments are sent to
Indonesia every month with intervals of two weeks. This means that, on average, a production order batch has
to wait for one week to be transported to Indonesia. Transportation to Indonesia takes about one-and-a-half
weeks including customs control in Indonesia. The moment of picking the raw materials coincides with the
CODP. From this moment on the raw materials are dedicated to a specific customer and to becoming a specific
500-level end product.
Once the raw materials arrive in Indonesia, they are assembled in four weeks, and after assembly they are sent
back to Technomed Europe. There is one sidetrack to be observed. Technomed Asia receives cables directly
from a Korean supplier. Also, for some product groups, the boxes are sourced in Indonesia. Like in Netherlands,
two shipments are sent back from Technomed Asia every month with a typical interval of two weeks.
After their return to Technomed Europe, the products are sample tested for quality and are sent to sterilization.
Products are sold directly to the customer or they are kept in stock if the customer does have no demand for
the product yet. The process takes about 16 weeks in total and around 10 weeks from the CODP.
5.1.3.2 DCNE MATERIAL FLOW
The path traveled by the materials, needles
to be specific, for the DCNE is quite a bit
longer than the path previously displayed for the DSNE. First of all the 100-level needles are sent to Technomed
Europe, where they are checked for quality. After this check needles of sufficient quality are gilded in Germany
Figure 5-3 Material flow of the disposable concentric needle. Total timeline in week
and timeline up to CODP displayed.

Analyzing Technomed Europe & Technomed Asia
23
and sent back to Technomed Europe for another quality check. Subsequently the needles are sent to
Technomed Asia, where a platinum-iridium thread is entered into the needle, and the needle is then sent back
to Technomed Europe for a Quality check. If the needle passes the quality check, it is sent to Germany to be
grinded, and from this point on the needle will follow the same path as the raw materials for the DSNE. Up to
this point the materials have been traveling for 19 weeks already, total cycle time surmounts to 29 weeks.
5.1.4 INFORMATION MANAGEMENT
Information and information management is of vital importance to Technomed Europe. As a medical company
Technomed has to comply to certain certificate requirements and has to be able to guarantee traceability.
Traceability means that for each end product it is known which raw material with which lot number is used to
produce it. This traceability is also useful in the case that a product recall is needed. In such a case not all of the
products, but only certain batches might have to be recalled. The importance of information management
reaches beyond mere traceability. Other information like prices, order lead times, delivery dates, stock level,
material status, bills of material and more are of equal importance to the effective management of the supply
chain.
In order to manage all available information, Technomed Europe has invested in a digital database system called
Vantage. Employees of the different Technomed departments can enter information into this system and can
also retrieve it. Most information is accessible to all of the authorized company staff.
5.1.5 PERFORMANCE MEASUREMENT
Performance measurement at Technomed can be divided into performance measurement of the supply chain
as a whole and performance measurement between Technomed Europe and Technomed Asia. If we look at
the supply chain performance metrics as described by Gunasekaran et al. (Gunasekaran, Patelb, & McGaughey,
2004) and combine them with the problems (chapter 6 “Problem Areas”) that Technomed experiences, we find
that some performance measures play a bigger part in Technomed Europe’s ability to gain and keep their
market share than others. These performance measures stand out from the crowd. Performance measurement
at Technomed is rather intuitive. Data is available from the databases, but structural performance
measurement is not always established. Still important measures do become clear whenever a problem
occurs. For example, if the number of back orders gets too high, that forms a problem, no matter if you know
the exact performance or not.
From literature, discussions with Technomed Europe, and observing problems, the researcher distilled
performance indicators that should be important to Technomed Europe, and that should be measured in a
structural way. In the remaining part of this section an overview of these proposed measures will be given. A
complete overview of theoretical performance measures can be found in Table 4-1. Actual performance is
discussed in chapter 6.

24
One very important performance indicator is customer perceived value, the Technomed product is seen as a
high quality product and therefore it has more value than its cheaper, Chinese counterparts. Quality wise
Technomed Europe performs well but the price of their product is higher. The option of private labeling also
increases the perceived value. Such a high perceived value level is very important to Technomed in order to
attract and keep customers.
While customers should perceive value as high as possible, Technomed Europe of course has to make sure that
the product cost-price is as low as possible. This will help them compete with cheap Chinese competitors.
Technomed should carefully look at everything that costs them money and see if it is really necessary. This
holds for materials, transport, operations, anything. All costs should be carefully registered and available. This
was not yet the case when the researcher was at Technomed Europe.
Another performance indicator that started to come into play after globalizing the supply chain is order lead
time. Order lead time has increased, with excesses up to more than a half year. Compared to the competitors
that can deliver from stock, this is much too slow. Order lead time is an important metric for Technomed
Europe. Technomed should always be fully aware of the different material flows and the location of the
decoupling point in those flows. This decoupling point should be located as far downstream as possible.
Furthermore Technomed could benefit from greater flexibility in the sizes of the orders that they can deliver
and the time that it will take to do so. Flexibility can be assessed by calculating, for example, the effect of 20%
increase in demand. What will the reaction time be? What will the cost be? Or calculating what the possible
order reduction can be x days prior to order delivery, without inventory or cost penalties. Currently this
indicator is not measured by Technomed Europe, but flexibility is very important as we will see in section 6.1.4.
Total cycle time in the current situation is closely connected to order lead time. In the future this will hopefully
not be the case, but it is always important to bring down total cycle time in order prevent having too much
work in progress and having to work with inaccurate forecasts.
High forecast accuracy can save the company big risks, like money that is tied up in the wrong stock. It could
also calm down the flow as a whole. Therefore the company should always strive to improve forecast accuracy.
Forecast Accuracy could not be measured during the researcher’s stay at Technomed. Old data was deleted
after updating it up to the last moment before the sell. This leaves us with unrealistic values of the forecast
accuracy.
Monitoring stock levels can be of help in measuring supply chain performance, but one should be careful to
interpret results. Inaccurate forecasts can cause high stock levels, but poor flexibility could give the same
result.
In the sourcing department it seems very important to keep measuring supplier delivery performance; quality,
quantity and on time delivery. With the recent emphasis on prices, material costs are an important measure,

Analyzing Technomed Europe & Technomed Asia
25
but these costs should also be weighed against order lead time, which has big influence on Technomed’s total
Cycle time. Supplier performance and material cost are already being measured by Technomed Europe.
Technomed produces and sells a very wide range of products (at least 1800 product codes). One product group
tends to be divided into wide ranges of length and thickness. Technomed should always carefully consider and
keep reconsidering if their ranges are necessary, sufficient or superfluous.
Information accuracy and availability is a performance indicator that was not mentioned in the framework of
Gunasekaran et al. (Gunasekaran, Patelb, & McGaughey, 2004). But as discussed in section 6.1.3 and 6.1.6
information accuracy and availability is an issue at Technomed Europe. First of all information should be readily
available through all departments in a system with appropriate architecture, and second the accuracy of that
information should be that high that people can actually depend on the information. Doing stock counts and
recording the differences between reality and the available information would be one way to measure
accuracy, these kinds of methods where reality is compared to available information can be established for
many variables. Also one could measure if desired or required information is available when needed.
Delivery reliability of Technomed Europe Itself is of great importance to please customers and this should
always be measured and controlled. Measures for this are lateness, quality and the number of mistakes made.
Within the Technomed Europe and Technomed Asia network delivery reliability is also a good performance
indicator. What should be in when, and did it arrive according to plan, if not, why? Technomed Europe
experiences constant problems in this field, but an actual performance measure is not calculated.
It is a fact that many of the KPIs counteract each other. High quality with low cost price, shorter cycle times
with low cost production in Asia, they are all related to each other. In looking for improvements of logistic
interactions, we will have to take into account that none of these performance indicators can reach beyond
their critical values. These critical values are yet unknown for many performance indicators, but on an intuitive
level we can assess whether impact will be within limits.
Technomed Asia
Performance measurement of Technomed Asia is arranged in much the same way as it is for anything else at
Technomed Europe. Data is available, but there is not always a structural measurement of Technomed Asia’s
performance in place. Judging from the problems that will be described in the next chapter, we propose that
performance measurement should be based on the percentage of in process defects (corrected for bad
supplier quality of course), late deliveries and cost per operation hour. Capacity utilization at Technomed Asia
can form a performance indicator for both Technomed Europe’s and Technomed Asia’s performance,
depending on the reason behind that poor utilization, the cause can be with both companies as we will find out
in section 6.2.5.
5.1.6 COMMUNICATION

26
Internal communication at Technomed Europe is not optimal. Partly due to the Vantage ERP system that
doesn't work, the amounts of manual work that are done, the very busy employees, and lack of
interdepartmental meetings and standards.
External communication with Technomed Asia is experienced as difficult. It is not clear what is happening at
Technomed Asia, or who is responsible for it. Important information reaches Technomed Europe too late, and
not too many communication procedures are in place. There are non-conformity forms that are filed in by both
companies in case of big deviations and furthermore Technomed Asia sends monthly quality reports.
5.1.7 CONTROLLING AND OPERATING THE SUPPLY CHAIN
The instigator of all activity in the Technomed supply chain has to be the sales department. Sales make a
forecast of the expected future demand, and this forecast is used to plan all of the production; Technomed
produces to forecast and not to order.
To initiate the material flow, raw materials have to be purchased. Purchasing of raw material is done by a
purchaser that ideally gets his cues from the Vantage information system. The Vantage system contains the
raw material order lead times, stock levels and production orders (products to be produced at a certain time,
based on forecast). The combination of this information should, in theory, lead to a purchasing suggestion.
Once an order is made, the supplier will confirm this order and provide TE with a delivery date. This date is
entered into Vantage and from this moment on it will be known when the raw materials are expected and
when the final product should be due.
Raw materials are divided into A, B and C price categories. A C-category article is a very cheap article that can
be ordered a year in advance. Orders of this type of article can be delivered to Technomed Europe at once, or
they can be paid and delivered on a monthly basis. The latter option saves stock, storage space and the amount
of money invested. Technomed Europe has different types of contracts with suppliers. Sometimes Technomed
is obliged to take an order from the moment it is made and other times the order can be changed up to 8
weeks in advance. A-articles, The most expensive materials, are bought as late as possible.
When the materials arrive, the logistics department gains power over the control of the material flow.
Materials obtain a lot number, are checked for quality and after approval they stay in the warehouse until they
are needed for a production order. Material that does not make it through the quality check is placed in the
rejected material stock. Possible actions to perform on this material would be to return the material to the
supplier, to do rework on it, or to sort the good from the bad material.
When the material is needed for production the logistics department decides which lot numbers will go into a
production order. First of all a batch card is printed. A batch card holds information about the 500-level end-
product like the bill of material, about operational steps and about the new batch number that will be the lot
number for the end product. Furthermore there are open spaces for registration of the raw material lot

Analyzing Technomed Europe & Technomed Asia
27
numbers. These spaces are filled in by the order picker when the material for the batch is collected. If the end
product contains a subassembly an extra batch card is printed for this subassembly.
If the batch is not yet complete due to absence of a raw material, the unfinished batch cards are kept at the
office and are checked against new arrivals every day. Complete batches are gathered in one box and are sent
to Indonesia along with batches of other products and all the batch cards. For some raw materials a surplus
amount is sent to Indonesia to prevent problems from in process material rejection. Counting of small parts is
done with the help of a counting scale.
At Technomed Asia a digital overview of the production orders is available long before the raw materials and
batch cards physically arrive there. This overview is used to make a production planning conform to
Technomed Europe's wishes regarding product delivery dates. During production the operational steps on the
batch card are signed by the workers that execute them. In this way it is always known who touched the
product.
5.1.8 COST
Money should be available for spending and it should not be tied up in the wrong places. That is why it is
interesting to reflect on which elements in the supply chain are using up the money. First of all the raw
materials themselves cost money. Once the materials arrive at Technomed Europe they take labor from the
warehouse and quality control staff and they take up expensive space in the warehouse.
When materials are transported to Indonesia again labor is put into picking the material and processing
information, but most important are the transportation cost and the fact that there is valuable inventory in
transport that is doing nothing.
Once in the production facility of Technomed Asia, clearly labor will go into quality checking, and assembling
and handling the products, and in some cases there might be taxes to pay. The work in process inventory is
worth money that cannot directly be spent by Technomed Europe and furthermore there might be some reject
material that will never repay itself.
Transportation to Technomed Europe will again mean that there is inventory in transport and that
transportation costs have to be paid. Also labor for receiving the goods and processing the information will
have to be paid.
At Technomed Europe there are the costs of sterilizing the products and keeping them in stock (holding cost),
or if there is a shortage, there might be lost sales that will virtually cost the company. Total stock, raw
materials, work in process, sub-assemblies and finished products currently take up more than 30% of
Technomed Europe's yearly turnover.
Last but not least there are the overhead costs of all the management involved in controlling the material flow
and in solving problems.

28
Figure 5-4 Technomed Asia material and information flow
5.2 TECHNOMED ASIA
From a Technomed Europe perspective Technomed Asia can best be compared with a black box. Material goes
in, time goes by and a product comes out. Sometimes there are problems, sometimes there are not. From a
Technomed Asia perspective much more things are happening in their company. In order to gain some more
insight into the workings of the Technomed Asia company we will try to find out what processes are set in
motion when material arrives at Technomed Asia.
In section 0 “Error! Not a valid bookmark self-reference.” we look at the path of the material from incoming to
production to shipment and at the information that is registered along this path. Since Technomed Asia is only
a small part of the whole system section 5.2 is less elaborate than section 5.1.Other things that will be
discussed are performance measurement in section 5.2.2 and communication in section 5.2.3.
5.2.1 MATERIAL FLOW
Before the material comes in at Technomed Asia a production plan is available this is based on Production
Orders (PO) that are received by email. Technomed Asia always plans full capacity and usually orders will come
in to fill the future schedule.

Analyzing Technomed Europe & Technomed Asia
29
When the materials for a PO come in at Technomed Asia from Technomed Europe, they are checked against
the material list that is sent along. If no materials list is included in the shipment, a new material list is made of
the incoming goods.
For some products the cables are sourced from Korea. These cables don't pass through Technomed Europe, but
they are sent directly to Technomed Asia. Quality control for these cables is done by sampling in America. Cable
quality is quite reliable. Boxes are sourced in Indonesia. No external quality control is being done on them.
After the receiving process is finished, most materials continue their journey to quality control. At quality
control quality is not tested by testing samples, but all of the material is looked at. If the materials are rejected,
Technomed Europe is consulted, and the materials are either sent back to Technomed Europe to prevent
trouble with customs, or discarded at Technomed Asia. Rejects at this point are registered in a generic scrap
form. In case of a big deviation, a non-conformity form is filled in. This will be sent to Technomed Europe and
they will be able to close a non conformity by identifying the root cause of the problem and thinking of a
corrective action that will prevent the same problem in the future.
Once released by the quality control department, the materials go into storage. Information about stored
goods are kept on a paper stock card, but a digital system in excel is being worked on. An example of what a
stock card looks like is given in Figure 5-5
Article Lot number
Date Proof No. Description In Out Remaining Date Proof No. Description In Out Remaining Date Proof No. Description In Out Remaining
Lot number Date Proof No. Description In Out Remaining Date Proof No. Description In Out Remaining
Figure 5-5 Exemplary stock card
Alongside of receiving materials a shipping plan is made for sending finished products to Technomed Europe.
Once this plan is approved of, production of the PO's involved can be started as soon as the production
capacity is free.
When production is ready to produce a batch, a proof of request is issued. On this proof of request the batch
number, part number, part name, lot numbers and the quantity that is needed from each lot are stated.
Materials can not be released to the production department without a proof of request.
Materials being picked from the warehouse are counted with the help of a counting scale whenever possible.
The realized amount of parts taken from each lot, this can differ from the requested amount, are written on
the proof of request and after that the proof of request is stored away for further processing. Further
processing involves updating the stock cards.

30
In production all materials are checked again for quality. If materials are rejected at this stage of the process
this is registered in a production scrap form. Production supervisors and staff sign the batch cards to confirm
that they are responsible for the assembly of this particular batch of product.
After assembly the 400-level products are stored in a big box, waiting to be pouched. Except for pouching the
pouching machine also does some accurate counting, so after pouching, the production department can be
really sure about the amount of product they produced. If there is still a problem with a product or the pouch,
and the product has to be rejected, this is registered in a packaging scrap form.
To finish the products to a 500-level end product they are packed by the packaging division that is situated in
the warehouse. After closing the boxes and labeling them, the batch can be approved and it will be added to
the pre-packing list. This list contains all the products that are sent to Technomed Europe in one shipment.
5.2.2 PERFORMANCE MEASUREMENT
Performance measurement at Technomed Asia consists of measuring Technomed Asia's own performance and
measuring Technomed Europe's performance. Most important internal performance measures for Technomed
Asia, according to the researcher, are yield, cost, on time shipments, and efficiency. Technomed Asia already
registers information about these types of things.
Technomed Asia does experience problems with Technomed Europe’s planning. These problems are observed,
but not officially measured. A good indicator for Technomed Europe’s performance could be to measure
balance in the workload, in both the short and the long term. Indicators of an unbalanced workload in the short
term are idle time and over time, resulting from late deliveries and rush orders. Furthermore performance
could be measured by recording the frequency of TNT use, recording taxes to be paid due to shipments outside
the standard protocol, recording fines given out by customs due to sloppiness.
Overtime and overtime could also be indicators of bad planning at Technomed Asia, so it is important to
include the cause of the imbalance in the measurement.
5.2.3 COMMUNICATION
Communication between Technomed Asia and Technomed Europe is not quite structured. There are some
standards like the monthly quality report containing global information about product quality, compliance,
non-conformities, production problems, improvements etc. and a non-conformity form that is filled in if there
is a big deviation. But daily problems are communicated mainly through e-mail in an unstructured way or
depending on the nature of the problem the problem is not communicated at all. Problems that are
communicated tend to be quality issues in production, but problems that transcend the operational level are
not communicated. For example overtime at Technomed Asia is not always communicated nor charged to
Technomed Europe, yet it is a hassle for Technomed Asia. Problems do seem to be the basis of and main
reason for communication between both companies.

Analyzing Technomed Europe & Technomed Asia
31
5.3 SUMMARY
In this chapter we have analyzed the way in which Technomed Europe and Technomed Asia function, guided by
the framework that we developed in chapter 4. We have seen the path from raw material to end-product and
the information flow, control structure, and costs that are connected to that process. We have seen that
controlling and planning activities are done mainly by Technomed Europe and that Technomed Asia depends
on them.
During the mapping of the material and information flow, identifying key performance indicators and
describing the activities in the company many problems and complex control structures were uncovered. Both
Technomed Europe and Technomed Asia were experiencing difficulties in all sorts of areas. The researcher took
stock of these problems and described them in chapter 6 “Problem Areas”. Problem areas are formed by poor
performance on the one hand, and by situations that are experienced in a negative way, but that are not
directly related to a performance indicator, on the other hand. Information about problem areas was gathered
in several ways. Open interviews with the management gave rich information about problems that were not
related to performance indicators, while data rendered information about problems that were measurable.
The next chapter discusses poor performance, problem areas and their causes from the perspective of
Technomed Europe and Technomed Asia.

32
Figure 6-1 Graphical representation of Technomed Europe problem areas
6 PROBLEM AREAS
Numerous people (management en operators) of both Technomed Europe and Technomed Asia were
interviewed to find out which problems were experienced at Technomed Europe and which problems are
experienced at Technomed Asia. The interviews were mostly open interviews. Rich information about ongoing
difficulties was rendered in these interviews.
Some problems were directly observed during the researcher’s stay at both companies, and during the
interpretation of data. In this chapter we try to give an answer to research question 2.2 (What are the problem
areas in the current logistic processes?). Also this chapter will give an insight into the current performance, as
requested in research question 2.1. Performance was measured according to the key performance indicators
that were given in section 5.1.5. The chapter will contain a mix of objectively measurable, poor performances
and subjective problem areas retrieved from the open interviews.

Problem Areas Technomed Europe
33
Table 6-1 Forecast accuracy as estimated by Technomed
Europe sales department
Month Jan Feb Mar Apr May Jun Jul Forecast 600 800 700 800 600 700 800
Real 400 700 Already in the pipeline Stock 200 300
Table 6-2 Updating the forecast and losing pipeline information
6.1 PROBLEM AREAS FROM A TECHNOMED EUROPE PERSPECTIVE
The transition from producing medical accessories in the Netherlands to producing them in Indonesia was
made relatively abrupt. The logistic interactions between Technomed Asia and Technomed Europe are based
on the old company structure in which production took place in the Netherlands. The new situation requires a
fair amount of managerial improvisation talent. During the researcher’s stay at Technomed Europe many
problem areas were identified. An overview of the problems, from a Technomed Europe point of view and the
researcher’s point of view, is given in this chapter. For a quick overview of all identified problem areas the
reader can skip to chapter 6.3 (Categorized problem areas for TE & TA). Sections in which objectively
measurable, poor performance is described are 0 (“Error! Not a valid bookmark self-reference.”), 6.1.2
(“Supplier reliability”), and 6.1.4 (“Logistics and flexibility”). Problems described in sections 6.1.3 (“Vantage
ERP system”), 6.1.5 (“Transporting and receiving end products”), and 6.1.6 (“Communication”) are based on
open interviews with the Technomed management.
6.1.1 FORECAST AND PLANNING
At the basis of the Technomed supply chain is the sales
forecasting. Production orders are based on forecasts and
shipping dates in their turn are based on the planning of
production orders. So a lot depends on the initial forecast.
Typical Technomed forecasts are derived in a qualitative
manner. Usually customers are interviewed about their
demand expectations and forecast. Forecasts given by the
customers are not binding, so customers don't have to buy
what they forecast to Technomed Europe. Forecasting in
this way is very difficult and not very precise. It is even
extremely imprecise; being 50% off is the rule rather than
the exception.
Forecasts are made one year in advance and are updated every month. Updates are always made in the old
forecasting document, and so the old forecast is discarded and deleted after an update. What is left is the
forecast as it was in December every year. This makes it nearly impossible to make a valid estimation of
forecast accuracy.

34
Figure 6-2 corrective forecast, January 2007 to March 2008
From the moment that a production order is initiated, which means from the moment that the batch card is
printed and the material is picked from the warehouse and prepared for transport to Technomed Asia, the
typical lead time lies around 3 months. In this case the lead time is the time it takes to obtain an end product
that is ready to be shipped to the customer. This is why there is always 3 months of forecasted demand in the
pipeline.
However, the sales department is unaware of this system, and forecasts tend to be updated up to one month
in advance. Because the old forecast is deleted when a new one is made, nobody at the sales department
knows exactly how much is in the pipeline. So they do not know how many products will be produced in reality
and how many of them they can sell. As a result big opportunities are missed, it is hard to anticipate and
promises cannot be kept.
Another problem concerning forecasting is the preventive correction of high, in process reject rates by
increasing the forecast. So if 40% of the product will be rejected, the forecast for that product will be
exaggerated without the rest of the company knowing about this. A forecasted demand of 600 boxes becomes
1000 boxes.
This kind of forecasting results in
incomprehensible forecasts, in which information
is included that should be included at the
production planning level. Forecasting like this
can lead to an internal bullwhip effect. And
example of a forecast with a different purpose
incorporated might look like Figure 6-2.
Looking at this chart where real demand and
forecasted demand are displayed together, there
is no reason to assume that the forecasted
demand will be actually sold in July to September,
and more so there seems to be no need to increase forecast after September, yet it is increased up to three
times. There is probably other information that might have led to a forecast like this, but that information does
not belong in the forecast, whatever good intentions may be behind it.
Production planning at Technomed Europe is not optimal. This results in processing steps taking longer than
they should. Needle grinding for example, can take up to four times longer (4 weeks instead of 1) than if it
would be carefully planned.
6.1.2 SUPPLIER RELIABILITY
After the complex task of forecasting demand, the next disturbance in the chain occurs on the supplier side of
the supply chain. Supplier performance (quality and timeliness) is below 95% for almost all suppliers.

Problem Areas Technomed Europe
35
Figure 6-3 The Technomed supplier problem has two dimensions
Untimeliness results in incomplete batches being sent to Technomed Asia and late shipments being sent by
TNT. TNT is more expensive compared to other means of transportation.
Late shipments also form a problem for
Technomed Asia's production
department that cannot produce the
production order in time if they get the
materials late. This in its turn leads to
complaints from Technomed Europe.
Quality issues with some of the materials
and processes cause high reject rates of
raw material and finished products.
Ultimately this creates problems with the end-customers. An interesting story is that of the gold plating of the
DCNE. This gold plating is totally useless for product functionality. Since the gold plating process is not yet fully
developed, it causes a lot of problems, including high reject rates and disturbances all along the supply chain.
Sales and marketing however want to keep the gold plate because that is how they positioned the product in
the market. Below, a table with some exemplary supplier reliability data is given. In this table “Delivery rate” is
defined as “On time deliveries” divided by the total number of deliveries and Quality rate is defined as “The
total number of order lines minus the non conform number of order lines” divided by “the total number of
order lines”
Supplier On time deliveries
Late deliveries
Delivery rate
Total number
order lines
Non conform
order lines
Quality rate
A 5 0 100.0 5 2 60.0 B 300 84 78.0 384 13 96.6 C 6 3 67.0 7 0 100.0 D 55 39 59.0 95 5 94.7 E 27 53 34.0 80 8 90.0 F 100 280 26.0 387 1 99.7 G 8 12 40.0 17 1 94.1 H 50 4 93.0 54 0 100.0 I 6 2 75.0 8 0 100.0 J 754 46 94.0 801 1 99.9
K 75 40 65.0 116 12 89.7 L 214 302 41.0 553 22 96.0
M 28 12 70.0 40 2 95.0
Table 6-3 Technomed supplier reliability
Shipments by TNT in one month in 2008 surmounted in approximately 18 million Indonesian rupiahs (The salary
of 18 operators at Technomed Asia for one month, ±€1250) of taxes to be paid, if normal transport means

36
would have been used, taxes would be zero. Not all the data was available, since it was in writing and not
digital, but the Technomed Asia finance department states that it is no exception to pay this much tax. Extra
transportation cost and handling and administration cost for extra shipments could also be omitted if normal
shipments were used to send materials to Technomed Asia.
6.1.3 VANTAGE ERP SYSTEM
Vantage is the Technomed Europe ERP system. All information concerning product traceability, forecasts, stock
levels and more of such should be available through Vantage.
In theory the Vantage system should play a clear and steering role in ordering raw materials, but in reality it
does not work that way. Order lead times that are registered in Vantage are more often wrong than right. This is
why much of the purchasing process is still done by hand, that is to say, by meetings between logistics and the
purchasing department. The prices stated in Vantage are also not up to date. This is why it is quite hard to
determine cost prices of the products.
When material is received by Technomed Europe it will first be placed in the quarantine area. This means that
the material has not yet been approved for use in production. The Vantage system does not make a difference
between approved and non-approved material stock. This would not be a problem if quarantined stock data
was not entered into the system, but if Technomed wants to pay the bill in time they have to enter the data long
before the quality check is finished. A bill will only be paid if the data is entered in the Vantage system.
The Vantage system has the possibility to make purchasing suggestions for Technomed Europe. But one of the
problems encountered in this function is that suggestions are made in the past, and buying materials in the past
is not an option, of course.
Furthermore Vantage is uncomfortable to work with, because of its data structure. When changing data of a
product that has ten colors in a box, all those ten colors will have to be addressed separately. This causes a lot of
clicking work for the person dealing with this data and a lot of opportunities for mistakes to be made.
All in all the architecture of and the faulty information in the Vantage system make it a system that has
potential, but that is not yet used optimally by Technomed Europe. Instead Excel and the employees are still
doing a big part of the work. This increases the risk of mistakes and also a lot of unnecessary work is done.
6.1.4 LOGISTICS AND FLEXIBILITY
The supply chain with its current decision points and material flow causes a lot of problems. Technomed
Europe feels that they are neither flexible nor responsive. And they are up to their noses in backorders and
complaints from customers.

Problem Areas Technomed Europe
37
Figure 6-4 Technomed dilemma visualized
Figure 6-6 DCNE material flow and its many quality checks and movements
Figure 6-5 Technomed negative spiral
Sales can only sell what they forecast, there is no safety stock and a quick response to a sudden change in
demand is impossible. Very little flexibility is available in the amount of product that can be produced and the
speed at which this can be done. Every decision made today will lead to a change in three months.
Materials are dedicated to end customers so early in the supply chain that it is very difficult to dedicate
shortages to customers. In the current situation a customer will get all or nothing at all. This can be a great way
to lose customers. Also Technomed Europe gets stuck with stock, end product that cannot be sold, because it is
in a package for the wrong customer. Many product-customer combinations can be found in Technomed
Europe’s stock. Stock value now takes up 34% of yearly turnover.
Logistical decisions are made for each individual
product, for each order even. There is a lack of a
model/strategy that covers all logistic decisions.
Because there are so many exceptions, a lot of
time is consumed by dealing with the separate
logistic problems, which in turn prevents time
being invested in developing a dependable logistic
plan. Technomed Europe management is
constantly involved in extinguishing little fires.
With the movement of the production to Indonesia lead times have increased from four to twenty nine weeks
in some cases. This results in a potential loss of orders and a big error in the forecast at the time that the
product is assigned to the customer.
The supply chain seems to be very inefficient, this holds especially for the DCNE flow. Because materials are not
tested for quality at Technomed Asia an extra round of transport to Technomed Europe is needed. See Figure
6-6 for visualization.

38
Figure 6-7 on time and late deliveries by Technomed Europe
Cycle times for some products are extremely high, because of the current supply chain set up. An overview of
total cycle time for all relevant products is given in Table 6-4.
Total product cycle time Product DSNE DCNE DHNE DMNE DASE COTOP
RCN COTOP SMK
Weeks 16 29 25 20 14 15.5 20.5
Table 6-4 overview of total cycle time for all relevant products
If we look at the Technomed Europe's data of orders from 2005 to 2008, we can see that many orders were
shipped too late. If the data is organized by customer specific part number it can be seen that some customers
are served late in 100% of the time, for example with private-label customer NK. Overall Technomed’s delivery
performance seems equally bad among all customers.
Customer NK falls in the category of customers that need the product on the day that they order them, this
need of customer NK is practically never fulfilled by Technomed Europe. Yet if the customer orders very early,
there is still a big chance that their order will be delivered late. If we take into account only late orders and
connect them with customer behavior as in Figure 6-8,
there can be observed a slightly positive correlation
(0.138) between the lateness and how far in advance the
product was ordered. Indicating that Technomed Europe
responds better to rush orders than to planned orders. Yet
this correlation is very small.
Looking at all order lines and the number of boxes of
products that were ordered and subsequently delivered,
we could say that 46% of all ordered boxes were delivered
too late by Technomed Europe. This percentage of late
Figure 6-8 days late related to customer behavior. Data was sorted according to “days late” (blue line) and displayed in relation to customer
behavior (days between order date and need-by date, red dots)

Problem Areas Technomed Europe
39
Figure 6-9 Late deliveries by Technomed Europe further specified
deliveries is quite constant from 2005 to 2008. The data was not entirely correct and late deliveries are not
always Technomed’s fault, so the 46% is a worst case outcome.
Figure 6-9 further specifies the nature of these late
orders by dividing them in six categories. These
categories represent how late the orders are (one
week, two weeks, etc., up to more than five weeks). If
customer behavior is compared for these six categories
we find again that a high preparation time for TE goes
along with late deliveries. This could be due to the size
of the orders, since there is some correlation to the
time given to Technomed Europe and the size of the
order. But orders that are delivered on time as well as
orders that are delivered late can have big sizes, as
indicated by a lack of correlation between order size and lateness. An other explanation might be that
customers that order early are of a different type than customers that order late and that consequences of not
serving them are milder than the consequences of not fulfilling a rush order, but this is pure speculation.
Category (weeks late)
Need date – Order date on average (days)
Average size of orders (boxes)
5+ 32 61 4-5 15 47 3-4 17 47 2-3 29 64 1-2 27 72 0-1 22 49 0 45 71
Table 6-5 Data on lateness, customer behavior and order size
Table 6-5 Displays some extra data about the late deliveries and their connection to order size and customer
behavior. There seems to be no obvious connection between these variables.
6.1.5 TRANSPORTING AND RECEIVING END PRODUCTS
Shipment of end products means shipping air. The ratio of the volume to the weight is far too big and therefore
a volume price is charged, which is higher than the price for the weight. It would be better if this ratio was close
to one.
Apart from this when 500-level products come back from Indonesia, total chaos emerges at Technomed
Europe. Boxes containing products from the same batch are mixed to achieve maximum entropy it seems, and
the packing list is no better. It takes Technomed Europe a lot of time, effort, and stress to get these boxes to
the sterilizing company in time.

40
6.1.6 COMMUNICATION
The communication within Technomed Europe is not functioning optimal. Sales does not communicate within
sales itself, as can be seen by their individual forecast making, and sales does not communicate the right
information with logistics and production, logistics in its turn does not structurally communicate with
Technomed Asia. Within Technomed Europe there are meetings between departments, but meetings do not
usually result in an improved situation. Everybody at Technomed Europe is always very busy.
Not many official procedures for communication have been installed. In case of a serious exception, a non-
conformity form is written, which can be closed by coming up with a root cause of the problem and a
corrective action, but otherwise communication is mostly free and relaxed. This also holds for the
communication between Technomed Europe and Technomed Asia, but in this case it can lead to big problems.
Technomed Asia personnel do not accidentally run around in the same building, so they will never accidentally
get information from anywhere. Within Technomed Europe it is not clear who bears responsibility for the
communication with Technomed Asia.
Technomed Asia functions like a black box. It is not clear what happens there and which problems occur there.
When a promised shipment from Technomed Asia is late, sometimes this is not communicated to Technomed
Europe. Sales will already have made promises to customers, but the products will just not arrive. This leads to
complications with the customer and irritation at Technomed Europe.
Now and then high material reject rates are not communicated to Technomed Europe. Technomed Europe
might think that there is still a stock of 10.000 needles in the Technomed Asia warehouse, but in reality it is
possible that these have been wasted in production. Again communication between the two companies is very
minimal.
Usually Technomed Europe will not know what the stock count of certain materials at Technomed Asia is. Stock
counts have been requested, but these are delayed or cancelled for reasons unclear. All in all there is a lot of
mystery that surrounds the Technomed Asia production plant.
Another problem in the communication is how to communicate the criteria for reject. These criteria are
somewhat subjective, “it's a feeling” is a much heard statement, that often results in reject rates that are either
too rigid and high or too low. This leaves the Technomed Europe company with an all or nothing sentiment
concerning quality control by Indonesian workers, it is either too much or not enough.
Final problem is the slow internet connection at Technomed Asia, this makes it troublesome to have good and
frequent communication and to exchange data.

Problem Areas Technomed Europe
41
6.1.7 CONCLUSION
The author realizes that the number of problems and their variety can be overwhelming. A summary of the
problems at both Technomed Europe and Technomed Asia is given in section 6.3. The problems at Technomed
Asia are discussed in section 6.2.

42
6.2 PROBLEM AREAS FROM A TECHNOMED ASIA PERSPECTIVE
Technomed Asia experiences the Technomed supply chain and its problems from a different angle. There are
problems that are internal to the Technomed Asia company, but also they are experiencing problems from
being on the receiving end of Technomed Europe's policies. Both types of problems are described in this
chapter. In addition problems diagnosed at Technomed Asia by the researcher are incorporated into this
chapter.
We will begin with describing the problems with customs in section 6.2.1, after which we will proceed to the
problems that are experienced when the material comes in 6.2.2. Problems in the areas of Quality control
(6.2.3), the warehouse (6.2.4), production (6.2.5), communication (6.2.6), autonomy (6.2.7), and capabilities
(6.2.8) will follow. A summary of all problems can be found in section 6.3.
Figure 6-10 Graphical representation of Technomed Asia's problem areas

Problem Areas Technomed Asia
43
Figure 6-11 Taxes, express delivery versus normal delivery
6.2.1 CUSTOMS
Technomed Asia has to deal with customs a lot, namely when they receive goods and when they send them. It
seems to them that Technomed Europe is not as concerned with this as they should be.
In Indonesia there are arrangements for companies that import material and export the product to another
country. These arrangements state that everything that is exported within a year is free of taxes. If of course
these materials are imported and exported through the official channels.
Technomed Europe sometimes sends products to Technomed Asia without discussing first, so for some
products they have a stock that is more than they can use up in 1 year of production and export. To correct this
situation Technomed Asia has to make this stock magically disappear in the papers, commit fraud. This is done
by making packing lists which are sent to customs as unspecific as possible (no lot numbers) and then by doing
the magic with the lot numbers in a later stadium when the tax report should be handed in. A higher level of
communication about the shipments that will be sent would be a great relieve for the Technomed Asia staff.
If TNT is used to make a fast delivery, which happens on a regular basis, taxes have to be paid by Technomed
Asia. These taxes exists of 10% Value Added Tax (VAT), a minimum of 5% import duty and 2.5% of import
income tax. This surmounts to a minimum of 17.5% of tax. For a small shipments the minimum tariff for TNT
should be added to the extra cost, but TNT is always more expensive than the normal carrier.
Technomed Europe can be somewhat careless with their packing lists. Many mistakes tend to be in the packing
list and not every item included in the shipment is always stated on the packing list. This is risky behavior. First
of all it results in fines that have to be paid, but if the problem turns up too frequently, the whole free of tax
import and export arrangement can be cancelled.
Another problem that occurs with customs is that every now and then they decide to take samples from
Technomed Europe material. This causes the shipment to stay in customs care, and to arrive at Technomed
Asia three later than scheduled.

44
Last but not least Technomed Asia gets stuck with surplus raw materials that are never required for production
again, yet there is no policy for dealing with these materials and after one year taxes will have to be paid for
them. In some cases Technomed Asia uses these left over materials when there is a shortage in another
production run. This is disastrous for traceability.
6.2.2 INCOMING MATERIAL
When material comes in from Technomed Europe, the materials list is often delayed. Technomed Europe
makes mistakes in the labeling of the sent materials on a regular basis (assigning wrong lot numbers, wrong
article numbers). If the materials list is not sent along with the shipment, the material label is used for
registering what materials are contained in the incoming shipment. This results in extra time needed to process
incoming material, but also in needles lying around in the warehouse with the wrong lot number, causing
problems when batch production starts up, and reduced traceability.
Part of the material shipments arrives with no information accompanying it at all. In this case Technomed Asia
will have a box of stuff that they don't know what it is for (for which batch, which purpose). In this case they
have to look through all batch cards and information available, until they find the part and lot number
somewhere. This takes a lot of time and energy and it can cause mistakes.
When material lists are received it is still a lot of work to compare the listed materials with the sent materials,
since the material list article descriptions can be utterly unspecific and many mistakes are being made. Terms
like “needles” are being used, but there are 5 product groups containing needles of many different lengths and
diameters. A written lead wire may turn out to be a canula in reality. Usually the material list is rewritten by the
person receiving the material.
Sometimes the material for a PO sent to Technomed Asia is not complete or the amount is not sufficient.
Because materials are sent to Technomed Asia just before production commences, many problems are caused
by this. Usually the production process gets delayed, this can cause idle time and a delayed shipment, and in
Figure 6-12 Material travels faster than information

Problem Areas Technomed Asia
45
the worst case, if it is important that the shipment is delivered back in time, also overtime. This overtime is not
charged to Technomed Europe, but very inconvenient for Technomed Asia. In the situation as described above,
Technomed Europe uses TNT to make an express delivery. Costs for this, from paying taxes can reach 18
million rupiah in one month.
6.2.3 QUALITY CONTROL
All incoming cables and almost all incoming needles are subject to a quality check. Except for the subdermal
needles, because there are simply too many of them. Quality control is done by a visual inspection with a
microscope and with the help of the criteria for reject that Technomed Asia got from Technomed Europe.
Quality checks like these can take weeks and they absorb a lot of Technomed Asia's capacity and time.
There are three problems connected to the incoming quality check. First of them is the fact that an incoming
quality check should not be done at all. Technomed Europe does sample testing and only if the material passes
that test, it is sent to Indonesia. In Indonesia quality checks should only be done “in process”. This saves time,
but also some products are quite vulnerable and can be damaged every time they are handled.
Yet quality checks on incoming material are being performed, and Technomed Asia encounters problems in the
communication about the “criteria of reject” with Technomed Europe. The Technomed Europe advice in
different situations with exactly the same defect may differ from time to time. Technomed Asia is trying to
collect all advice to create a list of clear criteria, but with all that ambiguity, that is harder than it seems.
The last problem is that the incoming check should not be necessary, but in practice, reject rates of around 10%
on incoming needles are no exception, especially for the concentric needles. If Technomed Asia does not
intercept these materials, they might be held responsible for rejects after production.
May 2008 Product
Type Qty. on PO Qty.
Real Qty. OK Qty. Reject
Percentage of reject
Monopolar 31888 31868 31370 498 1.56 %
COTOP 14081 14050 14023 27 0.19 %
Concentric 6687 6746 6099 647 9.59 %
Hypodermic 0 0 0 0 n/a
Subdermal 295947 n/a n/a
Table 6-6 Reject rates incoming material control at Technomed Asia

46
6.2.4 WA REHOUSE
The Technomed Asia warehouse is quite small, as is the production facility. At this moment a part of the
warehouse is used for packaging, which makes the usable area even smaller. This situation of having the
packaging staff in the warehouse is undesirable. As a consequence the warehouse cannot be locked, because of
the workers there. This makes it easier for end products to be stolen, but also for the workers to take the boxes
from the racks themselves, without filling in a proof of request. The latter sometimes leads to big differences
between the stock card and the stock count. Preferably the packaging staff would be separated from the
warehouse.
Circumstances in the warehouse are not optimal, temperature and humidity are high and the wood from the
new racks seems to release a lot of dust. The loading doors are opened most of the time, which allows small
animals to enter the building. There is no air conditioning for the workers, which means that just sitting around
and doing nothing is already heavy to do.
The warehouse is filled with boxes, boxes and boxes. The supplier delivers large quantities of boxes at once,
which fills up the warehouse with cartons every now and then. By ordering this way, more warehouse space is
used for boxes than necessary.
The way the hubs are stored in the warehouse is quite impractical. All hubs are stored in plastic bags in big
boxes that are stacked on top of each other. This results in moving the boxes around and searching for the right
hubs with the right part number for the right assembly somewhere in the box. Very time consuming
The counting scale in the warehouse is not precise enough to count needles. This has many negative
consequences. Each time the needles are needed they are counted, one by one, by hand. This can damage the
needle, it is time consuming and it is prone to error.
The last problem is not as much a warehouse problem as it is a traceability problem. Technomed Europe
sometimes sends too much material to Technomed Asia. This rest material is kept in the warehouse and is
never needed for production again. Whenever extra material is needed, because reject rates are high, or
because Technomed Europe did not send enough, this material is used for production. It is written down on the
batch card, but there is no official way to deal with this.
6.2.5 PRODUCTION
Technomed Europe tends to have many last minute requests. If a shipment leaves Jakarta at a certain date, it
leaves Technomed Asia 3 days before that date. Sometimes Technomed Europe tries to get certain orders
within a shipment that is due to leave within one or two days. This means that the Technomed Asia operators
will have to work long and crazy hours. Creating this much pressure, increases the amount of mistakes that are
being made. Furthermore the workload is unevenly spread, because of incomplete shipments or a shortage of
raw materials.

Problem Areas Technomed Asia
47
In an average month, Technomed Europe´s requests and acts result in a combination of idle and over time.
Taken over a whole year, the workload is even stranger. In the beginning of 2008 extra employees had to be
hired to deal with the demand, but later in the year it was possible for the employees to develop other skills
during work time. The workload is very unbalanced.
Technomed Europe does not always seem to be aware of the holiday periods at Technomed Asia and of the
time needed to finish a production run. They might want to incorporate these in their production planning and
requests. Typical production can contain the following elements: transport from Europe to Jakarta (2 days),
handover (1 day), custom clearance (5 days), delivery to Technomed Asia (1 day), production (number
requested/capacity days), preparing documents (5 days), holidays (x days), and then the product can be
shipped. Many times capacity has to be increased by working overtime in the evenings and weekends to fulfill
Technomed Europe’s requests, and sometimes requests are just impossible to fulfill. Pushing such a request
anyway, gives a negative feeling and a feeling of incomprehension at Technomed Asia.
6.2.6 COMMUNICATION, SOME ILLUSTRATIONS
Incoming cables from Korea are all checked for quality. This takes somewhere in between 2 days and 1 week.
Lot numbers for these cables have to be given out by Technomed Europe, they are communicated to
Technomed Asia by e-mail. The time between the Technomed Asia request for lot numbers and the
Technomed Europe reply is usually quite long, at least one week. During this time the cables are kept
somewhere in the middle of the warehouse, because they cannot be stored without a lot number, a very
impractical situation. It would be better if lot numbers were issued immediately after the request. Most
remarkable about the situation though, is that this very simple problem was only communicated after minimal
mediation of the researcher.
Another example, Technomed Asia receives boxes with pouches. The label on the box says that the pouch is
pouch xxx revision b, but on the pouches themselves the number xxx revision a is printed. Technomed Asia
does not know if Technomed Europe is aware of this. It is unclear if this is a problem or not, but the problem
Figure 6-13 Cause-effect diagram for facility utilization problems

48
keeps occurring. Again, with very minimal effort of the researcher this issue was cleared up, and turned out to
be rooted in the Vantage system.
In the case of questions and non-conformities Technomed Europe was quite slow to react. In some cases 5 e-
mails with the same question had to be sent before a reply was given. Most of the time it is not clear who is the
right Technomed Europe employee to send a question to.
Where the reaction time to a non-conformity at Technomed Asia is usually around 0 days with a maximum of 6
days, Technomed Europe still had open non-conformities from a year ago. The researcher did observe how
Technomed Europe made the same mistake with labels three times in one month. A corrective action might
have helped in that situation.
Not a lot of initiative is taken from the Technomed Europe side to give information to Technomed Asia.
Technomed Asia is always free to ask, but this should not always be necessary, as in the following illustration.
The researcher joined batch picking in the Netherlands. During batch picking the picker was confused as to
which boxes should be used. On the batch card there was a new article number, corresponding to a new box,
but there was still a lot of stock for the old model. After some doubt and asking a superior the old boxes were
picked to send to Indonesia. The batch picker was already having problems with this information, which were
easily solved, but it might have been a good indicator for the fact that Technomed Asia was going to experience
some confusion.
When this batch was sent to Indonesia, no information was added regarding the use of the old box.
Technomed Asia had previously been told not to produce with the old boxes anymore. On arrival they noticed
the difference between the part number on the batch card and the part number on the goods received.
Because this inconsistency was not reported in advance, Technomed Asia had to send an e-mail with a question
to Technomed Europe and wait for an answer.
Intercultural communication is another issue. In one e-mail in reply to a question from Technomed Asia
someone states “That is a good question” without answering the question after that. In Netherlands this is a
totally acceptable statement and to a Dutch person it will be clear that that means that the writer does not
know the answer himself, but will think about it. In Indonesia, however, the researcher observed loud laughing
and amazement among the readers when this email was received. They were asking questions like why was the
question not answered if it was that good? Was this an incomplete reply?
Both Technomed Europe and Technomed Asia have to be aware that expressions, sayings and humor are
connected to culture and language.
Another difference between Europeans and Indonesians is found in handling conflict. The Indonesians are a
very kind people and they are not used to the use of strong language. Dutch people on the other hand can be
quite brutal compared to Indonesians. For Technomed Europe strong language is not the way to communicate

Problem Areas Technomed Asia
49
with Indonesians. On the other hand, for Technomed Asia euphemisms are not the way to deal with
Technomed Europe.
Then there is the issue of power distance (section 4.4) in Indonesia it is hard for people to complain to the boss.
The boss is on a pedestal, he is a busy, self made man that will most probably not have time for your little
problems. When Mr. John Paes visits Technomed Asia every three months he cannot expect the Technomed
Asia staff to complain to him or bother him with small issues. To get a real view of what is going on, someone
with a different status will have to go there.
Last but not least a meeting was scheduled by Technomed Europe on an Indonesian national holiday. It seems
like a good idea to inform both parties about the national holidays and their effect on meetings, shipments,
etc..
6.2.7 AUTONOMY
To deal with the fact that some of the raw materials are rejected, Technomed Europe often sends more raw
materials to Technomed Asia than needed for production. Since Technomed Europe prescribes the lot numbers
of the raw materials that should be used in production, Technomed Asia gets stuck with leftovers that form
dead stock. If they would have more autonomy in choosing which lot number could be used in which
production batch, it would be much easier for them to apply a first in first out (FIFO) system in the warehouse.
Such a FIFO system would be very helpful in dealing with tax problems that occur if a material has not been
exported within one year.
6.2.8 CAPABILITIES
Technomed Asia has the feeling that they can do more and they can do better. But the current set-up is limiting
their performance. This sentiment is felt in all levels of the company.
Technomed Asia has smart employees, that are able to make materials disappear in financial papers, that have
a good insight into local possibilities, that are able to detect many inconsistencies and mistakes made by
Technomed Europe, that are working with one hand tied to their back, because of a lack of resources, and that
are working below their capacities, etc., etc..
6.2.9 SUMMARY
We have seen that Technomed Asia experiences many problems from the disorganized control mechanisms at
Technomed Europe. We have also seen that communication about these problems is quite inefficient, which
has many different causes. Overall operations and management at Technomed Asia are unnecessarily
complicated by the current set up of control and level of communication. A complete overview of problems at
both Technomed Europe and Technomed Asia is given in the next section.

50
6.3 CATEGORIZED PROBLEM AREAS FOR TE & TA
Organizational/Planning problems
Problem Consequence Concerning
Unreliable forecasting TE Lost sales, too much stock. TE
Lack of adequate production planning at TE Grinding takes 4 weeks instead of 1 because it is not carefully planned.
TE
TE requests for production come in late Overtime for operators TA
Unbalanced workload Hiring of personnel versus no work TA
TA employees that can do more than they are allowed to do. Frustration, boredom TA
Table 6-7 Organizational/planning problems
Supply related problems
Problem Consequence Concerning
Insufficient supplier delivery reliability Disturbances in the material flow, express deliveries by TNT needed, hence high taxes paid.
TE/TA
Insufficient supplier quality reliability Disappointing production yield, problems with customer TE/TA
Vantage system data not up to date Purchasing dates have to be found by hand. TE
Table 6-8 Problems related to supply
Supply chain set up problems
Problem Consequence Concerning
Very rigid supply chain with long lead time No quick responses, all decisions take 3 months to take effect
TE
Shortages cannot be dedicated to customers, because of early CODP Loss of customers TE
End product stock that cannot be sold Cash not available for spending TE
Too much time needed to manage all deviating supply chain strategies No time left for the things that really matter TE
Inefficient shipments because TE performs many quality checks High transportation costs TE
Incoming material quality check at TA takes a lot of time Production can be delayed, work is paid TE/TA
Incoming material quality checks are superfluous Time and money is invested in something that should not be done. Materials can get damaged each time they are
handled
TE/TA
Material quality not good. Incoming checks at TA have to be done, because of low material quality
Superfluous quality checking. But who will be held responsible if there is an in process reject rate that is too
high?
TA
No autonomous decision making at TA Much communication required by decision structure, FIFO TA

Problem Areas Summary
51
system impossible, dealing with tax problems is complex
Use of surplus raw material in other batches Reduced traceability TE
Table 6-9 supply chain set up related problems
Transport, taxes and customs
Problem Consequence Concerning
Products lying around for more than one year at TA Paying at least 17,5% tax TE/TA
Shipments by TNT Expensive rates and a minimum of 17,5% tax paid TE/TA
Mistakes in packing list Risking fines and cancellation of import and export arrangements
TE/TA
Left over materials from assembly in the TA warehouse
Tax will have to be paid after one year, and it is a waste of material
TA
Shipping air Voume price is paid, while price paying per weight unit would be cheaper
TE
Table 6-10 Transport, Customs and Taxes related problems
Incoming shipments at TA problems
Problem Consequence Concerning
Materials list delayed when materials arrive at TA More work, more mistakes TA
Materials arriving at TA with no information at all A lot of searching for the right PO TA
Descriptions on materials list very unspecific or wrong
Rewriting materials list and finding out right product description
TA
Incomplete shipments Idle time and overtime at TA and a need for express delivery with TNT
TA
Boxes arrive in large batches at TA Warehouse filled with boxes TA
Lot numbers are sent late by TE. Cables cannot be stored or used and take up space in the warehouse
TA
Table 6-11 Problems with incoming shipments at TA
Physical problems
Problem Consequence Concerning
Warehouse too small Expansion of stock keeping activities is difficult TA
Packaging in warehouse TA Warehouse cannot be locked, making materials
susceptible to theft. Materials are given out without proof of request.
TA/TE
Temperature, humidity and dust conditions in warehouse TA not good Might be bad for products. Uncomfortable for working TE
Poor storage systems in TA warehouse Investment of time in picking. Many mistakes can be made TA
Counting scale not exact enough for counting needles
Counting by hand results in time loss, mistakes and damaged material
TA
No digital, online information system at TA Working in an ineffective manner. Information hard to control. Information not accessible within TA let alone
TE/TA

52
warehouse and no information available from TE outside TA. No possibilities of making an information system if data is not coming from TE
Slow internet connection at TA Difficult communication with TA TE
Receiving end-products at TE is a very chaotic event Stress and panic in the warehouse TE
Table 6-12 Physical problems
Communication/Cultural problems
Problem Consequence Concerning
Internal Communication TE not optimal Difficulties in sales department, angry customers TE
Technomed Asia functioning like black box No insight in what is happening why at TE TE
Stock levels at TA are unknown by TE Makes it hard to manage stock at TA TE
Quality control at TA either to strict or to loose Unnecessary delay of production and transport to TE TE
Materials list delayed when materials arrive at TA More work, more mistakes TA
Materials arriving with no information at all (TNT) A lot of searching for the right PO TA
Descriptions on materials list very unspecific Rewriting materials list and finding out right product description
TA
Ambiguous criteria for reject Confusion, reject for the wrong reason TA
No information system at TA warehouse and no information available from TE
Working in an ineffective manner. Information not available to all of TA, this makes Information hard to control. No
possibilities of making an information system if data is not coming from TE
TA
Bad communication between TA and TE No familiarity with root causes of common problems at TA,
inefficiencies, confusion. Other way around TA is not familiar with the causes of TE induced problems
TE/TA
Slow internet connection at TA Difficult communication between TE and TA TE
High power distance Difficult to get a plan going without someone having decision power being available
TE/TA
High power distance 2 Director (either Mr. Adé or Mr. Paes) will never hear the full story or hear small complaints, when visiting the site
TE/TA
TE not familiar with Indonesian national holidays Meetings planned on Indonesian national holiday TE/TA
Table 6-13 Communicational and Cultural problems
The problems at Technomed Europe exist within a complex context. Communicational problems might be non-
existent if Logistics were set up differently or vice versa. This holds for all problems, everything is connected,
the categories are connected. A clarification of this principle is given in Figure 6-14. This figure gives a visual
representation of the problem-cluster, the interconnections, and the complexity.
As a result of the broad focus of the research during the identification of the problem areas, we can observe
that the problems at Technomed find their origin in many different areas of expertise. To improve either
planning, organization or communication could form a graduation project in itself. It is hard to say whether one

Problem Areas Summary
53
of these problems is more important than another. If communication is improved, there might be fewer
problems with customs, taxes, and the supply chain. Yet if the supply chain is set up differently, much of the
current communication might be superfluous.
Because problems are interconnected in so many ways, there is no wrong place to start with improvements. At
Technomed, issues like communication and cultural differences have been assessed many times before. The
main research question for this project “How to improve logistic interactions between Technomed Europe and
Technomed Asia?” focuses on the logistic interactions and therefore we will proceed to find solutions with a
logistic focus. In practice this means that in this problem cluster we will concentrate primarily on supply chain
architecture
By making adaptations to the supply chain architecture and other logistic aspects of the supply chain we will
affect problems outside the logistic field. For example lower lead times might improve forecast accuracy, as
might a CODP that is located closer to the customer. A flexible supply chain might reduce the effect of
unplanned orders throughout the chain. Another location of stock points can reduce the number of rush orders
Figure 6-14 visual representation of the problem-cluster

54
and tax problems. An ERP system might cause a reduced need for communication about trivial things, as might
carefully choosing which products to move to Technomed Asia. There are enough benefits in other areas of
attention if we think with a logistic mindset.
This chapter mentioned other types of problems like the physical problems. Solutions for these can not be
found in supply chain set up, it was important to mention them though, if only to be complete. Furthermore
these problems do illustrate beautifully that easily solvable problems do exist within Technomed Europe and
Technomed Asia, but that collaboration and communication about them is not optimal. Teamwork and
communication affect logistic performance, while supply chain architecture affects the need for
communication and shared efforts in the first place.
From a logistic approach, we can see that because of low forecasting accuracy and long cycle times Technomed
Europe experiences difficulties with serving their customers, while keeping stock levels low at the same time.
Two approaches were taken in finding solutions to logistic problems. The first approach was to look at each
individual step in the supply chain to find out if any improvement could be found. The second approach was to
consult literature about supply chain strategy and redesign to find out if a new, supply- chain architecture
would be more suitable. Consulted literature is summarized in chapter 7 “Theoretical tools for redesigning the
supply chain”. In chapter 8 options for improvement are given, and in chapter 9 a definitive choice for an
expected best alternative will be presented.

Theoretical tools for redesigning the supply chain
55
7 THEORETICAL TOOLS FOR REDESIGNING THE SUPPLY CHAIN
Technomed is not the first company to experience problems with operating a global supply chain, an internet
search on the topic gives the impression that problems in globalizing the supply chain are quite common.
In section 6.3 we stated already that from now on the focus would be on logistics. In short this is because the
main research question “How to improve logistic interactions between Technomed Europe and Technomed
Asia” steers the research in that direction, and because the problems are interconnected in such a complex
way that improvements in any area will force improvements in other areas.
One of the means for finding a solution to Technomed’s logistic problems is to perform a literature study. This
study is performed in order to find proven techniques and solutions that are generally applied when other
companies have to deal with uncertain demand, long lead times and high stock levels.
In chapter 8 this theory will be applied to the Technomed supply chain, which will result in a presentation of
different scenarios along with their advantages and drawbacks. From these scenarios the most viable one will
be chosen. The theory about typical supply chain adaptations can be found in sections 7.1 to 7.3. In section 7.3
there will be some additional theory on information streams and implementing changes in information
management.
5. Through finding literature and applying it to the Technomed supply chain we will be answering research
question 3.1 (“What alternatives can be designed for the current logistic processes?”) and 4.1 (“What are
the necessary conditions for this alternative to succeed, taking into account circumstances in Indonesia?”).
7.1 SUPPLY CHAIN STRATEGY
All supply chain strategy begins with the product that you want to sell; different types of products require
different strategies. An innovative or fashion product might require a quick response to the market, while a
commodity product with predictable demand might be much more in need of a low cost configuration of the
supply chain.
Table 7-1 source: (Fisher, 1997) Matching product types to an appropriate supply chain strategy
Functional Products
Innovative products
Lean Supply chain
Match Mismatch
Agile Supply chain
Mismatch Match

56
These two types of supply chain strategy respectively fit with the concepts of agility and leanness. The
following definitions of agility and leanness relate the agile and lean paradigms to supply chain strategies. They
were developed by Ben Naylor et al. (Ben Naylor, Naim, & Berry, 1999).
“Agility means using market knowledge and a virtual corporation to exploit profitable opportunities in a
volatile market place.”
“Leanness means developing a value stream to eliminate all waste, including time, and to ensure a level
schedule.”
Mason-Jones et al. (Mason-Jones, Naylor, & Towill, Engineering the leagile supply chain, 2000) put forward the
idea of market qualifiers and market winners. Qualifiers form the baseline for entering into a competitive
arena, and winners are the specific capabilities that are needed to win orders. If we put this in a lean and agile
supply chain context, and try to find out what the qualifiers and winners are that are inevitably connected to
these strategies we find that the relation is as shown in Table 7-2.
Agile supply
1. Quality
2. Cost
3. Lead-time
1. Availability
Lean
supply
1. Quality
2. Lead time
3. Availability
1. Cost
Market
Qualifiers
Market
winners
Table 7-2 Market qualifiers and market winners. Source: Mason-Jones et al. (Mason-Jones, Naylor, & Towill, Engineering the leagile
supply chain, 2000)
Both strategies require minimization of the lead-time. In the agile supply chain lead-time has to be reduced in
order to exploit market demand, while in a lean supply chain time should never be wasted. Also both strategies
require a product of sufficient quality. The difference however, is that for an agile supply chain availability is
the main customer driver and in the lean supply chain cost are. Former research (Mason-Jones, Naylor, &
Towill, Engineering the leagile supply chain, 2000) has pointed out other distinguishing attributes for lean and
agile supply chain strategies. A comparison of these attributes is given in Table 7-3.

Theoretical tools for redesigning the supply chain
57
Distinguishing attributes Lean supply chain Agile supply chain
Typical products Commodities Fashion goods
Marketplace demand Predictable Volatile
Product variety Low High
Product life cycle Long Short
Customer drivers Cost Availability
Profit margin Low High
Dominant cost Physical cost Marketability cost
Stock out penalties Long-term contractual Immediate and volatile
Purchasing policy Buy materials Assign capacity to finalize products in rapid response
Information enrichment Highly desirable Obligatory
Forecasting mechanism Algorithmic Consultative
Table 7-3 Distinguishing attributes of the lean and agile supply chain. Source: (Mason-Jones, Naylor, & Towill, Engineering the leagile
supply chain, 2000)
In some situations, depending on the market winners, it might be advisable to use a hybrid supply chain
strategy. Such a hybrid strategy is often referred to as a leagile supply chain. Leagility combines the virtues of
lean and agile supply chains, to form a strategy that is focused on specific market needs. The goal is to create
“highly competitive supply chains capable of winning in a volatile and cost-conscious environment”.
Technomed Europe operates in such an environment. Christopher and Towill (Christopher & Towill, An
Integrated Model for the Design of Agile Supply Chains, 2001) identify three hybrid methods that combine the
lean and agile approach. These Strategies will be further explored in this chapter. A short summary of the
hybrid strategies that will be discussed is given in Table 7-4.
Table 7-4 three hybrid strategies and their appropriate market conditions. Source: Christopher & Towill (Christopher & Towill, An
Integrated Model for the Design of Agile Supply Chains, 2001)
Hybrid strategy Appropriate market conditions Pareto/80:20 Using lean methods for the volume lines, and agile
methods for the slow movers High levels of variety; demand is non proportionate across the
range.
Decoupling point The aim is to be lean up to the decoupling point and agile beyond it
Possibility of modular production or intermediate inventory; delayed final configuration or distribution.
Surge/base demand separation Managing the forecastable element of demand using lean principles; using agile principles
for the less predictable element.
Where base level of demand can confidently be predicted from past experience and where local manufacturing, small batch
capacity is available.

58
Figure 7-1 Pareto curve. Source: Christopher & Towill, 2001 (Christopher & Towill, An Integrated Model for the Design of Agile
Supply Chains, 2001).
Figure 7-2 Decoupling point. Source: Christopher and Towill, 2001 (Christopher &
Towill, An Integrated Model for the Design of Agile Supply Chains, 2001)
7.1.1 PARETO CURVE
A typical analysis of any business will show that 80% of the volume is generated from 20% of the product lines,
following a Pareto distribution. Since demand for the 20% of fast moving items will be more predictable than
demand for the slow movers, supply chain strategy could be split up into a lean part for the fast movers and an
agile part for the slow movers. An example of such a Pareto curve is given in Figure 7-1.
7.1.2 DECOUPLING POINT
Another approach to achieving a
leagile supply chain would be to place
the customer order decoupling point
(CODP) as late in the supply chain as
possible. A decoupling point is a point
that holds strategic inventory in a
generic or modular form. These
modules or the generic product can
be assembled when exact customer
demand is known. This concept is also
known as postponement. Up to the
CODP the supply chain strategy
should be lean and beyond the CODP
it should be focused on agility.

Theoretical tools for redesigning the supply chain
59
Figure 7-3 Combinations of base and surge demands. Source: Christopher and Towill, 2001 (Christopher & Towill, An Integrated Model
for the Design of Agile Supply Chains, 2001)
7.1.3 SEPARATION OF “BASE” AND “SURGE” DEMANDS
The last hybrid strategy that Christopher and Towill (Christopher & Towill, An Integrated Model for the Design
of Agile Supply Chains, 2001) mention is the separation of base and surge demand. Base demand is the demand
that can be predicted, surge demand cannot be predicted. Separation of base and surge demand can be done
in space or in time. If a separation in space is chosen, base demand will be produced in a lean process, for
example in a low cost country, and surge demand will be produced in a more agile and usually more expensive
process. If a separation in time is applied, all slack time will be used to produce base stock.
7.2 RISK POOLING
Risk pooling is an important concept in SCM (supply chain management) (Levi, Kaminsky, & Simchi-Levi,
2002). In the context of SCM risk pooling means that demand variability is reduced if demand is aggregated
across locations or customers. With this type of aggregation of demand, it becomes more likely that high
demand from one customer cancels low demand from another. This reduction in variability usually allows a
decrease in safety stock and logistic movements of inventory and overall tends to reduce average inventory.
There are three critical aspects to risk pooling:
• The advantage that centralized inventory saves safety stock and average inventory in the system.
• The fact that a higher variation, causes greater benefit to be obtained from risk pooling.
• The fact that benefits from risk pooling depend on the correlation between the various demands, this
correlation is also known as relative market behavior.
Many other theories about stock keeping exists, like stock keeping based on component price, or on typical,
constant demand or other theories about keeping safety stock. The conditions that should be met before the
more simple stock keeping models can be applied are not met by Technomed Europe, since there is no
constant, predictable demand, and forecast is based on consultation of the customer. It is too complex to apply
a more elaborate stock keeping model to the Technomed stock, at least within the limits of this project it is. A
separation based on material cost price is already made in Technomed Europe.

60
Figure 7-4 Information as a means of decision support. Source: (Mason-Jones & Towill, 1999)
7.3 ERP
A prerequisite for making appropriate manufacturing, procurement, sales and otherwise important decisions is
information availability. Mason-Jones & Towill in their work (Mason-Jones & Towill, 1999) propose a model for
decision making in an arbitrary supply chain echelon. This model can be viewed in Figure 7-4. The original
purpose of this model is to display an information enrichment mechanism that is connected to actual market
sales information, but apart from that it gives a nice overview of which information should be available for
decision making.
As seen in chapter 6 (Problem Areas) not all the information on display is available to Technomed Europe.
Pipeline and inventory information are examples of lacking information.
In order to manage information, usually an Enterprise Resource Planning (ERP) software system is brought into
existence. Many ERP systems have been installed since the dawn of the information technology era. ERP
systems promise numerous advantages like inventory reduction, personnel reduction, productivity
improvements, information visibility, process optimization and many other perks.
Not all ERP projects have been successful however; some unfortunate souls even perceive ERP as the root of all
evil. Implementing an ERP system seems to be a risky adventure, yet there have been success stories.
Extensive research has been performed on how to make or break and ERP implementation process. This
research has yielded some very useful critical success factors (CSFs) that can be seen as important predictors

Theoretical tools for redesigning the supply chain
61
for initial and ongoing ERP implementation success. A list of critical success factors is displayed in Table 7-5.
Some are more applicable to Technomed Europe than others.
Critical success factors ranked by degree of importance 1 Top management support 2 Project team competence 3 Interdepartmental co-operation 4 Clear goals and objectives 5 Project management 6 Interdepartmental communication 7 Management of expectations 8 Project champion 9 Vendor support 10 Careful package selection 11 Data analysis and conversion 12 Dedicated resources 13 Steering committee 14 User training 15 Education on new business processes 16 Business process re-engineering 17 Minimal customizations 18 Architecture choices 19 Change management 20 Vendor partnership 21 Vendor’s tools 22 Use of consultants
Table 7-5 Critical success factors (CSFs) in ERP implementation. Source: (Akkermans & Helden van, 2002)
7.4 CONLCUSION
In this chapter we have seen theories about matching products to supply chains and creating leagility , and the
advantage of risk pooling (section7.1 and 7.2). Next step in the process is to find out how this general ideas
work out if they are applied to the Technomed supply chain and if that could bring any advantages. This is
exactly what we will find out in chapter 8. In that chapter we will create scenarios which will be partially based
on the literature from this chapter. Afterwards we will select the most promising scenario to proceed the
research with in chapter 9.
Section 7.3 contains theory about ERP systems and their implementation. This theory is used in chapter 10
where the implementation of the selected best alternative will be at issue. We will make an interpretation of
which CSFs are important when implementing an ERP system at Technomed Asia.

62
8 SOLUTION ALTERNATIVES AND SUGGESTIONS
During the first part of the research at both Technomed Europe and Technomed Asia, many problem areas
have been identified. The next part of the research consisted of the following steps: creating ideas that solve
these problems, or at least improve the situation, discussing these ideas with both Technomed Europe and
Technomed Asia and selecting the most viable ideas for further processing. Initial ideas were derived with the
help of interviews, a literature study and common sense.
Solutions were mainly derived by two different approaches. One approach was to find points of improvement
in the current supply chain setup, by analyzing the individual steps in the chain and their possibilities for
improvement. The other approach was to find literature about supply chain strategy to find out if Technomed
is using the right strategy, and to apply that literature to the Technomed supply chain. The literature used for
this can be found in chapter 7. During the analysis of the supply chain other types of improvement were
uncovered; these improvements are mentioned in section 8.4 and 8.5.
During the discussions with Technomed Europe management, the research scope was narrowed down to
options of improvement that would not interfere with product design/range, and with validation of new
materials and processes from new suppliers. Discarded options for improvement are mentioned in this chapter,
but were not officially examined by the researcher.
This chapter starts with applying literature to Technomed’s situation and thereby creating different scenarios in
section 8.1. After that in section 8.2 we continue to play with options for stock holding, something that is
already done in section 8.1. Then in section 8.3 we start to investigate each individual node in the supply chain
and try to look if there is an option for improvement there. In 8.4 some improvements that are not directly part
of supply chain design are discussed. And finally in 8.5 practical suggestions and requests are given.
Each section contains information about the content of the proposed changes, the advantage of the changes,
their drawbacks and the limitations that determine if the changes are qualified for further exploration within
this project. What will follow is the selection and elaborate description of a best alternative in chapter 9.
8.1 CREATING AN AGILE SUPPLY CHAIN
In order to find modifications that could cause better performance of the supply chain as a whole, literature
about creating agile supply chains was consulted. After all, lack of responsiveness because of the rigid supply
chain was one of the main complaints at Technomed Europe. Since demand is unpredictable and total cycle
times were long, creating some agility seems an appropriate choice.
Literature comes up with three ways to increase agility in the supply chain. First the separation of base and
surge demand, second the delay of the CODP, and third a Pareto separation between products that follow an
agile path and products that follow a lean path. Applied to Technomed Europe, these solutions would results in
the following options for supply chain set-up.

Selecting the most promising alternative
63
If we think about base and surge demand separation in space, that would mean that a relatively constant
amount product would be produced by Technomed Asia, and that all unforeseen demand will be produced at
higher cost by Technomed Europe.
The purpose of this change would be to decrease the customer order response time.
Another option that emerged from literature is to delay the customer order decoupling point (CODP). In the
Technomed supply chain this could be done by keeping 400-level stock at Technomed Asia. As a reminder, 400-
level refers to assembled product that is not yet packed in a customer specific pouch and box. The purpose of
delaying the CODP would be to reduce uncertainty in the forecast, to create a smoother production process
with fewer interruptions, to decrease the current customer order response time of 10 weeks and to be able to
assign shortages to customers.
Since the CODP would be moved further down the supply chain, forecasting would have a great advantage.
Forecasting will be able to merge customer demands into one demand pattern, which will be more predictable
due to the risk pooling effect. This effect is described in section 7.2 (Risk pooling).
If 400-level stock would be kept, Technomed Asia would not have to produce production orders for each
customer, but in production orders that replenish stock or that at least encompass the entire forecast. Up to
the 400 level this could bring some tranquility to the production process.
The lead time for an unpredicted customer request would be reduced to the time needed for packing,
transporting and sterilizing the product; this would be 5½ weeks in total. Packing will probably not need two
weeks, but in this case the time between shipments was used as the packing time. If quality checks would be
done parallel to finishing production another half week could be won.
400-level stock could also be kept at Technomed Europe, this would move the CODP and the order lead time
even further down the chain, but very expensive packing labor, or a packing machine would be needed in the
Netherlands.
Figure 8-1 Delaying the CODP decreases customer response time

64
The 400-level stock concept can only apply to the products that go to multiple customers with private labels
and without customer specific hubs. This applies mainly to the DSNE, and depending on circumstances and
customer behavior it can apply to DHNE, DCNE, and DMNE. DCNE and DMNE do both use a customer specific
hub for one of the customers. Technomed Europe sees private labeling as an important sales tool, and private
labeling can be applied relatively easily on these four product groups.
Another option that is also related to delaying the CODP would be to keep 450-level stock at Technomed Asia.
The 450-level does not officially exist, but it represents the assembled product, packed in a customer-non-
specific pouch. However, this option does not only interfere with the supply chain, but it also interferes with
the product pouching as it is done now. The purpose of keeping 450-level stock would be the same as that of
keeping 400-level stock. There is in this case an extra advantage of the possibility of sterilization being done in
Indonesia. This could save another 1½ weeks in the lead time, reducing it to 4 weeks. Again this level could be
kept stock at Technomed Europe, but packing labor would be quite expensive.
The pareto separation in space of some products being produced in a lean way, at Technomed Asia, and other
products being produced in an agile way, at Technomed Europe, is impossible. Products that are produced in
Indonesia now cannot be produced in Netherlands, because the production cost would exceed the market
price of the products.
8.1.1 DISCUSSION
Each of the mentioned options has its own drawbacks. Separating base and surge demand does improve the
order lead time if forecast is almost correct, but if forecast is very far off, this option still doesn't provide a
solution to deal with big variations in the amount needed. Producing large quantities in Netherlands would be
unprofitable and it would disturb other production activities taking place at Technomed Europe. Also the CODP
would still be located at the same point where it was, causing difficulties for the forecasting department.
Keeping 400-level stock at any location will result in higher work in progress inventories, and inventory equals
money that you cannot spend (in this case however there will be no more 500-level inventory). If this 400-level
stock is kept at Technomed Asia, decent communication between the two companies is required, and some
hardware for printing might have to be installed. Traceability issues will have to be taken serious, and shipping
Figure 8-2 Keeping 450-level stock visualized

Selecting the most promising alternative
65
a 500-level product at this point in time still means paying for the shipment of air. Changing the supply chain
this much will cost Technomed Europe. During conversations with the Technomed Europe management it was
decided that keeping 400-level stock in Netherlands is impossible, packing staff is too expensive to make
enough profit and a packing machine is also not an option, since such a machine is very expensive and has to
be operated by three men of expensive staff. Lately the impossibility of this idea has been challenged by
Technomed Europe management. Sadly, it was too late to incorporate it in this research.
Keeping 450-level stock gives technical problems. If a private label could be added to the pouch in a later point
in time, this would be a wonderful option, but it seems that for now this is still impossible.
8.1.2 SUMMARY
All options with their drawbacks and other considerations are recapitulated in Table 8-1.
OPTIONS PURPOSE/ADVANTAGE DRAWBACKS CONSIDERATIONS FOR FURTHER RESEARCH
Excess production at
TE
• More flexibility towards customers.
• Constant production in TA with a minimum of disturbances
• Profits are made from the part that is produced in Indonesia, but production in the Netherlands is very expensive and even non-profitable.
• More disturbances at TE production facilities
• CODP still at the same point
Would not give enough gain.
400-level stock at TA
• Lower lead time from 10 to 5½ weeks if CODP is moved to this stock point. Or 5 weeks if QC is done parallel
• Risk pooling.
• Not applicable to all products
• Smaller and irregular batch sizes to send to TE. This could affect transportation costs.
• Transport to Europe still has to take place
• Air is being shipped if the packed product is transported to TE.
• TA needs a new set of skills and hardware
Most viable option of all. No interference with product component design, production process or packing material. But serious change in supply chain set up. Needs further research.
400-level stock at TE
• Very low lead times of 3 weeks if CODP lies at this point.
• Risk pooling
• Not shipping air
• Quality check forms no problem.
• Packaging in the Netherlands is very, very expensive. Using a packaging machine should cut cost at least 10 times in order to be cost effective.
• Not applicable to all products
Packing would be too expensive and profits too low.
450-level stock at TA
• Gives the possibility to keep customer unspecific, sterilized stock. This will reduce lead-time considerably, to a maximum of 4 weeks. While still exploiting the effects of risk pooling
• Requires a big change in customer specific pouching, which might be impossible to realize.
• Private labeling important competitive advantage of TE (marketing)
• If goods have to be sent to TE first, there will still be
Private labeling is very important for TE to compete with other manufacturers. Therefore Technomed Europe does not want to lose this feature.
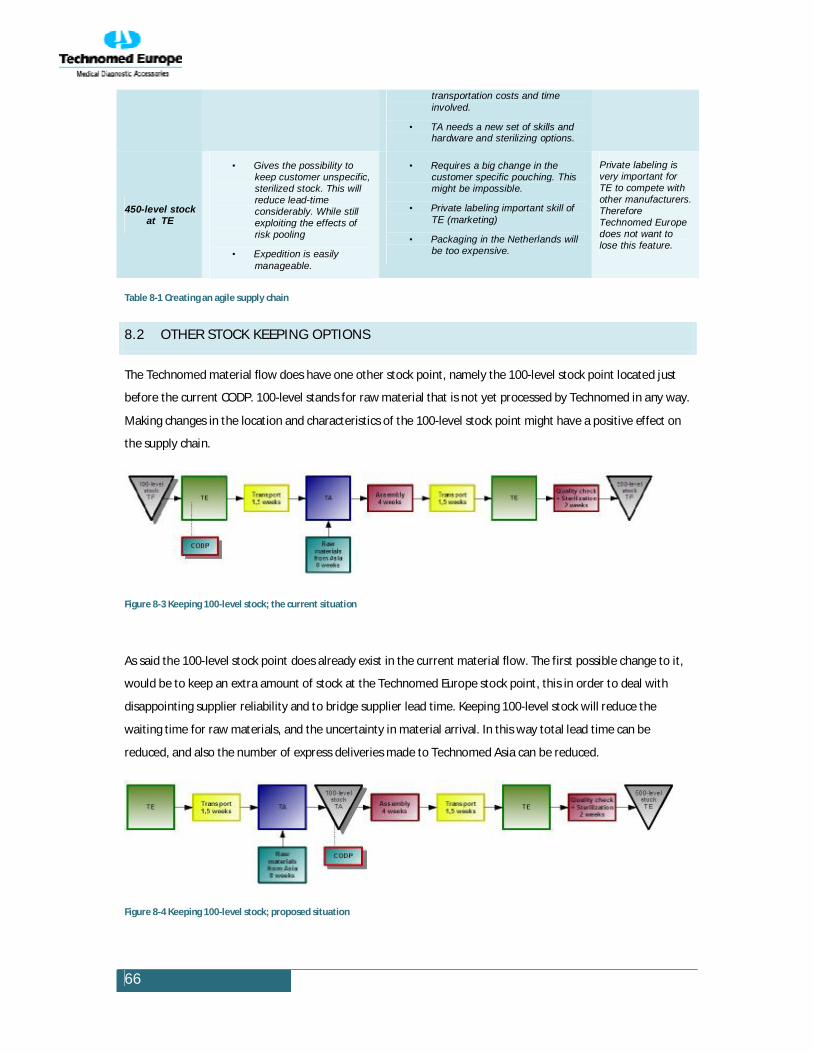
66
transportation costs and time involved.
• TA needs a new set of skills and hardware and sterilizing options.
450-level stock at TE
• Gives the possibility to keep customer unspecific, sterilized stock. This will reduce lead-time considerably. While still exploiting the effects of risk pooling
• Expedition is easily manageable.
• Requires a big change in the customer specific pouching. This might be impossible.
• Private labeling important skill of TE (marketing)
• Packaging in the Netherlands will be too expensive.
Private labeling is very important for TE to compete with other manufacturers. Therefore Technomed Europe does not want to lose this feature.
Table 8-1 Creating an agile supply chain
8.2 OTHER STOCK KEEPING OPTIONS
The Technomed material flow does have one other stock point, namely the 100-level stock point located just
before the current CODP. 100-level stands for raw material that is not yet processed by Technomed in any way.
Making changes in the location and characteristics of the 100-level stock point might have a positive effect on
the supply chain.
As said the 100-level stock point does already exist in the current material flow. The first possible change to it,
would be to keep an extra amount of stock at the Technomed Europe stock point, this in order to deal with
disappointing supplier reliability and to bridge supplier lead time. Keeping 100-level stock will reduce the
waiting time for raw materials, and the uncertainty in material arrival. In this way total lead time can be
reduced, and also the number of express deliveries made to Technomed Asia can be reduced.
Figure 8-4 Keeping 100-level stock; proposed situation
Figure 8-3 Keeping 100-level stock; the current situation

Selecting the most promising alternative
67
A second option would be to vary the amount and the location of the 100-level stock. If 100-level stock were to
be kept at Technomed Asia, this could greatly reduce idle time, overtime and hasty jobs at Technomed Asia,
thus reducing the number of mistakes. Also it would change the location of the CODP to the point of material
arrival at Technomed Asia. The amount of stock that should be kept at Technomed Asia should be assessed at a
later stage.
8.2.1 DISCUSSION
Inventory is money, so keeping extra stock at Technomed Europe will be expensive. Keeping stock also requires
controlling stock. An elaborate stock controlling system is not yet in place at Technomed Europe. Last
disadvantage is that batch picking is done by Dutch employees that are a lot more expensive then Indonesian
batch pickers.
Technomed Asia will need a lot of new skills and hardware to be able to deal with keeping 100-level stocks.
Technomed Europe uses validated procedures and can guarantee traceability up to a level that they (and the
F.D.A.) see fit, while Technomed Asia has barely any of these means. Great attention will have to be paid to this
before Technomed Asia can keep 100-level stock at their facility.
8.2.2 SUMMARY
OPTIONS PURPOSE DRAWBACKS CONSIDERATIONS
FOR FURTHER RESEARCH
Increased 100-level stock at
TE
• 100-level stock brings down lead times if compared with no stock at all.
• Fewer express deliveries
• Expensive to invest in stock • Order picking done by Dutch
(Expensive) employees • Stock levels not based on regular
values so it needs to be controlled all the time.
Lot of extra trouble for TE, not too many advantages from a TE point of view.
100-level stock at TA
• Lower transportation cost, because bulk can be sent.
• Lower lead times even if the CODP does not change position.
• 100-level stock brings down total lead times if compared with no stock at all.
• Much smoother production at TA.
• No extra taxes because of express shipments
• Hard to control. (Staff is untrained, no information systems available, difficult communication, etc.)
• Traceability has to be guaranteed at all cost
• Registration in Vantage difficult. • Responsibility issues
For Technomed Europe this would
mean a lot of problems and not
too much gain. Technomed Asia
would experience a lot of advantages from this option.
Therefore this option needs further
research.
Table 8-2 other stock keeping options

68
Figure 8-5 Grinding in Asia (DCNE supply chain)
8.3 SINGLE NODE ADJUSTMENTS
In the material flow each node can be looked at separately to determine if there is something about that node
that can be changed in order to improve the material flow. We use the material flows for the DCNE Figure 5-3
and DSNE Figure 5-2 as a starting point.
8.3.1.1 GRINDING IN ASIA
The first option for improvement would be particularly helpful to the DCNE supply chain. If the needle grinding
step in could be performed in Asia, this would reduce the number of times that the sub-assembled product
would have to be sent to Technomed Europe.
This option would bring down lead-time with at least 3 weeks and would obviously reduce transportation cost.
Lead time could be brought down even further. The four weeks that are needed for grinding in the current
situation can be reduced to one week if a decent planning could be made. The same shorter processing times
may hold for an Asian grinding company, or there might be an Asian company with larger capacity. A drawback
of this solution would be that Technomed Asia would have to do quality checks. This would require expensive
equipment and training.
8.3.1.2 QUALITY CHECKING IN ASIA
Performing quality checks at Technomed Asia could reduce the number of shipments needed between
Technomed Europe and Technomed Asia, also Indonesian labor is cheaper. However an investment will have to
be made in order to get the right testing equipment to Indonesia, to train the employees and to make standard
procedures that are very clear.
8.3.1.3 PURCHASING IN ASIA
Purchasing raw materials in Asia would be another option that could bring down time and cost. As seen in the
material flows depicted in “Appendix A: additional material flow charts”, in the current situation most raw
materials are bought by and brought to Technomed Europe before they are shipped to Technomed Asia.

Selecting the most promising alternative
69
Purchasing in Asia could reduce transportation time and cost, since the initial transport from Technomed
Europe to Technomed Asia would no longer be needed. If the total lead time is reduced, this means that
finishing the final forecast, used for purchasing activities, can be postponed, hence reducing uncertainty.
At this point in time Technomed Asia does not have the skill or machinery to test quality of all incoming
material. Technomed Europe could deal with this by either shifting this responsibility to Technomed Asia by
investing in the training and materials needed for this, or by requesting from the supplier that samples are sent
to Technomed Europe, which can be tested parallel to material arrival at Technomed Asia.
Another condition that has to be met is that Technomed Asia should possess a warehouse with a good, digital
warehouse management system. Technomed Europe should be fully aware of which materials reside at
Technomed Asia and communication would have to be taken up a notch. Finally, agreements should be made
about who is responsible for purchasing or calling off the raw materials.
8.3.1.4 ADVANCED PRODUCTION PLANNING
Production planning at Technomed Asia could be done in a more advanced way in order to decrease lead-time,
yet the advantages of improving production planning are minimal compared to those of other options and
compared to the effort that is needed. This is a change one would make in a fine-tuning situation.
8.3.1.5 STERILIZATION IN ASIA
Sterilizing products in Indonesia might be worthwhile. It could be cheaper than sterilizing in Netherlands,
sterilizing companies in Indonesia might have other capacity and thus another lead-time. If combined with
expedition in Indonesia it could save a full trip to the Netherlands. One of the questions is if it is possible to do
this in Indonesia anyway, and if it is possible, will it be up to the Technomed Europe standard. This standard
should be met in order for them to keep their license. It might be an interesting option for the clean room
products that are shipped to on customer only.
Figure 8-6 Purchasing in Asia

70
Figure 8-7 Expedition at Technomed Asia
8.3.1.6 EXPEDITION AT TECHNOMED ASIA
One could think about sending end product directly to the end customer from Technomed Asia. The end
transport to Technomed Europe would no longer be necessary if expedition would take place in Indonesia.
Lead-time and cost could possibly be reduced in this way.
This option does have many drawbacks though. It would require a new set of skills and possibilities from
Technomed Asia (sterilization, quality checking, managing expedition), it would shift responsibility for the
product from Technomed Europe to Technomed Asia while Technomed Europe needs to keep its license,
invoices would cause problems at customs because it is unclear what the value is that taxes should be paid for,
and Technomed Asia would be fully informed about the prices that are paid by end-customers, which would
give them too good a position to negotiate production prices. Or if the invoice would only state the real value
of the product, the customer would know the margins. All in all this option seems to be to complex for now.
8.3.1.7 TRANSPORTATION BY SEA
Transportation by sea is usually a lot cheaper than by air. So transporting all or some materials to Technomed
Asia by boat would be an interesting thought in this time of high fuel prices. Obvious disadvantages would be
the extra time it takes compared to airfreight and the extra inventory that is required to bridge this time. Time
for this would increase from 2 days to 21 days.
This time increase is not the biggest disadvantage. The biggest disadvantage is the time that is needed by
customs after arrival of the product. Custom clearance tends to be much longer in sea freight than in air freight
(this information comes from interviewing Technomed Asia’s financial management), and any problem with
clearance will be extended through time. Therefore shipping by sea might bring disturbances and uncertainty
into the supply chain. Careful considerations will have to be made before this type of transportation is chosen.
If transport is done by sea, it should be done with cheap C-materials that have to be bought in bulk and long in
advance anyway. It is not something one wishes to do with platinum.

Selecting the most promising alternative
71
8.3.1.8 AUTONOMOUS DECISION MAKING AT TECHNOMED ASIA
If Technomed Asia would have the freedom to choose which raw materials they use for their production
activities, they can start using a FIFO system. This would mean that they will not be stuck with left over stock
that has to be sent out of the country within a year and that they don’t have to fool around with the tax report.
On the other hand it does mean that traceability is in their hands. And this responsibility should not be taken
lightly. On the other hand the current situation in which parts are used from left over lots is even less
controllable.
8.3.2 SUMMARY
A summary of possible changes with their purpose and drawbacks is given in the table below.
OPTIONS PURPOSE DRAWBACKS CONSIDERATIONS
FOR FURTHER RESEARCH
Needle grinding in
Asia (not for all products)
• Lower transportation costs
• Lower lead time
• Less paperwork and fewer Dutch employees spending time on and handling the product.
• Inspection is more difficult to control. Maybe parallel.
• More quality testing and sending/receiving functionality in Asia
Quality checking not yet possible at
Technomed Asia
Quality checking at Technomed
Asia
• Reduce number of shipments
• Cheaper labor
• Training and standard procedures needed.
• Expensive testing equipment needed
Not that complex that it should be
researched.
Purchasing raw materials in
Asia
• Less transportation costs
• Lower lead times, which leads to a less uncertainty in forecast
• Inspection cannot be done in Asia yet.
• A decent information and communication system should be in place.
• Responsibility issues
Quality checking not yet possible at
Technomed Asia. Suppliers not
known. This is for the purchasing
department
More advanced means of
production planning in
Asia
• Might give lower lead times.
• Availability of raw materials required.
• Big investment compared to benefits at this point in time
Much work, not many benefits
Sterilization in Asia
• Might be cheaper than in the Netherlands.
• Transportation to TE might be superfluous if there is an expedition department at TA. So this might result in lower transportation cost.
• Expedition also in Asia (TA becomes TE)?
• It is not known if this is possible
No information about this at
Technomed Europe might be interesting
to look into.
Expedition in Asia
• Lower transportation cost. • A lot of intelligence, training, communication, information systems and coordination required
• TA slowly turning into TE
Both Technomed Europe and
Technomed Asia do not want to do this
now.

72
• Responsibility issues
• TA will know the TE prices, which will not be good for TE or customers will know margins.
• Tax problems as to what the value of the product is. Split the bill...customer will pay production cost to TA and profit margin to TE, that seems strange.
Transportation by sea
• This means of transportation is cheaper than the airplane. So it might be the right choice for cheap C-articles.
• Slower, so this will result in more inventory in transport
• Custom clearance will take much longer.
• Forecast has to be made longer in advance
• Cost benefit may not be big enough.
Interesting, Technomed Europe
knows transportation rates
Autonomous decision
making at TA
• Possibility for FIFO system
• Much less problems in dealing with tax
• Responsibility for traceability with TA
Really wanted by TA, but TE has its reservations. Still there is no reason to not investigate this option further.
Table 8-3 Single node adjustments
8.4 MISCELLANEOUS ADJUSTMENTS
Until now all proposed changes were changes in the material flow, but there are other levels in which changes
can be made. These levels of change were uncovered while analyzing possibilities for improvement in the
supply chain. Changes at these other levels are discussed in this section “miscellaneous adjustments”.
8.4.1.1 REDESIGNING THE PRODUCTS
Technomed products do not share a lot of components; many varieties of raw materials are needed. It could be
advantageous to increase the number of shared parts by redesigning the products. Forecasts would benefit
from using the risk pooling effect, by forecasting demand for several groups of products instead of one
product. Redesigning the product would, however, require a large investment of time, money, validation
processes, etc.
8.4.1.2 BRINGING DOWN VARIETY
Some products are available in 11 different lengths with different length cables. If half of these lengths would
be discarded the risk of buying the wrong amount of raw materials would decrease. Also the total amount of
stock needed for production could be reduced. Bringing down variety could greatly improve Technomed's
performance. Still the product has to be used by the customer, so this strategy can only be followed if the
customer has no need for all that variety or if Technomed can make the customer believe that they don’t need
it. Technomed is currently already working on these types of adjustments

Selecting the most promising alternative
73
8.4.1.3 BRINGING DOWN BOX SIZES
The costs of shipments that are sent from Technomed Asia to Technomed Europe are based on volume rather
than weight. The ratio between cost paid per volume and cost paid per weight should be 1 maximum. Now the
ratio is bigger than one, so if the volume can be brought back, the transportation cost will go down up to the
point where the weight is charged. There are virtually no disadvantages in doing this, except that it takes some
work. Technomed Is already working on this.
8.4.1.4 DIGITAL INFORMATION SYSTEM
In the theory a model is given in Figure 7-4. It displays how information can serve as decision support.
Technomed Europe misses some of the input that is described in the model.
Technomed Europe is in need of data from Technomed Asia and data about the pipeline. In order to obtain this
information in an easy way, it would be desirable for Technomed Asia to process their information digitally.
Internal communication and information exchange at Technomed Asia would benefit from a digital system as
well.
It is not clear though what kind of information system should be installed. Will Technomed Asia be in need of
some simple excel sheets, or do they need more advanced software, or does Technomed Europe need them to
have more advanced software?
8.4.1.5 BAR CODING SYSTEM
Many mistakes are made in packing lists and registering incoming materials. A bar coding system with scanners
could prevent many of those mistakes. It could also save both Technomed Europe and Technomed Asia a lot of
time. It might however take some investments in the equipment and implementation. On the other hand it will
reduce the risk of problems with customs. Besides the fact that Technomed might have to pay fines every now
and then, problems with customs might have far reaching consequences. If the tax agreement is lost all
material cost would increase with at least 17.5%.
8.4.2 SUMMARY
OPTIONS PURPOSE DRAWBACKS CONSIDERATIONS
FOR FURTHER RESEARCH
Product design changes
• Risk pooling effects in purchasing raw materials.
• If done in a smart way production might be cheaper.
• Go through design and validation cycles again, which is expensive.
• Stay within given TE structures
Not within scope.

74
Product line changes,
bringing down the variation.
• Risk pooling effects, assuming that customers will choose a slightly different model instead of their original choice.
• Customer has less choice • Takes some energy in making the
changes • Already being worked on
Not within scope and already being worked on
Bring down box sizes
• Not shipping air • Better volume-weight ratio
• Takes time and energy • Already being worked on
Not within scope, already being worked on
Digital information system at
Technomed Asia
• Better insight to information at Technomed Asia
• Less communication required about factual data
• More professional way of working at Technomed Asia
• Training of TA personnel. • Depending on the software it can
be expensive.
Much needed for both companies, needs further research.
Bar coding
• Fewer human mistakes • Saves time • Lower chance of running
into problems with customs
• Investment in equipment needed • Implementation might be
problematic. Scanners have to communicate with software
Interesting option, but not officially researched.
Table 8-4 Miscellaneous adjustments
8.5 SUGGESTIONS AND REQUESTS OF A MORE PRACTICAL NATURE
Finally analysis of the supply chain also rendered some very practical solutions. These are not necessarily of a
logistic nature, nor do they fall within the scope or purpose of this research, but they are worth mentioning.
And so here follows a section with solutions to some practical problems occurring at Technomed Asia and
Technomed Europe and the considerations surrounding them.
Communication
It would be advisable to make employees at both companies aware of the cultural and language barrier. As
stated in the problem areas, but also in literature (section 4.5), humor, jokes, sayings, etc. might carry a very
different meaning in another country and great care should be taken before expressing them. The Dutch
should be careful with their tone, while the Indonesians should learn how to speak up. Both companies should
be aware of the national holidays of the other company.
If the two Technomeds can find out where they stand and what type of management they strive for, they might
even make their differences work in their favor.
Boxes on a pallet
A suggestion for sending boxes to Technomed Europe on pallets was made. This would avoid the chaos at
Technomed Europe when the products arrive. Technomed Europe should consider that this means of
transportation is more expensive, because of the increased volume of one package. The new volume-weight
ratio will be unfavorable and a minimum weight in a new scale will be charged.
Adapting the packing list

Selecting the most promising alternative
75
There was a request from Technomed Europe to, among other things, make the packing list more specific. With
the purpose of reducing chaos when the end product arrives. Most of the proposed adjustments can be
executed, but making the list more specific would hurt the company, because it would reduce options for
cheating customs.
Sending cable lot number earlier
Sending the lot numbers for the cables to Technomed Asia at an earlier time would give the Technomed Asia
warehouse the option of storing the cables instead of keeping them in the middle until the lot numbers arrive
Increase effective space in warehouse
The warehouse is a bit small, but the space inside could be used more effectively. Several methods could be
used for this. A call off contract with the box supplier could be arranged. Instead of large quantities at once,
small quantities at a higher frequency could be ordered then. This would reduce the total space needed for
boxes.
Furthermore Technomed could think of using other storage racks, sliding racks would increase the effective
space in the warehouse. It would also cause an increase in pick time, but that is not the bottleneck in
Technomed Asia and batches can be picked in advance, so that will probably not cause a problem. If the
warehouse is still not big enough it can be extended by actually making it bigger.
warehouse conditions
Warehouse conditions are less than optimal. Air conditioning could help to manage the high temperatures, and
would also invite employees to keep the outside doors closed. Keeping the doors closed ill prevent dust and
animals from getting inside the warehouse.
Counting scale
Buying a counting scale that is precize enough to count needles will save a lot of time and will also prevent
damage to the needles that is caused by handling them.
8.6 CONCLUSION
In this chapter we have seen improvements emerge on all kind of levels. We started out with strategic changes
that involve changes in the supply chain architecture in order to create agility and flexibility, without increasing
cost too much. Keeping 400-level stock at either Technomed Europe or Technomed Asia are examples of this.
Then there were tactical changes in which activities and responsibilities were shifted from one company to the
other, like moving quality testing from Technomed Europe to Technomed Asia. Finally even operational,
practical options for improvement were presented.

76
Not all options for improvement could be pursued during this research. Technomed Europe made a clear
choice to stick to solutions that would not interfere with the product, product line or the production/assembly
process and that would fit with the current structure of the company. Also they were not ready to move
important responsibilities to Technomed Asia, which is why quality testing in Indonesia for example has not
been a subject of further research.
Improvements that were suitable for this research and were most promising are discussed in the next chapter
”Selecting the most promising alternative”.

Selecting the most promising alternative
77
9 SELECTING THE MOST PROMISING ALTERNATIVE
Not all options for improvement can or should be researched during this project. Agreements were made with
Technomed that the researcher would not investigate solutions that would require big changes in the product
lines or designs. But that the focus would be on solutions that fit within the current set-up and product
portfolio. The selected solution should be implementable within the limits of the current company structure.
Also the focus was not on subjects that were mostly the responsibility of the purchasing department like which
suppliers to buy from, these are just very clear choices that Technomed can deal with without help of the
researcher. Considerations for further research as discussed with Technomed Europe are stated in the fourth
column of all the summary tables presented throughout chapter 8. In collaboration with Technomed the most
promising alternatives for further research by the researcher were determined.
The most promising alternatives with the most advantages that also fall within the scope of the research are:
• keeping 400-level stock at Technomed Asia (Table 8-1 Creating an agile supply chain)
• Keeping 100-level stock at Technomed Asia (Table 8-2 other stock keeping options)
• Installing a digital, online information system at Technomed Asia (Table 8-4 Miscellaneous
adjustments)
• Giving Technomed Asia the freedom to make autonomous decisions (Table 8-3 Single node
adjustments)
In sections 9.1.1 to 9.1.4 and overview of the tangible and intangible advantages of the selected options are
given. In section 9.1.5 a graphical overview of the final proposal is presented.
9.1 TANGIBLE AND INTANGIBLE ADVANTAGES OF SELECTED ALTERNATIVES
If we inspect the selected alternatives more closely, the advantages become clearer. An overview of all
tangible and intangible advantages of the selected solution is given in this section.
9.1.1 100-LEVEL STOCK
In practice 100-level stock is already held at Technomed Europe. Especially the cheaper B and C category
materials are there before they are used. If some of this stock could be moved to Technomed Asia, Technomed
Asia would gain great advantages of that, but Technomed Europe could also.
The last minute shipments that Technomed Europe tends to make, cause distress at both Technomed Europe
and Technomed Asia. In Technomed Europe they cause problems because many times there's shortage or a
material is delivered late by the supplier, and this forces them to make express shipments by TNT, which take
energy and money.

78
In Technomed Asia a lot of goodwill is spoiled if time and again they have to wait for Technomed Europe
sending the material too late, if therefore their production is stalled and if in the meantime Technomed Europe
is demanding an on time return shipment, which causes overtime. This situation is the rule more than the
exception. By giving Technomed Asia a month worth of stock, this problem could be reduced. B and C category
articles are already in stock at TE, so for these items, this option would only mean a difference in location and
not a difference in the amount of stock. A category articles should, of course, be carefully managed and be
shipped as late as possible, but not too late and preferably a little bit early. The items that are expensive and
may cause problems because of late deliveries should be managed with most care.
Financially Technomed Europe might save figures up to 19000000 rupiah (€1350) a month on taxes. And an x
amount on extra transportation cost. But more important it will reduce the number of mistakes made, reduce
stress levels, it will increase goodwill, and it will shorten the line between production and the CODP, so in case
of an anomaly the response time will be shorter.
For products to which the 400-level stock keeping does not apply it will actually be the CODP which will be 2
located 2 weeks downstream by moving 100-level stock to Technomed Asia
9.1.2 400-LEVEL STOCK
The main advantages that were identified for keeping 400-level stock at Technomed Asia were risk pooling and
a decrease of order lead time from the CODP. But how big are the advantages, and are they big enough to
implement 400-level stock.
The decrease in lead-time is easy to quantify in time units and may be set at 5 weeks, reducing it from 10 to 5
weeks. The value of risk pooling however, is a little bit more complicated to derive. Part of the reason being the
enormous amount of data that the big variety of products brings with it. In order to get an insight into the
advantages, data of one representative product is chosen, on which practical calculations are performed.
As a representative product we choose the subdermal needles. Subdermal needles have the characteristics
that are needed in order to gain any advantage from delaying the CODP. The production process for the
product, which is sold to different customers, is the same up to the point where it is pouched. This
characteristic is not met by all product groups that are produced at Technomed Asia, it does apply to DSNE,
DHNE, DMNE and DCNE, although the advantage does depend on the number of customers for certain
products, and this number can vary over time. Also DCNE and DMNE have customer specific hubs for one
customer which means that products for that customer are useless to keep at 400-level. Clean-room products,
like Cotop needles, all go to one customer, which is why changing the CODP will have no effect on these
products. Furthermore the subdermal needle stock is about 109% above the maximum level.
Being able to combine forecasts for different customers will allow Technomed Europe to be more flexible in
assigning shortages or in shifting forecasted demand from one customer to another. This should reduce
uncertainty, bring down stock levels, and create more calmness in the production process.

Selecting the most promising alternative
79
Table 9-1 displays the forecast and real result from January 2007 to March 2008 for a subdermal product that
goes to 3 customers. Stock and corrected stock were calculated. The following assumptions were made while
doing this:
• backorders are solved and taken care of outside the normal forecast-production circuit,
• backorders equal a stock value of zero,
• it is possible to respond to excess stock, within a one month time frame,
• The only stock that counts is excess stock, backorders are a different problem,
• In January 2007 there is zero stock,
• fulfilling demand means that the 400 level is available for customer specific packing at the moment
that the order comes in
Here is an example calculation for the stock of the first customer. In January there is a backorder of 10 boxes,
this backorder is solved outside the normal trajectory. Therefore the backorder in January does not add to the
one of 46 boxes in February. January, February and March leave Technomed Europe with a stock of 0 for the
next month.
For April 63 boxes were produced to forecast, and none were bought, this leaves a stock of 63 boxes. Forecast
for May is 56, but since response time is one month, these boxes are not produced, there is enough in stock.
Real demand in May is 108, which leaves us with 108-63=45 boxes as a backorder.
The response time of 1 month is not an entirely realistic one for Technomed Europe. At this point in time
response time might be more like 2 or 3 months. A doubling of response time will approximately lead to a
doubling of the average numbers, since all extra ballast will be held at stock for double the time. Yet working
with a one month response system makes it easier to deal with the data and it doesn't change much to the
ratio of improvement for the 400-level system.
Table 9-1 Virtual stock in current situation

80
Figure 9-1 stock levels before and after risk pooling effect
Table 9-4 Saving for the s43-438
Table 9-2 effect of risk pooling
The 400-level stock system will give Technomed Europe the chance to combine forecast of separate customers
into one forecast. This should reduce the error in the forecast considerably. The researcher attempted to
assess the effect of this in a practical manner, the result can be viewed in Table 9-2.
First of all total forecast was combined to one
forecast, which is the sum of the three different
forecast. Total real demand is calculated in the same
way. The researcher made the same assumptions as
before. In the new situation corrective steps will and
can be taken in one month and backorders are
eventually dealt with via another circuit. If we
compare the stock levels in the before and after 400-
level stock situation. We find that average stock levels
during the measuring period would decrease with
52%. A visual representation of the difference is given in Figure 9-1. One subdermal needle costs 0,448 cents
(including the packing and packing material, which is not done at the 400-level yet, but it is already in stock)
and each box contains 25 needles.
For this product (S43-438) savings
would add up to €790,72 every
month, taking into account only
the material and production cost.
Of course there is also other
savings in the form of holding
cost, space, interest rates, etc.
Table 9-3 old stock levels compared to expected stock levels after implementing 400 level stock

Selecting the most promising alternative
81
Figure 9-2 real demand versus forecast
An advantage that should not be overlooked is the increase in customer service level. In the old situation
Technomed would have to deal with 7 incidences of stock out, whereas in the new situation there is only one,
because it would provide Technomed Europe with great flexibility in assigning stock to customers in a late
stadium. Results are not the same for all subdermal sub-products. Savings vary from 19.3 to 56.8 percent, as
can be seen in Table 9-3.
Other advantages are that there is no risk that stock will get obsolete, unless production of the whole product
is cancelled. If there is a build up in stock, like occurring at Technomed Europe right now, it will be much easier
to take corrective actions and to get rid of excess stock. This could prevent situations like 1391 boxes of
subdermals (€15579,20) for XL-tech just lying around and waiting every month.
The exact savings for the other products groups were not calculated, and since calculations were made for an
ideal situation, the real numbers will have to present themselves in a real situation. Handling stock-outs in the
same circuit might have a negative effect on results, while a longer response time would increase savings
considerably. From section 7.2 we know that the bigger the variety in the demand, the bigger the advantage
from risk pooling will be. And we also know that independent market movements increase the gain from risk
pooling.
If we plot total forecast and total demand for the S43-
438 in one graph, it can be seen that total forecast is
structurally too high. A reduction of production to 90%
of total forecast could further reduce the money
invested in stock, without hurting the customer
service level too much, that is two stock-outs in total.
An extra reduction of €177 per month could be
realized, this is an improvement of another 8.75% on
the original situation. Whether this is applicable for all
products and whether 90% is the right number, should
be considered by Technomed management.
Another advantage is that production at Technomed Asia can be scheduled differently if it is scheduled
according to total forecast. Ideal batch sizes can be produced and stored and it might be easier to create some
kind of base-surge demand separation in time. Picking of raw materials and registering information has to be
done only once, instead of once for every customer.
9.1.3 INFORMATION SYSTEM
An information system is a prerequisite for functional stock keeping at Technomed Asia. Without it, it will be
impossible to do any online, real-time management and chaos will increase uncontrollably. The main
advantage of an information system is that it opens up the way to growth and a professional environment. By

82
having real time information about stock and production, the response time to actual changes in the market
can be decreased. Time is money. How much money? As we saw in stock keeping double time means double
stock and many other double things that cost double money.
A good information system with clear functionality combined with decent training and disciplined usage will
result in a smaller need for communication. If the software is validated and tailored to Technomed's needs it
will be easy to exchange information between companies, and the process of shifting certain responsibilities to
Technomed Asia will not be hindered by their lack of validated means. Also this will make it less prone to
mistakes than when the system is handmade and not validated. Once data is collected in the right way, the
information system might render some interesting performance indicators as a bonus.
If information about stocks can be seen by all of the Technomed Asia employees, that will make it easier for
Technomed Asia to manage the Asian suppliers and to spot anomalies in the data.
9.1.4 AUTONOMOUS DECISION MAKING
The advantages of autonomous decision making are hard to quantify, advantages are mainly qualitative.
Autonomous decision making at Technomed Asia will reduce the need for communication and therefore it will
reduce delays and opportunities for mistakes. Also it will reduce the opportunity of holding obsolete stock at
Technomed Asia and paying taxes for it, while creating a much simpler way to manage stock (FIFO) and creating
a synergy between stock keeping and administration. Administration is done in according to the FIFO principle
already.
9.1.5 FINAL PROPOSAL
The researcher proposes a scenario as depicted in Figure 9-3.
Figure 9-3 final solution as proposed by the researcher

Selecting the most promising alternative
83
Keeping 400-level stock is a solution that follows from a combination of theory from section 0 and
conversations with the Technomed Europe management about selecting the best location for this stock.
The information system that is proposed is a direct consequence of keeping stock at Technomed Asia, but
without keeping 400-level stock it might still be beneficial to both companies.
Keeping 100-level stock is a suggestion derived mainly from interviews with Technomed Asia and from
observing the great problems and the amount of work that late deliveries of raw materials from Technomed
Europe cause.
Last but not least autonomous decision making at Technomed Asia is suggested to minimize the need for
communication and to make stock management as uncomplicated as possible. This suggestion was derived
from observing problems with obsolete stock and interviewing the Technomed Asia management. Overall
control for stock levels stays at Technomed Europe.

84

Implementation strategy
85
10 IMPLEMENTATION STRATEGY
In the previous chapter the most viable ideas for improvement that were within the scope of the research were
identified. These ideas will require changes in both companies and certain conditions will have to be met in
order for them to fully function. The researcher investigated in what order the proposed solutions can best be
implemented, and what the conditions are that can make or break their success, therewith answering research
question 4.1 (“What are the necessary conditions for this alternative to succeed, taking into account
circumstances in Indonesia?”). Information was gathered by interviewing both Technomed Europe and
Technomed Asia combined with a literature study. The following solutions were selected for further research
by the researcher, Technomed Europe and Technomed Asia.
1. Keeping 100-level stock at Technomed Asia
2. Keeping 400-level stock at Technomed Asia
3. Setting up a digital information system at Technomed Asia
4. All of the above combined with autonomous decision making at Technomed Asia
Keeping 100-level stock at Technomed Asia would mean to have raw materials stored in the Technomed Asia
warehouse. The purpose of keeping raw materials in Asia could be to delay the customer order decoupling
point (CODP), like displayed in Figure 8-4, but since 400-level stock is also suggested, this is not the main
purpose. Except for those products that keeping 400-level stock does not apply to. Mostly this option will
greatly reduce problems with customs, taxes, idle time and over time.
To keep 400-level stock would mean that the CODP is pushed back even further down the line. Assembled,
generic product that is not yet in a pouch will be kept at Technomed Asia in this case. A graphical
representation of this adjustment is given in Figure 8-1.
A digital information system that will give Technomed Europe a thorough insight to Technomed Asia's stock
levels is a must. But what are its requirements?
Autonomous decision making for Technomed Asia refers to the freedom to make a decision about what lot
number will be used for production. Purpose would be to accommodate a first in first out (FIFO) system that
can be flexible, to decrease the need for communication, and to get the information delay out of the supply
chain. It makes no sense that people are performing easy tasks in Padalarang, but have to wait for answers
from Maastricht.
In this chapter we will first describe the basic overall consequences and requirements that the proposed
adjustments bring in section 10.1. After that, in section 10.2, we will describe the requirements for
implementation in more detail per stage. The stages will be addressed in the suggested sequence of their
implementation.

86
Figure 10-1 Mindmap regarding consequences of keeping stock at Technomed Asia
10.1 BASIC REQUIREMENTS FOR THE PROPOSED CHA NGES
For stock keeping options at Technomed Asia, a mind map of all thinkable implications, requirements and
concerns was drawn. The mind map was composed with the help of a brainstorming session with different
departments of the Technomed Europe management, and also with the help of questionnaires filled in by the
Technomed Asia staff. This effort has resulted in Figure 10-1.
The consequences of keeping 100-level stock are much shared with the consequences of keeping 400-level
stock. Concerns that only apply to storing the 400-level were flagged in the mind map. Going clockwise from
the top the following consequences and requirements were expected. In this section a short explanation of the
expected consequences is given.
10.1.1 PRODUCTION
Keeping 400-level stock would change the production schedule severely. Technomed Asia production is now
controlled by production orders for separate customers. If the CODP lies behind the production process,
Technomed Asia can start to produce to a general forecast or to an up-to-level, depending on the control rule.
Batch sizes will be bigger, since production is for multiple customers. Batch sizes should not be too big in order
to prevent the risk of calling back too many products in case of a non-conformity that is noticed after the
product is sold. Keeping 100-level stock would give production the freedom of producing product when they
want to produce it. And an improvement of the current situation where idle time and overtime play a big role.
10.1.2 WA REHOUSE

Implementation strategy
87
More space will be needed in the warehouse if more stock will be kept there. It is already quite there with
boxes and the packaging department in there. Conditions in the warehouse will need to sustain the storage of
400 level products; there should not be too much dust, moist and extreme temperatures. And the storage
facilities should also not damage the 400 level. At this moment the 400-level product is already temporarily
stored in boxes before it is cleaned in alcohol and ultrasound, and then pouched. If the product is not pouched,
discoloration can occur.
Exact counting of the number of 400-level products is usually done during pouching, because the pouching
machine has a counting facility. It is not entirely clear how the counting should be done in the future, when the
product will be stored before pouching. Maybe a certain level of uncertainty should be accepted in the stock
level.
10.1.3 STOCK MANAGEMENT
One of the companies will need to manage the amount of stock that is kept at Technomed Asia. Since
Technomed Europe is the company doing the forecasting and the sales it is best that they decide ho much is in
stock at Technomed Asia. In order for this to function well, Technomed Europe needs a pretty good insight into
what stock is available at Technomed Asia at any point in time. Therefore Technomed Asia is in need of a digital
system in which they can register all incoming, used and discarded materials. Technomed Europe should be
able to do some online management, especially with all those time related tax problems lurking in Indonesia.
That is why second requirement is that Technomed Asia can share their information with Technomed Europe
through an internet connection.
10.1.4 PRINTING
For keeping both 400-level stock and 100-level stock, Technomed Asia is required to print batch cards. Batch
cards are normally sent along with the material from Netherlands, but if Technomed Asia starts packing to
order or if they start picking from raw materials, it would be a pure waste of time to involve TNT in this process.
For printing batch cards Technomed Asia needs printing hardware, the right data to print, and a validation
process after printing that will guarantee that the right batch card is printed. The label that is added to the
product after packing should also be printed at Technomed Asia once they start packing to order. For label
printing the same requirements hold as for batch printing.
10.1.5 TRACEABILITY
Traceability has to be guaranteed all through the supply chain. If stock is kept at Technomed Asia, then
Technomed Asia gets part of the responsibility for traceability. At this moment they already have the
responsibility that accompanies picking the right materials from the warehouse. In the future this responsibility
will still lie at Technomed Asia. They will also get the responsibility of storing the material in such a way that
batches will be separated. This applies to keeping raw materials and assembled product in stock. Another

88
aspect of guaranteeing traceability is the registering of data about the lot numbers of raw material used a
production batch, and the production batch number of the product that is sent to the customer. This
responsibility could be placed at either Technomed Europe or Technomed Asia. The information system should
also be updated to accommodate information about the extra level that is created between the raw material
and the customer.
10.1.6 SHIPPING FREQUENCY
Shipping frequency might be in need of a change, once Technomed Asia starts to pack to order. Maybe it can
be limited in quiet periods or increased in busy times. At least it might be worth it to reevaluate shipping
frequency if circumstances change.
10.1.7 UNEXPECTED SITUATIONS
Keeping more stock at Technomed Asia, means there will be more value stored in the warehouse. Solid
arrangements about responsibility for the stock should be made. What happens in case of a fire, flood,
earthquake, or theft?
10.1.8 INFORMATION SYSTEM
One thing that sticks out is the recurrence of the need for an online information system. It is needed to manage
stock levels online, to determine stock age, to communicate information, and it can be used for many other
purposes at Technomed Asia.
It is clear that in order for the information system to function the hardware in the form of computers,
connected to the network, should be available. And if software is installed Technomed Asia personnel might
have to be trained, or at least informed about what to do with it. The question remains what type of
information system will be sufficient for Technomed Asia. Can it be limited to some Excel sheets, or should a
more elaborate piece of software be installed?
10.2 IMPLEMENTATION
Now that we have a vision of the consequences and requirements that the proposed changes will bring, it is
time to make a plan about implementing them. Which factors are important? What is the best order to
implement? In this section we will discuss the business environment in which the changes will have to take
place (10.2.1 “Making compromises”) and from there we move to the appropriate starting point (10.2.2
“Starting point: the information system” ) and from that we will flow through all stages of the implementation
in sections 10.2.3 (“Keeping 400-level stock”) and 10.2.4 (“Keeping 100-level stock”). Each stage will contain
more detailed information about the requirements for that stage and about guaranteeing and measuring
performance of the implementation.

Implementation strategy
89
10.2.1 MAKING COMPROMISES
Keeping 400-level stock is a wish that comes from Technomed Europe primarily, while keeping 100-level stock
is an idea that is embraced most by Technomed Asia, as is autonomous decision making at Technomed Asia.
Installing a decent information system at Technomed Asia is something that both companies agree will be very
useful.
Autonomous decision making by Technomed Asia is a sensitive subject for Technomed Europe. This is very
understandable since their license could be revoked if traceability cannot be guaranteed. If it would be
revoked, Technomed Europe would not be allowed to sell their product in areas where most of their customers
reside and this would lead to big financial problems for both Technomed Europe and Technomed Asia. After all
Technomed Asia, at this point in time, fully relies on Technomed Europe for its income. One should not think
lightly about transferring responsibility for traceability to Technomed Asia, yet for warehouse management,
applying FIFO principles, avoiding tax problems, avoiding idle time and overtime, avoiding shipments with TNT,
and avoiding rush jobs and mistakes, having this responsibility would be a welcome change to Technomed Asia.
Truth is that Technomed Asia is not ready to deal with full responsibility for traceability now, but they can be
ready in the future, if they get the chance to be.
Technomed Europe's request for keeping 400-level stock and setting up an information system brings about
consequences that can be the starting point for Technomed Asia to start working towards taking on more
responsibilities.
By taking into account both companies’ wishes a win-win situation can be created. Giving Technomed Asia full
responsibility for traceability, 400-level stock, 100-level stock and a new information system at the same time,
without proper guidance will most probably fail completely. So a plan is needed for implementing these
changes step by step. If this situation can be realized both Technomed Europe and Technomed Asia will have
great advantages of this. The researcher would advice the following steps in transferring responsibilities to
Technomed Asia.
10.2.2 STARTING POINT: THE INFORMATION SYSTEM
The first step towards clear management of the supply chain would be to manage data at Technomed Asia. If
Technomed Europe does not know stock levels at Technomed Asia, the future situation will be at least as
chaotic as it is now, but probably worse. This is why the information system stays the starting point of any
implementation plan. Any proposed adaptation in stock keeping at Technomed Asia requires a good
information system.

90
As described in the literature (Akkermans & Helden van, 2002) there are some general success factors that play
a part in helping implementation of an ERP system forward. When the success factors mentioned, are seen in
the light of installing an information system at Technomed Asia some of them seem very important.
In Indonesia there should be a project captain that has the possibility to make decisions about the project
anytime. Since hierarchy is very important in Indonesia delays can be expected if such a captain is not available
throughout the project. The plant manager could be a good choice for this. He can also be held responsible for
the communication about the project. This project captain should just as well exist in Netherlands, without a
responsible person at Technomed Europe there will be a lack of structure in the communication and the
steering of the project.
Then the next important issue is that both companies and all those involved are aware of the goals and
objectives of the project. And also that they are aware that this will help all parties involved. With this
understanding everybody can unite strength and motivation and try to make the best decisions at all times.
With understanding there will be no reason for resistance, which can play a negative role in ERP
implementation.
Expectations should be managed and monitored. What do both parties expect from the project and how does
that expectation relate to reality.
Of course, education and training are an essential part of implementation. There is no question about that.
System architecture should be chosen in such a way that data is compatible with Technomed Europe, but also
in such a ways that it is workable for Technomed Asia and that it fits their processes. For this the information
structure as described in Figure 5-4 Technomed Asia material and information flow) can be used, or adapted.
Then in order to make early corrections when things go wrong, progression and performance should be
measured.
Purpose of the information system
Functionality Importance ranking
Controlling traceability 1
Inventory management 2
Communication 2
Determining stock value 2
Giving information on material status 2
Production planning 2
Real time management 3
Generating reports 4
Avoiding tax problems 4
Performance measurement 5

Implementation strategy
91
Data visualization 5
Table 10-1 Information system functionality importance ranking
Technomed Europe would like to use this system primarily for managing stock levels, for having up to date and
complete information, and for communication. The ERP system at Technomed Europe is already in place, but at
Technomed Asia it still has to be implemented. A survey conducted by the researcher to investigate what IT
features Technomed Asia finds relevant, revealed that they would like to see the functionalities as displayed in
Table 10-1 in an information system.
Importance rankings were given, but none of the functionalities were ranked unimportant. The scale should be
interpreted as going from very important (1) to normal importance (5). There is overlap between Technomed
Europe and Technomed Asia in what is rated as very important. This means that both companies can agree to
the usefulness of installing such a system, which will contribute to the motivation of both parties.
Furthermore the biggest purpose of installing an information system at Technomed Asia will be to support
future stock keeping activities.
Type of information system
Information from Technomed Asia can be shared with the use of Excel files and a FTP-server, but it can also be
shared through a client version of the Technomed Europe ERP system “Vantage”. Technomed Europe uses
validated software to comply to the requirements for their licenses. If Technomed Asia would ever want to
grow towards taking responsibility for anything else, they will need to validate their software.
Excel sheets that are made by hand, are hard to validate, whereas a client version of Vantage would open the
road to growth. In the same time it will reduce the time invested in making and changing unofficial Excel
sheets, and the amount of mistakes that can be made by broken links and other things that can go wrong in
Excel.
Furthermore the information would be directly compatible with the information in the Technomed Europe
database, which would make communication and use of factual data effortless, if of course a decent internet
connection is installed.
Last but not least it would ease communication from Technomed Europe to Technomed Asia. In case a change
is made in the bill of materials, this will be immediately clear, and will not have to be communicated. Neither
will it have to be changed by hand in a complex excel sheet. One big advantage is that Technomed Asia is
already working with the same part numbers and products codes
A fast internet connection is certainly a possibility according to the Technomed Asia “computer scientist”.
Other requirements for successful implementation

92
Technomed Asia personnel will have to be educated about how to use the Vantage ERP system, skills like that
will not just develop them selves. Furthermore clear standard procedures will have to be written for how and
when important data should be entered, to avoid as many mistakes as possible. Technomed Asia will also have
to be disciplined in making the data entries. The Technomed Asia plant manager feels he can establish this by
people management. When the system is online and accessible to all Technomed Asia management, it will be
easier to check whether those responsible for entering data are doing their jobs.
Technomed Asia expects that they might make some mistakes, but with the help of feedback, discovering root
causes of mistakes and taking preventive actions, they expect to master the art of information management.
The researcher herself has all trust that this will work out just fine at Technomed Asia. The neighboring
company Sugih is the living proof that a higher level of information management in Indonesia should not form
any problem at all. If the information system is up and running it should drastically decrease the need for
communication about factual data.
Measuring performance
If Technomed Asia would want to proof they have the information management under control and if
Technomed Europe would want to be sure of it, some kind of performance will have to be measured.
The most important way to measure the performance of Technomed Asia's information management system
would be to make regular stock counts to control if the digital system is up to date and if numbers are accurate.
All incidents could be recorded and archived. An assessment of how well Technomed Asia deals with feedback
can be made, for example by finding out if mistakes are repeated very often.
When the number of mistakes and incidents is within acceptable limits and people learn from their mistakes
Technomed Asia will have proven that they have gotten the hang of managing information.
10.2.3 KEEPING 400-LEVEL STOCK
The next step is shifting the CODP down the supply chain. This step is requested by Technomed Europe and can
be a good way to experiment with responsibilities. One of the consequences of keeping 400-level stock, is that
there will be a new decision point in the supply chain. Someone, somewhere, will have to decide which
production batch will go into a customer order, and after that a batch card and a label with the correct
information have to be printed. Since the stock is kept at Technomed Asia, it would be most practical to have
the decision made by Technomed Asia. This could help to support a first in first out (FIFO) system and to avoid
an unnecessary need for communication. Also it can avoid long waiting times when either of the companies is
closed due to the time zone difference. Label and batch card printing have to be performed by Technomed Asia
to prevent a useless increase in lead time.
A plan for dealing with more responsibilities

Implementation strategy
93
Label and batch card printing should be done with great care, traceability stands above all else for the
Technomed Company. In order create a correct label, a control system should be established. When asked how
to guarantee traceability on the label, Technomed Asia proposes the following system.
After production, the amount of finished 400-level product is entered into the information system with its own
lot number. The product itself will be stored in an appropriate place.
When a customer order comes in, a batch card, from Technomed Europe, will arrive at Technomed Asia
(Preferably through the digital highway). The batch card can either only contain a request for packing of a
certain amount of product, or it could also prescribe the lot number that should be used. Technomed Asia
would prefer if they could make their own decision about the lot number and could register this information
themselves, the researcher agrees with them. The batch card will be used to issue a request to the warehouse
for a certain amount of product. In the warehouse the picked lot numbers will be registered and the amounts
will be written down. This amount can later be verified at the pouching machine, which has a counting
function. The amount picked should also correspond to the data in the information system. When the people
dealing with the batch card, picking, pouching and processing data have done their parts in controlling the
information, they sign the batch card, and are responsible for its content.
After this someone will create a label, compares it to the batch card, and signs for this. A sample will be
printed, and this will go to quality control (QC). QC will compare the label to the batch card again, and will sign
for this. If it is really necessary TE might also approve the label, preferably via the internet, but ideally
Technomed Asia would operate independent. After approval by QC a green light will be given to print all labels,
after which a sample check for quality will be made. Quality issues that are not related to traceability will be
checked 100% during packing, just like it is done now. All in all many standard procedures will have to be in
place.
Performance measurement
Technomed Europe can do an extra control on the batch cards and labels to determine the amount of mistakes
that are made. If Technomed Asia can make the decision as to which lot number will go into a batch,
performance can be measured by measuring the accuracy.
In the beginning there will be more control needed than in a later point in time, when a sample test might be
sufficient.
Again Technomed Europe might also want to check how well feedback transformed into improvements, by
keeping track of incidents and feedback given. After working together more intensive in the beginning,
Technomed Europe can slowly give responsibility to Technomed Asia, if they decide that performance is up to
the standard.
To determine the performance of the 400-level stock system itself, Technomed can measure the number of
stock outs, the amount of dead stock, stock value, things like that.

94
10.2.4 KEEPING 100-LEVEL STOCK
100-level stock keeping would calm down all of the processes taking place at Technomed Asia; idle time and
over time could both be greatly reduced. Technomed Europe could cut down on express delivery cost and taxes
by keeping 100-level stock at Technomed Asia. According to Technomed Asia wishes, the 100-level stock should
certainly not exceed three months worth of stock. If more stock is kept, tax problems might occur in times of
low demand. Ideally Technomed Asia would like to have 1 month of stock in their vicinity.
Requirements
Physical requirements are much the same as they are for keeping 400-level stock. Space should be available
and printers installed. Batch cards printed at Technomed Asia should be validated, whether their content is
decided by Technomed Europe or Technomed Asia.
Technomed Asia would benefit from making autonomous decisions regarding lot numbers, because they could
apply the simple FIFO principle, which would comply with the way the rest of the company is set up, and which
would also prevent tax problems.
The way that Technomed Asia would like to make sure that traceability is guaranteed is by creating a closed
loop control circuit. Initial information comes from Technomed Europe and it should be approved by
Technomed Europe in the end. The proposed system is as following. A material quantity check will be done
when materials come in. The data is entered in validated software. After a production order from Technomed
Europe arrives,
a proof of request will be made. This proof of request will be the same document as it is now; it does, however,
depend on who is making the decision, whether the lot number is already filled in, or is to be filled in after
picking. Another option would be for the lot number to be prescribed by the software that might be able to
handle a FIFO system. A disadvantage of automation though, is that more often than not it limits your
flexibility.
The proof of request could be approved by Technomed Europe, but preferably it should not be. In the end
material will be picked from the warehouse, the amount picked would be entered in the information system,
the batch card is controlled and signed by the production manager, and sent back to Technomed Europe for
approval. The plant manager will be responsible for the human factor, which is the disciplined entry of data in
the system and the disciplined use of standard procedures.
At this point the researcher wants to make a comment that subjective quality controls of products might be
difficult to communicate to Technomed Asia, but dealing with data is quite an objective thing. During the

Implementation strategy
95
researcher's stay at Technomed Asia, the people have shown to be very good at interpreting and acting upon
objective information, even more so than Technomed Europe, which seemed to be a bit sloppy with
information compared to Technomed Asia. This is why the researcher believes that Technomed Asia will be up
to the task of taking responsibility for traceability.
Performance
Performance can be measured in the same way as it is measured for keeping 400-level stock. Performance in
the areas of stock keeping, information management and traceability should be monitored.
10.3 SUMMARY
In order to make the implementation of the proposed solutions succeed, Technomed Europe and Technomed
Asia will have to invest money, time and energy. They will have to cooperate closely and Technomed Asia
should be carefully guided in getting a more professional way of working that can guarantee traceability. The
researcher believes that with proper guidance, performance measurement and investment of both companies
a good result is absolutely attainable. Capabilities are there at both companies, they just have to be channeled
nurtured and refined.

96
11 CONCLUSION AND RECOMMENDATIONS
The main objective of the study at Technomed Europe and Technomed Asia was to find methods to improve
logistical interactions between Technomed Europe and Technomed. According to the author this goal is
accomplished after formulating an adequate, attainable alternative and making suggestions about its
implementation. In this chapter a recapitulation of research and answers found, is given. Resulting in the final
recommendation for improving logistical interactions between Technomed Europe and Technomed Asia
11.1 ANSWERING THE RESEARCH QUESTION
The main research question is stated as following:
“How to improve the logistic interactions between Technomed Europe and Technomed Asia”
Sub-questions were posed to answer the main research question in four careful steps. The first step was to
analyse what the ongoing processes were and identify problems, the second step was to analyse problem areas
and determine causality, the third step was to design and select an appropriate alternative, and the fourth step
was to determine what conditions should be met to accomplish a successful implementation of the design.
11.1.1 ANALYSIS
During the analysis it was found that not all Technomed Europe products were involved in the Europe-Asia
supply chain. Only those products that are being produced at Technomed Asia were relevant to the research.
For these relevant products material flow charts were developed in chapter 5 (Figure 5-2, Figure 5-3 and
“Appendix A: additional material flow charts”). Apart from the physical flow of the materials, the control
structure, and information flow throughout the chain were described. This information served as a basis for
further analyzing important measures of performance and also for making alternative designs.
There is no clean cut between the analysis of the current situation, determining key performance indicators
(KPIs) and causality. Relevant KPIs are closely linked to those activities in which problems are/can be
experienced. KPI’s were found for measuring performance of the supply chain as a whole, but also for
measuring the performance of Technomed Europe and Technomed Asia towards each other (section 5.1.5 and
5.2.2). Some very important KPIs for the supply chain as a whole were, among others: Technomed Europe’s
delivery reliability towards the customer, order lead time, forecasting accuracy, stock levels, product-cost price,
information accuracy, and more.
11.1.2 PROBLEMS AND CAUSALITY
The problems at Technomed were many and diverse. Performance of the current logistic processes is poor on
customer order lead time, total cycle time, flexibility, stock levels, Technomed delivery reliability, and

Conclusion and recommendations
97
forecasting and information accuracy. Detailed descriptions of performance and problems were given in
chapter 6. The given measures are not yet related to a preferred level, but absolute numbers were given. Total
cycle time can take up to 29 weeks, forecasting can be off by 50%, stock takes up 34% of Technomed’s yearly
turnover, and 46% of Technomed’s products are delivered late to their customers.
In this stage of the research we looked at the causality from a broad view, hereby creating a complex cluster of
interrelated problem areas. Problems were experienced in the following areas: organization and planning,
suppliers, supply chain architecture, transport, tax and customs, physical limits, and communication and
culture. Problems are so interconnected that changing one thing will have an effect in multiple areas.
Within the context of the research question the following problems were relevant: late and unstructured
deliveries and requests from Technomed Europe to Technomed Asia, long lead times, obsolete inventory, a
high amount of backorders, and a lack of information availability. These problems are very much related to
supply chain architecture.
11.1.3 DESIGN AND SELECTION
Alternative design of the supply chain architecture was presented in chapter 8. Literature gave solutions on a
strategic level, like keeping strategic 400-level stock in Indonesia to create a leagile supply chain. While analysis
of the individual nodes of the supply chain offered tactical and operational options for improvement. This
includes options like sourcing in Indonesia, and having quality checks done by Technomed Asia. All proposed
scenarios were summarized in tables (Table 8-1 to Table 8-4) with their expected advantages and drawbacks,
and with the considerations from Technomed’s management concerning the desirability of the proposed
change.
After discussing all options with Technomed, we decided to stay within the current company and process
structure. Within this context, the proposal had to be financially attainable and had to bring a sufficient
advantage. During this process many options were discarded for further research.
For those options that were viable, and thus selected for further research, an elaborate estimation of the
expected performance was given in chapter 9. A detailed description of the tangible and intangible advantages
of the proposed alternative was also presented. The final proposal, as selected and described in chapter 9, is
displayed in Figure 11-1. The purpose of the proposed changes is discussed in the following paragraphs.
Keeping 100-level stock at Technomed Asia and combining that with autonomous decision making will create a
less hectic schedule at Technomed Asia, fewer problems with customs and tax, and less complexity in
managing and registering stock.
The 400-level stock point should decrease total end-product stock levels and the number of stock-outs by
making use of the risk pooling effect. Risk pooling affects those products that are sold to several customers

98
with a private label. It should also give shorter customer order lead times. An information system is suggested
as a support for the activities mentioned above.
Calculations on the effect of risk pooling on DSNE stocks show minimal stock reductions of 19.3%, and
maximum stock reduction of 56.8%. Calculations can be found in section 9.1.2. The CODP will be located
further downstream in the supply chain, going from 10 to 5 weeks before the incoming order for those
products concerned. In these 5 weeks 400-level products will be picked and packed to order, shipped to
Technomed Europe and be sterilized and checked for quality. The products for which keeping strategic 400-
level stock is relevant are DSNE, DHNE, DMNE and DCNE. With the advantage depending on the contracts that
Technomed Europe makes with its customers.
11.1.4 IMPLEMENTATION
Implementation of the proposed changes should be done with great care and not all at once. The information
system is a prerequisite for holding and managing stock at Technomed Asia. This information system should be
able to communicate with Technomed Europe’s information system and it should be validated in order to open
the road to growth of responsibilities for Technomed Asia. Technomed Europe should be the actor in the
implementation; they are the steering, experienced partner. If Technomed Asia will be assisted thoroughly
during the implementation phase and performance will be monitored, according to the researcher, all
objectives can be realized, all capabilities are there. The complexity of the problem cluster should be kept in
mind at all times and it should be reduced one step at a time.
Figure 11-1 final proposal

Conclusion and recommendations
99
11.1.5 DISCUSSION
The proposal as given in Figure 11-1 is only one option for improving logistical interactions between
Technomed Europe and Technomed Asia, but it is neither the only one nor the best one. It is just the best one
within the limits that were set, like staying close to the current structure and not changing the product or
assembly process. An optimal situation would require many more adaptations, but the company is not ready to
take all these steps at the same time and some changes are easier to make than others. The final proposal will
form a good starting point for improvement, but in the future Technomed still has many different options for
improvement. The effort will never be wasted though, because there will always be the benefit from a better
developed, better supported, better adjusted, more professional situation at Technomed Asia, that will provide
a basis for growth in many ways.
11.2 RECOMMENDATIONS
In the Technomed supply chain time is very precious, therefore winning time by changing the supply chain
structure might be a wise move. If the opportunity is there I would certainly recommend that Technomed looks
at options like sourcing, quality testing, processing and sterilizing in Asia/Indonesia.
Furthermore I would advice that in designing products and product ranges, the effects of the design are taken
into account. Designing with shared components can evoke a risk pooling effect for raw materials, decreasing
stock, as does the limiting of the range of products, which also decreases the 400-level stock. Simple processing
steps of the raw material can guarantee high supplier quality rates, which will reduce the number of rejects in
production and the number of disturbances in the chain.
Since the chain is such a long and rigid one it is quite sensitive to disturbances. With the measures described
above we try to minimize these disturbances, but disturbances could also be minimized by focusing on supplier
responsiveness, rather than their price only. Disturbances should also be reduced from inside the company
that is why I would most certainly advice to get the ERP system completely up to date. This will reduce the
number of human mistakes that are made by doing manual work and also the number of late deliveries due to
wrong supplier information.
Communication is not the most convincing skill in Technomed. Technomed Europe as the controlling and
steering partner should think very carefully how she wants to develop and improve communication and how
she want s to gain from that. Until the time of improvement has come, Technomed might want to reduce the
need for communication. This can be done by only moving fully developed production processes to Indonesia
with clear, stable, documented procedures and quality standards. Also raw materials should be of sufficient
quality, so there will be no 10% reject rates of incoming material at Technomed Asia.
Sending a representative from Technomed Europe to Technomed Asia on a more frequent basis or for a longer
time span can improve communication between both companies. Technomed Europe should be careful to
select who they send and what the status of the representative is. This status should depend on the

100
information and communication that is required. The company director will get significantly different
information than a student will. Both types of information can be useful.
Accurate forecast would be fantastic for those products that are produced at Technomed Asia, but probably
not attainable, yet it might be possible to steer customers in a certain direction. They could either order on
time or their forecasts could be binding. It would be interesting to find out if the customers can be manipulated
with the help of discounts or other perks.
Technomed Europe should consider carefully which products they transfer to Technomed Asia. Literature as
provided in chapter 7 could be of assistance in determining if a product is suitable for production in Indonesia.
My final recommendation is to always keep an open mind and keep listening!

References
101
REFERENCES
Akkermans, H., & Helden van, K. (2002). Vicious and virtuous cycles in ERP implementation: a case study of
interrelations between critical success factors. European Journal of Information Systems , 35-46.
Ben Naylor, J., Naim, M., & Berry, D. (1999). Integrating the lean and agile manufacturing paradigms in the total
supply chain. International Journal Production Economics 62 , 107-118.
BNP Media. (2006, 7 6). World Trade Magazine. Opgeroepen op 08 10, 2008, van Effective Multicultural
Communication :
http://www.worldtrademag.com/CDA/Articles/Feature_Article/0a66f39ea844c010VgnVCM100000f932a8c0__
__
Christopher, M., & Towill, D. (2001). An Integrated Model for the Design of Agile Supply Chains. International
Journal of Physical Distribution and Logistics Management , Vol. 30, No. 4 , 235-245.
Christopher, M., & Towill, D. (2000). Supply chain migration from lean and functional to agile and customised.
International Journal of Supply Chain Management, Vol. 5 No. 4 , 206-213.
Fisher, M. (1997). What is the right supply chain for your product? The Harvard business review, March-April .
Gunasekaran, A., Patelb, C., & McGaughey, R. E. (2004). A framework for supply chain performance
measurement. Int. J. Production Economics 87 , 333-347.
Higgs, M. (1999). Overcoming the problems of cultural differences to establish success for international
management teams. Team Performance Management, Vol.2, issue 1 , 36-43.
Hofstede, G. (sd). Geert Hofstede Cultural Dimensions. Opgeroepen op 11 21, 2008, van http://www.geert-
hofstede.com/hofstede_dimensions.php?culture1=62&culture2=43#compare
Levi, D., Kaminsky, P., & Simchi-Levi, E. (2002). In Designing & Managing the Supply Chain - Second Edition (pp.
66, Chapter 3: Inventory Management and Risk Pooling). Richard d Irwin.
Mason-Jones, R., & Towill, D. (1999). Using the information decoupling point to improve supply chain
performance. The International Journal of Logistics Management, Vol. 10, No. 2 , 13-26.
Mason-Jones, R., Naylor, B., & Towill, D. (2000). Engineering the leagile supply chain. International Journal of
Agile Management Systems , 54-61.
Narasimhan, R., & Mahapatra, S. (2004). Decision models in global supply chain management. Industrial
Marketing Management, Vol. 33 , 21-27.
Paes, R. (2007). Participatieverhoging door gezamenlijke strategiebepaling. Eindhoven: Technische Universiteit
Eindhoven, 1968-.

102
Stadtler, H. (2005). Supply chain management and advanced planning - basics, overview and challenges.
European journal of operational research 163 , 575-588.
Technomed. (2008). Technomed Europe. Opgeroepen op 12 27, 2008, van Technomed Europe:
http://www.technomed-europe.com/
Thatte, A. (2007). Competitive Advantage of a Firm through Supply Chain Responsiveness and SCM Practices.
Toledo: The University of Toledo.
Vorst, v. d., & Beulens, A. (2002). Identfying sources of uncertainty to generate supply chain redesign
strategies. International Journal of Physical Distribution & Logistics Management Vol. 32, No. 6 , 409-430.

References
103


Appendix A: additional material flow charts
I
APPENDIX A: ADDITIONAL MA TERIAL FLOW CHARTS

II

Appendix A: additional material flow charts
III