report for: cabinet - harro - main report... · report for: cabinet date of meeting: 1 5 february...
TRANSCRIPT

REPORT FOR:
CABINET
Date of Meeting:
15 February 2018
Subject:
Treasury Management Strategy Statement including Prudential Indicators, Minimum Revenue Provision Policy Statement and Annual Investment Strategy for 2018/19
Key Decision:
Yes
Responsible Officer:
Dawn Calvert, Director of Finance
Portfolio Holder:
Councillor Adam Swersky, Portfolio Holder for Finance and Commercialisation
Exempt:
No
Decision subject to
Call-in:
No, as the decision reserved to Council
Wards affected:
All
Enclosures:
Appendix A – Legislation and Regulations Impacting on Treasury Management Appendix B – Treasury Management Delegations and Responsibilities Appendix C – Minimum Revenue Provision (MRP) Policy Statement Appendix D – Interest Rate Forecasts 2018-21 Appendix E - Economic Background Appendix F - Counterparties Appendix G - Affordability Prudential Indicators

Summary
This report sets out the Council’s Treasury Management Strategy Statement including Prudential Indicators, Minimum Revenue Provision Policy Statement and Annual Investment Strategy 2018/19.
Recommendation
Cabinet is asked to recommend to Council that they approve the Treasury Management Strategy Statement for 2018/19 including:
Prudential Indicators for 2018/19
Minimum Revenue Provision Policy Statement for 2018/19;
Annual Investment Strategy for 2018/19
Increase in investments held over 365 days (Paragraph 83)
Reason
To promote effective financial management and comply with the Local Authorities (Capital Finance and Accounting) Regulations 2003 and other relevant guidance.
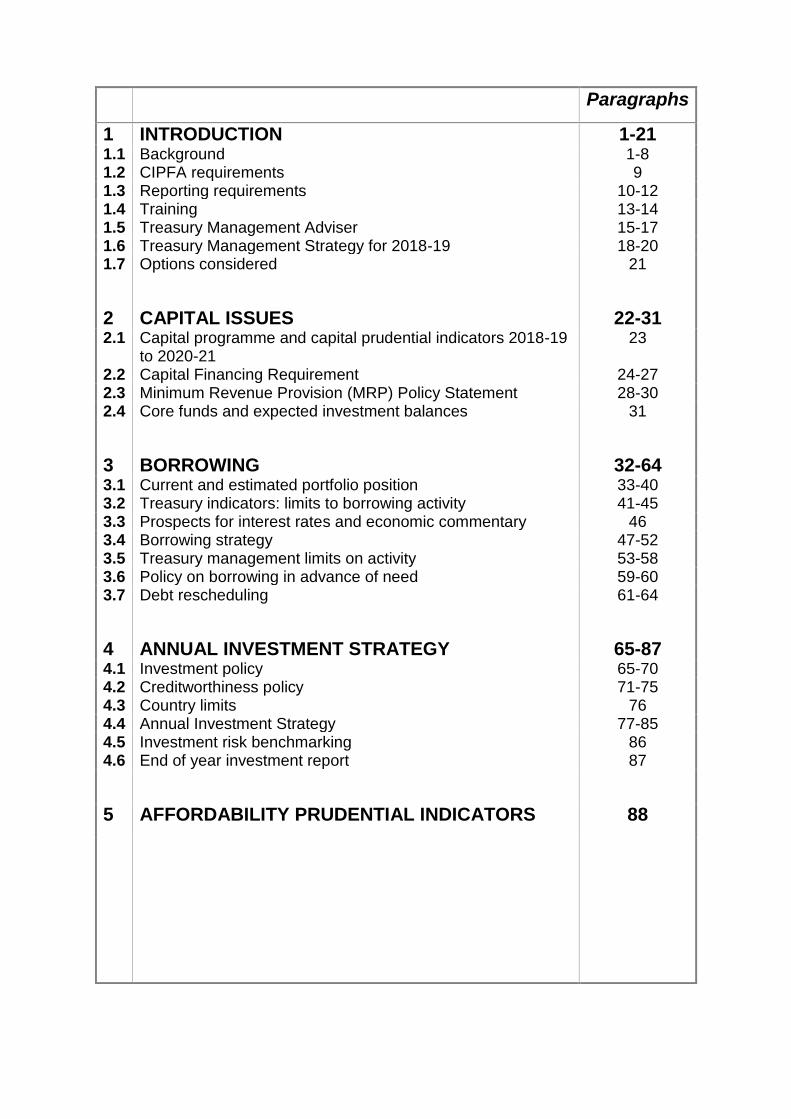
Paragraphs
1 INTRODUCTION 1-21 1.1 Background 1-8
1.2 CIPFA requirements 9 1.3 Reporting requirements 10-12 1.4 Training 13-14 1.5 Treasury Management Adviser 15-17 1.6 Treasury Management Strategy for 2018-19 18-20 1.7 Options considered 21
2 CAPITAL ISSUES 22-31 2.1 Capital programme and capital prudential indicators 2018-19
to 2020-21 23
2.2 Capital Financing Requirement 24-27 2.3 Minimum Revenue Provision (MRP) Policy Statement 28-30 2.4 Core funds and expected investment balances 31
3 BORROWING 32-64 3.1 Current and estimated portfolio position 33-40 3.2 Treasury indicators: limits to borrowing activity 41-45 3.3 Prospects for interest rates and economic commentary 46 3.4 Borrowing strategy 47-52 3.5 Treasury management limits on activity 53-58 3.6 Policy on borrowing in advance of need 59-60 3.7 Debt rescheduling 61-64
4 ANNUAL INVESTMENT STRATEGY 65-87 4.1 Investment policy 65-70 4.2 Creditworthiness policy 71-75 4.3 Country limits 76 4.4 Annual Investment Strategy 77-85 4.5 Investment risk benchmarking 86 4.6 End of year investment report 87
5 AFFORDABILITY PRUDENTIAL INDICATORS 88

APPENDICES A Legislation and Regulations Impacting on Treasury
Management
B Treasury Management Delegations and Responsibilities C Minimum Revenue Provision (MRP) Policy Statement D Interest Rate Forecasts 2018-21 E Economic Background F Counterparties G Affordability Prudential Indicators

Section 2 – Report
1. INTRODUCTION
1.1 Background 1. The Chartered Institute of Public Finance and Accountancy (CIPFA)
defines Treasury Management as: “The management of the local authority’s borrowing investments and cash flows, its banking, money market and capital market transactions; the effective control of the risks associated with those activities; and the pursuit of optimum performance consistent with those risks.”
2. The Council is required to operate a balanced budget, which broadly
means that cash raised during the year will meet cash expenditure. The first main function of the treasury management operation is to ensure that this cash flow is adequately planned, with cash being available when it is needed. Surplus monies are invested with approved counterparties or instruments commensurate with the Council’s current investment strategy, providing adequate liquidity initially before considering investment return.
3. The second main function of the Treasury Management service is the
funding of the Council’s capital programme. This programme provides a guide to the borrowing need of the Council, essentially the longer term cash flow planning, to ensure that the Council can meet its capital spending obligations. This management of longer term cash may involve arranging long or short term loans or using longer term cash flow surpluses. On occasion, any debt previously drawn may be restructured to meet Council risk or cost objectives.
4. The Local Government Act 2003 and supporting regulations require the
Council to ‘have regard to’ the Prudential Code (The Prudential Code for Capital Finance in Local Authorities [CIPFA 2017 Edition]) and Treasury Management Code (Treasury Management in the Public Services: Code of Practice and Cross-Sectoral Guidance Notes [CIPFA 2017 Edition]), in setting Treasury and Prudential Indicators for the next three years and in ensuring that the Council’s capital investment programme is affordable, prudent and sustainable.
5. The Act, the Codes and Department for Communities and Local Government Investment Guidance (2010) require the Council to set out its Treasury Strategy for Borrowing and to prepare an Annual Investment Strategy that establishes the Council’s policies for managing its investments and for giving priority to the security and liquidity of those investments. A summary of the relevant legislation, regulations and guidance is included as Appendix A.
6. The budget for each financial year includes the revenue costs that flow
from capital financing decisions. Under the Treasury Management Code,
increases in capital expenditure should be limited to levels whereby increases in interest charges and running costs are affordable within the projected income of the Council for the foreseeable future.
7. The Council regards the successful identification, monitoring and control of risk to be the prime criteria by which the effectiveness of its treasury management activities will be measured. Accordingly, the analysis and reporting of treasury management activities will focus on their risk implications for the organisation.
8. The Council recognises that effective treasury management will provide
support towards the achievement of its business and service objectives. It is therefore committed to the principles of achieving value for money in treasury management, and to employing suitable comprehensive performance measurement techniques, within the context of effective risk management.
1.2 CIPFA requirements
9. The Council has formally adopted the Treasury Management Code, the primary requirements of which are as follows:
Creation and maintenance of a Treasury Management Policy Statement which sets out the policies and objectives of the Council’s treasury management activities.
Creation and maintenance of Treasury Management Practices (“TMPs”) that set out the manner in which the Council will seek to achieve those policies and objectives.
Receipt by the full Council and/or Cabinet of an annual Treasury Management Strategy Statement - including the Annual Investment Strategy and Minimum Revenue Provision Policy - for the year ahead, a Half-year Review Report and an Annual Report (stewardship report) covering activities during the previous year.
Delegation by the Council of responsibilities for implementing and monitoring treasury management policies and practices and for the execution and administration of treasury management decisions.
Delegation by the Council of the role of scrutiny of treasury management strategy and policies to a specific named body.

1.3 Reporting requirements
10. As introduced above, the Council and/or Cabinet are required to receive and approve, as a minimum, three main reports each year, which incorporate a variety of policies, estimates and actuals.
Treasury Management Strategy Statement report (this report) - The first, and most important report is presented to the Council in February and covers:
the capital programme (including Prudential Indicators);
an MRP Policy (how residual capital expenditure is charged to revenue over time);
the Treasury Management Strategy (how the investments and borrowings are to be organised) including treasury indicators; and
an Investment Strategy (the parameters on how investments are to be managed).
Mid-year Review report – This is presented to Cabinet in the autumn and updates Members on the progress of the capital position, reporting on Prudential Indicators and recommending amendments when necessary and identifying whether the treasury strategy is meeting the objectives or whether any policies require revision.
Treasury Management Outturn report – This is presented to Cabinet in June/July and provides details of a selection of actual prudential and treasury indicators and actual treasury operations compared to the estimates within the Strategy.
Scrutiny - The above reports are required to be adequately scrutinised, normally before being recommended to Cabinet / Council, with the role being undertaken by the Governance, Audit, Risk Management and Standards Committee (GARMSC). GARMSC Capital Strategy In December 2017, CIPFA issued revised Prudential and Treasury Management Codes. As from 2019-20, all local authorities will be required to prepare an additional report, a Capital Strategy report, which is intended to provide the following: -
a high-level overview of how capital expenditure, capital financing and treasury management activity contribute to the provision of services
an overview of how the associated risk is managed
the implications for future financial sustainability.
The aim of this report is to ensure that all elected members on the full council fully understand the overall strategy, governance procedures and risk appetite entailed by this Strategy.
The Capital Strategy will include capital expenditure, investments and liabilities and treasury management in sufficient detail to allow all members to understand how stewardship, value for money, prudence, sustainability and affordability will be secured.

11. The Council has delegated responsibility for the implementation and regular monitoring of its treasury management policies and practices to the Section 151 officer. The Section 151 Officer chairs the Treasury Management Group (TMG), which monitors the treasury management activity and market conditions.
12. Further details of responsibilities are given in Appendix B.
1.4 Training
13. The Treasury Management Code requires the responsible officer to ensure that Members with responsibility for treasury management receive adequate training in this area. This especially applies to Members responsible for scrutiny.
14. The training needs of Treasury Management officers are periodically reviewed as part of the Learning and Development programme with appropriate training and support provided.
1.5 Treasury Management Adviser
15. The Council has engaged Link Asset Services (was Capita Asset Services), Treasury Solutions as its external Treasury Management Adviser.
16. However, the Council recognises that responsibility for treasury
management decisions remains with itself at all times and will ensure that undue reliance is not placed upon external service providers.
17. It also recognises that there is value in employing external providers of treasury management services in order to acquire access to specialist skills and resources. The Council will ensure that the terms of their appointment and the methods by which their value is assessed are properly agreed and documented, and subjected to regular review.
1.6 Treasury Management Strategy for 2018/19 18. The Strategy covers:- Capital Issues (Section 2)
Capital programme and capital prudential indicators 2018-19 to 2020-21 (Sub-section 2.1);
Capital Financing Requirement (Sub-section 2.2);
Minimum Revenue Provision Policy Statement (Sub-section 2.3 and Appendix C); and
Core funds and expected investment balances (Sub-section 2.4).
Treasury Management Issues
Borrowing (Section 3)
- Current and estimated portfolio position (Sub-section 3.1);
- Treasury indicators: limits to borrowing activity (Sub-section 3.2);

- Prospects for interest rates and economic commentary (Sub-section 3.3 and Appendices D and E);
- Borrowing strategy (Sub-section 3.4);
- Treasury management limits on activity (Sub-section 3.5);
- Policy on borrowing in advance of need (Sub-section 3.6); and
- Debt rescheduling (Sub-section 3.7).
Annual Investment Strategy (Section 4)
- Investment policy (Sub-section 4.1);
- Creditworthiness policy (Sub-section 4.2);
- Country limits (Sub-section 4.3);
- Annual Investment Strategy (Sub-section 4.4);
- Investment risk benchmarking (Sub-section 4.5); and
- End of year investment report (Sub-section 4.6).
Affordability Prudential Indicators (Section 5 and Appendix G)
19. These elements cover the requirements of the Local Government Act
2003, the CIPFA Prudential Code, the Department for Communities and Local Government (DCLG) Minimum Revenue Provision Guidance, the CIPFA Treasury Management Code and DCLG Investment Guidance.
20. It is not considered necessary to produce a separate treasury strategy
for the Housing Revenue Account (HRA) in light of the co-mingling of debt and investments between HRA and the General Fund. Where appropriate, details of allocations of balances and interest to HRA are contained in this report.
1.7 Options Considered 21. No options were considered beyond those discussed in the report due to
the statutory and risk management constraints inherent in treasury management.
2. CAPITAL ISSUES
22. The Council’s capital expenditure programme is the key driver of treasury management activity. The output of the programme is reflected in the Prudential Indicators, which are required by the Prudential Code and are designed to assist Members’ overview. The values shown in the tables for 2016-17 and 2017-18 are actual and estimated outturn respectively and not the strategy for those years.
2.1 Capital Programme and Capital Prudential Indicators 2018-19 to 20-21
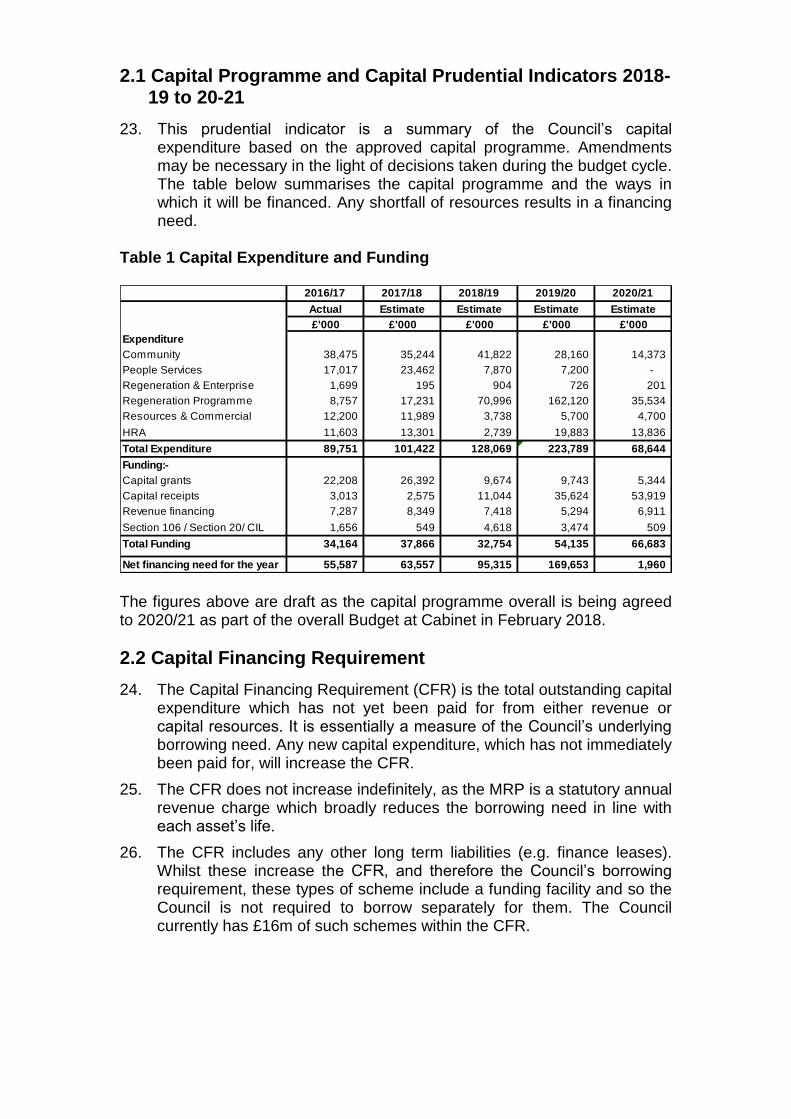
23. This prudential indicator is a summary of the Council’s capital expenditure based on the approved capital programme. Amendments may be necessary in the light of decisions taken during the budget cycle. The table below summarises the capital programme and the ways in which it will be financed. Any shortfall of resources results in a financing need.
Table 1 Capital Expenditure and Funding
2016/17 2017/18 2018/19 2019/20 2020/21
Actual Estimate Estimate Estimate Estimate
£'000 £'000 £'000 £'000 £'000
Expenditure
Community 38,475 35,244 41,822 28,160 14,373
People Services 17,017 23,462 7,870 7,200 -
Regeneration & Enterprise 1,699 195 904 726 201
Regeneration Programme 8,757 17,231 70,996 162,120 35,534
Resources & Commercial 12,200 11,989 3,738 5,700 4,700
HRA 11,603 13,301 2,739 19,883 13,836
Total Expenditure 89,751 101,422 128,069 223,789 68,644
Funding:-
Capital grants 22,208 26,392 9,674 9,743 5,344
Capital receipts 3,013 2,575 11,044 35,624 53,919
Revenue financing 7,287 8,349 7,418 5,294 6,911
Section 106 / Section 20/ CIL 1,656 549 4,618 3,474 509
Total Funding 34,164 37,866 32,754 54,135 66,683
Net financing need for the year 55,587 63,557 95,315 169,653 1,960 The figures above are draft as the capital programme overall is being agreed to 2020/21 as part of the overall Budget at Cabinet in February 2018.
2.2 Capital Financing Requirement
24. The Capital Financing Requirement (CFR) is the total outstanding capital expenditure which has not yet been paid for from either revenue or capital resources. It is essentially a measure of the Council’s underlying borrowing need. Any new capital expenditure, which has not immediately been paid for, will increase the CFR.
25. The CFR does not increase indefinitely, as the MRP is a statutory annual revenue charge which broadly reduces the borrowing need in line with each asset’s life.
26. The CFR includes any other long term liabilities (e.g. finance leases). Whilst these increase the CFR, and therefore the Council’s borrowing requirement, these types of scheme include a funding facility and so the Council is not required to borrow separately for them. The Council currently has £16m of such schemes within the CFR.

27. CFR projections are included in the table below.
Table 2 Capital Financing Requirement
The Non-HRA CFR increases from £329m to £601m and then reduces to £577m in 2020/21, reflecting the regeneration programme, the property investment portfolio, secondary school expansion, the redevelopment of the depot, the renewal and replacement of highways, footways and streetlighting and upgrades and enhancements to ICT systems. Through a special determination the debt limit for the HRA has been increased to £154.7m and work will be carried out in line with this increase.
2.3 Minimum Revenue Provision (MRP) Policy Statement 28. Capital expenditure is generally defined as expenditure on assets that
have a life expectancy of more than one year e.g. buildings, vehicles, machinery etc. The accounting approach is to spread the cost over the estimated useful life of the asset. The mechanism for spreading these costs is through an annual MRP. The MRP is the means by which capital expenditure, which is financed by borrowing or credit arrangements, is funded by Council Tax.
29. Regulation 28 of the Local Authorities (Capital Finance and Accounting)
(England) Regulations 2003 (as amended) require the Council to approve an MRP Statement setting out what provision is to be made in the General Fund for the repayment of debt, and how the provision is to be calculated. The purpose of the Statement is to ensure the provision is prudent, allowing the debt to be repaid over a period reasonably commensurate with that over which the capital expenditure benefits. The Council is recommended to approve the statement as detailed in Appendix C.
30. There is no requirement on the HRA to make a minimum revenue
provision but there is a requirement for a charge for depreciation to be made.

2.4. Core funds and expected investment balances
31. The application of resources (grants, capital receipts etc.) to finance capital expenditure or budget decisions to support the revenue budget will have an ongoing impact on investments unless resources are supplemented each year from new sources (asset sales etc.).
Table 3 Core Funds and expected investment balances
2016/17 2017/18 2018/19 2019/20 2020/21
Actual Estimate Estimate Estimate Estimate
£'000 £'000 £'000 £'000 £'000
Fund Balances/Reserves 61,877 50,083 41,383 39,573 22,523
Capital Receipts Reserve 22,649 16,393 16,393 17,305 10,380
Provisions 10,315 10,033 9,843 9,843 9,843
Other 19,568 14,676 11,007 8,255 6,191
Total Core Funds 114,409 91,185 78,626 74,976 48,937
Working Capital 73,918- -129,821 -123,770 -106,693 -107,621
Under/(Over) Borrowing 140,958 190,729 172,236 151,347 126,075
Expected Investments 47,369 30,000 30,000 30,000 30,000
Total 114,409 90,907 78,465 74,654 48,454
Year End Resources
The above table assumes that expected investment balance will be kept at approximately £30m and that the working capital and borrowing position will be managed to effect this.
3. BORROWING 32. The capital expenditure programme set out in Paragraph 23 provides
details of the service activity of the Council. The treasury management function ensures that the Council’s cash is organised in accordance with the relevant professional codes, so that sufficient cash is available to meet the activities of the Council. This involves both the organisation of the cash flow and, where the capital programme requires it, the organisation of approporiate borrowing facilities. The strategy covers the relevant treasury indicators, the current and projected debt positions and the annual investment strategy.
3.1 Current and estimated portfolio position
33. The Council’s borrowing position at 31 December 2017 is summarised below.
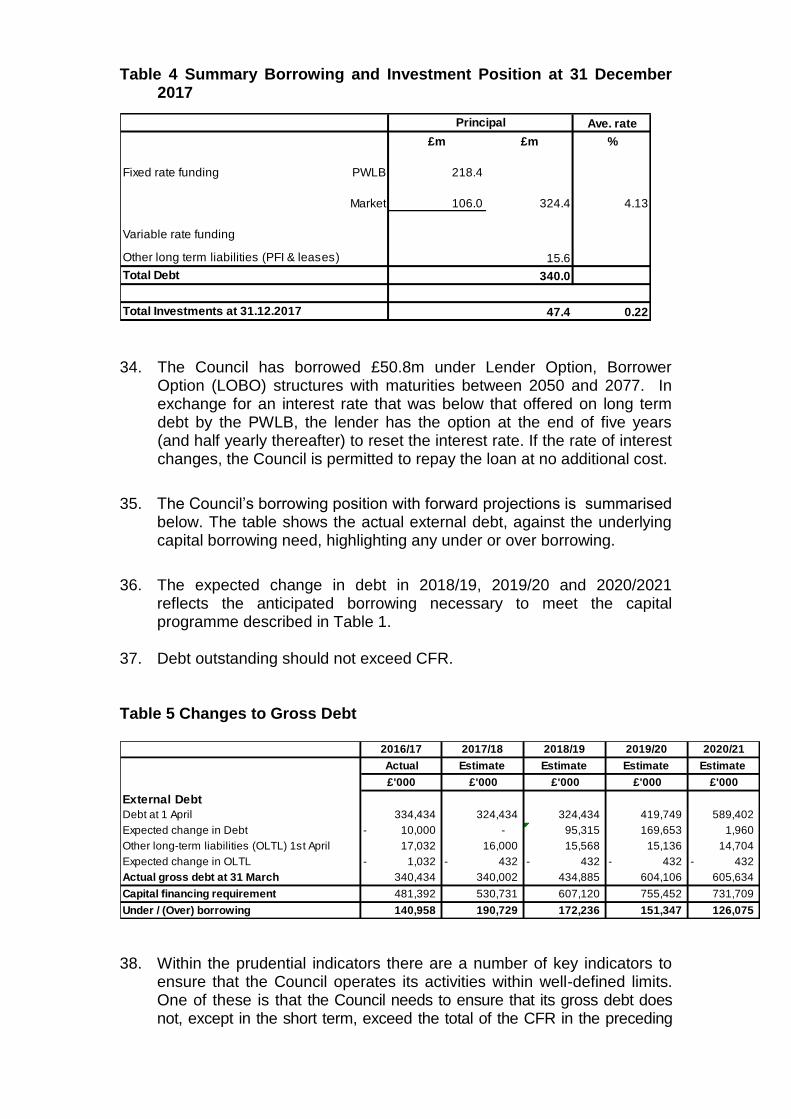
Table 4 Summary Borrowing and Investment Position at 31 December 2017
Ave. rate
£m £m %
Fixed rate funding PWLB 218.4
Market 106.0 324.4 4.13
Variable rate funding
Other long term liabilities (PFI & leases) 15.6
Total Debt 340.0
Total Investments at 31.12.2017 47.4 0.22
Principal
34. The Council has borrowed £50.8m under Lender Option, Borrower
Option (LOBO) structures with maturities between 2050 and 2077. In exchange for an interest rate that was below that offered on long term debt by the PWLB, the lender has the option at the end of five years (and half yearly thereafter) to reset the interest rate. If the rate of interest changes, the Council is permitted to repay the loan at no additional cost.
35. The Council’s borrowing position with forward projections is summarised below. The table shows the actual external debt, against the underlying capital borrowing need, highlighting any under or over borrowing.
36. The expected change in debt in 2018/19, 2019/20 and 2020/2021
reflects the anticipated borrowing necessary to meet the capital programme described in Table 1.
37. Debt outstanding should not exceed CFR. Table 5 Changes to Gross Debt
2016/17 2017/18 2018/19 2019/20 2020/21
Actual Estimate Estimate Estimate Estimate
£'000 £'000 £'000 £'000 £'000
External Debt
Debt at 1 April 334,434 324,434 324,434 419,749 589,402
Expected change in Debt 10,000- - 95,315 169,653 1,960
Other long-term liabilities (OLTL) 1st April 17,032 16,000 15,568 15,136 14,704
Expected change in OLTL 1,032- 432- 432- 432- 432-
Actual gross debt at 31 March 340,434 340,002 434,885 604,106 605,634
Capital financing requirement 481,392 530,731 607,120 755,452 731,709
Under / (Over) borrowing 140,958 190,729 172,236 151,347 126,075
38. Within the prudential indicators there are a number of key indicators to ensure that the Council operates its activities within well-defined limits. One of these is that the Council needs to ensure that its gross debt does not, except in the short term, exceed the total of the CFR in the preceding
year plus the estimates of any additional CFR for 2018/19 and the following two financial years. This allows some flexibility for limited early borrowing for future years, but ensures that borrowing is not undertaken for revenue purposes.
39. The Director of Finance reports that the Council complied with this prudential indicator in the current year and does not envisage difficulties for the future. This view takes into account current commitments, existing programmes and the proposals in the budget report.
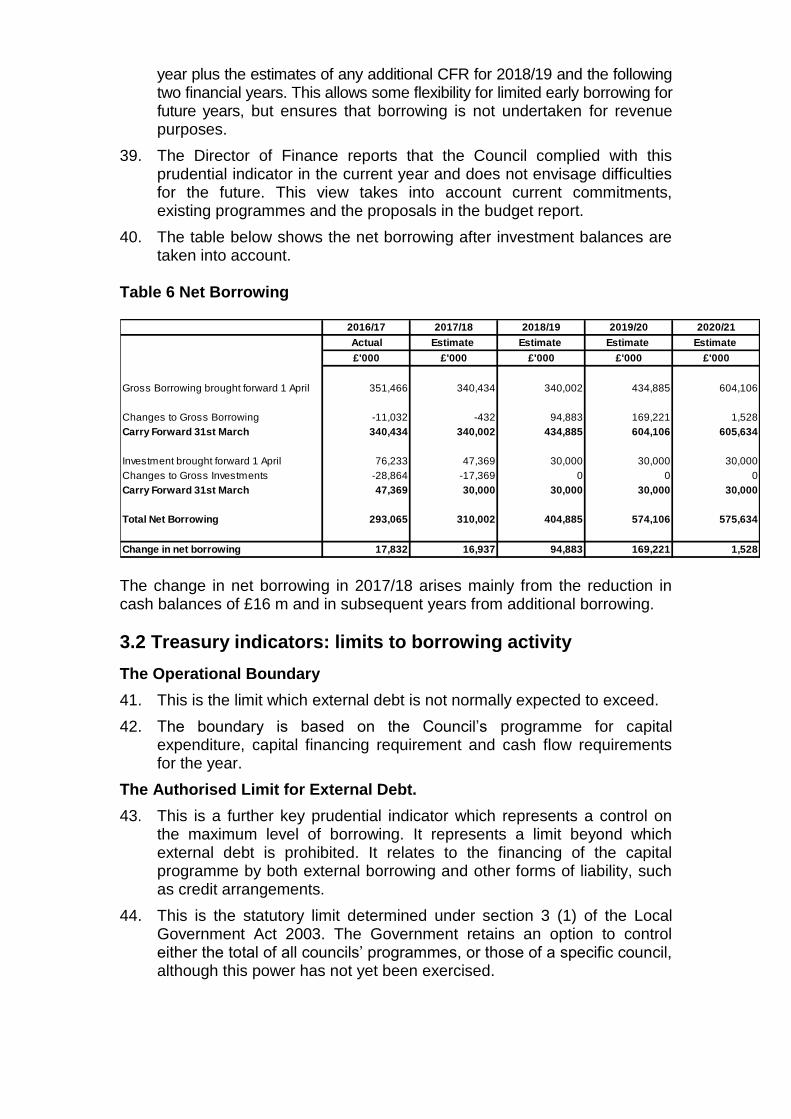
40. The table below shows the net borrowing after investment balances are taken into account.
Table 6 Net Borrowing
2016/17 2017/18 2018/19 2019/20 2020/21
Actual Estimate Estimate Estimate Estimate
£'000 £'000 £'000 £'000 £'000
Gross Borrowing brought forward 1 April 351,466 340,434 340,002 434,885 604,106
Changes to Gross Borrowing -11,032 -432 94,883 169,221 1,528
Carry Forward 31st March 340,434 340,002 434,885 604,106 605,634
Investment brought forward 1 April 76,233 47,369 30,000 30,000 30,000
Changes to Gross Investments -28,864 -17,369 0 0 0
Carry Forward 31st March 47,369 30,000 30,000 30,000 30,000
Total Net Borrowing 293,065 310,002 404,885 574,106 575,634
Change in net borrowing 17,832 16,937 94,883 169,221 1,528 The change in net borrowing in 2017/18 arises mainly from the reduction in cash balances of £16 m and in subsequent years from additional borrowing.
3.2 Treasury indicators: limits to borrowing activity
The Operational Boundary
41. This is the limit which external debt is not normally expected to exceed.
42. The boundary is based on the Council’s programme for capital expenditure, capital financing requirement and cash flow requirements for the year.
The Authorised Limit for External Debt.
43. This is a further key prudential indicator which represents a control on the maximum level of borrowing. It represents a limit beyond which external debt is prohibited. It relates to the financing of the capital programme by both external borrowing and other forms of liability, such as credit arrangements.
44. This is the statutory limit determined under section 3 (1) of the Local Government Act 2003. The Government retains an option to control either the total of all councils’ programmes, or those of a specific council, although this power has not yet been exercised.

Table 7 Operational boundary and authorised limit
2016/17 2017/18 2018/19 2019/20 2020/21
Actual Estimate Estimate Estimate Estimate
£m £m £m £m £m
Authorised Limit for external debt
Borrowing and finance leases 469 531 607 755 732
Operational Boundary for external debt
Borrowing 334 334 435 604 606
Other long term liabilities 16 16 16 15 15
Total 350 350 451 619 621
Upper limit for fixed interest rate exposure
Net principal re fixed rate borrowing 334 334 435 604 606
Upper limit for variable rate exposure
Net principal re variable rate borrowing - - - - -
Upper limit for principal sums invested over 364
days60 60 60 60 60
Due to the Council’s current under borrowing position it is considered sufficient to set the Authorised limit at the same level as the CFR.
As shown in Table 11 in Appendix F below, the Council may wish to make additional investments of over 365 days. The current limit for such investments is £60m.
HRA Debt Limit
45. Separately, the Council is also limited to a maximum HRA debt through the HRA self-financing regime. This limit and the HRA CFR are shown in the table below. An application has been made to DCLG to increase the HRA debt limit.
Table 8 HRA Debt Limit and CFR
2016/17 2017/18 2018/19 2019/20 2020/21
Actual Estimate, Qtr 3 Estimate Estimate Estimate
£m £m £m £m £m
HRA Debt Limit 154.843 154.843 154.843 154.843 154.843
HRA CFR 149.537 151.492 154.668 154.779 156.268
Headroom 5.306 3.351 0.175 0.064 -1.425
3.3 Prospects for interest rates and economic commentary
46. The Treasury Management Adviser has provided a commentary on the prospects for interest rates included as Appendix D and an economic commentary included as Appendix E.
3.4 Borrowing strategy
47. As shown in Table 5 above, currently the Council has a debt portfolio of £324m, mainly long term, with an average maturity of 35 years assuming no early repayment of the LOBO loans. Adjusting LOBO loans maturity in line with the next interest reset date reduces the average maturity to 25 years. Cash balances at 31 December 2017 were £47.4m. With the

investment portfolio yielding only 0.22% and the likely average cost of new debt 2.6%, there is a substantial short term cost of carrying excessive debt.
48. As shown in Table 5 above the Council is currently maintaining an under-borrowed position. This means that the capital borrowing need (CFR), has not been fully funded with loan debt as cash supporting the Council’s reserves, balances and cash flow has been used as a temporary source of funding. This strategy is prudent with investment returns low and counterparty risk is still an issue to be considered.
49. However, with the reduction in cash balances and the likelihood that they
will be further reduced by the end of 2017/18 much of the increased capital programme in the next few years will need to be funded from borrowing. As shown in Table 5 above, it is currently estimated that sums of £95m, £170 and £2m will need to be borrowed in the next three years. The Council will have a range of funding sources available and will need to base its decisions on optimum borrowing times and periods taking into account current interest rates and likely future movements and the “cost of carry” (difference between rates for borrowing and rates for investments) which currently remains high. A strategy is being developed in consultation with the Treasury Management Adviser. It is also possible, but unlikely, that new long term borrowing in the next three years might be required if part of the LOBO portfolio has to be refinanced early.
50. It may be necessary to resort to temporary borrowing from the money
markets or other local authorities to cover mismatches in timing between capital grants and payments. However, with several Government grants now paid early in the financial year this is not very likely.
51. Against this background and the risks within the economic forecast,
caution will be adopted in the 2018/19 treasury management operations. The Director of Finance will monitor interest rates in financial markets and adopt a pragmatic approach to changing circumstances:
if it was felt that there was a significant risk of a sharp fall in long
and short term rates (e.g. due to a marked increase of risks around relapse into recession or of risks of deflation), then long term borrowings will be postponed, and potential rescheduling from fixed rate funding into short term borrowing will be considered.
if it was felt that there was a significant risk of a much sharper rise
in long and short term rates than that currently forecast, perhaps arising from an acceleration in the start date and in the rate of increase in central rates in the USA and UK, an increase in world economic activity or a sudden increase in inflation risks, then the portfolio position will be re-appraised. Most likely, fixed rate funding will be drawn whilst interest rates are lower than they are projected to be in the next few years.
52. The Council has adopted a single pooled approach for debt. Allocations to HRA are based on its CFR, with interest charged to HRA at the average rate on all external borrowing. Longer term, the HRA’s ability to repay borrowing will depend on future revenues and the capital expenditure programme.
3.5 Treasury management limits on activity
53. There are three debt related treasury activity limits. The purpose of these is to restrain the activity of the treasury function within certain limits, thereby managing risk and reducing the impact of any adverse movement in interest rates. However, if these are set to be too restrictive they will impair the opportunities to reduce costs and improve performance.
Upper limit on variable interest rate exposure
54. This identifies a maximum limit for variable interest rates based upon the debt position net of investments. As shown in Table 7 above the Council does not expect to undertake any borrowing on this basis.
Upper limit on fixed interest rate exposure
55. This identifies a maximum limit for fixed interest rates based upon the debt position net of investments. The Council’s proposed limits are shown in Table 7 above
Maturity Structure of Borrowing
56. These gross limits are set to reduce the Council’s exposure to large fixed rate sums falling due for refinancing, and are required for upper and lower limits.
57. The Council has no variable rate borrowing and the comments below relate only to its fixed rate portfolio.
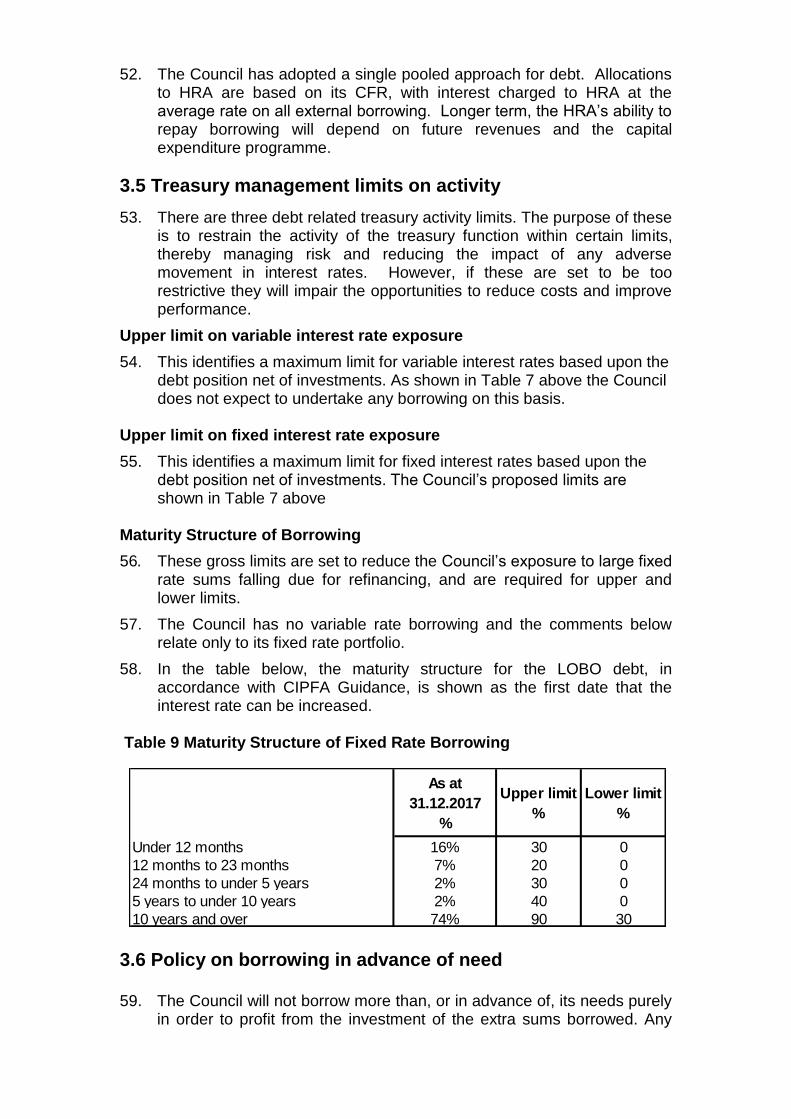
58. In the table below, the maturity structure for the LOBO debt, in accordance with CIPFA Guidance, is shown as the first date that the interest rate can be increased.
Table 9 Maturity Structure of Fixed Rate Borrowing
As at
31.12.2017
%
Upper limit
%
Lower limit
%
Under 12 months 16% 30 0
12 months to 23 months 7% 20 0
24 months to under 5 years 2% 30 0
5 years to under 10 years 2% 40 0
10 years and over 74% 90 30
3.6 Policy on borrowing in advance of need
59. The Council will not borrow more than, or in advance of, its needs purely in order to profit from the investment of the extra sums borrowed. Any
decision to borrow in advance will be within forward approved CFR estimates and future authorised limits, and will be considered carefully to ensure that value for money can be demonstrated and that the Council can ensure the security of such funds.
60. Risks associated with any borrowing in advance activity will be subject to
prior appraisal and subsequent reporting through the mid-year or annual reporting mechanism.
3.7 Debt rescheduling
61. Link Asset Services currently advise that:
As short term borrowing rates will be considerably cheaper than longer term fixed interest rates, there may be potential opportunities to generate savings by switching from long term debt to short term debt. However, these savings will need to be considered in the light of the current treasury position and the size of the cost of debt repayment (premiums incurred). The reasons for any rescheduling to take place will include:
the generation of cash savings and / or discounted cash flow savings;
helping to fulfil the treasury strategy;
enhance the balance of the portfolio (amend the maturity profile and/or the balance of volatility).
62. Opportunities to reduce the cost of debt by premature repayment or to
improve the maturity profile are kept under review in discussion with the Treasury Management Adviser. Early repayment of market loans is by negotiation. For PWLB loans, there are daily published prices for early repayment that allows analysis of the opportunities for restructuring. There is currently a spread which has generally made restructuring uneconomic.
63. Should any of the LOBO loans with interest rate reset dates in 2018-19
(£50.8m) require refinancing, the most likely source would be external borrowing.
64. All rescheduling will be reported to Cabinet at the earliest meeting
following the exercise.
4. Annual Investment Strategy
4.1 Investment policy
65. The Council’s investment policy has regard to the Department for Communities and Local Government Investment Guidance and the CIPFA Treasury Management Code. The Council’s investment priorities will be security first, liquidity second, then return.

66. Advice received from Link Asset Services is: We remain in a very difficult investment environment. Whilst counterparty risk appears to have eased, market sentiment has still been subject to bouts of, sometimes, extreme volatility and economic forecasts abound with uncertainty. However, we also have a very accommodating monetary policy - reflected in a 0.50% Bank Rate. As a consequence, authorities are not getting much of a return from deposits. Against this backdrop it is, nevertheless, easy to forget recent history, ignore market warnings and search for that extra return to ease revenue budget pressures. In this respect, we are seeing an increase in investment “opportunities” being offered to clients or being discussed in the wider press. What then, should you consider when these are offered? We suggest that you “look under the bonnet” when considering pooled investment vehicles, although this applies to any investment opportunity. It is not enough that other councils are investing in a scheme or an investment opportunity: you are tasked through market rules to understand the “product” and appreciate the risks before investing. A quote from the Financial Conduct Authority puts the environment in context.
The main risks in the industry for the coming year are firms designing products that: -
aren’t in the long-term interest of consumers
don’t respond to their needs
encompass a lack of transparency on what’s being sold
lead to a poor understanding by consumers of risk
shift toward more complex structured products that lack oversight. 67. In accordance with the above guidance and in order to minimise the risk
to investments, the Council in Appendix F clearly stipulates the minimum acceptable credit quality of counterparties for inclusion on the lending list. The creditworthiness methodology used to create the counterparty list fully accounts for the ratings, watches and outlooks published by all three ratings agencies. The Treasury Management Adviser monitors counterparty ratings on a real time basis with knowledge of any changes advised electronically as the agencies notify modifications.
68. Further, the Council’s officers recognise that ratings should not be the
sole determinant of the quality of an institution and that it is important to assess continually and monitor the financial sector on both a micro and macro basis and in relation to the economic and political environments in which institutions operate. The assessment will also take account of information that reflects the opinion of the markets. To this end the Council will engage with its Adviser to maintain a monitor on market pricing such as “credit default swaps” and overlay that information on top of the credit ratings.

69. The aim of the strategy is to generate a list of highly creditworthy counterparties which will provide security of investments, enable divesification and minimise risk.
70. Investment instruments identified for current use are listed in Appendix F
under the ‘specified’ and ‘non-specified’ investments categories. Counterparty limits will be as set through the Council’s Treasury Management Practices.
4.2 Creditworthiness policy
71. The primary principle governing the Council’s investment criteria is the security of its investments, although the return on the investment is also a key consideration. After this main principle, the Council will ensure that:
It maintains a policy covering both the categories of investment types it will invest in, criteria for choosing investment counterparties with adequate security, and monitoring their security. This is set out in the specified and non-specified investment sections below; and
It has sufficient liquidity in its investments. For this purpose it will set out procedures for determining the maximum periods for which funds may prudently be committed. These procedures also apply to the Council’s prudential indicators covering the maximum principal sums invested.
72. The Director of Finance will maintain a counterparty list in compliance with the following criteria and will revise the criteria and submit them to Council for approval as necessary. These criteria are separate to those which determine which types of investment instrument are either specified or non-specified as they provide an overall pool of counterparties considered high quality which the Council may use, rather than defining what types of investment instruments are to be used.
73. The minimum rating criteria uses the lowest common denominator method of selecting counterparties and applying limits. This means that the application of the Council’s minimum criteria will apply to the lowest available rating for any institution. For instance, if an institution is rated by two agencies, one meets the Council’s criteria, the other does not, the institution will fall outside the lending criteria.
74. Credit rating information is supplied by the Treasury Management
Adviser on all active counterparties that comply with the criteria below. Any counterparty failing to meet the criteria would be omitted from the counterparty list. Any rating changes, rating watches (notification of a likely change), rating outlooks (notification of a possible longer term change) are provided to officers almost immediately after they occur and this information is considered before dealing. For instance, a negative rating watch applying to a counterparty at the minimum Council criteria will be suspended from use, with all others being reviewed in light of market conditions.

75. The Council’s criteria for an institution to become a counterparty are detailed in Appendix F.
4.3 Country Limits
76. The Council has determined that it will only use approved counterparties from the UK or from countries with a minimum sovereign credit rating of AAA. Currently the only countries meeting this criterion are Australia, Canada, Denmark, Germany, Luxembourg, Netherlands, Norway, Singapore, Sweden and Switzerland. The current UK rating is the third level of AA. This list will be added to, or deducted from, by officers should ratings change in accordance with this policy.
4.4 Annual Investment Strategy
77. In-house funds. The Council’s funds are mainly cash derived primarily from the General Fund and HRA. Balances are also held to support capital expenditure. From 1st April 2011, pension fund cash balances have been held separately from those of the Council. However, a separate investment strategy has not been developed for the pension fund and all its cash is held on overnight call account with RBS. Investments are made with reference to the core balance and cash flow requirements and the outlook for short-term interest rates (i.e. rates for investments up to 12 months).
78. Investment returns expectations. Bank Rate is forecast by Link Asset
Services to stay flat at 0.50% until quarter 4 2018 and not to rise above 1.25% by quarter 1 2021. Bank rate forecasts for financial year ends are:
2017/18 0.50%
2018/19 0.75%
2019/20 1.00%
2020/21 1.25%
79. Link Asset Services suggest that budgeted investment earnings rates for returns on investments placed for periods of up to 100 days during each financial year are as follows:
2017/18 0.40% 2018/19 0.60% 2019/20 0.90% 2020/21 1.25% 2021/22 1.50% 2022/23 1.75% 2023/24 2.00% Later years 2.75%
80. Link Asset Services further advise that “the overall balance of risks to these
forecasts is currently skewed to the upside and are dependent on how strong GDP growth turns out, how quickly inflation pressures rise and how quickly the Brexit negotiations move forward positively.

81. Investment treasury indicator and limit - total principal funds invested for greater than 365 days. These limits are set with regard to the Council’s liquidity requirements and to reduce the need for early sale of an investment. The Council’s limit for investments of over 365 days is currently £60m.
82. Throughout 2017-18 interest rates receivable for short term investments
have fallen substantially with the Council receiving 0.10% compared to 0.20% at the beginning of the year for deposits of under one month. The Council’s bankers also reduced the call account rate from 0.25% to 0.01%. The increase in base rate in November 2017 has resulted in a slight increase in investment rates in the last quarter.
83. As a consequence of these rates and the maturity of several higher
yielding investments the Council’s return for the whole year is likely to be close to 0.22%. Whilst this is still above the short term LIBOR benchmark and comparable to peer authorities it represents a substantial reduction from rates earned in previous years.
84. As a result of the Council’s strategy and the interest rates available the
only counterparties actively in use during 2017-18 have been Lloyds, Royal Bank of Scotland Group and Svenska Handelsbanken. The investment portfolio has inevitably remained concentrated with RBS and Lloyds with 82.5% of the total portfolio invested with them on 31st December 2017. When opportunities arise consistent with the Council’s policies diversification will be sought but it is not anticipated that there will be any significant change during 2018-19.
85. Authority has been given to place funds in ‘non-standard investments’ up
to a value of £10m. Officers are considering what investment opportunities and counterparties should be included to utilise this facility.
4.5 Investment risk benchmarking
86. This Council uses the current LIBOR rates as a benchmark to assess the investment performance of its investment portfolio. In addition the Council is a member of a Link Asset Services investment portfolio benchmarking group through which performance is measured against peer London authorities. The risk of default attached to the Council’s portfolio is reported by Capita on a monthly basis.
4.6 End of year investment report
87. At the end of the financial year the Council will report on its investment activity as part of the Treasury Management Outturn Report.

5. Affordability Prudential Indicators 88. The previous sections cover the overall capital and control of borrowing
Prudential Indicators but within this framework Prudential Indicators are also required to assess the affordability of the capital investment programme. These provide an indication of the impact of the programme on the Council’s overall finances and are shown in detail in Appendix G.
6. Implications of the recommendations 89 The recommendations primarily relate to the requirements for the
Council to comply with statutory duties. However, the content of the report, covering borrowing and investment strategy, has implications for the Council’s ability to fund its capital projects and revenue activities.
90. The recommendations do not directly affect the Council’s
staffing/workforce. 7. Performance issues
91. The Council meets the requirements of the CIPFA Treasury Management Code and, therefore, is able to demonstrate best practice for the Treasury Management function.
92. As part of the Code the Council must agree a series of prudential
indicators and measure its performance against them. Success is measured by compliance with the indicators and the accuracy of future estimates so far as they are within the control of the Treasury Management function.
8. Environmental implications 93. There are no direct environmental implications.
9. Risk management implications 94. The identification, monitoring and control of risk are central to the
achievement of treasury management objectives and to this report. Potential risks are identified, mitigated and monitored in accordance with Treasury Management Practice Notes approved by the Treasury Management Group.
95. Risks are included in the Directorate Risk Register.

10. Legal Implications 96. The purpose of this report is to comply with the Local Authorities (Capital
Finance and Accounting) (England) Regulations 2003 and other relevant guidance referred to in the report.
11. Financial implications 97. Financial matters are integral to the report.
12. Equalities implications / Public sector equality duty 98. Officers have considered possible equalities impact and consider that
there is no adverse equalities impact as there is no direct impact on individuals
13. Council priorities 99. This report deals with the Treasury Management Strategy which plays a
significant part in supporting the delivery of all the Council’s corporate priorities.

Section 3 - Statutory Officer Clearance
Name: Dawn Calvert x Chief Financial Officer
Date: 30 January 2018
on behalf of the
Name: Linda Cohen x Monitoring Officer
Date: 15 January 2018
Ward Councillors notified: No
EqIA carried out: No
EqIA cleared by: N/A
Section 4 - Contact Details and
Background Papers
Contact: Iain Millar (Treasury and Pensions Manager) Tel: 020-
8424-1432/ Email: [email protected]
Background Papers: N/A
Call-In Waived by the
Chair of Overview and
Scrutiny Committee
NOT APPLICABLE [Call-in does not apply as the decision is reserved to Council]
APPENDIX A LEGISLATION AND REGULATIONS IMPACTING ON TREASURY MANAGEMENT
The following items numbered 1 - 4 show the sequence of legislation and regulation impacting on the treasury management function. The sequence begins with primary legislation, moves through Government guidance and Chartered Institute of Public Finance and Accountancy (CIPFA) codes of practice and finishes with implementation through the Council’s own Treasury Management Practices.
1. Local Government Act 2003 Link below
Local Government Act 2003 Below is a summary of the provisions in the Act dealing with treasury management. In addition the Secretary of State is empowered to define the provisions through further regulations and guidance which he has subsequently done through statutory instruments, Department of Communities and Local Government Guidance and CIPFA codes of practice. Power to borrow The Council has the power to borrow for purposes relevant to its functions and for normal treasury management purposes – for example, to refinance existing debt. Control of borrowing The main borrowing control is the duty not to breach the prudential and national limits as described below. The Council is free to seek loans from any source but is prohibited from borrowing in foreign currencies without the consent of Treasury, since adverse exchange rate movements could leave it owing more than it had borrowed. All of the Council’s revenues serve as security for its borrowing. The mortgaging of property is prohibited. It is unlawful for the Council to ‘securitise’, that is, to sell future revenue streams such as housing rents for immediate lump-sums. Affordable borrowing limit The legislation imposes a broad duty for the Council to determine and keep under review the amount it can afford to borrow. The Secretary of State has subsequently defined this duty in more detail through the Prudential Code produced by CIPFA, which lays down the practical rules for deciding whether borrowing is affordable. It is for the Council (at a meeting of the full Council) to set its own ‘prudential’ limit in accordance with these rules, subject only to the scrutiny of its external auditor. The Council is then free to borrow up to that limit without Government
consent. The Council is free to vary the limit during the year, if there is good reason. Requirements in other legislation for the Council to balance its revenue budget prevents the long-term financing of revenue expenditure by borrowing. However the legislation does confer limited capacity to borrow short-term for revenue needs in the interests of cash-flow management and foreseeable requirements for temporary revenue borrowing are allowed for when borrowing limits are set by the Council. The Council is allowed extra flexibility in the event of unforeseen needs, by being allowed to increase borrowing limits by the amounts of any payments which are due in the year but have not yet been received. Imposition of borrowing limits The Government has retained reserve power to impose ‘longstop’ limits for national economic reasons on all local authorities’ borrowing and these would override authorities’ self-determined prudential limits. Since this power has not yet been used the potential impact on the Council is not known. Credit arrangements Credit arrangements (e.g. property leasing, PFI and hire purchase) are treated like borrowing and the affordability assessment must take account not only of borrowing but also of credit arrangements. In addition, any national limit imposed under the reserve powers would apply to both borrowing and credit. Power to invest The Council has the power to invest, not only for any purpose relevant to its functions but also for the purpose of the prudential management of its financial affairs.
2. Department for Communities and Local Government Investment Guidance (March 2010) The Local Government Act 2003 requires a local authority “…..to have regard (a) to such guidance as the Secretary of State may issue…………..” and the current guidance became operative on 1 April 2010.
The Guidance recommends that for each financial year the Council should
prepare at least one investment Strategy to be approved before the start of
the year. The Strategy must cover:
Investment security
Investments should be managed prudently with security and
liquidity being considered ahead of yield
Potential counterparties should be recognised as “specified” and
“non-specified” with investment limits being defined to reflect the
status of each counterparty

Investment risk
Procedures should be established for monitoring, assessing and
mitigating the risk of loss of invested sums and for ensuring that
such sums are readily accessible for expenditure whenever
needed.
The use of credit ratings and other risk assessment processes
should be explained
The use of external advisers should be monitored
The training requirements for treasury management staff should
be reviewed and addressed
Specific policies should be stated as regards borrowing money in
advance of need
Investment Liquidity
The Strategy should set out procedures for determining the
maximum periods for which funds may prudently be committed
The Strategy should be approved by the full Council and made available to
the public free of charge. Subject to full Council approval, or approved
delegations, the Strategy can be revised during the year.
3. Treasury Management in the Public Services: Code of Practice and Cross-Sectoral Guidance Notes (CIPFA 2017) The primary requirements of the Code are:
Creation and maintenance of a Treasury Management Policy Statement which sets out the policies and objectives of the Council’s treasury management activities.
Creation and maintenance of Treasury Management Practices (“TMPs”) that set out the manner in which the Council will seek to achieve those policies and objectives.
Receipt by the full Council or Cabinet of an annual Treasury Management Strategy Statement - including the Annual Investment Strategy and Minimum Revenue Provision Policy - for the year ahead, a Half-year Review Report and an Annual Report (stewardship report) covering activities during the previous year.
Delegation by the Council of responsibilities for implementing and monitoring treasury management policies and practices and for the execution and administration of treasury management decisions.
Delegation by the Council of the role of scrutiny of treasury management strategy and policies to a specific named body.

4. The Prudential Code for Capital Finance in Local Authorities (CIPFA 2011) – Guidance 2017 Compliance with the objectives of the Code by the Council should ensure that:
Capital expenditure plans are affordable in terms of their implications on Council Tax and housing rents
External borrowing and other long term liabilities are within prudent and sustainable levels
Treasury management decisions are taken in accordance with good professional practice
As part of the two codes of practice above the Council is required to:
agree a series of prudential indicators against which performance is measured
produce Treasury Management Practice Notes for officers which set out how treasury management policies and objectives are to be achieved and activities controlled.

APPENDIX B
TREASURY MANAGEMENT DELEGATIONS AND RESPONSIBILITIES
The respective roles of the Council, Cabinet, GARMSC, the Section 151 officer, the Treasury Management Group the Treasury and Pensions Manager and the Treasury Team are summarised below. Further details are set out in the Treasury Management Practices. Council Under the Constitution, the Council is responsible for “decisions relating to the control of the Council’s borrowing requirement.” It agrees the annual Treasury Management Strategy Statement including Prudential Indicators, Minimum Revenue Provision Policy Statement and Annual Investment Strategy. Cabinet Under the Constitution, the Cabinet “will exercise all of the local authority functions which are not the responsibility of any other part of the local authority, whether by law or under this Constitution.” It considers and recommends to Council the annual Treasury Management Strategy Statement and receives a mid-year report and annual outturn report on Treasury Management activities. Governance, Audit, Risk Management and Standards Committee GARMSC reviews the Treasury Management Strategy and monitors progress on treasury management in accordance with CIPFA codes of practice. Director of Finance (Section 151 Officer) Under S151 of the Local Government Act 1972 the Council “shall make arrangements for the proper administration of their financial affairs and shall secure that one of their officers has responsibility for the administration of those affairs.” At Harrow, this responsibility is exercised by the Director of Finance. The Director is responsibility for implementing the policies agreed by the Council and Cabinet. Under the Local Government Finance Act 1988 and the Local Government Act 2003 the Director also has responsibilities in respect of budget arrangements and the adequacy of resources. In terms of Treasury Management this means that the financing costs of the Capital Programme are built into the Revenue Budget as are any assumptions on investment income.

The Director chairs the Treasury Management Group and agrees major treasury management decisions, specifically including any borrowing decisions, delegated to officers. Treasury Management Group Comprises Director of Finance, Head of Strategic and Technical Finance (Deputy S151 Officer), Treasury and Pensions Manager, Senior Finance Officer and is responsible for:
Monitoring treasury management activity against approved strategy, policy, practices and market conditions;
Ensuring that capital expenditure plans are continually reviewed in line with budget assumptions throughout the year to forecast when borrowing will be required.
Approving changes to treasury management practices and procedures;
Reviewing the performance of the treasury management function using benchmarking data on borrowing and investment provided by the Treasury Management Adviser (Link Asset Services Asset Services);
Monitoring the performance of the appointed Treasury Management Adviser and recommending any necessary actions
Ensuring the adequacy of treasury management resources and skills and the effective division of responsibilities within the treasury management function;
Monitoring the adequacy of internal audit reviews and the implementation of audit recommendations
Treasury and Pensions Manager Responsible for the execution and administration of treasury management decisions, acting in accordance with the Council’s Treasury Management Strategy Statement and CIPFA’s “Standard of Professional Practice on Treasury Management” Treasury Team Headed by Senior Finance Officer with responsibility for day-to-day treasury and investment and borrowing activity in accordance with approved Strategy, policy, practices and procedures and for recommending changes to the Treasury Management Group

APPENDIX C
Minimum Revenue Provision (MRP) Policy Statement
For capital expenditure incurred before 1 April 2008 or which in the future will be Supported Capital Expenditure, the MRP policy will be the equal annual reduction of 2% of the outstanding debt at 1 April 2015 for the subsequent 50 years.
For all capital expenditure financed from unsupported (prudential) borrowing (including PFI and finance leases), MRP will be based upon an asset life method in accordance with Option 3 of the guidance.
In some cases where a scheme is financed by prudential borrowing it may be appropriate to vary the profile of the MRP charge to reflect the future income streams associated with the asset, whilst retaining the principle that the full amount of borrowing will be charged as MRP over the asset’s estimated useful life.
A voluntary MRP may be made from either revenue or voluntarily set aside capital receipts.
Estimated life periods and amortisation methodologies will be determined under delegated powers. To the extent that expenditure is not on the creation of an asset and is of a type that is subject to estimated life periods that are referred to in the guidance, these periods will generally be adopted by the Council. However, the Council reserves the right to determine useful life periods and prudent MRP in exceptional circumstances where the recommendations of the guidance would not be appropriate.
Freehold land cannot properly have a life attributed to it, so for the purposes of Asset Life method it will be treated as equal to a maximum of 50 years. But if there is a structure on the land which the authority considers to have a life longer than 50 years, that same life estimate will be used for the land.
As some types of capital expenditure incurred by the Council are not capable of being related to an individual asset, asset lives will be assessed on a basis which most reasonably reflects the anticipated period of benefit that arises from the expenditure. Also, whatever type of expenditure is involved, it will be grouped together in a manner which reflects the nature of the main component of expenditure and will only be divided up in cases where there are two or more major components with substantially different useful economic lives.
Repayments included in annual PFI or finance leases are applied as MRP.
Where borrowing is undertaken for the construction of new assets, MRP will only become chargeable once such assets are completed and operational.

Under Treasury Management best practice the Council may decide to defer borrowing up to the capital financing requirement (CFR) and use internal resources instead. Where internal borrowing has been used, the amount chargeable as MRP may be adjusted to reflect the deferral of actual borrowing.
APPENDIX D
Provided by Link Asset Services Asset Services at November 2017
Interest Rate Forecasts 2017 - 2021
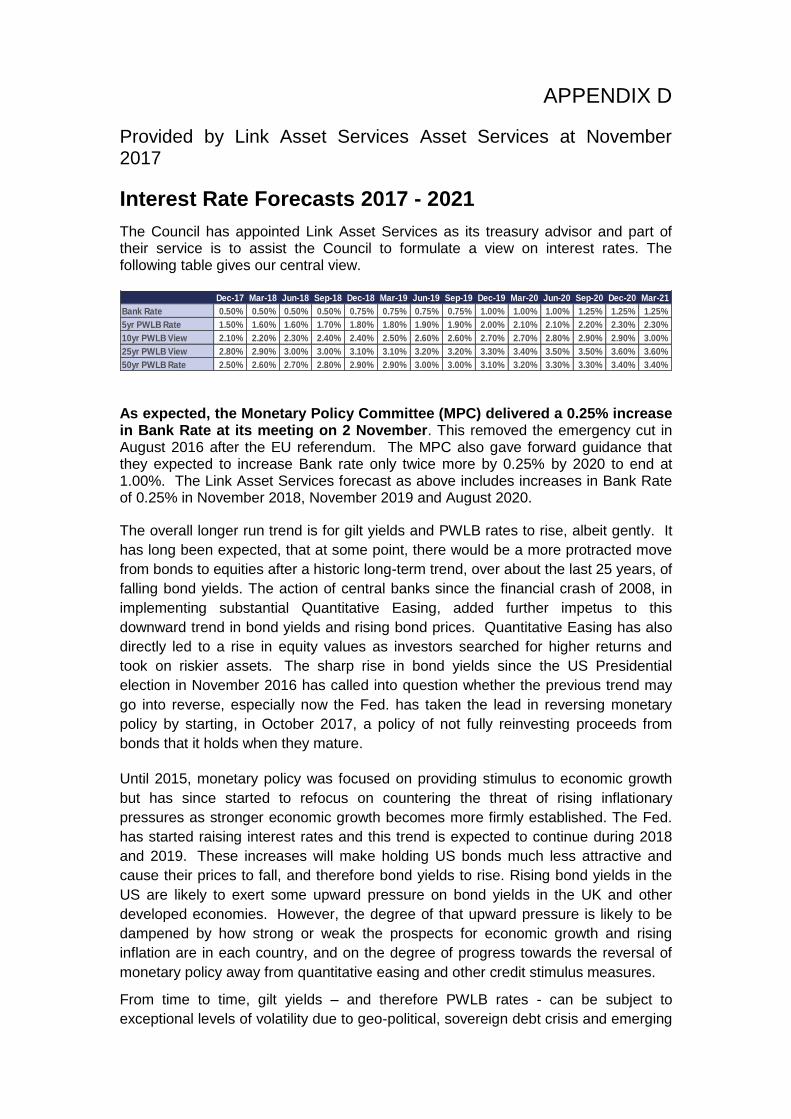
The Council has appointed Link Asset Services as its treasury advisor and part of their service is to assist the Council to formulate a view on interest rates. The following table gives our central view.
Dec-17 Mar-18 Jun-18 Sep-18 Dec-18 Mar-19 Jun-19 Sep-19 Dec-19 Mar-20 Jun-20 Sep-20 Dec-20 Mar-21
Bank Rate 0.50% 0.50% 0.50% 0.50% 0.75% 0.75% 0.75% 0.75% 1.00% 1.00% 1.00% 1.25% 1.25% 1.25%
5yr PWLB Rate 1.50% 1.60% 1.60% 1.70% 1.80% 1.80% 1.90% 1.90% 2.00% 2.10% 2.10% 2.20% 2.30% 2.30%
10yr PWLB View 2.10% 2.20% 2.30% 2.40% 2.40% 2.50% 2.60% 2.60% 2.70% 2.70% 2.80% 2.90% 2.90% 3.00%
25yr PWLB View 2.80% 2.90% 3.00% 3.00% 3.10% 3.10% 3.20% 3.20% 3.30% 3.40% 3.50% 3.50% 3.60% 3.60%
50yr PWLB Rate 2.50% 2.60% 2.70% 2.80% 2.90% 2.90% 3.00% 3.00% 3.10% 3.20% 3.30% 3.30% 3.40% 3.40% As expected, the Monetary Policy Committee (MPC) delivered a 0.25% increase in Bank Rate at its meeting on 2 November. This removed the emergency cut in August 2016 after the EU referendum. The MPC also gave forward guidance that they expected to increase Bank rate only twice more by 0.25% by 2020 to end at 1.00%. The Link Asset Services forecast as above includes increases in Bank Rate of 0.25% in November 2018, November 2019 and August 2020.
The overall longer run trend is for gilt yields and PWLB rates to rise, albeit gently. It
has long been expected, that at some point, there would be a more protracted move
from bonds to equities after a historic long-term trend, over about the last 25 years, of
falling bond yields. The action of central banks since the financial crash of 2008, in
implementing substantial Quantitative Easing, added further impetus to this
downward trend in bond yields and rising bond prices. Quantitative Easing has also
directly led to a rise in equity values as investors searched for higher returns and
took on riskier assets. The sharp rise in bond yields since the US Presidential
election in November 2016 has called into question whether the previous trend may
go into reverse, especially now the Fed. has taken the lead in reversing monetary
policy by starting, in October 2017, a policy of not fully reinvesting proceeds from
bonds that it holds when they mature.
Until 2015, monetary policy was focused on providing stimulus to economic growth
but has since started to refocus on countering the threat of rising inflationary
pressures as stronger economic growth becomes more firmly established. The Fed.
has started raising interest rates and this trend is expected to continue during 2018
and 2019. These increases will make holding US bonds much less attractive and
cause their prices to fall, and therefore bond yields to rise. Rising bond yields in the
US are likely to exert some upward pressure on bond yields in the UK and other
developed economies. However, the degree of that upward pressure is likely to be
dampened by how strong or weak the prospects for economic growth and rising
inflation are in each country, and on the degree of progress towards the reversal of
monetary policy away from quantitative easing and other credit stimulus measures.
From time to time, gilt yields – and therefore PWLB rates - can be subject to
exceptional levels of volatility due to geo-political, sovereign debt crisis and emerging

market developments. Such volatility could occur at any time during the forecast
period.
Economic and interest rate forecasting remains difficult with so many external
influences weighing on the UK. The above forecasts (and MPC decisions) will be
liable to further amendment depending on how economic data and developments in
financial markets transpire over the next year. Geopolitical developments, especially
in the EU, could also have a major impact. Forecasts for average investment
earnings beyond the three-year time horizon will be heavily dependent on economic
and political developments.
The overall balance of risks to economic recovery in the UK is probably to the downside, particularly with the current level of uncertainty over the final terms of Brexit.
Downside risks to current forecasts for UK gilt yields and PWLB rates currently include:
The Bank of England takes action too quickly over the next three years
to raise Bank Rate and causes UK economic growth, and increases in
inflation, to be weaker than we currently anticipate.
Geopolitical risks, especially North Korea, but also in Europe and the
Middle East, which could lead to increasing safe haven flows.
A resurgence of the Eurozone sovereign debt crisis, possibly Italy, due
to its high level of government debt, low rate of economic growth and
vulnerable banking system.
Weak capitalisation of some European banks.
Germany is still without an effective government after the inconclusive
result of the general election in October. In addition, Italy is to hold a
general election on 4 March and the anti EU populist Five Star party is
currently in the lead in the polls, although it is unlikely to get a working
majority on its own. Both situations could pose major challenges to the
overall leadership and direction of the EU as a whole and of the
individual respective countries. Hungary will hold a general election in
April 2018.
The result of the October 2017 Austrian general election has now
resulted in a strongly anti-immigrant coalition government. In addition,
the Czech ANO party became the largest party in the October 2017
general election on a platform of being strongly against EU migrant
quotas and refugee policies. Both developments could provide major
impetus to other, particularly former Communist bloc countries, to
coalesce to create a major block to progress on EU integration and
centralisation of EU policy. This, in turn, could spill over into impacting
the Euro, EU financial policy and financial markets.
Rising protectionism under President Trump
A sharp Chinese downturn and its impact on emerging market countries

The potential for upside risks to current forecasts for UK gilt yields and PWLB rates, especially for longer term PWLB rates include: -
The Bank of England is too slow in its pace and strength of increases in
Bank Rate and, therefore, allows inflation pressures to build up too
strongly within the UK economy, which then necessitates a later rapid
series of increases in Bank Rate faster than we currently expect.
UK inflation returning to sustained significantly higher levels causing an
increase in the inflation premium inherent to gilt yields.
The Fed causing a sudden shock in financial markets through
misjudging the pace and strength of increases in its Fed. Funds Rate
and in the pace and strength of reversal of Quantitative Easing, which
then leads to a fundamental reassessment by investors of the relative
risks of holding bonds, as opposed to equities. This could lead to a
major flight from bonds to equities and a sharp increase in bond yields
in the US, which could then spill over into impacting bond yields around
the world.
Investment and borrowing rates
Investment returns are likely to remain low during 2018/19 but to be on a gently rising trend over the next few years.
Borrowing interest rates increased sharply after the result of the general election in June and then also after the September MPC meeting when financial markets reacted by accelerating their expectations for the timing of Bank Rate increases. Since then, borrowing rates have eased back again somewhat. Apart from that, there has been little general trend in rates during the current financial year. The policy of avoiding new borrowing by running down spare cash balances has served well over the last few years. However, this needs to be carefully reviewed to avoid incurring higher borrowing costs in the future when authorities may not be able to avoid new borrowing to finance capital expenditure and/or the refinancing of maturing debt;
There will remain a cost of carry to any new long-term borrowing that causes a temporary increase in cash balances as this position will, most likely, incur a revenue cost – the difference between borrowing costs and investment returns.

APPENDIX E
Provided by Link Asset Services Asset Services at 20 November 2017
ECONOMIC BACKGROUND
GLOBAL OUTLOOK. World growth looks to be on an encouraging trend of stronger performance, rising earnings and falling levels of unemployment. In October, the IMF upgraded its forecast for world growth from 3.2% to 3.6% for 2017 and 3.7% for 2018. In addition, inflation prospects are generally muted and it is particularly notable that wage inflation has been subdued despite unemployment falling to historically very low levels in the UK and US. This has led to many comments by economists that there appears to have been a fundamental shift downwards in the Phillips curve (this plots the correlation between levels of unemployment and inflation e.g. if the former is low the latter tends to be high). In turn, this raises the question of what has caused this? The likely answers probably lay in a combination of a shift towards flexible working, self-employment, falling union membership and a consequent reduction in union power and influence in the economy, and increasing globalisation and specialisation of individual countries, which has meant that labour in one country is in competition with labour in other countries which may be offering lower wage rates, increased productivity or a combination of the two. In addition, technology is probably also exerting downward pressure on wage rates and this is likely to grow with an accelerating movement towards automation, robots and artificial intelligence, leading to many repetitive tasks being taken over by machines or computers. Indeed, this is now being labelled as being the start of the fourth industrial revolution. KEY RISKS - central bank monetary policy measures Looking back on nearly ten years since the financial crash of 2008 when liquidity suddenly dried up in financial markets, it can be assessed that central banks’ monetary policy measures to counter the sharp world recession were successful. The key monetary policy measures they used were a combination of lowering central interest rates and flooding financial markets with liquidity, particularly through unconventional means such as Quantitative Easing (QE), where central banks bought large amounts of central government debt and smaller sums of other debt. The key issue now is that that period of stimulating economic recovery and warding off the threat of deflation is coming towards its close and a new period has already started in the US, and more recently in the UK, on reversing those measures i.e. by raising central rates and (for the US) reducing central banks’ holdings of government and other debt. These measures are now required in order to stop the trend of an on-going reduction in spare capacity in the economy, and of unemployment falling to such low levels that the re-emergence of inflation is viewed as a major risk. It is, therefore, crucial that central banks get their timing right and do not cause shocks to market expectations that could destabilise financial markets. In particular, a key risk is that because QE-driven purchases of bonds drove up the price of government debt, and therefore caused a sharp drop in income yields, this then also encouraged investors into a search for yield and into investing in riskier assets such as equities. This resulted in bond markets and equity market prices both rising to historically high valuation levels simultaneously. This, therefore, makes both asset categories vulnerable to a sharp correction. It is important, therefore, that central banks only gradually unwind their holdings of bonds in order to prevent destabilising the financial markets. It is also likely that the timeframe for central banks unwinding their holdings
of QE debt purchases will be over several years. They need to balance their timing to neither squash economic recovery by taking too rapid and too strong action, or, alternatively, let inflation run away by taking action that was too slow and/or too weak. The potential for central banks to get this timing and strength of action wrong are now key risks. There is also a potential key question over whether economic growth has become too dependent on strong central bank stimulus and whether it will maintain its momentum against a backdrop of rising interest rates and the reversal of QE. In the UK, a key vulnerability is the low level of productivity growth, which may be the main driver for increases in wages; and decreasing consumer disposable income, which is important in the context of consumer expenditure primarily underpinning UK GDP growth. A further question that has come to the fore is whether an inflation target for central banks of 2%, is now realistic given the shift down in inflation pressures from internally generated inflation, (i.e. wage inflation feeding through into the national economy), given the above mentioned shift down in the Phillips curve.
Some economists favour a shift to a lower inflation target of 1% to emphasise the need to keep the lid on inflation. Alternatively, it is possible that a central bank could simply ‘look through’ tepid wage inflation, (i.e. ignore the overall 2% inflation target), in order to take action in raising rates sooner than might otherwise be expected.
However, other economists would argue for a shift UP in the inflation target to 3% in order to ensure that central banks place the emphasis on maintaining economic growth through adopting a slower pace of withdrawal of stimulus.
In addition, there is a strong argument that central banks should target financial market stability. As mentioned previously, bond markets and equity markets could be vulnerable to a sharp correction. There has been much commentary, that since 2008, QE has caused massive distortions, imbalances and bubbles in asset prices, both financial and non-financial. Consequently, there are widespread concerns at the potential for such bubbles to be burst by exuberant central bank action. On the other hand, too slow or weak action would allow these imbalances and distortions to continue or to even inflate them further.
Consumer debt levels are also at historically high levels due to the prolonged period of low cost of borrowing since the financial crash. In turn, this cheap borrowing has meant that other non-financial asset prices, particularly house prices, have been driven up to very high levels, especially compared to income levels. Any sharp downturn in the availability of credit, or increase in the cost of credit, could potentially destabilise the housing market and generate a sharp downturn in house prices. This could then have a destabilising effect on consumer confidence, consumer expenditure and GDP growth. However, no central bank would accept that it ought to have responsibility for specifically targeting house prices.
UK. After the UK surprised on the upside with strong economic growth in 2016, growth in 2017 has been disappointingly weak; quarter 1 came in at only +0.3% (+1.8% y/y), quarter 2 was +0.3% (+1.5% y/y) and quarter 3 was +0.4% (+1.5% y/y). The main reason for this has been the sharp increase in inflation, caused by the devaluation of sterling after the EU referendum, feeding increases in the cost of imports into the economy. This has caused, in turn, a reduction in consumer disposable income and spending power and so the services sector of the economy, accounting for around 80% of GDP, has seen weak growth as consumers cut back on their expenditure. However, more recently there have been encouraging statistics from the manufacturing sector which is seeing strong growth, particularly as a

result of increased demand for exports. It has helped that growth in the EU, our main trading partner, has improved significantly over the last year while robust world growth has also been supportive. However, this sector only accounts for around 10% of GDP so expansion in this sector will have a much more muted effect on the overall GDP growth figure for the UK economy as a whole. While the Bank of England is expected to give forward guidance to prepare financial markets for gradual changes in policy, the Monetary Policy Committee, (MPC), meeting of 14 September 2017 managed to shock financial markets and forecasters by suddenly switching to a much more aggressive tone in terms of its words around warning that Bank Rate will need to rise soon. The Bank of England Inflation Reports during 2017 have clearly flagged up that it expected CPI inflation to peak at just under 3% in 2017, before falling back to near to its target rate of 2% in two years’ time. The Bank revised its forecast for the peak to just over 3% at the 14 September meeting. (Inflation actually came in at 3.1% in November so that may prove now to be the peak.) This marginal revision in the Bank’s forecast can hardly justify why the MPC became so aggressive with its wording; rather, the focus was on an emerging view that with unemployment having already fallen to only 4.3%, the lowest level since 1975, and improvements in productivity being so weak, that the amount of spare capacity in the economy was significantly diminishing towards a point at which they now needed to take action. In addition, the MPC took a more tolerant view of low wage inflation as this now looks like a common factor in nearly all western economies as a result of automation and globalisation. However, the Bank was also concerned that the withdrawal of the UK from the EU would effectively lead to a decrease in such globalisation pressures in the UK, and so this would cause additional inflationary pressure over the next few years. At Its 2 November meeting, the MPC duly delivered a 0.25% increase in Bank Rate. It also gave forward guidance that they expected to increase Bank Rate only twice more in the next three years to reach 1.0% by 2020. This is, therefore, not quite the ‘one and done’ scenario but is, nevertheless, a very relaxed rate of increase prediction in Bank Rate in line with previous statements that Bank Rate would only go up very gradually and to a limited extent. However, some forecasters are flagging up that they expect growth to accelerate significantly towards the end of 2017 and then into 2018. This view is based primarily on the coming fall in inflation, (as the effect of the effective devaluation of sterling after the EU referendum drops out of the CPI statistics), which will bring to an end the negative impact on consumer spending power. In addition, a strong export performance will compensate for weak services sector growth. If this scenario was indeed to materialise, then the MPC would be likely to accelerate its pace of increases in Bank Rate during 2018 and onwards. It is also worth noting the contradiction within the Bank of England between action in 2016 and in 2017 by two of its committees. After the shock result of the EU referendum, the Monetary Policy Committee (MPC) voted in August 2016 for emergency action to cut Bank Rate from 0.50% to 0.25%, restarting £70bn of QE purchases, and also providing UK banks with £100bn of cheap financing. The aim of this was to lower borrowing costs, stimulate demand for borrowing and thereby increase expenditure and demand in the economy. The MPC felt this was necessary in order to ward off their expectation that there would be a sharp slowdown in economic growth. Instead, the economy grew robustly, although the Governor of the Bank of England strongly maintained that this was because the MPC took that action. However, other commentators regard this emergency action by the MPC as being proven by events to be a mistake. Then in 2017, we had the Financial Policy Committee (FPC) of the Bank of England taking action in June and September over its concerns that cheap borrowing rates, and easy availability of consumer credit, had resulted in too rapid a rate of growth in consumer borrowing and in the size of total

borrowing, especially of unsecured borrowing. It, therefore, took punitive action to clamp down on the ability of the main banks to extend such credit! Indeed, a PWC report in October 2017 warned that credit card, car and personal loans and student debt will hit the equivalent of an average of £12,500 per household by 2020. However, averages belie wide variations in levels of debt with much higher exposure being biased towards younger people, especially the 25 -34 year old band, reflecting their lower levels of real income and asset ownership. One key area of risk is that consumers may have become used to cheap rates since 2008 for borrowing, especially for mortgages. It is a major concern that some consumers may have over extended their borrowing and have become complacent about interest rates going up after Bank Rate had been unchanged at 0.50% since March 2009 until falling further to 0.25% in August 2016. This is why forward guidance from the Bank of England continues to emphasise slow and gradual increases in Bank Rate in the coming years. However, consumer borrowing is a particularly vulnerable area in terms of the Monetary Policy Committee getting the pace and strength of Bank Rate increases right - without causing a sudden shock to consumer demand, confidence and thereby to the pace of economic growth. Moreover, while there is so much uncertainty around the Brexit negotiations, consumer confidence, and business confidence to spend on investing, it is far too early to be confident about how the next two to three years will actually pan out. EZ. Economic growth in the eurozone (EZ), (the UK’s biggest trading partner), had been lack lustre for several years after the financial crisis despite the ECB eventually cutting its main rate to -0.4% and embarking on a massive programme of QE. However, growth picked up in 2016 and has now gathered substantial strength and momentum thanks to this stimulus. GDP growth was 0.6% in quarter 1 (2.1% y/y), 0.7% in quarter 2 (2.4% y/y) and +0.6% in quarter 3 (2.6% y/y). However, despite providing massive monetary stimulus, the European Central Bank is still struggling to get inflation up to its 2% target and in November inflation was 1.5%. It is therefore unlikely to start on an upswing in rates until possibly 2019. It has, however, announced that it will slow down its monthly QE purchases of debt from €60bn to €30bn from January 2018 and continue to at least September 2018. USA. Growth in the American economy was notably erratic and volatile in 2015 and 2016. 2017 is following that path again with quarter 1 coming in at only 1.2% but quarter 2 rebounding to 3.1% and quarter 3 coming in at 3.2%. Unemployment in the US has also fallen to the lowest level for many years, reaching 4.1%, while wage inflation pressures, and inflationary pressures in general, have been building. The Fed has started on a gradual upswing in rates with four increases in all and four increases since December 2016; the latest rise was in December 2017 and lifted the central rate to 1.25 – 1.50%. There could then be another four increases in 2018. At its September meeting, the Fed said it would start in October to gradually unwind its $4.5 trillion balance sheet holdings of bonds and mortgage backed securities by reducing its reinvestment of maturing holdings. CHINA. Economic growth has been weakening over successive years, despite repeated rounds of central bank stimulus; medium term risks are increasing. Major progress still needs to be made to eliminate excess industrial capacity and the stock of unsold property, and to address the level of non-performing loans in the banking and credit systems. JAPAN. GDP growth has been gradually improving during 2017 to reach an annual figure of 2.1% in quarter 3. However, it is still struggling to get inflation up to its target of 2%, despite huge monetary and fiscal stimulus. It is also making little progress on fundamental reform of the economy.
Brexit timetable and process
March 2017: UK government notifies the European Council of its intention to leave under the Treaty on European Union Article 50
March 2019: initial two-year negotiation period on the terms of exit. In her Florence speech in September 2017, the Prime Minister proposed a two year transitional period after March 2019.
UK continues as a full EU member until March 2019 with access to the single market and tariff free trade between the EU and UK. Different sectors of the UK economy will leave the single market and tariff free trade at different times during the two year transitional period.
The UK and EU would attempt to negotiate, among other agreements, a bi-lateral trade agreement over that period.
The UK would aim for a negotiated agreed withdrawal from the EU, although the UK could also exit without any such agreements in the event of a breakdown of negotiations.
If the UK exits without an agreed deal with the EU, World Trade Organisation rules and tariffs could apply to trade between the UK and EU - but this is not certain.
On full exit from the EU: the UK parliament would repeal the 1972 European Communities Act.
The UK will then no longer participate in matters reserved for EU members, such as changes to the EU’s budget, voting allocations and policies.

APPENDIX F
Counterparties
Specified Investments These are sterling investments of a maturity period of not more than 365 days, or those which could be for a longer period but where the lender has the right to be repaid within 365 days if it wishes. These are low risk assets where the possibility of loss of principal or investment income is negligible. The instruments and credit criteria to be used are set out in the table below. Table 10 Specified Investments
Instrument Minimum Credit Criteria
Use
Debt Management Agency Deposit Facility
Government backed In-house
Term deposits – other LAs Local Authority issue In-house
Term deposits – banks and building societies
AA- Long Term F1+Short-term
2 Support UK or AAA Sovereign
In-house
Money Market Funds (CNAV), (LVNAV) and (VNAV)
AAA In-house
Non-Specified Investments Non-specified investments are any other type of investment (i.e. not defined as Specified above).They normally offer the prospect of higher returns but carry a higher risk. The identification and rationale supporting the selection of these other investments are set out in the table below. Table 11 Non - Specified Investments
Minimum Credit Criteria
Use Max total investment
Max. maturity period
Term deposits – banks and building societies (excluding Lloyds / HBOS)
A Long Term F1 Short-term
UK or AAA Sovereign In-house 50% 3 months
Lloyds / HBOS A Long Term F1 Short-term
In-house 50% 6 months
Callable Deposits A Long Term F1 Short term
In-house 20% 3 months
UK nationalised Banks [RBS]
F2 Short-term In-house 60% 36 months
Enhanced Cash Funds AAA
In-house
25% (maximum £10
million per fund)
Minimum monthly redemption
Corporate bonds pooled funds, other non-standard investments and gilts
In house £10m in total Dependent on
specific agreement
HB Public Law Ltd
In house £0.1m 36 months

Minimum Credit Criteria
Use Max total investment
Max. maturity period
Investment Property Strategy *
In house £20.0m
Dependent on specific agreement
Concilium Business Services Ltd t/a Smart Lettings Ltd
In house £0.331m 36 months
Concilium Group Startup capital
In house £0.702m 60 months
Concilium Group 5% Long Term Investment
In house £1.5m
Dependent on specific agreement
Cultura London re Harrow Arts Centre
In house £1m 25 years
Housing Development Vehicle (LLP) – Initially on acquisition of 100 homes
In house £30m Dependent on
specific agreement
*Investment to date totals £10.2m
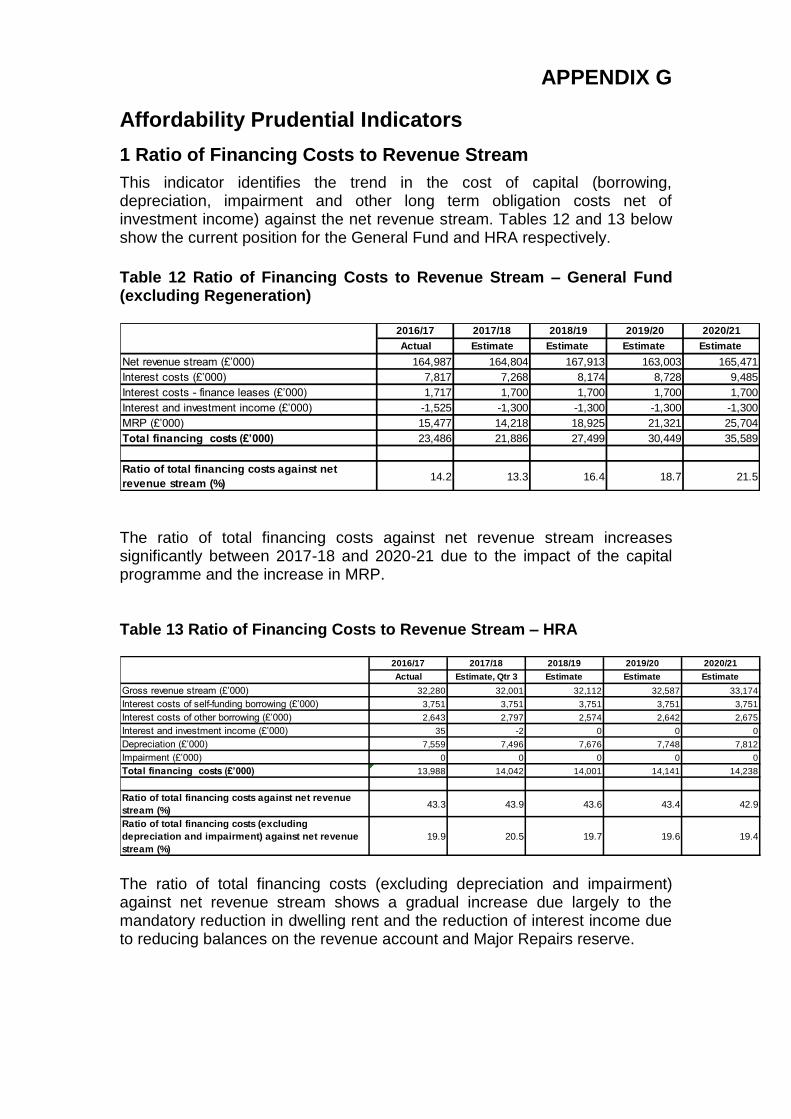
APPENDIX G
Affordability Prudential Indicators
1 Ratio of Financing Costs to Revenue Stream
This indicator identifies the trend in the cost of capital (borrowing, depreciation, impairment and other long term obligation costs net of investment income) against the net revenue stream. Tables 12 and 13 below show the current position for the General Fund and HRA respectively.
Table 12 Ratio of Financing Costs to Revenue Stream – General Fund (excluding Regeneration)
2016/17 2017/18 2018/19 2019/20 2020/21
Actual Estimate Estimate Estimate Estimate
Net revenue stream (£’000) 164,987 164,804 167,913 163,003 165,471
Interest costs (£’000) 7,817 7,268 8,174 8,728 9,485
Interest costs - finance leases (£’000) 1,717 1,700 1,700 1,700 1,700
Interest and investment income (£’000) -1,525 -1,300 -1,300 -1,300 -1,300
MRP (£’000) 15,477 14,218 18,925 21,321 25,704
Total financing costs (£’000) 23,486 21,886 27,499 30,449 35,589
Ratio of total financing costs against net
revenue stream (%)14.2 13.3 16.4 18.7 21.5
The ratio of total financing costs against net revenue stream increases significantly between 2017-18 and 2020-21 due to the impact of the capital programme and the increase in MRP. Table 13 Ratio of Financing Costs to Revenue Stream – HRA
2016/17 2017/18 2018/19 2019/20 2020/21
Actual Estimate, Qtr 3 Estimate Estimate Estimate
Gross revenue stream (£’000) 32,280 32,001 32,112 32,587 33,174
Interest costs of self-funding borrowing (£’000) 3,751 3,751 3,751 3,751 3,751
Interest costs of other borrowing (£’000) 2,643 2,797 2,574 2,642 2,675
Interest and investment income (£’000) 35 -2 0 0 0
Depreciation (£’000) 7,559 7,496 7,676 7,748 7,812
Impairment (£’000) 0 0 0 0 0
Total financing costs (£’000) 13,988 14,042 14,001 14,141 14,238
Ratio of total financing costs against net revenue
stream (%)43.3 43.9 43.6 43.4 42.9
Ratio of total financing costs (excluding
depreciation and impairment) against net revenue
stream (%)
19.9 20.5 19.7 19.6 19.4
The ratio of total financing costs (excluding depreciation and impairment) against net revenue stream shows a gradual increase due largely to the mandatory reduction in dwelling rent and the reduction of interest income due to reducing balances on the revenue account and Major Repairs reserve.

2 Incremental Impact of Capital Investment Decisions on
Council Tax and Housing Rents This indicator identifies the revenue costs associated with proposed capital programme and the impact on Council Tax and Housing Rents. Table 14 Incremental Impact of Capital Investment Decisions (excluding Regeneration) – Council Tax
2016/17 2017/18 2018/19 2019/20 2020/21
Actual Estimate Estimate Estimate Estimate
Net Financing need (£'000) 45,131 46,131 23,415 6,808 33,774-
Borrowing @ 25-50years PWLB rate (£'000) 1,146 1,241 711 217 1,077-
MRP @ 2% (£'000) 903 923 468 136 -675
Total increased costs (£'000) 2,049 2,164 1,180 353 1,752-
Ctax base (£'000) 82,000 83,500 84,466 85,946 85,946
% Increase 2.5 2.6 1.4 0.4 2.0-
Band D Council Tax 1,560 1,628 1,689 1,738 1,766
Overall increase £ pa 38.98 42.17 23.58 7.14 36.01-
Table 15 Incremental Impact of Capital Investment Decisions – Housing Rents
2016/17 2017/18 2018/19 2019/20 2020/21
Actual Estimate, Qtr 3 Estimate Estimate Estimate
Net Financing need (£'000)
Borrowing @ 2% (25-50years PWLB rate) (£'000)
Depreciation @ 2% (£'000)
Total increased costs
Number of dwellings
Increase in average housing rent per week £ #DIV/0! #DIV/0! #DIV/0! #DIV/0! #DIV/0!
3 Local HRA indicators The Council should also be aware of the following ratios when making its treasury management decisions. Table 16 HRA Ratios
2016/17 2017/18 2018/19 2019/20 2020/21
Actual Estimate, Qtr 3 Estimate Estimate Estimate
Debt (CFR) (£m) 149.54 151.49 154.67 154.78 156.27
Gross Revenue Stream (£m) 32.28 32.00 32.11 32.59 33.17
Ratio of Gross Revenue Stream to Debt (%) 22 21 21 21 21
Average Number of Dwellings 4,825 4,823 4,781 4,760 4,755
Debt outstanding per dwelling (£) 30,992 31,410 32,351 32,517 32,864 Rents in the Housing Revenue Account are projected to reduce by 1% each year for four years commencing in 2016/17, in line with the provisions of the Welfare Reform and Work Act. The reduction in income is expected to be mitigated over the next two years by additional rent income generated as a result of an increase in HRA property numbers from the Council’s HRA new build and purchase and repair programmes.