report for department of health (england) - em … hai surve… · response and led to the...
TRANSCRIPT

Preliminary Results of Third Prevalence Survey of HCAI in England 2006 – Report for Department of Health, England
June 2007
Hospital Infection Society Infection Control Nurses Association
The Third Prevalence Survey of
Healthcare Associated Infections in
Acute Hospitals in England 2006
Report for Department of Health (England)

DH INFORMATION READER BOX
Policy EstatesHR / Workforce CommissioningManagement IM & TPlanning / FinanceClinical Social Care / Partnership Working
Document Purpose For Information
ROCR Ref: 0 Gateway Ref: 8766
Title
Author
Publication DateTarget Audience
Circulation List
Description
Cross Ref
Superseded Docs
Action Required
TimingContact Details
For Recipient's Use
The Third Prevalence Survey of Healthcare Associated Infections in Acute Hospitals in England 2006
SE1 8UG
0
0
Professor Brian DuerdenInspector of Microbiology and Infection ControlDepartment of HealthWellington House, Waterloo Road, London
Hospital Infection Society
N/A0N/A
September 2007Medical Directors, Directors of PH, Directors of Nursing, Directors of Infection Prevention and control, Infection Control Doctors, and Nurse Practitioners
#VALUE!
Aggregate results of the Healthcare Associated Infections Prevalence Survey conducted in Acute Trusts in England on 2006
0N/A0N/A

Preliminary Results of Third Prevalence Survey of HCAI in England 2006 – Report for Department of Health, England
June 2007 Page 1 of 21
Foreword The Third Healthcare Associated Infection (HCAI) Prevalence Survey has been a marvellous example of cooperation between many sections of the Health Service. The initial approach, in late 2004, by the Department of Health in England to the Hospital Infection Society (HIS) received a very favourable response and led to the formation of a steering group to oversee the project. Soon after agreement was reached with the relevant Departments of Health in Wales, Northern Ireland and the Republic of Ireland to participate employing the same methodology. Scotland had already decided to embark on a HCAI Prevalence Survey of their own and they readily agreed to standardise methodologies. The Infection Control Nurses Association (ICNA) embraced the project and became an active partner with HIS. I had the privilege of acting as Lead for the project.
The methodology employed was crucial to the success of the venture. Early agreement on the use of standardized definitions of infection (Centers for Disease Control and Prevention, Atlanta, Georgia, USA) and employing optical scanning technology helped in the execuction of the project. Meanwhile HIS appointed a surveillance coordinator for England, Joanne Enstone, and 10.5 regional coordinators who were instrumental in setting up the project throughout England. Coordination of the project was centred at the Northern Ireland Healthcare Associated Surveillance Centre (HISC) in Belfast and Gerard McIlvenny, the HISC Manager, took responsibility for the data management team.
The surveillance was carried out during the period February to May 2006 with data analysis performed in Belfast. An interim report was presented on behalf of the steering group at the HIS International Scientific Meeting in Amsterdam in October 2006.
A desire not to repeat the mistake of previous surveys, with regard to timely information feedback, led to the development of a secure web-based system developed by the Welsh Healthcare Associated Infection Programme (WHAIP) and hosted by the NHS intranet. This enabled hospitals to access their own data via the system. A number of reports were available and data could be downloaded for local analysis. For comparative purposes, hospitals were provided with summary data for England. Individual data feedback to participating hospitals went “live” in March 2007 and was a great success.
I would like to acknowledge the assistance and funding by the Department of Health in England; the support and active participation of the HIS steering group; participation of members of HIS and ICNA; the valuable role played by the regional coordinators and the contribution of the individual infection prevention & control teams and clinical staff throughout the country; the significant contribution made by the WHAIP team in Wales and members of the staff of HISC and The Royal Hospitals in Belfast. A more comprehensive list of acknowledgements will be found in the appendix to this report. Lastly I would single out two people who have contributed well above and beyond the call of duty; namely Joanne Enstone and Gerard McIlvenny. Without their expertise and drive we would have had major difficulties in performing the Third HCAI Prevalence Survey.
In closing I feel confident that we achieved our objectives set by the Department of Health and the HIS Steering Group and I commend this report to all.
Dr Edward TM Smyth
HIS Lead for the Third HCAI Prevalence Survey
Director, Northern Ireland Healthcare Associated Infection Surveillance Centre
June, 2007

Preliminary Results of Third Prevalence Survey of HCAI in England 2006 – Report for Department of Health, England
June 2007 Page 2 of 21
Contents Foreword 1
List of Figures 3
List of Tables 3
Background 4
Methodology 4
Results 5
UK Prevalence of HCAI 5
Prevalence of HCAI by Trust type 5
Distribution of prevalence of HCAI 6
Ward specialties surveyed 7
Patient demographics 10
Device usage 11
Antibiotic usage 11
Types of healthcare-associated infection 12
Prevalence of HCAI by infection type 13
Prevalence of HCAI by specialty 14
MRSA prevalence 16
Clostridium difficile prevalence 17
Norovirus prevalence 18
Appendix 1: Survey questionnaire 19
Appendix 2: List of acknowledgements 21

Preliminary Results of Third Prevalence Survey of HCAI in England 2006 – Report for Department of Health, England
June 2007 Page 3 of 21
List of Figures
Figure 1: Distribution of prevalence of HCAI in acute hospitals in England 6
Figure 2: Patients surveyed by ward specialty (>1000 patients) 7
Figure 3: Patients surveyed by ward specialty groups 9
Figure 4: Patients surveyed by age group and gender 10
Figure 5: Prevalence of HCAI by age group and gender 10
Figure 6: Prevalence of C.difficile by age group and gender 17
List of Tables
Table 1: UK Prevalence of HCAI 5
Table 2: Prevalence of HCAI by Trust type 5
Table 3 Patients surveyed by ward specialty (<1000 beds) 8
Table 4: Device usage 11
Table 5: Antibiotic usage 11
Table 6: Types of healthcare associated infection 12
Table 7: Prevalence of HCAI by infection type 13
Table 8: Prevalence of HCAI by consultant and ward specialty 14
Table 9: MRSA prevalence 16
Table 10: MRSA prevalence by infection type 16
Table 11: Clostridium difficile prevalence 17
Table 12: Norovirus prevalence 18

Preliminary Results of Third Prevalence Survey of HCAI in England 2006 – Report for Department of Health, England
June 2007 Page 4 of 21
Background The first and second national UK prevalence surveys of Healthcare Associated Infection (HCAI) were conducted in 1980 and 1993/94. In those surveys the overall prevalence of HCAI was 9.2% and 9.0% respectively. However different definitions of infection were employed in those studies and therefore direct comparisons should only be made with extreme caution.The Third HCAI Prevalence Survey was carried out across the UK and included 190 acute hospitals (130 trusts) in England. Hospitals from all Strategic Health Authorities participated. The survey was conducted between February and May 2006.
Health departments in Wales, Northern Ireland and the Republic of Ireland conducted identical surveys during the same time period. In Scotland a comparable survey, including an estimate of the economic burden of HCAI, was carried out. This will ultimately allow a full UK and Ireland analysis to be performed.
The aims of the prevalence survey were to:
• Determine the prevalence of all HCAI in acute hospitals including urinary tract infection, surgical site infection, bloodstream infection, soft tissue infection and lower respiratory tract infection
• Collect specific information on C. difficile diarrhoea and norovirus infection
• Help develop a consistent methodology for prevalence surveys for the future
• Conduct a survey that would be compatible with studies carried out in other countries.
Methodology In England the Third Prevalence Survey was led by the Hospital Infection Society (HIS) together with the ICNA; members of these societies were invited to participate during the summer of 2005. All acute hospitals with adult in-patients were eligible to participate in the survey. Paediatric patients were excluded.
Infection control teams and microbiologists were trained at regional symposia in the survey methodology and, with the help of 10.5 regional coordinators (employed by the HIS), collected prevalence data on scannable questionnaires using the CDC definitions of infection. The data was scanned and then cleaned and analysed in Belfast. It was fed back to participating hospitals via a secure web-based reporting system developed by the Welsh Healthcare Associated Infection Programme and hosted by the NHS intranet. Since March 2007 hospitals have been able to access their own data, and the data of other participating hospitals in the same trust via this system. A number of summary and detailed reports are available and data can be downloaded for local analysis. For comparative purposes, hospitals were provided with summary data for England in pdf format.

Preliminary Results of Third Prevalence Survey of HCAI in England 2006 – Report for Department of Health, England
June 2007 Page 5 of 21
Results The total number of patients surveyed in England was 58,775. The prevalence of HCAI in England was 8.2% (95% CI 8.0 – 8.4), compared with 7.6% (95% CI 7.4 – 7.8) for the UK and Ireland collectively (excluding Scotland). See Table 1. Although similar surveys were carried out in 1980 and 1993/94, the results are not directly comparable with the current survey because the definitions of infection used in the three surveys were not identical.
UK Prevalence of HCAI Table 1 UK Prevalence of HCAI
* excludes Scotland
Prevalence of HCAI by Trust type One hundred and thirty acute trusts in England participated in the survey. The HCAI prevalence by Trust type is given in Table 2.
Table 2 Prevalence of HCAI by Trust type
Type of Trust Number of Trusts
(hospitals)
Total number of patients (%)
Patients with HCAI
Prevalence * 95% confidence
interval
Small acute 22 (23) 6364 (10.8%) 500 7.9 7.2 – 8.5
Medium acute 43 (49) 17768 (30.2%) 1373 7.7 7.3 – 8.1
Large acute 34 (72) 19777 (33.6%) 1680 8.5 8.1 – 8.9
Acute teaching 22 (36) 13658 (23.2%) 1149 8.4 8.0 – 8.9
Acute specialist 9 (10) 1208 (2.1%) 110 9.1 7.6 – 10.9
Total 130 (190) 58775 (100.0%) 4812 8.2 8.0 – 8.4 * Prevalence =
Prevalence survey Total patients surveyed
Number of patients with
HCAI
Prevalence 95% confidence interval
2006 England 58775 4812 8.2 8.0 – 8.4
2006 UK* and Ireland 75856 5773 7.6 7.4 – 7.8
UK 1993/94 37111 3353 9.0 8.8 – 9.3
UK 1980 18163 1671 9.2 8.8 – 9.6
Number of patients with infections
Total number of patients surveyed X 100

Preliminary Results of Third Prevalence Survey of HCAI in England 2006 – Report for Department of Health, England
June 2007 Page 6 of 21
Distribution of HCAI prevalence HCAI prevalence in the hospitals ranged from 0% to 34.6%. The distribution is shown in Figure 1.
17
28
53
44
24
11
63 4
<2.50 2.50 - 4.99 5.00 - 7.49 7.50 - 9.99 10.00 - 12.49 12.50 - 14.99 15.00 - 17.49 17.50 - 19.99 >20.00
Prevalenceof HCAI (%)
Num
ber o
f hos
pita
ls
Figure 1 Distribution of HCAI prevalence in acute hospitals in England

Preliminary Results of Third Prevalence Survey of HCAI in England 2006 – Report for Department of Health, England
June 2007 Page 7 of 21
Ward specialties surveyed The average (mean) number of patients surveyed per hospital was 309. Figure 2 and Table 3 show the percentage of patients surveyed for ward specialties with > 1000 patients and ward specialties with < 1000 patients respectively.
21.5
13.112.3
10.3
4.1 4.1 3.82.9 2.5 2.3 2.3 1.7
19
0
5
10
15
20
25
Genera
l med
icine
n=12
664
Care of
the e
lderly
n=76
81
Trauma &
ortho
paed
ics n=
7220
Genera
l surg
ery n=
6075
Cardiol
ogy n
=242
9
Respir
atory
medici
ne n=
2391
Obstet
rics n
=2233
Gynae
colog
y n=1
706
Critica
l care
med
icine n
=146
9
Medica
l onc
ology
n= 13
79
Gastro
enter
ology
n=13
64
Urolog
y n=1
020
Others
n=11
144
Ward specialty
Perc
enta
ge o
f pat
ient
s su
rvey
ed
N.B. Only ward specialties where the number of patients surveyed exceeded 1000 are shown
Figure 2 Patients surveyed by ward specialty (>1000 beds)

Preliminary Results of Third Prevalence Survey of HCAI in England 2006 – Report for Department of Health, England
June 2007 Page 8 of 21
Table 3 Patients surveyed by ward specialty (<1000 beds)
Ward Specialty
Number of patients surveyed
Percentage of total patients
Vascular surgery 973 1.7
Nephrology 914 1.6
ENT 837 1.4
Clinical haematology 762 1.3
Neurosurgery 715 1.2
Neurology 679 1.2
Colorectal surgery 556 0.9
Plastic surgery 488 0.8
Cardiothoracic surgery 486 0.8
Endocrinology 404 0.7
Coronary care unit 403 0.7
Infectious diseases 316 0.5
Upper gastrointestinal surgery 300 0.5
Cardiac surgery 268 0.5
Rheumatology 183 0.3
Surgical high dependency 171 0.3
Ophthalmology 156 0.3
Thoracic surgery 132 0.2
Genito-urinary medicine 126 0.2
Maxillo-facial surgery 120 0.2
Breast surgery 110 0.2
Hepatology 110 0.2
Dermatology 104 0.2
Hepatobiliary & pancreatic surgery 101 0.2
Palliative medicine 90 0.2
Burns care 83 0.1
Transplantation surgery 66 0.1
Medical high dependency 65 0.1
Blood & marrow transplantation 56 0.1
Cardiothoracic transplantation 32 0.1
Oral surgery 4 <0.1
Miscellaneous 1334 2.3

Preliminary Results of Third Prevalence Survey of HCAI in England 2006 – Report for Department of Health, England
June 2007 Page 9 of 21
Figure 3 shows the percentage of patients surveyed by grouping ward specialty into medical, surgical, obstetrics & gynaecology, critical care medicine and other specialties.
54.6
33.9
6.7
2.5 2.3
Medical includes Care of the elderly
Surgical Obstetrics & gynae Critical care All others
Ward specialty
Perc
enta
ge o
f pat
ient
s su
rvey
ed
n=58775
Figure 3 Ward specialty groups

Preliminary Results of Third Prevalence Survey of HCAI in England 2006 – Report for Department of Health, England
June 2007 Page 10 of 21
Patient demographics The majority of patients surveyed were female (56.1%). Figure 4 shows the distribution of patients surveyed by age group and gender. Forty seven percent of patients surveyed were aged 75 or over.
15
19.7 18.5
46.8
12.2
23.6 22.2
17.3
50.4
42
16.6 15.6
<45 45 - 64 65 -74 75+
Age group
Perc
enta
ge o
f pat
ient
s
All patientsMaleFemale
Figure 4 Patients surveyed by age group and gender
Figure 5 shows the rise in HCAI prevalence as age increases.
4.2
7.4
8.5
9.7
5.7
7.9
99.8 9.6
8.1
6.8
3.4
<45 45 - 64 65 -74 75+
Age group
HC
AI p
reva
lenc
e (%
)
All patientsMaleFemale
Figure 5 HCAI prevalence by age group and gender

Preliminary Results of Third Prevalence Survey of HCAI in England 2006 – Report for Department of Health, England
June 2007 Page 11 of 21
Device usage Device usage is summarised in Table 4. Peripheral catheters (61.7% of patients) and urinary catheters (31.6% of patients) were the most common devices either in situ on the day of the survey, or present within the previous seven days.
Table 4 Device usage
Device type Number of patients with device in situ at time of
survey or within previous seven days
Percentage of patients with device in situ at time of
survey or within previous seven days
Urinary catheter 18554 31.6
Other bladder instrumentation 946 1.6
Peripheral catheter 36241 61.7
Central line catheter 4303 7.3
Mechanical ventilation 3285 5.6
Parenteral nutrition 976 1.7
Antibiotic usage One third of patients were prescribed antimicrobials at the time of the survey; of these 45.7% were on intravenous antimicrobial therapy.
Table 5 Antibiotic usage
Total patients Number of patients on systemic antimicrobials
Percentage of patients on systemic antimicrobials
58775 19566 33.3
Preliminary Results of Third Prevalence Survey of HCAI in England 2006 – Report for Department of Health, England
June 2007 Page 12 of 21
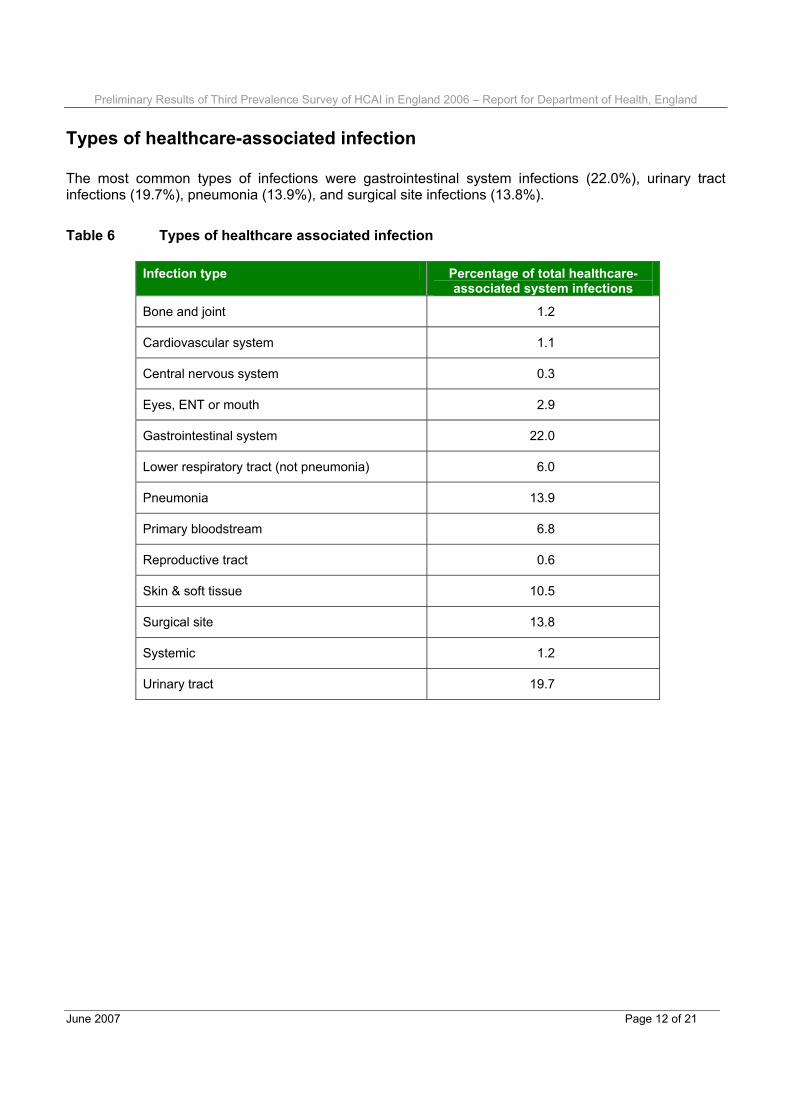
Types of healthcare-associated infection The most common types of infections were gastrointestinal system infections (22.0%), urinary tract infections (19.7%), pneumonia (13.9%), and surgical site infections (13.8%).
Table 6 Types of healthcare associated infection
Infection type Percentage of total healthcare-associated system infections
Bone and joint 1.2
Cardiovascular system 1.1
Central nervous system 0.3
Eyes, ENT or mouth 2.9
Gastrointestinal system 22.0
Lower respiratory tract (not pneumonia) 6.0
Pneumonia 13.9
Primary bloodstream 6.8
Reproductive tract 0.6
Skin & soft tissue 10.5
Surgical site 13.8
Systemic 1.2
Urinary tract 19.7

Preliminary Results of Third Prevalence Survey of HCAI in England 2006 – Report for Department of Health, England
June 2007 Page 13 of 21
Prevalence of HCAI by infection type The prevalence of each type of infection is given in Table 7. The prevalence is given as a percentage of patients surveyed except for surgical site infections where an additional prevalence is given using the number of patients undergoing a surgical procedure as the denominator.
Table 7 Prevalence of HCAI by infection type
Infection type Infection type prevalence*
95% confidence interval
Bone and joint 0.11 0.09 – 0.14
Cardiovascular system 0.10 0.08 – 0.13
Central nervous system 0.02 0.01 – 0.04
Eyes, ENT or mouth 0.27 0.23 – 0.31
Gastrointestinal system 2.02 1.91 – 2.13
Lower respiratory tract (not pneumonia) 0.55 0.50 – 0.62
Pneumonia 1.27 1.19 – 1.37
Primary bloodstream 0.62 0.56 – 0.69
Reproductive tract 0.06 0.04 – 0.08
Skin & soft tissue 0.96 0.88 – 1.04
Surgical site
All patients surveyed
Patients who had undergone surgery
1.27
4.65
1.18 – 1.36
4.33 – 4.99
Systemic 0.11 0.09 – 0.14
Urinary tract 1.80 1.70 – 1.91
* Infection type prevalence =
Number of patients with specific type of infection
Total number of patients surveyed X 100

Preliminary Results of Third Prevalence Survey of HCAI in England 2006 – Report for Department of Health, England
June 2007 Page 14 of 21
Prevalence of HCAI by specialty Consultant specialties used in the survey were aligned with the specialties recognised in the European Specialist Medical Qualifications Order 1995 and European Primary and Specialist Dental Qualifications Regulations 1998. Ward specialties were assigned during the survey to reflect the type of ward. The consultant specialty reflects the consultant managing the patient on a day to day basis whereas the ward specialty gives the prevalence rate for similar groups of wards e.g. critical care units.
Table 8 Prevalence of HCAI by consultant and ward specialty
Specialty prevalence * Specialty
Consultant specialty Ward specialty
Blood and marrow transplantation 18.5 -----
Breast surgery 3.0 1.8
Burns care 22.9 18.1
Cardiac surgery 12.1 9.7
Cardiology 6.0 5.3
Cardiothoracic surgery 12.6 8.4
Cardiothoracic transplantation 18.9 31.3
Care of the elderly also known as Geriatric medicine 10.0 10.7
Clinical haematology 14.6 11.3
Clinical immunology 9.1 -----
Clinical microbiology 4.1 -----
Colorectal surgery 11.0 7.9
Coronary care unit - Ward specialty only ----- 3.7
Critical care medicine also known as Intensive care medicine 23.2 24.5
Dermatology 3.5 5.8
Endocrinology 9.0 7.2
ENT 3.9 3.7
Gastroenterology 7.0 6.0
General medicine 7.7 8.1
General surgery 8.1 7.1
Genito-urinary medicine 1.9 4.8
Gynaecology 4.8 4.4 Continued… * Specialty prevalence =
Number of patients with infections in specific specialty
Total number of patients surveyed in specific specialty X 100

Preliminary Results of Third Prevalence Survey of HCAI in England 2006 – Report for Department of Health, England
June 2007 Page 15 of 21
Prevalence by specialty (continued)
Specialty prevalence Specialty Consultant specialty Ward specialty
Hepatobiliary & pancreatic surgery 10.8 5.9
Hepatology 14.7 8.2
Infectious diseases 7.8 12.7
Maxillo-facial surgery 2.5 1.7
Medical high dependency - Ward specialty only ----- 16.9
Medical oncology 6.4 8.5
Nephrology 13.4 12.9
Neurology 7.8 7.1
Neurosurgery 10.9 9.9
Obstetrics 0.8 0.6
Ophthalmology 0.0 1.3
Oral surgery 0.0 0.0
Orthodontics 0.0 -----
Pain management 8.3 -----
Palliative medicine 6.1 -----
Plastic surgery 4.8 5.1
Respiratory medicine also known as thoracic medicine 7.7 7.6
Restorative dentistry 14.3 -----
Rheumatology 4.5 4.9
Surgical high dependency - Ward specialty only ----- 14.0
Thoracic surgery 10.2 10.6
Transplantation surgery 21.6 15.2
Trauma & orthopaedics 8.7 8.5
Tropical medicine 5.9 -----
Upper gastrointestinal surgery 9.2 9.7
Urology 5.8 5.5
Vascular surgery 10.5 8.4
Others 10.9 6.7

Preliminary Results of Third Prevalence Survey of HCAI in England 2006 – Report for Department of Health, England
June 2007 Page 16 of 21
MRSA prevalence For each HCAI recorded, it was asked whether MRSA was the causative organism. The prevalence of MRSA was 1.28% (Table 9) with MRSA being the causative organism in 15.5% of all HCAI. Table 10 gives the breakdown by infection type.
Table 9 MRSA prevalence
Total patients
Number of patients with HCAI where MRSA was causative organism
MRSA prevalence * 95% confidence
interval
58775 755 1.28 1.20 – 1.38 * MRSA prevalence =
Table 10 MRSA prevalence by infection type
Infection type Percentage of infection type with MRSA as causative organism
Infection type MRSA prevalence *
Bone and joint 28.1 0.03
Cardiovascular system 19.7 0.02
Central nervous system 14.3 <0.01
Eyes, ENT or mouth 29.3 0.08
Lower respiratory tract (not pneumonia) 15.7 0.09
Gastrointestinal system (includes specific sites gastroenteritis and GI tract)
1.4 0.03
Pneumonia 7.3 0.09
Primary bloodstream 22.4 0.14
Reproductive tract 22.9 0.01
Skin & soft tissue 49.1 0.47
Surgical site – Patients who had undergone surgery
27.6 1.28
Systemic 10.8 0.01
Urinary tract 4.7 0.09
* Infection type MRSA prevalence =
Number of patients with infections where MRSA was the causative organism
Total number of patients surveyed X 100
Number of patients with specific infection type where MRSA was the causative organism
Total number of patients surveyed X 100

Preliminary Results of Third Prevalence Survey of HCAI in England 2006 – Report for Department of Health, England
June 2007 Page 17 of 21
Clostridium difficile prevalence The number of patients with C. difficile diarrhoea was recorded. Table 11 shows the overall prevalence of C.difficile (including those who had a C. difficile diarrhoea that was already present or incubating at the time of admission to hospital); of these 1163 patients, 828 (71.2%) were recorded as having a healthcare associated gastrointestinal system infection. This equates to 1.41% of the total population having a healthcare associated C. difficile diarrhoea. Therefore 335 of 1163 patients with C. difficile diarrhoea (28.8%) had a C. difficile diarrhoea that didn’t conform to the HCAI definitions. This equates to 0.57% of the total population having a C. difficile diarrhoea that was already present or incubating at the time of admission to hospital.
Table 11 Clostridium difficile prevalence rate
Total patients
Number of patients with Clostridium difficile diarrhoea
Clostridium difficile prevalence*
95% confidence
interval
58775 1163 1.98 1.87 – 2.09
* Clostridium difficile prevalence =
Figure 6 illustrates the prevalence by age group and gender. The overall prevalence was 0.83% in those aged under 65 and 2.61% in those aged 65 and over.
2.99
2.61
0.51
1.08
1.7
0.89
2.4
1.65
1.08
0.49
0.83
2.77 2.77
0.77
3.13
1.61
0.46
1.09
0<45 45 - 64 65 -74 75+ Under 65 65 and over
Age group
Prev
alen
ce (%
)
All patients
Male
Female
Figure 6 Prevalence of C.difficile by age group and gender
Number of patients with Clostridium difficile diarrhoea
Total number of patients surveyedX 100
Preliminary Results of Third Prevalence Survey of HCAI in England 2006 – Report for Department of Health, England
June 2007 Page 18 of 21
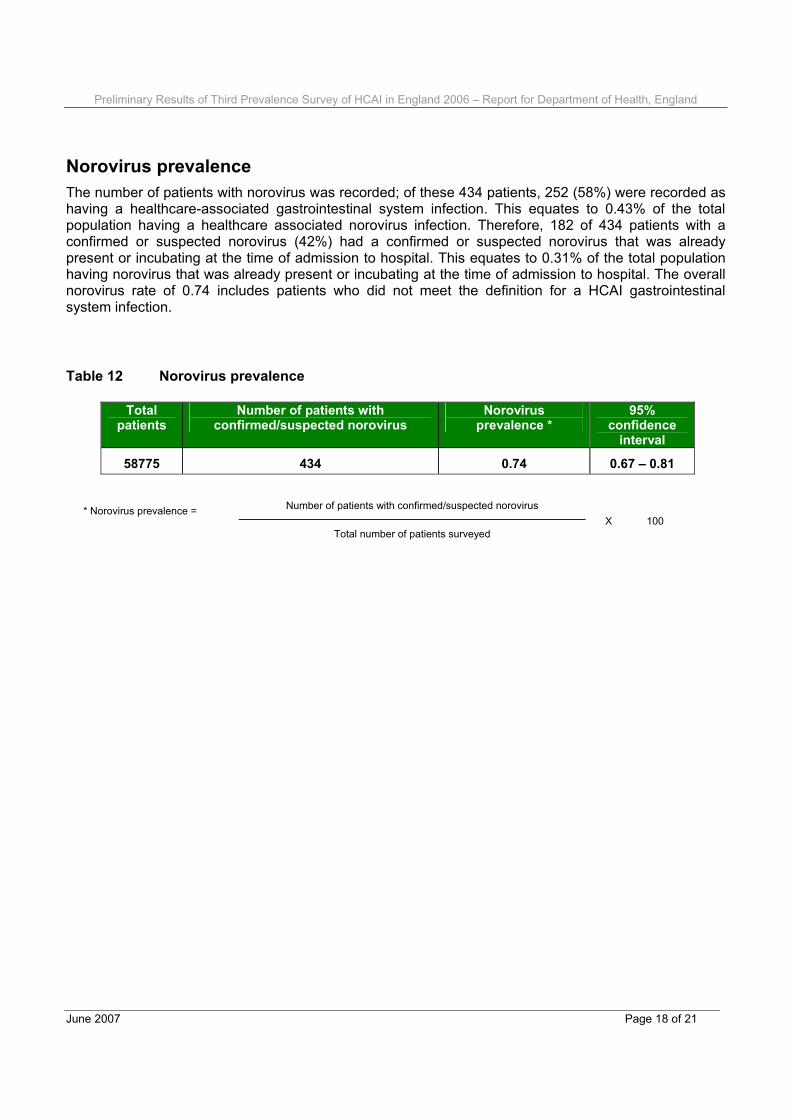
Norovirus prevalence The number of patients with norovirus was recorded; of these 434 patients, 252 (58%) were recorded as having a healthcare-associated gastrointestinal system infection. This equates to 0.43% of the total population having a healthcare associated norovirus infection. Therefore, 182 of 434 patients with a confirmed or suspected norovirus (42%) had a confirmed or suspected norovirus that was already present or incubating at the time of admission to hospital. This equates to 0.31% of the total population having norovirus that was already present or incubating at the time of admission to hospital. The overall norovirus rate of 0.74 includes patients who did not meet the definition for a HCAI gastrointestinal system infection.
Table 12 Norovirus prevalence
Total patients
Number of patients with confirmed/suspected norovirus
Norovirus prevalence *
95% confidence
interval
58775 434 0.74 0.67 – 0.81
* Norovirus prevalence =
Number of patients with confirmed/suspected norovirus
Total number of patients surveyed X 100

Preliminary Results of Third Prevalence Survey of HCAI in England 2006 – Report for Department of Health, England
June 2007 Page 19 of 21
Appendix 1
Survey questionnaire

Preliminary Results of Third Prevalence Survey of HCAI in England 2006 – Report for Department of Health, England
June 2007 Page 20 of 21

Preliminary Results of Third Prevalence Survey of HCAI in England 2006 – Report for Department of Health, England
June 2007 Page 21 of 21
Appendix 2 List of acknowledgements Prevalence Survey Steering Group Dr Robert Cunney Dr Eleri Davies Professor Brian Duerden Professor Michael Emmerson Joanne Enstone (Central Co-ordinator) Dr Fidelma Fitzpatrick Dr Adam Fraise Carole Fry Dr Marjory Greig Dr Tony Howard Professor Hilary Humphreys Martin Kiernan Gerard McIlvenny Dr Robert Newcombe Christine Perry Dr Judith Richards Dr Geoffrey Ridgway Dr Jacqui Reilly Dr Michael Simmons Dr Edward Smyth (HIS Lead) Dr Robert Spencer (Chairman) Regional co-ordinators Angeline Boorer Clare Court Liz Emmerson Rita Gallagher Jenny Hayward-Karlsson Alison Kitson Bridget Lees Dr Caroline Mitchell Rowan Slowther Anna Swann Kathy Topley Data management team (HIS, HISC and the Royal Hospitals, Belfast) Joanne Enstone Colin Lavelle Gerry McIlvenny Geraldine Reid Welsh Healthcare Associated Infection Programme team Dr Eleri Davies Susan Harris Dr Mari Morgan