report for the 1st quarter 2013
DESCRIPTION
Consolidated Report Pursuant to IFRS – as of March 31, 2013 (unaudited)TRANSCRIPT

Report for the 1st Quarter 2013Consolidated Report Pursuant to IFRS –
as of March 31, 2013 (unaudited)

2 Q UA R T E R Ly R E p O R T Q1. 2 013
Business Trends and Situation of the SINGULUS TECHNOLOGIES Group
ě Quarterly sales slightly above prior-year levelě EBIT slightly improved compared with the same period one year agoě Low order intake in the 1st quarter ě Positive development of the demand for Blu-ray production machinesě Development in the 1st quarter within expectationsě Marginally positive EBIT expected for the full-year 2013
As expected, the course of business was quiet in the 1st quarter of 2013. In the quarter under review, the SINGULUS TECHNOLOGIES Group achieved a slightly higher level of sales than in the prior year with sales of € 22.8 million (previous year: € 16.0 million). In comparison, the earnings before interest and taxes (EBIT) improved slightly to € -4.9 million (previous year: -5.7 million) as well. The order intake in the quarter under review came to € 15.6 million (1st quarter 2012: € 55.7 million). The order backlog declined since the year-end 2012 and stood at € 32.9 million (December 31, 2012: € 40.1 million).
Overall, the course of business was within our expectations in the 1st quarter 2013. The weak photovoltaics market as well as the seasonal trend in the Optical Disc segment had a significant impact on the development in the quarter under review.

Q UA R T E R Ly R E p O R T Q1. 2 013 3
Hollywood and the international movie industry have already released several successful movies to the market at the end of 2012 and the beginning of 2013. For example, this includes the new James Bond movie „Skyfall“ or the film adaptation of „The Hobbit: An Unexpected Journey“. This has a positive impact on the demand for Blu-ray Discs and DVDs. The past years’ consumer behavior shows that movies with big box office success result in very big demand for discs. The provision of content in 3D, which is only possible with a Blu-ray Disc, then makes the offer even more attractive. The number of available 3D Blu-ray titles has more than quintupled since 2010.
Optical Disc We are the only supplier worldwide offering production equipment for 50 gigabyte Blu-ray Discs.
In 2012, the global market for Blu-ray Discs with movie content continued to grow. Therefore, we see the general development of the market as positive for the following years and still expect good sales figures for our Blu-ray production machines. Except for Sony’s production facilities, SINGULUS TECHNOLOGIES provides all Blu-ray Disc manufacturers with BLULINE II production lines.
All in all, our project activities for Blu-ray Disc production equipment have slightly improved. Orders from Asia and the US were received in the past days and weeks.
For SINGULUS TECHNOLOGIES the further development of Nintendo, the expected market launch and the potentially resulting market success of a Microsoft Xbox with a built-in Blu-ray Disc drive are important. The reason is the importance of the Blu-ray Disc as a media resource for the relevant games and the resulting demand for additional production machines made by SINGULUS TECHNOLOGIES. It is expected that Sony will launch its next generation gaming console PS4 with a Blu-ray rive with 4K support to win the consumers’ favor.
ě HIGH-TECH WITH BLULINE IIFascination Blu-ray
4 Q UA R T E R Ly R E p O R T Q1. 2 013
by the year 2017. Analysts of the market research company IHS, however, still project that the global addition to photovoltaic modules will exceed 35,000 MW this year. This would correspond to a growth in quantity of around 12 % compared with the year 2012.
In the recent past SINGULUS TECHNOLOGIES was able to secure important key orders from Germany, Korea, India, South Africa and the US and to occupy a significant starting point for potential projects in the coming years in the Solar
From today’s point of view the sales market for machines for the production of photovoltaic cells will remain difficult for some time and is affected by a high insecurity. This way, the Analysts’ of the market research institute NPD Solarbuzz sees a decline in module sales in its most recent report. Accordingly, module sales are supposed to drop by an additional 20 % from US$ 25.5 billion in 2012 to US$ 20.5 billion in the current year 2013. In the following years the volume of sales is expected to rise once again to US$ 32 billion
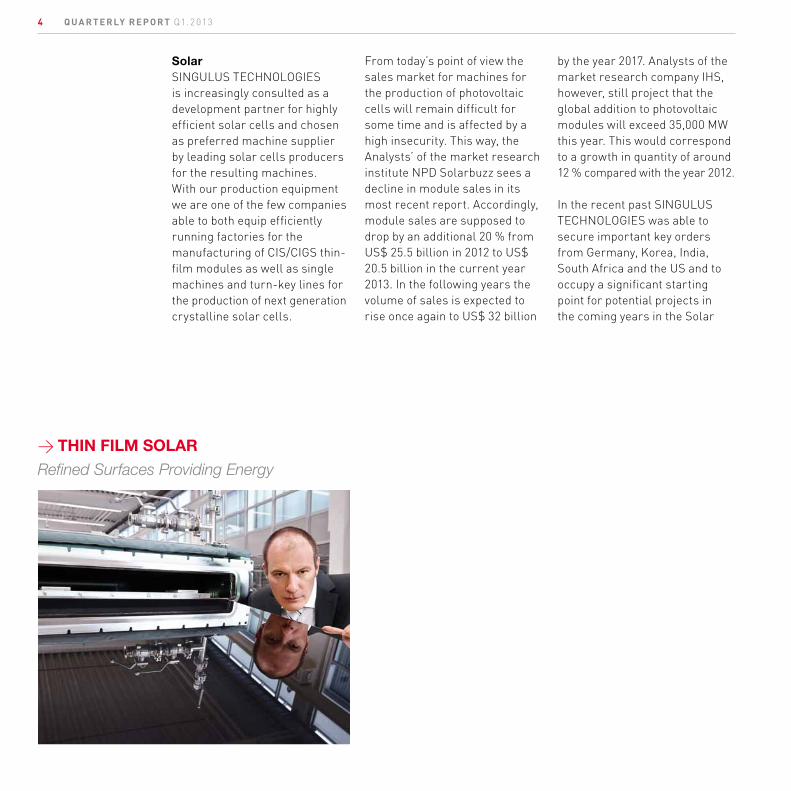
Solar SINGULUS TECHNOLOGIES is increasingly consulted as a development partner for highly efficient solar cells and chosen as preferred machine supplier by leading solar cells producers for the resulting machines.With our production equipment we are one of the few companies able to both equip efficiently running factories for the manufacturing of CIS/CIGS thin-film modules as well as single machines and turn-key lines for the production of next generation crystalline solar cells.
ě THIN FILM SOLARRefined Surfaces Providing Energy
Q UA R T E R Ly R E p O R T Q1. 2 013 5
division. On the basis of the newly-developed machines in the previous business years we will try to further strengthen our position as the leading technology supplier. Today, we are already regarded by respected market participants as the leading technology supplier for machines for the production of thin-film solar cells. This will bring SINGULUS TECHNOLOGIES in a position to be present with the leading designs and processing at important customers amidst a renewed pick-up in capital spending.
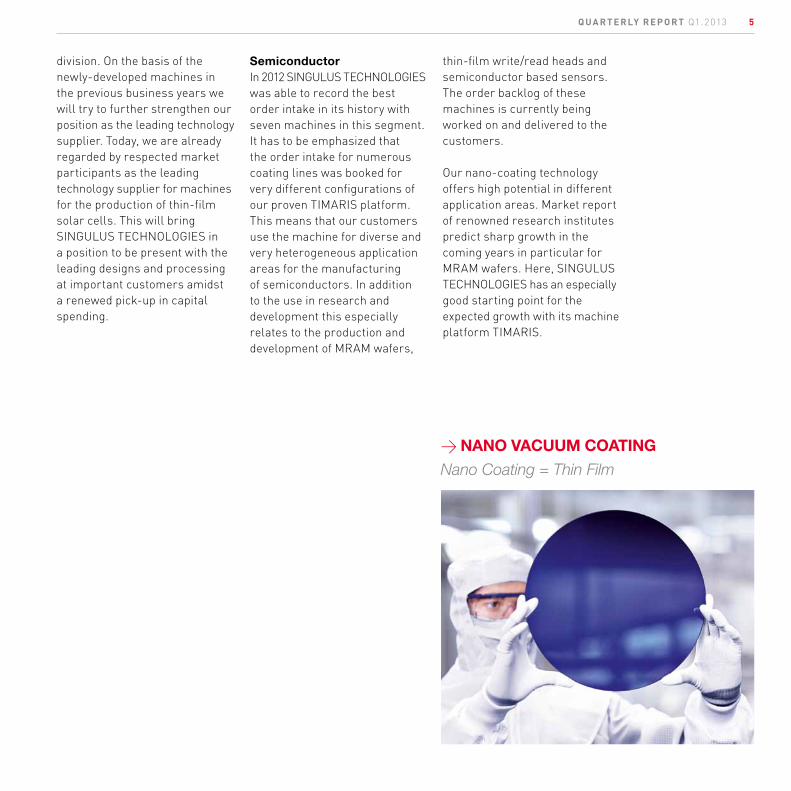
Semiconductor In 2012 SINGULUS TECHNOLOGIES was able to record the best order intake in its history with seven machines in this segment. It has to be emphasized that the order intake for numerous coating lines was booked for very different configurations of our proven TIMARIS platform. This means that our customers use the machine for diverse and very heterogeneous application areas for the manufacturing of semiconductors. In addition to the use in research and development this especially relates to the production and development of MRAM wafers,
ě NANO VACUUM COATINGNano Coating = Thin Film
thin-film write/read heads and semiconductor based sensors. The order backlog of these machines is currently being worked on and delivered to the customers.
Our nano-coating technology offers high potential in different application areas. Market report of renowned research institutes predict sharp growth in the coming years in particular for MRAM wafers. Here, SINGULUS TECHNOLOGIES has an especially good starting point for the expected growth with its machine platform TIMARIS.
6 Q UA R T E R Ly R E p O R T Q1. 2 013
Key financial figures
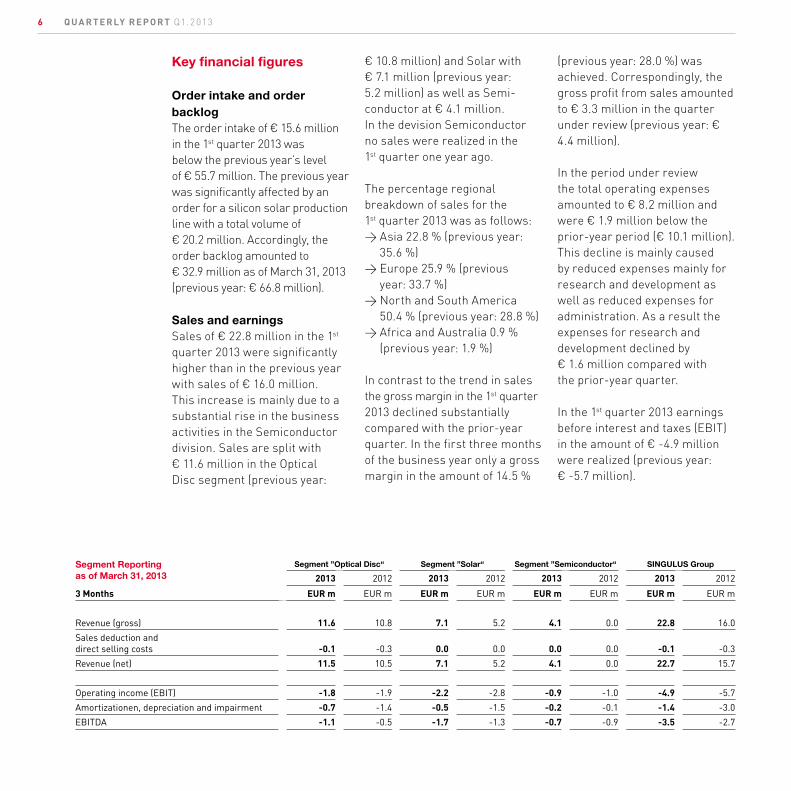
Order intake and order backlogThe order intake of € 15.6 million in the 1st quarter 2013 was below the previous year’s level of € 55.7 million. The previous year was significantly affected by an order for a silicon solar production line with a total volume of € 20.2 million. Accordingly, the order backlog amounted to € 32.9 million as of March 31, 2013 (previous year: € 66.8 million).
Sales and earningsSales of € 22.8 million in the 1st quarter 2013 were significantly higher than in the previous year with sales of € 16.0 million. This increase is mainly due to a substantial rise in the business activities in the Semiconductor division. Sales are split with € 11.6 million in the Optical Disc segment (previous year:
€ 10.8 million) and Solar with € 7.1 million (previous year: 5.2 million) as well as Semi- conductor at € 4.1 million. In the devision Semiconductor no sales were realized in the 1st quarter one year ago.
The percentage regional breakdown of sales for the 1st quarter 2013 was as follows:ě Asia 22.8 % (previous year: 35.6 %)ě Europe 25.9 % (previous year: 33.7 %)ě North and South America 50.4 % (previous year: 28.8 %)ě Africa and Australia 0.9 % (previous year: 1.9 %)
In contrast to the trend in sales the gross margin in the 1st quarter 2013 declined substantially compared with the prior-year quarter. In the first three months of the business year only a gross margin in the amount of 14.5 %
(previous year: 28.0 %) was achieved. Correspondingly, the gross profit from sales amounted to € 3.3 million in the quarter under review (previous year: € 4.4 million).
In the period under review the total operating expenses amounted to € 8.2 million and were € 1.9 million below the prior-year period (€ 10.1 million). This decline is mainly caused by reduced expenses mainly for research and development as well as reduced expenses for administration. As a result the expenses for research and development declined by € 1.6 million compared with the prior-year quarter.
In the 1st quarter 2013 earnings before interest and taxes (EBIT) in the amount of € -4.9 million were realized (previous year: € -5.7 million).
Segment Reporting as of March 31, 2013
3 Months
Segment ”Optical Disc“ Segment ”Solar“ Segment ”Semiconductor“ SINGULUS Group
2013 2012 2013 2012 2013 2012 2013 2012
EUR m EUR m EUR m EUR m EUR m EUR m EUR m EUR m
Revenue (gross) 11.6 10.8 7.1 5.2 4.1 0.0 22.8 16.0
Sales deduction and
direct selling costs -0.1 -0.3 0.0 0.0 0.0 0.0 -0.1 -0.3
Revenue (net) 11.5 10.5 7.1 5.2 4.1 0.0 22.7 15.7
Operating income (EBIT) -1.8 -1.9 -2.2 -2.8 -0.9 -1.0 -4.9 -5.7
Amortizationen, depreciation and impairment -0.7 -1.4 -0.5 -1.5 -0.2 -0.1 -1.4 -3.0
EBITDA -1.1 -0.5 -1.7 -1.3 -0.7 -0.9 -3.5 -2.7
Q UA R T E R Ly R E p O R T Q1. 2 013 7
as well as acquired technology from the acquisition of the Blu-ray Disc activities of the Oerlikon Balzer AG in the amount of € 0.3 million. In addition, the accounts receivable due in more than 12 months declined by € 0.6 million to € 2.9 million in the quarter under review (previous year: € 3.5 million). Property, plant and equipment showed a contrasting trend. They rose by € 0.9 million to € 8.4 million (previous year: € 7.5 million). This is mainly due to the transfer of a development machine from capitalized development expenses to property, plant and equipment. The capital expenditure in property, plant and equipment remained around the prior- year level and amounted to € 0.2 million in the 1st quarter of 2013 (previous year: € 0.1 million). Most of the spending was used for replacement investments.
Balance Sheet and Liquidity The long-term assets amounted to € 52.7 million and were therefore slightly below the level as of December 31, 2012 (€ 53.4 million). The capitalized development expenses amounted to € 6.7 million (previous year: € 7.1 million). In the first three months of 2013 the investments in developments totaled € 1.1 million (previous year: € 0.9 million). Scheduled write-offs and amortization on capitalized development expenses amounted to € 0.5 million in the quarter under review (previous year: € 1.5 million). In the quarter under review the other intangible assets dropped by € 0.6 million. This change is mainly due to periodic write-offs on the acquired customer base
Current assets declined by € 14.4 million during the period under review. Background is a decline in cash and cash equivalents in the amount of € 11.8 million due to the payout of the interests of the bond (€ -4.7 million) and the negative result for the quarter. Furthermore, accounts receivable declined by € 3.4 million in connection with the lower business activities. Inventories decreased by € 2.3 million within the first three months of the business year and stood at € 43.8 million overall as of March 31, 2013. In contrast, receivables due to production orders (€ +1.5 million) and other receivables and assets (€ +1.6 million) increased.

8 Q UA R T E R Ly R E p O R T Q1. 2 013
The short-term liabilities declined by € 8.1 million compared with the year-end level of 2012. Specifically, short-term financing liabilities from the issue of the corporate bond declined by € 3.5 million. This is in connection with the payment of the coupon as of March 23, 2013 in the amount of € 4.7 million. Furthermore, liabilities from production orders dropped by € 3.3 million, accounts receivable by € 2.0 million and the other short-term liabilities by € 1.1 million. In contrast, the prepayments received increased by € 1.4 million.
As of the balance sheet date the long-term liabilities amounted to € 76.6 million and thus remained around the prior-year level (previous year: € 78.0 million).
Shareholders’ equityThe shareholders’ equity in the Group declined by € 5.6 million in the quarter under review and stood at € 68.9 million as of March 31, 2013 (previous year: € 74.5 million). Equity in the amount of € 67.9 million is attributable to the shareholders of the parent company and € 1.0 million to minorities. Accordingly, the equity ratio amounts to nearly unchanged 36.0 % (previous year: 36.1 %). Cash FlowIn the 1st quarter of 2013 the operating cash flow of the Group of € -5.1 million was negative and thus substantially lower than the prior-year level (previous year: € -0.1 million). Due to the issue of the corporate bond in March 2012 the cash flows from investing activities and from financing activities differ materially from the prior-year levels. The cash flow from investing activities of € 8.7 million (previous year: € -52.0 million)
was impacted by the change in cash and cash equivalents with a maturity exceeding three months in the amount of € 10.0 million. In the prior-year period the item was negative at € 50.0 million in connection with the deposit of term money from the issue of the corporate bond. The cash flow from financing activities amounted to € -5.5 million in the first quarter 2013 and was characterized by the payment of interest for the corporate bond (€ 4.7 million). In the previous year, the cash flow from financing activities amounted to € 58.0 million due to the cash inflow from the issue of the bond. Overall, funds in the cash flow statement declined by € 1.8 million. Cash and cash equivalents in the balance sheet dropped by € 11.8 million.

Q UA R T E R Ly R E p O R T Q1. 2 013 9
Research and developmentAt € 2.0 million the expenditures for research and development in the first three months of 2013 were slightly above the prior-year level (previous year: € 1.7 million).
EmployeesThe number of employees in the SINGULUS Group decreased by 16 employees from 400 employees as of December 31, 2012 to 384 employees as of March 31, 2013.
Changes in the Executive and Supervisory Boards There were no changes of the members of the Executive and Supervisory Boards in the period under review.
Risk Report During the first three months of the business year 2013 there were no changes regarding the risks depicted in the Annual Report for the year 2012.
Development of costs and pricesFrom our perspective the selling prices developed as planned in the 1st quarter of the business year. Material and personnel expenses also developed according to our budgets. However, the price situation in the Solar segment strongly depends on the future developments of demand in this market.
The SINGULUS Stock The low of the SINGULUS TECHNOLOGIES shares was in November 2012 at a level just above the € 1.00 mark. From there the stock was able to considerably recover once again. The shares of SINGULUS TECHNOLOGIES closed the year 2012 with a closing price of € 1.39. At the beginning of January the stock price rose to more than € 1.60, but dropped to € 1.40 subsequently to recover to nearly € 1.60 at the end of February once again. As of March 28, 2013 the SINGULUS stock closed at € 1.28. Accordingly, SINGULUS TECHNOLOGIES had a market capitalization of approximately € 63 million.
10 Q UA R T E R Ly R E p O R T Q1. 2 013
Corporate bondOn March 26, with approval of the Supervisory Board the Executive Board of the SINGULUS TECHNOLOGIES resolved the extension of the buy-back program, which was initiated on December 11, 2012 and expired on March 31, 2013, from March 31, 2013 to June 30, 2013 for the bonds issued on March 23, 2012. The total volume of buy-back program remains restricted to € 3.0 million at maximum. The other conditions of the program remain unchanged.
SINGULUS TECHNOLOGIES had successfully placed its first corporate bond in Germany, Austria and Luxembourg as well as through a private placement in bordering countries in 2012. The issue volume of € 60 million was already achieved on the first subscription day, March 12, 2012, thanks to strong demand. The corporate bond has an annual coupon of 7.75 % and a term to maturity of five years. The bond was in demand by institutional as well as private investors. On March 14, 2012, trading at the Open Market of Deutsche Börse AG in the “Entry Standard for Bonds” segment at the Frankfurt Stock Exchange commenced. The corporate bonds’ identifiers are: ISIN: DE000A1MASJ4 / A1MASJ. Issue and value date was March 23, 2012.
Outlook for the business year 2013
SINGULUS TECHNOLOGIES is a technology leader with its machines and equipment in the three applications areas Optical Disc, Semiconductor and Solar. We are currently anticipating to once again grow sales in these segments in 2013 compared with 2012 and expect to complete the business year in the Group with an overall slightly positive operating result (EBIT). Including financing expenses a negative full-year result for the Group pursuant to IFRS would be incurred. However, for this, we project a significant sales growth in the Solar division. Within the segments Optical Disc and Semiconductor we anticipate a modest increase in sales.

Q UA R T E R Ly R E p O R T Q1. 2 013 11
At the same time we analyze the markets and review specific acquisition opportunities for the targeted strengthening of our product range. With the successful implementation of this strategy we expect to return to a growth path.
Adverse developments in our core markets could have a dampening effect. If the still current investment restraint for production equipment in the solar market continues, this will not take place without corresponding impacts on the earnings targets of the company.
To strengthen the existing business areas we develop targeted products and thus open new application areas as well as corresponding new markets. Accordingly, the strategic further development of the existing product portfolio is in the focus for the business year 2013. With this and planned growth in the segments Solar and Semiconductor, the dependency on Optical Disc will be further reduced and the earnings power for the future strengthened. We expand our product portfolio on the basis of our core competencies with self- developed machines and equipment and also intensify our efforts for organic growth.
Although the cost structures were adjusted in 2012 in particular by capacity adjustments, a more negative development than expected and the resulting adjustments of the company’s long-term plans especially in the Solar division, would also make additional write-offs necessary. Furthermore, the company’s result in 2013 will be significantly impacted by the sales success of our machines for the Blu-ray production.
Yours sincerely,
The Executive BoardSINGULUS TECHNOLOGIES AG

12 Q UA R T E R Ly R E p O R T Q1. 2 013
Consolidated Balance Sheet as of March 31, 2013 and December 31, 2012 (IFRS unaudited)
03/31/2013 12/31/2012
[in millon €] [in millon €]
Cash and cash equivalents 44.1 55.9
Trade receivables 19.6 23.0
Receivables from construction contracts 4.9 3.4
Other receivables and other assets 26.3 24.7
Total receivables and other assets 50.8 51.1
Raw materials, consumables and supplies 18.7 20.0
Work in process 25.1 26.1
Total inventories 43.8 46.1
Total current assets 138.7 153.1
Trade receivables 2.9 3.5
Borrowings 3.7 3.7
Property, plant and equipment 8.4 7.5
Capitalized development costs 6.7 7.1
Goodwill 21.7 21.7
Other intangible assets 8.3 8.9
Deferred tax assets 1.0 1.0
Total non-current assets 52.7 53.4
Total assets 191,4 206,5
ASSETS

Q UA R T E R Ly R E p O R T Q1. 2 013 13
Consolidated Balance Sheet as of March 31, 2013 and December 31, 2012 (IFRS unaudited)
03/31/2013 12/31/2012
[in millon €] [in millon €]
Cash and cash equivalents 44.1 55.9
Trade receivables 19.6 23.0
Receivables from construction contracts 4.9 3.4
Other receivables and other assets 26.3 24.7
Total receivables and other assets 50.8 51.1
Raw materials, consumables and supplies 18.7 20.0
Work in process 25.1 26.1
Total inventories 43.8 46.1
Total current assets 138.7 153.1
Trade receivables 2.9 3.5
Borrowings 3.7 3.7
Property, plant and equipment 8.4 7.5
Capitalized development costs 6.7 7.1
Goodwill 21.7 21.7
Other intangible assets 8.3 8.9
Deferred tax assets 1.0 1.0
Total non-current assets 52.7 53.4
Total assets 191,4 206,5
03/31/2013 12/31/2012
[in millon €] [in millon €]
Trade payables 5.8 7.8
Current bank liabilities 3.0 2.5
Prepayments received 5.1 3.7
Liabilities from construction contracts 12.8 16.1
Current financial liabilities from the issuance of bonds 0.1 3.6
Other current liabilities 11.6 12.7
Provisions for restructuring measures 5.0 5.1
Provisions for taxes 0.2 0.3
Other provisions 2.3 2.2
Total current liabilities 45.9 54.0
Non-current financial liabilities from the issuance of bonds 57.8 58.3
Non-current bank liabilities 1.0 1.7
Provisions for restructuring measures 7.3 7.5
Pension provisions 10.5 10.5
Total non-current liabilities 76.6 78.0
Total liabilities 122.5 132.0
Subscribed capital 48.9 48.9
Capital reserves 77.2 77.2
Reserves* 2.4 2.2
Retained earnings* -60.6 -54.8
Equity attributable to owners of the parent 67.9 73.5
Non-controlling interests 1.0 1.0
Total equity and liabilities 68.9 74.5
Summe passiva 191.4 206.5
* Prior-year figures adjusted
LIABILITIES

14 Q UA R T E R Ly R E p O R T Q1. 2 013
Consolidated Income Statement as of March 31, 2013 and 2012 (IFRS unaudited)
03/31/2013 03/31/2012
[in milion !] [in %] [in milion €] [in %]
Revenue (gross) 22.8 100.4 16.0 101.9
Sales deductions and direct selling costs -0.1 -0.4 -0.3 -1.9
Revenue (net) 22.7 100.0 15.7 100.0
Cost of sales -19.4 -85.5 -11.3 -72.0
Gross profit on sales 3.3 14.5 4.4 28.0
Research and development -1.6 -7.0 -3.2 -20.4
Sales and customer service -4.0 -17.6 -4.1 -26.1
General administration -2.4 -10.6 -2.8 -17.8
Other operating expenses -0.5 -2.2 -1.6 -10.2
Other operating income 0.3 1.3 1.6 10.2
Total operating expenses -8.2 -36.1 -10.1 -64.3
Operating result (EBIT) -4.9 -21.6 -5.7 -36.3
Finance income 0.6 2.6 0.2 1.3
Finance costs -1.4 -6.2 -0.3 -1.9
EBT -5.7 -25.1 -5.8 -36.9
Tax expenses/income -0.2 -0.9 1.1 7.0
profit or loss for the period -5.9 -26.0 -4.7 -29.9
Thereof attributable to: - Owners of the parent -5.8 -4.7
Non-controlling interests -0.1 0.0
[in !] [in €]
Basic earnings per share based on the result for the period (in EUR)attributable to owners of the parent -0.12 -0.10
Diluted earnings per share based on the result for the period (in EUR)attributable to owners of the parent -0.12 -0.10
Basic number of shares, pieces 48,930,314 48,930,314
Diluted number of shares, pieces 48,930,314 48,930,314

Q UA R T E R Ly R E p O R T Q1. 2 013 15
Consolidated Income Statement as of March 31, 2013 and 2012 (IFRS unaudited)
Consolidated Statement of Changes in Equityas of March 31, 2013 and 2012 (IFRS unaudited)
Equity attributable to owners
of the parent
Non-
controlling
interests Equity
Subscribedcapital
[in milion €]
Capitalreserves
[in milion €]
Currencytranslation
reserves [in milion €]
Hedgeaccountingreserves
[in milion €]
Actuarial gains and losses
from pension plans*
[in milion €]
Other retained earnings
[in milion €]Total
[in milion €]
[in milion €]
[in milion €]
As of January 1, 2012 48.9 77.2 1.4 -0.1 0.1 8.2 135.7 2.3 138.0
Profit or loss for the period 0.0 0.0 0.0 0.0 0.0 -4.7 -4.7 0.0 -4.7
Other comprehensive income 0.0 0.0 -0.9 0.0 0.0 0.0 -0.9 0.0 -0.9
Total comprehensive income 0.0 0.0 -0.9 0.0 0.0 -4.7 -5.6 0.0 -5.6
As of March 31, 2012 48.9 77.2 0.5 -0.1 0.1 3.5 130.1 2.3 132.4
As of January 1, 2013 48.9 77.2 2.2 0.0 -1.9 -52.9 73.5 1.0 74.5
Profit or loss for the period 0.0 0.0 0.0 0.0 0.0 -5.8 -5.8 -0.1 -5.9
Other comprehensive income 0.0 0.0 0.2 0.0 0.0 0.0 0.2 0.1 0.3
Total comprehensive income 0.0 0.0 0.2 0.0 0.0 -5.8 -5.6 0.0 -5.6
As of March 31, 2013 48.9 77.2 2.4 0.0 -1.9 -58.7 67.9 1.0 68.9
* Prior-year figures adjusted
Consolidated Statement of Comprehensive Incomeas of March 31, 2013 and 2012 (IFRS unaudited)
03/31/2013 03/31/2012
[in milion €] [in milion €]
profit or loss for the period -5.9 -4.7
Exchange differences in the fiscal year 0.3 -0.9
Total other comprehensive income 0.3 -0.9
Total comprehensive income -5.6 -5.6
Thereof attributable to:
Owners of the parent -5.6 -5.6
Non-controlling interests 0.0 0.0
16 Q UA R T E R Ly R E p O R T Q1. 2 013
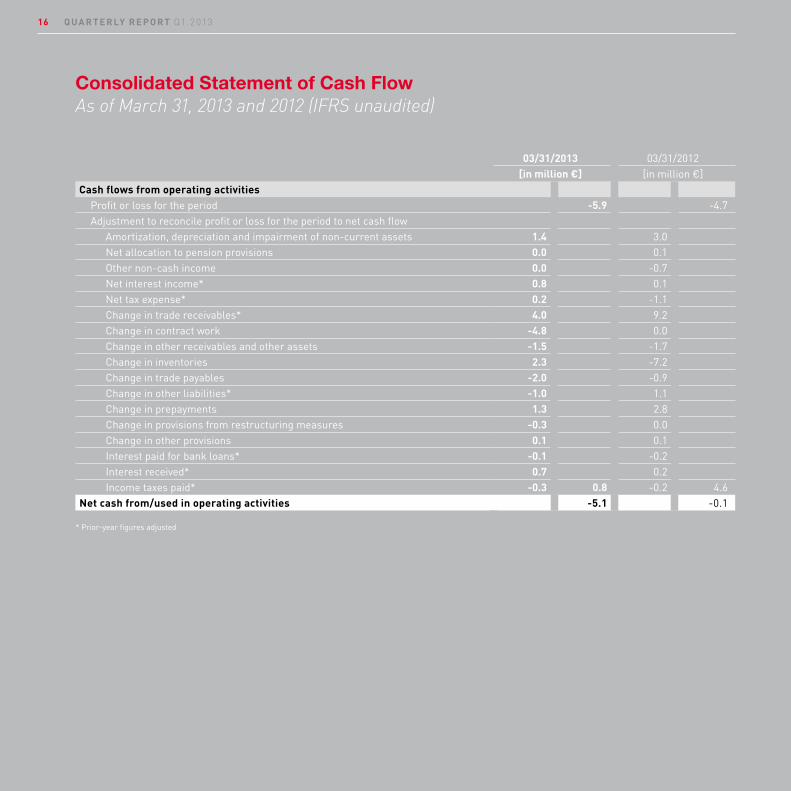
Consolidated Statement of Cash FlowAs of March 31, 2013 and 2012 (IFRS unaudited)
03/31/2013 03/31/2012
[in million €] [in million €]
Cash flows from operating activities Profit or loss for the period -5.9 -4.7
Adjustment to reconcile profit or loss for the period to net cash flow
Amortization, depreciation and impairment of non-current assets 1.4 3.0
Net allocation to pension provisions 0.0 0.1
Other non-cash income 0.0 -0.7
Net interest income* 0.8 0.1
Net tax expense* 0.2 -1.1
Change in trade receivables* 4.0 9.2
Change in contract work -4.8 0.0
Change in other receivables and other assets -1.5 -1.7
Change in inventories 2.3 -7.2
Change in trade payables -2.0 -0.9
Change in other liabilities* -1.0 1.1
Change in prepayments 1.3 2.8
Change in provisions from restructuring measures -0.3 0.0
Change in other provisions 0.1 0.1
Interest paid for bank loans* -0.1 -0.2
Interest received* 0.7 0.2
Income taxes paid* -0.3 0.8 -0.2 4.6
Net cash from/used in operating activities -5.1 -0.1
* Prior-year figures adjusted
Q UA R T E R Ly R E p O R T Q1. 2 013 17
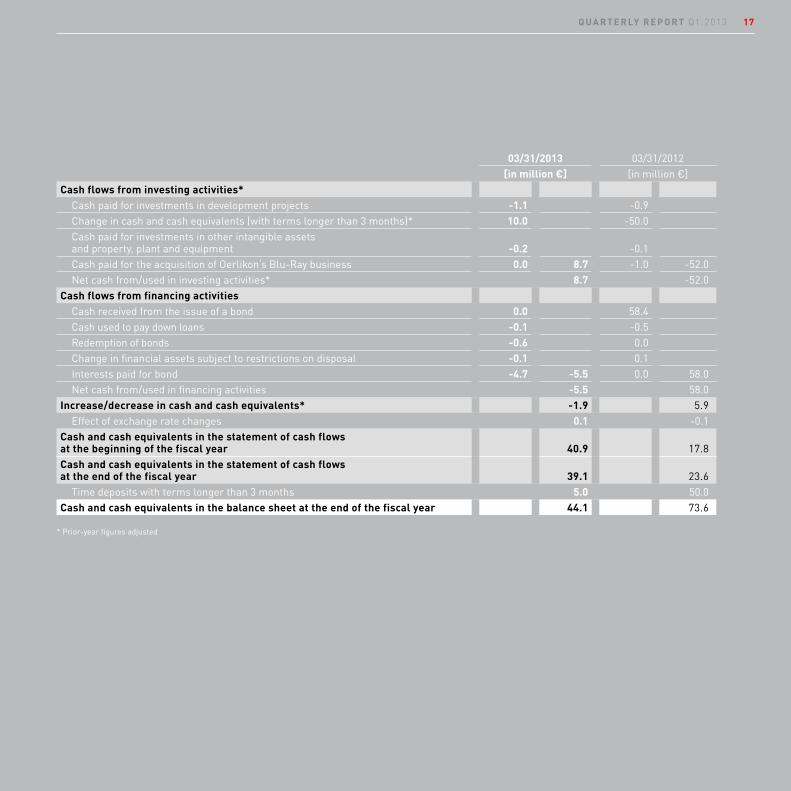
Consolidated Statement of Cash FlowAs of March 31, 2013 and 2012 (IFRS unaudited)
03/31/2013 03/31/2012
[in million €] [in million €]
Cash flows from investing activities* Cash paid for investments in development projects -1.1 -0.9
Change in cash and cash equivalents (with terms longer than 3 months)* 10.0 -50.0
Cash paid for investments in other intangible assets
and property, plant and equipment -0.2 -0.1
Cash paid for the acquisition of Oerlikon‘s Blu-Ray business 0.0 8.7 -1.0 -52.0
Net cash from/used in investing activities* 8.7 -52.0
Cash flows from financing activities Cash received from the issue of a bond 0.0 58.4
Cash used to pay down loans -0.1 -0.5
Redemption of bonds -0.6 0.0
Change in financial assets subject to restrictions on disposal -0.1 0.1
Interests paid for bond -4.7 -5.5 0.0 58.0
Net cash from/used in financing activities -5.5 58.0
Increase/decrease in cash and cash equivalents* -1.9 5.9
Effect of exchange rate changes 0.1 -0.1
Cash and cash equivalents in the statement of cash flowsat the beginning of the fiscal year 40.9 17.8
Cash and cash equivalents in the statement of cash flowsat the end of the fiscal year 39.1 23.6
Time deposits with terms longer than 3 months 5.0 50.0
Cash and cash equivalents in the balance sheet at the end of the fiscal year 44.1 73.6
* Prior-year figures adjusted
18 Q UA R T E R Ly R E p O R T Q1. 2 013
Notes to the interim results (unaudited)
The SINGULUS TECHNOLOGIES Aktiengesellschaft (hereinafter also “SINGULUS” or the “Company”) is an exchange-listed stock corporation domiciled in Germany. The consolidated financial accounts presented for the interim reporting of the SINGULUS TECHNOLOGIES AG and its subsidiaries (the “Group”) for the first three months of the business year 2013 were approved for publication by decision of the Executive Board as of May 7, 2013.
The consolidated financial accounts were drawn up in euros (€). If not stated otherwise, all figures are in millions of euros (million €). Due to statements in million € differences in rounding may occur.
Accounting and valuation principlesThe preparation of the abbreviated consolidated interim results for the period from January 1 to March 31, 2013 was made pursuant to IAS 34 “Interim Financial Reporting”. The abbreviated consolidated interim results do not include all of the notes and information required for the reporting for the full business year and should be read in conjunction with the consolidated financial accounts as of December 31, 2012.
The preparation of the annual results pursuant to IAS 34 requires estimates and assumptions by the management, affecting the level of the reported assets, liabilities, income, expenses as well as contingent liabilities. These assumptions and estimates mainly affect the Group- consistent determination of useful life expectancy, the write-offs of assets, the valuation of provisions, the
recoverability of receivables, the determination of realizable terminal values in the area of inventories as well as the realizability of future tax relieves. The actual values can differ from the assumptions and estimates made on a case by case basis. Changes are recognized affecting earnings at the time of the knowledge gained.
The accounting and valuation methods applied in the consolidated accounts for the interim reporting correspond to those applied for the most recent consolidated financial report as of the end of the business year 2012. For a detailed description of the accounting principles please refer to the notes of the consolidated financial statements of our Annual Report 2012.
In June 2011 the IASB published changes of IAS 19 - Employee Benefits - which were adopted by the EU in June 2012. The changes of IAS 19 are principally mandatorily applicable with retrospective effect for accounts for the business commencing on or after January 1, 2013. The Group adjusted the reported prior-year figures for the effects from the changes of IAS 19.
For the valuation of the provisions for pensions the Group has so far applied the corridor approach. The abolishment of the corridor method due to the changed IAS 19 has an effect on the actuarial gains and losses directly in the balance sheet and resulted in an increase in the provisions for pensions in the amount of € 2.7 million as well as a reduction of the shareholders’ equity in the same amount. The consolidated profit and loss statements will be unaffected by actuarial gains and losses in the future, since they are included in the other result from now on.

Q UA R T E R Ly R E p O R T Q1. 2 013 19
With the reporting as of December 31, 2012 term deposits with a maturity of more than three months were no longer reported as a component of the funds in the cash flow statements pursuant to IAS 7.7. The changes in term deposits with a remaining term to maturity exceeding three months are separately reported since then within the cash flow from investing activities. Correspondingly, below the cash flow statements a transition towards cash and cash equivalents in the balance sheet was included. In addition, with the reporting as of December 31, 2012 interest payments made and received (IAS 7.31) as well as cash flow from income taxes (IAS 7.35) were separately reported. Pursuant to IAS 8.42 the respective figures for the year 2012 were adjusted accordingly.
Scope of consolidationIn addition to the SINGULUS TECHNOLOGIES AG the consolidated financial statements include all companies, which are legally or factually controlled by the company. In the interim report as of March 31, 2013, in addition to the SINGULUS TECHNOLOGIES AG in total one domestic and 13 foreign subsidiaries were included.
No companies have been added or deleted from the scope of consolidation in the current business year.
Accounts receivableThe accounts receivable as of March 31, 2013 are split as follows:
Intangible assetsCapitalized development expenses, goodwill, customer bases as well as concessions, intellectual property rights and other intangibles are included under intangible assets.
As of March 31, 2013, the capitalized development expenses amounted to € 6.7 million (December 31, 2012: € 7.1 million). In the first three months of 2013 the investments in developments for new products totaled € 1.1 million (previous year: € 0.9 million). Scheduled write-offs and amortization on capitalized development expenses amounted to € 0.5 million (previous year: € 1.5 million).
Property, plant & equipmentIn the first three months of the business year 2013 € 0.2 million were invested in property, plant & equipment (previous year: € 0.1 million). During the same period scheduled depreciation amounted to € 0.4 million (previous year: € 0.4 million).
03/31/2013 12/31/2012
million € million €
Accounts receivable –short-term 24.5 27.4
Receivables from production orders 4.9 3.4
Accounts receivable –long-term 2.9 4.1
less write-offs -4.9 -5.0
27.4 29.9

20 Q UA R T E R Ly R E p O R T Q1. 2 013
Contingent liabilities and other financial obligationsAt the end of the quarter under review the contingent liabilities and other financial obligations not included in the consolidated accounts amount to € 47.8 million (December 31, 2012: € 47.6 million) and mainly include rent and leasing obligations (€ 28.5 million), guarantees for prepayments received (€ 15.7 million) as well as guarantees (€ 2.9 million). The Executive Board does not have knowledge about facts that could have a materially adverse impact on the business operations, the financial situation or the business results of the company.
Geographical breakdown of sales
Sales reductions and individual selling expensesThe sales reductions include cash discounts granted. The individual selling expenses are mainly composed of expenses for packaging, freight and commissions.
General administrative expensesThe administrative expenses include the expenses for the management, personnel expenses, the finance and accounting departments as well as the corresponding expenses for rent and company cars. Furthermore, they include the ongoing IT expenses, legal and consulting fees, expenses for investor relations activities, the Annual General Meeting as well as the annual financial statements.
Research and development expensesIn addition to the research and non-capitalizable development expenses, the research and development expenses in the 1st quarter of 2013 also include the scheduled amortization of capitalized development expenses in the amount of € 0.5 million (previous year: € 1.5 million).
Financial income and financing expensesThe interest income/ expenses are composed as follows:
Financial instrumentsAttributable time valueCash and cash equivalents and trade payables are generally due in the short term. The balance sheet figures approximate the fair values. The same applies for trade receivables and other assets.
The fair values of non-current trade receivables correspond to the present values of the payments relating to the assets taking into account the corresponding interest parameters.
Geographical informationas of March 2013
GermanyRest ofEurope
North andSouth
America AsiaAfrica &
Australia
million € million € million € million € million €
Sales bycountry of origin 16.7 1.2 4.3 0.6 0.0
by country of destination 2.9 3.0 11.5 5.2 0.2
Geographical informationas of March 2012
GermanyRest ofEurope
North andSouth
America AsiaAfrica &
Australia
million € million € million € million € million €
Sales bycountry of origin 10.9 1.6 2.8 0.7 0.0
by country of destination 2.1 3.3 4.6 5.7 0.3
03/31/2013 03/31/2012
million € million €
Interest income from long-term customer claims 0.4 0.2
Interest income from time deposits/ sight deposits 0.2 0.0
Financing expenses -1.4 -0.3
-0.8 -0.1

Q UA R T E R Ly R E p O R T Q1. 2 013 21
Forward exchange contracts are measured using the ECB reference rates for spot currency and the valid forward exchange rates of the respective commercial bank for forward currency.
The fair value of the exchange-listed bond equals the market price as of the balance sheet date plus the carrying amount of accrued interest liabilities as of the balance sheet date.
The fair values of the liabilities to banks correspond to the amounts repayable on the bank loans as of the balance sheet date.
The maximum credit risk is reflected in the carrying amounts of the financial assets and liabilities.
The following table displays the book values and the corresponding time values of all financial instruments included in the consolidated financial statement by class.
Valuation category
Book value Attributable time value
03/31/2013 12/31/2012 03/31/2013 12/31/2012
million ! million € million ! million €
Financial assets
Cash and cash equivalents L&R 44.1 55.9 44.1 55.9
Borrowings L&R 3.7 3.7 3.7 3.7
Other assets L&R 17.7 17.6 17.7 17.6
Derivatives Hedging derivatives FAHfT 0.1 0.1 0.1 0.1
Accounts receivable L&R 22.5 26.5 22.5 26.5
Receivables from production orders L&R 4.9 3.4 4.9 3.4
Financial liabilities
Corporate bond FLAC 57.9 61.9 44.9 47.8
Loans with variable interest rate FLAC 4.0 4.2 4.0 4.2
Derivatives Hedging derivatives HD 0.0 0.0 0.0 0.0
Other derivatives FLHfT 0.0 0.0 0.0 0.0
Accounts payable FLAC 5.8 7.8 5.8 7.8
Off-balance sheet instrumentsLoan commitments to customers 1.5 1.5 1.5 1.5
Total L&R 92.9 107.1 92.9 107.1
Total FAHfT 0.1 0.1 0.1 0.1
Total FLAC 67.7 73.9 54.7 59.8
Total FAHfT 0.0 0.0 0.0 0.0
Total HD 0.0 0.0 0.0 0.0
Annotations to the abbreviations:
L&R: Loans and Receivables FAHfT: Financial Assets Held for Trading
FLAC: Financial Liabilities Measured at Amortised CostFLHfT: Financial Liabilities Held for TradingHD Hedging derivatives

22 Q UA R T E R Ly R E p O R T Q1. 2 013
Hierarchy of attributable time valuesThe Group applies the following hierarchy for the calculation and reporting of the corresponding time values of financial instruments as per valuation method:
Level 1: listed (unadjusted) prices on active markets for similar assets or liabilities,
Level 2: methods, in which all input parameters which have a material impact on the calculated attributable time value, can be observed directly or indirectly,
Level 3: methods, which use input parameters, which have a material impact on the calculated attributable time value and which are not based on observable market data.
Assets, which are valued at the attributable time value:
As of March 31, 2013 Level 1 Level 2 Level 3
Attributable time value of financial assets that are earnings relevant million ! million ! million ! million !
Foreign exchange contracts – hedging 0.1 - 0.1 -
As of December 31, 2012 Level 1 Level 2 Level 3
Attributable time value of financial assets that are earnings relevant million € million € million € million €
Foreign exchange contracts – hedging 0.1 - 0.1 -
As of March 31, 2013 Level 1 Level 2 Level 3
Attributable time value of financial liabilities that are earnings relevant million ! million ! million ! million !
Foreign exchange contracts – hedging 0.0 - 0.0 -
As of December 31, 2012 Level 1 Level 2 Level 3
Attributable time value of financial liabilities that are earnings relevant million € million € million € million €
Foreign exchange contracts – hedging 0.0 - 0.0 -
Liabilities, which are valued at the attributable time value:

Q UA R T E R Ly R E p O R T Q1. 2 013 23
Earnings per shareFor the calculation of the diluted earnings per share the earnings attributable to the bearers of the common shares of the parent company are divided by the weighted average number of common shares in circulation during the period under review in addition to the weighted average number of shares resulting from the conversion of all potential common shares with dilution effect into common shares. Dilution effects were neither recorded in the quarter under review nor in the same period one year ago.In the period from the balance sheet date until the drawing up of the consolidated financial statements there were no additional transactions of common shares or potential common shares.
Events after the Balance Sheet DateThere were no events with material impact after the completion of the quarter under review.
Shareholdings of Board members As of the balance sheet date, the members of the Executive and Supervisory Boards of the SINGULUS TECHNOLOGIES AG held the following number of shares, convertible bonds and stock options:
The following members of the Supervisory Board are shareholders of the company:
Furthermore, at the end of the quarter under review members of the Executive Board had themselves purchased the following number of shares of the SINGULUS TECHNOLOGIES AG:
Affirmation of the Legal Representatives“We asset to our best knowledge and belief that pursuant to the applicable accounting principles for the interim financial reporting the consolidated financial statements reflect the true situation of the asset, financial and earnings situation of the Group. The consolidated interim status report depicts the course of business including the financial results and the situation of the Group in a way reflecting the true situation and describing the material opportunities and risks of the foreseeable developments of the Group during the remainder of the business year.”
Kahl am Main, in May 2013
The Executive Board
03/31/2013shares
Dr.-Ing. Stefan Rinck 9,619
Markus Ehret 7,000
16,619
03/31/2013shares
Dr.-Ing. Wolfhard Leichnitz 39,344

Future-oriented statementsand forecasts
This report contains future-oriented statementsbased on the current expectations, assessmentsand forecasts of the Executive Board as well ason the currently available information to them.Known as well as unknown risks, uncertaintiesand impacts could cause the actual results,the financial situation or the development todiffer from the statements made in this report.We assume no obligation to update the future- oriented statements made in this report.
Corporate Calendar2013
May May 8 Q1/2013 Report
June June 6 Annual Press Conference
August August 13 Q2/2013 Report
November November 12 Q3/2013 Report
SINGULUS TECHNOLOGIES AG Hanauer Landstrasse 103 D-63796 Kahl am Main Phone +49 6188 440-0 Fax +49 6188 440-110 Internet: www.singulus.de
Investor Relations Maren Schuster Phone +49 6188 440-612 Fax +49 6188 440-110 [email protected]
Me
ta
Co
m 0
5/2
01
3
2011 2012 2013
Revenue (gross) million € 19.8 16.0 22.8
Order intake million € 65.9 55.7 15.6
Order backlog (03/31) million € 81.6 66.8 32.9
EBIT million € -2.6 -5.7 -4.9
EBITDA million € 0.2 -2.7 -3.5
Earnings before taxes million € -3.2 -5.8 -5.7
Profit/loss for the period million € -3.9 -4.7 -5.9
Operating cash flow million € 5.7 -0.1 -5.1
Shareholders’ equity million € 100.5 132.4 68.9
Balance sheet total million € 192.8 237.0 191.4
Research & development
expenditures
million € 1.5 1.7 2.0
Employees (03/31) 464 448 384
Weighted number of
shares, basic
41,050,111 48,930,314 48,930,314
Earnings per share, basic € -0.09 -0.10 -0.12
At a glance –Consolidated Key Figures
Annual Shareholders’ Meeting2013
SINGULUS TECHNOLOGIES AG, Kahl am Main Thursday, June 6, 2013, 10:30 am Commerzbank Auditorium Große Gallusstrasse 19 60311 Frankfurt am Mainn
Please refer to SINGULUS TECHNOLOGIES ’ page under: http://www.singulus.de/de/investor-relations/hauptversammlung.html for detailed information about the Annual General Meeting 2013.