report for the key comparison ccauv.a-k2 · 2009-08-02 · 3 1 background it was agreed during the...
TRANSCRIPT

BEV - BUNDESAMT FÜR EICH- UND VERMESSUNGSWESEN
FINAL
TECHNICAL REPORT
FOR KEY COMPARISON
CCAUV.A-K2
__________________________________________________
16 February 2009
Abstract
A low-frequency, acoustics key comparison has been conducted by the CCAUV for
the first time. There were nine participants from three different regional metrology
organizations, which will enable regional comparisons to be linked to this CIPM key
comparison. The measurements have been analysed, a key comparison reference value
evaluated and the results are presented together with their degrees of equivalence in the
format compatible with publication in the BIPM key comparison database. There is
reasonable agreement between all the results, within the stated uncertainties and
consistency has been demonstrated between these results and those of the CCAUV.A-K1
comparison.
Merita Sinojmeri
Acoustics Laboratory
1160, Arltgasse 35, Vienna
AUSTRIA
Tel: +43 1 21110 6390
Fax: +43 1 21110 6000
2
FINAL
TECHNICAL REPORT FOR KEY COMPARISON
CCAUV.A-K2
Contents 1 Background............................................................................................... 3 2 Participants ............................................................................................... 3 3 Circulated Microphones ............................................................................ 4 4 Measurements .......................................................................................... 4 5 Reported Results ...................................................................................... 5 6 Calibration Method.................................................................................... 7 7 Microphone Parameters ......................................................................... 12 8 Preliminary Analysis................................................................................ 13 9 Stability of Standards.............................................................................. 15 10 Key Comparison Reference Value ...................................................... 17
10.1 Analysis and results....................................................................... 17 10.2 Reference value ............................................................................ 17 10.3 Degrees of equivalence................................................................. 20 10.4 Mutual equivalence........................................................................ 26
11 Linking CCAUV.A-K2 to CCAUV.A-K1 ................................................ 27 12 Conclusion ........................................................................................... 28 13 References .......................................................................................... 28 14 Glossary............................................................................................... 29 15 Appendix A - Reported Uncertainty Budgets ....................................... 30 16 Appendix B............................................................................................... 43 16.1 Time table ............................................................................................ 43
16.2 Contact List.................................................................................... 45

3
1 Background
It was agreed during the 3rd meeting of the CCAUV in Sèvres, France on October 2002 that after finishing the first Key Comparison organised by the CCAUV, denominated as CCAUV.A-K1, concerned with pressure calibration of laboratory standard microphones type LS1P, the following step should necessarily be the realization of a comparison of laboratory standard microphones type LS1P in the low frequency region. The key comparison was denominated CCAUV.A-K2 and it was agreed that BEV would be the pilot laboratory.
This report contains the results of the CCAUV.A - K2 CIPM key comparison which was performed according to its protocol. It has been prepared in accordance with the “Guidelines for CIPM key comparisons” [1], carried out by Consultative Committees, which includes more details on the purpose and conduct of key comparisons in general. The purpose of this document is also to report the degrees of equivalence of the participant laboratories and their uncertainties.
2 Participants
The following laboratories participated in the key comparison. According to the protocol, NIST was also scheduled to participate in the key comparison. The NIST had agreed provisionally to participate towards the end of the schedule if development of its new system for these measurements could be ready in time. It was not and therefore the NIST did not participate.
• BEV, Austria
• CEM, Spain
• KRISS, Korea
• DPLA, Denmark
• NMIJ, Japan
• NPL, UK
• PTB, Germany
• UME, Turkey
• NIST, USA (participation cancelled)
• VNIFTRI, Russia

4
3 Circulated Microphones
Two LS1P microphones have been selected for this comparison. They are Brüel & Kjaer (B&K) type 4160 microphones, with serial numbers 2142633 and 2142634. These two microphones belong to the BEV. Each participant received both of these microphones for calibration.
The timetable was followed carefully by the NMIs although for the Russian NMI, instead of the four weeks scheduled it took approximately four months. This was caused by Customs problems. As the VNIIFTRI was scheduled at the end of the period they were still able to participate in the comparison.
Large temperature changes and sudden shocks were expected but ameliorated during the transport (a temperature data logger was provided together with a vibration isolating aluminium box) in order not to cause irreversible changes to the standards. The microphones were returned to the BEV for a check calibration after each calibration in a participating laboratory. This procedure ensured that the stability of the standards could be monitored and so that results from different laboratories could still be compared should a change occur.
4 Measurements
This key comparison was only concerned with primary methods of calibration and only considers results from such methods.
The microphones require a polarising voltage of 200 V.
Each laboratory was to determine the open-circuit pressure sensitivity level of both microphones at nominal frequencies; 2.00, 2.50, 3.15, 4.00, 5.00, 6.30, 8.00, 10.00, 12.50, 16.00, 20.00, 25.00, 31.50, 63.00, 125.00 and 250.00 Hz, optionally also 1 Hz, using their normal primary calibration method. It was agreed that the pilot laboratory would not collate any other frequencies reported by the participants. If a laboratory was unable to report results at all these frequencies then it may report on a reduced set, provided that any excluded frequencies are also excluded from the “best measurement capability” that the laboratory has declared or intends to declare under the CIPM MRA.
The use of hydrogen-filled couplers is not recommended and should be avoided.
The use of grease as a means of sealing the microphones to the test fixture should be avoided, as agreed at the CCAUV meeting 27-28, September 2004.
Results should be corrected to the reference environmental conditions as given in IEC 61094-2.

5
5 Reported Results
Each laboratory was asked to report its results using the typical report that it would issue to a customer. A covering letter to the report includes (where necessary):
• Details of the method which was used for the calibration
• Values of the temperature and static pressure coefficients of the microphones used in the calculations.
• The uncertainty budget should be clearly summarised, evaluated at a level of one standard uncertainty, information must be given on the numbers of effective degrees of freedom, required for a proper estimate of the level of confidence. The combined uncertainty as well as the expanded uncertainty should be reported. The reported uncertainty budget is very important in calculating the KCRV.
The results should be posted to the BEV within four weeks after the return of the microphones. This deadline was respected from the following NMIs: DPLA, NMIJ, KRISS; CEM. The CEM asked to repeat the measurements but due to the last NMI delay it was not possible to resend the standards back to Spain and maintain the agreed schedule.
Hz BEV DPLA NMIJ KRISS NPL* PTB CEM UME VNIIFTRI 1 - - -26.21 - -26.11 - - - - 2 -26.55 -26.56 -26.54 -26.56 -26.36 -26.47 -26.634 - -26.636
2.5 -26.65 -26.66 -26.66 -26.67 -26.54 -26.58 -26.727 - -26.667 3.15 -26.76 -26.77 -26.76 -26.78 -26.68 -26.69 -26.827 - -26.745
4 -26.86 -26.87 -26.87 -26.9 -26.81 -26.81 -26.925 - -26.838 5 -26.96 -26.96 -26.96 -26.99 -26.91 -26.91 -27.007 - -26.915
6.3 -27.04 -27.04 -27.05 -27.07 -27.00 -27.01 -27.087 - -27.007 8 -27.12 -27.12 -27.12 -27.14 -27.08 -27.09 -27.160 - -27.081 10 -27.18 -27.17 -27.18 -27.2 -27.14 -27.16 -27.211 -27.176 -27.142
12.5 -27.23 -27.22 -27.23 -27.25 -27.19 -27.21 -27.256 -27.226 -27.195 16 -27.27 -27.26 -27.28 -27.29 -27.24 -27.26 -27.296 -27.271 -27.242 20 -27.30 -27.29 -27.31 -27.32 -27.29 -27.29 -27.324 -27.304 -27.277 25 -27.33 -27.32 -27.33 -27.34 -27.31 -27.32 -27.349 -27.331 -27.306
31.5 -27.35 -27.34 -27.35 -27.36 -27.34 -27.34 -27.369 -27.353 -27.330 63 -27.40 -27.39 -27.40 -27.41 -27.41 -27.39 -27.416 -27.401 -27.383
125 -27.430 -27.422 -27.43 -27.44 -27.43 -27.42 -27.441 -27.431 -27.417 250 -27.450 -27.442 -27.44 -27.45 -27.46 -27.44 -27.459 -27.45 -27.438
*NPL results in bold were determined using a laser pistonphone (see Section 6)
Table 1. Reported sensitivities: Microphone 4160 2142633 / dB (re 1 V/Pa)

6
Hz BEV DPLA NMIJ KRISS NPL* PTB CEM UME VNIIFTRI
1 - - -26.42 - -26.39 - - -
2 -26.75 -26.75 -26.73 -26.79 -26.62 -26.7 -26.828 - -26.899
2.5 -26.85 -26.85 -26.84 -26.88 -26.80 -26.8 -26.922 - -26.936
3.15 -26.95 -26.94 -26.93 -26.97 -26.91 -26.9 -27.009 - -26.995
4 -27.04 -27.04 -27.02 -27.06 -27.01 -26.99 -27.090 - -27.055
5 -27.11 -27.11 -27.09 -27.13 -27.10 -27.07 -27.156 - -27.118
6.3 -27.18 -27.17 -27.16 -27.2 -27.16 -27.14 -27.217 - -27.176
8 -27.24 -27.23 -27.22 -27.25 -27.23 -27.21 -27.274 - -27.234
10 -27.28 -27.28 -27.27 -27.3 -27.27 -27.26 -27.313 -27.304 -27.281
12.5 -27.32 -27.32 -27.31 -27.34 -27.31 -27.3 -27.349 -27.341 -27.320
16 -27.35 -27.35 -27.35 -27.37 -27.35 -27.33 -27.380 -27.375 -27.357
20 -27.38 -27.38 -27.37 -27.39 -27.39 -27.36 -27.403 -27.4 -27.387
25 -27.41 -27.40 -27.39 -27.41 -27.41 -27.38 -27.424 -27.42 -27.411
31.5 -27.42 -27.42 -27.41 -27.43 -27.43 -27.4 -27.441 -27.439 -27.432
63 -27.46 -27.46 -27.45 -27.47 -27.44 -27.44 -27.479 -27.48 -27.479
125 -27.484 -27.495 -27.48 -27.5 -27.47 -27.47 -27.506 -27.507 -27.510
250 -27.504 -27.515 -27.50 -27.52 -27.49 -27.49 -27.524 -27.525 -27.532 *NPL results in bold were determined using a laser pistonphone (see Section 6) Table 2. Reported sensitivities: Microphone 4160 2142634 / dB (re 1 V/Pa)
Hz BEV DPLA NMIJ KRISS NPL* PTB CEM UME VNIIFTRI
1 0.4 0.25
2 0.18 0.18 0.23 0.99 0.17 0.20 0.141 0.09
2.5 0.15 0.15 0.17 0.71 0.16 0.20 0.112 0.07
3.15 0.12 0.12 0.11 0.51 0.14 0.20 0.092 0.06
4 0.11 0.08 0.09 0.36 0.12 0.11 0.087 0.05
5 0.09 0.08 0.08 0.26 0.10 0.11 0.076 0.04
6.3 0.07 0.08 0.07 0.20 0.10 0.11 0.076 0.04
8 0.06 0.07 0.06 0.15 0.08 0.07 0.075 0.03
10 0.05 0.07 0.05 0.12 0.08 0.07 0.066 0.07 0.03
12.5 0.05 0.07 0.04 0.10 0.07 0.07 0.064 0.06 0.03
16 0.04 0.06 0.04 0.08 0.07 0.04 0.061 0.06 0.03
20 0.03 0.050 0.04 0.06 0.07 0.04 0.055 0.05 0.03
25 0.03 0.050 0.04 0.04 0.07 0.04 0.046 0.05 0.03
31.5 0.03 0.030 0.04 0.03 0.06 0.03 0.044 0.05 0.03
63 0.03 0.025 0.04 0.03 0.03 0.03 0.031 0.04 0.03
125 0.025 0.025 0.03 0.03 0.03 0.03 0.025 0.04 0.03
250 0.025 0.025 0.03 0.03 0.03 0.03 0.025 0.04 0.03 *NPL results in bold were determined using a laser pistonphone (see Section 6)
Table 3. Reported expanded uncertainties from the laboratories / dB (re 1 V/Pa)

7
6 Calibration Method BEV
The calibration is based on the pressure reciprocity calibration technique according to IEC 61094-2, using three microphones of the same type. Four air-filled Plane Wave couplers of different lengths, respectively with nominal lengths 5.7 mm, 7.5 mm, 10 mm and 15 mm were used to determine the parameters of the microphones. The B&K Type 5998 reciprocity calibration apparatus with low frequency option was used. The resulting sensitivity was calculated using the MP.EXE software. The chamber in which the microphones are coupled was placed in a vibration isolated table. The chamber volume was extended with another container volume and this system was pressure controlled. Temperature was monitored in the coupler corpus via a Pt 100 resistance, the pressure inside the chamber was measured by DPI 141. The DATRON Voltmeter Type 1281 was used for voltage measurements. A 1/3 Octave band pass filter B&K 1617 as well as a generator B&K 1051 were part of the system.
The preamplifier B&K 2673 for receiver microphone and the B&K transmitter unit ZE 0796 for the transmitter were used. The measurement impedance (nominal value 4.7 nF) was calibrated in the range 20 Hz - 40 kHz and the results were extrapolated down to 2 Hz.
Polarisation voltage of the microphones was monitored by a B&K Polarisation Voltage Meter Type 5981. DPLA Calibration of LS1 microphones in the frequency range 2 Hz to 1 kHz Measurement principle
The calibration is performed as a full reciprocity calibration according to IEC 61094-2, using three microphones pair-wise coupled through air-filled Plane Wave couplers of different lengths (nominal lengths 4 - 6 - 7.5 - 9 mm). The resulting sensitivity is calculated using a modified version of MP.EXE software. The modification concerns the additional heat conduction caused by the inner thread in the front cavity of type 4160 microphones. When calculating the heat conduction, the front cavity depth of the said microphones is increased by 1.5 mm. At 2 Hz the additional heat conduction caused by the thread amounts between 0.18 and 0.06 dB for the above mentioned four couplers. Measuring equipment
The main component of the equipment used was a B&K 5998 Reciprocity Calibration Apparatus modified for low frequency applications. The receiver microphone is connected to a preamplifier B&K 2673 with insert voltage facilities (driven ground shield) and the transmitter microphone to a B&K transmitter unit ZE 0796 also with a driven ground shield. The measurement impedance (nominal 4.7 nF) was calibrated in the range 60 Hz - 40 kHz and the results extrapolated down to 2 Hz. An external polarization voltage was applied by a Fluke DC Voltage Calibrator type 343A. The static pressure is measured by a calibrated barometer, Druck DPI 140 and the temperature by a Pt 100 resistance located close to the coupler. All measurements are conducted in a temperature controlled room at 23.0°C ± 1.5°C. Humidity is kept within the range 40% - 60% RH. The transfer function is measured using a two-channel B&K Pulse analyzer in connection with SSR-software (Steady-State-

8
Response software). The measurements were conducted in 1/6-octave steps from 2 Hz to 4 kHz. The software parameters were set to average 5 sweeps with a detector band of 0.01 dB. NMIJ
1. Pressure sensitivity calibration by the reciprocity technique using three LS1P laboratory standard microphones according to IEC 61094-2.
2. Basically, a reciprocity calibration apparatus, Brüel & Kjær type 5998 was used. However, the main electronics was replaced by our own making switching box and low-noise amplifiers so as to make sure of enough amplitude of the receiving signal in low frequency region.
3. The calibration apparatus was placed in very low noise circumstance.
4. Both of the signal generation and the signal processing were executed by a dual-channel FFT analyzer, model CF-5220 of ONO SOKKI Co. Signal to noise ratio was improved by the synchronous waveform averaging method.
5. B&K type UA1413 plane-wave (long) coupler was used for the reciprocity calibration, and a short coupler type UA1429 was also used for determining the equivalent volume of microphones under test.
6. Instead of a capillary tube, a needle bung DA5563 was used so that both equalization of static pressure and an acoustic seal could be ensured.
7. The insert voltage technique was used to cancel the effect of the gain and impedance of an electrical circuit.
8. The calibration was executed by using software of our own making.
9. Heat conduction correction factor was calculated based on IEC 61094-2, Eq. (A.2). The uncertainty caused by using this approximate formula was estimated in comparison with Gerber's ([A.1] in IEC 61094-2). KRISS
The calibration is performed by a reciprocity calibration according to IEC 61094-2 using three reciprocal microphones. The microphones are coupled in pairs with four plane-wave couplers of different length (nominal length: 4, 6, 7.5, 9 mm).
The receiver microphone is connected to a preamplifier B&K type 2673/WH 3291 with insert voltage facilities and the transmitter microphone is connected to a similar housing but with grounded shield.
The electrical current through the transmitter is measured as the voltage across the 4.7 nF capacitor connected in series with the transmitter. The measuring instruments are: Sine Generator B&K 1051, Digital Multimeter Wavetek 1281 and 1/3 Octave band Pass Filter B&K 1617. The measurements are made at discrete frequencies controlled via computer.
During the calibrations the coupler and the microphones are located under a cylindrical

9
bulb of volume of about 20 liter and the cylindrical bulb is again enclosed by the acryl box with dimensions of 650 mm(W) x 859 mm(H) x 700 mm(D). The static pressure is measured by a Multifunction Pressure Indicator, Druck DPI 145, the temperature and the relative humidity are measured by Testo 650.
The front cavity depths of the microphones are measured by the Video Measuring Scope, Nikon, VMH-300N. The equivalent volume is determined by fitting the final results for the four couplers in the frequency range up to about 2 kHz. Nominal values are assumed for the resonance frequency and the loss factor of the microphone diaphragm. NPL
The pressure sensitivity of the microphone with the grid removed was determined using the NPL laser pistonphone in the frequency range from 1 Hz to 31.5 Hz, and by the reciprocity technique at higher frequencies. The polarising voltage applied to the microphone was 200.00 ± 0.05 V.
The volume of the front cavity of the microphone was measured by an acoustical method.
Measurements by laser pistonphone
Measurements were conduced in a large volume cylindrical cavity having nominal dimensions of Ø60 mm × 60 mm. Sound pressure in the closed cavity was produced by an electro-dynamically driven piston, mounted in the centre of one end face of the cavity. The piston was driven at the test frequency to produce a sinusoidal sound pressure waveform and the sound pressure was assumed to be uniform throughout the cavity. The microphone was mounted in the sidewall of the cavity, mid-way along the length, such that only the diaphragm was exposed to the sound pressure. A laser interferometer was used to measure the displacement of the piston enabling calculation of the sound pressure [7]. The calculation originates from the adiabatic gas law and must therefore be corrected to account for heat conduction effects that become increasingly significant as the frequency is reduced. The model given in IEC 61094-2 was used to calculate this correction.
The open-circuit output voltage of the microphone and the sound pressure were determined simultaneously. The resulting pressure sensitivity level quoted is the mean of six individual determinations.
Measurements by reciprocity
The reciprocity technique described in IEC 61094-2:1992 was used. Two other laboratory standard microphones, one of which is maintained by NPL as a reference device, were used to complete the triad required.
Nominal values were assumed for the acoustic impedance of the microphone. PTB
The calibration was performed according to IEC 61094-2, using three microphones coupled in pairs by an air filled plane wave coupler (length 15 mm).
The electrical transfer impedance was measured using the main unit of a Brüel&Kjaer

10
reciprocity calibration system 5998 (modification WH 3432, including transmitter unit ZE 0796 with modification WH 3433 and pre-amp 2673 with modification WH 3291) , a signal generator HP33120A, a band pass filter Brüel&Kjaer 1617, and a digital voltmeter HP3458A.
The measurement control program delivered by the manufacturer was replaced by software developed at PTB, allowing a more detailed control of the voltmeter. The voltage ratio was measured in synchronous sampling mode of HP 3458A using a resolution of 0,01 % for frequencies greater than or equal to 6,2 Hz and a resolution of 0,001 % for lower frequencies.
The polarization voltage was checked by a differential voltmeter type Fluke 893A.
The resulting sensitivity was calculated according to IEC 61094-2 (as represented by WD7, 2005) with the ‘Calcmp’ software developed at PTB, using the full frequency solution for the heat conduction calculation and taking into account an additional thread surface of 81 mm² per 4160 microphone.
The static pressure was measured by a calibrated barometer, Druck DPI 141, the temperature and humidity by a laboratory meter type Dostmann P 570.
The measurements were performed in a temperature range from (22,1 to 27,8) °C. Humidity was within the range 25% to 70% RH. The static pressure limits were (96...104) kPa.
The microphone front cavity depth was measured using a depth focusing microscope with a digimatic indicator ID 110.
The total effective volume of the microphones were determined by data fitting of the results obtained couplers of different cavity volumes in the frequency range from 80 to 255 Hz.
The pressure and temperature coefficients for correcting the sensitivity of the microphones to reference environmental conditions were calculated according to “Rasmussen, K., The static pressure and temperature coefficients of laboratory standard microphones. Metrologia, 1999, 36, 265-273. CEM
The calibration method used in this comparison was the open-circuit pressure sensitivity of the microphone by the reciprocity technique described in IEC 61094-2. The System B&K 9699 was implemented. Plane Wave couplers with nominal lengths 7.5 and 15 mm were used. To fit the results, nominal values for couplers were used. Front cavity depths of travelling microphones were measured at CEM Length Division. The B&K microphone nominal parameters were used (as included in the B&K 9699 Technical Manual). UME
The open-circuit pressure sensitivity of the microphone with the grid removed was determined by the reciprocity technique described in IEC 61094-2. Sensitivity of each

11
microphone determined ten times and the reported sensitivity is the arithmetic mean of ten results.
The microphones were coupled in pairs using two air filled plane-wave couplers with nominal lengths 7,5 mm and 15 mm. Actual dimensions of the couplers were determined by using Coordinate Measuring Machine at UME Dimension Laboratory. The polarizing voltage applied to the microphone was (200,00 ± 0,05) VDC. The variation of the polarization voltage during the measurements was monitored by HP 3458A Digital Multimeter. The polarizing voltage was measured at the port of the reciprocity calibration apparatus, instead of at the terminals of the microphone. The calculation of microphone sensitivity was performed using software MP.EXE developed at DTU in accordance with IEC 61094-2. Nominal values for the microphone cavity depth, resonance frequency and loss factor declared by manufacturer were used for the sensitivity calculation. Values for microphone equivalent and front volumes were determined by data fitting of microphone sensitivities obtained for two couplers in the frequency range 250 – 2000 Hz.
Final sensitivity values were corrected to the reference environmental conditions given below: Static pressure : 101,325 kPa Temperature : 23,0 °C Relative humidity : 50,0 % RH VNIIFTRI Pressure Reciprocity Calibration
Open-circuit pressure sensitivity was measured according to the recommendations given in IEC 61094-2. The temperature transfer function was calculated following Gerber's approach.
The microphone front cavity depth was measured by an optical focusing microscope. To determine the total volume of the microphones, the calibrations in 5 couplers were performed in the frequency range 20-250 Hz with subsequent minimization of the deviations in the microphone sensitivity levels measured in each coupler. The nominal lengths of the couplers were 4.3, 5.7, 7.5, 10.0 and 15.0 mm. The microphone equivalent volume was then calculated from the total volume and the measured front cavity depth using the cross-section area of 274.4 mm² provided by the manufacture of the microphones. Typical values of the microphone resonance frequency (8200 Hz) and loss factor (1.05) were used in the calculations.
The couplers did not contain any capillary tubes, thus no corresponding corrections were applied.
The calibrations were made at prevailing environment conditions and then corrected to the reference environment conditions. The static pressure coefficients were calculated according to [Kosobrodov and Kuznetsov. Static pressure coefficients of laboratory standard microphones in the frequency range 20 – 250 Hz. 11th Int. Congr. Sound and Vibration. 2004]. The individual microphone lower limiting frequency was determined using Brüel & Kjær type 4221 calibrator and Brüel & Kjær type 2631 carrier system.

12
7 Microphone Parameters The microphones parameters reported by the participants are presented in the tables 4
and 5 respectively for each microphone.
NMI Equivalent
Volume 10-3 m
Resonance frequency
Hz
Loss factor
Front cavity depth 10-3 m
Front cavity
volume 10-9 m³
St. pressure coefficient at 250 Hz dB/kPa
Temperature coefficient at
250 Hz dB/°C
BEV 126 8.9 1.01 1.97 544 -0.016 -0.002 DPLA 118 8.9 1.12 1.969 546 -0.0136 -0.003 NMIJ 129.4 8.2 1.05 1.97 540.6 -0.015 -0.0025
KRISS 124.15 8.2 1.05 1.973 541.47 -0.01524 -0.003 NPL 1.964 664* -0.015** -0.003** PTB 126.7 8.39 1.05 1.972 673* CEM 130 8.2 1.05 1.968 538 -0.016 -0.002 UME 135.1 8.2 1.05 1.95 532.2
VNIIFTRI 126.0 8.2 1.05 1.973 541.4 -0.0146 -0.0019 *Volume of the front cavity including the equivalent volume of the diaphragm **Low frequency as reported from the laboratory
Table 4. Microphone parameters Type 4160 2142633
NMI Equivalent
Volume 10-3 m
Resonance frequency
Hz
Loss factor
Front cavity depth 10-3 m
Front cavity
volume 10-9 m³
St. pressure coefficient at 250 Hz dB/kPa
Temperature coefficient at
250 Hz dB/K
BEV 120 9.1 1.08 1.966 539 -0.016 -0.002 DPLA 112 9.14 1.13 1.97 543 -0.0133 -0.0026 NMIJ 121.4 8.2 1.05 1.98 543.3 -0.015 -0.0025
KRISS 119.58 8.2 1.05 1.98 543.38 -0.01524 -0.003 NPL 1.973 659* -0.015** -0.003** PTB 125.7 8.426 1.05 1.973 666.4* CEM 125.325 8.2 1.05 1.971 537.4 -0.016 -0.002 UME 133.2 8.2 1.05 1.95 526.5
VNIIFTRI 116.0 8.2 1.05 1.965 539.2 -0.0144 -0.0019 *Volume of the front cavity including the equivalent volume of the diaphragm **Low frequency as reported from the laboratory
Table 5. Microphone parameters Type 4160 2142634

8 Preliminary Analysis The reported sensitivities of the microphones relative to median and weighted mean
values respectively are represented in the figures 1 to 4. As we can see from the graphs there is no significant difference between these statistical presentations.
4160 2142633 - Reported sensitivities in dB re Median
-0.2
-0.15
-0.1
-0.05
0
0.05
0.1
0.15
0.2
1 10 100 1000
Frequency/Hz
Sens
itivi
ty (d
B re
med
ian
valu
e)
BEVDPLANMIJKRISSNPLPTBCEMUMEVNIIFTRI
Figure 1. Deviation of the results from the median - B&K 4160 2132633
For the same microphone the deviation of each laboratory from the weighted is presented in the Figure 2.
4160 2142633 - Reported sensitivity in dB re weighted mean
-0,2
-0,15
-0,1
-0,05
0
0,05
0,1
0,15
0,2
1 10 100 1000
Frequency (Hz)
Sens
itivi
ty (d
B re
wei
ghte
d m
ean)
BEVDPLANMIJKRISSNPLPTBCEMUMEVNIIFTRI
Figure 2. Deviation of the results from the weighted mean- B&K 4160 2142633
13

4160 2142634 - Reported sensitivities in dB re Median
-0,2
-0,15
-0,1
-0,05
0
0,05
0,1
0,15
0,2
1 10 100 1000
Frequency/Hz
Sens
itivi
ty (d
B re
med
ian
valu
e)
BEVDPLANMIJKRISSNPLPTBCEMUMEVNIIFTRI
Figure 3. Deviation of the results from the median - B&K 4160 2142634
4160 2142634 - Reported sensitivities in dB re weighted mean
-0,15
-0,1
-0,05
0
0,05
0,1
0,15
0,2
1 10 100 1000
Frequency / Hz
Sens
itivi
ty (d
B re
wei
ghte
d m
ean)
BEVDPLANMIJCRISSNPLPTBCEMUMEVNIIFTRI
Figure 4. Deviation of the results from the weighted mean- B&K 4160 2142634
There is no statistical difference either for the arithmetic mean, which is not presented here. This is a short test for verifying the reported uncertainty. The weighted mean, median and arithmetic mean values do not vary apart from the rounding error for each frequency. So at this stage we can conclude that there is no measurement uncertainty reported from any participant that would drastically influence the KCRV calculation. So the reported uncertainty of all the participants can be considered for post evaluation of the results.
14

9 Stability of Standards
The microphones were measured at BEV before and after each laboratory measurement. The number of measurements, performed by the pilot laboratory in the period between two laboratories, was 4 to 8 using two different couplers. The long term stability is shown in the figures 5 to 8.
4160 2142633 - BEV measurements
-0.200
-0.150
-0.100
-0.050
0.000
0.050
0.100
0.150
0.200
1.00 10.00 100.00 1000.00
Frequency / Hz
Sens
itivi
ty (
dB re
BEV
mea
n va
lue) Dec-04
Feb-05Apr-05Jun-05Sep-05Nov-05Jan-06Apr-06Sep-06UncertaintyUncertainty
Figure 5. BEV measurements over frequency - B&K 4160 2142633
4160 2142634 - BEV measurements
-0.200
-0.150
-0.100
-0.050
0.000
0.050
0.100
0.150
0.200
1 10 100 1000
Frequency / Hz
Sens
itivi
ty (
dB re
BEV
mea
n va
lue) Dec-04
Feb-05Apr-05Jun-05Sep-05Nov-05Jan-06Apr-06Sep-06UncertaintyUncertainty
Figure 6. BEV measurements over frequency - B&K 4160 2142634
As we can see from the figures 5 and 6 the sensitivities of the standards fluctuate slightly inside the 95 % confidence interval of the pilot laboratory.
15

Figures 7 and 8 show the mean value of the standards for each period between two laboratories and the respective standard deviation at 10 Hz frequency.
4160 2142633 - Stability over time - 10 Hz
-0,060
-0,040
-0,020
0,000
0,020
0,040
0,060
Aug.04 Dez.04 Mär.05 Jun.05 Okt.05 Jän.06 Apr.06 Aug.06 Nov.06
Sens
itivi
ty d
B re
BEV
mea
n va
lue
Mean Exp.Unc. Exp.Unc. Typ A Typ A
Figure 7. BEV measurements - B&K 4160 2142633
4160 2142634 - Stability over time - 10 Hz
-0,060
-0,040
-0,020
0,000
0,020
0,040
0,060
Aug.04 Dez.04 Mär.05 Jun.05 Okt.05 Jän.06 Apr.06 Aug.06 Nov.06
Sens
itivi
ty (d
B re
BEV
mea
n va
lue)
Mean Exp.Unc. Exp.Unc. Typ A Typ A
Figure 8. BEV measurements - B&K 4160 2142634
The standard deviations of the respective measurements during the period between two laboratories are inside the typical Type A uncertainty of the pilot laboratory. A similar situation happens for all the other frequencies of interest, from 2 Hz to 250 Hz.
16

10 Key Comparison Reference Value
The determination of the Key Comparison Reference Value is an important outcome of this project. The pilot laboratory did not identify any anomalous results through statistical tests according to the BIPM Guidelines.
The BIPM guidelines were followed to calculate the KCRV and the participants agreed with the analysis as described here.
10.1 Analysis and results
The scope of a CIPM key comparison is to calculate the key comparison reference value (KCRV) and the degrees of equivalence for each participant.
In the preliminary analysis (section 8) of the CCAUV.A-K2 key comparison, such an attempt was made and the median and the weighted mean were used to compare the results.
The method chosen for calculating the degrees of equivalence of the laboratories in this section is the generalized least squares (GLS) method. There are two main reasons for this choice:
1) There are two travelling standards; each of them has its own sensitivity value which is unknown
2) The BLUE (best linear unbiased estimate) approach gives the possibility to consider the standards’ covariances and to calculate one degree of equivalence per participant
10.2 Reference value
In the actual comparison, two travelling standards were distributed. For the frequency region 2 Hz to 8 Hz there were eight laboratories that reported the results for each standard, while for the frequencies between 10 Hz and 250 Hz there were nine laboratories. To calculate the reference value of the comparison we consider the GLS method as described by L. Nielson [3], in the case of measuring two travelling standards. The mathematical model was designed as follows:
eX += αy (1)
y column vector of the measurement results
X the design matrix
α column vector of the unknowns, 2 elements per frequency
e matrix of random errors or disturbances
17

The design matrix X looks as follows:
−−
−−=
1010
0101
X
The elements of the parameter vector α to be defined are two per each frequency, respectively the estimated value of the first standard and the estimated value of the second standard.
Let us define Φ as the uncertainty matrix with dimensions NxN variable to frequency, containing in the diagonal the variances (reported standard uncertainty squared, ui
2) for each element of the vector y (measurement value reported from the laboratory i per standard) and in the corresponding nondiagonal elements the covariances between the elements of the vector y. According to CCAUV.A-K3 [4] the correlation factors for the standard values reported from the same laboratory are considered to be 0.7 for the standard microphones type 4160. Except for the NPL where the laser pistonphone method [8] in the frequency region 2- 31.5 Hz was applied. In this case there was assumed to be no correlation between standards.
The standards have shown short term gradients after the travel and for this reason a matrix containing in the diagonal the maximum standard deviation measured from the pilot laboratory for each frequency and each standard was added to the variance matrix. We can call it transport uncertainty.
FrequencyHz
4160 2142633
dB
4160 2142634
dB 2 0.055 0.027
2.5 0.044 0.019 3.15 0.038 0.016
4 0.033 0.011 5 0.029 0.022
6.3 0.013 0.012 8 0.013 0.012 10 0.013 0.011
12.5 0.009 0.007 16 0.008 0.006 20 0.008 0.006 25 0.008 0.006
31.5 0.008 0.006 63 0.004 0.007
125 0.004 0.007 250 0.004 0.007
Table 6. Maximum standard deviations of the key comparison standards
The estimated standards values are calculated from the formula below,
y1T ΦXC −= ˆα (2)
18

where C is given as,
1)(ˆ −−= XΦXC 1T (3)
The uncertainty of each estimated value is equal with,
),( iiCkUi
⋅=α (4)
where k is the coverage factor.
The chi-squared value was calculated according to the formula below;
)()( 12e
Te XyXy ααχ −Φ−= − (5)
In this case the degrees of freedom for the first frequency region are 14, for the second frequency region are 16. The expected values of are respectively 26.29 for the 2 Hz to 8 Hz region and 28.87 for the 10 Hz to 250 Hz region. The observed for each frequency are shown in the table below.
2χ2oχ
FrequencyHz
2oχ
Probability %
2 10.78 70 2.5 5.30 98
3.15 3.38 100 4 3.98 100 5 4.09 99
6.3 5.45 98 8 7.13 93 10 7.24 97
12.5 6.83 98 16 7.24 97 20 6.70 98 25 6.50 98
31.5 6.42 98 63 15.85 46
125 15.55 48 250 14.30 58
Table 7. Consistency test of the measurement results
As we can see from the above values, the probability for all the frequencies is higher than 5 % level of significance and the equivalence of the measurements cannot be rejected.
19

The estimated reference values and their uncertainties are shown in the table 8.
4160 2142633
4160 2142634 Frequency
Hz Sensitivity Uncertainty
k = 2 Sensitivity
Uncertainty k = 2
2 -26.552 0.072 -26.768 0.075 2.5 -26.655 0.060 -26.870 0.062
3.15 -26.757 0.050 -26.952 0.078 4 -26.858 0.041 -27.037 0.042 5 -26.947 0.036 -27.107 0.040
6.3 -27.032 0.027 -27.172 0.028 8 -27.104 0.022 -27.230 0.023 10 -27.166 0.020 -27.279 0.021
12.5 -27.218 0.019 -27.319 0.019 16 -27.264 0.017 -27.352 0.018 20 -27.298 0.015 -27.381 0.016 25 -27.326 0.015 -27.405 0.016
31.5 -27.347 0.013 -27.422 0.014 63 -27.399 0.011 -27.461 0.012
125 -27.431 0.010 -27.492 0.011 250 -27.448 0.010 -27.511 0.011
Table 8. Estimated reference values of the two microphones (dB re 1V/Pa)
10.3 Degrees of equivalence
The BLUE method is again the method chosen to calculate the degrees of equivalence inspired from the method applied in the reference [5] and [6] for analysis of the international comparison results.
The basic equation of the key comparison is:
pijjipij eSdS ,,,, ++= (6)
where
pijS ,, measurement value of the laboratory i, of the standard j and at the moment of time p
jS reference value of the standard j
id bias of the laboratory i
pije ,, is the random error of disturbances of the laboratory i, of the standard j and at the moment of time p
20

The design matrix for the frequencies which were reported from all the laboratories has the form:
X
X =
1 0 0 0 0 0 0 0 0 1 0
0 1 0 0 0 0 0 0 0 1 0
0 0 1 0 0 0 0 0 0 1 0
0 0 0 1 0 0 0 0 0 1 0
0 0 0 0 1 0 0 0 0 1 0
0 0 0 0 0 1 0 0 0 1 0
0 0 0 0 0 0 1 0 0 1 0
0 0 0 0 0 0 0 1 0 1 0
0 0 0 0 0 0 0 0 1 1 0
1 0 0 0 0 0 0 0 0 0 1
0 1 0 0 0 0 0 0 0 0 1
0 0 1 0 0 0 0 0 0 0 1
0 0 0 1 0 0 0 0 0 0 1
0 0 0 0 1 0 0 0 0 0 1
0 0 0 0 0 1 0 0 0 0 1
0 0 0 0 0 0 1 0 0 0 1
0 0 0 0 0 0 0 1 0 0 1
0 0 0 0 0 0 0 0 1 0 1
0 0 0 0 0 0 0 0 0 1 0
0 0 0 0 0 0 0 0 0 0 1
Columns 1 to 9 (8) correspond to the nine (eight) laboratories that took part in the CIPM comparison, columns 10 (9) and 11 (10) are for the two standards estimated in the previous paragraph. The covariance matrix contains the variances, covariances and transport uncertainties of the standards as described previously. Uncertainties for the estimated reference values of the standards are calculated also previously and are included in the covariance matrix. The parameter vector α is the column vector of the 11 elements in case of upper frequencies, and 10 in the case of lower frequencies. The upper elements correspond to the estimated degrees of equivalence and the two last ones to the estimated standard values. The vector y contains the measurement results reported for each laboratory and the last elements belong to the estimated reference values of the standards as described in the previous paragraph 10.2.
A measure of goodness-of-fit of the model to the measurement results is given by equation (5).
In our case the equation should be solved for all the 16 frequencies. Number of degrees of freedom ν for the upper frequencies is 9 and for the lower frequencies the number of degrees of freedom is 8. A summary of the results is shown in the table 9.
21

22
2oχ
where k is the coverage factor as it has been assumed, k = 2.
The deviations between pairs of laboratories are reported for the frequencies of 2 Hz, 10 Hz and 250 Hz in tables 12 to 17. The deviation Di,j of laboratory i from laboratory j is calculated from equation 7,
In tables 10 and 11 the deviations and the corresponding expanded uncertainties for each frequency, are reported, as described above, derived from vector α and the diagonal elements of the matrix Ĉ with a coverage factor of 2 according to the equation 4.
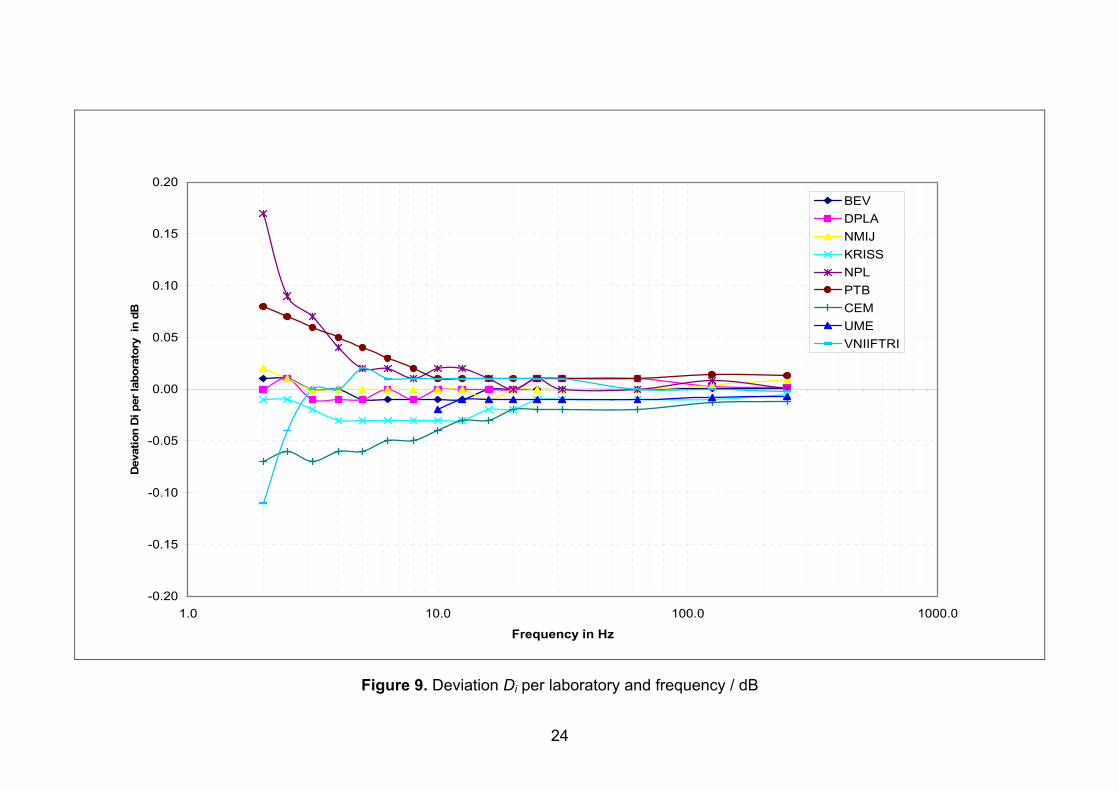
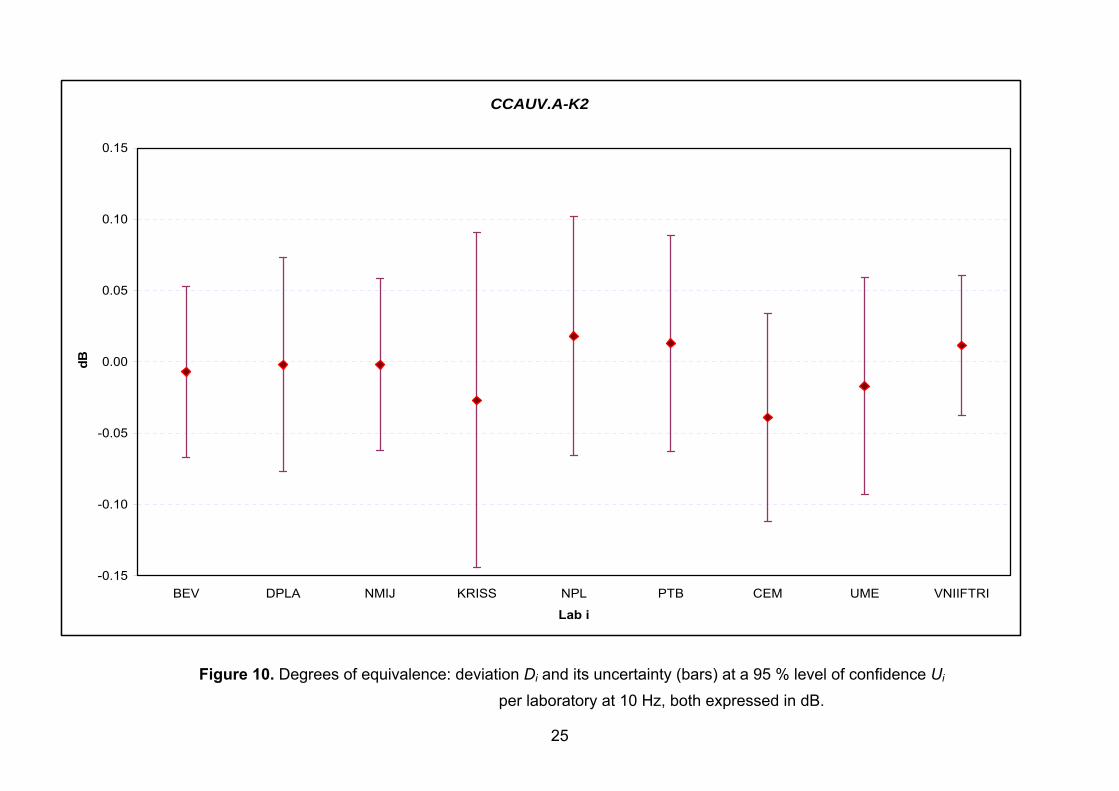
In table 10 the deviations from the KCRV per laboratory and frequency directly derived from the parameter vector α after the equation 2, are reported. The same data is reported in graphical way in the figure 9. The figure 10 represents the degrees of equivalence in terms of deviations and their uncertainties at 10 Hz for all participant laboratories.
The degrees of equivalence in accordance with the CIPM MRA [2], are calculated directly from the parameter vector
As we can see from the chi-squared values the mathematical model can not be rejected at a level of significance 5 % for all the frequencies.
and its uncertainty Ui,j is again obtained from Ĉ using the equation 8,
Table 9. Consistency test of the degrees of equivalence mathematical model
FrequencyHz
Probability %
2 0.55 100 2.5 1.00 100
3.15 0.51 100 4 0.92 100 5 1.24 100
6.3 2.39 97 8 3.63 89 10 3.75 93
12.5 3.52 94 16 4.29 89 20 4.41 88 25 4.10 90
31.5 3.81 92 63 12.52 19
125 13.45 14 250 11.86 22
α and Ĉ.
jiijD α−α=
ijjjiiij C2CCkU −+=
(7)
(8)

Frequency / Hz 2 2.5 3.15 4 5 6.3 8 10 DOE→ Di Ui Di Ui Di Ui Di Ui Di Ui Di Ui Di Ui Di Ui
Lab i ↓ dB dB dB dB dB BEV 0.01 0.19 0.01 0.16 0.00 0.14 0.00 0.12 -0.01 0.10 -0.01 0.07 -0.01 0.06 -0.01 0.05 DPLA 0.00 0.19 0.01 0.16 -0.01 0.14 -0.01 0.09 -0.01 0.09 0.00 0.08 -0.01 0.07 0.00 0.07 NMIJ 0.02 0.23 0.01 0.18 0.00 0.13 0.00 0.10 0.00 0.09 0.00 0.07 0.00 0.06 0.00 0.05 KRISS -0.01 0.92 -0.01 0.66 -0.02 0.48 -0.03 0.34 -0.03 0.25 -0.03 0.19 -0.03 0.14 -0.03 0.11 NPL 0.17 0.15 0.09 0.14 0.07 0.14 0.04 0.10 0.02 0.09 0.02 0.08 0.01 0.06 0.02 0.06 PTB 0.08 0.21 0.07 0.20 0.06 0.21 0.05 0.12 0.04 0.12 0.03 0.11 0.02 0.07 0.01 0.07 CEM -0.07 0.16 -0.06 0.13 -0.07 0.12 -0.06 0.10 -0.06 0.09 -0.05 0.08 -0.05 0.07 -0.04 0.06 UME -0.02 0.07 VNIIFTRI -0.11 0.13 -0.04 0.10 0.00 0.10 0.00 0.07 0.02 0.07 0.01 0.05 0.01 0.04 0.01 0.03
Table 10. Degrees of equivalence given as deviation from the KCRV, Di and its expanded uncertainty (k = 2), Ui both expressed in dB, per laboratory and frequency
Frequency / Hz 12.5 16 20 25 31.5 63 125 250 DOE→ Di Ui Di Ui Di Ui Di Ui Di Ui Di Ui Di Ui Di Ui
Lab i ↓ dB dB dB dB dB dB dB dB BEV -0.01 0.05 0.00 0.04 0.00 0.03 0.00 0.03 0.00 0.03 0.00 0.03 0.001 0.026 0.001 0.026 DPLA 0.00 0.07 0.00 0.06 0.00 0.05 0.01 0.05 0.01 0.03 0.01 0.03 0.003 0.026 0.002 0.026 NMIJ 0.00 0.04 -0.01 0.04 0.00 0.04 0.00 0.04 0.00 0.04 0.00 0.04 0.004 0.030 0.009 0.030 KRISS -0.03 0.09 -0.02 0.08 -0.02 0.06 -0.01 0.04 -0.01 0.03 -0.01 0.03 -0.010 0.030 -0.005 0.030 NPL 0.02 0.05 0.01 0.05 0.00 0.05 0.01 0.05 0.00 0.05 0.00 0.03 0.008 0.030 0.001 0.030 PTB 0.01 0.07 0.01 0.04 0.01 0.04 0.01 0.04 0.01 0.03 0.01 0.03 0.014 0.030 0.013 0.030 CEM -0.03 0.06 -0.03 0.06 -0.02 0.05 -0.02 0.05 -0.02 0.04 -0.02 0.03 -0.013 0.026 -0.012 0.026 UME -0.01 0.06 -0.01 0.06 -0.01 0.05 -0.01 0.05 -0.01 0.05 -0.01 0.04 -0.008 0.039 -0.007 0.039 VNIIFTRI 0.01 0.03 0.01 0.03 0.01 0.03 0.01 0.03 0.01 0.03 0.00 0.03 0.000 0.030 -0.002 0.030
Table 11. Degrees of equivalence given as deviation from the KCRV, Di and its expanded uncertainty (k = 2), Ui both expressed in dB, per laboratory and frequency
23
-0.20
-0.15
-0.10
-0.05
0.00
0.05
0.10
0.15
0.20
1.0 10.0 100.0 1000.0
Frequency in Hz
Dev
atio
n D
i per
labo
rato
ry i
n dB
BEVDPLANMIJKRISSNPLPTBCEMUMEVNIIFTRI
Figure 9. Deviation Di per laboratory and frequency / dB
24
CCAUV.A-K2
-0.15
-0.10
-0.05
0.00
0.05
0.10
0.15
BEV DPLA NMIJ KRISS NPL PTB CEM UME VNIIFTRI
Lab i
dB
Figure 10. Degrees of equivalence: deviation Di and its uncertainty (bars) at a 95 % level of confidence Ui per laboratory at 10 Hz, both expressed in dB.
25

26
10.4 Mutual equivalence
According to the equations 7 and 8 in the previous paragraph, the mutual degrees of equivalence are calculated. Those corresponding to the frequencies 2 Hz, 10 Hz, 250 Hz are shown in the following tables:
NMI BEV DPLA NMIJ KRISS NPL PTB CEM VNIIFTTRI
BEV -- 0.01 -0.01 0.02 -0.16 -0.07 0.08 0.11
DPLA 0.27 -- -0.02 0.02 -0.17 -0.07 0.08 0.11
NMIJ 0.30 0.30 -- 0.04 -0.15 -0.05 0.10 0.13
KRISS 0.94 0.94 0.95 -- -0.19 -0.09 0.06 0.09
NPL 0.24 0.24 0.28 0.93 -- 0.10 0.24 0.28
PTB 0.28 0.28 0.31 0.94 0.25 -- 0.15 0.18
CEM 0.25 0.25 0.28 0.93 0.22 0.26 -- 0.03
VNIIFTTRI 0.23 0.23 0.26 0.93 0.19 0.24 0.20 --
Table 12. Mutual equivalence at 2 Hz: upper triangle deviations Dij, lower triangle respective uncertainties Uij / dB
NMI BEV DPLA NMIJ KRISS NPL PTB CEM UME VNIIFTTRI
BEV -- -0.01 0.00 0.02 -0.03 -0.02 0.03 0.01 -0.02
DPLA 0.08 -- 0.00 0.03 -0.02 -0.01 0.04 0.01 -0.02
NMIJ 0.07 0.08 -- 0.02 -0.02 -0.02 0.04 0.01 -0.02
KRISS 0.12 0.13 0.12 -- -0.05 -0.04 0.01 -0.01 -0.04
NPL 0.08 0.09 0.08 0.13 -- 0.01 0.06 0.03 0.00
PTB 0.08 0.09 0.08 0.13 0.09 -- 0.05 0.03 0.00
CEM 0.08 0.09 0.08 0.13 0.09 0.09 -- -0.02 -0.05
UME 0.08 0.09 0.08 0.13 0.09 0.09 0.09 -- -0.03
VNIIFTTRI 0.06 0.07 0.06 0.12 0.07 0.07 0.07 0.07 --
Table 14. Mutual equivalence at 10 Hz: upper triangle deviations Dij, lower triangle respective uncertainties Uij / dB
NMI BEV DPLA NMIJ KRISS NPL PTB CEM UME VNIIFTTRI
BEV -- -0.002 -0.009 0.005 0.000 -0.013 0.012 0.008 0.002
DPLA 0.035 -- -0.007 0.007 0.002 -0.011 0.014 0.009 0.004
NMIJ 0.039 0.039 -- 0.014 0.008 -0.004 0.021 0.016 0.011
KRISS 0.039 0.039 0.042 -- -0.005 -0.018 0.007 0.002 -0.003
NPL 0.039 0.039 0.042 0.042 -- -0.012 0.012 0.008 0.003
PTB 0.039 0.039 0.042 0.042 0.042 -- 0.025 0.020 0.015
CEM 0.035 0.035 0.039 0.039 0.039 0.039 -- -0.005 -0.010
UME 0.046 0.046 0.048 0.048 0.048 0.048 0.046 -- -0.005
VNIIFTTRI 0.039 0.039 0.042 0.042 0.042 0.042 0.039 0.048 --
Table 16. Mutual equivalence at 250 Hz: upper triangle deviations Dij, lower triangle respective uncertainties Uij / dB

27
11 Linking CCAUV.A-K2 to CCAUV.A-K1
In the previous chapter, the CCAUV.A-K2 key comparison results were analysed and in this chapter the possibility of a cross link to the CCAUV.A-K1 key comparison has been investigated by using results obtained in both key comparisons in the overlapping frequency range.
In this key comparison there were many laboratories that participated in the previous key comparison, CCAUV.A-K1 [7], the DPLA, NPL, PTB, KRISS and the VNIIFTRI. The frequencies reported in the CCAUV. A-K2, were 63 Hz, 125 Hz and 250 Hz. For these frequencies the results of the link laboratories are presented in the tables 18 and 19 below, where D is the deviation and U the expanded uncertainty (k = 2).
NMI NPL DPLA KRISS PTB VNIIFTRI
Frequency
Hz
D
/ dB
U
/ dB
D
/ dB
U
/ dB
D
/ dB
U
/ dB
D
/ dB
U
/ dB
D
/ dB
U
/ dB
63 0.02 0.03 0.00 0.04 0.00 0.03 0.00 0.03 -0.01 0.07
125 0.01 0.03 0.00 0.03 0.00 0.03 0.01 0.03 0.00 0.05
250 0.01 0.03 0.00 0.03 0.00 0.03 0.01 0.03 0.00 0.05
Table 18. CCAUV.A-K1 results of the link laboratories
NMI NPL DPLA KRISS PTB VNIIFTRI
Frequency
Hz
D
/ dB
U
/ dB
D
/ dB
U
/ dB
D
/ dB
U
/ dB
D
/ dB
U
/ dB
D
/ dB
U
/ dB
63 0.00 0.03 0.01 0.03 -0.01 0.03 0.01 0.03 0.00 0.03
125 0.01 0.03 0.01 0.03 -0.01 0.03 0.00 0.03 0.00 0.03
250 0.00 0.03 0.00 0.03 -0.01 0.03 0.01 0.03 -0.00 0.03
Table 19. CCAUV.A-K2 results of the link laboratories
The differences of the results for each link laboratory are given in table 20 below. The uncertainty is calculated as the root mean square of the uncertainties reported in each comparison as well as the covariance, taking into account the same correlation factor 0.7 as reported in the previous paragraph.
NMI NPL DPLA KRISS PTB VNIIFTRI
Frequency
Hz
D
/ dB
U
/ dB
D
/ dB
U
/ dB
D
/ dB
U
/ dB
D
/ dB
U
/ dB
D
/ dB
U
/ dB
63 0.02 0.03 -0.01 0.04 -0.01 0.03 -0.01 0.03 -0.01 0.07
125 0.00 0.03 -0.01 0.03 -0.01 0.03 0.01 0.03 0.00 0.05
250 0.01 0.03 0.00 0.03 -0.01 0.03 0.00 0.03 -0.00 0.05
Table 20. Differences between CCAUV.A-K1 and CCAUV.A-K2 results of the link laboratories
As we can see from the table 20, there is no systematic error and the differences are smaller than the calculated uncertainties. Actually the rounding of the results is the biggest

28
contribution to these differences. So practically it can be considered that the two key comparisons are equivalent at the link frequencies and there is no need to consider a link factor.
12 Conclusion
In conclusion, the degrees of equivalence of all the laboratories show agreement within the estimated uncertainties.
In addition it has been shown that where the two key comparisons; the earlier CCAUV.A-K1 and the present key comparison CCAUV.A-K2, overlap in frequency, the results are equivalent.
13 References
[1] Guidelines for CIPM key comparisons, www.bipm.org, 03. 1999 (rev. 10. 2003) [2] Mutual recognition of national measurement standards and of calibration and measurement certificates issued by national metrology institutes,Tech.Rep.,2003, www.bipm.org/utils/en/pdf/mra_2003.pdf[3] L. Nielson. DFM 99-R39 Report, Evaluation of key comparisons by the method of least squares, 2000 [4] V. Cutanda Henriquez, K. Rasmussen. Final Report on the Key Comparison CCAUV.A-K3, May 2006 [5] W. Bich. Metrologia 27, 111 – 116 ,1990 [6] C.M. Sutton. Analysis and linking of international measurement comparison, Metrologia 41, 272- 277, 2004 [7] R.Barham, “Report on key comparison CCAUV.A-K1”, Metrologia, 40, Tech. Suppl., 2003 [8] R. Barham & M Goldsmith. The application of the NPL laser pistonphone to the international comparison of measurement microphones. Metrologia 44, 210-216, 2007 [9] Evaluation of measurement data — Supplement 1 to the “Guide to the expression of uncertainty in measurement” Propagation of distributions using a Monte Carlo method, JCGM 2008

29
14 Glossary
BIPM: Bureau International des Poids et Mesures. CIPM: International Committee of Weights and Measures. Degree of equivalence of a measurement standard: the degree to which the value of a measurement standard is consistent with the key comparison reference value. This is expressed quantitatively by the deviation from the key comparison reference value and the uncertainty of this deviation. The degree of equivalence between two measurement standards is expressed as the difference between their respective deviations from the key comparison reference value and the uncertainty of this difference. Key comparison: one of the set of comparisons selected by a Consultative Committee to test the principal techniques and methods in the field (note that key comparisons may include comparisons of representations of multiples and submultiples of SI base and derived units and comparisons of artefacts). Key comparison reference value, KCRV: the reference value accompanied by its uncertainty resulting from a CIPM key comparison. Uncertainty matrix: matrix of dimension NxN, containing on its diagonal the squares of the standard uncertainties associated with estimates of the components of an N-dimensional vector quantity, and in its off-diagonal positions the covariances associated with pairs of estimates. An uncertainty matrix is also known as a covariance matrix or variance-covariance matrix. [9] BLUE method: Best linear unbiased estimator method GLS: Generalized least squares

30
15 Appendix A - Reported Uncertainty Budgets BEV Uncertainty budget
Condensed components of uncertainty expressed as 10–4 dB
Frequency / Hz Source 2,00 2,50 3,15 4,00 5,00 6,30 8,00 10,00 Series impedance 300 280 260 240 220 200 180 160 Voltage ratio 35 30 25 20 14 14 14 14 Crosstalk , electrical setup 40 37 35 33 30 30 30 30 Coupler dimensions 37 37 37 37 37 37 37 37 Coupler leakage 500 400 300 250 160 80 50 30 Microphone parameters 69 69 69 69 69 69 69 69 Environmental parameters 48 36 28 20 16 16 16 16 Heat conduction correction 100 50 46 32 30 27 25 25 Rounding error 60 60 60 60 60 60 60 60 Measurement reproducibility 644 531 447 368 308 246 193 149 Combined uncertainty 883 733 610 518 425 344 289 245 Expanded uncertainty (k = 2) 1766 1465 1220 1035 850 688 579 491
Frequency / Hz Source 12,5 16,0 20,0 25,0 31,5 63,0 125,0 250,0 Series impedance 140 120 100 80 65 48 28 24 Voltage ratio 12 12 12 12 12 12 12 12 Crosstalk , electrical setup 30 30 30 30 25 25 25 25 Coupler dimensions 37 37 37 37 37 37 37 37 Coupler leakage 25 20 15 14 13 12 10 8 Microphone parameters 69 69 69 69 69 69 69 69 Environmental parameters 16 16 16 16 16 16 16 16 Heat conduction correction 25 25 20 20 20 20 15 10 Rounding error 60 60 60 60 60 60 6 6 Measurement reproducibility 116 88 73 63 57 49 49 48 Combined uncertainty 213 185 164 148 137 127 103 101 Expanded uncertainty (k=2) 426 370 329 297 275 253 207 202

31
DPLA Condensed uncertainty budget for type 4160 microphones in the frequency range 2 Hz to 1 kHz
The condensed uncertainty budget for a pressure reciprocity calibration of B&K Type 4160 microphones are given in the table below. The background for the budget is given in the following remarks:
Item 1: The figures represent the combined effects of the uncertainty on the coupler length (5 µm) and diameter (5 µm) including the resulting changes in heat conduction corrections.
Item 2: The figures represent the combined effects of the uncertainty on the microphone parameters represented by the front cavity depth (10 µm) and total (effective) front cavity volume (5 mm3).
Item 3: The figures represent the combined effects of the uncertainty on the measurement impedance, voltage ratios (3 ratios each derived from 4 voltage measurements), cross-talk (< 66 dB) and noise (S/N < 46 dB). It is assumed that cross-talk and noise affects all voltage ratios in the same way.
Item 4: The figures represent the combined effects of the measurement uncertainties on static pressure (40 Pa), temperature (1 K) and relative humidity (5 %).
Item 5: The figures represent the uncertainty on the polarizing voltage (40 mV) and the non-linear relation between polarizing voltage and microphone sensitivity.
Item 6: The figures represent the estimated error on the total heat conduction correction after applying the additional heat correction caused by the thread in the microphone.
Item 7: The figures represent the uncertainty on the equations for calculating the speed of sound (0.05 m/s), density of air (10–4 kg/m3) and ratio of specific heats (0.0005).
Item 10: The figures represent the uncertainty on applying a correction for dependence of static pressure and temperature on the microphone sensitivity. (Uncertainty on low-frequency value of static pressure coefficient 0.0005 dB/kPa and on temperature coefficient 0.002 dB/K, allowed deviation from reference conditions 2 kPa, respectively 1 K).

Danish Primary Laboratory of Acoustics
Components of type B uncertainties expressed as dB/1000 Frequency Hz
Source 2 4 8 16 32 63 125 250 500 10001 Coupler dimensions 2.2 2.2 2.2 2.2 2.2 2.2 2.2 2.2 2.2 2.2 2 Microphone parameters 9 9 9 9 9 9 9 9 9 9 3 Electrical transfere impedance 40 30 25 20 15 11 10 10 5 5 4 Environmental parameters 1.6 1.6 1.6 1.6 1.6 1.6 1.6 1.6 1.6 1.6 5 Polarizing voltage 2.1 2.1 2.1 2.1 2.1 2.1 2.1 2.1 2.1 2.1 6 Heat conduction correction 40 25 19 14 10 7 6 4 3.5 3 7 Equations of environmental parameters 1.6 1.6 1.6 1.6 1.6 1.6 1.6 1.6 1.6 1.6 8 Rounding of results 6 6 6 6 6 6 6 6 6 6 2/12∑B )3/u(=σ 33 25 19 15 12 10 9 8 7 7
Components of type A uncertainties expressed as dB/1000
9 Allowed reproducibility σA 80 40 20 10 10 10 8 8 8 8
Overall uncertainty expressed as dB/1000 at measurement conditions (k = 2) 2/12
B2A )(*2 σ+σ=σ 173 93 56 37 32 28 24 23 21 21
Uncertainty on corrections to reference environmental conditions expressed as dB/1000 (k = 2) 10 8 6 5 4.5 4.5 4.5 4.5 4.5 4.5 4.5
Overall uncertainty expressed as dB/1000 at reference conditions (k = 2) 173 93 56 37 32 29 25 24 21 21
32

NMIJ Frequency Type 1,00 2,00 2,50 3,15 4,00 5,00 6,30 8,00 10,00 12,50 16,00 20,00 25,00 31,50 63,00 125,00 250,00
Serial Capacitance B 0,0011 0,0011 0,0011 0,0011 0,0011 0,0011 0,0011 0,0011 0,0011 0,0011 0,0011 0,0011 0,0011 0,0011 0,0011 0,0011 0,0011
Voltage Ratio B 0,0031 0,0031 0,0031 0,0031 0,0031 0,0031 0,0031 0,0031 0,0031 0,0031 0,0031 0,0031 0,0031 0,0031 0,0031 0,0031 0,0031
Cross-talk B 0,0012 0,0012 0,0012 0,0012 0,0012 0,0012 0,0012 0,0012 0,0012 0,0012 0,0012 0,0012 0,0012 0,0012 0,0012 0,0012 0,0012
Coupler Volume A 0,0058 0,0058 0,0058 0,0058 0,0058 0,0058 0,0058 0,0058 0,0058 0,0058 0,0058 0,0058 0,0058 0,0058 0,0058 0,0058 0,0058
Static Pressure B 0,0012 0,0012 0,0012 0,0012 0,0012 0,0012 0,0012 0,0012 0,0012 0,0012 0,0012 0,0012 0,0012 0,0012 0,0012 0,0012 0,0012
Coupler Leakage B 0,1000 0,0500 0,0400 0,0300 0,0250 0,0220 0,0200 0,0180 0,0150 0,0120 0,0100 0,0100 0,0100 0,0090 0,0090 0,0060 0,0050
Front Cavity Volume A 0,0028 0,0028 0,0028 0,0028 0,0028 0,0028 0,0028 0,0028 0,0028 0,0028 0,0028 0,0028 0,0028 0,0028 0,0028 0,0028 0,0028
Equivalent Volume B 0,0550 0,0450 0,0380 0,0320 0,0270 0,0240 0,0200 0,0150 0,0120 0,0100 0,0080 0,0070 0,0060 0,0050 0,0050 0,0050 0,0040
Polarizing Voltage B 0,0004 0,0004 0,0004 0,0004 0,0004 0,0004 0,0004 0,0004 0,0004 0,0004 0,0004 0,0004 0,0004 0,0004 0,0004 0,0004 0,0004
Heat Conduction Correction B 0,0020 0,0010 0,0010 0,0010 0,0010 0,0010 0,0010 0,0010 0,0010 0,0010 0,0010 0,0010 0,0010 0,0010 0,0010 0,0010 0,0010
Repeatability of Measurements A 0,1600 0,0900 0,0600 0,0300 0,0200 0,0150 0,0100 0,0080 0,0080 0,0080 0,0080 0,0080 0,0080 0,0080 0,0080 0,0080 0,0080
Rounding Error B 0,0029 0,0029 0,0029 0,0029 0,0029 0,0029 0,0029 0,0029 0,0029 0,0029 0,0029 0,0029 0,0029 0,0029 0,0029 0,0029 0,0029
Static Pressure Corrections B 0,0040 0,0040 0,0040 0,0040 0,0040 0,0040 0,0040 0,0040 0,0040 0,0040 0,0040 0,0040 0,0040 0,0040 0,0040 0,0040 0,0040
Temperature Corrections B 0,0006 0,0006 0,0006 0,0006 0,0006 0,0006 0,0006 0,0006 0,0006 0,0006 0,0006 0,0006 0,0006 0,0006 0,0006 0,0006 0,0006
Combined Uncertainty 0,197 0,113 0,082 0,054 0,043 0,037 0,031 0,026 0,023 0,020 0,018 0,017 0,017 0,016 0,016 0,014 0,014
Expanded Uncertainty (k=2) 0,393 0,225 0,164 0,108 0,086 0,074 0,063 0,053 0,045 0,039 0,035 0,034 0,034 0,032 0,032 0,029 0,027
Stated Uncertainty 0,40 0,23 0,17 0,11 0,09 0,08 0,07 0,06 0,05 0,04 0,04 0,04 0,04 0,04 0,04 0,03 0,03
NMIJ/AIST
33

34
KRISS Measured Quatitity Symbol Unc. Unit 2 2,5 3,15 4 5 6,3 8 10 12,5 16 20 25 31,5 63 125 250 Electrical Transfer
Impedance
Series Impedance C Table nF 0,0529 0,0510 0,0495 0,0483 0,0473 0,0466 0,0460 0,0280 0,0276 0,0273 0,0096 0,0094 0,0093 0,0045 0,0045 0,0044 Voltage Ratio VR Table 0,0030 0,0030 0,0030 0,0030 0,0030 0,0030 0,0030 0,0030 0,0026 0,0026 0,0024 0,0024 0,0024 0,0021 0,0020 0,0020
Cross-talk Meas. 0,0039 0,0039 0,0039 0,0039 0,0039 0,0039 0,0039 0,0039 0,0039 0,0039 0,0039 0,0036 0,0035 0,0035 0,0035 0,0035 Inherent Noise Meas. 0,0009 0,0009 0,0009 0,0009 0,0009 0,0009 0,0009 0,0009 0,0009 0,0009 0,0009 0,0009 0,0009 0,0009 0,0009 0,0009
Distortion Meas. 0,0004 0,0004 0,0004 0,0004 0,0004 0,0004 0,0004 0,0004 0,0004 0,0004 0,0004 0,0004 0,0004 0,0004 0,0004 0,0004 Frequency f Table Hz 0,0000 0,0000 0,0000 0,0000 0,0000 0,0000 0,0000 0,0000 0,0000 0,0000 0,0000 0,0000 0,0000 0,0000 0,0000 0,0000
Receiver Ground Shield B&K 0,0003 0,0003 0,0003 0,0003 0,0003 0,0003 0,0003 0,0003 0,0003 0,0003 0,0003 0,0003 0,0003 0,0003 0,0003 0,0003 Transmitter Ground
Shield B&K 0,0003 0,0003 0,0003 0,0003 0,0003 0,0003 0,0003 0,0003 0,0003 0,0003 0,0003 0,0003 0,0003 0,0003 0,0003 0,0003
Coupler Properties Coupler Length lcoup 0,0010 mm 0,0000 0,0000 0,0000 0,0000 0,0000 0,0000 0,0000 0,0000 0,0000 0,0000 0,0000 0,0000 0,0000 0,0000 0,0000 0,0000
Coupler Diameter dcoup 0,0015 mm 0,0000 0,0000 0,0000 0,0000 0,0000 0,0000 0,0000 0,0000 0,0000 0,0000 0,0000 0,0000 0,0000 0,0000 0,0000 0,0000 Coupler Volume Vcoup 0,4270 mm3 0,0006 0,0006 0,0006 0,0006 0,0006 0,0006 0,0006 0,0006 0,0006 0,0006 0,0006 0,0006 0,0006 0,0005 0,0005 0,0005
Coupler Surface Area Scoup 0,1360 mm2 0,0000 0,0000 0,0000 0,0000 0,0000 0,0000 0,0000 0,0000 0,0000 0,0000 0,0000 0,0000 0,0000 0,0000 0,0000 0,0000 Static Pressure Ps 0,0137 kPa 0,0006 0,0006 0,0006 0,0006 0,0006 0,0006 0,0006 0,0006 0,0006 0,0006 0,0006 0,0006 0,0005 0,0005 0,0005 0,0005 Temperature T 0,1733 K 0,0001 0,0001 0,0001 0,0001 0,0001 0,0001 0,0001 0,0001 0,0001 0,0001 0,0000 0,0000 0,0000 0,0000 0,0000 0,0000
Relative Humidity RH 1,9370 % 0,0001 0,0001 0,0001 0,0001 0,0001 0,0001 0,0001 0,0001 0,0001 0,0001 0,0001 0,0001 0,0001 0,0001 0,0001 0,0001 Coupler Leakage Table 0,4866 0,3472 0,2449 0,1711 0,1190 0,0829 0,0583 0,0417 0,0305 0,0229 0,0175 0,0134 0,0102 0,0035 0,0010 0,0007
Microphone Parameters
Front Cavity Depth Lf 0,0025 mm 0,0001 0,0001 0,0001 0,0001 0,0001 0,0001 0,0000 0,0000 0,0000 0,0000 0,0000 0,0000 0,0000 0,0000 0,0000 0,0000 Front Cavity Volume Vf 0,6860 mm3 0,0018 0,0018 0,0018 0,0018 0,0018 0,0018 0,0018 0,0018 0,0018 0,0018 0,0018 0,0018 0,0018 0,0018 0,0018 0,0018 Equivalent Volume Veq 1,0620 mm3 0,0024 0,0025 0,0025 0,0025 0,0025 0,0026 0,0026 0,0026 0,0026 0,0026 0,0026 0,0026 0,0027 0,0027 0,0027 0,0027
Resonance Frequency fo 510 Hz 0,0000 0,0000 0,0000 0,0000 0,0000 0,0000 0,0000 0,0000 0,0000 0,0000 0,0000 0,0000 0,0000 0,0000 0,0000 0,0000 Loss Factor D 0,0800 0,0000 0,0000 0,0000 0,0000 0,0000 0,0000 0,0000 0,0000 0,0000 0,0000 0,0000 0,0000 0,0000 0,0000 0,0000 0,0000
Additional Heat Conduction
Caused by Front Cavity Thread
0,0000 0,0000 0,0000 0,0000 0,0000 0,0000 0,0000 0,0000 0,0000 0,0000 0,0000 0,0000 0,0000 0,0000 0,0000 0,0000
Polarizing Voltage Uo 0,0064 V 0,0005 0,0005 0,0005 0,0005 0,0005 0,0005 0,0005 0,0005 0,0005 0,0005 0,0005 0,0005 0,0005 0,0005 0,0005 0,0005
Imperfection of Theory Heat Conduction Theory 0,0000 0,0000 0,0000 0,0000 0,0000 0,0000 0,0000 0,0000 0,0000 0,0000 0,0000 0,0000 0,0000 0,0000 0,0000 0,0000
Adding of Excess Volume
0,0000 0,0000 0,0000 0,0000 0,0000 0,0000 0,0000 0,0000 0,0000 0,0000 0,0000 0,0000 0,0000 0,0000 0,0000 0,0000
Radial Wave Motion 0,0000 0,0000 0,0000 0,0000 0,0000 0,0000 0,0000 0,0000 0,0000 0,0000 0,0000 0,0000 0,0000 0,0000 0,0000 0,0000 Processing of Results
Rounding Error 0,0050 dB 0,0029 0,0029 0,0029 0,0029 0,0029 0,0029 0,0029 0,0029 0,0029 0,0029 0,0029 0,0029 0,0029 0,0029 0,0029 0,0029 Repeatability of Measurements
Meas. dB 0,0443 0,0306 0,0215 0,0149 0,0112 0,0083 0,0068 0,0061 0,0057 0,0056 0,0055 0,0055 0,0057 0,0059 0,0060 0,0060
Static Pressure Corrections
0,0032 0,0032 0,0032 0,0032 0,0032 0,0032 0,0032 0,0032 0,0032 0,0032 0,0032 0,0032 0,0032 0,0032 0,0032 0,0032
Temperature Corrections
0,0011 0,0011 0,0011 0,0011 0,0011 0,0011 0,0011 0,0011 0,0011 0,0011 0,0011 0,0011 0,0011 0,0011 0,0010 0,0010
Sum 0,4916 0,3523 0,2508 0,1786 0,1288 0,0958 0,0749 0,0511 0,0422 0,0368 0,0219 0,0187 0,0165 0,0108 0,0103 0,0102 Expanded Uncertainty
(k=2) 0,9831 0,7046 0,5017 0,3572 0,2576 0,1915 0,1498 0,1022 0,0844 0,0736 0,0439 0,0374 0,0331 0,0215 0,0205 0,0204
Stated Uncertainty 0,99 0,71 0,51 0,36 0,26 0,20 0,15 0,12 0,10 0,08 0,06 0,04 0,03 0,03 0,03 0,03

NPL
35
Type B sources - rectangular distribution applies unless stated 1,00 2,00 2,50 3,15 4,00 5,00 6,30 8,00 10,0 12,5 16,0 20,0 25,0 31,5
Static pressure - drift between measurements 43 43 43 43 43 43 43 43 43 43 43 43 43 43Static pressure - instrument calibration uncertainty 5 5 5 5 5 5 5 5 5 5 5 5 5 5Ratio of specific heats 60 60 60 60 60 60 60 60 60 60 60 60 60 6Piston diameter 108 108 108 108 108 108 108 108 108 108 108 108 108 108Optical wavelength 7 7 7 7 7 7 7 7 7 7 7 7 7 7Fringe count rate - resolution 17 17 17 17 17 17 17 17 17 17 17 17 17 17Fringe count rate - erroneous counting 174 174 174 174 174 174 174 174 174 174 174 174 174 174Fringe count rate - quantisation error 9 9 9 9 9 9 9 9 9 9 9 9 9 9Fringe count rate - instrument calibration uncertainty 1 1 1 1 1 1 1 1 1 1 1 1 1 1Cavity volume 136 136 136 136 136 136 136 136 136 136 136 136 136 136Waveform crest factor 91 91 91 32 13 13 13 13 13 13 0 0 0 0Heat conduction theory 1133 816 729 660 576 516 459 408 366 327 288 258 231 204Vibration sensitivity 195 195 195 195 195 195 195 195 195 195 195 195 195 195Pressure coefficients 35 35 35 35 35 35 35 35 35 35 35 35 35 35Temperature coefficients 50 50 50 50 50 50 50 50 50 50 50 50 50 50Open-circuit voltage - accuracy of balancing voltages 217 217 174 130 104 87 87 87 35 10 10 10 10 10Open-circuit voltage - instrument calibration uncertainty 210 160 160 160 160 160 160 160 160 120 120 62 62 35Simultaneous measurement of sound pressure & voltage 44 30 26 18 13 13 9 9 0 0 0 0 0 0Polarising voltage 22 22 22 22 22 22 22 22 22 22 22 22 22 2
ESTIMATE OF S.D. (σB) 706 534 485 443 399 369 343 321 300 277 262 244 235 225σΒ = [Σ (a2/3)]1/2
Type A sources - normal distribution with n →∞ applies unless stated 1,00 2,00 2,50 3,15 4,00 5,00 6,30 8,00 10,0 12,5 16,0 20,0 25,0 31,5
Allowed repeatability 1000 600 600 500 400 300 300 200 200 200 200 200 200 200
ESTIMATE OF S.D. (σA) 1000 600 600 500 400 300 300 200 200 200 200 200 200 200σΑ = [Σ (a2)]1/2
1,00 2,00 2,50 3,15 4,00 5,00 6,30 8,00 10,0 12,5 16,0 20,0 25,0 31,5
Type B at k =2 (2σ B) 1411 1069 969 885 798 738 686 641 599 554 524 489 470 449Type A at k =2 (2σ A) 2000 1200 1200 1000 800 600 600 400 400 400 400 400 400 400
Overall Uncertainty at k=2 2448 1607 1543 1336 1130 951 911 756 721 683 659 631 617 602σ = 2(σA
0
2
2+σB2)1/2
QUOTE 0,25 0,17 0,16 0,14 0,12 0,10 0,10 0,08 0,08 0,07 0,07 0,07 0,07 0,06
Overal uncertainty (10-4 dB)Frequency (Hz)
Components of type B uncertainty expressed a semi-ranges (10-4 dB)Frequency (Hz)
Components of type A uncertainty expressed a standard deviations (10-4 dB)Frequency (Hz)

PTB 123456789101112131415161718192021222324252627
A B C D E F J K L M N O P QLS1P microphones Frequency in Hz
2 4 8 16 31,5 63 125 250
Type A uncertainty, as standard deviation (10-4 dB)
Source of uncertaint
282930313233343536373839404142434445464748495051525354
36
yNormal distribution
Repeatibility 900 500 300 150 100 100 100 100
Estimate of a type A uncertainty (S.D.), k=1 900 500 300 150 100 100 100 100
Type B uncertainty, as semi-ranges (10-4 dB)
Source of uncertaintyRectangular distribution
Measurement Capacitor 100 100 100 75 50 50 50 50Polarization Voltage 22 22 22 22 22 22 22 22
Microphone parameters Total effective volume 100 100 100 100 100 100 100 100
Corrections Heat conduction 400 300 200 150 100 70 50 40
Couplers Volume 30 30 30 30 30 30 30 30
Correction of results to normal environmental conditionStatic pressure 40 40 40 40 40 40 40 40Temperature 20 20 20 20 20 20 20 20
Environmental conditions Static pressure 30 30 30 30 30 30 30 30Temperature 5 5 5 5 5 5 5 5Humidity 5 5 5 5 5 5 5 5
Rounding error 50 50 50 50 50 50 50 50
Estimate of type B uncertainty (S.D.), k=1 250 197 149 122 99 90 85 84
Overall uncertainty (10-4 dB)
Type A, k=2 1800 1000 600 300 200 200 200 200Type B, k=2 499 395 299 245 198 180 171 167
Overall uncertainty, k=2 1868 1075 670 387 281 269 263 261
2 4 8 16 31,5 63 125 250
Standard Uncertainty (x 10–4 dB)
Frequency (Hz) SOURCE OF UNCERTAINTY Probability distribution
Input value Unit
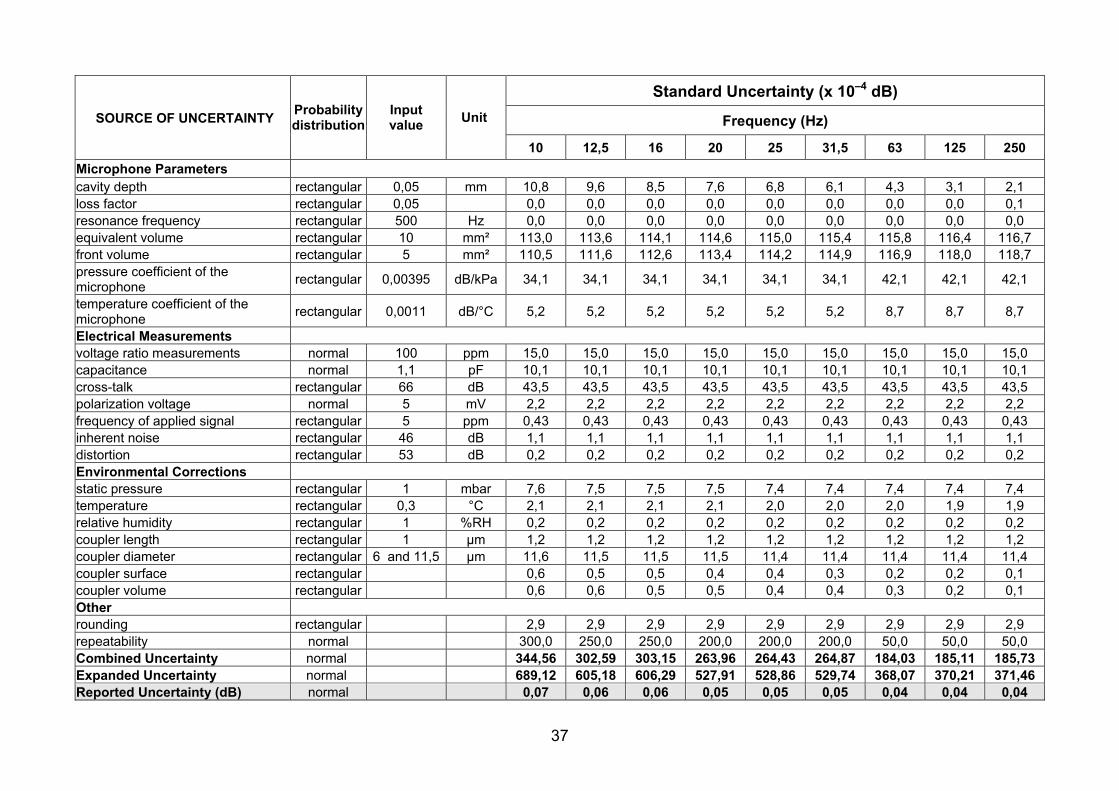
10 12,5 16 20 25 31,5 63 125 250 Microphone Parameters cavity depth rectangular 0,05 mm 10,8 9,6 8,5 7,6 6,8 6,1 4,3 3,1 2,1 loss factor rectangular 0,05 0,0 0,0 0,0 0,0 0,0 0,0 0,0 0,0 0,1 resonance frequency rectangular 500 Hz 0,0 0,0 0,0 0,0 0,0 0,0 0,0 0,0 0,0 equivalent volume rectangular 10 mm² 113,0 113,6 114,1 114,6 115,0 115,4 115,8 116,4 116,7 front volume rectangular 5 mm² 110,5 111,6 112,6 113,4 114,2 114,9 116,9 118,0 118,7 pressure coefficient of the microphone rectangular 0,00395 dB/kPa 34,1 34,1 34,1 34,1 34,1 34,1 42,1 42,1 42,1
temperature coefficient of the microphone rectangular 0,0011 dB/°C 5,2 5,2 5,2 5,2 5,2 5,2 8,7 8,7 8,7
Electrical Measurements voltage ratio measurements normal 100 ppm 15,0 15,0 15,0 15,0 15,0 15,0 15,0 15,0 15,0 capacitance normal 1,1 pF 10,1 10,1 10,1 10,1 10,1 10,1 10,1 10,1 10,1 cross-talk rectangular 66 dB 43,5 43,5 43,5 43,5 43,5 43,5 43,5 43,5 43,5 polarization voltage normal 5 mV 2,2 2,2 2,2 2,2 2,2 2,2 2,2 2,2 2,2 frequency of applied signal rectangular 5 ppm 0,43 0,43 0,43 0,43 0,43 0,43 0,43 0,43 0,43 inherent noise rectangular 46 dB 1,1 1,1 1,1 1,1 1,1 1,1 1,1 1,1 1,1 distortion rectangular 53 dB 0,2 0,2 0,2 0,2 0,2 0,2 0,2 0,2 0,2
Environmental Corrections static pressure rectangular 1 mbar 7,6 7,5 7,5 7,5 7,4 7,4 7,4 7,4 7,4 temperature rectangular 0,3 °C 2,1 2,1 2,1 2,1 2,0 2,0 2,0 1,9 1,9 relative humidity rectangular 1 %RH 0,2 0,2 0,2 0,2 0,2 0,2 0,2 0,2 0,2 coupler length rectangular 1 µm 1,2 1,2 1,2 1,2 1,2 1,2 1,2 1,2 1,2 coupler diameter rectangular 6 and 11,5 µm 11,6 11,5 11,5 11,5 11,4 11,4 11,4 11,4 11,4 coupler surface rectangular 0,6 0,5 0,5 0,4 0,4 0,3 0,2 0,2 0,1 coupler volume rectangular 0,6 0,6 0,5 0,5 0,4 0,4 0,3 0,2 0,1
Other rounding rectangular 2,9 2,9 2,9 2,9 2,9 2,9 2,9 2,9 2,9 repeatability normal 300,0 250,0 250,0 200,0 200,0 200,0 50,0 50,0 50,0 Combined Uncertainty normal 344,56 302,59 303,15 263,96 264,43 264,87 184,03 185,11 185,73 Expanded Uncertainty normal 689,12 605,18 606,29 527,91 528,86 529,74 368,07 370,21 371,46 Reported Uncertainty (dB) normal 0,07 0,06 0,06 0,05 0,05 0,05 0,04 0,04 0,04
37

UME UNCERTAINTY BUDGET FOR CCAUV.A-K2 COMPARISON
Frequency pressure temperature humidity coupler
mic - Front cavity
mic. Press. Coef.
mic. Temp. Coef.
mic. Volume
mic. Freq. reson.
Polarization voltage
V1, V2, V3 Capacity
(Hz) u2(p) u2(T) u2(Hr) u2(cpl-
L2) u2(cpl-
d2) u2(cpl-
V2) u2(cpl-
S2) u2(mic-
Lf) u2(mic-
cp) u2(mic-
ct) u2(mic-Vf+Veq)
u2(mic-f0) u2(Vo) u2(V) u2(C)
2 1,E-06 1,E-06 8,E-08 3,E-06 2,E-06 4,E-12 3,E-11 3,E-07 5,E-05 4,E-06 6,E-05 3,E-07 1,E-05 2,E-05 5,E-06 2,5 1,E-06 1,E-06 8,E-08 3,E-06 2,E-06 0,E+00 3,E-11 2,E-07 6,E-05 3,E-06 6,E-05 3,E-07 1,E-05 2,E-05 5,E-06
3,15 1,E-06 1,E-06 8,E-08 3,E-06 2,E-06 4,E-12 1,E-11 2,E-07 6,E-05 3,E-06 6,E-05 2,E-07 1,E-05 2,E-05 5,E-06 4 1,E-06 1,E-06 8,E-08 3,E-06 2,E-06 0,E+00 1,E-11 2,E-07 6,E-05 3,E-06 6,E-05 2,E-07 1,E-05 2,E-05 5,E-06 5 1,E-06 1,E-06 8,E-08 3,E-06 2,E-06 0,E+00 1,E-11 1,E-07 6,E-05 3,E-06 7,E-05 1,E-07 1,E-05 2,E-05 5,E-06
6,3 1,E-06 1,E-06 8,E-08 3,E-06 2,E-06 0,E+00 1,E-11 1,E-07 6,E-05 3,E-06 7,E-05 1,E-07 1,E-05 2,E-05 5,E-06 8 1,E-06 9,E-07 7,E-08 3,E-06 2,E-06 4,E-12 4,E-12 8,E-08 6,E-05 3,E-06 7,E-05 8,E-08 1,E-05 2,E-05 5,E-06 10 1,E-06 9,E-07 7,E-08 3,E-06 2,E-06 0,E+00 1,E-11 6,E-08 6,E-05 3,E-06 7,E-05 6,E-08 1,E-05 2,E-05 5,E-06
12,5 1,E-06 9,E-07 7,E-08 3,E-06 2,E-06 4,E-12 4,E-12 5,E-08 6,E-05 2,E-06 7,E-05 5,E-08 1,E-05 2,E-05 5,E-06 16 1,E-06 8,E-07 7,E-08 3,E-06 2,E-06 0,E+00 4,E-12 4,E-08 6,E-05 2,E-06 7,E-05 4,E-08 1,E-05 2,E-05 5,E-06 20 1,E-06 8,E-07 7,E-08 3,E-06 2,E-06 4,E-12 4,E-12 3,E-08 6,E-05 2,E-06 7,E-05 3,E-08 1,E-05 2,E-05 5,E-06 25 1,E-06 8,E-07 7,E-08 3,E-06 2,E-06 0,E+00 4,E-12 3,E-08 6,E-05 2,E-06 7,E-05 3,E-08 1,E-05 2,E-05 5,E-06
31,5 1,E-06 8,E-07 7,E-08 3,E-06 2,E-06 4,E-12 0,E+00 2,E-08 5,E-05 2,E-06 7,E-05 2,E-08 1,E-05 2,E-05 5,E-06 63 1,E-06 7,E-07 7,E-08 3,E-06 2,E-06 4,E-12 0,E+00 1,E-08 5,E-05 2,E-06 8,E-05 1,E-08 1,E-05 2,E-05 5,E-06
125 7,E-07 7,E-07 7,E-08 2,E-06 1,E-06 0,E+00 4,E-12 5,E-09 5,E-05 2,E-06 8,E-06 5,E-09 1,E-05 2,E-05 5,E-06 250 4,E-07 7,E-07 7,E-08 1,E-06 1,E-06 0,E+00 4,E-12 2,E-09 5,E-05 2,E-06 7,E-06 3,E-09 1,E-05 2,E-05 5,E-06
38

39
Frequency type A uncertainty rounding
(Hz) ua2 = (s/raiz(n))2 νι u(round) u(leak) uc=raiz(u2(x)) U(k=2)
2 2,E-05 1,E+01 6,E-05 5,E-03 5,E-03 0,07 0,141 2,5 7,E-06 1,E+01 6,E-05 3,E-03 3,E-03 0,06 0,112
3,15 5,E-06 1,E+01 6,E-05 2,E-03 2,E-03 0,05 0,092 4 3,E-06 1,E+01 6,E-05 2,E-03 2,E-03 0,04 0,087 5 2,E-06 1,E+01 6,E-05 1,E-03 1,E-03 0,04 0,076
6,3 2,E-06 1,E+01 6,E-05 1,E-03 1,E-03 0,04 0,076 8 8,E-06 1,E+01 6,E-05 1,E-03 1,E-03 0,04 0,075 10 3,E-06 1,E+01 6,E-05 9,E-04 1,E-03 0,03 0,066
12,5 2,E-06 1,E+01 6,E-05 8,E-04 1,E-03 0,03 0,064 16 3,E-06 1,E+01 6,E-05 7,E-04 9,E-04 0,03 0,061 20 4,E-06 1,E+01 6,E-05 5,E-04 8,E-04 0,03 0,055 25 5,E-06 1,E+01 6,E-05 3,E-04 5,E-04 0,02 0,046
31,5 6,E-06 1,E+01 6,E-05 3,E-04 5,E-04 0,02 0,044 63 8,E-06 8,E+00 6,E-05 0,E+00 2,E-04 0,02 0,031
125 7,E-06 1,E+01 6,E-05 0,E+00 2,E-04 0,01 0,025 250 6,E-06 1,E+01 6,E-05 0,E+00 2,E-04 0,01 0,025
CEM - Uncertainty budget


ν
where
41
B
VNIIFTRI Uncertainty budget for pressure reciprocity calibration of LS1P microphones A summary of the uncertainty analysis for pressure reciprocity calibration of microphones type LS1P is given below. 1. Type B uncertainty u was calculated using the equation:
,3
11
2
∑=
⎟⎟⎠
⎞⎜⎜⎝
⎛Δ
∂∂
=N
ii
iB x
xMu
where M is the microphone pressure sensitivity level;
ii
xxM
Δ∂∂
A
are components of type B uncertainty given in Table 1;
N is the number of components (N = 13). Each component was assumed to be uniformly distributed. 2. Type A uncertainty u was estimated as:
( ),
)1(1
2
−
−=
∑=
mm
yyu
m
jj
A
jy
where m is the number of measurements (m = 3); is the result the sensitivity level measurement with index j ; y is the average sensitivity level. 3. The expanded uncertainty U was calculated using the equation:
( )
ν is the number of effective degrees of freedom (see Table 1):
,)( 2295.0 BA uutU +⋅= ν
112
2
2
⎟⎟⎠
⎞⎜⎜⎝
⎛+−=
A
B
uu
m
95.0t ( )ν is the coverage factor for the level of confidence 0.95 and the degrees of freedom
;
ν , calculated as the corresponding Student’s distribution quantile.

42
Uncertainty budget for reciprocity calibration of LS1P microphones Frequency, Hz Source Δxi 2 2.5 3.15 4 5 6.3 8 10 12.5 16 20 25 31.5 63 125 250
Components of type B uncertainty, 10-3 dB. Symbol: ii
xxM
Δ∂∂
Electrical Parameters Electrical transfer impedance 0.01 dB 30 30 30 30 30 30 30 30 30 30 30 30 30 30 30 30 Microphone Equivalent volume 5 mm3 11.6 11.8 11.9 12.0 12.1 12.2 12.3 12.4 12.5 12.6 12.6 12.6 12.6 12.7 12.8 12.9 Resonance frequency 20 Hz 0 0 0 0 0 0 0 0 0 0 0 0 0 0 0 0 Loss factor 0.05 0 0 0 0 0 0 0 0 0 0 0 0 0 0 0 0.02 Front cavity depth 0.01 mm 6.32 6.41 6.49 6.56 6.62 6.67 6.72 6.76 6.80 6.83 6.86 6.89 6.91 6.97 7.01 7.03 Additional surface area 4 mm2 3.35 2.98 2.64 2.34 2.08 1.85 1.64 1.46 1.31 1.15 1.03 0.92 0.82 0.58 0.41 0.29 Coupler Length 0.01 mm 3.39 3.40 3.42 3.43 3.44 3.45 3.46 3.47 3.47 3.48 3.48 3.49 3.49 3.50 3.51 3.51 Diameter 0.01 mm 3.04 3.02 3.00 2.98 2.97 2.96 2.94 2.93 2.92 2.92 2.91 2.90 2.90 2.88 2.87 2.86 Environmental Conditions Pressure 20 Pa 0.85 0.84 0.84 0.83 0.83 0.82 0.82 0.82 0.82 0.81 0.81 0.81 0.81 0.80 0.80 0.85 Temperature 2 °C 3.18 2.87 2.58 2.32 2.11 1.91 1.73 1.58 1.45 1.32 1.22 1.12 1.04 0.83 0.70 0.61 Relative humidity 20 %RH 1.20 1.19 1.18 1.18 1.17 1.17 1.16 1.16 1.16 1.15 1.15 1.15 1.15 1.14 1.14 1.14 Corrections to reference environmental conditions
4
Pressure correction 5*10-4 dB 1.50 1.50 1.50 1.50 1.50 1.50 1.50 1.50 1.50 1.50 1.50 1.50 1.50 1.50 1.50 1.50 Temperature correction 16*10-4 dB 4.80 4.80 4.80 4.80 4.80 4.80 4.80 4.80 4.80 4.80 4.80 4.80 4.80 4.80 4.80 4.80 Total type B uncertainty. Symbol: Bu 13.3 13.3 13.3 13.3 13.3 13.3 13.3 13.3 13.4 13.4 13.4 13.4 13.4 13.5 13.5 13.5
Type A uncertainty, 10-3 dB. Symbol: AuStandard deviation of 3 measurements 25 22 19 16 13 11 9 7 6 5 5 4 4 4 4
Effective degrees of freedom. Symbol: ν 3.28 3.72 4.43 5.71 8.38 12.2 20.4 43.0 71.1 103 177 300 300 303 305 306
Coverage factor for the level of confidence 0.95. Symbol: )(95.0 νt
3.03 2.86 2.67 2.48 2.29 2.18 2.08 2.02 1.99 1.98 1.97 1.97 1.97 1.97 1.97 1.97 Expanded uncertainty, 10-3 dB. Symbol: U
86 74 62 52 43 38 34 30 29 29 28 28 28 28 28 28

43
16 Appendix B
16.1Time table
NMI Period of receiving of the microphones
Period for calibration including the
transportation of microphones to the next
NMI
Notice
BEV -
DPLA 10. - 16.01.2005 17.01. - 6.02.2005
BEV 7. - 13. 02.2005 14.02. - 6.03.2005
NMIJ 7. - 13.03.2005 14.03. - 03.04.2005
BEV 4. - 10.04.2005 11.04. - 1.05.2005
KRISS 2.05. - 8.05.2005 9.- 29.05.2005
BEV 30.05. - 5.06.2005 6.- 26.06.2005
NPL 27.06. - 3.07.2005 4.07.- 24.07.2005
BEV 25.- 31.07.2005 1.- 21.08.2005
PTB 22.- 28.08.2005 28.08. - 18.09.2005
BEV 19.09. - 25.09.2005 26.09. - 16.10.2005
CEM 17.- 23.10.2005 24.10-13.11.2005
BEV 14. - 20.11. 2005 21.11. - 11.12.2005
UME 12. - 18.12.2005 19.12. - 8.01.2006
BEV 9. - 15.1.2006 16.01.- 5.2.2006
BEV 6. - 12.02.2006 13.02. - 5.03.2006 NIST didn’t participate
BEV 6. - 12.03.2006 13.03. - 2.4.2006
VNIIFTRI 3. - 9.04.2006 . -.09.2006
BEV - 27.09.2006
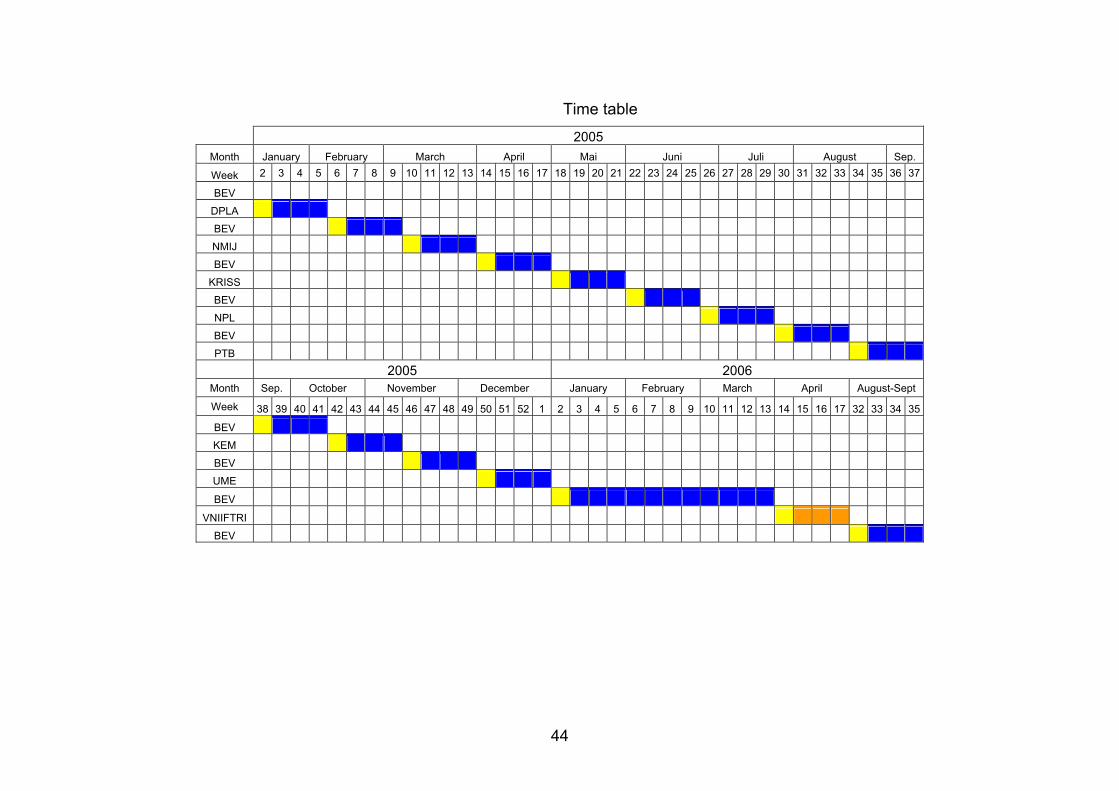
44
Time table
2005 Month January February March April Mai Juni Juli August Sep.
Week 2 3 4 5 6 7 8 9 10 11 12 13 14 15 16 17 18 19 20 21 22 23 24 25 26 27 28 29 30 31 32 33 34 35 36 37
BEV DPLA BEV NMIJ BEV
KRISS BEV NPL BEV PTB
2005 2006 August-Sept Month Sep. October November December January February March April
Week 38 39 40 41 42 43 44 45 46 47 48 49 50 51 52 1 2 3 4 5 6 7 8 9 10 11 12 13 14 15 16 17 32 33 34 35
BEV KEM BEV UME BEV
VNIIFTRI BEV

45
16.2 Contact List Contact person Contact person Anatoly Konkov All-Russian Institute of Physical-Technical Radiotechnical Measurements Mendeleevo RU – 141570 Moscow region Telefon: +7 095 535 9256 Telefax: +7 095 744 8128 E-Mail: [email protected] VNIIFTRI, Russia
Richard Barham National Physical Laboratory Queens Road Teddington Middlesex TW11 0LW Telefon: +44 (0) 20 8943 6725 Telefax: +44 (0) 20 8943 6217 E-Mail: [email protected] NPL, UK
Carmen Casal Sobrino Centro Espanol de Metrologia Alfar, 2 ES – 28760 Tres Cantos (Madrid Telefon: +34 91 807 48 25 Telefax: +34 91 807 48 07 E-Mail: [email protected] CEM, Spain
Ryuzo Horiuchi National Metrology Institute of Japan Tsukuba Central 3 1-1-1 Umezono, Tsukuba, Ibaraki, 305-8563 Tel : + 81 298 61 5585 Fax : + 81 298 61 2226 [email protected] NMIJ, Japan
Enver Sadikoglu Ulusal Metroloji Enstitüsü Tübitak, UME P.O. Box 54 TR – Gebze, Kocaeli 41470 Telefon: +90 262 679 50 00 Telefax: +90 262 679 50 01 E-Mail: [email protected] UME, Turkey
Sang Joon Suh P.O.Box 102, Yuseong, Daejeon 305-600, Telefon:+82-42-868-5300 Telefax:+82-428685643 e-Mail: [email protected] KRISS, Republic of Korea
Knud Rasmussen Danish Primary Laboratory of Acoustics Brüel & Kjaer A/S, Skodsborgvej 307 DK – 2850 Naerum Telefon: +45 45 25 39 37 Telefax: +45 45 88 05 77 E-Mail: [email protected] DPLA/DTU, Denmark
Thomas Fedtke Physikalisch-Technische Bundesanstalt, Braunschweig Department 1.6 - Sound Phone: +49 531 592 1511 Mobile: +49 174 6986502 Fax: +49 531 592 691511 E-Mail: [email protected] PTB, Germany
Merita Sinojmeri Bundesamt für Eich- und Vermessungswesen Arltgasse 35 1160 Wien Telefon: +43 1 49 21110 6390 Telefax: +43 1 49 21110 6000 E-Mail: [email protected] BEV, Austria