report from the review of the global school budgets
TRANSCRIPT

Government School Funding in the Northern Territory
Review of the Global School Budgets Funding Model
Department of Education Northern Territory Government
September 2017

Northern Territory Government Department of Education
Government School Funding in the Northern Territory, Australia EY i
EY would like to thank the executive and staff of the Department of Education, school principals and business managers and stakeholder organisations that actively participated in the engagement between May and July 2017. Their input and collaboration contributed to the findings and recommendations presented in this report.
We recognise that this project occurred at a time when the Department, schools, and stakeholder organisations had competing demands on time and resources. We appreciate the time given to participate in discussions regarding the future of the Global School Budgets Funding Model in the Northern Territory.

Northern Territory Government Department of Education
Government School Funding in the Northern Territory, Australia EY i
Notice
Ernst & Young was engaged on the instructions of the Department of Education to conduct a review of the Global School Budgets Funding Model, in accordance with the order of services dated 24 April 2017.
The results of Ernst & Young’s work, including the assumptions and qualifications made in preparing the report, are set out in Ernst & Young's report dated 7 September 2017 ("Report"). The Report should be read in its entirety including this public release notice, the applicable scope of the work and any limitations. A reference to the Report includes any part of the Report. No further work has been undertaken by Ernst & Young since the date of the Report to update it.
Ernst & Young has prepared the Report for the benefit of the Department of Education and has considered only the interests of the Department of Education. Ernst & Young has not been engaged to act, and has not acted, as an advisor to any other party. Accordingly, Ernst & Young makes no representations as to the appropriateness, accuracy or completeness of the Report for any other party's purposes.
The Report has been constructed based on information current as of 31 July 2017 (being the date of the last data received), and which has been provided by the Client and other industry stakeholders. Since this date, material events may have occurred since completion which are not reflected in the Report.
No reliance may be placed upon the Report or any of its contents by any recipient of the Report for any purpose and any party receiving a copy of the Report must make and rely on their own enquiries in relation to the issues to which the Report relates, the contents of the Report and all matters arising from or relating to or in any way connected with the Report or its contents.
Ernst & Young disclaims all responsibility to any other party for any loss or liability that the other party may suffer or incur arising from or relating to or in any way connected with the contents of the Report, the provision of the Report to the other party or the reliance upon the Report by the other party.
No claim or demand or any actions or proceedings may be brought against Ernst & Young arising from or connected with the contents of the Report or the provision of the Report to any party. Ernst & Young will be released and forever discharged from any such claims, demands, actions or proceedings.
Ernst & Young has prepared this analysis in conjunction with, and relying on information provided by the Client and other industry stakeholders. We do not imply, and it should not be construed, that we have performed audit or due diligence procedures on any of the information provided to us. We have not independently verified, or accept any responsibility or liability for independently verifying, any such information nor do we make any representation as to the accuracy or completeness of the information. We accept no liability for any loss or damage, which may result from your reliance on any research, analyses or information so supplied.
It is important to note that the identification of financial impact is not a precise science.
Ernst & Young have consented to the Report being published electronically on the Department of Education website for informational purposes only. Ernst & Young have not consented to distribution or disclosure beyond this. The material contained in the Report, including the Ernst & Young logo, is copyright and copyright in the Report itself vests in the Department of Education. The Report, including the Ernst & Young logo, cannot be altered without prior written permission from Ernst & Young.
Ernst & Young’s liability is limited by a scheme approved under Professional Standards Legislation.
Northern Territory Government Department of Education
Government School Funding in the Northern Territory, Australia EY ii
1. Executive summary ........................................................................................................... 2
1.1 Background and context ................................................................................................................. 2
1.2 Findings and recommendations ....................................................................................................... 4
2. Background and context .................................................................................................. 11
2.1 Transitioning to student needs funding .......................................................................................... 11
2.2 The NT has high levels of disadvantage and complex student needs ................................................ 12
2.3 Overview of our approach............................................................................................................. 17
3. Consultations and survey findings ..................................................................................... 20
3.1 Snapshot of survey findings .......................................................................................................... 20
3.2 What’s working? .......................................................................................................................... 21
3.3 What could be improved? ............................................................................................................. 22
4. Key findings and recommendations ................................................................................... 27
4.1 Solution theme 1 What support is required by schools through targeted investment? ...................... 29
4.1.1 Key Finding 1 .........................................................................................................................30
4.1.2 Key Finding 2 .........................................................................................................................31
4.2 Solution theme 2 Is the current approach to budget allocation efficient in distributing a finite pool of funding? ............................................................................................................................................... 32
4.2.1 Key Finding 3 .........................................................................................................................38
4.2.2 Key Finding 4 .........................................................................................................................40
4.3 Solution theme 3 How can efficient investment by schools in the needs of their students be facilitated and monitored? ..................................................................................................................................... 41
4.3.1 Key Finding 5 .........................................................................................................................43
4.3.2 Key Finding 6 .........................................................................................................................43
4.3.3 Key Finding 7 .........................................................................................................................44
4.3.4 Key Finding 8 .........................................................................................................................45
4.3.5 Key Finding 9 .........................................................................................................................46
4.4 Solution theme 4 How can funding be better targeted to student needs? ........................................ 47
4.4.1 Key Finding 10 .......................................................................................................................48
4.4.2 Key Finding 11 .......................................................................................................................53
4.4.3 Key Finding 12 .......................................................................................................................58
5. Implementation of recommendations ................................................................................ 60
6. Performance measures .................................................................................................... 62
Appendix A Our approach ................................................................................................... 64
Purpose of the review ............................................................................................................................ 64
Review limitations .................................................................................................................................. 65
Consultation and data approaches .......................................................................................................... 65
Appendix B Case study schools ............................................................................................ 67
Appendix C List of stakeholders consulted ............................................................................ 68
Appendix D Information sources .......................................................................................... 70
Appendix E Survey approach ............................................................................................... 71
Table of contents
Northern Territory Government Department of Education
Government School Funding in the Northern Territory, Australia EY iii
Table of figures Figure 1. NTG and Australian Government education initiatives ..................................................................... 11 Figure 2. Comparison of national and NT ICSEA score distribution.................................................................. 12 Figure 3. School based staffing and NTG funding........................................................................................... 13 Figure 4. Fundamental principles of student needs funding ............................................................................ 14 Figure 5. Global School Budgets in 2017 ...................................................................................................... 16 Figure 6. GSBFM budget timeline ................................................................................................................. 16 Figure 7. Perceived transparency, efficiency and equity ................................................................................ 20 Figure 8. Effective enrolment impacts disadvantage schools .......................................................................... 33 Figure 9. Effective enrolment multipliers are higher than average attendance ................................................ 34 Figure 10. Comparison of ongoing and fixed period staff by year ................................................................... 35 Figure 11. Average proportion of fixed period to ongoing staff by remote categorisation (CT/ST/TP) ............... 35 Figure 12. Variable budget fluctuations represent a greater proportion of remote school budgets ................... 39 Figure 13. Fixed budget deficits and surpluses are increasing ........................................................................ 42 Figure 14. Comparison of current and recommended Aboriginal student weightings ....................................... 50 Figure 15. Breakdown of disability programs and funding for 2016 ................................................................ 56 Figure 16. Current distribution of all special needs funding for 2016 .............................................................. 57 Figure 17. Review approach ........................................................................................................................ 64 Figure 18. Review limitations ....................................................................................................................... 65
Table of tables Table 1. Key findings and recommendations ................................................................................................... 4 Table 2. Cross jurisdictional comparison of weightings .................................................................................. 15 Table 3. Solution themes and stakeholder issue mapping ............................................................................... 27 Table 4. Average proportion of fixed period to ongoing staff by effective enrolment ....................................... 35 Table 5. Five largest cash balances for GSBFM funded schools at end of 2016 ................................................ 41 Table 6. The five largest 2016 GSB budget surpluses for GSBFM funded schools ............................................. 43 Table 7. Impact of removing personal leave allocation from centrally held school corporate credit budget ........ 45 Table 8. Cost per student analysis of selected cost lines, in $ per student ....................................................... 48 Table 9. Average impact of targeting ESL funding to students with identified ESL needs ................................. 53 Table 10. Most impacted schools by targeting ESL funding to students with identified ESL needs..................... 53 Table 11. Year on year student teacher ratio analysis, by enrolments, for Special Education Schools ............... 56 Table 12. Year on year student funding levels in dollars per student .............................................................. 57 Table 13. Average impact of targeting disability funding to students with identified disability needs ................ 58 Table 14. The most impacted schools by targeting disability funding to students with identified disability needs 58 Table 15. Performance measures................................................................................................................. 62 Table 16. Consultation approach .................................................................................................................. 66 Table 17. Case study schools by geolocation and school type ........................................................................ 67 Table 18. Stakeholders consulted ................................................................................................................ 68 Table 19. Data sources and analysis ............................................................................................................. 70

Northern Territory Government Department of Education
Government School Funding in the Northern Territory, Australia EY iv
Glossary
Effective enrolment The methodology used to determine the student activity level in a school for the allocation of funding. Effective enrolment is calculated by averaging the two highest non-consecutive weeks of student activity in each term over 4 terms in a year.
Effective enrolment multiplier
Effective enrolment multiplier is the rate applied to the number of students enrolled in a school that results in the effectively enrolled number of students. For example, if a school has 100 students enrolled, and the average attendance of the two highest non-consecutive weeks in each term over 4 terms is 90, then the effective enrolment multiplier is 0.9.
Equity Fair distribution and use of school resources to give every student what they need to achieve success in education.
• Students can access the support they need to succeed.
• Teachers and school are equipped to tailor their practice to individual student need.
Efficiency Distribute funding as efficiently as possible with increased school autonomy and flexibility to:
• Target resources where evidence shows it makes the most difference for students.
• Allocate money effectively and appropriately to improve student outcomes.
Global School Budgets The one line annual budget allocated to each Northern Territory Government school, informed by the SNBFM.
Index of Community Socio-Educational Advantage (ICSEA)
ICSEA is a measure of relative socio-educational backgrounds of schools and takes into account student parental occupation and educational history, the proportion of Aboriginal students at a school and the geographical location of the school. The ICSEA value is distributed to have mean of 1,000 and a standard deviation of 100.
Aboriginal Concentration
Percentage of a school’s enrolled students who identify as being Aboriginal.
Nationally Consistent Collection of Data (NCCD)
Nationally Consistent Collection of Data (NCCD) on students with a disability is a joint initiative of all Australian governments and government and non-government authorities, whereby data is collected annually to identify the number of school students with disability across Australia in a consistent, reliable and systematic way.
Remote category The locations of Northern Territory Government schools are defined in the Public Sector Employment and Management Act By-law 42 as category 1, 2 and 3, with category 3 being the most remote location. In general, a remote location is defined as being outside the environs of Darwin, Katherine and Alice Springs, where access to health, education, social, financial, emergency, communication and professional support services is limited.
Socio-economic status (SES) score
The socio-economic status (SES) score applied in the SNBFM for each student ranges from 0 to 0.4 and is designed as a measure of socio-economic disadvantage where 0 represents the least level of disadvantage and 0.4 represents the most disadvantaged students. SES scores are structured to take into account the parental background of each student by recording both parents’ educational background and employment status in order to determine a relative level of disadvantage.
Student Needs Based Funding Model (SNBFM)
The model for calculating funding for the variable components of Global School Budgets for most schools. It uses student data from the Age/Grade Census and takes into account individual needs factor for each student to ‘weight’ their enrolment.
Small school supplement
Applied to very small schools (less than 52 effective enrolments) to recognise additional costs associated with small scale.
Transparency There is sufficient access to information to make informed decisions including:
• Ability to communicate to your school council/board and school community how funding has been allocated to meet student need.
• Better visibility of funding, resources and their allocation.

Northern Territory Government Department of Education
Government School Funding in the Northern Territory, Australia EY 1
Executive summary

Northern Territory Government Department of Education
Government School Funding in the Northern Territory, Australia EY 2
Background and context
The Department of Education (the Department) implemented the Global School Budgets Funding Model (GSBFM) in 2015 with the aim of providing schools with simpler, transparent, flexible and more predictable resourcing arrangements based on the needs of students and schools. When the Northern Territory (NT) Government introduced Global School Budgets, it was at a time of declining education funding, making for a difficult implementation environment. In 2015/16, NT Government appropriation attributed to government education was $53m (11%) less than in 2012/13, whilst the number of classroom teachers also decreased by 8.7%. Over the same period, student enrolments remained relatively stable, fluctuating between 1-2%. In 2016/17, there has been an increase in funding of $26m from 2015/16, the first increase since 2012/13. Although funding increased in 2016/17, this does not take into account Consumer Price Index (CPI) and wage increases experienced over the period 2012 to 2017.
Changes to school funding are not limited to the NT and school funding in Australia is experiencing major reform. In 2011, an expert panel chaired by David Gonski delivered the Review of Funding for Schooling (the Gonski Review) which identified that school funding lacked coherence and transparency, showed significant gaps between the highest and lowest performing students and that the lowest performing students were not meeting minimum standards of achievement. Linking low levels of achievement particularly to low socio-economic and Aboriginal backgrounds, the Gonski Review recommended a needs-based funding model. At the funding model’s core was the principle that all students should have access to a high standard of education regardless of their background or circumstances1.
The Gonski Review also highlighted that school funding in Australia was ad-hoc and imbalanced between jurisdictions and there were overlaps between Commonwealth, State and Territory funding priorities leading to duplication and inefficiencies. The findings of the review initiated school funding reforms around Australia with a majority of States and Territories moving towards a student needs-based funding model.
In 2014, Professor Stephen Lamb of Victoria University made a number of recommendations to establish a new needs based funding approach for NT Government Schools. The Department considered its own analysis and some recommendations in the report to form the foundation of the current Global School Budgets and Student Needs-Based Funding Model (SNBFM).
The NT Government introduced GSBFM in all NT Government schools in 2015, with the aim of providing schools with more autonomy in deciding how best to use the resources provided to meet the needs of students2. The GSBFM aims to distribute funds to schools equitably, efficiently and transparently. According to stakeholders, the reform was implemented quickly and it has taken schools time to familiarise themselves with the new model and transition to funding under the GSBFM.
Scope of the review
The GSBFM is in its third year of operation, and the Department engaged EY in April 2017 to review the GSBFM’s methods for allocating funding in an equitable, transparent and efficient manner. The review did not consider the sufficiency of the funding to education, but how the model distributes the current finite funding pool.
The review was conducted between May and July 2017, aimed to:
► Determine if the GSBFM allocates available funding in an equitable, transparent and efficient manner for better educational outcomes of NT Government school students.
► Identify potential improvements to the GSBFM within the available funding pool.
► Identify potential performance measures for the efficacy of the GSBFM.
EY performed a desktop review of relevant information, analysed the current GSBFM and engaged with the stakeholders to collect both qualitative and quantitative feedback on the GSBFM. Stakeholders were provided with an opportunity to express their views on the current model, and stakeholders included a selection, by the Department, of 21 government case study schools across the NT, departmental staff and
1 Gonski, D. et al. (2011). Review of Funding for Schooling - Final Report. Department of Education, Employment and Workplace Relations. https://docs.education.gov.au/system/files/doc/other/review-of-funding-for-schooling-final-report-dec-2011.pdf 2 NT Department of Education. (2017). Global school budgets. https://education.nt.gov.au/education/statistics-research-and-strategies/increasing-school-autonomy/global-school-budgets
1. Executive summary

Northern Territory Government Department of Education
Government School Funding in the Northern Territory, Australia EY 3
non-government stakeholders. These consultations were supplemented with a separate online survey to all NT Government schools conducted by EY.
The focus of the consultations and survey was on the model principles of equity, efficiency and transparency. Insights gathered were used to corroborate the evidence of the findings presented, which were validated through our data research using 2015, 2016 and some 2017 school and student data sourced from the Department during the consultation period. This process identified gaps and enabled our findings to be evidence based and practical costed; supporting the development of practical recommendations to improve the distribution of the existing funding pool aimed at school and student needs.
There are a number of broader reforms and reviews in the public and political domain currently underway. Some of these have not been completed to allow them to be considered as part of this review or they fall outside of the scope of our engagement (they are targeted at other parts of the education system, not funding directly). In any event, these findings may add additional evidence and context post this review.
Our detailed scope, assumptions and related limitations are outlined in Appendix A of this report.
Consultation and survey findings
As part of this review, 21 case study schools were consulted and an online survey was distributed to all school principals. The opportunity to participate in consultations was well-received and the survey had a 72% response rate.
Overall, the findings from the survey and consultation shows that the GSBFM has allowed schools additional flexibility and autonomy. However, as it is early in the implementation of the GSBFM and there are varying levels of maturity at the school and department level, there are adjustments to how the model works and targeted investments required in capability development at the school level and the broader systems and processes at the Department level.
Below is a summary of the key feedback themes further explored in the consultation and survey findings section and identifies the four solution themes, which are explored in the findings and recommendation section.

Northern Territory Government Department of Education
Government School Funding in the Northern Territory, Australia EY 4
Findings and recommendations
It is important to recognise that the recommendations made in this report are made within the limitation of the existing funding pool. Further, the recommendations made in this repot are based on survey findings and consultations as mentioned above and are subject to limitations outlined in this report. Any increase in funding to a cohort of students has had to be balanced by a reduction in funding to other students. The majority of stakeholders understood this premise and the scope of the review did not test the adequacy of funding. The test applied during consultations and in this analysis for any suggested redistribution of funds is not whether a school is receiving sufficient funds per student, but whether the available funding per student is distributed equitably, transparently and efficiently.
For complete appreciation of the context and basis, the below findings and recommendations should be read in conjunction with the analysis discussed later in this report.
The recommendations have been prioritised based on the materiality of the finding and readiness of Department processes and information sources for implementation.
A set of performance measures have been developed for the Department to monitor and track the progress of our recommendations. These are detailed in the performance measures section.
Table 1. Key findings and recommendations
Finding Recommendation Priority
Solution theme 1: What support is required by schools through targeted investment?
In its third year since implementation, it is clear that schools are at different stages in adopting the Global School Budgets reform and understanding of the GSBFM. Survey and case study school consultations demonstrated the full spectrum of maturity in the GSBFM implementation. Areas requiring improvement suggested by stakeholders included establishing a better governance structure, supporting schools to build their capabilities and understanding of the GSBFM, and providing early and targeted support for schools that need it.
Key Finding 1
Schools are at different points in their understanding and capability to manage the GSBFM. It was observed throughout this review, that there are examples of schools who were not ready for full autonomy, for a range of reasons, and are reliant on the central support currently provided. The review also observed examples of other schools that have the appropriate capability and resources to facilitate autonomy and innovation.
Similarly, the Department is also on its own journey of improving its processes and systems. As these mature, better support can be provided to schools.
Recommendation 1a
Investigate what support is required for schools to enhance capability and knowledge gaps of the GSBFM and drive continuous improvement.
This might include:
• Establishing an improved good governance structure to replace the Exceptional Circumstances Policy. The new structure should be proactive, responsive and provide schools with regular and early intervention support when expenditure is higher than allocated budget.
• Working with schools to continuously build an understanding of the GSBFM, specifically around weightings and effective enrolment. This may include suggestions and advice to schools on how to spend or manage funding using better practices from other schools.
• Undertaking a review of the enterprise data systems to identify improvements in how schools and the Department can better manage and monitor school budgets and expenditure.
• Expanding the level of corporate services and support offered to schools to manage their budget and other corporate issues, in particular around strategic workforce planning and managing workforce mix.
High

Northern Territory Government Department of Education
Government School Funding in the Northern Territory, Australia EY 5
Finding Recommendation Priority
Key Finding 2
There are varying support structures across the regions providing support services to small, regional and remote schools such as shared business managers. However, the ability to access this support and the level of support varies across schools.
Recommendation 2a
Identify what specific support is needed by small, regional and remote schools that are less comfortable with autonomy and are in the early stages of the improvement journey to assist in building their capabilities and understanding of the GSBFM. The support should be accessible and consistent across all schools and help address any staff resourcing and capability challenges they may face.
High
Solution theme 2: Is the current approach to budget allocation efficient in distributing a finite pool of funding?
High levels of budget variability were consistently raised as a key issue for stakeholders. Whilst funding based on student needs is inherently variable as enrolments and individual student needs change from year to year, this variability is further impacted in the NT through the additional application of effective enrolment. Effective enrolment attempts to distribute finite funding based on attendance peaks, to the schools with children attending and in front of the teacher.
Key Finding 3
At this time, with a finite funding pool, effective enrolment is the most appropriate measure to distribute funds on the basis that it best distributes finite funding to schools with children attending and in front of a teacher.
Other approaches tested dilute the ability for funding to be directly related to the students who are enrolled and attending school and would require additional administrative steps to ensure responsiveness to student needs.
Recommendation 3a
Continue with the effective enrolment measure as the most efficient way to distribute the current levels of finite funding.
High
Key Finding 4
Stakeholders identify an element of uncertainty around budgets year to year due to the application of effective enrolment. Stakeholders also attribute a preference for hiring fixed period staff to this uncertainty, to be able to better manage their resource mix in the event that funding is decreased in future years.
The proportion of teaching staff on fixed period contracts has increased each year since 2012/13, particularly in small and remote schools, reportedly in part due to increasing budget uncertainty.
The small school supplement was intended to provide a minimum funding threshold for small schools to assist in resource and program planning.
Recommendation 4a
Increase communications on the intention of the small school supplement introduced in 2016 to ensure adequate staffing levels can be maintained in small schools.
High
Recommendation 4b
Monitor the proportion of ongoing to fixed period teaching contracts, to identify if the certainty of funding afforded by the small school supplement facilitates a shift to a higher proportion of ongoing staff.
Medium
Solution theme 3: How can efficient investment by schools in the needs of their students be facilitated and monitored?
The profile of student needs changes as students move from one year to another or from school to school. The allocation of funding is intended to be used on the students in the year it is allocated. However, there are various circumstances throughout the year that may result in more or less than the allocation being spent. A surplus or a deficit should not automatically be considered as an indication of over- or under-funding of that school, due to the myriad of factors that contribute to the financial position of a particular school.
Northern Territory Government Department of Education
Government School Funding in the Northern Territory, Australia EY 6
Finding Recommendation Priority
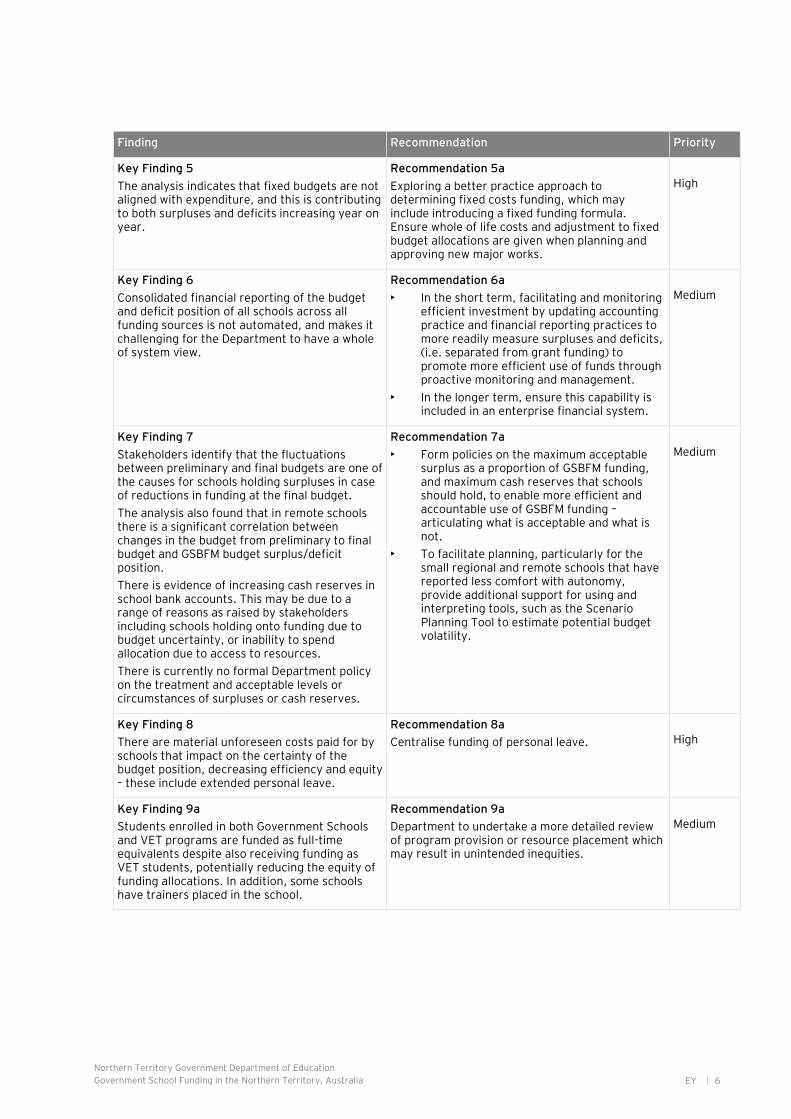
Key Finding 5
The analysis indicates that fixed budgets are not aligned with expenditure, and this is contributing to both surpluses and deficits increasing year on year.
Recommendation 5a
Exploring a better practice approach to determining fixed costs funding, which may include introducing a fixed funding formula. Ensure whole of life costs and adjustment to fixed budget allocations are given when planning and approving new major works.
High
Key Finding 6
Consolidated financial reporting of the budget and deficit position of all schools across all funding sources is not automated, and makes it challenging for the Department to have a whole of system view.
Recommendation 6a
• In the short term, facilitating and monitoring efficient investment by updating accounting practice and financial reporting practices to more readily measure surpluses and deficits, (i.e. separated from grant funding) to promote more efficient use of funds through proactive monitoring and management.
• In the longer term, ensure this capability is included in an enterprise financial system.
Medium
Key Finding 7
Stakeholders identify that the fluctuations between preliminary and final budgets are one of the causes for schools holding surpluses in case of reductions in funding at the final budget.
The analysis also found that in remote schools there is a significant correlation between changes in the budget from preliminary to final budget and GSBFM budget surplus/deficit position.
There is evidence of increasing cash reserves in school bank accounts. This may be due to a range of reasons as raised by stakeholders including schools holding onto funding due to budget uncertainty, or inability to spend allocation due to access to resources.
There is currently no formal Department policy on the treatment and acceptable levels or circumstances of surpluses or cash reserves.
Recommendation 7a
• Form policies on the maximum acceptable surplus as a proportion of GSBFM funding, and maximum cash reserves that schools should hold, to enable more efficient and accountable use of GSBFM funding – articulating what is acceptable and what is not.
• To facilitate planning, particularly for the small regional and remote schools that have reported less comfort with autonomy, provide additional support for using and interpreting tools, such as the Scenario Planning Tool to estimate potential budget volatility.
Medium
Key Finding 8
There are material unforeseen costs paid for by schools that impact on the certainty of the budget position, decreasing efficiency and equity – these include extended personal leave.
Recommendation 8a
Centralise funding of personal leave.
High
Key Finding 9a
Students enrolled in both Government Schools and VET programs are funded as full-time equivalents despite also receiving funding as VET students, potentially reducing the equity of funding allocations. In addition, some schools have trainers placed in the school.
Recommendation 9a
Department to undertake a more detailed review of program provision or resource placement which may result in unintended inequities.
Medium
Northern Territory Government Department of Education
Government School Funding in the Northern Territory, Australia EY 7
Finding Recommendation Priority
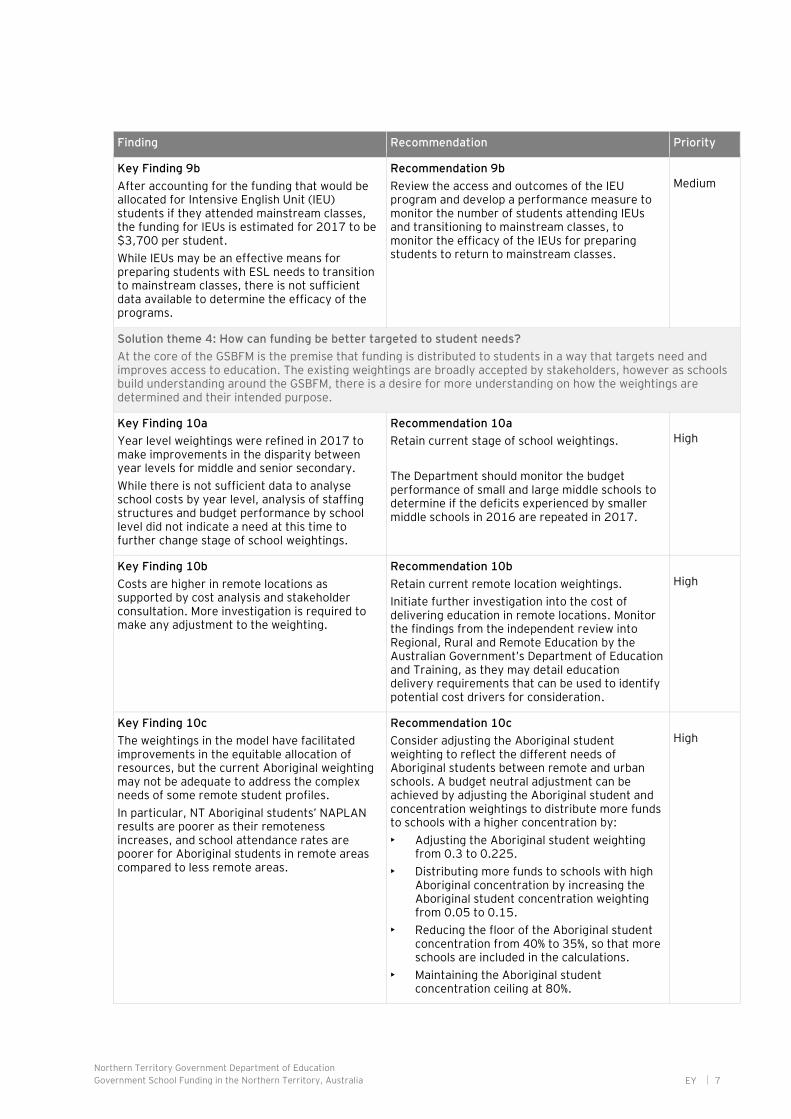
Key Finding 9b
After accounting for the funding that would be allocated for Intensive English Unit (IEU) students if they attended mainstream classes, the funding for IEUs is estimated for 2017 to be $3,700 per student.
While IEUs may be an effective means for preparing students with ESL needs to transition to mainstream classes, there is not sufficient data available to determine the efficacy of the programs.
Recommendation 9b
Review the access and outcomes of the IEU program and develop a performance measure to monitor the number of students attending IEUs and transitioning to mainstream classes, to monitor the efficacy of the IEUs for preparing students to return to mainstream classes.
Medium
Solution theme 4: How can funding be better targeted to student needs?
At the core of the GSBFM is the premise that funding is distributed to students in a way that targets need and improves access to education. The existing weightings are broadly accepted by stakeholders, however as schools build understanding around the GSBFM, there is a desire for more understanding on how the weightings are determined and their intended purpose.
Key Finding 10a
Year level weightings were refined in 2017 to make improvements in the disparity between year levels for middle and senior secondary.
While there is not sufficient data to analyse school costs by year level, analysis of staffing structures and budget performance by school level did not indicate a need at this time to further change stage of school weightings.
Recommendation 10a
Retain current stage of school weightings.
The Department should monitor the budget performance of small and large middle schools to determine if the deficits experienced by smaller middle schools in 2016 are repeated in 2017.
High
Key Finding 10b
Costs are higher in remote locations as supported by cost analysis and stakeholder consultation. More investigation is required to make any adjustment to the weighting.
Recommendation 10b
Retain current remote location weightings.
Initiate further investigation into the cost of delivering education in remote locations. Monitor the findings from the independent review into Regional, Rural and Remote Education by the Australian Government’s Department of Education and Training, as they may detail education delivery requirements that can be used to identify potential cost drivers for consideration.
High
Key Finding 10c
The weightings in the model have facilitated improvements in the equitable allocation of resources, but the current Aboriginal weighting may not be adequate to address the complex needs of some remote student profiles.
In particular, NT Aboriginal students’ NAPLAN results are poorer as their remoteness increases, and school attendance rates are poorer for Aboriginal students in remote areas compared to less remote areas.
Recommendation 10c
Consider adjusting the Aboriginal student weighting to reflect the different needs of Aboriginal students between remote and urban schools. A budget neutral adjustment can be achieved by adjusting the Aboriginal student and concentration weightings to distribute more funds to schools with a higher concentration by:
• Adjusting the Aboriginal student weighting from 0.3 to 0.225.
• Distributing more funds to schools with high Aboriginal concentration by increasing the Aboriginal student concentration weighting from 0.05 to 0.15.
• Reducing the floor of the Aboriginal student concentration from 40% to 35%, so that more schools are included in the calculations.
• Maintaining the Aboriginal student concentration ceiling at 80%.
High
Northern Territory Government Department of Education
Government School Funding in the Northern Territory, Australia EY 8
Finding Recommendation Priority
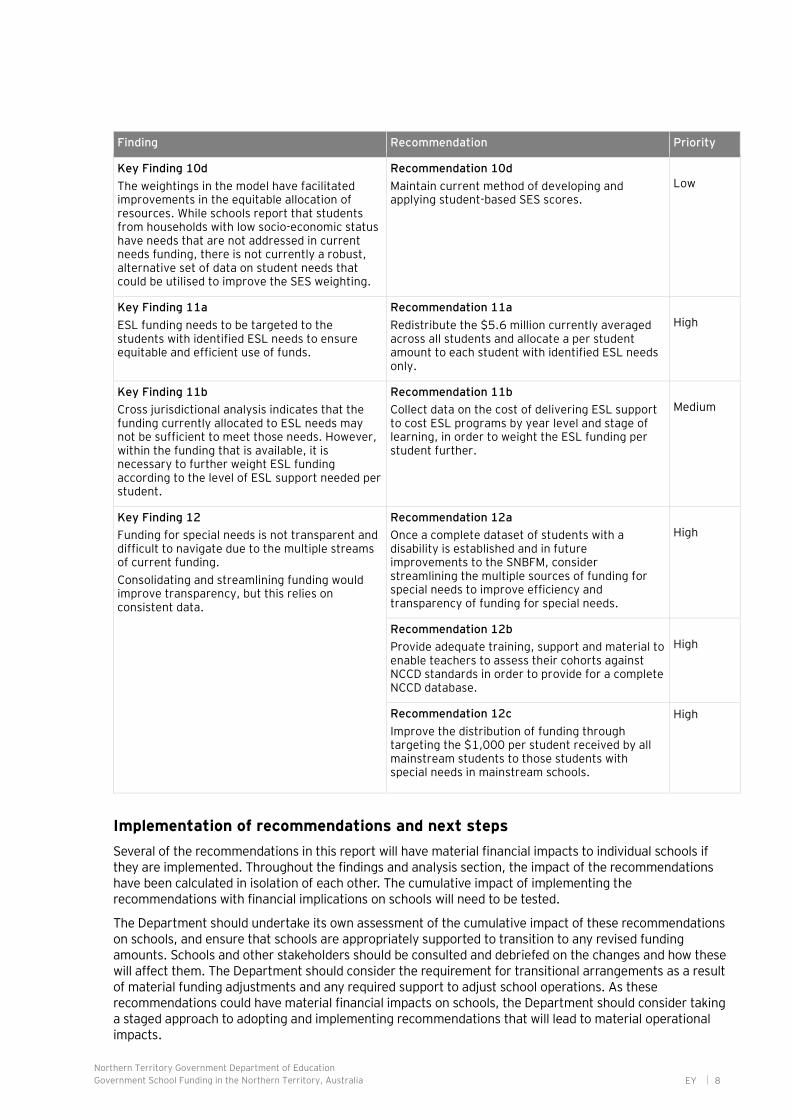
Key Finding 10d
The weightings in the model have facilitated improvements in the equitable allocation of resources. While schools report that students from households with low socio-economic status have needs that are not addressed in current needs funding, there is not currently a robust, alternative set of data on student needs that could be utilised to improve the SES weighting.
Recommendation 10d
Maintain current method of developing and applying student-based SES scores.
Low
Key Finding 11a
ESL funding needs to be targeted to the students with identified ESL needs to ensure equitable and efficient use of funds.
Recommendation 11a
Redistribute the $5.6 million currently averaged across all students and allocate a per student amount to each student with identified ESL needs only.
High
Key Finding 11b
Cross jurisdictional analysis indicates that the funding currently allocated to ESL needs may not be sufficient to meet those needs. However, within the funding that is available, it is necessary to further weight ESL funding according to the level of ESL support needed per student.
Recommendation 11b
Collect data on the cost of delivering ESL support to cost ESL programs by year level and stage of learning, in order to weight the ESL funding per student further.
Medium
Key Finding 12
Funding for special needs is not transparent and difficult to navigate due to the multiple streams of current funding.
Consolidating and streamlining funding would improve transparency, but this relies on consistent data.
Recommendation 12a
Once a complete dataset of students with a disability is established and in future improvements to the SNBFM, consider streamlining the multiple sources of funding for special needs to improve efficiency and transparency of funding for special needs.
High
Recommendation 12b
Provide adequate training, support and material to enable teachers to assess their cohorts against NCCD standards in order to provide for a complete NCCD database.
High
Recommendation 12c
Improve the distribution of funding through targeting the $1,000 per student received by all mainstream students to those students with special needs in mainstream schools.
High
Implementation of recommendations and next steps
Several of the recommendations in this report will have material financial impacts to individual schools if they are implemented. Throughout the findings and analysis section, the impact of the recommendations have been calculated in isolation of each other. The cumulative impact of implementing the recommendations with financial implications on schools will need to be tested.
The Department should undertake its own assessment of the cumulative impact of these recommendations on schools, and ensure that schools are appropriately supported to transition to any revised funding amounts. Schools and other stakeholders should be consulted and debriefed on the changes and how these will affect them. The Department should consider the requirement for transitional arrangements as a result of material funding adjustments and any required support to adjust school operations. As these recommendations could have material financial impacts on schools, the Department should consider taking a staged approach to adopting and implementing recommendations that will lead to material operational impacts.

Northern Territory Government Department of Education
Government School Funding in the Northern Territory, Australia EY 9
Background and context

Northern Territory Government Department of Education
Government School Funding in the Northern Territory, Australia EY 10
Source: 1 NT Department of Education. (2017). Average Enrolment and Attendance by School, Term 2 2017. https://education.nt.gov.au/education/statistics-research-and-strategies/enrolment-and-attendance 2 2015-2017 NT Department of Education data and EY modelling 3 2017 NT Department of Education data 4 NT Department of Education. (2016). Department of Education Annual Report 2015-16. https://education.nt.gov.au/__data/assets/pdf_file/0011/379397/DOE_Annual-Report-2015-16_web.pdf 5 The Australian Curriculum, Assessment and Reporting Authority, 2017 6 NT Department of Education. (2017). Average Enrolment and Attendance for Northern Territory Government Schools, 2016. https://education.nt.gov.au/education/statistics-research-and-strategies/enrolment-and-attendance/2016-enrolment-and-attendance-statistics

Northern Territory Government Department of Education
Government School Funding in the Northern Territory, Australia EY 11
This section sets the scene for this review. It explores the complex environment of education delivered in the NT, the rationale for a student-needs model and the arrival of the GSBFM as a means to address the complexity of needs.
Transitioning to student needs funding
School funding in Australia was reviewed by an expert panel chaired by David Gonski in 2011 and the Review of Funding for Schooling report was published, now commonly known as the Gonski Review3. The Gonski Review revealed that the performance of Australian students had declined at all levels in the 10 years preceding the report. School funding lacked coherence and transparency, there was a significant gap between the highest and lowest performing students and that the lowest performing students were not meeting minimum standards of achievement. Linking low levels of achievement particularly to low socio-economic and Aboriginal backgrounds, the Gonski Review developed a needs-based funding model. At its core was the principle that all students should have access to a high standard of education regardless of their background or circumstances.
The Gonski Review highlighted that school funding in Australia was ad-hoc, based on special deals, imbalanced between jurisdictions and there were overlaps between Commonwealth and State and Territory funding priorities leading to duplication and inefficiencies. The findings of the review initiated school funding reforms around Australia with a majority of States and Territories moving towards a student needs-based funding model. The premise built on setting a base rate per student and then calculating loadings for various forms of disadvantage4.
In recent years, funding of Australian Education has been a topic of public interest and has undergone significant reform. Discussions and reviews in relation to education have been carried out in recent years and are still on-going. The most recent reform to education has been the Turnbull Government passing the Australian Education Amendment Bill 2017 through the Senate which will deliver $23.5bn to schools over the next 10 years based on the Gonski Review’s needs-based principles5.
The Government has commissioned the Review to Achieve Educational Excellence in Australian Schools, led by David Gonski. The intention of the review is to build an evidence base to ensure the additional funding provided by the Australian Government is directed to proven initiatives that make a difference to student outcomes.
NT Government and Australian Government education initiatives show that student needs have become a significant factor in establishing school funding models with discussions and considerations around disability, socio-economic status, Aboriginal status and other factors of student need forming part of school funding models.
Figure 1. NTG and Australian Government education initiatives
3 Gonski, D. et al. (2011). Review of Funding for Schooling - Final Report. Department of Education, Employment and Workplace Relations. https://docs.education.gov.au/system/files/doc/other/review-of-funding-for-schooling-final-report-dec-2011.pdf 4 Goss, P., Sonnemann, J., Griffiths, K., and Chivers, C. (2016). Circuit breaker: A new compact on school funding, Grattin Institute. https://grattan.edu.au/wp-content/uploads/2016/11/881-Circuit-Breaker-New-Compact.pdf 5 Norman, J. (2017). ‘Gonski 2.0: School funding package passes Senate, as Coalition takes big win’. 23 June. ABC News. http://www.abc.net.au/news/2017-06-23/senate-votes-to-pass-gonski-2.0-in-a-big-win-for-coalition/8644156
2. Background and context

Northern Territory Government Department of Education
Government School Funding in the Northern Territory, Australia EY 12
The NT has high levels of disadvantage and complex student needs
Socio-educational disadvantage complicates the analysis of student needs in the NT. Using average ICSEA scores, 93% of NT schools fall below the national mean of 1,000. This supports and illustrates the context of relative disadvantage that school funding models have to address and suggests a nationally consistent funding model may not necessarily meet the needs of all NT students.
Figure 2. Comparison of national and NT ICSEA score distribution
Source: The Australian Curriculum, Assessment and Reporting Authority, NT Department of Education data and EY modelling *Chart is for illustrative purposes only and is not to scale
Schools and students must overcome various challenges in meeting student needs including:
► The lower socio-economic status of children in the NT indicates that workloads of teachers are likely to be higher, especially in the early years of schooling, as children in the lowest socio-economic quintile are more than twice as likely to not be ‘school ready’ as those in the highest quintile6.
► Based on 2017 Department data, approximately 41% of students in the NT have English language needs that need to be addressed in order to be able to learn effectively under the Australian curriculum7.
► Attendance of Aboriginal students is consistently low, particularly outside of urban areas. In 2015 and 2016, the attendance rate of Aboriginal students was 67%, it was 68% in 2014, and 69% for term 1 of 20178. Low attendance not only impacts a student’s access to learning but creates increased workload for teachers to catch children up on missed lessons to keep up with the curriculum.
► 43% of Aboriginal children and 44% of children in remote areas are considered developmentally vulnerable in one or more domains, when measured against the five Australian Early Development Census domains (physical health and well-being, social competence, emotional maturity, language and cognitive skills and communication skills and general knowledge)9.
► According to the Australian Institute of Family Studies, the number of children receiving child protection services in the NT has risen 57% in the past 4 years, from 3,880 to 6,100 children – ahead of the national rate of 20%. In 2015-16, 96 children in every 1,000 in the NT were receiving child protection services, compared to a national rate of 30 children per 1,00010. The prevalence of child protection concerns illustrates the complex and increasing student needs that teachers are faced with in the NT.
6 Lamb, S, Jackson, J, Walstab, A & Huo, S. (2015). Educational opportunity in Australia 2015: Who succeeds and who misses out, Centre for International Research on Education Systems, Victoria University, for the Mitchell Institute, Melbourne: Mitchell Institute. http://www.mitchellinstitute.org.au/wp-content/uploads/2015/11/Educational-opportunity-in-Australia-2015-Who-succeeds-and-who-misses-out-19Nov15.pdf 7 2017 NT Department of Education data 8 NT Department of Education. (2017). Enrolment and attendance. https://education.nt.gov.au/education/statistics-research-and-strategies/enrolment-and-attendance 9 Australian Early Development Census. (2014). Pathways through school for children with additional needs. http://www.aedc.gov.au/resources/detail/pathways-through-school-for-children-with-additional-needs 10 Australian Institute of Health and Welfare. (2017). Child protection Australia 2015-2016. http://www.aihw.gov.au/WorkArea/DownloadAsset.aspx?id=60129558819.

Northern Territory Government Department of Education
Government School Funding in the Northern Territory, Australia EY 13
Student needs funding in the NT
Professor Stephen Lamb in 2014 made a number of recommendations to establish a new needs based funding approach for NT Government Schools. The Department considered its own analysis and recommendations in the report to form the foundation of the current GSBFM. The NT Government introduced GSBFM in all NT Government schools in 2015, with the aim of providing schools with more autonomy in deciding how best to use the resources provided to meet the needs of students. The GSBFM aims to distribute funds to schools equitably, transparently and efficiently.
The GSBFM was implemented quickly at a time when funding to public schools had already been declining; 11% over the period from 2012/13 to 2015/16, by $53m11. Numbers of classroom teachers also decreased from 2012/13 by 8.71% to 2015/1612. Over the same period, student enrolments remained relatively stable fluctuating between 1-2%13. In 2016/17, there has been an increase in funding of $26m from 2015/16, the first increase since 2012/1314. Although funding increased in 2016/17, this does not take into account CPI and wage increases experienced over the period 2012 to 2017.
Figure 3. School based staffing and NTG funding
The GSBFM is in its third year of operation, with a number of changes to systems and processes taking place over the last three years. The Department has indicated a commitment to continuous improvement to the GSBFM and seeks recommendations from this review to that effect.
The GSBFM was developed by the Department on the premise that each school will be provided with autonomy through global budgets to empower government schools to make decisions on how to best use their allocated resources to support students.
The context for the current GSBFM is:
1. School autonomy improves student outcomes, and Global School Budgets are the mechanism for autonomy.
2. The current GSBFM demonstrates principles of funding for student needs but can always be improved.
11 NT Department of Education 2012/13 – 2015/16 Annual Reports 12 ibid 13 NT Department of Education. (2017). Enrolment and attendance. https://education.nt.gov.au/education/statistics-research-and-strategies/enrolment-and-attendance 14 NT Government. (n.d.). Agency Budget Statements 2016-17. http://www.treasury.nt.gov.au/PMS/Publications/BudgetFinance/BudgetPapers/I-BP3-1617.pdf
The Government Education Appropriation Output is total NTG funding towards Whole of Agency services towards Government Education and includes School Support Services, Regional Support/Offices etc. The GSBFM was implemented in 2015. The GSB Pool does not include NTG funded services for other Government Education services carried out in-house (i.e. non-GSB) and is subsidised by Commonwealth Students First funding so is not just NTG funding.
Northern Territory Government Department of Education
Government School Funding in the Northern Territory, Australia EY 14
School autonomy improves student outcomes, and Global School Budgets are the mechanism for autonomy
School autonomy has been found to be an important factor in contributing to good student outcomes based on high performing school systems across the world. Research has shown that “school leaders who are able to make decisions, including decisions about hiring staff and over the school budget, do well in terms of student achievement, providing there are measures of school accountability”15.
Common attributes of excellent school systems include an organisational structure that delineates decision rights and a financial structure that establishes an efficient and equitable funding allocation mechanism for school. Decentralising financial and administrative powers is a mechanism to achieve this and is well along the school improvement journey. The Mourshed et al report highlights that schools can be at different places along the reform journey with a range of different needs and support requirements depending on school based circumstances16. During this review, it was observed that schools in the NT are at difference places in the reform journey.
Mourshed et al found that “there is a strong, correlation between a school system’s improvement journey stage and the tightness of central control over the individual school activities and performance”17. In the study performed by Mourshed et al, it was observed that there was increased central guidance and oversight for schools improving from poor to fair, whereas schools improving from good to great had more autonomy to encourage creativity and innovation which was found to be a core driver for improving student performance at this stage. But that is not to say central support is not required - but improving systems “prescribe adequacy but unleash greatness”18. It was observed throughout this review, that there are examples of both types of improving schools in the NT. Some were not ready for full autonomy, for a range of reasons, and are reliant on the central support currently provided. Others have the appropriate capability and resources to facilitate autonomy and innovation.
GSBFM and principles of student needs funding
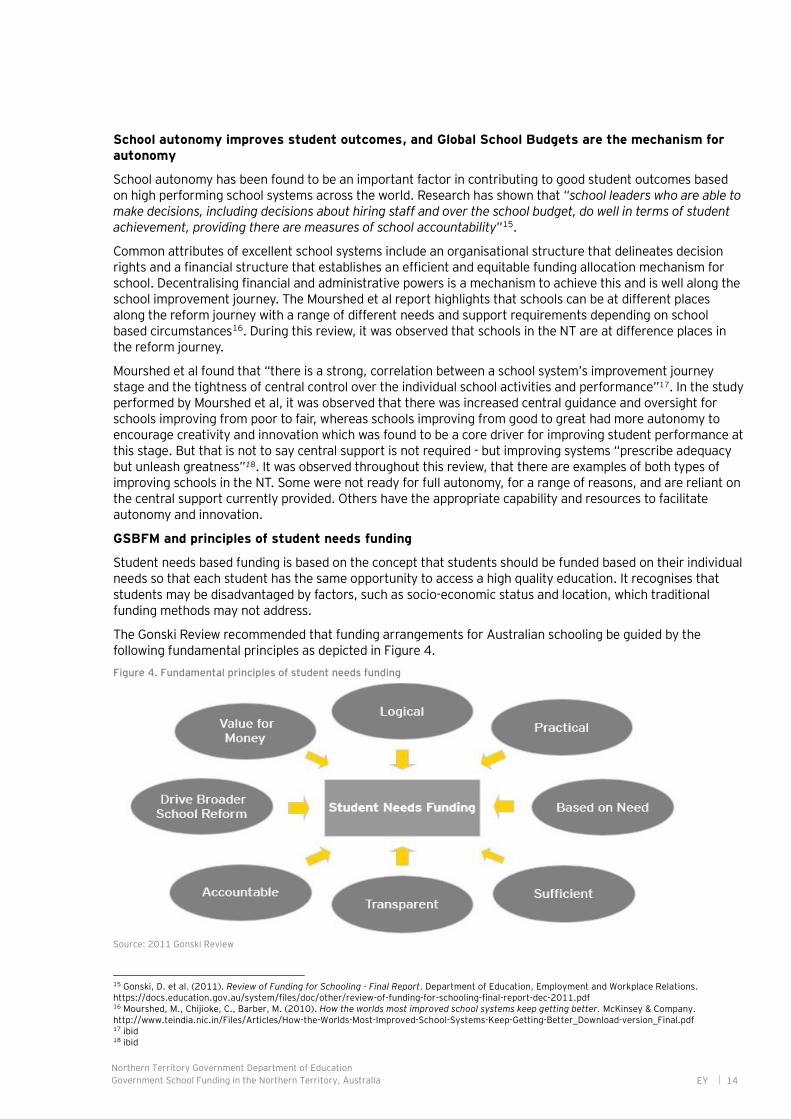
Student needs based funding is based on the concept that students should be funded based on their individual needs so that each student has the same opportunity to access a high quality education. It recognises that students may be disadvantaged by factors, such as socio-economic status and location, which traditional funding methods may not address.
The Gonski Review recommended that funding arrangements for Australian schooling be guided by the following fundamental principles as depicted in Figure 4.
Figure 4. Fundamental principles of student needs funding
Source: 2011 Gonski Review
15 Gonski, D. et al. (2011). Review of Funding for Schooling - Final Report. Department of Education, Employment and Workplace Relations. https://docs.education.gov.au/system/files/doc/other/review-of-funding-for-schooling-final-report-dec-2011.pdf 16 Mourshed, M., Chijioke, C., Barber, M. (2010). How the worlds most improved school systems keep getting better. McKinsey & Company. http://www.teindia.nic.in/Files/Articles/How-the-Worlds-Most-Improved-School-Systems-Keep-Getting-Better_Download-version_Final.pdf 17 ibid 18 ibid

Northern Territory Government Department of Education
Government School Funding in the Northern Territory, Australia EY 15
The GSBFM was developed to share many of the same principles. The funding model was created with the intention of being more equitable, accountable and efficient and distributing funding more fairly and transparently, guided by the overarching principle of meeting student needs19. However, the ability to meet student needs is primarily impacted by the total quantum of education budget allocation, which was not tested as part of this review. The GSBFM seeks to distribute funding in the most equitable, efficient and transparent manner, within the finite funding pool. The sufficiency of the total funding pool was not in scope for this review and not tested as part of our analysis.
The GSBFM shares many of the same variable funding factors such as weightings for student-needs as other jurisdictions as demonstrated in Table 2.
Table 2. Cross jurisdictional comparison of weightings
Jurisdiction
Students Needs Funding NT WA SA NSW VIC ACT Gonski
Stage of schooling
School size
Remoteness of school
Aboriginal status
Socio-economic status
ESL / EAL/D
Disability
Source: Jurisdictional Education Departments (based on information available in the public domain) and 2011 Gonski Review
In its third year of operation, many lessons have been learnt and a number of amendments to the model have been made to improve the GSBFM’s equity, efficiency and transparency. Improvements include such considerations as the introduction of Aboriginal concentration, small school threshold, scaling and stage of school weightings. The Department is committed to ongoing improvements by undertaking this review and others such as the stakeholder consultation with business managers and distribution of the ESL funding, both of which are underway and not considered as part of this review.
Our understanding of the current GSBFM
The total annual pool of available funds is currently distributed to schools through one-line budgets comprising of funding calculated through the SNBFM and using student numbers as determined by the effective enrolment methodology. Under the current model, each student attracts a base level of funding and then additional weightings are provided for stage of schooling, socio-economic background, remoteness and Aboriginal status. Schools receive additional funding for fixed expenses and targeted funding programs as illustrated in Figure 5 below. The base-rate per student fluctuates each year depending on the size of the funding pool, the number of enrolments, effective enrolments and the needs profile of the current cohort of students.
19 NT Department of Education. (2013). Department of Education Strategic Plan 2013-2015. https://education.nt.gov.au/__data/assets/pdf_file/0009/228996/DoE_strategic_plan2013-15.pdf

Northern Territory Government Department of Education
Government School Funding in the Northern Territory, Australia EY 16
Figure 5. Global School Budgets in 2017
Source: 2017 NT Department of Education data *Total of segments equals $483 million due to $6m being unallocated funding
Broader system and processes that impact GSBFM management
Outside of the GSBFM there are broader systems and processes that directly impact a school’s ability to manage its expenditure within funding allocation. These include the budget timeline, exceptional circumstance policy and the regional support structure.
Budget timeline
The budget timeline depicted in Figure 6 below is driven by school year and data requirements. An additional element driving the budget cycle is the gathering of data to inform this process and the subsequent application of effective enrolment. The process drives school decision making on the allocation of resources for the following year. If the final budget position is impacted, schools will need to manage their expenditure of the allocated budget accordingly.
Figure 6. GSBFM budget timeline
Source: 2017 NT Department of Education data

Northern Territory Government Department of Education
Government School Funding in the Northern Territory, Australia EY 17
Exceptional circumstances
The Exceptional Circumstances Policy is the framework that guides access to a shared funding pool for unexpected or unforeseen events that impact on the schools available budget.
The process starts with the school principal identifying the need for an Exceptional Circumstance claim. The Regional Financial Manager and HR Manager work with the principal to complete and review applications. Regional Directors assess the applications and supporting documents and provides the recommendation to the Exceptional Circumstances assessment panel.
The policy documentation details that the assessment panel comprises of senior executives from the Department’s corporate area nominated by the Department’s established budget committee. In practice, stakeholders confirm there are school representatives. The Panel is responsible for assessing requests and making recommendations on each application to the Department’s nominated budget committee for additional funding.
Applications can be made twice a year, the first being in Term 3 for Semester 1 events. The preferred application point is Term 1 for previous calendar year events.
Regional structure
The regional structures of the Department vary from region to region, as does the support services provided. Each region has a Regional Director (Darwin, Katherine, Palmerton and Rural, Arnhem, Alice Springs and Barkly). Each regional office provides human resource and finance officers to support the schools.
Small schools that meet requirements are able to access a pool of shared resources such as business managers, roving relief teachers and other services. Schools accessing this service pay a financial contribution to the regional office. Each region has a different range of services available and charges varying amounts depending on the cost of service provision.
Overview of our approach
EY performed the review between May and July 2017. During this time EY performed a desktop review of relevant information, conducted an assessment of the current model and engaged with school and non-school stakeholders to collect both qualitative and quantitative feedback on the GSBFM. This process built the evidence base to identify gaps and develop practical recommendations to improve the distribution of the existing funding pool, that is targeted at school and student needs. Our detailed approach is in Appendix A.
Whilst undertaking this review, there are a number of broader discussions and reviews in the public and political domain currently underway and we have listed some of these in Appendix A. These have not been considered in this review due to the timing or falling outside of the scope of our engagement. In any event, findings from these reviews may add additional evidence and context to our findings for consideration by the Department after this review.
This review required a range of consultations with stakeholders through interviews with 21 case study schools (provided in Appendix B) and other stakeholders that represented key internal and external stakeholders and school principals through an online survey to 153 NT government schools. A list of those consulted is in Appendix C.
Our approach included an assessment of the current GSBFM and this was performed using school data sourced directly from the Department for the years 2015 – 2016 and some data from 2017. Several modelling and statistical techniques were employed in the research approach, as the review sought to test a variety of aspects of the GSBFM. Data research approach is included in Appendix D.
This review is focussed on identifying incremental improvements to the funding model to ensure allocated funding is distributed in the most equitable, efficient and transparent manner. This review explores school funding drivers and the mechanics of how the various funding elements work together – not the performance of the entire system.

Northern Territory Government Department of Education
Government School Funding in the Northern Territory, Australia EY 18
There are various operating environment challenges and issues with the broader systems and processes that impact schools ability to manage expenditure within funding allocations, and these have been identified where appropriate. The level of funding allocation to education by the NT Government and the Australian Government, whilst a critical factor, is not considered as part of this review.

Northern Territory Government Department of Education
Government School Funding in the Northern Territory, Australia EY 19
Consultations and survey findings

Northern Territory Government Department of Education
Government School Funding in the Northern Territory, Australia EY 20
This section summarises the key themes we heard from consultation with stakeholders and school survey findings relating to efficiency, equity and transparency. This information has supported the analysis and recommendations in the following sections.
The consultation with case study schools, other stakeholders and the principal survey explored if the GSBFM achieves efficient, equitable and transparent distribution of education funding in the NT. For the purposes of this review the definitions applied are detailed in the Glossary section of this report. This review has incorporated the perceptions of stakeholders in the analysis undertaken. A mix of feedback and data findings has driven the development of recommendations and actions for consideration of the Department.
The case study schools and other stakeholders consulted are detailed in Appendix B and Appendix C.
Snapshot of survey findings
Consultations with case study schools indicate that the concept behind the GSBFM is broadly supported and schools appreciate the additional flexibility and autonomy. Three in five schools that responded to the survey agree with this. Perceptions about the funding model in terms of how well it allocates available funding in an equitable, efficient, and transparent matter have been mixed, as shown in Figure 7.
Survey questions were developed by EY, and agreed by the Department, and are detailed in Appendix E. The survey was a standalone online questionnaire sent to respondents and was not complemented by consultations or interviews.
Figure 7. Perceived transparency, efficiency and equity
Source: 2017 Principal Survey, EY
3. Consultations and survey findings

Northern Territory Government Department of Education
Government School Funding in the Northern Territory, Australia EY 21
What’s working?
Consultations and the survey indicate that the concept of the GSBFM is broadly supported with a majority of schools appreciating the additional flexibility and autonomy.
Specifically, schools reported:
► 83% of schools improved the way they allocate resources to better meet student needs
► 74% of schools reporting some familiarity with the model, and this is growing
► 65% of schools felt that the GSBFM improved visibility of funding allocation
► 61% of schools agree that the GSBFM allows them to distribute more efficiently
Improved allocation of resources to student need
Survey results show that 83% of schools have made improvements to the way the school allocates resources to better meet the needs of students. The types of improvements made include staffing (teachers and non-teachers), better teaching/curriculum resources to meet different student needs, and having greater flexibility in how they use their funding.
Continued improvement in understanding of the GSBFM
Of the total schools that responded, 69% felt that their staff currently have sufficient guidance to make informed decisions relating to their role. The majority of schools (74%) report to have some degree of familiarity and consultation with stakeholders revealed that in its third year of implementation, schools are starting to feel more confident and build an understanding of the GSBFM.
Improving visibility of funding allocation and transparency in broader communication
A large proportion (65%) of schools feel that Global School Budgets has given their school better visibility of funding allocation, which is a consistent view across all school types. Views are mixed, with half of the schools agreeing that the systems and available reports delivered as part of the funding model have helped them achieve greater transparency in reporting to school stakeholders and community.
Investment decisions made based on student needs
Most schools agree that the GSBFM has allowed them to distribute funding as efficiently as possible (61% strongly/mostly agreeing with this aspect) and provided better visibility of funding and how it is allocated (65%).
Currently, 98% of schools are using student information and their support needs when making decisions around the school’s resource allocation process. This is consistently practiced across all groups such as disadvantaged cohorts, location and Aboriginal concentration.

Northern Territory Government Department of Education
Government School Funding in the Northern Territory, Australia EY 22
What could be improved?
It was evident that the challenges raised by schools were based on the ability to meet student needs, environmental constraints outside of the school’s control, maturity of the broader education system and processes.
Schools raised the following challenges that could be improved:
► Additional support through a targeted and tailored program to individual school needs
► Specific and targeted support to small, remote and disadvantaged schools to address the gap in understanding of the GSBFM
► Simplification of the reporting and planning tools and improvements to data systems to allow schools to better communicate with the school community and plan for funding
► Improve the processes that surround the GSBFM to provide early and regular opportunities for schools to access or escalate budget expenditure concerns
► More certainty around budget allocations to address the impacts of effective enrolment
► Support for schools to manage expenses and programs that erode equity such as extended personal leave
► Consideration of how to better meet student needs through better communication on weighting calculation, more targeted funding for needs such as special needs and ESL and better data collection
Invest in support where schools need it most
When asked about the challenges encountered when trying to meet all student needs, the inadequacy of support to address all student needs (76%) and time demands on principal workload (69%) are the key challenges identified. Other main challenges identified include the cost of delivering a range of suitable programs and pathways for students with different needs (59%) and resourcing issues, namely the time demands on teacher workload (57%) and the difficulties faced in finding suitable staff with the right skill set/experience (57%). School location, particularly for those in remote and hard to reach areas, is also a prevailing issue for half of the schools (46%).
Inaccessibility of teacher training/professional development (cost and availability) also feature to some degree. This was raised by case study schools in remote locations, accessing professional development was limited due to the cost involved in travelling and resource implications for classes.
While 69% of schools feel their staff currently have sufficient guidance to make informed decisions relating to their role, a substantial proportion (31%) also believe their staff are lacking the required support.
One-third (approximately 35%) of schools have had concerns around the variability in funding due to the timing of the budget cycle. This impact was raised by almost all of the case study schools consulted with and attributed to the application of effective enrolment.

Northern Territory Government Department of Education
Government School Funding in the Northern Territory, Australia EY 23
Investigate the needs of disadvantaged and remote schools
Familiarity with the GSBFM tends to be lower among schools with disadvantage, including schools with higher Aboriginal concentration and lower effective enrolments.
Schools that are more disadvantaged are likely to voice some key challenges relevant to them. Schools characterised with high levels of disadvantage, a higher concentration of Aboriginal students, and lower effective enrolment have found it particularly difficult to get support due to school remoteness/access.
More schools with a higher concentration of Aboriginal students (90% to 100%) are confronted by a lack of understanding of the systems and the topic and feel disadvantaged due to their school remoteness/access. These schools also feel it has been difficult to achieve transparency due to lacking processes for reporting and insufficient communication between leadership and the school community about its importance.
Capability and attracting talent is a recurring issue for some schools with the GSBFM. Inadequate skills of schools staff (18%) and inability to find support due to remoteness (17%) are key barriers to understanding and communicating reports, and therefore making it difficult to achieve transparency.
Simplify and improve systems, reports and planning tools
When asked if the systems and available reports delivered as part of the funding model have helped schools achieve greater transparency in reporting, views are equally divided with half (50%) agreeing that it has enabled their school to clearly communicate to the School Council or Board, and the school community about how the funding has been allocated to meet student needs. Consultation with case study schools and other stakeholders confirmed this challenge. In some instances, the complexity of reports prevented open communication with school councils or boards.
Schools have also found it difficult to achieve transparency due to poor understanding and the complexity of the GSBFM, including knowledge of the systems and available reports (53%) and budget allocation formulae (28%).
Simplification of the administrative process around the model
Among the few (n=19) who have not changed the way they allocate resources, there is a sense that the budget allocation model is still regarded as an administrative burden that does not work in the interest of their schools. The timing of the budget and workload issues are other common barriers mentioned.
There was discontent amongst stakeholders for the Exceptional Circumstances process and policy. Stakeholders remarked the process lacked clarity and the policy was ambiguous, especially where schools had cash reserves and applying for exceptional circumstances. Schools perceive there are limited early intervention and support when expenditure is over allocation including for unexpected expenditure. Stakeholders advised that the administration of exceptional circumstances applications is time-consuming and a perceived deterrent in applying for support.
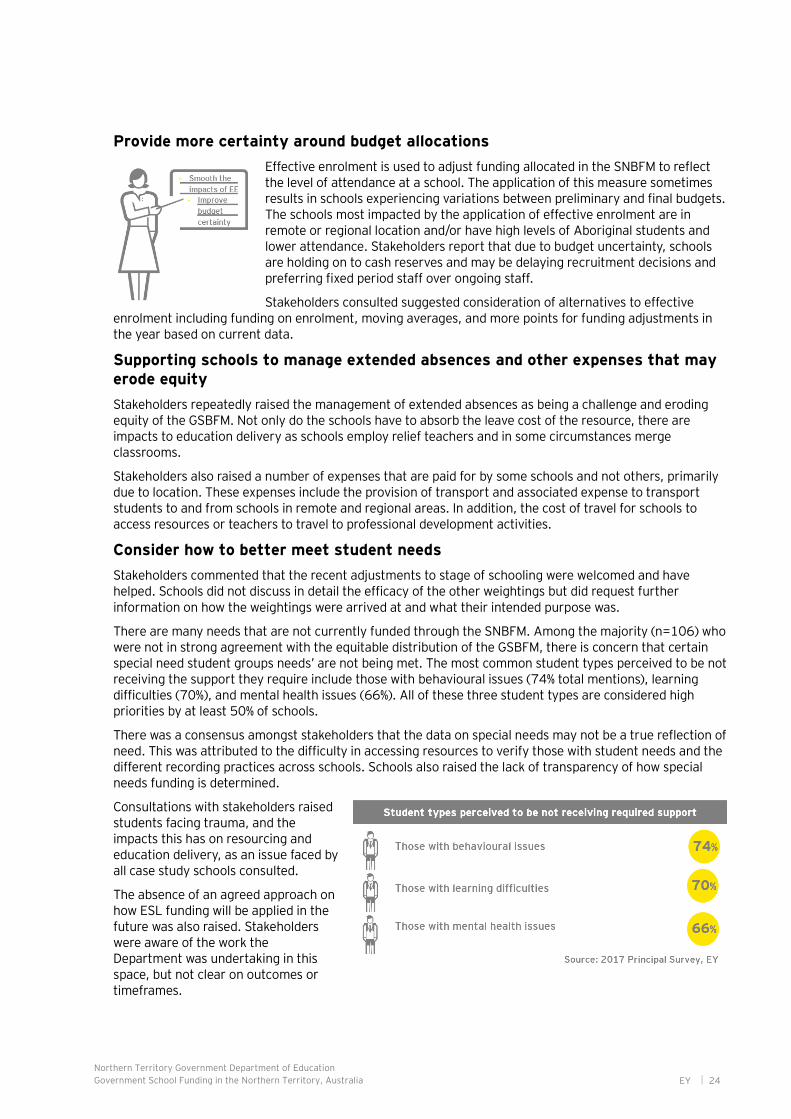
Northern Territory Government Department of Education
Government School Funding in the Northern Territory, Australia EY 24
Provide more certainty around budget allocations
Effective enrolment is used to adjust funding allocated in the SNBFM to reflect the level of attendance at a school. The application of this measure sometimes results in schools experiencing variations between preliminary and final budgets. The schools most impacted by the application of effective enrolment are in remote or regional location and/or have high levels of Aboriginal students and lower attendance. Stakeholders report that due to budget uncertainty, schools are holding on to cash reserves and may be delaying recruitment decisions and preferring fixed period staff over ongoing staff.
Stakeholders consulted suggested consideration of alternatives to effective enrolment including funding on enrolment, moving averages, and more points for funding adjustments in the year based on current data.
Supporting schools to manage extended absences and other expenses that may erode equity
Stakeholders repeatedly raised the management of extended absences as being a challenge and eroding equity of the GSBFM. Not only do the schools have to absorb the leave cost of the resource, there are impacts to education delivery as schools employ relief teachers and in some circumstances merge classrooms.
Stakeholders also raised a number of expenses that are paid for by some schools and not others, primarily due to location. These expenses include the provision of transport and associated expense to transport students to and from schools in remote and regional areas. In addition, the cost of travel for schools to access resources or teachers to travel to professional development activities.
Consider how to better meet student needs
Stakeholders commented that the recent adjustments to stage of schooling were welcomed and have helped. Schools did not discuss in detail the efficacy of the other weightings but did request further information on how the weightings were arrived at and what their intended purpose was.
There are many needs that are not currently funded through the SNBFM. Among the majority (n=106) who were not in strong agreement with the equitable distribution of the GSBFM, there is concern that certain special need student groups needs’ are not being met. The most common student types perceived to be not receiving the support they require include those with behavioural issues (74% total mentions), learning difficulties (70%), and mental health issues (66%). All of these three student types are considered high priorities by at least 50% of schools.
There was a consensus amongst stakeholders that the data on special needs may not be a true reflection of need. This was attributed to the difficulty in accessing resources to verify those with student needs and the different recording practices across schools. Schools also raised the lack of transparency of how special needs funding is determined.
Consultations with stakeholders raised students facing trauma, and the impacts this has on resourcing and education delivery, as an issue faced by all case study schools consulted.
The absence of an agreed approach on how ESL funding will be applied in the future was also raised. Stakeholders were aware of the work the Department was undertaking in this space, but not clear on outcomes or timeframes.

Northern Territory Government Department of Education
Government School Funding in the Northern Territory, Australia EY 25
Acknowledge and respond to the broader issues outside this review
A number of issues were raised throughout consultations and through the survey that remain outside the scope of this review. These are summarised below:
► In the schools consulted, it was observed that there were many instances of innovation at the school level but these are not widely shared as best practice across the system. There may be benefit in the Department considering how to facilitate better sharing of innovative student support and teaching programs.
► The barriers for achieving reporting transparency have largely revolved around time constraints, with almost two-thirds of schools (63%) indicating that workload issues have been a key challenge for them. This was raised many times during consultations.
► School principal workload (85%) has been a more prevalent issue among schools with a higher concentration of Aboriginal students (90% to 100%) and lower effective enrolment (less than 50), likely due to the access to resources, demands surrounding particular student types and the dedication needed to deal with different student needs.
► All case study schools consulted raised the resource and education delivery changes as a result of managing students facing entrenched trauma. Whilst no evidence exists to the extent of this, the Department is considering trauma led practice in some schools.

Northern Territory Government Department of Education
Government School Funding in the Northern Territory, Australia EY 26
Key findings and recommendations

Northern Territory Government Department of Education
Government School Funding in the Northern Territory, Australia EY 27
This section details the analysis, findings and recommendations of this review relating to efficiency, equity and transparency.
Our findings and recommendations included in this section are based on the findings from consultations and the school survey. They are centred around four solution areas for exploration in our analysis. These are summarised in the table below.
Table 3. Solution themes and stakeholder issue mapping
Consultation themes
Solution theme 1: What support is required by schools through targeted investment?
In its third year since implementation, it is clear that schools are at different stages in adopting the Global School Budgets reform and understanding of the GSBFM. Survey and case study school consultations demonstrated the full spectrum of maturity in the GSBFM implementation. Areas requiring improvement suggested by stakeholders included establishing a better governance structures, supporting schools to build their capabilities and understanding of the GSBFM, and providing early and targeted support for schools that need it.
► Invest in support where schools need it most
► Investigate the needs of disadvantaged and remote schools
► Simplify and improve reports and planning tools
► Simplification of the administrative process around the model
Solution theme 2: Is the current approach to budget allocation efficient in distributing a finite pool of funding?
High levels of budget variability were consistently raised as a key issue for stakeholders. Whilst funding based on student needs is inherently variable as enrolments and individual student needs change from year to year, this variability is further impacted in the NT through the additional application of effective enrolment. Effective enrolment attempts to distribute finite funding based on attendance peaks, to the schools with children attending and in front of the teacher.
► Provide more certainty around budget allocation
Solution them 3: How can efficient investment by schools in the needs of their students be facilitated and monitored?
The profile of student needs changes as students move from one year to another or from school to school. The allocation of funding is intended to be used on the students in the year it is allocated. However, there are various circumstances throughout the year that may result in more or less than the allocation being spent. A surplus or a deficit should not automatically be considered as an indication of over- or under-funding of that school, due to the myriad of factors that contribute to the financial position of a particular school.
► Supporting schools to manage extended absences and other expenses or programs that may erode equity
Solution theme 4: How can funding be better targeted to student needs?
At the core of the GSBFM is the premise that funding is distributed to students in a way that targets need and improves access to education. The existing weightings are broadly accepted by stakeholders, however as schools build understanding around the GSBFM, there is a desire for more understanding on how the weightings are determined and their intended purpose.
► Consider how to better meet student needs
4. Key findings and recommendations

Northern Territory Government Department of Education
Government School Funding in the Northern Territory, Australia EY 28
Materiality
For brevity and clarity, the results included in this section do not constitute the entirety of analysis and modelling undertaken. Rather the narrative focuses on the evidence that supports the recommendations reached, instead of describing the analysis that proved alternative solutions inferior. Our detailed scope, assumptions and related limitations are outlined in Appendix A of this report.
The impacts of recommendations in this section have been calculated in isolation of each other. If multiple recommendations are implemented, their results, although cumulative, will not be additive, as the implementation of an individual recommendation will have flow-on impacts to the other weightings within the overall model.
Budget neutrality
The recommendations made in this report are intended to be budget neutral. Any recommendation to increase funding to a cohort of students has had to be balanced by a reduction to other students. The majority of stakeholders understood this premise and the scope of the review did not test the adequacy of overall education funding. The test applied in this analysis for the redistribution of funds is not whether a school is receiving sufficient funds per student, but whether the funding per student is distributed equitably.

Northern Territory Government Department of Education
Government School Funding in the Northern Territory, Australia EY 29
Solution theme 1 What support is required by schools through targeted investment?
In its third year since implementation, it is clear that schools are at different stages in adopting and understanding the GSBFM. Survey and case study school consultations demonstrated the full spectrum of maturity in the GSBFM implementation. 74% of the schools surveyed appeared somewhat familiar with the GSBFM and through consultations, schools are beginning to feel more confident. However, it was observed that others have limited resources and capability to invest in understanding the GSBFM.
Schools that have benefited from the GSBFM have used the additional flexibility and autonomy to target resourcing at improving curriculum and teaching resources, staffing and resources for students with special needs.
Survey results indicated that the more remote and disadvantaged the student cohort the more likely the school was to face barriers in understanding and finding appropriate support in implementing the GSBFM. Schools require a range of support that builds on a school’s existing strengths and targets investment to the areas that need it most.
We noted that schools want assistance with:
► Building the skills and capabilities of staff for professional development (70% of schools surveyed)
► Having the right tools to assist them with the Global School Budgets, such as budgeting and scenario planning tools (55%), and a better understanding of the weighting and effective enrolment methodology (54%) in general
► Workforce planning (50%)
► Identifying varying student needs (47%)
It is worth noting that schools with a higher Aboriginal student concentration and those with a higher disadvantage would like more support in identifying their students’ needs to help them achieve greater autonomy and flexibility.
A good governance structure will support schools
According to Mourshed M. at el, less sophisticated school systems first need to achieve uniform adequate performance levels which require tighter central process control and tighter governance before embarking on a continuous improvement journey20. We observed, based on survey results and consultations, that some schools have sophisticated systems in place and the capability to embrace the autonomy the GSBFM provides and drive continuous improvement, with 83% of schools reporting they improved the way they allocate resources to better meet student needs. However, some schools do not yet have the same capabilities and understanding of the GSBFM and still require support and central intervention, where 46% of schools feel that they are unable to access support due to the remoteness of their school.
School representatives consulted reported that there are various circumstances throughout the year that schools find challenging to manage, resulting in spending outside their GSBFM allocation. Opportunity for budget allocation appeal is through the Exceptional Circumstances process which is widely disliked. Schools feel it is not transparent and the process is time-consuming and burdensome and is especially felt by those schools where capability and capacity are already constrained.
Schools consulted perceive that there are limited opportunities to assist schools when expenditure over the allocated budget occurs due to exceptional circumstances. Schools raised instances where applications had been made and subsequently denied if the school had cash reserves – allocated or not. Schools also raised that the administration and time required to prepare an exceptional circumstances application is time-consuming and perceived as a deterrent in applying.
20 Mourshed, M., Chijioke, C., Barber, M. (2010). How the worlds most improved school systems keep getting better. McKinsey & Company. http://www.teindia.nic.in/Files/Articles/How-the-Worlds-Most-Improved-School-Systems-Keep-Getting-Better_Download-version_Final.pdf
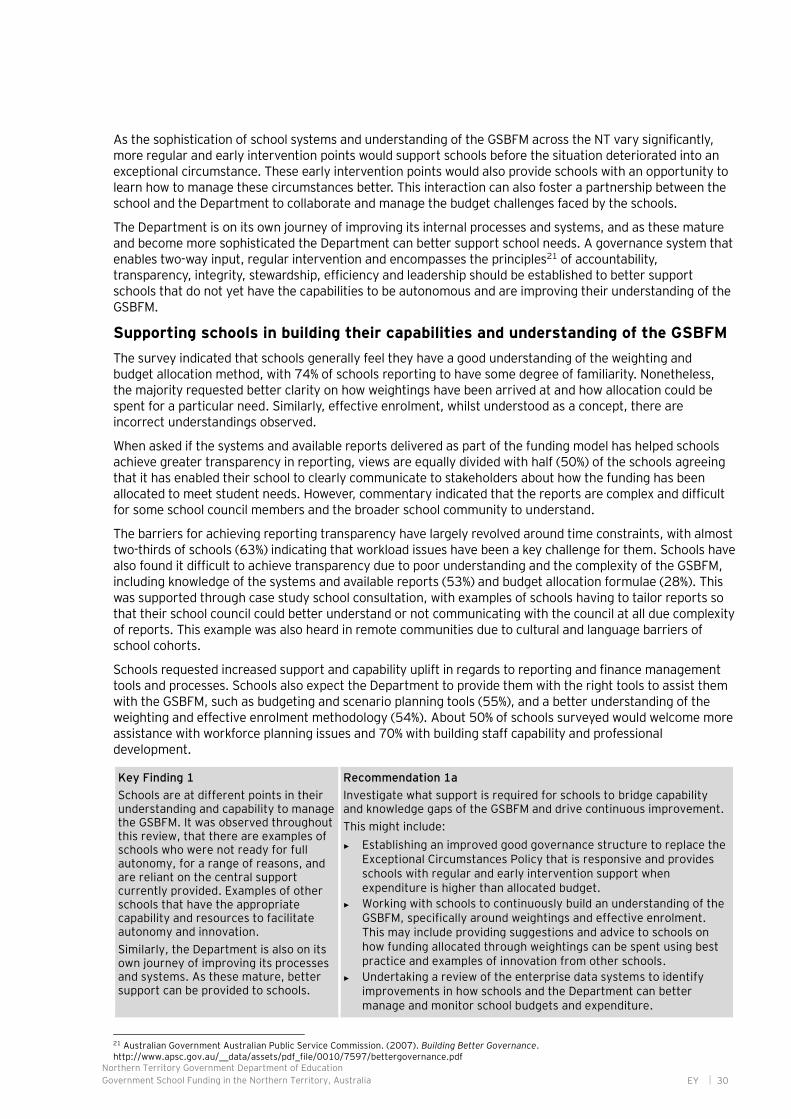
Northern Territory Government Department of Education
Government School Funding in the Northern Territory, Australia EY 30
As the sophistication of school systems and understanding of the GSBFM across the NT vary significantly, more regular and early intervention points would support schools before the situation deteriorated into an exceptional circumstance. These early intervention points would also provide schools with an opportunity to learn how to manage these circumstances better. This interaction can also foster a partnership between the school and the Department to collaborate and manage the budget challenges faced by the schools.
The Department is on its own journey of improving its internal processes and systems, and as these mature and become more sophisticated the Department can better support school needs. A governance system that enables two-way input, regular intervention and encompasses the principles21 of accountability, transparency, integrity, stewardship, efficiency and leadership should be established to better support schools that do not yet have the capabilities to be autonomous and are improving their understanding of the GSBFM.
Supporting schools in building their capabilities and understanding of the GSBFM
The survey indicated that schools generally feel they have a good understanding of the weighting and budget allocation method, with 74% of schools reporting to have some degree of familiarity. Nonetheless, the majority requested better clarity on how weightings have been arrived at and how allocation could be spent for a particular need. Similarly, effective enrolment, whilst understood as a concept, there are incorrect understandings observed.
When asked if the systems and available reports delivered as part of the funding model has helped schools achieve greater transparency in reporting, views are equally divided with half (50%) of the schools agreeing that it has enabled their school to clearly communicate to stakeholders about how the funding has been allocated to meet student needs. However, commentary indicated that the reports are complex and difficult for some school council members and the broader school community to understand.
The barriers for achieving reporting transparency have largely revolved around time constraints, with almost two-thirds of schools (63%) indicating that workload issues have been a key challenge for them. Schools have also found it difficult to achieve transparency due to poor understanding and the complexity of the GSBFM, including knowledge of the systems and available reports (53%) and budget allocation formulae (28%). This was supported through case study school consultation, with examples of schools having to tailor reports so that their school council could better understand or not communicating with the council at all due complexity of reports. This example was also heard in remote communities due to cultural and language barriers of school cohorts.
Schools requested increased support and capability uplift in regards to reporting and finance management tools and processes. Schools also expect the Department to provide them with the right tools to assist them with the GSBFM, such as budgeting and scenario planning tools (55%), and a better understanding of the weighting and effective enrolment methodology (54%). About 50% of schools surveyed would welcome more assistance with workforce planning issues and 70% with building staff capability and professional development.
Key Finding 1
Schools are at different points in their understanding and capability to manage the GSBFM. It was observed throughout this review, that there are examples of schools who were not ready for full autonomy, for a range of reasons, and are reliant on the central support currently provided. Examples of other schools that have the appropriate capability and resources to facilitate autonomy and innovation.
Similarly, the Department is also on its own journey of improving its processes and systems. As these mature, better support can be provided to schools.
Recommendation 1a
Investigate what support is required for schools to bridge capability and knowledge gaps of the GSBFM and drive continuous improvement.
This might include:
► Establishing an improved good governance structure to replace the Exceptional Circumstances Policy that is responsive and provides schools with regular and early intervention support when expenditure is higher than allocated budget.
► Working with schools to continuously build an understanding of the GSBFM, specifically around weightings and effective enrolment. This may include providing suggestions and advice to schools on how funding allocated through weightings can be spent using best practice and examples of innovation from other schools.
► Undertaking a review of the enterprise data systems to identify improvements in how schools and the Department can better manage and monitor school budgets and expenditure.
21 Australian Government Australian Public Service Commission. (2007). Building Better Governance. http://www.apsc.gov.au/__data/assets/pdf_file/0010/7597/bettergovernance.pdf
Northern Territory Government Department of Education
Government School Funding in the Northern Territory, Australia EY 31
► Expanding the level of corporate services and support offered to schools to manage their budget and other corporate issues, in particular around strategic workforce planning and managing workforce mix.
Targeted support for small, regional and remote schools is required
Despite a majority (74%) of schools reporting to have some degree of familiarity with the GSBFM, of concern is that familiarity tends to be higher among more advantaged schools, including schools with lower SES score, those with a lower concentration of Aboriginal students, and higher effective enrolment.
The survey indicated that 46% of schools feel that they are unable to access support due to the remoteness of their school. Based on consultations and survey feedback, there appears to be a number of different support structures between the regions accessible to small schools. With this, it appears the type, provision and cost of these services vary from region to region.
Schools also face strategic challenges in being able to recruit staff in remote, regional and special schools. Stakeholders raised challenges relating to managing the workforce mix and to manage their expenditure within allocated budgets. Schools report not being able to offer permanency due to the lack of certainty in the budget. In the survey, 57% of schools mentioned that finding the right skills and experience is a key challenge and 35% also raised inadequate skills and knowledge of teachers for effective engagement as a challenge.
Schools with a higher concentration of Aboriginal students indicated a lack of understanding of the systems and feel disadvantaged due to their school remoteness and access. These schools also feel it has been difficult to achieve transparency due to lacking processes for reporting and insufficient communication between leadership and the school community about its importance.
Stakeholders have reported that since the GSBFM was introduced schools have moved to a fixed period workforce or delaying recruitment decisions as a result of the uncertainty around preliminary and final budget allocations. This is supported by the data as outlined later in Key Finding 4.
Key Finding 2
There are varying support structures across the regions providing support services to small, regional and remote schools such as shared business managers. However, the ability to access this support and the level of support varies across schools.
Recommendation 2a
Identify what specific support is needed by small, regional and remote schools that are less comfortable with autonomy and are in the early stages of the improvement journey to assist in building their capabilities and understanding of the GSBFM. The support should be accessible and consistent across all schools and help address any staff resourcing and capability challenges they may face.

Northern Territory Government Department of Education
Government School Funding in the Northern Territory, Australia EY 32
Solution theme 2 Is the current approach to budget allocation efficient in distributing a finite pool of funding?
Understanding the purpose of effective enrolment – both supply and demand
High levels of budget variability were consistently raised as a key issue for stakeholders. Whilst funding based on student needs is inherently variable as enrolments and individual student needs change from year to year, this variability is further impacted in the NT through the additional application of effective enrolment by the Department. Effective enrolment attempts to distribute finite funding based on attendance peaks, to the schools with children attending and in front of the teacher. Due to this approach in the NT, where the average attendance was 79% in 2016, but varied between 27% and 93%22 across schools, the impacts of effective enrolment are experienced differently. Consultations raised important questions about where the responsibility of school attendance sits in the community and within government. This was not in scope of this review and is an issue that needs to be considered by the Department.
The NT Education Act 2015 states that parents are responsible for their child’s attendance at school23. Support to improve attendance is provided by school and departmental staff. Parent awareness of their responsibilities is supported by the Australian Government’s School Enrolment and Attendance Measure (SEAM) initiative for those that live in SEAM locations, of which the NT has a number of locations.
Additionally, school attendance officers in NT remote communities are tasked to work with schools, families and the community to ensure children attend school, which includes transporting children to and from school, as part of the Australian Government’s Remote School Attendance Strategy (RSAS). Both these strategies have been implemented by the Australian Government to complement its “close the gap between Aboriginal and non-Aboriginal school attendance by the end of 2018” target. However according to the Closing the Gap: Prime Minister's Report 2017, Aboriginal school attendance rates decreased in the NT from 2014 (70.2%) to 2016 (68.6%) and nationally there has been negligible change24.
We heard through consultations, that schools are investing resources in an effort to improve school attendance. This takes the form of schools providing transport and diverting school resources to increase attendance. Stakeholders commented that disengaged students, who do not attend school, are not being adequately supported and this is not considered in the effective enrolment measure. This is not the purpose of effective enrolment. Within the existing funding pool, effective enrolment attempts to distribute finite funding to the schools with children attending and in front of the teacher.
*The above is for demonstration purposes and does not represent actual schools
22 NT Department of Education. (2017). Average Enrolment and Attendance by School, 2016 and 2015. https://education.nt.gov.au/education/statistics-research-and-strategies/enrolment-and-attendance/2016-enrolment-and-attendance-statistics 23 NT Education Act, Part 4, Division 1, s40(2) 24 Australian Government Department of Prime Minister and Cabinet. (2017). Closing the Gap: Prime Minister’s Report 2017. http://closingthegap.pmc.gov.au/sites/default/files/ctg-report-2017.pdf
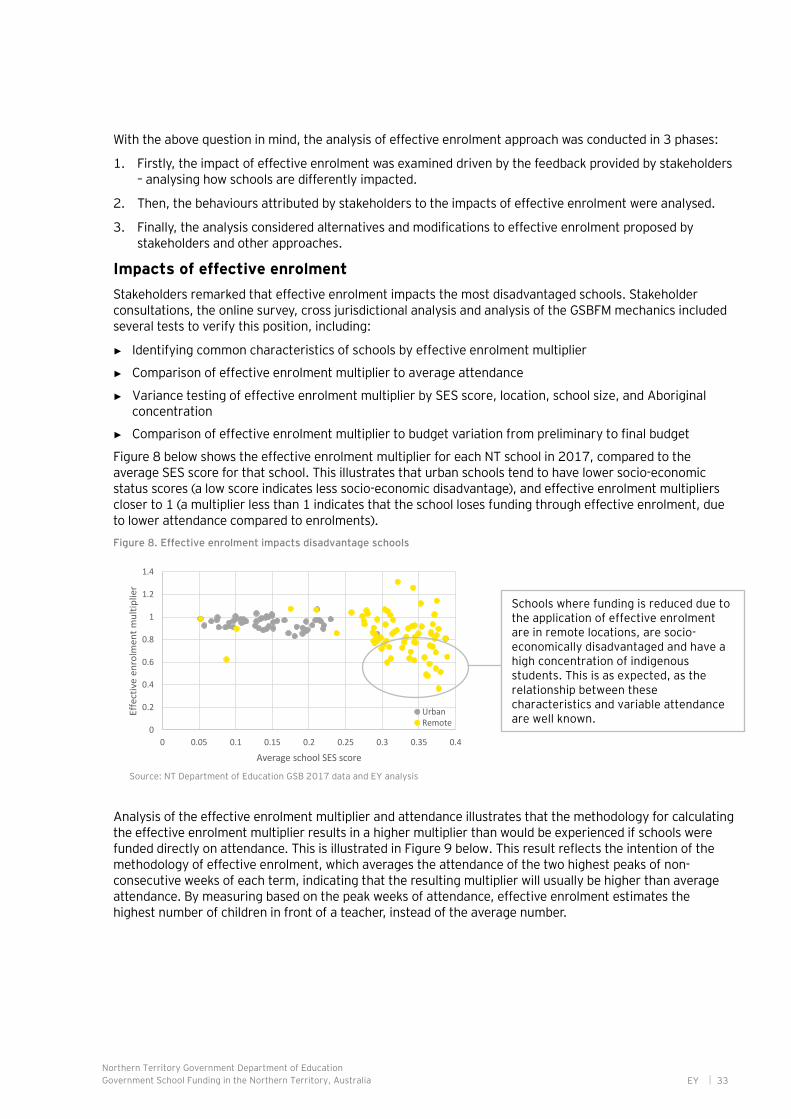
Northern Territory Government Department of Education
Government School Funding in the Northern Territory, Australia EY 33
With the above question in mind, the analysis of effective enrolment approach was conducted in 3 phases:
1. Firstly, the impact of effective enrolment was examined driven by the feedback provided by stakeholders – analysing how schools are differently impacted.
2. Then, the behaviours attributed by stakeholders to the impacts of effective enrolment were analysed.
3. Finally, the analysis considered alternatives and modifications to effective enrolment proposed by stakeholders and other approaches.
Impacts of effective enrolment
Stakeholders remarked that effective enrolment impacts the most disadvantaged schools. Stakeholder consultations, the online survey, cross jurisdictional analysis and analysis of the GSBFM mechanics included several tests to verify this position, including:
► Identifying common characteristics of schools by effective enrolment multiplier
► Comparison of effective enrolment multiplier to average attendance
► Variance testing of effective enrolment multiplier by SES score, location, school size, and Aboriginal concentration
► Comparison of effective enrolment multiplier to budget variation from preliminary to final budget
Figure 8 below shows the effective enrolment multiplier for each NT school in 2017, compared to the average SES score for that school. This illustrates that urban schools tend to have lower socio-economic status scores (a low score indicates less socio-economic disadvantage), and effective enrolment multipliers closer to 1 (a multiplier less than 1 indicates that the school loses funding through effective enrolment, due to lower attendance compared to enrolments).
Figure 8. Effective enrolment impacts disadvantage schools
Analysis of the effective enrolment multiplier and attendance illustrates that the methodology for calculating the effective enrolment multiplier results in a higher multiplier than would be experienced if schools were funded directly on attendance. This is illustrated in Figure 9 below. This result reflects the intention of the methodology of effective enrolment, which averages the attendance of the two highest peaks of non-consecutive weeks of each term, indicating that the resulting multiplier will usually be higher than average attendance. By measuring based on the peak weeks of attendance, effective enrolment estimates the highest number of children in front of a teacher, instead of the average number.
Schools where funding is reduced due to the application of effective enrolment are in remote locations, are socio-economically disadvantaged and have a high concentration of indigenous students. This is as expected, as the relationship between these characteristics and variable attendance are well known.
0
0.2
0.4
0.6
0.8
1
1.2
1.4
0 0.05 0.1 0.15 0.2 0.25 0.3 0.35 0.4
Eff
ect
ive
en
rolm
en
t m
ult
iplie
r
Average school SES score
SES and effective enrolment by location
UrbanRemote
Source: NT Department of Education GSB 2017 data and EY analysis

Northern Territory Government Department of Education
Government School Funding in the Northern Territory, Australia EY 34
Figure 9. Effective enrolment multipliers are higher than average attendance
Analysing reported behaviours due to effective enrolment
Stakeholders indicated that the application of effective enrolment introduces a level of uncertainty, with comments attributing the application of effective enrolment to substantial variations in preliminary and final budgets. While effective enrolment can reduce variable budgets, the use of enrolments instead of effective enrolments for funding would not address these variations. As final student numbers cannot be confirmed until after the school year has commenced, it is not possible to completely eliminate budget volatility between preliminary and final budgets.
Schools reported that final budget positions for the school year are not known until after the year has started. This uncertainty has been attributed to behaviours that appear to be having system wide implications. For example, stakeholders raised concerns about the increase in schools hiring fixed period staff as opposed to ongoing staff or delaying recruitment decisions until after the final budgets were confirmed. In addition, some schools retain surpluses from previous years to cover the operating costs or allocation gap.
Stakeholders raised that there may be circumstances where more students attend school than they are funded for and thus suggested funding on enrolments like many other jurisdictions, however other jurisdictions do not face the same attendance challenges as the NT.
To analyse behaviours reported in stakeholder consultations we looked at:
► Changes in the proportion of ongoing and fixed period staff over time
► Identification of characteristics of schools with a greater proportion of fixed period staff
► Comparison of ratio of ongoing staff to effective enrolment, by school size and location
► Instances of surplus or deficit by effective enrolment multiplier
► Instance of surplus or deficit compared to budget variation from preliminary to final budget
Analysis found that the proportion of fixed period teaching staff has increased since 2012, as illustrated in Figure 10. In 2017, there were 2,543 staff employed through GSBFM allocations at the classroom teacher, senior teacher and teaching principal levels. Of those staff, 1,504 were employed on an ongoing basis while 919 were employed on a fixed period basis, equating to 36% of the workforce being on fixed period contracts.
-
0.20
0.40
0.60
0.80
1.00
1.20
1.40
- 0.20 0.40 0.60 0.80 1.00
Effe
ctiv
e en
rolm
ent
mu
ltip
lier
2016 average attendance
Urban Remote
Source: NT Department of Education GSB 2016, NT Department of Education attendance data 2016 and EY analysis
Schools above the grey line have an effective enrolment multiplier that is higher than
their average attendance

Northern Territory Government Department of Education
Government School Funding in the Northern Territory, Australia EY 35
Figure 10. Comparison of ongoing and fixed period staff by year
Source: NT Department of Education Annual Report 2015-16 and EY modelling
There is a correlation between the remoteness of a school and its ratio of fixed period to ongoing staff, where the ratio ranges from 34% in urban schools to 50% in remote category 3 schools, as in Figure 11 below which displays the number of ongoing and fixed period teaching staff. This aligns with the reports of schools that are more impacted by budget volatility between preliminary and final budgets resorting to employing more fixed period staff. However, it is not possible to isolate the other factors that may influence the utilisation of fixed period teaching staff in remote areas.
Figure 11. Average proportion of fixed period to ongoing staff by remote categorisation (CT/ST/TP)
Source: 2017 NT Department of Education data and EY modelling
School size, as measured by effective enrolments, is also a strong influencer of the proportion of staff employed under fixed period contracts, schools with fewer effective enrolments having a greater proportion of staff employed on fixed period contracts, than in larger schools, as per Table 4 below.
Table 4. Average proportion of fixed period to ongoing staff by effective enrolment
Effective enrolments Number of schools within range Proportion of staff that are fixed period
0-200 89 45%
200-400 34 40%
400-600 24 30%
600-800 3 36%
800-1000 2 31%
1000+ 1 21% Source: 2017 NT Department of Education data and EY modelling
Effective enrolment does not impact surplus or deficit trends. The analysis of effective enrolment multiplier compared to the frequency of budget surplus or deficit of schools identified no significant correlation.
0%
10%
20%
30%
40%
50%
60%
-
500
1,000
1,500
2,000
Urban Specialcategory
Category 1 Category 2 Category 3
% w
ork
forc
e te
mp
/fix
edOngoing and fixed period teaching staff
Ongoing staff Temporary or fixed period staff
% workforce temporary or fixed term

Northern Territory Government Department of Education
Government School Funding in the Northern Territory, Australia EY 36
Similarly, there was no evidence that schools with a lower effective enrolment multiplier are holding larger amounts of cash in the bank at the end of the year.
The analysis also measured the correlation between variable budget changes from preliminary to final budgets and the balance of variable budgets at the end of 2016. While no correlation was found for urban schools, significant correlation was identified for non-urban schools. The analysis found that non-urban schools with a decrease in variable budget from preliminary to final were significantly more likely to have a variable budget deficit in 2016 and significantly more likely to have an overall GSBFM budget deficit. This indicates there is evidence in remote schools that budget changes from preliminary to final may contribute to instances of variable budget deficit or surplus. This can be driven by increases or decreases in enrolments and effective enrolments between preliminary and final budgets, but it should be noted that this is one of many factors.
The alternatives to effective enrolment
Stakeholder consultations, the online survey, cross jurisdictional analysis and analysis of the GSBFM mechanics included several tests to verify this position, including:
Test Basis for analysis
Funding on enrolment Analysed the feasibility of stakeholder recommendation.
Funding on attendance Analysed for comparative purposes.
Funding on attendance plus 10%, capped between 60% and 100% (known as the calculated figure for staffing)
Analysed the feasibility of stakeholder recommendation, as well as a comparison to previous funding method.
Moving average of effective enrolments The use of a moving average is likely to smooth the variation of school budgets between years, and from preliminary to final budgets, as it reduces the variation in student numbers.
Assessment of other aspects of the model that may offset the impacts of effective enrolment
Other parts of the model may address concerns that effective enrolment impacts disadvantaged schools.
In particular, the small school supplement, Aboriginal student weighting and weighting for concentration of Aboriginal students in a school may have positive, offsetting impacts.
Comparison of process for developing preliminary and final budgets
There may be factors in the calculation of preliminary and final budgets that are exacerbating variation from preliminary to final budgets.
Funding on enrolment
Many stakeholders suggested that schools should be funded on enrolment. With no change to the total funding pool, this proposal would require reducing the 2017 base rate per student from $6,570 to $4,865 and would result in urban schools receiving an average of $330,000 less per school in variable funding per year.
School A and B both have 100 enrolled students with the same needs profile.
School A has 90 of its students attending regularly.
School B has 30 of its students attending regularly.
Under the enrolment method, both schools would receive the same amount of variable funding as both have 100 enrolled students.
Under the effective enrolment method, School A would receive more variable funding than School B as attendance is higher.
Note: Schools referenced in examples are not the same schools throughout the report.
Funding on average attendance
Funding on average attendance would result in funding being redistributed from remote schools, who tend to have lower attendance rates, to urban schools. On average, urban schools would receive $123,000 more in

Northern Territory Government Department of Education
Government School Funding in the Northern Territory, Australia EY 37
variable funding, while remote category 3 schools would receive an average of $98,000 less in variable funding.
If School A and School B were funded on average attendance in 2016 their variable funding would be affected as follows.
School A, a remote category 3 primary school with 350 effective enrolments, 400 actual enrolments, and 71% attendance, would have their variable funding reduced by $450,000 (13%).
In the same year School B, an urban primary school with 460 effective enrolments, 500 actual enrolments and 90% attendance, would have their variable funding increased by $510,000 (11%).
Funding on average attendance plus 10%, limited to a band of 60% to 100%
The analysis for this alternative is based on applying the Department’s ‘calculated figure for staffing’ approach to 2017 budgets, with student numbers calculated on average attendance plus 10%, with a minimum attendance of 60% and a maximum of 100%.
Schools with an average attendance above 90% have increased funding compared to effective enrolment. However, under this methodology compared to funding on average attendance, these schools will lose variable funding, as it is redistributed from them to schools with less than 50% attendance.
For schools with between 50% and 90% attendance, this has a similar pattern of impact as funding based on average attendance, although slightly moderated.
School A in the above example would have their variable funding reduced by $378,000.
School B in the above example would have their variable funding increased by $364,000.
Overall, compared to effective enrolment this methodology would result in an average increase in variable funding of $34,000 for urban schools and a reduction in variable funding of $59,000 for remote category 2 schools.
Remote category 3 schools are better off under this methodology than funding on average attendance, due to the incidence of average attendance below 50% in these schools. On average, compared to effective enrolment, remote category 3 schools would lose $98,000 in variable funding for funding by average attendance, and they would lose $2,000 in variable funding under the calculated figure for staffing approach.
Moving averages
The analysis on replacing enrolment numbers with a moving average reduced fluctuations both between years and from preliminary to final budgets, providing greater certainty for schools in terms of budget and planning.
However, both forms of moving average analysis performed resulted in variable funding that is less responsive to sudden fluctuations in enrolments. Effective enrolment uses peaks in attendance, where averages flatten attendance, resulting in a lower average attendance than resulting effective enrolments.
Applying a three-year moving average of effective enrolment to the 2017 budget resulted in 18 schools where the moving average would have been 20 or more students lower than the number of effective enrolments. Conversely, this approach also resulted in 20 schools being funded for 20 or more students higher than the eventual number of effective enrolments.
This lag in responsiveness to enrolment fluctuations would require an additional process for schools to access additional funding when student numbers are substantially higher than the moving average. Further, without an equivalent mechanism to reduce over-funded schools, the inequity illustrated in the enrolments example is likely to be experienced
Offsetting impacts of other aspects of the model
Assessment of the impact of effective enrolment supports stakeholder reports that it disproportionately impacts remote and socio-economically disadvantaged schools, and those with high concentrations of Aboriginal students. However, deeper analysis indicates that reductions in funding as a result of the application of effective enrolment are largely offset by additional funding received through the weightings for Aboriginal students and through the small school supplement.
Northern Territory Government Department of Education
Government School Funding in the Northern Territory, Australia EY 38
In 2016, NT schools non-Aboriginal student attendance was 89.3% whilst Aboriginal student attendance was 67.0%25.
In the same year, non-Aboriginal and Aboriginal student attendance was 89.2% and 85.0% respectively for Queensland schools26. In Western Australia, non-Aboriginal and Aboriginal student attendance was 92.2% and 76.3% respectively in 201527.
There are components of the GSBFM that address the different needs of schools most impacted by effective enrolment, including:
► A weighting allocation of 0.3 for Aboriginal students.
► An additional weighting of between 0 and 0.05 for schools with high Aboriginal concentrations.
► Supplementary small school funding, additional to the variable funding calculated per student, to provide improved budget certainty for small schools by ensuring sufficient funding for at least 2 staff members, plus operational costs.
The intention of these components is to address the needs associated with students, not to address the impacts of effective enrolment. However, these elements of the model have been considered as they address some of the characteristics of schools that are most impacted by the application of effective enrolment.
The application of effective enrolment and the offsetting impacts can be grouped into three categories:
► Schools where effective enrolment does not result in reduced variable funding. These are predominantly urban senior colleges and the large, urban primary schools. They have high average attendance and an effective enrolment multiplier of 0.9 or greater.
► Schools where effective enrolment results in reduced variable funding, but which is more than offset by the Aboriginal student weightings and small school supplement. These schools are much more likely to be remote and are predominantly small schools, and schools catering for students from pre-school through to year 12. Their effective enrolment multiplier tends to be between 0.7 and 0.9.
► In 2017 there were 15 schools where the Aboriginal weightings and small school supplement did not offset the impact of effective enrolment. They all have an Aboriginal concentration above 96%, and all were small schools, or schools catering for students from pre-school through to year 12. They had an average attendance between 28% and 57% in 2016 and tended to have an effective enrolment multiplier below 0.7.
This indicates that when considering the impact of effective enrolment within the broader context, the model largely offsets the impact experienced by remote schools. Further analysis and recommendations regarding the weightings for Aboriginal students and Aboriginal concentration are detailed in the section Solution theme 4.
Key Finding 3
At this time, with a finite funding pool, effective enrolment is the most appropriate measure to distribute funds on the basis that it best distributes finite funding to schools with children attending and in front of a teacher.
Other approaches tested dilute the ability for funding to be directly related to the students who are enrolled and attending school and would require additional administrative steps to ensure responsiveness to student needs.
Recommendation 3a
Continue with the effective enrolment measure as the most efficient way to distribute the current levels of finite funding.
25 NT Department of Education. (2017). Average Enrolment and Attendance for Northern Territory Government Schools, 2016. https://education.nt.gov.au/education/statistics-research-and-strategies/enrolment-and-attendance/2016-enrolment-and-attendance-statistics 26 Queensland Department of Education. (2016). 2012-2016 Attendance rate by year level and Indigenous status. http://education.qld.gov.au/schools/statistics/student-attendance.html 27 Western Australian Department of Education. (2016). Annual Report 2015-16. https://www.education.wa.edu.au/documents/2548175/0/Annual+Report+2015-16+-+Final+-+Corrected+-+Reduced+%281%29.pdf/15c619c0-3bbb-45fb-b49f-bfb9d95937c2
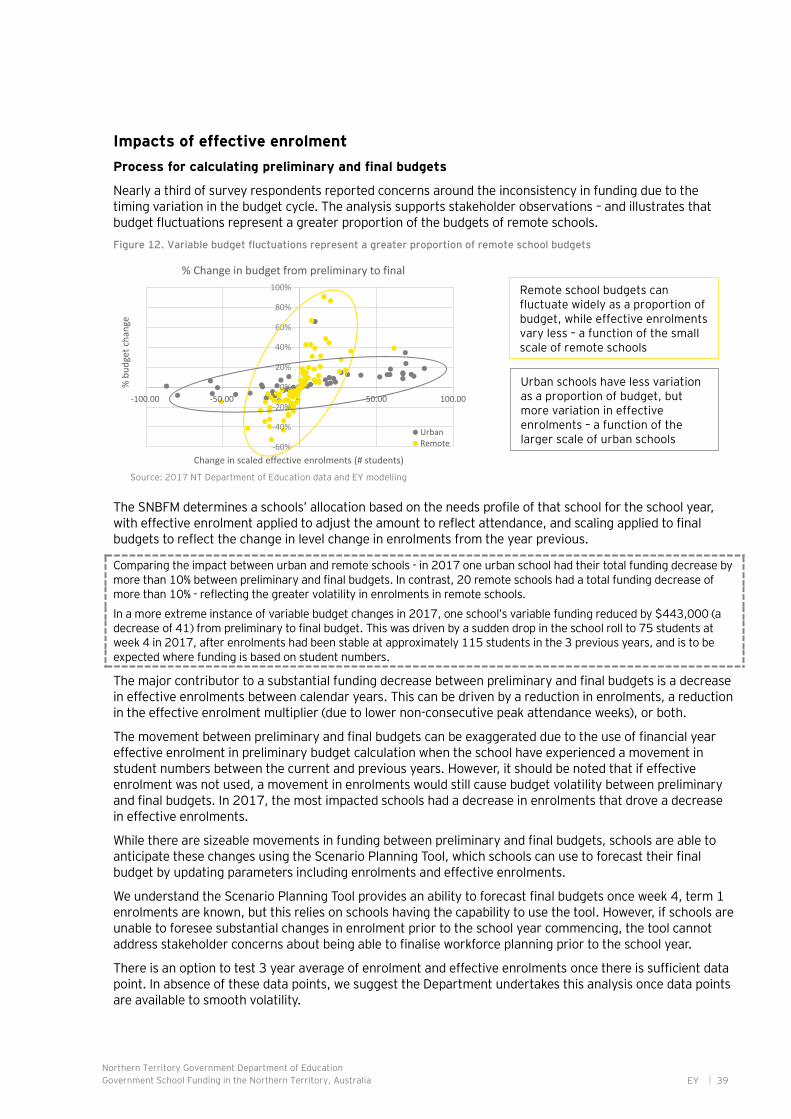
Northern Territory Government Department of Education
Government School Funding in the Northern Territory, Australia EY 39
Impacts of effective enrolment
Process for calculating preliminary and final budgets
Nearly a third of survey respondents reported concerns around the inconsistency in funding due to the timing variation in the budget cycle. The analysis supports stakeholder observations – and illustrates that budget fluctuations represent a greater proportion of the budgets of remote schools.
Figure 12. Variable budget fluctuations represent a greater proportion of remote school budgets
The SNBFM determines a schools’ allocation based on the needs profile of that school for the school year, with effective enrolment applied to adjust the amount to reflect attendance, and scaling applied to final budgets to reflect the change in level change in enrolments from the year previous.
Comparing the impact between urban and remote schools - in 2017 one urban school had their total funding decrease by more than 10% between preliminary and final budgets. In contrast, 20 remote schools had a total funding decrease of more than 10% - reflecting the greater volatility in enrolments in remote schools.
In a more extreme instance of variable budget changes in 2017, one school’s variable funding reduced by $443,000 (a decrease of 41) from preliminary to final budget. This was driven by a sudden drop in the school roll to 75 students at week 4 in 2017, after enrolments had been stable at approximately 115 students in the 3 previous years, and is to be expected where funding is based on student numbers.
The major contributor to a substantial funding decrease between preliminary and final budgets is a decrease in effective enrolments between calendar years. This can be driven by a reduction in enrolments, a reduction in the effective enrolment multiplier (due to lower non-consecutive peak attendance weeks), or both.
The movement between preliminary and final budgets can be exaggerated due to the use of financial year effective enrolment in preliminary budget calculation when the school have experienced a movement in student numbers between the current and previous years. However, it should be noted that if effective enrolment was not used, a movement in enrolments would still cause budget volatility between preliminary and final budgets. In 2017, the most impacted schools had a decrease in enrolments that drove a decrease in effective enrolments.
While there are sizeable movements in funding between preliminary and final budgets, schools are able to anticipate these changes using the Scenario Planning Tool, which schools can use to forecast their final budget by updating parameters including enrolments and effective enrolments.
We understand the Scenario Planning Tool provides an ability to forecast final budgets once week 4, term 1 enrolments are known, but this relies on schools having the capability to use the tool. However, if schools are unable to foresee substantial changes in enrolment prior to the school year commencing, the tool cannot address stakeholder concerns about being able to finalise workforce planning prior to the school year.
There is an option to test 3 year average of enrolment and effective enrolments once there is sufficient data point. In absence of these data points, we suggest the Department undertakes this analysis once data points are available to smooth volatility.
-60%
-40%
-20%
0%
20%
40%
60%
80%
100%
-100.00 -50.00 - 50.00 100.00
% b
ud
get
chan
ge
Change in scaled effective enrolments (# students)
% Change in budget from preliminary to final
UrbanRemote
Remote school budgets can fluctuate widely as a proportion of budget, while effective enrolments vary less – a function of the small scale of remote schools
Urban schools have less variation as a proportion of budget, but more variation in effective enrolments – a function of the larger scale of urban schools
Source: 2017 NT Department of Education data and EY modelling
Northern Territory Government Department of Education
Government School Funding in the Northern Territory, Australia EY 40
Managing the shift from ongoing to fixed period
Our analysis in Figure 12 is in line with stakeholder statements that the fixed period staff to ongoing ratio has been increasing. Stakeholders attribute the increase to the uncertainty around budgets year to year, so the preference being to hire fixed period staff to be able to better manage their resource mix in the event that funding is decreased in future years. However, it cannot be determined to what extent this is due to schools making recruitment decisions based on financial drivers compared to other drivers such as classroom sizes, program or subject enrolments and teacher utilisation and availability.
Given the correlation between a school’s remoteness and school size, the small school supplement introduced in 2016 may provide schools with some certainty around a minimum funding amount in future years. Consequently, the proportion of fixed period staff in remote schools may reduce. Case study schools consulted supported the introduction of the small school supplement.
Whilst not an immediate solution, broader communication of the intention of the small school supplement and monitoring of its impact is recommended.
Key Finding 4
Stakeholders identify an element of uncertainty around budgets year to year due to the application of effective enrolment. Stakeholders also attribute a preference for hiring fixed period staff to this uncertainty, to be able to better manage their resource mix in the event that funding is decreased in future years.
The proportion of teaching staff on fixed period contracts has increased each year since 2012/13, particularly in small and remote schools, reportedly in part due to increasing budget uncertainty.
The small school supplement was intended to provide a minimum funding threshold for small schools to assist in resource and program planning.
Recommendation 4a
Increase communications on the intention of the small school supplement introduced in 2016 to ensure adequate staffing levels can be maintained in small schools.
Recommendation 4b
Monitor the proportion of ongoing to fixed period teaching contracts, to identify if the certainty of funding afforded by the small school supplement facilitates a shift to a higher proportion of on-going staff.

Northern Territory Government Department of Education
Government School Funding in the Northern Territory, Australia EY 41
Solution theme 3 How can efficient investment by schools in the needs of their students be facilitated and monitored?
The profile of student needs changes as students move from one year to another or from school to school. The allocation of funding is intended to be used on the students in the year it is allocated. There are various circumstances throughout the year that may result in more or less than the allocation being expended. A surplus or a deficit should not automatically be considered as an indication of over- or under-funding of that school, due to the myriad of factors that contribute to the financial position of a particular school.
Understanding the practice of schools maintaining cash reserves and surpluses Exploring surpluses from variable allocation or grant monies
Schools that manage their expenditure within GSBFM allocations are able to keep any unspent funds at the end of each calendar year, yet no formal policy documentation exists on this. Analysis identified cash accruing in school operated bank accounts. This could potentially be an indicator of schools being over-funded, or of an inefficiency in the use of funding allocations. However, consultations indicated flaws in these assumptions.
Firstly, stakeholders reported that while they may appear to be in surplus at the end of the financial year, in a majority of cases this is the result of grants received late in the financial year. As these funds are already allocated for specific programs, stakeholders advised that these funds should not be considered a surplus. Stakeholders also reported that in remote or regional areas, funds may not be spent due to limited access to required resources or professionals. To determine drivers if surplus’, a case-by-case consultation will be required, which had not been performed as part of this report.
Secondly, the substantial changes in overall funding from preliminary to final budgets may be causing schools to hold surpluses for other reasons, including:
► To ensure sufficient funds are available to continue operations without interruption despite large decreases in variable funding.
► In a process of transition funding downwards from previous levels to align with GSBFM expected allocations.
Balance sheet data was analysed, revealing a total balance of $70.4 million being held across all schools in school-operated bank accounts at the end of 2016, with an average balance at year-end of $684,000. Stakeholders indicated that some of this is related to already-allocated external grant money and not related to GSBFM funding. Expenditure at the school level is pooled, both grant and GSBFM allocation, so it has not been possible during the consultation period to determine the extent of surpluses relating the GSBFM allocation. Table 5 below illustrates the five largest cash balances being held.
Table 5. Five largest cash balances for GSBFM funded schools at end of 2016
Cash balance Proportion of total annual GSBFM variable budget
School A 2,418,000 48%
School B 2,266,000 92%
School C 2,214,000 50%
School D 2,058,000 20%
School E 1,477,000 57%
Source: 2016 NT Department of Education data and EY modelling
As seen in Table 5, some schools are holding large proportions of their GSBFM variable budget as cash, with the average bank balance as a proportion of the variable budget being 38%. The average variable budget position is an average of $112,000 surplus, with a total GSBFM variable surplus of $8.5 million in 201628.
28 2016 NT Department of Education data

Northern Territory Government Department of Education
Government School Funding in the Northern Territory, Australia EY 42
Exploring fixed budget allocations
Fixed budgets are intended to cover the costs of property management, non-urgent minor repairs and essential services. They were determined for each school at the commencement of the GSBFM, with indexation applied each year to account for increasing costs. Case study schools indicated that fixed budgets are not adequately meeting the actual fixed expenditure of schools.
A review of fixed budgets for each school found that 55% of schools ran a fixed budget deficit. Conversely, 45% of schools ran a fixed budget surplus in 2016 which has increased from 39% in 2015. Overall, the global fixed budget position is in deficit, yet improving from an overall $5.6m deficit in 2015 to a $4.6m deficit in 2016.
Schools that have obtained a budget surplus continue to increase the size of their surplus, with the average surplus size increasing from $36,000 to $42,000 from 2015 to 2016. This increase to surplus is compounded by the indexation applied to fixed budgets, which is currently 3% per annum, higher than the Consumer Price Index (CPI), both at the national, and Darwin level. For comparison, the national CPI increased 1.9% from June 2016 to June 2017, and the Darwin CPI increased 0.5% over the same period.
The fixed cost analysis also revealed that while the overall position of schools was improving, the position of those schools that are running a fixed budget deficit has deteriorated with the average deficit increasing from $84,000 in 2015 to over $90,000 in 2016.
Figure 13. Fixed budget deficits and surpluses are increasing
Source: 2016 NT Department of Education data and EY modelling
Through consultation, many reasons were put forward for deficits and surpluses ranging from not being able to get qualified trades to perform the work, therefore money remaining unspent to the high-cost of purchasing services in remote and regional locations resulting in overspend. The data analysis didn’t show any significant patterns in types or locations of schools having surpluses and deficits.
The analysis indicates that fixed budgets are not aligned with expenditure across schools, and worsening as the size of surpluses and deficits increase. The Department should explore a better practice approach to determining fixed costs funding, such as a formula for determining fixed costs such cost per square meter. In addition, a policy position will need to be reached on how to address the current surplus and deficit position of schools.
Multisite and homeland schools
Multisite and homeland schools also reported that the fixed budgets were not sufficient to meet fixed expenditure at multiple sites. While not all multisite schools operated a fixed budget deficit in 2016, 5 of the 9 schools had a fixed budget deficit ranging from $38,000 to $304,000. Six of the schools also had a deterioration in their fixed budget balance between 2015 and 2016.
It is not clear if the fixed budget deficits of these schools are caused by the costs of operating multi-site and homeland schools, or if other factors are contributing. A higher number of sites does not exhibit a
-100,000
-80,000
-60,000
-40,000
-20,000
0
20,000
40,000
60,000
2015 2016
Average fixed budget surplus / deficit
Average surplus Average deficit

Northern Territory Government Department of Education
Government School Funding in the Northern Territory, Australia EY 43
correlation with running fixed budget deficits. In particular, a school with 7 additional sites had fixed budget surpluses in 2016 and 2017, while two schools with 1 additional site had the highest fixed budget deficits of the multisite schools in 2016.
Outside of the sufficiency of fixed costs, the Department is currently exploring the development of a homelands education delivery policy to determine what resources are required to deliver education, which should drive the allocation of funding to meet school and student needs.
Key Finding 5
The analysis indicates that fixed budgets are not aligned with expenditure, and is contributing to both surpluses and deficits increasing year on year.
Recommendation 5a
Exploring a better practice approach to determining fixed costs funding, which may include introducing a fixed funding formula. Ensure whole of life costs and adjustment to fixed budget allocations are given when planning and approving new major works.
Better management and monitoring of surpluses and cash reserves
Surpluses from variable allocation and grants
Given that grant money is mixed into the cash/fixed budget pool, overall budget positions are less clear and could not be used to form an accurate picture of an overall GSBFM funding position. However, when any cash fixed surplus or deficit is taken into account, regardless of composition, there exists a GSBFM-wide budget surplus of $17.2 million across all schools, with the five largest overall surpluses listed in Table 6 below.
In 2016, 41 schools had an overall GSBFM-wide deficit, up from 39 schools in 2015. There is not sufficient data to identify trends of types of schools that are more likely to run an overall GSBFM-wide deficit or surplus. However, in 2016, 64% of urban schools had a budget surplus, compared to 73% of schools throughout the NT. Further, a lower proportion of schools in Darwin had a surplus (54%), while 88% of schools in the Palmerston and rural region had a surplus.
Table 6. The five largest 2016 GSB budget surpluses for GSBFM funded schools
Overall budget surplus Proportion of total GSBFM variable budget
School A 1,455,000 33%
School B 1,351,000 25%
School C 1,149,000 32%
School D 865,000 44%
School E 824,000 8%
Source: 2016 NT Department of Education data and EY modelling
Key Finding 6
Consolidated financial reporting of the budget and deficit position of all schools across all funding sources is not automated, and makes it challenging for the Department to have a whole of system view.
Recommendation 6a
• In the short term, facilitating and monitoring efficient investment by updating accounting practice and financial reporting practices to more readily measure surpluses and deficits, (i.e. separated from grant funding) to promote more efficient use of funds through proactive monitoring and management.
• In the longer term, ensure this capability is included in an enterprise financial system.
Northern Territory Government Department of Education
Government School Funding in the Northern Territory, Australia EY 44
Key Finding 7
Stakeholders identify that the fluctuations between preliminary and final budgets are one of the causes for schools holding surpluses in case of reductions in funding at the final budget.
The analysis also found that in remote schools there is a significant correlation between changes in the budget from preliminary to final budget and GSBFM budget surplus/deficit position.
There is evidence of increasing cash reserves in school bank accounts. This may be due to a range of reasons as raised by stakeholders including schools holding onto funding due to budget uncertainty, or inability to spend allocation due to access to resources.
There is currently no formal Department policy on the treatment and acceptable levels or circumstances of surpluses or cash reserves.
Recommendation 7a
• Form policies on the maximum acceptable surplus as a proportion of GSBFM funding, and maximum cash reserves that schools should hold, to enable more efficient and accountable use of GSBFM funding – articulating what is acceptable and what is not.
• To facilitate planning, particularly for the small regional and remote schools that have reported less comfort with autonomy, provide additional support for using and interpreting tools, such as the Scenario Planning Tool to estimate potential budget volatility.
Improving the efficient use of resources allocated to schools After schools receive their allocation of the GSBFM, there are some situations such as extended personal leave that are material and erode funding throughout the year. These instances are unplanned, material and can cause inequity. There are other costs raised such as transport of remote students, but these have not been explored as they are not consistently material across schools, difficult to cost due to data reliability or have not been raised as impacting schools ability to manage expenditure.
Balancing and managing unplanned circumstances
Personal leave accounted for 5% of variable funding expenditure in 2016. As personal leave is often unplanned, schools report that personal leave is unforeseeable, difficult to manage and can impact on the ability to stay within budget. The ability for staff to accumulate several months of personal leave throughout their career means that instances of extended personal leave can have substantial impacts on school budgets and education delivery. Some schools reported not being able to access relief teachers in regional and remote areas, so they consolidated classes to address teacher absence.
The ability for staff to convert long service and recreational leave to personal leave after the leave has been taken creates additional uncertainty, as this shifts the cost of leave taken from the central funding pool to the schools – with potentially substantial impacts on the budget.
Extended personal leave (for periods longer than 15 consecutive working days) represented 64% of exceptional circumstances claims in 2016, incurring additional resource costs at the corporate and school level to prepare, submit and assess applications.
In 2016, School A had $81,000 in personal leave claimed. This absorbed 31% of their total variable budget.
In the same year, School B faced $237,000 in personal leave, 20% of their variable budget.
Neither school had exceptional circumstances claims in 2016. While both schools managed small fixed budget surpluses, they also overspent their variable budgets and had a deterioration in budget position from the previous year.
In order to remain cost neutral, the provision for personal leave would need to be removed from the school funding allocation and reallocated to the central pool. Based on actual 2016 personal leave costs, this amount is $14.8 million. However, further consideration needs to be given to how much is a reasonable redistribution into the central pool given that the cost is unforeseen, varies from year to year, and there is an annual accrued entitlement for employees under the EBA.
Assuming the centralisation of personal leave does not change the amount of personal leave claimed, the overall financial impact to schools is modelled to be zero, as schools’ variable budgets reduce by an average of 5%, but their costs from personal leave also reduce by the equivalent amount. Having a shared risk pool reduces schools exposure to impacts of extended leave in the future.
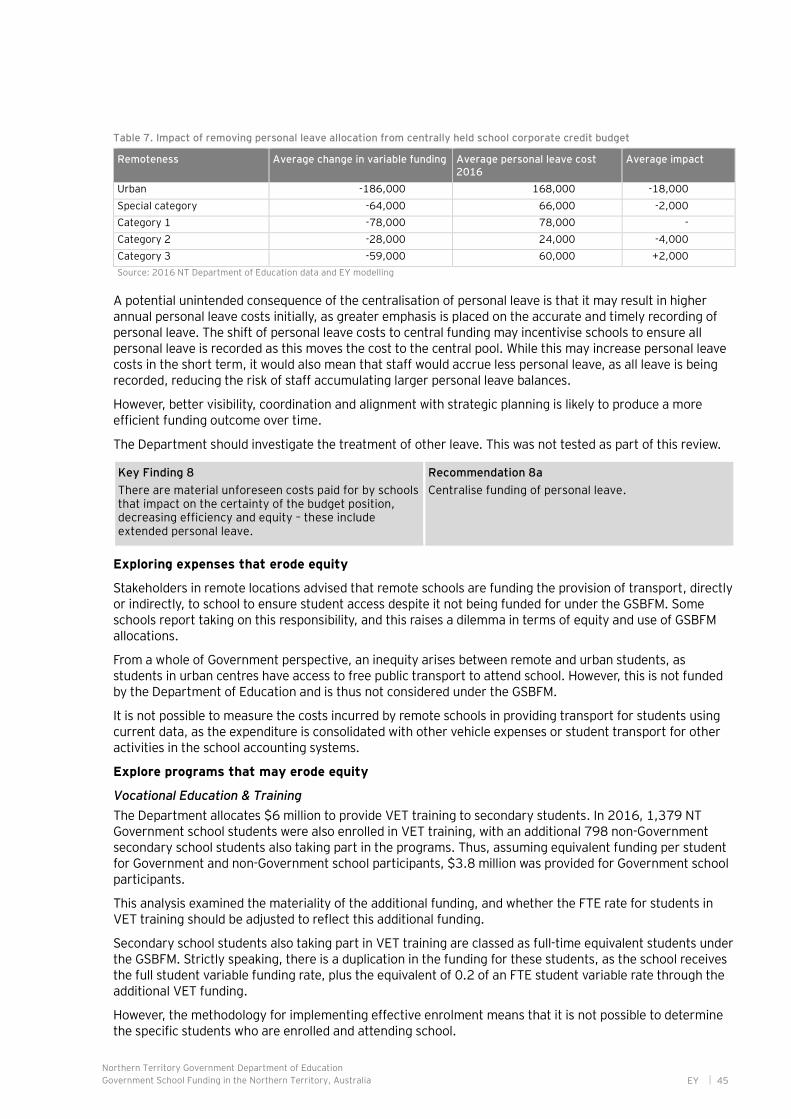
Northern Territory Government Department of Education
Government School Funding in the Northern Territory, Australia EY 45
Table 7. Impact of removing personal leave allocation from centrally held school corporate credit budget
Remoteness Average change in variable funding Average personal leave cost 2016
Average impact
Urban -186,000 168,000 -18,000
Special category -64,000 66,000 -2,000
Category 1 -78,000 78,000 -
Category 2 -28,000 24,000 -4,000
Category 3 -59,000 60,000 +2,000
Source: 2016 NT Department of Education data and EY modelling
A potential unintended consequence of the centralisation of personal leave is that it may result in higher annual personal leave costs initially, as greater emphasis is placed on the accurate and timely recording of personal leave. The shift of personal leave costs to central funding may incentivise schools to ensure all personal leave is recorded as this moves the cost to the central pool. While this may increase personal leave costs in the short term, it would also mean that staff would accrue less personal leave, as all leave is being recorded, reducing the risk of staff accumulating larger personal leave balances.
However, better visibility, coordination and alignment with strategic planning is likely to produce a more efficient funding outcome over time.
The Department should investigate the treatment of other leave. This was not tested as part of this review.
Key Finding 8
There are material unforeseen costs paid for by schools that impact on the certainty of the budget position, decreasing efficiency and equity – these include extended personal leave.
Recommendation 8a
Centralise funding of personal leave.
Exploring expenses that erode equity
Stakeholders in remote locations advised that remote schools are funding the provision of transport, directly or indirectly, to school to ensure student access despite it not being funded for under the GSBFM. Some schools report taking on this responsibility, and this raises a dilemma in terms of equity and use of GSBFM allocations.
From a whole of Government perspective, an inequity arises between remote and urban students, as students in urban centres have access to free public transport to attend school. However, this is not funded by the Department of Education and is thus not considered under the GSBFM.
It is not possible to measure the costs incurred by remote schools in providing transport for students using current data, as the expenditure is consolidated with other vehicle expenses or student transport for other activities in the school accounting systems.
Explore programs that may erode equity
Vocational Education & Training
The Department allocates $6 million to provide VET training to secondary students. In 2016, 1,379 NT Government school students were also enrolled in VET training, with an additional 798 non-Government secondary school students also taking part in the programs. Thus, assuming equivalent funding per student for Government and non-Government school participants, $3.8 million was provided for Government school participants.
This analysis examined the materiality of the additional funding, and whether the FTE rate for students in VET training should be adjusted to reflect this additional funding.
Secondary school students also taking part in VET training are classed as full-time equivalent students under the GSBFM. Strictly speaking, there is a duplication in the funding for these students, as the school receives the full student variable funding rate, plus the equivalent of 0.2 of an FTE student variable rate through the additional VET funding.
However, the methodology for implementing effective enrolment means that it is not possible to determine the specific students who are enrolled and attending school.
Northern Territory Government Department of Education
Government School Funding in the Northern Territory, Australia EY 46
Further, the additional administrative cost of managing students who are also participating in VET training or required to manage a Registered Training Organisation, would mean that any reduction in FTE would need to be moderated to ensure a redistribution of funding would not act as a disincentive from encouraging students to enrol in vocational training.
A further consideration in the equity of the VET programs arises as teaching resources for the VET programs are funded outside of the model. In 2017, 22 schools and 2 regional clusters had VET trainers funded outside of the model, meaning those schools were benefitting from funding for programs that were not accounted for in the model. Instead of reducing the FTE rate for students attending VET programs, it may be more effective to investigate incorporating the funding received by these schools into the model.
Key Finding 9a
Students enrolled in both Government Schools and VET programs are funded as full-time equivalents despite also receiving funding as VET students, potentially reducing the equity of funding allocations. In addition, some schools have trainers placed in the school.
Recommendation 9a
Department to undertake a more detailed review of program provision or resource placement which may result in unintended inequities.
Intensive English Units
In 2017, $4.7 million was allocated to four Intensive English Units (IEUs) and an Intensive English Program at a fifth school. In 2017, the IEUs were funded for 300 students. However, data was not available to analyse enrolment numbers and rates of transition from the IEU into mainstream classes.
The analysis estimated the cost per student that would have resulted from these students attending mainstream classes based on the student profile of the school that the IEU is part of. This approach accurately reflects the base rate, remote location weighting, and $1,200 ESL and special needs funding currently allocated per student. As it was not possible to identify the stage of schooling, SES score or Aboriginal status of the individual IEU students, these have been modelled based on the average weighting of students attending that school.
The modelling found that if these students had attended mainstream classes, their SNBFM funding per student would have totalled to $3.6 million. Thus, the difference between the $4.7 million in funding for IEUs and the $3.6 million that would have been allocated if the student were in mainstream classes, indicates that the cost of these programs estimated to be $1.1 million, or $3,700 per student.
While access to intensive English classes is an important means of addressing specific educational needs in the NT, they are an example of the conflict between providing sufficient funding for educational outcomes and equity of the wider system.
As in intervention strategy, IEUs may be an effective in enabling students to gain the skills necessary to enter in the Australian education system without requiring ongoing additional funding. However, there was not sufficient data for this analysis to measure the effectiveness of this funding at preparing students to transition to mainstream classes.
The inability to link these funds to specific students, and to link funds with outcomes reduces the transparency of the application of these funds. For transparency and ensuring efficient use of this level of funding per student, consideration should be given to the efficacy of these programs.
Key Finding 9b
After accounting for the funding that would be allocated for Intensive English Unit (IEU) students if they attended mainstream classes, the funding for IEUs is estimated for 2017 to be $3,700 per student.
While IEUs may be an effective means for preparing students with ESL needs to transition to mainstream classes, there is not sufficient data available to determine the efficacy of the programs.
Recommendation 9b
Review the access and outcomes of the IEU program and develop a performance measure to monitor the number of students attending IEUs and transitioning to mainstream classes, to monitor the efficacy of the IEUs for preparing students to return to mainstream classes.

Northern Territory Government Department of Education
Government School Funding in the Northern Territory, Australia EY 47
Solution theme 4 How can funding be better targeted to student needs?
Testing if the current weightings reflect the actual environment
At the core of the GSBFM is the premise that funding is distributed to students in a way that targets need and improves access to education. The SNBFM, as explored in the context section, shares many similar elements to other SNBFMs in other jurisdictions.
The existing weightings are broadly accepted by stakeholders, however as schools build understanding around the GSBFM, there is a desire for more understanding on how the weightings are determined and their intended purpose. Schools report that the introduction of the GSBFM has resulted in changes to how schools allocate resources, with 83% of schools having made some change to better meet students’ needs. While case study schools highlighted issues in managing the workforce mix to stay within annual funding allocations, survey respondents reported improvements in the areas of staffing and greater flexibility around how to use their funding as a result of the introduction of the GSBFM.
However, just with the changing student needs profile, the weightings should be flexible enough to capture these changes. The analysis has determined a number of potential refinements to the existing weightings.
Stage of school weightings
Year level weightings are driven by the differences in complexity and cost of delivery at stages of schooling. For instance, the need to provide more specialised subjects for senior students reduces the number of students per teacher, increasing the cost of staffing per student. Case study schools consulted appreciated the recent changes to the stage of school weightings. However, case study schools indicated specific challenges for regional secondary schools with mixed cohorts or small schools with teaching principals.
As the weightings in the model are intended to address the different cost structures of teaching by year level, as well as covering the administrative and education delivery costs of the different stages of education, the analysis evaluated the staff cost per student by school type and measured the proportionate differences between these costs to test whether they reflect the differences in the weightings.
While there is not sufficient data to confirm the adequacy of stage of school weightings by individual year level, analysis by school type indicates that the stage of school weightings, and scaling applied to middle and secondary school cohorts reflects the staffing structures and costs of teaching primary, middle and secondary students. For instance, the cost of teaching staff per student in senior colleges and comprehensive high schools in 2017 is 29% higher than that of primary schools – reflected in the 0.32 weighting applied to senior students.
The cost of teaching staff per student in years 7 to 9 is 22% higher than in years 1 to 6 – more than is accounted for in the 0.16 weighting for students in year 7 to 9. However, the additional scaling for middle schools with up to 600 students addresses this shortfall.
The analysis also considered whether there was any evidence that particular school types, school sizes and student to teacher ratios were impacting on the budget performance of schools, in order to determine whether the stage of school weighting is sufficient to ensure that schools have enough resources to deliver classes, to meet regulations and to cover administrative costs.
Based on analysis of budget surpluses and deficits, there was no conclusive evidence to indicate consistent factors contributing to poorer budget performance based on student to teacher ratios. Some school types demonstrated a higher frequency of budget deficits in 2016. Notably, 20 of the 22 ‘schools’ (a category of school type with students ranging from pre-school through to year 12 – all in remote locations) had a deficit central funding balance in 2016. However, this did not consistently translate to an overall GSBFM budget deficit, with 15 of the 22 schools operating a GSBFM budget surplus for the same period.
In contrast, all middle schools had a surplus credit budget balance in 2016, but the smaller middle schools (with 322 or fewer effective enrolments) had a deficit GSBFM budget and a deficit across all funding streams. In contrast, the larger middle schools (all with more than 500 effective enrolments) had an overall surplus. The sample size of middle schools is too small to confirm with significance testing, and these results are not consistent across 2015 and 2016.
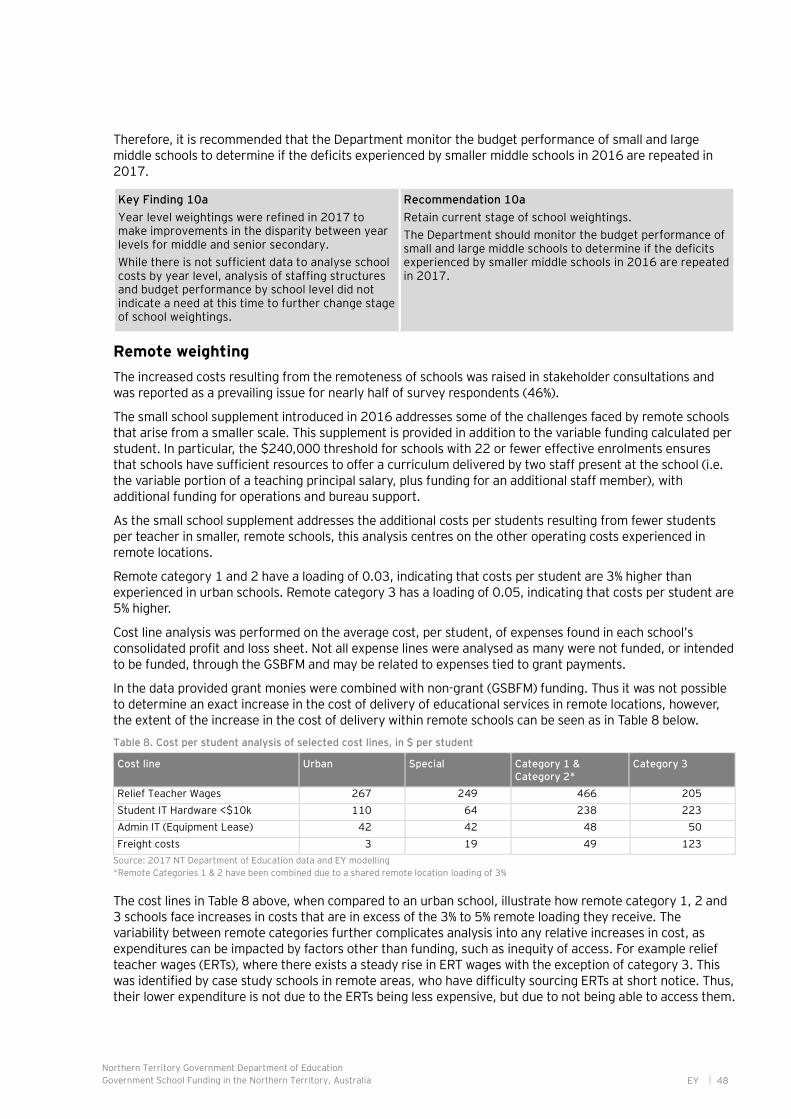
Northern Territory Government Department of Education
Government School Funding in the Northern Territory, Australia EY 48
Therefore, it is recommended that the Department monitor the budget performance of small and large middle schools to determine if the deficits experienced by smaller middle schools in 2016 are repeated in 2017.
Key Finding 10a
Year level weightings were refined in 2017 to make improvements in the disparity between year levels for middle and senior secondary.
While there is not sufficient data to analyse school costs by year level, analysis of staffing structures and budget performance by school level did not indicate a need at this time to further change stage of school weightings.
Recommendation 10a
Retain current stage of school weightings.
The Department should monitor the budget performance of small and large middle schools to determine if the deficits experienced by smaller middle schools in 2016 are repeated in 2017.
Remote weighting
The increased costs resulting from the remoteness of schools was raised in stakeholder consultations and was reported as a prevailing issue for nearly half of survey respondents (46%).
The small school supplement introduced in 2016 addresses some of the challenges faced by remote schools that arise from a smaller scale. This supplement is provided in addition to the variable funding calculated per student. In particular, the $240,000 threshold for schools with 22 or fewer effective enrolments ensures that schools have sufficient resources to offer a curriculum delivered by two staff present at the school (i.e. the variable portion of a teaching principal salary, plus funding for an additional staff member), with additional funding for operations and bureau support.
As the small school supplement addresses the additional costs per students resulting from fewer students per teacher in smaller, remote schools, this analysis centres on the other operating costs experienced in remote locations.
Remote category 1 and 2 have a loading of 0.03, indicating that costs per student are 3% higher than experienced in urban schools. Remote category 3 has a loading of 0.05, indicating that costs per student are 5% higher.
Cost line analysis was performed on the average cost, per student, of expenses found in each school’s consolidated profit and loss sheet. Not all expense lines were analysed as many were not funded, or intended to be funded, through the GSBFM and may be related to expenses tied to grant payments.
In the data provided grant monies were combined with non-grant (GSBFM) funding. Thus it was not possible to determine an exact increase in the cost of delivery of educational services in remote locations, however, the extent of the increase in the cost of delivery within remote schools can be seen as in Table 8 below.
Table 8. Cost per student analysis of selected cost lines, in $ per student
Cost line Urban Special Category 1 & Category 2*
Category 3
Relief Teacher Wages 267 249 466 205
Student IT Hardware <$10k 110 64 238 223
Admin IT (Equipment Lease) 42 42 48 50
Freight costs 3 19 49 123
Source: 2017 NT Department of Education data and EY modelling
*Remote Categories 1 & 2 have been combined due to a shared remote location loading of 3%
The cost lines in Table 8 above, when compared to an urban school, illustrate how remote category 1, 2 and 3 schools face increases in costs that are in excess of the 3% to 5% remote loading they receive. The variability between remote categories further complicates analysis into any relative increases in cost, as expenditures can be impacted by factors other than funding, such as inequity of access. For example relief teacher wages (ERTs), where there exists a steady rise in ERT wages with the exception of category 3. This was identified by case study schools in remote areas, who have difficulty sourcing ERTs at short notice. Thus, their lower expenditure is not due to the ERTs being less expensive, but due to not being able to access them.

Northern Territory Government Department of Education
Government School Funding in the Northern Territory, Australia EY 49
The case study schools advised that the costs of accessing ERTs would be high if they were available, due to travel costs. One school also identified that there was no accommodation available for ERTs, other than staying at the principal’s house. Case study schools advised of several strategies to cope with not being able to access ERTs, including staff working while unwell, using non-teaching staff to supervise students, combining classes, or closing the school for the day.
At this stage, there is not sufficient data to provide an evidence base to recommend changes to the remote locations weightings. Given the mixture of grant and non-grant money into each schools profit and loss, combined with the evidence supporting significantly higher relative costs than are provided for in the GSBFM, it is recommended initiate further investigation into the cost of delivering education in remote locations.
Key Finding 10b
Costs are higher in remote locations as supported by cost analysis and stakeholder consultation. More investigation is required to make any adjustment to the weighting.
Recommendation 10b
Retain current remote location weightings.
Initiate further investigation into the cost of delivering education in remote locations. Monitor the findings from the independent review into Regional, Rural and Remote Education by the Australian Government’s Department of Education and Training, as they may detail education delivery requirements that can be used to identify potential cost drivers for consideration.
Aboriginal weighting
The Aboriginal student weighting is a proxy for more direct data for factors that are statistically more common in Aboriginal populations known to effect education outcomes. The weighting is intended to address these needs, including language, cultural, attendance and socio-economic status. Evidence indicates that the needs of Aboriginal students are different in the more remote locations. For instance, the NAPLAN results of Aboriginal students are higher in more urban areas. In 2016 for example, the achievement of Year 3 Aboriginal students in reading showed that 72% of students in outer regional NT were at or above the national minimum standard, compared to 50% in remote and 26 % in very remote locations29.
Further, Aboriginal students in urban NT demonstrate different attendance rates to Aboriginal students living in more remote locations. In 2016 the attendance rate of Aboriginal students varied from an average of 81% in urban areas to an average of 56% in very remote areas. By contrast, the average attendance of non-Aboriginal students was much more similar between urban areas (90%) and very remote areas (89%).
Regular school attendance is a key contributor to successful educational outcomes. However many factors that can contribute to the lower attendance rates of Aboriginal students – some of which are exaggerated by remoteness, including health, ceremonies, sporting activities and religious or cultural activities30. Researchers note that while there are many examples of successful programs to engage Aboriginal students with school, these are often short lived, and sustainable programs are necessary for schools to implement strategies to secure attendance of all students31. The Aboriginal student weighting and concentration provide a sustainable source of funding for implementation of strategies that target the needs of Aboriginal students.
Reducing the Aboriginal student weighting for urban schools
The analysis investigated whether it would be appropriate to implement different weightings for Aboriginal students in urban and remote schools in order to reflect the different needs of Aboriginal students. The adjustment of Aboriginal student weightings would result in $2.4 million being redistributed from urban schools (an average of -$45,000 per school, or -1.4% of variable budget) to the schools most impacted by effective enrolment (increase by an average of $105,000 or 8% in variable budget). However, this had unintended impacts on urban schools with a large proportion of Aboriginal students traveling from remote areas to attend an urban school.
29 The Australian Curriculum, Assessment and Reporting Authority. (2016). NAPLAN National Report. http://reports.acara.edu.au/Home/Results#results 30 Partington, G., Gray, J., & Byrne, M. (n.d.). School attendance and Aboriginal students. Western Australia Department of Education. 31 ibid

Northern Territory Government Department of Education
Government School Funding in the Northern Territory, Australia EY 50
School A, an urban primary school in Palmerston region, with 59% Aboriginal students would have experienced a $102,000 decrease in variable budget.
School B in Alice Springs with 54% Aboriginal students would have experienced a $64,000 decrease in variable funding.
Adjusting Aboriginal student funding to reflect ESL needs
The analysis also evaluated the potential of the Aboriginal student weighting being reduced and a more direct source of need, ESL being introduced. This was attempted by reducing the Aboriginal student weighting for all students and adding an additional weighting for Aboriginal students with identified ESL needs.
As the dataset for ESL needs is incomplete, there was not sufficient data to draw reliable conclusions on the viability and impact of this option. Once a complete dataset of students with ESL needs is available, this option should be re-assessed in order to more specifically target funding directly to specific student needs.
Shifting Aboriginal student funding from all students to high concentration schools
In order to reflect the more complex needs of Aboriginal students in more remote locations, without negatively impacting urban schools with students attending from remote locations, the analysis also examined the option of reducing the Aboriginal status weighting for all students and increasing the weighting for the concentration of Aboriginal students in a school.
The basis for this analysis was to identify a budget neutral solution where the weightings reflect the different needs of Aboriginal students in urban and remote locations (notably the lower attendance rates of Aboriginal students in remote locations and poorer NAPLAN outcomes demonstrated by Aboriginal students in more remote locations). This analysis was constrained by maintaining a budget neutral solution to allocating funding to reflect different levels of student needs, as opposed to identifying the appropriate level of funding to reflect the cost of delivering education to meet different levels of student needs.
It was found that a budget neutral shift of funding could be achieved by:
► Reducing the weighting of all Aboriginal students from 0.3 to 0.225
► Increasing the maximum Aboriginal concentration weighting from 0.05 to 0.15
► Reducing the floor of where of the Aboriginal concentration begins from 40% to 35%
► Maintain the ceiling of the Aboriginal concentration at 80%
The combined weightings for Aboriginal students, and for the concentration of Aboriginal students in a school are illustrated below.
Figure 14. Comparison of current and recommended Aboriginal student weightings
Source: 2017 NT Department of Education data and EY modelling
0
0.05
0.1
0.15
0.2
0.25
0.3
0.35
0.4
0 0.2 0.4 0.6 0.8 1
Wei
ghti
ng
% Aboriginal students
Aboriginal student and concentration weightings
By recommendations Current

Northern Territory Government Department of Education
Government School Funding in the Northern Territory, Australia EY 51
As the concentration of Aboriginal students is higher in remote locations in the NT, the increase in the weighting for the concentration of Aboriginal students balances the impact of the reduction of the Aboriginal student weighting, and results in a higher combined weighting for schools with more than 67% Aboriginal students.
The impact of these adjustments would result in an average decrease in variable funding for urban schools of $16,800 per school, with the worst affected school’s budget reducing by $93,000. Remote category 3 schools would receive an average increase in variable funding of $16,200.
The benefit of this option is that the weighting reflects the differences in characteristics of Aboriginal students in urban and remote areas, while not negatively impacting urban schools with a high proportion of Aboriginal students attending from outside of the area.
By reducing the level where this weighting commences to 35% an additional 6 schools with 700 effectively enrolled Aboriginal students are covered by the weighting. For comparison, in Western Australia, the allocation of funding for Aboriginal students increases progressively as the proportion of Aboriginal students exceeds 5%.
Increasing the band of schools covered by the Aboriginal student concentration weighting also reflects stakeholder consultation feedback of the complexity faced by schools in meeting the needs of diverse student cohorts. This feedback aligns with research findings that culturally diverse communities have complex learning experiences and that education services need to be culturally suitable to increase enrolment, attendance and responsiveness of children32.
Key Finding 10c
The weightings in the model have facilitated improvements in the equitable allocation of resources, but the current Aboriginal weighting may not be adequate to address the complex needs of some remote student profiles.
In particular, NT Aboriginal students’ NAPLAN results are poorer as their remoteness increases, and school attendance rates are poorer for Aboriginal students in remote areas compared to less remote areas.
Recommendation 10c
Consider adjusting the Aboriginal student weighting to reflect the different needs of Aboriginal students between remote and urban schools. A budget neutral adjustment can be achieved by adjusting the Aboriginal student and concentration weightings to distribute more funds to schools with a higher concentration by:
• Adjusting the Aboriginal student weighting from 0.3 to 0.225
• Distributing more funds to schools with high Aboriginal concentration by increasing the Aboriginal student concentration weighting from 0.05 to 0.15
• Reducing the floor of the Aboriginal student concentration from 40% to 35%, so that more schools are included in the calculations
• Maintaining the Aboriginal student concentration ceiling at 80%.
Socio-economic status (SES) weighting
The socio-economic status (SES) weighting is a proxy for more direct data for factors that are statistically more common in low socio-economic populations known to effect education outcomes. The SES score for each student ranges from 0 to 0.40 and is designed as a measure of socio-economic disadvantage where 0 represents the least level of disadvantage and 0.4 represents the most disadvantaged students. SES scores are structured to take into account the parental background of each student by recording both parents’ educational background and employment status in order to determine a relative level of disadvantage.
The SES score calculated for each student in the GSBFM illustrates the low socio-economic status of students in the NT. This is reinforced by stakeholder consultations identifying the high complexity in the needs of the students, often resulting in more assistance required in the classroom and in administration.
Given that SES weighting is a proxy and with no more detailed data on the needs of individual children related to socio-economic hardship (such as cases of trauma, abuse, homelessness) currently available, the socio-economic status score represents the best measure of educational disadvantage available.
32 Social Ventures Australia. (2016). SVA Perspectives Education. http://www.socialventures.com.au/assets/Education-Perspective-web.pdf

Northern Territory Government Department of Education
Government School Funding in the Northern Territory, Australia EY 52
Key Finding 10d
The weightings in the model have facilitated improvements in the equitable allocation of resources. While schools report that students from households with low socio-economic status have needs that are not addressed in current needs funding, there is not currently a robust, alternative set of data on student needs that could be utilised to improve the SES weighting.
Recommendation 10d
Maintain current method of developing and applying student-based SES scores.
Being adaptable to allow for other needs not currently in the GSBFM
Through consultation and survey results, a number of student needs were raised that are currently not captured through the SNBFM but through other funding programs.
Case study schools identified the need for specialist skills and support to manage challenging behaviours and address learning difficulties. This includes trauma-informed and trained teachers, emotional and well-being programs, psychologist, counsellor, mentor, youth worker or Aboriginal and Islander Education Worker (AIEW). Case study schools report they struggle to fund and find these supports. Stakeholders advised that one single weighting for special needs would not work as there is a spectrum of needs so funding needs to be flexible.
In addition, case study schools have identified the requirement to divert resources in both administration and teaching, to manage and support children affected by trauma. This was broadly identified as including children in foster care, independent minors, children experiencing neglect, and victims of domestic and family violence.
To be able to categorise student need sufficiently to drive funding allocation through the model, reliable data capturing of these needs is required. In many circumstances, data stakeholders felt the data wasn’t reliable or accurately captures the need.
Stakeholders consistently raised ESL and students with special needs as areas of focus and not currently included in the SNBFM. These are explored below.
Improving how ESL funding is targeted and distributed
There are approximately 13,600 ESL students in the NT. This accounts for more than 40% of all effectively enrolled students. Of the students with ESL needs, approximately 8,600 identify as being Aboriginal.
In 2017, $5.6 million of GSBFM funding intended for ESL students was evenly distributed across all government-school students in the NT at a rate of $200 per student. The Department identified the inability to target ESL funding directly to students with ESL needs as a gap, arising due to the lack of reliable data.
We have analysed the impact of redistributing ESL funding based on existing data in order to provide indicative analysis on the potential impact to schools. It is expected that with more detailed data on the level and progress of students with ESL needs, the Department will be able to further refine the redistribution of ESL funding.
Targeting existing ESL funding to students who need it
For comparative purposes, the analysis to follow considers the redistribution of funding based on effective enrolments.
The ability to identify and target funding to students with ESL needs will allow the redistribution of $5.6 million, allowing an average of $521 per student if funding is proportionately allocated based on effective enrolments.
Based on an average per student, redistribution of the $5.6 million would result in less funding for urban schools and more funding for remote schools, as detailed in Table 9 below.
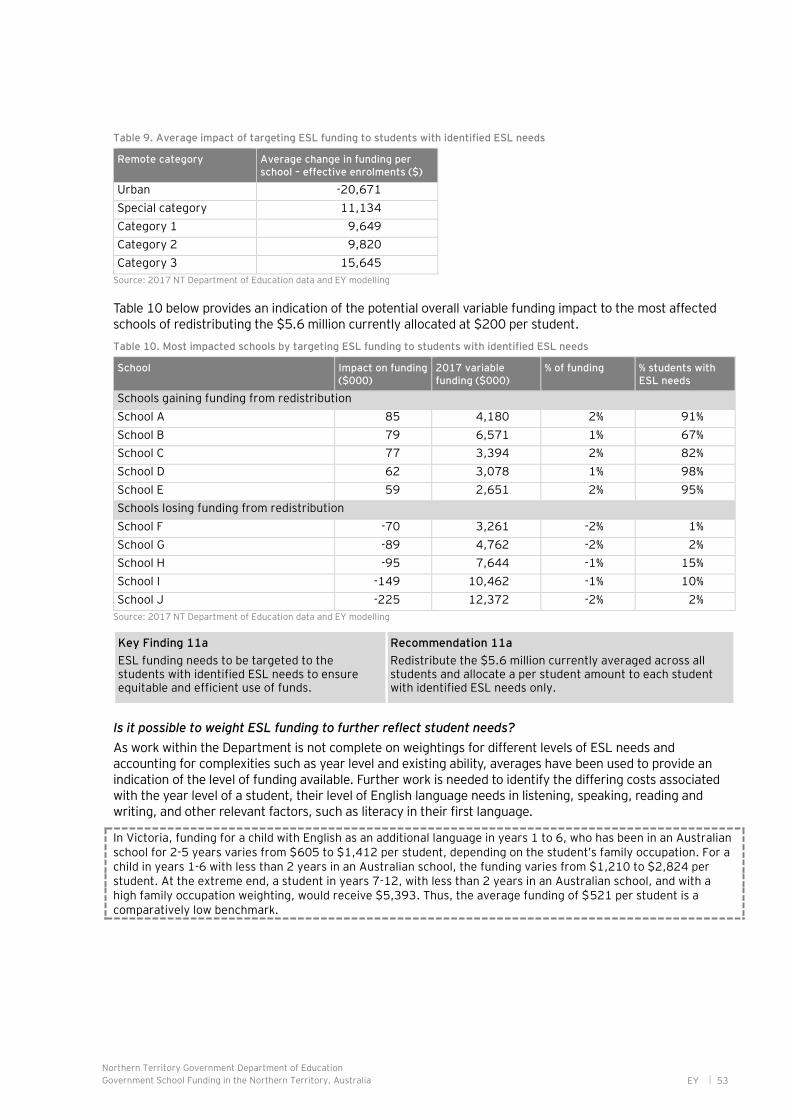
Northern Territory Government Department of Education
Government School Funding in the Northern Territory, Australia EY 53
Table 9. Average impact of targeting ESL funding to students with identified ESL needs
Remote category Average change in funding per school – effective enrolments ($)
Urban -20,671
Special category 11,134
Category 1 9,649
Category 2 9,820
Category 3 15,645
Source: 2017 NT Department of Education data and EY modelling
Table 10 below provides an indication of the potential overall variable funding impact to the most affected schools of redistributing the $5.6 million currently allocated at $200 per student.
Table 10. Most impacted schools by targeting ESL funding to students with identified ESL needs
School Impact on funding ($000)
2017 variable funding ($000)
% of funding % students with ESL needs
Schools gaining funding from redistribution
School A 85 4,180 2% 91%
School B 79 6,571 1% 67%
School C 77 3,394 2% 82%
School D 62 3,078 1% 98%
School E 59 2,651 2% 95%
Schools losing funding from redistribution
School F -70 3,261 -2% 1%
School G -89 4,762 -2% 2%
School H -95 7,644 -1% 15%
School I -149 10,462 -1% 10%
School J -225 12,372 -2% 2%
Source: 2017 NT Department of Education data and EY modelling
Key Finding 11a
ESL funding needs to be targeted to the students with identified ESL needs to ensure equitable and efficient use of funds.
Recommendation 11a
Redistribute the $5.6 million currently averaged across all students and allocate a per student amount to each student with identified ESL needs only.
Is it possible to weight ESL funding to further reflect student needs?
As work within the Department is not complete on weightings for different levels of ESL needs and accounting for complexities such as year level and existing ability, averages have been used to provide an indication of the level of funding available. Further work is needed to identify the differing costs associated with the year level of a student, their level of English language needs in listening, speaking, reading and writing, and other relevant factors, such as literacy in their first language.
In Victoria, funding for a child with English as an additional language in years 1 to 6, who has been in an Australian school for 2-5 years varies from $605 to $1,412 per student, depending on the student’s family occupation. For a child in years 1-6 with less than 2 years in an Australian school, the funding varies from $1,210 to $2,824 per student. At the extreme end, a student in years 7-12, with less than 2 years in an Australian school, and with a high family occupation weighting, would receive $5,393. Thus, the average funding of $521 per student is a comparatively low benchmark.
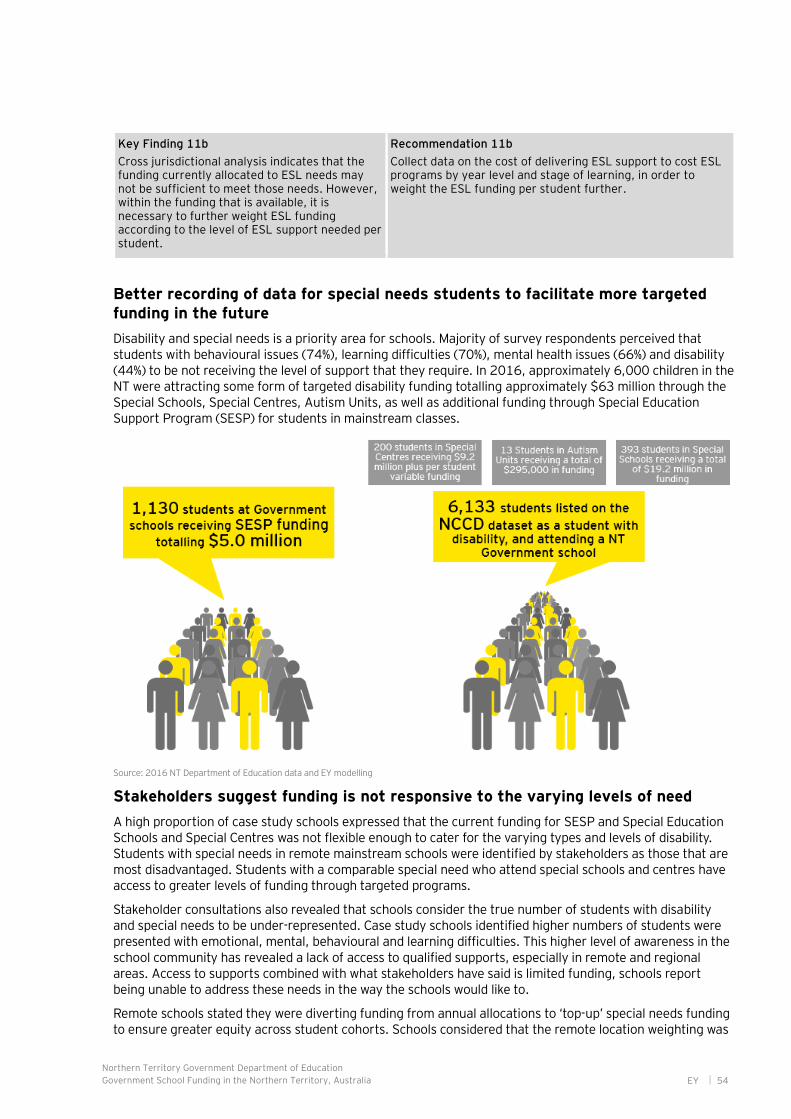
Northern Territory Government Department of Education
Government School Funding in the Northern Territory, Australia EY 54
Key Finding 11b
Cross jurisdictional analysis indicates that the funding currently allocated to ESL needs may not be sufficient to meet those needs. However, within the funding that is available, it is necessary to further weight ESL funding according to the level of ESL support needed per student.
Recommendation 11b
Collect data on the cost of delivering ESL support to cost ESL programs by year level and stage of learning, in order to weight the ESL funding per student further.
Better recording of data for special needs students to facilitate more targeted funding in the future
Disability and special needs is a priority area for schools. Majority of survey respondents perceived that students with behavioural issues (74%), learning difficulties (70%), mental health issues (66%) and disability (44%) to be not receiving the level of support that they require. In 2016, approximately 6,000 children in the NT were attracting some form of targeted disability funding totalling approximately $63 million through the Special Schools, Special Centres, Autism Units, as well as additional funding through Special Education Support Program (SESP) for students in mainstream classes.
Source: 2016 NT Department of Education data and EY modelling
Stakeholders suggest funding is not responsive to the varying levels of need
A high proportion of case study schools expressed that the current funding for SESP and Special Education Schools and Special Centres was not flexible enough to cater for the varying types and levels of disability. Students with special needs in remote mainstream schools were identified by stakeholders as those that are most disadvantaged. Students with a comparable special need who attend special schools and centres have access to greater levels of funding through targeted programs.
Stakeholder consultations also revealed that schools consider the true number of students with disability and special needs to be under-represented. Case study schools identified higher numbers of students were presented with emotional, mental, behavioural and learning difficulties. This higher level of awareness in the school community has revealed a lack of access to qualified supports, especially in remote and regional areas. Access to supports combined with what stakeholders have said is limited funding, schools report being unable to address these needs in the way the schools would like to.
Remote schools stated they were diverting funding from annual allocations to ‘top-up’ special needs funding to ensure greater equity across student cohorts. Schools considered that the remote location weighting was
Northern Territory Government Department of Education
Government School Funding in the Northern Territory, Australia EY 55
not sufficient to cover the additional costs of accessing supports for students with special need. This was unable to be verified with the available data.
Guiding standards and policies
The Disability Standards for Education 2005 (the Standards) seek to ensure that students with disability can access and participate in education “on the same basis” as other students. A student with a disability must have opportunities and choices which are comparable with those offered to students without a disability. Data is currently collected on students with disabilities in line with the NCCD, and the Department is making improvements each year in the consistency of data collection as NT schools and teachers build on their experience with it.
The 2016 NCCD on School Students with Disability revealed that 20.4% of students (6,646 students) in the NT were receiving adjustments due to disability, the highest proportion of any state or territory, with SA at 20%33. The NCCD data provided by the Department revealed a total of 5,953 students with a recorded disability. This is nearly 700 students less than the NCCD set, indicating that there are inconsistencies in the data, which is supported by stakeholder feedback.
The Department’s Student with a Disability Policy is guided by the Standard. The policy makes it imperative for all Government schools to provide students with a disability an appropriate Education Adjustment Plan (EAP) for personalised learning and support. The EAP is informed and underpinned by consultations between teachers, parents or caregivers, and students as well as other appropriate external allied health practitioners where required. This approach relies on teachers, principals and schools more broadly, being informed and having the appropriate understanding and knowledge in special needs to undertake consultations.
Students need based disability funding in other jurisdictions
Other jurisdictions collect data aligned with the NCCD also. Cross-jurisdictional analysis shows that Victoria, Western Australia and South Australia have developed and defined a range of disability categories which are linked to funding amounts. The needs are categorised according to levels of disability and funding required for supports and adjustments for students with a disability in mainstream, special schools and centres. In these jurisdictions, the distribution of disability funding is built into the student needs model.
Without undertaking a detailed analysis, it appears that the jurisdictions stated above have a more developed approach to distributing funding to students with special needs. By comparison, the funding models consider concentration and categorisation of students with challenging behaviour. The policies and funding approaches of these jurisdictions are easier to find and understand than the current approach in the NT. This is supported by stakeholder feedback highlighting that the current funding approach is difficult to navigate and lacks transparency.
Given the high proportion of students with special needs in the NT, it would be ideal to align current sources of special needs funding through the SNBFM, similar to how other jurisdictions do. This would improve transparency and simplification of funding arrangements. This is only possible when the consistency of data for students with special needs improve. Currently, the data set is not reliable enough to be able to appropriately identify and make a recommendation of this nature but should be considered as part of future improvements to the SNBFM.
Overview of current funding for students with special needs
Students with a disability attending Special Schools or Centres are funded through targeted funding while the Special Education Support Program (SESP) provides funding to mainstream schools to support students with diagnosed disabilities. Consultations revealed that the policy and how funding is allocated to these areas is not widely understood and the information is difficult to find.
Figure 15 below is a breakdown of current funding for students with special needs in 2016, totalling $33.8 million.
33 Education Council. (n.d.). 2016 emergent data on students in Australian schools receiving adjustments for disability, http://www.educationcouncil.edu.au/EC-Reports-and-Publications.aspx
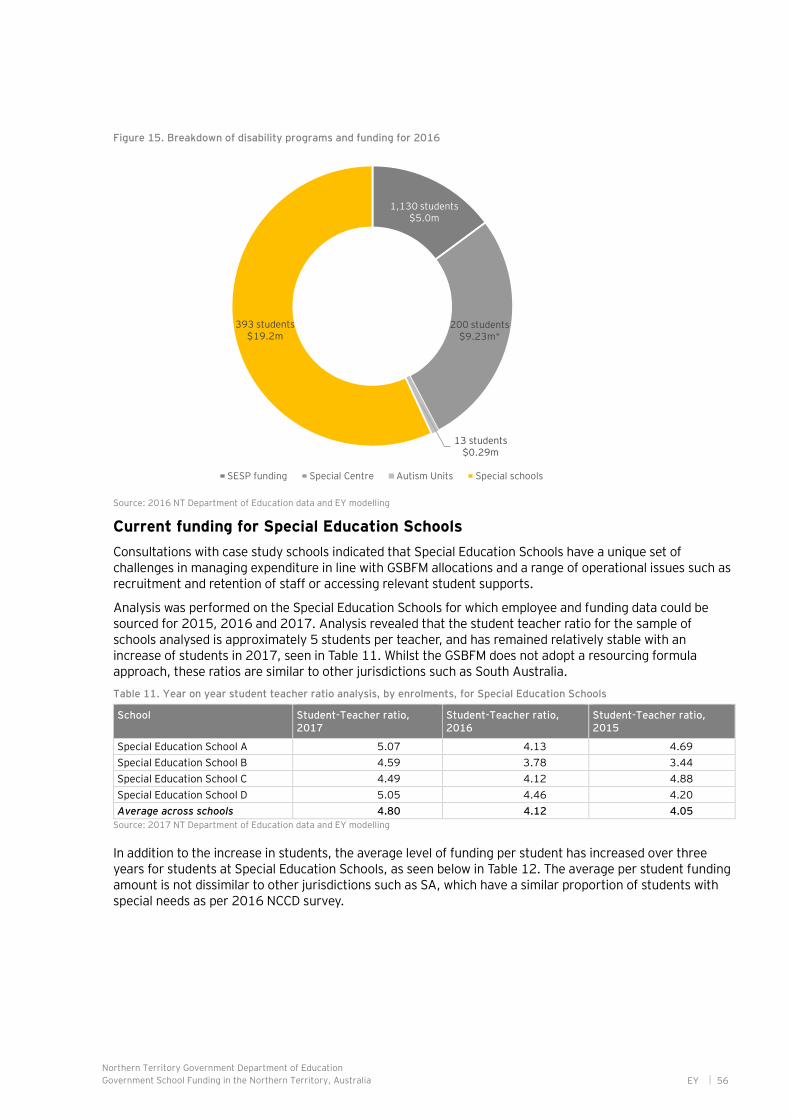
Northern Territory Government Department of Education
Government School Funding in the Northern Territory, Australia EY 56
Figure 15. Breakdown of disability programs and funding for 2016
Source: 2016 NT Department of Education data and EY modelling
Current funding for Special Education Schools
Consultations with case study schools indicated that Special Education Schools have a unique set of challenges in managing expenditure in line with GSBFM allocations and a range of operational issues such as recruitment and retention of staff or accessing relevant student supports.
Analysis was performed on the Special Education Schools for which employee and funding data could be sourced for 2015, 2016 and 2017. Analysis revealed that the student teacher ratio for the sample of schools analysed is approximately 5 students per teacher, and has remained relatively stable with an increase of students in 2017, seen in Table 11. Whilst the GSBFM does not adopt a resourcing formula approach, these ratios are similar to other jurisdictions such as South Australia.
Table 11. Year on year student teacher ratio analysis, by enrolments, for Special Education Schools
School Student-Teacher ratio, 2017
Student-Teacher ratio, 2016
Student-Teacher ratio, 2015
Special Education School A 5.07 4.13 4.69
Special Education School B 4.59 3.78 3.44
Special Education School C 4.49 4.12 4.88
Special Education School D 5.05 4.46 4.20
Average across schools 4.80 4.12 4.05
Source: 2017 NT Department of Education data and EY modelling
In addition to the increase in students, the average level of funding per student has increased over three years for students at Special Education Schools, as seen below in Table 12. The average per student funding amount is not dissimilar to other jurisdictions such as SA, which have a similar proportion of students with special needs as per 2016 NCCD survey.
1,130 students$5.0m
200 students$9.23m*
13 students$0.29m
393 students$19.2m
SESP funding Special Centre Autism Units Special schools
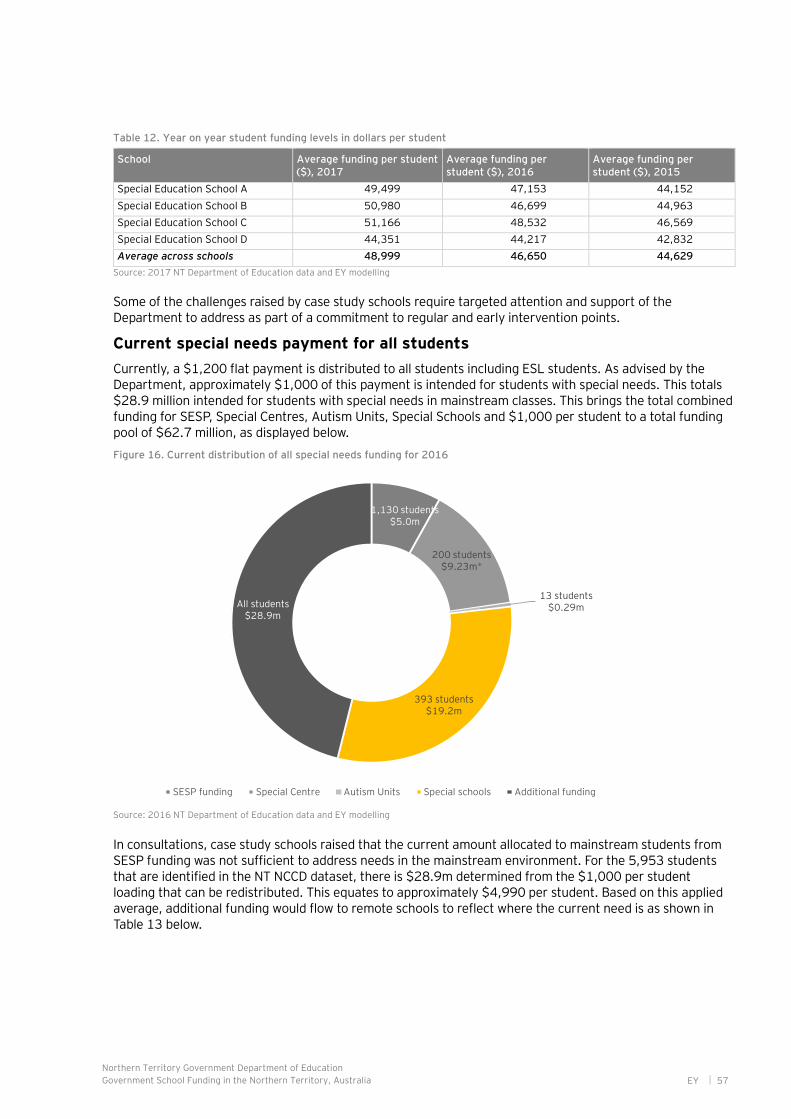
Northern Territory Government Department of Education
Government School Funding in the Northern Territory, Australia EY 57
Table 12. Year on year student funding levels in dollars per student
School Average funding per student ($), 2017
Average funding per student ($), 2016
Average funding per student ($), 2015
Special Education School A 49,499 47,153 44,152
Special Education School B 50,980 46,699 44,963
Special Education School C 51,166 48,532 46,569
Special Education School D 44,351 44,217 42,832
Average across schools 48,999 46,650 44,629
Source: 2017 NT Department of Education data and EY modelling
Some of the challenges raised by case study schools require targeted attention and support of the Department to address as part of a commitment to regular and early intervention points.
Current special needs payment for all students
Currently, a $1,200 flat payment is distributed to all students including ESL students. As advised by the Department, approximately $1,000 of this payment is intended for students with special needs. This totals $28.9 million intended for students with special needs in mainstream classes. This brings the total combined funding for SESP, Special Centres, Autism Units, Special Schools and $1,000 per student to a total funding pool of $62.7 million, as displayed below.
Figure 16. Current distribution of all special needs funding for 2016
Source: 2016 NT Department of Education data and EY modelling
In consultations, case study schools raised that the current amount allocated to mainstream students from SESP funding was not sufficient to address needs in the mainstream environment. For the 5,953 students that are identified in the NT NCCD dataset, there is $28.9m determined from the $1,000 per student loading that can be redistributed. This equates to approximately $4,990 per student. Based on this applied average, additional funding would flow to remote schools to reflect where the current need is as shown in Table 13 below.
1,130 students$5.0m
200 students$9.23m*
13 students$0.29m
393 students$19.2m
All students$28.9m
SESP funding Special Centre Autism Units Special schools Additional funding

Northern Territory Government Department of Education
Government School Funding in the Northern Territory, Australia EY 58
Table 13. Average impact of targeting disability funding to students with identified disability needs
Remote category Average change in funding per school enrolments ($)
Urban -14,500
Special category -8,600
Category 1 -57,800
Category 2 -8,400
Category 3 36,200
Source: 2017 NT Department of Education data and EY modelling
Table 14 below illustrates the top 5 schools based on both gain and loss of funding under the proposed redistribution of current funding.
Table 14. The most impacted schools by targeting disability funding to students with identified disability needs
School Increase from redistribution of special needs funding ($000)
2017 variable funding
($000)
% of funding Proportion of students with disability (excl. targeted programs)
Schools gaining funding from redistribution
School A 335 2,626 13% 42%
School B * 614 4,288 14% 42%
School C 618 2,564 24% 42%
School D * 707 4,629 15% 48%
School E 764 4,168 19% 48%
Schools losing funding from redistribution
School F * -367 3,524 -10% 3%
School G -405 4,253 -9% 5%
School H -417 4,645 -9% 5%
School I -555 9,099 -6% 7%
School J -628 6,026 -10% 1%
Source: 2017 NT Department of Education data and EY modelling
*Allocated funding for a Targeted Program (Special Annexe/Autism Unit) in 2017
As in Table 14 above, funding moves away from schools with proportionally low numbers of students with a diagnosed disability and towards those schools with a high proportion of students with a disability, consistent with the intention of student needs based funding.
Key Finding 12
Funding for special needs is not transparent and difficult to navigate due to the multiple streams of current funding.
Consolidating and streamlining funding would improve transparency, but this relies on consistent data.
Recommendation 12a
Once a complete dataset of students with a disability is established and in future improvements to the SNBFM, consider streamlining the multiple sources of funding for special needs to improve efficiency and transparency of funding for special needs.
Recommendation 12b
Provide adequate training, support and material to enable teachers to assess their cohorts against NCCD standards in order to provide for a complete NCCD database.
Recommendation 12c
Improve the distribution of funding through targeting the $1,000 per student received by all mainstream students to those students with special needs in mainstream schools.

Northern Territory Government Department of Education
Government School Funding in the Northern Territory, Australia EY 59
Considerations
The NCCD dataset has been used as the basis to identify the number of students with a disability. Although it is not yet a complete dataset, the NCCD is a joint initiative of all Australian Government and non-Government educational authorities. In order for NT schools to be accurately reflected in the funding allocations of this joint state and federal government initiative, it is necessary for NT schools to be able to commit to the initiative.
Ideally, each student within this cohort should be assessed in compliance with NCCD guidelines before any redistribution commences to ensure consistency of access between schools. The Department should provide the adequate training, support and materials to allow teachers to assess their cohorts against these standards to provide for a complete NCCD database.
In performing this analysis, a uniform amount of funding was redistributed to the identified students. Due to the unavailability of associated costs for supporting the different levels of need recorded in the NCCD, the results of redistributing based on individual need will alter the current flow of funding.
Under the current model, $1,000 is allocated to every student regardless of their level of need, with an intention of specifically targeting these funds when adequate data is available. This means that the eventual introduction of targeting these funds may have a significant impact on school funding for some schools. While schools have been advised that these funds are currently temporary, any eventual changes due to targeted redistribution on student need will need to be signalled well in advance, in order to provide sufficient time for schools to adjust their budgets accordingly. Alternatively, bridging or transition arrangements may be required to alleviate large budget variances post redistribution.

Northern Territory Government Department of Education
Government School Funding in the Northern Territory, Australia EY 60
Several of the recommendations in this report will have material financial impacts to individual schools if they are implemented. Throughout the findings and analysis section, the impact of the recommendations have been calculated in isolation of each other. The cumulative impact of implementing the recommendations with financial implications on schools will need to be tested.
The findings and impact of recommendations in this report are based on student profiles from the 2015, 2016 and 2017 data provided. Forecasts of enrolments and student profiles were not undertaken.
The Department should undertake its own assessment of the cumulative impact of these recommendations on schools, and ensure that schools are appropriately supported to transition to any revised funding amounts. Schools and other stakeholders should be consulted and debriefed on the changes and how these will affect them. The Department should consider the requirement for transitional arrangements as a result of material funding adjustments and any required support to adjust school operations. As these recommendations could have material financial impacts on schools, the Department should consider taking a staged approach to adopting and implementing recommendations that will lead to material operational impacts.
5. Implementation of recommendations

Northern Territory Government Department of Education
Government School Funding in the Northern Territory, Australia EY 61
Performance measures

Northern Territory Government Department of Education
Government School Funding in the Northern Territory, Australia EY 62
This section outlines the performance measures that will allow the Department to track impact of the recommendations made in this review.
When the GSBFM was introduced, a set of performance measures was not developed to monitor and report on its impact on schools. The below proposed measures have been developed by EY as a result of the recommendations of this review to measure and monitor the impact they have on schools. Table 15. Performance measures
Measure Equity Efficiency Transparency
Budget certainty
Monitor the difference between preliminary and final budget for each school in dollar and percentage terms to enable monitoring of other behaviours that budget volatility may contribute to.
Proposed metrics:
► Number of urban schools with budget variation greater than + or -$100,000
► Number of non-urban (remote category 1, 2 and 3) schools with budget variation greater than + or -$100,000
► Number of urban schools with budget variation greater than + or - 5%
► Number of non-urban schools with budget variation greater than + or 5%
Ongoing to fixed period staff
Monitor the proportion of teachers on ongoing contracts versus fixed period contracts to monitor correlation between budget volatility and the proportion of ongoing staff, and to determine if the small school supplement is sufficient to introduce stability:
Proposed metrics:
► % of ongoing teaching staff in urban schools
► % of ongoing teaching staff in non-urban schools
Cash, not related to grants, in bank at end of year
Monitor surpluses held by schools at the end of each calendar year to determine if the current GSBFM is distributing funds efficiently.
Note - The Department needs to be able to differentiate between GSBFM and grant money at the end of the year if they want to influence associated behaviours about surpluses and cash held
Proposed metrics:
► Size of surplus by school of GSBFM budget in dollar terms
► % of GSBFM budget by school held in surplus at year end
Students in Intensive English Units (IEUs)
Monitor the number of students attending IEUs to ensure that targeted funding is being allocated according to demand.
Proposed metrics:
► Number of students enrolled in each IEU
► Number of students attending each IEU
Transition to NCCD dataset
Monitor the uptake and compliance with NCCD data recording.
Proposed metrics:
► Number of students assessed under NCCD framework
► Number of schools with students assessed under the NCCD framework
► Number of schools reporting NCCD framework
Exceptional Circumstance Claims relating to personal leave
Monitor the number of Exceptional Circumstance applications relating to extended personal leave.
Proposed metrics:
► Number of Exceptional Circumstances claims made relating to personal leave
Record queries from schools to track the most commonly requested support to identify next round of improvements
6. Performance measures

Northern Territory Government Department of Education
Government School Funding in the Northern Territory, Australia EY 63
Appendices

Northern Territory Government Department of Education
Government School Funding in the Northern Territory, Australia EY 64
The section describes our approach to this review.
Purpose of the review
EY was engaged by the Department on 24 April 2017 with specific review objectives, which were to:
► Provide an independent review to determine if the GSBFM allocates resources to government schools in an equitable, transparent and efficient manner.
► Identify potential improvements to the GSBFM within the available funding pool and feasible measures for the efficacy of the model.
Consider key mechanisms of the GSBFM including:
► Cash and centrally held school corporate credit budget components of school funding, i.e. what is spent by the school and the Department centrally.
► Fixed, variable and targeted components, including impacts of targeted programs transitioning to the GSBFM (if relevant).
► SNBFM and profile loadings, i.e. stage of schools, Aboriginal and socio-economic status, remoteness and size of the school, etc.
► Data and measures, including the effective enrolment methodology.
► Assessment of better practice funding models, including models that provide funding to students with disabilities, from other Australian jurisdictions to support the formulation of recommendations that are both relevant and applicable to the Territory context.
EY performed the review between May and July 2017. During this time EY performed a desktop review of relevant information, conducted an assessment of the current model and engaged with school and non-school stakeholders to collect both qualitative and quantitative feedback on the GSBFM. This process built the evidence base to identify gaps and develop practical recommendations to improve the distribution of the existing funding pool, that is targeted at school and student needs.
Figure 17. Review approach
This review assessed if the distribution of school funding was equitable, efficient and transparent and has provided practical recommendations for improvement to these areas.
Collect, understand, define current state
► Conduct desktop review
► Collect data and information
► Conduct assessment of current GSBFM
Engage with stakeholders
► Design questions and survey
► Conduct face to face interviews
► Undertake online survey
► Summarise findings and opportunities
Analysis of gaps and improvements
► Assess inputs, outputs and assumptions
► Identify gaps, pressure points and improvement opportunities
► Evidenced, costed and practical recommendations
Report, review and refine
► Report and present findings and recommendations
Appendix A Our approach

Northern Territory Government Department of Education
Government School Funding in the Northern Territory, Australia EY 65
Review limitations
Whilst undertaking this review, there are a number of broader discussions and reviews in the public and political domain currently underway. Some of these have not been considered in this review due to the timing (they are not yet complete) or falling outside of the scope of our engagement. In any event, findings from these reviews may add additional evidence and context to our findings for consideration by the Department after this review.
Limitations of this review is summarised in Figure 18 below.
Figure 18. Review limitations
Department programs
► Distance education
► Principals and business managers well-being
► Sources and split of the current funding pool, i.e. funding from the Australian Government
Department processes
► Budget management, processes and capability of individual schools
► Funding allocations to non-government schools
► Systems and tools such as MS Excel- based Student Needs Based Funding Model, planning and budget monitoring tools, etc.
Topical matters
► Improving school attendance
► Pedagogy matters
► Student performance
► Assessment of effectiveness of curriculum
► Sufficiency of existing Education funding levels
► Australian Education Amendment Bill 2017 and its impact NT Government funding for Education, SRS and NCCD approaches
Other reviews
► Department’s GSBFM continuous improvement including – business manager review, funding approach for ESL and dual enrolments
► Independent review into regional, rural and remote education is being performed by Prof. John Hasley
► Review to Achieve Educational Excellence in Australian Schools chaired by David Gonski
Data limitations
In undertaking this review, EY has relied on the information provided by the Department, publicly available information, survey results and consultations with stakeholders between May and July 2017. A number of formal and informal data requests were provided over the review’s duration. The findings and recommendations within this report are based on the assumption that the data provided can be relied upon in completing this review. Verbal information used in our assessment and development of recommendations is substantiated with data where possible.
Consultation and data approaches
Consultations with stakeholders were conducted to obtain their views on GSBFM, with particular focus on the equity, efficiency and transparency of the model. This information supported the evidence base for the review’s findings and validated through our data research using 2015, 2016 and some 2017 school data sourced from the Department.
Consultation approach
This review required a range of consultations with stakeholders through interviews with 21 case study schools and other stakeholders that represented key internal and external stakeholders and school principals through an online survey to 153 NT government schools. A list of those consulted is in Appendix C. Our consultation approach is summarised in the
Table 16 below.
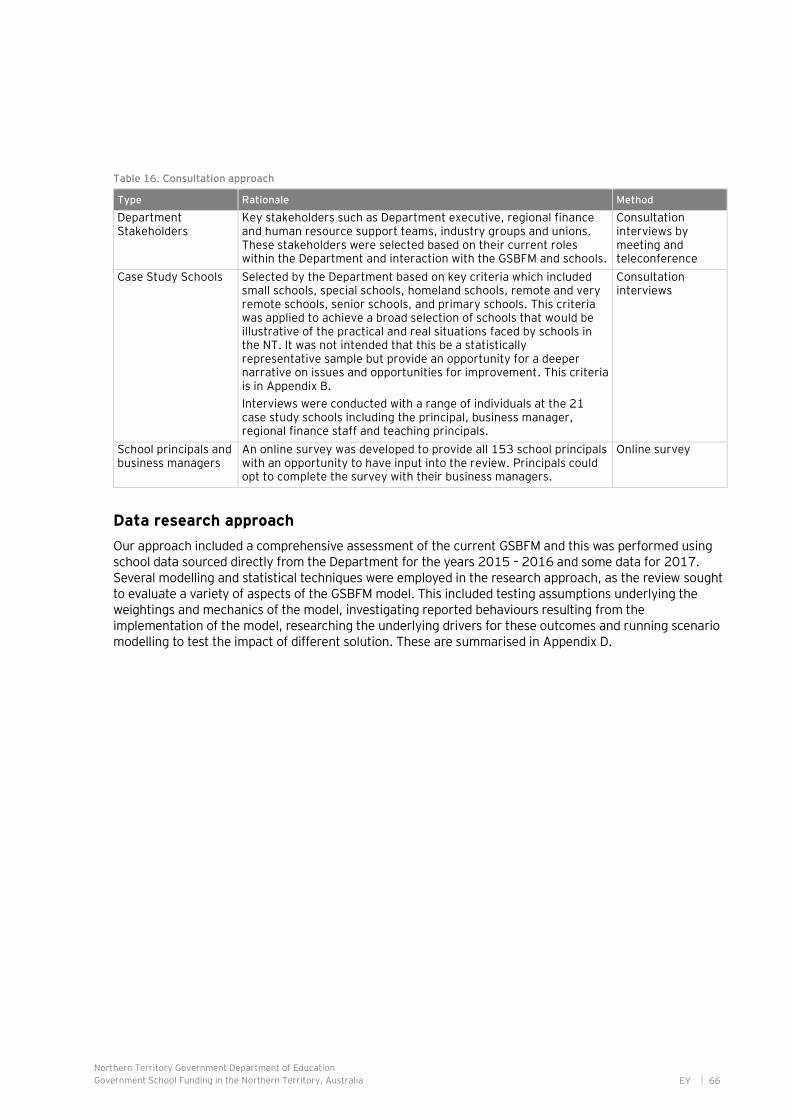
Northern Territory Government Department of Education
Government School Funding in the Northern Territory, Australia EY 66
Table 16. Consultation approach
Type Rationale Method
Department Stakeholders
Key stakeholders such as Department executive, regional finance and human resource support teams, industry groups and unions. These stakeholders were selected based on their current roles within the Department and interaction with the GSBFM and schools.
Consultation interviews by meeting and teleconference
Case Study Schools Selected by the Department based on key criteria which included small schools, special schools, homeland schools, remote and very remote schools, senior schools, and primary schools. This criteria was applied to achieve a broad selection of schools that would be illustrative of the practical and real situations faced by schools in the NT. It was not intended that this be a statistically representative sample but provide an opportunity for a deeper narrative on issues and opportunities for improvement. This criteria is in Appendix B.
Interviews were conducted with a range of individuals at the 21 case study schools including the principal, business manager, regional finance staff and teaching principals.
Consultation interviews
School principals and business managers
An online survey was developed to provide all 153 school principals with an opportunity to have input into the review. Principals could opt to complete the survey with their business managers.
Online survey
Data research approach
Our approach included a comprehensive assessment of the current GSBFM and this was performed using school data sourced directly from the Department for the years 2015 – 2016 and some data for 2017. Several modelling and statistical techniques were employed in the research approach, as the review sought to evaluate a variety of aspects of the GSBFM model. This included testing assumptions underlying the weightings and mechanics of the model, investigating reported behaviours resulting from the implementation of the model, researching the underlying drivers for these outcomes and running scenario modelling to test the impact of different solution. These are summarised in Appendix D.
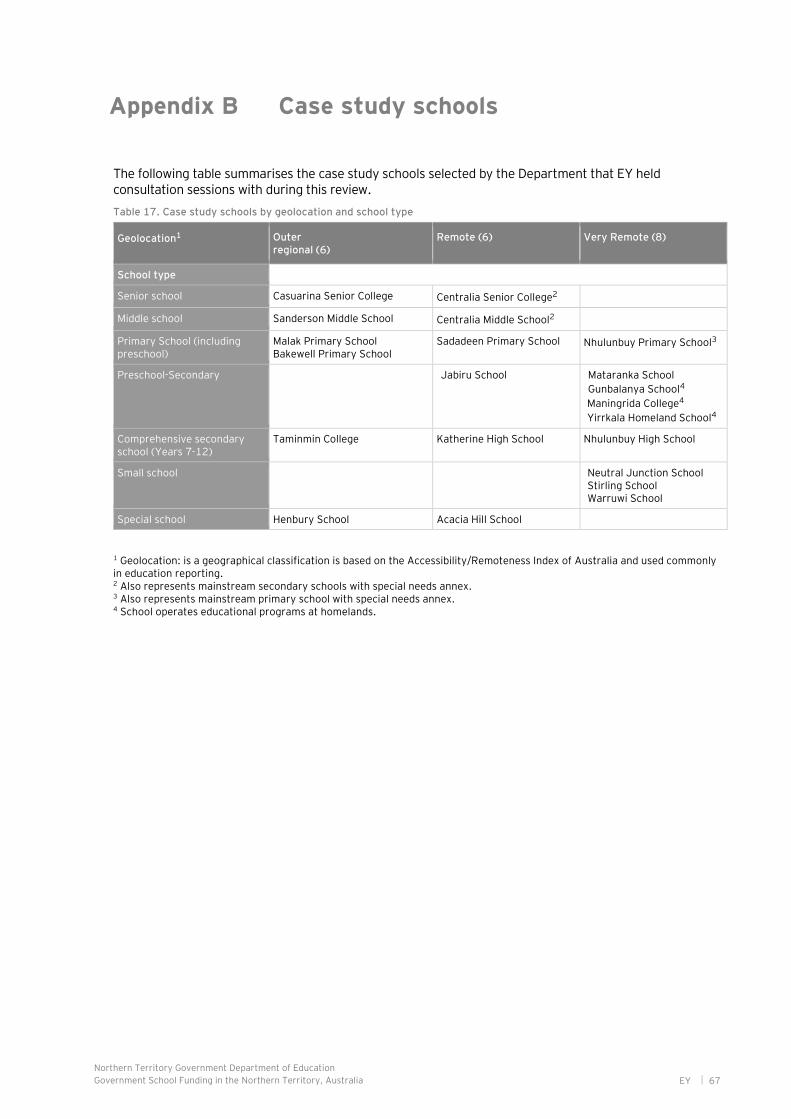
Northern Territory Government Department of Education
Government School Funding in the Northern Territory, Australia EY 67
The following table summarises the case study schools selected by the Department that EY held consultation sessions with during this review.
Table 17. Case study schools by geolocation and school type
Geolocation1 Outer regional (6)
Remote (6) Very Remote (8)
School type
Senior school Casuarina Senior College Centralia Senior College2
Middle school Sanderson Middle School Centralia Middle School2
Primary School (including preschool)
Malak Primary School Bakewell Primary School
Sadadeen Primary School Nhulunbuy Primary School3
Preschool-Secondary Jabiru School Mataranka School
Gunbalanya School4
Maningrida College4
Yirrkala Homeland School4
Comprehensive secondary school (Years 7-12)
Taminmin College Katherine High School Nhulunbuy High School
Small school Neutral Junction School Stirling School Warruwi School
Special school Henbury School Acacia Hill School
1 Geolocation: is a geographical classification is based on the Accessibility/Remoteness Index of Australia and used commonly in education reporting. 2 Also represents mainstream secondary schools with special needs annex. 3 Also represents mainstream primary school with special needs annex. 4 School operates educational programs at homelands.
Appendix B Case study schools
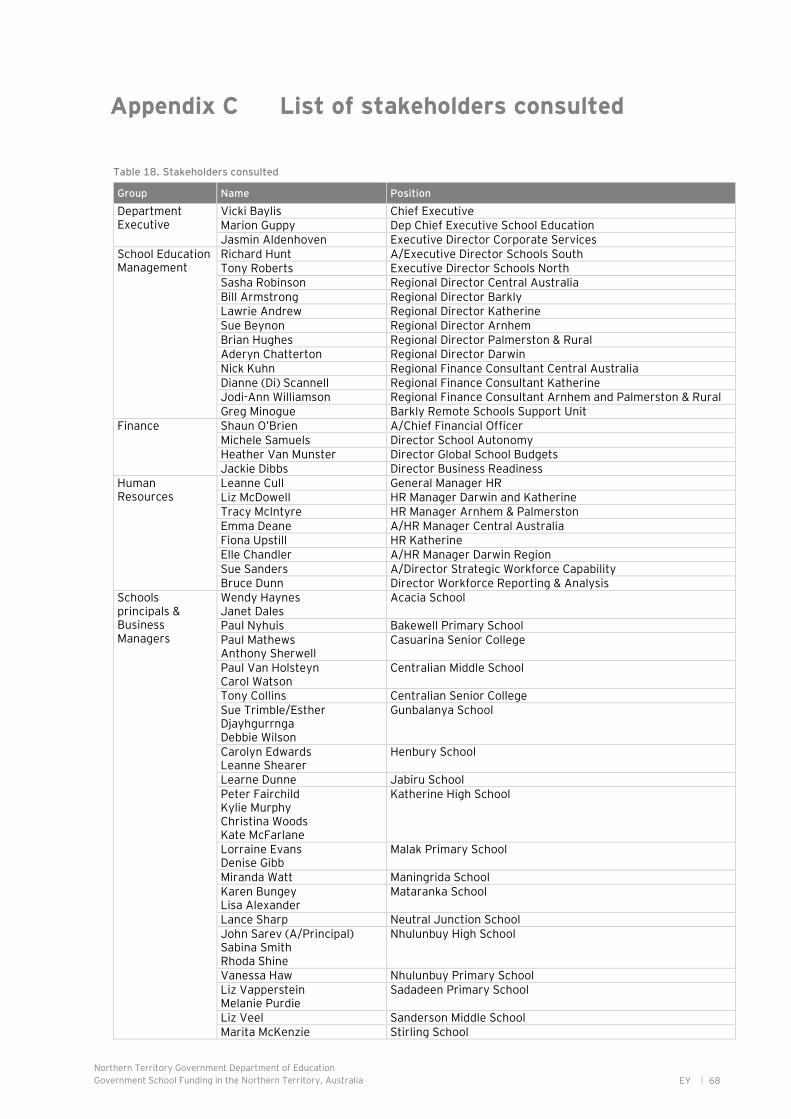
Northern Territory Government Department of Education
Government School Funding in the Northern Territory, Australia EY 68
Table 18. Stakeholders consulted
Group Name Position
Department Executive
Vicki Baylis Chief Executive Marion Guppy Dep Chief Executive School Education Jasmin Aldenhoven Executive Director Corporate Services
School Education Management
Richard Hunt A/Executive Director Schools South Tony Roberts Executive Director Schools North Sasha Robinson Regional Director Central Australia Bill Armstrong Regional Director Barkly Lawrie Andrew Regional Director Katherine Sue Beynon Regional Director Arnhem Brian Hughes Regional Director Palmerston & Rural Aderyn Chatterton Regional Director Darwin Nick Kuhn Regional Finance Consultant Central Australia Dianne (Di) Scannell Regional Finance Consultant Katherine Jodi-Ann Williamson Regional Finance Consultant Arnhem and Palmerston & Rural Greg Minogue Barkly Remote Schools Support Unit
Finance Shaun O’Brien A/Chief Financial Officer Michele Samuels Director School Autonomy Heather Van Munster Director Global School Budgets Jackie Dibbs Director Business Readiness
Human Resources
Leanne Cull General Manager HR Liz McDowell HR Manager Darwin and Katherine Tracy McIntyre HR Manager Arnhem & Palmerston Emma Deane A/HR Manager Central Australia Fiona Upstill HR Katherine Elle Chandler A/HR Manager Darwin Region Sue Sanders A/Director Strategic Workforce Capability Bruce Dunn Director Workforce Reporting & Analysis
Schools principals & Business Managers
Wendy Haynes Janet Dales
Acacia School
Paul Nyhuis Bakewell Primary School Paul Mathews Anthony Sherwell
Casuarina Senior College
Paul Van Holsteyn Carol Watson
Centralian Middle School
Tony Collins Centralian Senior College Sue Trimble/Esther Djayhgurrnga Debbie Wilson
Gunbalanya School
Carolyn Edwards Leanne Shearer
Henbury School
Learne Dunne Jabiru School Peter Fairchild Kylie Murphy Christina Woods Kate McFarlane
Katherine High School
Lorraine Evans Denise Gibb
Malak Primary School
Miranda Watt Maningrida School Karen Bungey Lisa Alexander
Mataranka School
Lance Sharp Neutral Junction School John Sarev (A/Principal) Sabina Smith Rhoda Shine
Nhulunbuy High School
Vanessa Haw Nhulunbuy Primary School Liz Vapperstein Melanie Purdie
Sadadeen Primary School
Liz Veel Sanderson Middle School Marita McKenzie Stirling School
Appendix C List of stakeholders consulted

Northern Territory Government Department of Education
Government School Funding in the Northern Territory, Australia EY 69
Group Name Position
Miriam McDonald Leanne Thackeray
Taminmin College
Daryll Kinane Keira Stewart
Warruwi School
Leon White Haidee Dentith Carrie-Ann Warr
Yirrkala Homeland School
Other stakeholders NT COGSO
Michelle Parker Alice Gawler
Executive Officer Training Officer
NTPA
Sabina Smith Sharon Reeves Brittney Roestenberg
President Member Member
AEU NT
Jarvis Ryan Mick McCarthy
President Vice President
CPSU Kay Densley Regional Secretary
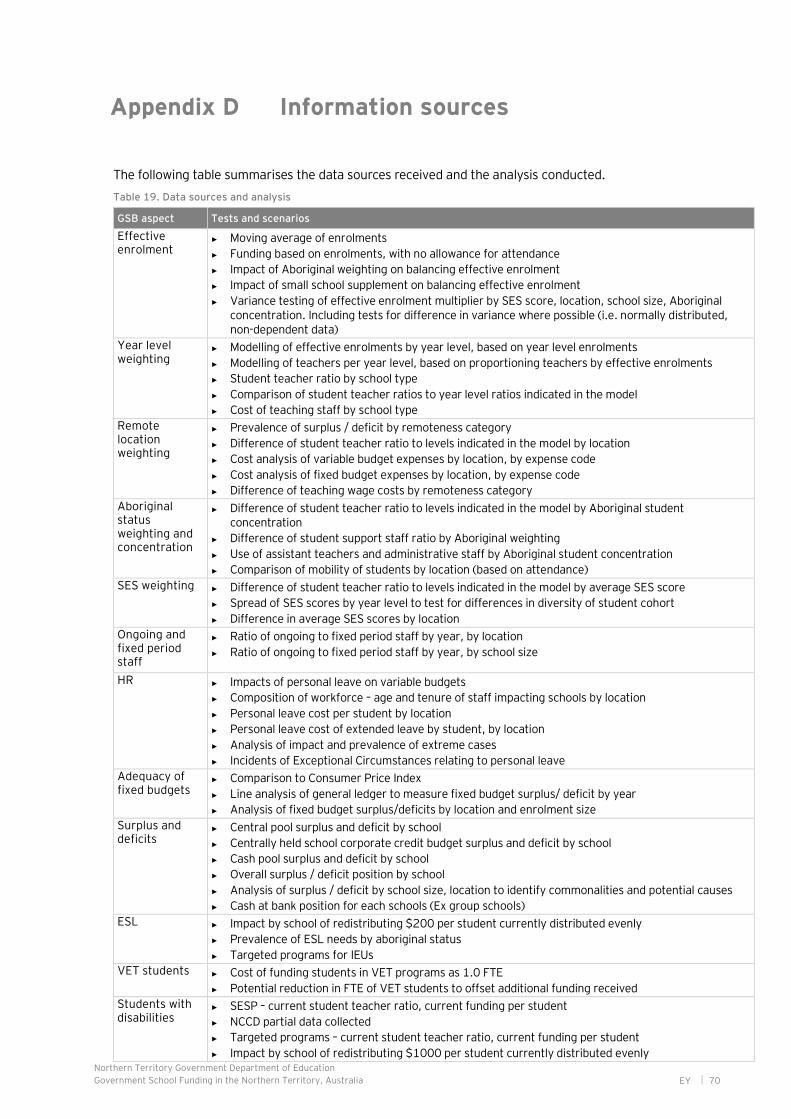
Northern Territory Government Department of Education
Government School Funding in the Northern Territory, Australia EY 70
The following table summarises the data sources received and the analysis conducted.
Table 19. Data sources and analysis
GSB aspect Tests and scenarios
Effective enrolment
► Moving average of enrolments
► Funding based on enrolments, with no allowance for attendance
► Impact of Aboriginal weighting on balancing effective enrolment
► Impact of small school supplement on balancing effective enrolment
► Variance testing of effective enrolment multiplier by SES score, location, school size, Aboriginal concentration. Including tests for difference in variance where possible (i.e. normally distributed, non-dependent data)
Year level weighting
► Modelling of effective enrolments by year level, based on year level enrolments
► Modelling of teachers per year level, based on proportioning teachers by effective enrolments
► Student teacher ratio by school type
► Comparison of student teacher ratios to year level ratios indicated in the model
► Cost of teaching staff by school type
Remote location weighting
► Prevalence of surplus / deficit by remoteness category
► Difference of student teacher ratio to levels indicated in the model by location
► Cost analysis of variable budget expenses by location, by expense code
► Cost analysis of fixed budget expenses by location, by expense code
► Difference of teaching wage costs by remoteness category
Aboriginal status weighting and concentration
► Difference of student teacher ratio to levels indicated in the model by Aboriginal student concentration
► Difference of student support staff ratio by Aboriginal weighting
► Use of assistant teachers and administrative staff by Aboriginal student concentration
► Comparison of mobility of students by location (based on attendance)
SES weighting ► Difference of student teacher ratio to levels indicated in the model by average SES score
► Spread of SES scores by year level to test for differences in diversity of student cohort
► Difference in average SES scores by location
Ongoing and fixed period staff
► Ratio of ongoing to fixed period staff by year, by location
► Ratio of ongoing to fixed period staff by year, by school size
HR ► Impacts of personal leave on variable budgets
► Composition of workforce – age and tenure of staff impacting schools by location
► Personal leave cost per student by location
► Personal leave cost of extended leave by student, by location
► Analysis of impact and prevalence of extreme cases
► Incidents of Exceptional Circumstances relating to personal leave
Adequacy of fixed budgets
► Comparison to Consumer Price Index
► Line analysis of general ledger to measure fixed budget surplus/ deficit by year
► Analysis of fixed budget surplus/deficits by location and enrolment size
Surplus and deficits
► Central pool surplus and deficit by school
► Centrally held school corporate credit budget surplus and deficit by school
► Cash pool surplus and deficit by school
► Overall surplus / deficit position by school
► Analysis of surplus / deficit by school size, location to identify commonalities and potential causes
► Cash at bank position for each schools (Ex group schools)
ESL ► Impact by school of redistributing $200 per student currently distributed evenly
► Prevalence of ESL needs by aboriginal status
► Targeted programs for IEUs
VET students ► Cost of funding students in VET programs as 1.0 FTE
► Potential reduction in FTE of VET students to offset additional funding received
Students with disabilities
► SESP – current student teacher ratio, current funding per student
► NCCD partial data collected
► Targeted programs – current student teacher ratio, current funding per student
► Impact by school of redistributing $1000 per student currently distributed evenly
Appendix D Information sources

Northern Territory Government Department of Education
Government School Funding in the Northern Territory, Australia EY 71
The study involved the conduct of 109 x 10 minute online surveys conducted between 13 and 26 June, 2017.
To achieve the 109 completed surveys, 152 schools were e-mailed an invitation to participate in the survey, resulting in a maximum margin of error of ±5% at the 95% confidence interval.
The response rate for this survey was 72%, which is based on the number of completed surveys divided by the number of schools e-mailed to participate in the survey.
Sample for the survey, which included all government schools in the NT, was provided by the NT Department of Education.
Data has not been weighted as results are highly representative of the total population.
The survey questions are listed below.
EQUITY
Q1. Under the global school budget funding model, the distribution of funding to schools is based on the needs of students through a “weighting” method and effective enrolment methodology.
To help us understand the level of support and assistance that can be offered to schools, how would you describe your understanding of the weighting and budget allocation method?
Please tick one only.
Very familiar 1
Quite familiar 2
Not very familiar 3
Not familiar at all 4
Q2a. To what extent do you agree or disagree that the global school budget distributes available funding equitably to meet student needs?
Please tick one only.
Strongly agree Go to Q3 1
Mostly agree 2
Neither agree or disagree 3
Mostly disagree 4
Strongly disagree 5
ASK IF Q2a=2-5 (NOT STRONGLY AGREE)
Q2b. Which students’ needs do you feel are currently not being met?
Please tick all that apply.
English as Second Language students 1
Low socio-economic status students 2
Aboriginal students 3
Students with a disability 4
Students with learning difficulties (e.g. dyslexia, ADHD, etc. 5
Students with mental health issues 6
Students with behavioural issues 7
Other (please write in box below) 8
Appendix E Survey approach

Northern Territory Government Department of Education
Government School Funding in the Northern Territory, Australia EY 72
ASK IF Q2a=2-5 (NOT STRONGLY AGREE)
Q2c. And which students’ needs that are currently not being met are of priority for the school?
Please tick all that apply.
English as Second Language students 1
Low socio-economic status students 2
Aboriginal students 3
Students with a disability 4
Students with learning difficulties (e.g. dyslexia, ADHD, etc. 5
Students with mental health issues 6
Students with behavioural issues 7
No particular priority groups 8
ASK IF Q2a=2-5 (NOT STRONGLY AGREE)
Q2c. What have been the key challenges in meeting all students’ needs?
Please select all that apply.
RANDOMISE ORDER
Inadequate skills and knowledge of teachers to effectively engage with a diverse range of students 01
No relevant teacher training/professional development offered 02
Cost of teacher training/professional development is too expensive 03
Time demands – teacher workload 04
Time demands – school principal workload 05
Unable to find teachers with the right skills/experience 06
Inability to get support due to school remoteness/access 07
Cost of delivering an appropriate range of programs and pathways for a diverse range of students 08
Insufficient curriculum resources and support 09
Inadequate support to deal with student behavioural issues/poor attendance 10
The variation in funding due to the timing of the budget cycle 11
Other (please write in box below) 12

Northern Territory Government Department of Education
Government School Funding in the Northern Territory, Australia EY 73
EFFICIENCY
Q3. Who is responsible for overseeing the budget and resource allocation processes at the school?
Please tick all that apply.
Principal 1
Assistant Principal 2
School Business Manager – school level 3
School Business Manager – shared corporate level 4
Other 5
Q4. To what extent do you agree or disagree that the global school budget allows your school greater flexibility and autonomy to distribute funding as efficiently as possible?
Please tick one only.
Strongly agree 1
Mostly agree 2
Neither agree or disagree 3
Mostly disagree 4
Strongly disagree 5
Q5. Does your school use student information and identify student support needs in the planning or resource allocation process?
Please tick one only.
Yes, always 1
Yes, to some degree 2
No, not at all 3
Q6a. Since the introduction of the global school budgets, has your school changed the way it allocates resources to better meet your students’ needs?
Please tick one only.
Yes, a lot Go to Q6b 1
Yes, some Go to Q6b 2
No, not at all Go to Q6c 3
ASK IF Q6a=1-2 (YES) Q6b. What were the key improvements made? Please write in your answer.
ASK IF Q6a=3 (NO) Q6c. What has been the main barriers to greater school efficiency? Please write in your answer.

Northern Territory Government Department of Education
Government School Funding in the Northern Territory, Australia EY 74
TRANSPARENCY
Q7. To what extent do you agree or disagree that the global school budget has given your school better visibility of funding and how it is allocated?
Please select one only.
Strongly agree 1
Mostly agree 2
Neither agree or disagree 3
Mostly disagree 4
Strongly disagree 5
Q8a. Has the systems and available reports delivered as part of the global school budgets enabled your school to clearly communicate to the School Council or Board, and the school community about how the funding has been allocated to meet student needs?
Please tick one only.
Yes 1
No 2
Q8b. What have been the key challenges in achieving transparency in reporting on allocation of resources in your school to meet student needs?
Please tick all that apply.
Inadequate skills and knowledge of school staff 1
Not aware of relevant support offered by government 2
Time demands – workload 3
Unable to find support due to school remoteness/access 4
Poor understanding of budget allocations and formulae 5
Insufficient communication between leadership and school community about importance of reporting 6
No formal school process in place 7
Systems and available reports are difficult to understand 8
Other (please write in box below) 9
None, no specific key challenges in achieving transparency in school reporting 10
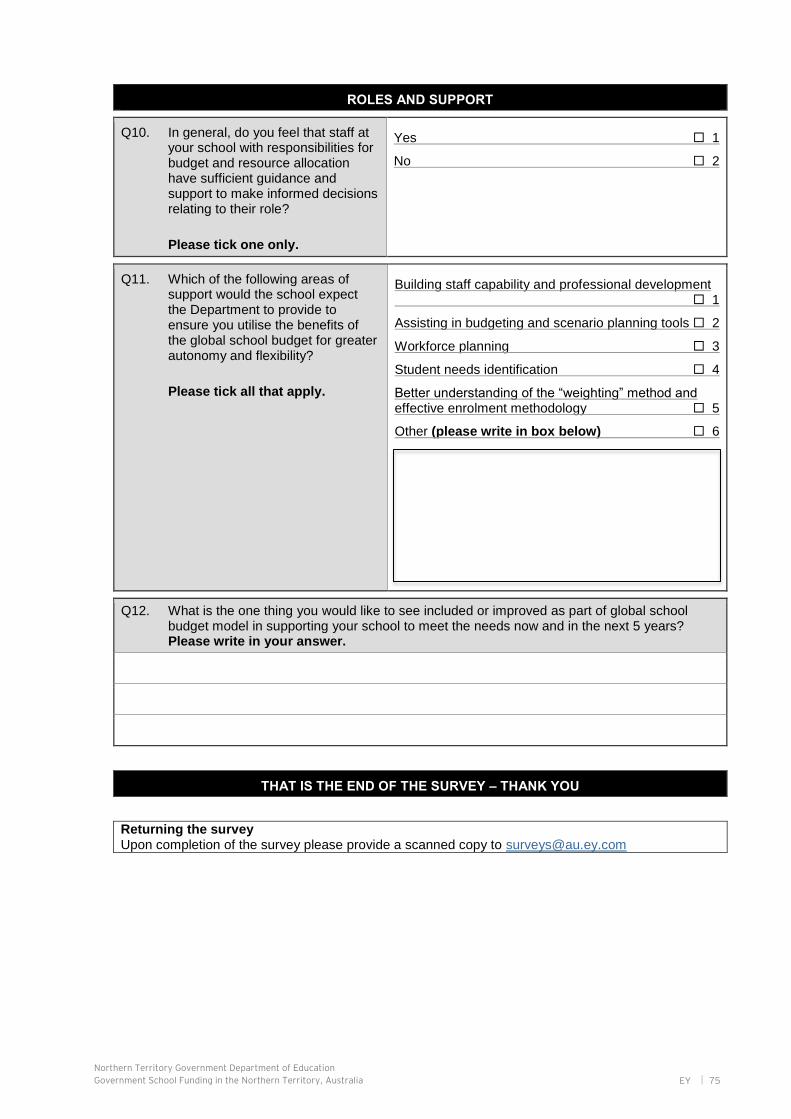
Northern Territory Government Department of Education
Government School Funding in the Northern Territory, Australia EY 75
ROLES AND SUPPORT
Q10. In general, do you feel that staff at your school with responsibilities for budget and resource allocation have sufficient guidance and support to make informed decisions relating to their role?
Please tick one only.
Yes 1
No 2
Q11. Which of the following areas of support would the school expect the Department to provide to ensure you utilise the benefits of the global school budget for greater autonomy and flexibility?
Please tick all that apply.
Building staff capability and professional development 1
Assisting in budgeting and scenario planning tools 2
Workforce planning 3
Student needs identification 4
Better understanding of the “weighting” method and effective enrolment methodology 5
Other (please write in box below) 6
Q12. What is the one thing you would like to see included or improved as part of global school budget model in supporting your school to meet the needs now and in the next 5 years?
Please write in your answer.
THAT IS THE END OF THE SURVEY – THANK YOU
Returning the survey Upon completion of the survey please provide a scanned copy to [email protected]

Northern Territory Government Department of Education
Government School Funding in the Northern Territory, Australia EY 76
EY | Assurance | Tax | Transactions | Advisory About EY EY is a global leader in assurance, tax, transaction and advisory services. The insights and quality services we deliver help build trust and confidence in the capital markets and in economies the world over. We develop outstanding leaders who team to deliver on our promises to all of our stakeholders. In so doing, we play a critical role in building a better working world for our people, for our clients and for our communities. EY refers to the global organisation and may refer to one or more of the member firms of Ernst & Young Global Limited, each of which is a separate legal entity. Ernst & Young Global Limited, a UK company limited by guarantee, does not provide services to clients. For more information about our organisation, please visit ey.com. © 2017 Ernst & Young, Australia. All Rights Reserved. Ernst & Young is a registered trademark. Our report may be relied upon by Northern Territory Government for the purpose of the Review only pursuant to the terms of our notice of acceptance dated 24 April 2017. We disclaim all responsibility to any other party for any loss or liability that the other party may suffer or incur arising from or relating to or in any way connected with the contents of our report, the provision of our report to the other party or the reliance upon our report by the other party. Liability limited by a scheme approved under Professional Standards Legislation.
ey.com