report from the workshop on indicators of final … from the workshop on indicators of final...
TRANSCRIPT
Report from the Workshop on Indicators of Final
Ecosystem Services for Streams
Meeting Date: July 13 to 16, 2009
(EPA/600/R-09/137)
Prepared by
Paul L. Ringold1
James Boyd2
Dixon Landers3
Matthew Weber4
1 [email protected], Research Ecologist, U.S. Environmental Protection Agency, Office of Research and Development, National Health and Environmental Effects Research Laboratory, Western Ecology Division, Corvallis, OR 97333 2 [email protected], Senior Fellow, Resources for the Future, 1616 P St. NW, Washington, DC 20036 3 [email protected], Senior Research Environmental Scientist (Limnology), U.S. Environmental Protection Agency, Office of Research and Development, National Health and Environmental Effects Research Laboratory, Western Ecology Division, Corvallis, OR 97333 4 [email protected], U.S. Environmental Protection Agency, Office of Research and Development, National Risk Management Research Laboratory, Sustainable Technology Division, Cincinnati, OH 45268

Table of Contents
Section Page
Acknowledgments 2
Preface 3
Executive Summary 5
Introduction 6
Workshop Organization 7
Workshop Results 9
Indicators 9
How big is a site? 14
Other Questions 15
Next Steps 17
Literature Cited 20
Tables 22
List of Workshop Participants Attachment 1
Workshop Agenda Attachment 2
Workshop Presentations Attachment 3
Specific Measures of Final Ecosystem Services for Streams Attachment 4
Acknowledgments The quality of this report was greatly improved by comments from Alan Covich (University of Georgia), Michael McDonald (USEPA, Office of Research and Development) and Steven Newbold (USEPA, National Center for Environmental Economics). The information in this document has been funded wholly or in part by the U.S. Environmental Protection Agency under cooperative agreement 83235601 to the Council of State Governments. It has been subjected to review by the National Health and Environmental Effects Research Laboratory and approved for publication. Approval does not signify that the contents reflect the views of the Agency, nor does mention of trade names or commercial products constitute endorsement or recommendation for use.
Workshop on Indicators of Final Ecosystem Services for Streams
Page 2
Report from the Workshop on Indicators of Final Ecosystem Services for Streams
PREFACE
As ecosystems are restored, degraded, protected or managed the social wealth derived from them
correspondingly rises and falls. Public policies that seek to protect or enhance social wealth
derived from ecosystems must recognize measure and manage that wealth. This requires
ecological and social analysis that is integrated in terms of underlying principles and approaches
to measurement.
The desire to quantitatively incorporate the role of ecosystems in sustaining human-well being in
policy deliberations is not new5. It has been embodied in repeated Executive Orders, National
Academy of Sciences Reports, EPA Science Advisory Reports and agency policies and academic
debates for decades. The motivation to build policies on this ecosystem human well-being
linkage has increased, and refocused, in recent years, especially by the development of the
Millennium Ecosystem Assessment (Millennium Ecosystem Assessment 2005). This global
assessment defines a comprehensive taxonomy of four categorizes of “ecosystem services”:
regulating (such as climate regulation), supporting (such as nutrient cycling), provisioning (such
as the production of food and fiber) and cultural (such as spiritual inspiration). These services, in
combination with human systems, cultures and values benefit human well-being. While this
categorization is seen as a useful heuristic tool it does not provide an operational definition
useful for accounting, landscape management or valuation (Fisher et al. 2008). In order to
facilitate the interaction between ecological assessment and economic valuation of changes in 5 Nor without question, e.g. (McCauley 2006)
Workshop on Indicators of Final Ecosystem Services for Streams
Page 3

ecosystem goods and services, Boyd and Banzhaf (2007) advocate the need to clearly distinguish
between “final ecosystem services” or endpoints and other ecosystem services more
appropriately termed “intermediate services”(Daily and Matson 2008). As they argue, an
accounting perspective (a perspective with a set of internally consistent rules avoiding both
double counting and exclusion of substantial benefits) and an emphasis on biophysical outcome
measures that facilitate economic analyses is essential if we wish to aggregate or bundle benefits
so that cumulative changes in ecosystems and the consequent changes in human well-being can
be described over time or projected as a result of a suite of policy options.
To be clear, while “final services” may be the units upon which accounting systems and
valuation are based, an understanding of “intermediate services” and their relationship to final
services is of great importance in understanding, assessing, predicting and managing final
services and the human well-being provided. This relationship between intermediate and final
services is described by “ecological production functions” that relate changes in one set of
biophysical features and conditions to changes in other biophysical features and conditions.(See
slide 3 and the 6 following slides starting on page 20 of Attachment 3). They are essential to the
delivery of policy-relevant ecological benefit analyses.
This workshop explored the concept of “final” ecosystem services – and the corollary concepts
of intermediate services and production functions -- and its relevance to the design of ecological
monitoring systems that can support decision-making. The focus of this exercise was on one
type of ecosystem -- streams. In addition to this specific purpose, the workshop report (under the
heading “Other Questions”) also documents key elements of the broader discussion that needs to
Workshop on Indicators of Final Ecosystem Services for Streams
Page 4
take place between natural sciences and social sciences if we are to succeed in making the
contribution of ecosystems to human well-being a richer part of our decision making.
EXECUTIVE SUMMARY
Policy-relevant management of ecosystem services requires extensive collaboration between
natural and social scientists. This report documents a workshop – featuring such collaboration –
designed to answer the following questions: (1) What biophysical metrics directly facilitate the
integration of biophysical measurement, analysis, and models with analyses of the social benefits
derived from ecosystem goods and services?; (2) are these metrics already available?; (3) if not
available, what steps would be required to make them available?; and (4) to what use will
economic analyses of ecosystem services be put?. The workshop achieved consensus on an
approach designed to identify policy- and economically-relevant ecological metrics and
illustrated it via a collaborative identification of metrics applicable to the ecology of streams.
Translation of these metrics into implementation ready monitoring protocols involves significant
further collaborative work. However, the meeting achieved agreement among social and natural
scientists on a framework and set of practices that can direct a more detailed design and
implementation phases. Importantly, the framework and practices are consistent with both
ecological and economic best practices related to the analysis of ecological systems.
The report identifies categories of indicators that could contribute to estimates of human well-
being and evaluates the current capacity to represent those indicators in a national aquatic
ecosystem monitoring program. It also identifies opportunities to refine the workshop’s results,
Workshop on Indicators of Final Ecosystem Services for Streams
Page 5
transfer the framework and process to other ecosystems and organizations, and demonstrate the
measurement approach in field efforts. As important, the document addresses key underlying
issues that too often thwart effective collaboration and communications between natural and
social scientists.
INTRODUCTION
EPA’s Ecosystem Services Research Program (ESRP) is structured to create:
“A comprehensive theory and practice for quantifying ecosystem services so that
their value and their relationship to human well-being, can be consistently
incorporated into environmental decision making.”(Linthurst and Goodman 2009)
To contribute to this vision, EPA’s MARA (Monitoring and Aquatic Resource Assessment)
program organized a workshop to identify ecological indicators (hereafter just “indicators”)
characterizing the relationships between stream ecosystems and human well-being. The central
objective of the workshop was to focus on indicators of final ecosystem services as developed in
(Boyd and Banzhaf 2007; Boyd 2007), relate them to other important features of natural systems
(including intermediate goods and services and biophysical production functions), and using that
framework identify indicators that could be included in a national stream monitoring program
such as those demonstrated by EMAP efforts6 or implemented in EPA Office of Water
Programs7 in the NARS (National Aquatic Resource Surveys) program. An additional goal was
6 For example (Stoddard et al. 2005b; U.S. Environmental Protection Agency Office of Water 2006) 7 http://www.epa.gov/owow/monitoring/nationalsurveys.html
Workshop on Indicators of Final Ecosystem Services for Streams
Page 6

to determine if indicators selected for use in national scale monitoring could be useful for
monitoring programs covering smaller assessment areas (e.g. regions, watersheds, or even for
short reaches of single streams) or as response variables that could be the focus of stressor-
response (i.e. ecological production function) models.
Indicators of final services are not a substitute for existing ecological metrics. Rather, they are
an important addition and complement to indicators already being monitored. Existing metrics
are an important part of analytical systems designed to model and predict changes in final goods
and services. They also have demonstrated utility in scientific, legal and planning contexts.
Indicators of final services for streams can be used for three purposes. First, they help
communicate the roles of stream ecosystems to decision makers in an effective manner. Second,
they provide the biophysical information necessary for cost effectiveness analysis, i.e. analysis of
ecological change (e.g. miles of fishable streams) in response to policy choices, and third they
facilitate valuation studies, i.e. studies that monetize incremental changes in biophysical features
over time or in response to policy choices. These latter two types of analysis, linking ecological
responses to policy choices rely on production function models. The need for these models,
based on indicators of “intermediate services” to predict “final services”, underscores the need to
continue the collection of information in addition to indicators of final services.
WORKSHOP ORGANIZATION
Workshop on Indicators of Final Ecosystem Services for Streams
Page 7

Workshop planning started in December 2008. The planning committee8 developed an approach
to translate the final ecosystem services concept into a framework that would allow experts to
identify specific measurements. The key element of the approach was the development of a
matrix with users of stream ecosystem services listed as rows, and stream attributes which might
provide final services for categories of users of stream ecosystems listed as columns. This matrix
was similar in form to that provided as Table 1. We provided our initial entries in this matrix by
asking ourselves the question: “What biophysical amounts, features and qualities does each user
want more of or less of? Is this the most concrete, tangible and intuitive feature for the user?9
This was an initial iteration of what we intended to complete during the workshop. The
development of this framework enabled the planning committee to identify the categories of
expertise needed to pursue the workshop goals. Participants were then identified and invited to
the workshop based on their individual and collective capacities to contribute to the goals of the
workshop, and particularly for their knowledge of stream attributes that the organizers believed
would need to be characterized to quantify the role that streams play in human well-being.
Approximately equal number of natural and social scientists participated in the workshop.
Background material and workshop presentations ensured that workshop participants had a
common understanding of workshop goals, concepts and terms. Key structural elements of the
workshop were:
• A definition of final ecosystem goods and services: Biophysical features, quantities, and
qualities that require little further biophysical translation to make clear their relevance to 8 James Boyd, Dixon Landers, Paul Ringold and Matt Weber 9 Examples of this thought exercise were provided in the presentations (See slide 4 and the following 5 slides starting on page 23 of Attachment 3).
Workshop on Indicators of Final Ecosystem Services for Streams
Page 8

human well-being. These goods and services tend to be directly or tangibly used,
experienced or appreciated by households, firms, and communities. While we refer to
“users” of ecosystem goods and services, the concept is meant to include non-
consumptive beneficiaries of natural resources (e.g. Arrow et al. 1993). A final ecosystem
service is also an “ecological endpoint”10. (See slide 2 on page 19 of attachment 3)
• The presentation of an initial matrix, developed by the planning committee as noted
above, with candidate categories of users and candidate attributes of streams. The
purpose of this matrix was to organize expert knowledge linking attributes of streams that
are directly or tangibly used by various groups of people. (See slide 5 on page 25 of
Attachment 3).
The list of participants, prepared presentations and the agenda for the workshop are provided as
attachments 1, 2 and 3. In addition, participants were provided with background material to
review in advance of the workshop (Boyd and Banzhaf 2007; Boyd 2007; Chee 2004; Stoddard
et al. 2005b).
WORKSHOP RESULTS
Indicators
10 Note that this definition is not identical to that used in ecological risk assessments. That definition is: “An end point is a characteristic of an ecological component (e.g., increased mortality in fish) that may be affected by exposure to a stressor ... Two types of end points are distinguished in the framework: Assessment end points are explicit expressions of the actual environmental values that are to be protected; measurement end points are measurable responses to a stressor that are related to the valued characteristics chosen as the assessment end points ….”(Norton et al. 1992)
Workshop on Indicators of Final Ecosystem Services for Streams
Page 9

The agenda (Attachment 2) allowed ample time for discussion of the material presented. After
the initial presentations and discussion the group split into six groups. Each group attempted to
identify indicators of stream attributes that constitute the ecological endpoints for collections of
users. In this process each group was challenged to go through the following thought exercise
(the same one that we had gone through in organizing the workshop): “What biophysical
amounts, features and qualities does each user want more of or less of? Is this the most concrete,
tangible and intuitive feature for the user?11 For example one category of user is a catch and
release angler. The biophysical amounts, features and qualities that this user wants more of have
something to do with fish and with the aesthetics or appeal of the location (e.g. Arlinghaus
2006). Exactly what these measures are and how they would be combined into a measure of
well-being for a catch and release angler is an example of an issue that needs more focused
attention as noted in Step 1 of the NEXT STEPS section. Notably, in this example, watershed
condition, stream habitat, riparian condition, and water quantity timing and quality are all
important ecosystem attributes that can change fish distribution and abundance. Within the
context of the “final services” taxonomy that we adopted these are examples of intermediate
services that are vitally important and would be candidates to be included in production function
models useful for assessing or managing the final service.
We noted that because there are diverse users of ecosystems some ecological features are
intermediate services in one context and final services in another. For example12, for a
11 Examples of this thought exercise were provided in the presentations (See slide 4 and the following 5 slides starting on page 23 of Attachment 3). 12 See slides 1 and 2 on page 21 of Attachment 3.
Workshop on Indicators of Final Ecosystem Services for Streams
Page 10
recreational boater water clarity may be an indicator of a final service. However, for a
commercial crab harvester, water clarity may be a factor in the production of crabs and thus
provide an indicator of an intermediate service for this user.
This initial attempt at completing the matrix was a heuristic effort for workshop participants. By
working through specific examples we intended to determine if participants felt that the general
approach made sense, and if the proposed user groups or stream attributes (See slide 5 on page
24 and the following 3 slides of attachment 3) should be modified. The sentiment was that the
general approach made sense. In addition the group consensus was to add one category of user,
research and education, as well as one stream attribute – genetic diversity. Other categories of
users and stream attributes were clarified or modified.
After this initial heuristic analysis we reviewed the revised matrix and came to consensus upon
the entries that should fall in each cell of the matrix and on the usefulness of the “final services”
concept. The result of this discussion, viewed as a working hypothesis, is provided as Table 1.
The entries in this table are general stream attributes (such as fish); rather than specific
measurements or indicators (e.g. the number of large game fish). In many instances the group
discussion provided detail beyond the identification of the stream attribute that would help to
define the specific indicator of the final ecosystem service or endpoint. These discussions are
provided in Attachment 4. Further refinement of these entries is necessary and is noted in the
Next Steps section.
Workshop on Indicators of Final Ecosystem Services for Streams
Page 11
The extensive discussions that led to Table 1 required us to develop and adhere to a set of
general principles to determine which stream attributes should be measured to quantify final
ecosystem services for each category of users (Table 3). These principles are important not only
because they define how workshop participants translated expert knowledge into a delineation of
indicators of final stream ecosystem services but also because these principles should be readily
transferrable to other ecosystems. These principles were evaluated and revised during the course
of the workshop. The first three principles were adopted directly from the background material.
The fourth -- “Regulations alone could not create a final ecosystem service” --was an important
additional consideration13. Had we chosen to assume that regulations could create final services,
a number of additional stream attributes would have been identified as providing final ecosystem
services. However, since regulations are not biophysical features, quantities or qualities, they
cannot provide a final ecosystem service (cf. slide 3 on page 19 of Attachment 3).
We split into four groups to determine the usefulness of the indicators identified for use in a
national monitoring program (as shown in Table 1) for use in monitoring programs at smaller
scales and in stressor-response models. Each group was asked to identify and work through a
case study of an analysis of an ecological problem at a small scale and consider what indicators
of final ecosystem services they might use. The four case studies were acid rain in the
13 Two examples illustrate the manner in which regulations could be viewed as creating a final service.
1. A point source discharger, e.g. an industrial plant or a municipal waste water treatment plant (subcategories IIe and IIIb in Table 1), is required to discharge its effluent to meet a set of regulatory requirements. These regulatory requirements limit physical or chemical changes in the stream associated with the discharge. Thus, stream chemistry or physical attributes could be construed as providing a final service for this user category.
2. Water users, e.g. a farmer withdrawing irrigation water or a plant manager withdrawing cooling water
(subcategories Ia and IIa in Table 1) can be limited in the timing or amount of their withdrawals if threatened or endangered species might be affected as a result of the withdrawal. Thus, threatened or endangered species could be construed as providing a final service for this user category.
Workshop on Indicators of Final Ecosystem Services for Streams
Page 12

northeastern United States, Ohio River pollutant trading, a hypothetical cold water fishery, and
Root River, WI management. In all four cases, the final ecosystem services indicators identified
for use in national scale monitoring were found to be useful at a smaller scale in both a
monitoring and a modeling context. This provides us with some evidence that the indicators
identified would be useful not only for national scale monitoring, but also for other scales and
purposes.
After preparing Table 1 we evaluated the extent to which those attributes were included in
existing programs that characterize the nation’s waters. The results of this analysis were
presented to workshop participants during a plenary session and were revised in response to
comments from those participants. This comparison is provided as Table 2. Steps are specified to
address the gaps identified, and were developed after the workshop. Some of the options listed in
the section “NEXT STEPS” are designed to address the results of this comparison. Current data
collection is likely to be sufficient for four stream attributes: fish, conductivity, clarity and
streambed characteristics. However, analyses need to be conducted to express these data in terms
that “require little further translation to make clear their relevance to [human] well-being”. For
attributes that have a high degree of temporal or temporal and spatial variability (indicators of
water quantity, temperature, dissolved oxygen and pathogens), monitoring programs are likely to
play a role, but it seems likely that models will need to be developed to provide national
estimates of these attributes. In some cases (plants, wildlife and aesthetics), a wide range of
quantitative collection protocols exist, but are not deployed in national surveys. In parallel with
the definition of clear endpoints, renewed consideration can be given to including these
measurements in national surveys. For the visual component of aesthetics, which may rely on
Workshop on Indicators of Final Ecosystem Services for Streams
Page 13

reformulations of existing topographic and landcover/landuse data, this may be more achievable
than for measures which require additional field efforts.
How big is a site?
Workshop participants considered the issue of the spatial scale of the units of observation
(natural science terminology), or the size of the biophysical commodity directly or tangibly used
(social science terminology). Consideration of this issue is a well developed question in the
natural sciences for which a variety of approaches exist14. The three approaches are
1. Compare the relationship between sampling effort and the value of the metric of interest
as compared to a true value (where the true value is estimated by much more intensive or
extensive sampling)15.
2. Capture a predictable level of natural variability16.
3. Best professional judgment.
14 That approaches to address these questions are well developed does not mean that they are universally applied. 15 The development of the EMAP stream and river protocols are examples of the use of this approach. Hughes et al (2002) and Reynolds et al (2003) conclude that sampling a stream length of 40 channel widths is sufficient to characterize a vertebrate species richness for wadeable streams while a reach length of 100 channel widths is necessary for rivers (streams large enough to be sampled by raft, but excluding “Great Rivers”, e.g. the Colorado, Columbia or Mississippi) 16 Physical and biological attributes of streams vary within stream meanders. If sampling were confined to one part of one meander, the data derived would characterize very local conditions. If another field crew were to go to the same stream reach and sample in a slightly different location their results could be very different. Monitoring designs demonstrated by EMAP and used by NARS address this issue by distributing sampling effort across multiple meanders. Since observations of many streams reveal that stream meanders are typically 7 to 10 times the channel width (Leopold et al. 1964) distributing sampling over 40 channel widths is expected to capture the range of very small scale local variability and provide data that should be repeatable and ecologically meaningful.
Workshop on Indicators of Final Ecosystem Services for Streams
Page 14

In contrast to the recognition of this question---how big is a sample site?–-within the natural
sciences, the brief discussion we had during the workshop led us to conclude that future
discussions of scale, and particularly its two components: extent and grain (Forman and Godron
1986) would be productive in furthering the interaction between natural and social scientists.
Other Questions
In addition to, and in the course of, identifying indicators of final ecosystem services the
scientists at the meeting identified a number of technical issues that served as barriers to
communications across the disciplines.
One significant barrier was the economists’ view that value can only sensibly be calculated in
dollar terms when comparing differences in ecosystem states (or choice scenarios) where both of
the states are comprehensible and sensible. Thus a question such as “What would be the value of
water lost by a policy that reduces water produced from land in Colorado administered by the
National Forest System by 10%?“ is one that can be plausibly addressed. In contrast, a question
such as “What is the value of all streams in the United States?” cannot be addressed in
quantitative economic terms.
Furthermore, participants pointed out that often determining what these final commodities (or
biophysical features, quantities or qualities) are is an important research topic. For example, in a
study of consumer preferences for ecological restoration Johnston et al (2009) found that
indicators must be “grounded in feasible restoration outcomes identified by ecological models,
Workshop on Indicators of Final Ecosystem Services for Streams
Page 15

field studies or expert consultations. Choice scenarios represent each ecological attribute in
relative terms with regard to upper and lower reference conditions (i.e., best and worst possible
in the Pawtuxet) as defined in survey informational materials.” For example people were asked
about their preference for restoration that would provide 80% of fish dependent wildlife native to
the study area (i.e. 28 of 36 species) being common as compared to 60% (22 of 36 species). In
addition questions of similar form were asked about five other ecological attributes of the study
area. Notably, the formulation of this questionnaire was based on theoretical principles and
”developed and tested over 2½ years through a collaborative process involving interactions of
economists and ecologists; meetings with resource managers, natural scientists, and stakeholder
groups; and 12 focus groups with 105 total participants…. In addition to survey development and
testing in focus groups, individual interviews were conducted with both ecological experts and
non-experts.” This is an example of the kind of effort that needs to be undertaken to
communicate ecosystem status and its relationship to human well-being. The need to conduct
research on this issue is not new; and has been thoroughly identified by natural scientists. 17
A second issue that we addressed was the usefulness of a national monitoring program
addressing broad “strategic” questions, for example, is water quality in the nation improving?18,
rather than a narrow set of questions tied to the implementation of a specific policy change based
17E.g. “Results of water-quality monitoring programs need to be translated into formats that enhance effective and informed responses from a wide range of stakeholders” (Covich et al. 2004); “Application of ecological knowledge will re- quire better communication between ecologists and decision-makers in all sectors of society” (Lubchenco et al. 1991); Communication must flow in both directions and become an iterative dialogue, and the scientific community must understand what pieces of information are critical…”(Christensen et al. 1996). These statements aren’t all necessarily interesting in and of themselves, but the authors of these statements include 13 past presidents of the Ecological Society of America and provide evidence of the recognition on the part of natural scientists that the details of communication of natural science information is a priority. 18 (See slide 2 on page 3 of Attachment 3)
Workshop on Indicators of Final Ecosystem Services for Streams
Page 16

on the application of a stressor-response or ecological production function model19. We termed
this second set “tactical” question. After an exchange of views participants acknowledged the
legitimacy of both types of questions and concluded that indicators defined with strategic
questions in mind would also likely be useful for tactical questions and vice versa.
A third issue was the relationship between intermediate ecosystem services and final ecosystem
services. For example lakes, floodplains and wetlands provide flood storage which has the
capacity to modify the magnitude and duration of flooding. Similarly stream habitat supports
biodiversity. Natural scientists believe that such assets (flood storage or stream habitat) have
value. Social scientists note that such assets do have value, but that value is reflected in and
accounted for in measurements of water quantity and timing in the first case, or in measurements
of specific components of biodiversity which are directly and tangibly used by various categories
of users in the second case. Social scientists suggest that it is useful to think of these systems in
the context of ecological production function models (Daily and Matson 2008). The features in
these constructs that are valued are the final services; other ecosystem features, “intermediate
ecosystem services”, produce these final services and have value which is captured in the final
services.
NEXT STEPS
There are numerous opportunities to capitalize on the success of the workshop. A few examples
are:
19 (See slide 6 on page 21 of Attachment 3)
Workshop on Indicators of Final Ecosystem Services for Streams
Page 17

1. There is a great need to add operational specificity to the definitions of endpoints
provided in Table 1 and in Attachment 4. Efforts related to this task would engage natural
and social scientists in conducting studies, possibly including surveys of people, to add
this specificity. In parallel, where we have data, e.g. with vertebrate assemblages, natural
scientists could evaluate the characteristics of alternative candidate metrics under
consideration by social scientists. Jackson and her colleagues (Jackson et al. 2000)
provide a rich list of criteria to support this evaluation.
2. Workshop participants believe that the approach, principles and methods used in this
workshop are potentially highly transferable to other ESRP activities, to other landcover
categories (such as lakes, wetlands, forests, estuaries, etc.), to other research programs
(e.g. climate change), and to research supported by other organizations. EPA should find
opportunities to support this transfer. The October ESRP meeting would be one a good
opportunity to focus on transferring this perspective.
3. The next national lake survey will take place in 201220. The default design for this survey
would be to replicate prior designs which did not include an explicit consideration of
final ecosystem services. To address the absence of such consideration, the process
implemented in this workshop could be repeated along with a lake specific analysis of the
research listed in opportunity 1 above. The goal would be to provide a list of additional
measurements and indicators of final services that could be deployed with the 2012
survey.
20 http://www.epa.gov/owow/monitoring/nationalsurveys.html
Workshop on Indicators of Final Ecosystem Services for Streams
Page 18

4. The Electric Power Research Institute (EPRI), along with numerous public and private
partners, has developed a pilot project “Ohio River Basin Trading Pilot Project”21.
Extending this partnership to include consideration of final ecosystem services could be
most beneficial in transferring these concepts outside of the research realm and outside of
EPA. This is an unusually appealing opportunity because of the rich monitoring datasets
developed by the Ohio EPA, Ohio River Valley Water Sanitation Commission
(ORSANCO22) over the past three decades for this study area, and the spatial overlap
between this pilot project and the ESRP Mid-West place-based study.
21 http://my.epri.com/portal/server.pt?open=512&objID=401&&PageID=226975&mode=2 22 http://www.orsanco.org/
Workshop on Indicators of Final Ecosystem Services for Streams
Page 19

LITERATURE CITED Arlinghaus, R. 2006. On the Apparently Striking Disconnect between Motivation and
Satisfaction in Recreational Fishing: the Case of Catch Orientation of German Anglers. North American Journal of Fisheries Management 26:592-605.
Arrow, K., R. Solow, P. R. Portney, E. E. Leamer, R. Radner, and H. Schuman. 1993. Report of the NOAA Panel on Contingent Valuation.
Boyd, J., and S. Banzhaf. 2007. What Are Ecosystem Services? The Need For Standardized Environmental Accounting Units. Ecological Economics 63:616-626.
Boyd, J. W. 2007. The Endpoint Problem. Resources 165:26-28. Chee, Y. E. 2004. An Ecological Perspective On The Valuation Of Ecosystem Services.
Biological Conservation 120:549-565. Christensen, N. L., A. M. Bartuska, J. H. Brown, S. Carpenter, C. D'Antonio, R. Francis, J. F.
Franklin et al. 1996. The Report of the Ecological Society of America Committee on the Scientific Basis for Ecosystem Management. Ecological Applications 6:665-691.
Covich, A. P., K. C. Ewel, R. O. Hall Jr., P. S. Giller, W. Goedkoop, and D. M. Merritt. 2004. Ecosystem Services Provided By Freshwater Benthos, Pages 44-72 in D. H. Wall, ed. Sustaining Biodiversity and Ecosystem Services in Soils and Sediments. Washington, D.C., Island Press.
Daily, G. C., and P. A. Matson. 2008. Ecosystem Services: From Theory To Implementation. Proceedings of the National Academy of Sciences 105:9455-9456.
Fisher, B., K. Turner, M. Zylstra, R. Brouwer, R. d. Groot, S. Farber, P. Ferraro et al. 2008. Ecosystem Services And Economic Theory: Integration For Policy-Relevant Research. Ecological Applications 18:2050-2067.
Forman, R. T. T., and M. Godron. 1986, Landscape Ecology. New York, John Wiley & Sons. Hughes, R. M., P. R. Kaufmann, A. T. Herlihy, S. S. Intelmann, S. C. Corbett, M. C. Arbogast,
and R. C. Hjort. 2002. Electrofishing Distance Needed to Estimate Fish Species Richness in Raftable Oregon Rivers. North American Journal of Fisheries Management 22:1229-1240.
Jackson, L. E., J. C. Kurtz, and W. S. Fisher. 2000. Evaluation Guidelines for Ecological Indicators. EPA/620/R-99/005., Pages 107. Research Triangle Park, NC, U.S. Environmental Protection Agency, Office of Research and Development.
Johnston, R. J., E. T. Schultz, K. Segerson, and E. Y. Besedin. 2009? Bioindicator-Based Stated Preference Valuation For Aquatic Habitat And Ecosytem Service Restoration in J. Bennett, ed. International Handbook on Non-Marketed Environmental Valuation. Cheltenham, U.K., Edward Elgar.
Kaufmann, P. R. 2006. Physical Habitat Characterization, Pages 107-164 in D. V. Peck, A. T. Herlihy, B. H. Hill, R. M. Hughes, P. R. Kaufmann, D. J. Klemm, J. M. Lazorchak et al., eds. EMAP Surface Waters: Western Pilot Study Field Operations Manual for Wadeable Streams. Washington, D.C., U.S. Environmental Protection Agency, Office of Research and Development.
Leopold, L. B., M. G. Wolman, and J. P. Miller. 1964, Fluvial Processes in Geomorphology: A Series of Books in Geology. San Francisco, W.H. Freeman.
Linthurst, R. A., and I. A. Goodman. 2009. The Ecosystem Services Research Program
Workshop on Indicators of Final Ecosystem Services for Streams
Page 20

Page 21
Lubchenco, J., A. M. Olson, L. B. Brubaker, S. R. Carpenter, M. M. Holland, S. P. Hubbell, S. A. Levin et al. 1991. The Sustainable Biosphere Initiative: An Ecological Research Agenda. Ecology 72:371-412.
McCauley, D. J. 2006. Selling Out On Nature. Nature 443:27-28. Millennium Ecosystem Assessment. 2005, Ecosystems and Human Well-being: Synthesis.
Washington, D.C., World Resources Institute. Norton, S. B., D. J. Rodier, J. H. Gentile, W. H. Van Der Schalie, W. P. Wood, and M. W.
Slimak. 1992. A Framework for Ecological Risk Assessment at the EPA. Environmental Toxicology and Chemistry 11:1663-1672.
Reynolds, L., A. T. Herlihy, P. R. Kaufmann, S. V. Gregory, and R. M. Hughes. 2003. Electrofishing Effort Requirements for Assessing Species Richness and Biotic Integrity in Western Oregon Streams. North American Journal of Fisheries Management 23:450-461.
Stoddard, J. L., D. V. Peck, A. R. Olsen, D. P. Larsen, J. Van Sickle, C. P. Hawkins, R. M. Hughes et al. 2005a. Environmental Montoring and Assessment Program (EMAP): Western Streams and Rivers Statistical Summary, Pages 1762 in United States Environmental Protection Agency -- Office of Research and Development, ed.
Stoddard, J. L., D. V. Peck, S. G. Paulsen, J. Van Sickle, C. P. Hawkins, A. T. Herlihy, R. M. Hughes et al. 2005b. An Ecological Assessment of Western Streams and Rivers. U.S. Environmental Protection Agency Office of Water. 2006. Wadeable Streams Assessment: A Collaborative Survey of the Nation's Streams, Pages 117. Washington, D.C.
Workshop on Indicators of Final Ecosystem Services for Streams

Quantity QualityPhysical Chemical Biological Landscapes
Amount TimingTemperatur
e ConductivityStream
Bed ClarityDissolved Oxygen Chemicals Odor Pathogens
Ecosystem Health / Biotic
Integrity Fish Wildlife Plants
(Human "Experience
Shed") Aesthetics
Genetic Diversity
I Agriculturea) Irrigated Cropsb) Livestock (CAFO)c) Aquacultured) Processinge) Grazing
II Industrya) Cooling Waterb) Processingc) Hydroelectricd) Extracting (Sand and Gravel)e) Discharge ? ?f) Commercial Extractiong) Pharmacuetical Industry
III Municipala) Drinking Water Sourceb) WWTP Sink ? ?c) Property Owners
IV Non-Use a) Existence/Option/Bequest
V Recreational Usea) Viewingb) Swimmingc) Fishingd) Boating
VI Culturala) Spiritualb) Ceremonialc) Subsistence
VII Commercial Transportationa) Goodsb) People
VIIIa) Education and Research
This attribute is posited to be of direct use to specific user categoriesThis attribute is posited to not be of direct use to specific user categories
Working Hypothesis
Human "Use" Categories and Subcategories
Education and Research
Stream Attributes Posited to be a components of Indicators of Final Ecosystem Service to Specific User Categories and Subcategories
Table 1. Stream attributes that provide final ecosystem services for various user categories of stream users. See Attachment 4 for details on the indicators thought to be important for each cell.
Workshop on Indicators of Final Ecosystem Services for Streams
Page 22

Current Status
Measured in Current
Programs to support national
estimates of Steps that could be taken to improve data collection or
reporting in terms of endpointsAmountTiming
Stream Qualities Physical
Temperature Abundant records of stream temperature data exist housed in disparate locations, temporal resolution and extent, formats and collection protocols. 1
Estimates of national extent of temperature tied to endpoints should be provided from models rather than from measurements because of the high temporal variability of this attribute. Efforts to define the fom of the endpoint should also be pursued.
ConductivityStream BedClarity
Chemical
Dissolved Oxygen Abundant records of stream dissolved oxygen exist housed in disparate locations, temporal resolution and extent, formats and collection protocols. 1
Estimates of national extent of dissolved oxygen tied to endpoints should be provided from models rather than from measurements because of the high temporal variability of this attribute. Efforts to define the fom of the endpoint should also be pursued.
Chemicals
Chemical data are included in surveys of national extent. Abundant additional records of stream chemistry exist housed in disparate locations, with different lists of chemicals, temporal resolution and extent, formats and collection protocols.
2The scales and representation of these data that best represent endpoints needs to be evaluated. Efforts to define the fom of the endpoint should also be pursued.
Odor ? 1 ?
Biological
PathogensAbundant records of stream pathogens exist housed in disparate locations, with different lists of chemicals, temporal resolution and extent, formats and collection protocols.
1
Estimates of national extent of pathogens tied to endpoints should be provided from models rather than from measurements because of the high temporal variability of this attribute. Efforts to define the fom of the endpoint should also be pursued.
Ecosystem Health / Biotic Integrity
Diverse measures which may equate to ecosystem health are collected in programs of national extent. 2 The representation of these data or alternative data that best
represent this endpoints needs to be evaluated.
Fish Existing protocols to collect fish consistently are included in programs of national extent. 3 The representation of these data that best represent
endpoints needs to be evaluated.
Wildlife
Plants
Landscapes
(Human "Experience Shed") Aesthetics
Other Genetic Diversity Feasible measures of this attribute don't exist 1 This is a research topic.
Stream AttributeAn extensive USGS hydrographic system provides consistent easily available data. These data do not represent the stream network as a whole
Water Quantity
Indicators of these measures are included in programs of national extent. The scales and representation of these data that best represent endpoints needs to be evaluated.
A range of protocols of these streams attributes exist but are not included in current programs of national extent
The clear definition of the endpoint needs to be developed and existing protocols which could support the estimation of these endpoints would need to be evaluated adapted and deployed as appropriate
2
3
1
Existing network provides a foundation for models that could describe water quantity in terms of endpoints.
Table 2. Steam attributes required to support national estimates of endpoints; their current status in national monitoring programs and steps that could be taken to improve our capacity to estimate these endpoints at the national scale. Status of 1 implies great discrepancy between current capacity and needs; 2 implies moderate discrepancy, and 3 implies slight discrepancy.
Workshop on Indicators of Final Ecosystem Services for Streams
Page 23

Table 3. Prinicples used in identifying indicators of final ecosystem services provided by streams.
1. Strictly biophysical features, quantities or qualities that require little further translation to make clear their relevance to human well-being
2. Comprehensive identification of these entities requires the identification of the full set of users (and non-users) who directly benefit from stream ecosystems.
3. While the list must be exhaustive and non-duplicative it should also provide for parsimony by keeping a focus on substantive or material services.
4. Regulations alone do not create a final ecosystem service.

Attachment 1
List of Workshop Participants James Boyd Resources for the Future [email protected] 202‐321‐6470Robert Brooks Pennsylvania State University [email protected] 814‐863‐1596David Brookshire University of New Mexico [email protected] 505‐277‐1964Thomas Brown US Forest Service [email protected] 970‐295‐5968Deron Carlisle USGS ‐‐ NAQWA [email protected] 703‐648‐6890John Duffield University of Montana [email protected] 406‐243‐5569Jessica Fox Electric Power Research Institute [email protected] 650‐855‐2138Julie Hewitt US EPA OW OST EAD [email protected] 202‐566‐1031Brian Hill US EPA ORD NHEERL MED [email protected] 218‐529‐5224Bob Hughes Oregon State University [email protected] 541‐754‐4516David Hulse Dept. of Landscape Architecture [email protected] 541‐346‐3672Robert Johnston George Perkins Marsh Institute [email protected] 508‐751‐4619Julie Kinzelman City of Racine [email protected] 262‐636‐9501Alan Krupnick Resources for the Future [email protected] 202‐328‐5107Melinda Laituri Colorado State University [email protected] 970‐491‐0292Dixon Landers US EPA ORD NHEERL WED [email protected] 541‐754‐4427Timothy Lewis Environmental Laboratory, USACE [email protected] 601‐634‐2141Ryan McShane Colorado State University [email protected] 970‐310‐1725Jay Messer US EPA ORD NCEA [email protected] 919‐843‐6804 Wayne Munns US EPA ORD NHEERL AED [email protected] 401‐782‐3017LeRoy Poff Colorado State University [email protected] 970‐491‐2079Brenda Rashleigh US EPA ORD NERL ERD [email protected] 706‐355‐8148 Anne Rea US EPA OAR OAQPS HEID [email protected] 919‐541‐0053Paul Ringold US EPA ORD NHEERL WED [email protected] 541‐754‐4565Lisa Wainger University of Maryland [email protected] 410‐326‐7401Matt Weber US EPA ORD NRMRL [email protected] 541‐754‐4315
Workshop on Indicators of Final Ecosystem Services for Streams

Attachment 2
Agenda Workshop on Indicators of Final Ecosystem Services for Streams
Denver Renaissance Hotel 3801 Quebec Street
Denver, Colorado 80207 USA Phone: 1-303-399-7500
All meeting rooms are on the Atrium Level
Monday July 13 4:30 PM to 6 PM – Informal Reception and Registration [Durango Room] Tuesday July 14 8:00 AM Continental Breakfast and Registration 8:30 AM Welcome and Introductions: Weber [Vail Room] CSG Role and Procedures – Parks Interests in Stream Monitoring and Ecosystem Services – Each Participant 9:00 AM What’s the problem we’re trying to solve?
• Why Are We Here? -- Natural Science Perspective: Ringold (15 minutes) • Why Are We Here? The Social Science Version: Boyd (15 minutes)
9:30 to 10:00 AM Questions and Discussion 10:00 to 10:15 AM Break 10:15 AM Economics 101: Boyd (20 minutes) Surface Water Monitoring: Landers (20 minutes) Ecological Measures for Social Analysis: Boyd (20 minutes) Questions and Discussion 12:30 to 1:30 PM Lunch [Buffet Lunch Provided] 1:30 to 3:45 PM Plenary: Develop a Working Hypothesis
How Can We Use the Final Services Concept in Monitoring Design? (20 minutes) Discussion
• Does this approach make sense? • Should some stream attributes be added or deleted? • Should user categories be added or deleted?
3:45 to 4:00 PM Break 4:00 to 5:00 PM Small Group Discussions – What are the issues raised? [Snowmass, Breckenridge, Durango and Winter Park Rooms available]
Workshop on Indicators of Final Ecosystem Services for Streams

Attachment 2 5:00 to 6:00 PM Plenary – Identify and Address Issues Raised [Vail Room] Adopt a working hypothesis 6:00 PM Adjourn for Dinner [On Your Own] Wednesday, July 15 8:00 AM Continental Breakfast 8:30 AM Plenary [Vail Room] 8:30 to 9:00 AM Introduction and Tasking -- Weber Task 3 or 4 break out groups [Snowmass, Breckenridge, Durango and Winter Park Rooms available] Each breakout group will address the following questions and identify the range of opinions in answering them:
1. What are user requirements for the character of information needed including it’s temporal and spatial characteristics?
2. What are FES indicators for each user category as identified in the matrix? • Existing/Currently available, Near Term, Long-Term
3. What does an FES at a point in time and space (and flow?) represent for other times and places?
4. What is the current/probable future ability to predict FES based on the availability of extensive data (e.g. landcover, roads, census, NHD, topography….)?
Noon Buffet Lunch [Provided] 1:00 – 2:00 PM Progress Reports from breakout groups, discussion, retasking, and as necessary, restructuring.[Vail Room] 2:00 to 4:00 PM Reconvene breakout groups [Snowmass, Breckenridge, Durango and Winter Park Rooms available] 4:00 to 5:30 PM Report from breakout groups [Vail Room] Identification of Final Service Indicators …….. 5:30 PM Adjourn for Dinner [On Your Own] Thursday, July 16 8:00 AM Continental Breakfast 8:30 – 9:30 AM Boyd/Landers/Ringold reaction to breakout reports [Vail Room]
Workshop on Indicators of Final Ecosystem Services for Streams

Attachment 2
9:30 – 10:30 AM New breakout groups to address key issues [Snowmass, Breckenridge, Durango and Winter Park Rooms available] For example: 1) What practical challenges would be incurred in monitoring this set of indicators in a national program? 2) What should we do next? 3) .. 10:30 – 10:45 AM Break 10:45 to 11:30 AM Breakout group reports [Vail Room] Refined List of Final Service Indicators 11:30 to Noon Wrap Up Discussion [Vail Room] Noon Meeting Concludes for most participants
Workshop on Indicators of Final Ecosystem Services for Streams

1
Why Are We Here?
Natural Science PerspectiveSponsors Perspective
July, 2009Paul L. Ringold
US EPA, ORD, NHEERLWestern Ecology Division, Corvallis, OR 2
Why are we here?
We want to tie human well-being to stream ecosystems.
3
Why are we here?
We want to tie human well-being to stream ecosystems.
4
What’s our goal
Define a list of measurements that could be used in a national monitoring program that will support analysis of human well-being.
5
Or
“Tell me what to measure when I go to a site and what a site is.”
Tony Olsen
6
And
“Tell me what to measure when I go to a site and what a site is.”
Tony Olsen
“The best is the enemy of the good”
Voltaire
1
65
43
2
Slide Number
Workshop on Indicators of Final Ecosystem Services for Streams
Attachment 3 -- Page 1

7
Parsimony is a challenge
Summerhayes and Elton 19238
Another Challenge
Stream Ecology
Social SciencesHuman Well-Being
Natural Sciences
9
Different Vocabularies, Cultures, Norms
Stream Ecology
Social SciencesHuman Well-Being
Natural Sciences 10
1 million km of streams
11
Ways we use streams
12
Ways we stress streams
1
65
43
2
Slide Number
Workshop on Indicators of Final Ecosystem Services for Streams
Attachment 3 -- Page 2

13
We spend a lot on water pollution control
14
Can we answer simple questions?
1. What’s the current status of streams?2. Are streams improving?3. Which places are in most need of
attention?4. Which stressors are in most need of
attention?5. What if…?6. What are the connections between
human well-being and streams?
15
Existing Monitoring Programs Fall Short
• 1981 -- “..reports .. are not reliable” GAO
• 1984 -- “The greatest shortcoming… lack of a detailed approach that specifies why monitoring is done and what will be done with the results. Perry et al
• 1998 – “…reports do not represent an accurate picture of status for all waters and cannot be used to describe trends in the number of impaired water bodies.” Paulsen et al
• 2000 -- “Key EPA and State Decisions Limited by Inconsistent and Incomplete Data” GAO
• 2002 -- “A lack of information about actual environmental conditions … has been a major obstacle to improving the effectiveness of state water quality programs” NAPA
16
Wadeable Streams AssessmentMacroinvertebrate IBI Results
17
The Clean Water Act Motivates the Reporting Goal
• Sec. 101. (a) “The objective of this Act is to restore and maintain the chemical, physical, and biological integrity of the Nation’s waters.”
• Sec. 305. (b) Annual state reports on the extent to which waters “provide for the protection and propagation of a balanced population of shellfish, fish, and wildlife, and allow recreational activities in and on the water”
18
Why Biological Indicators: Ecological Understanding
• Long track record– 1894 Illinois State Laboratory of Natural
History • “..objects of our Station…to prevent progressive
pollution of our streams and lakes” (from Davis 1995)
• Integrates stressors over longer times and larger areas
• Diagnostic
1
65
43
2
Slide Number
Workshop on Indicators of Final Ecosystem Services for Streams
Attachment 3 -- Page 3

19
But
Is that all we would measure to describe the roles of streams in human well-being?
20
GoalA list of indicators that could be used:1. in a national stream monitoring programAlso2. in developing local and regional stream
monitoring programs3. as the focus of stressor-response models4. ….and provide the foundation for social
scientists to report on the role streams play in human well-being.
1
65
43
2
Slide Number
Workshop on Indicators of Final Ecosystem Services for Streams
Attachment 3 -- Page 4

1
Why Are We Here?The Social Science Version
Jim Boyd
2
What We Want
• To measure changes in human wealth & wellbeing
• Arising from changes in nature
3
What We Want
• To measure changes in human wealth & wellbeing
• Arising from changes in nature
What We Believe
• Nature is a source of wealth
• Wealth should be managed and protected
• Choices must be made, tradeoffs faced
• Information and analysis helps
4
Core Questions
• What do people want from nature?
• What is the biophysical measure of what they want?
• Can we measure that in practice?
5
A Day In the Life
• Decision‐makers, policy‐makers ask us…– What is most important?
– Which should we choose?
– What is the monetary benefit of a new regulation?
– What is the benefit of this wetland restoration program?
6
A Day In the Life
• Decision‐makers, policy‐makers ask us…– What is most important?
– Which should we choose?
– What is the monetary benefit of a new regulation?
– What is the benefit of this wetland restoration program?
• We have ways to answer these questions– But all must be built on ecological foundation
– What is nature’s state and what is changing?1
65
43
2
Slide Number
Workshop on Indicators of Final Ecosystem Services for Streams
Attachment 3 -- Page 5

7
Problem
• We have a hard time connecting what we do…
• To what ecology – Measures
– Thinks is important
8
Problem
• We have a hard time connecting what we do…
• To what ecology – Measures
– Thinks is important
• It’s not that we disagree or think we know better– We need to connect the two realms
9
Frustrations Being Addressed
• Problems with “inter‐disciplinary” work– Can we make progress on the linkages?
• Inconsistent biophysical measures (even within our own disciplines)– Can we converge on and articulate principles to guide choice of measures?
10
(Again) Core Questions
• What do people want from nature?
• What is the biophysical measure of what they want?
• Can we measure that in practice?
• Can we relate natural science measures to the measure we want?
11
Audiences & Clients?
• Politicians, public administrators, planners (people who make policy, spend public money)
• Lawyers and judges• Businesses that rely on natural resources• Conservationists• Resource managers• Environmental accountants• Anyone drawn to “ecosystem services”• The good government crowd
12
Goals of Meeting
• What do I measure at a site, and what is a site?– Conceptual underpinnings to link natural and social sciences
– Hypotheses and examples of what to measure
• Want reactions to all of the above
1
65
43
2
Slide Number
Workshop on Indicators of Final Ecosystem Services for Streams
Attachment 3 -- Page 6

13
Post‐Meeting Proof of Concept
• Collaborations and coordination
• Convergence on language, principles, and measures
• Transfer of insights to other resource types?
• Pilots and practical deployment
14
Balances to Be Struck
• Complexity of problem vs.
• Need for practical guidance
• The principles and measures we will advance to trigger discussion
• Where we wind up
1
65
43
2
Slide Number
Workshop on Indicators of Final Ecosystem Services for Streams
Attachment 3 -- Page 7

1
Economics 101
Jim Boyd
2
What do We Do?
• Assume we had the biophysical information we wanted
• What would we do with it?– Relate it to human welfare
– Weight things
– Compare the costs of protection/restoration to the benefits
3
What is Human Welfare?
• Synonyms– Wellbeing
– Utility
– Happiness
• Not just from market consumption– Beauty
– Biophilia
– Cultural connections to place
4
How to Detect Changes in Welfare?
• Anthropology
• Law
• Marketing
• Psychology
• Physiology
• Economics– Empirical behavior
– Choice experiments
5
Economic Detection
• Look for preferences, rankings, choices
• Detect “willingness to pay”– A particular kind of choice
– An environmental good versus an amount of money
– Or versus anything whose value is known
6
Willingness to Pay
• Consider a choice
• If you are “willing to pay” X for choice A and Y for choice B
• And if X > Y
• We infer that you prefer A to B
1
65
43
2
Slide Number
Workshop on Indicators of Final Ecosystem Services for Streams
Attachment 3 -- Page 8

7
Willingness to Pay
• Consider a choice
• If you are “willing to pay” X for choice A and Y for choice B
• And if X > Y
• We infer that you prefer A to B
How do we detect willingness to pay?In a minute, but first… 8
The Goal to an Economist
• Maximize overall social welfare
• Caricature: economists care about maximizing profits– Focus on making companies richer
• Wrong– We want to maximize social profits
– This includes the “profit” from species abundance, beauty, clean air and water, etc.
9
Alternative Goals?
• What is fairest?
• What is cheapest or easiest?
• What does the majority want?
• What do scientists think is most important?
• What is legal?
• What is healthiest for the environment?
• What is most morally acceptable?
10
Why Do Economists Like $’s
• Need a uniform measure to compare weights
• Many things already denominated in dollars, thus intuitive as a scale
• Costs come in dollars
• Seashells, 100‐point scale, thermometer readings could also work
11
The Challenge
• Figuring out willingness to pay for nonmarket goods and services
• Easier for market goods– Quantities of goods and services, and prices paid are observable
12
What Is Valuable?
• We seek to detect, reveal, uncover social values,
• We do not impose those values
• Ways of knowing: Psychology, marketing, anthropologists (other social scientists)
1
65
43
2
Slide Number
Workshop on Indicators of Final Ecosystem Services for Streams
Attachment 3 -- Page 9

13
Economic Valuation In Practice
• Methods– Revealed preference
– Stated preference
• Key issues
• Interpretation
14
Revealed Preference
• Our behavior can “reveal” willingness to pay
• Hedonic– Higher home prices near parks, beaches, rivers, lakes, open space
• Travel cost– Amount we “pay” to enjoy resources (entrance fees, permits, foregone wages, travel expenses)
15 16
Caveat: a very incomplete measure of a wetland’s value (we know that)
17
Travel Cost Detection
• If people are willing to pay $700 to travel and get access to a beach…
• A lower bound on the value of the beach experience– Much of that value is due to the natural resources and qualities of the beach
18
The Benefit Pie
• What is the value of a stream reach?– A collection of benefits
– Enjoyed by different groups users
• Need a suite of detection methods– Each is its own sub‐discipline
1
65
43
2
Slide Number
Workshop on Indicators of Final Ecosystem Services for Streams
Attachment 3 -- Page 10

19
The (Partial) Benefit Pie
20
21 22
Stated Preference
• Present people with a set of hypothetical choices involving at least one good whose value is known
• The choice of environmental goods relative to that good is informative
• Advantage: you can cover a wider spectrum of benefits
23 24
Other Methods
• Citizen juries
• Expert elicitation
• Voting behavior
• Mediated modeling
• Quantitative, but non‐monetary, indicators of benefits
1
65
43
2
Slide Number
Workshop on Indicators of Final Ecosystem Services for Streams
Attachment 3 -- Page 11

25
Example
Wetland A Wetland B
Hydrologic connection to aquifer used as drinking water by
100 households 10 households
Open space viewed by 10,000 commuters 2,000 commuters
Flood buffer in floodplain with
$25M worth of damageable structures
$2M worth
26
All Social Methods
• Benefit from ecological measures that are…– Directly relevant and interpretable by expert nonusers and policymakers
27
Where Does Our Data Come From?
In addition to natural science data
• Market data– Home values
• Behavior surveys– Recreational surveys
• Census data– Demography, incomes, property
• Lab‐like experiments– Preference surveys
28
Scientific Paternalism
• Should we believe what natural scientists tell us is most important?– Yes: you are the ones who can tell us what is happening to nature
• The experts
– No: you have no special ability to know what is right for society
• Just another constituency
29
What If People Are Ignorant?
• A big topic in economics, we’re aware of the problem
• Public ignorance as excuse for not looking at public preferences is a slippery slope
• If we describe nature in ways people can’t understand, how can people learn?
• Faith in social ability to correct mistakes, overcome ignorance
1
65
43
2
Slide Number
Workshop on Indicators of Final Ecosystem Services for Streams
Attachment 3 -- Page 12
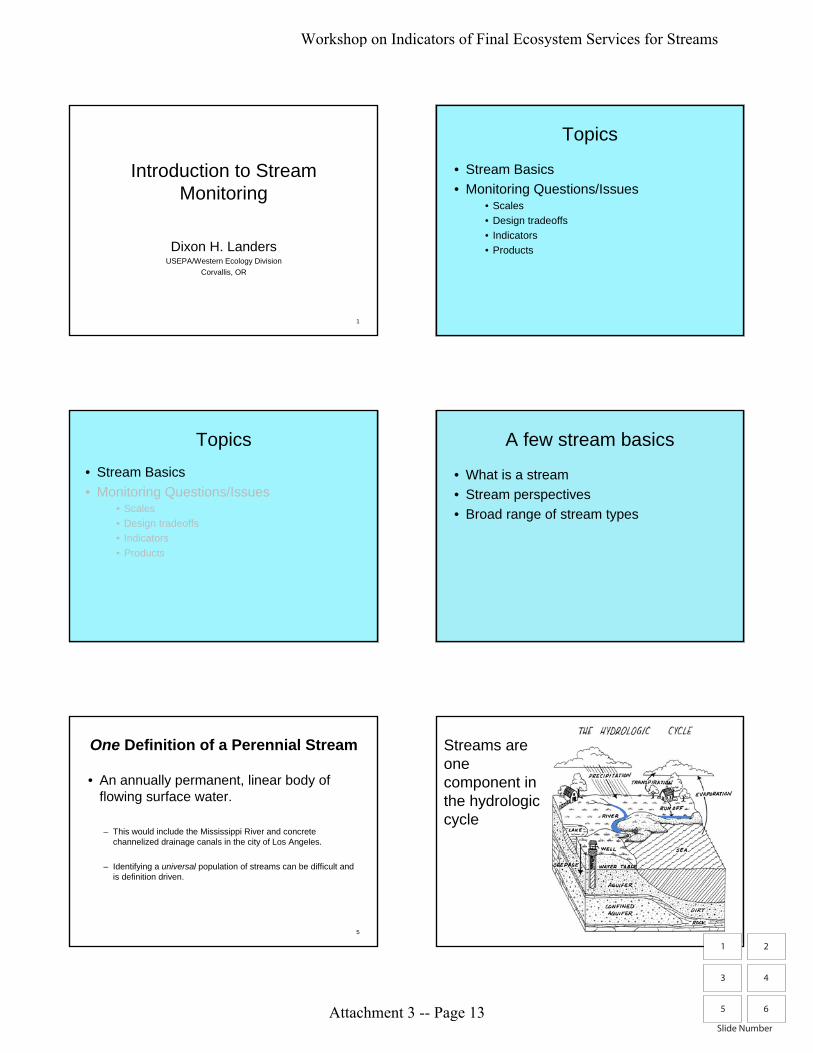
1
Introduction to Stream Monitoring
Dixon H. LandersUSEPA/Western Ecology Division
Corvallis, OR
2
Topics
• Stream Basics• Monitoring Questions/Issues
• Scales• Design tradeoffs• Indicators• Products
3
Topics• Stream Basics• Monitoring Questions/Issues
• Scales• Design tradeoffs• Indicators• Products
4
A few stream basics
• What is a stream• Stream perspectives• Broad range of stream types
5
One Definition of a Perennial Stream
• An annually permanent, linear body of flowing surface water.
– This would include the Mississippi River and concrete channelized drainage canals in the city of Los Angeles.
– Identifying a universal population of streams can be difficult and is definition driven.
6
Streams are one component in the hydrologic cycle
1
65
43
2
Slide Number
Workshop on Indicators of Final Ecosystem Services for Streams
Attachment 3 -- Page 13

7
Streams don’t hold much water
8
Orders of Magnitude Less Volume than other inland components
9
But, if we change the indicator…
10
The Great Variability of Streams in Space and Time Has IMPORTANT
Implications for
• Field Protocols• Assessment Methods• What do measurements at one time or
place mean for other times and places?
11
Stream Network
12
Seventy YearsJohn Day River, OR
1
65
43
2
Slide Number
Workshop on Indicators of Final Ecosystem Services for Streams
Attachment 3 -- Page 14

13
Most Streams are Small
14
A few streams drain large areas
15
Topics
• Stream Basics• Monitoring Questions/Issues
• Scales• Design tradeoffs• Indicators• Products
16
Monitoring Program Tradeoffs
From Hughes and Peck 2008
17
Recent emphasis in monitoring programs
18
Other Current ProgramsEMAP and Other CurrentMonitoring Programs
1
65
43
2
Slide Number
Workshop on Indicators of Final Ecosystem Services for Streams
Attachment 3 -- Page 15

19
Goals – EMAP West2000 – 2004 12 Western States
• Demonstration for streams in a large region1. assessment of ecological condition 2. associations with stressors
• Components1. Reporting goals2. Sample design and tradeoffs
• Site selection• Field methods
3. Assessment methods
20
628,000 Stream MilesAll wadeable and non-wadeable streams
EPA Western EMAPSample Sites
21
Attributes of Indicators
• Conceptual Relevance• Feasible Implementation• Meaningful Signal• Understandable
– Scientists– Managers– Public
22
Terminology and Approach
Index
Metrics
Data
23
Terminology and Approach
Index
Metrics
Data
Indicator
24
Data
1
65
43
2
Slide Number
Workshop on Indicators of Final Ecosystem Services for Streams
Attachment 3 -- Page 16

25
Metrics
• Number of Non-Tolerant Species Corrected for Stream Size
• Proportion of Individual Fish that are Alien
26
Index
• Vertebrate: Index of Biotic Integrity = 37.53
27
Categories of EMAP Metrics
28
EMAP MacroinvertebrateMetrics
29
EMAP Physical Habitat and Fish Metal Metrics
30
1
65
43
2
Slide Number
Workshop on Indicators of Final Ecosystem Services for Streams
Attachment 3 -- Page 17

1
Ecological Measuresfor Social Analysis
Jim Boyd
2
Desired Characteristic forEcological Measures
• Biophysical measures, indicators that are…
• Easy for non‐scientists to interpret
• Directly or tangibly used by– Households
– Recreators
– Plant operators
– Farmers
– Planners and politicians
3
Natural Science Indicators
• Biotic integrity measures
• Benthic disturbance
• Hydrogeomorphic wetland classification
• Habitat suitability rankings
• Tissue burdens (toxics)
• Dissolved oxygen, nitrate, phosphorus concentrations
3 4
Natural Science Indicators
• Biotic integrity measures
• Benthic disturbance
• Hydrogeomorphic wetland classification
• Habitat suitability rankings
• Tissue burdens (toxics)
• Dissolved oxygen, nitrate, phosphorus concentrations
4
Are these interpretable by non‐scientists?
5
Natural Science Indicators
• Biotic integrity measures
• Benthic disturbance
• Hydrogeomorphic wetland classification
• Habitat suitability rankings
• Tissue burdens (toxics)
• Dissolved oxygen, nitrate, phosphorus concentrations
5
Require translation into “plain English”
Translation into what?
6
Examples
Input Biophysical Process Ecological Endpoint
Surface water pHHabitat and toxicity effects
Fish, bird abundance
Acres of habitatForage, reproduction, migration
Species abundance
Wetland acres Hydrologic processes Flood severity
Urban forest acresShading and sequestration
Air quality and temperature
Vegetated riparian border
Erosion processesSediment accumulation in reservoirs
1
65
43
2
Slide Number
Workshop on Indicators of Final Ecosystem Services for Streams
Attachment 3 -- Page 18

7
Examples
Input Biophysical Process Ecological Endpoint
Surface water pHHabitat and toxicity effects
Fish, bird abundance
Acres of habitatForage, reproduction, migration
Species abundance
Wetland acres Hydrologic processes Flood severity
Urban forest acresShading and sequestration
Air quality and temperature
Vegetated riparian border
Erosion processesSediment accumulation in reservoirs
Natural science indicators
Social science indicators
Biophysical production functions
8
Definition
Two interchangeable terms
(1) Ecological Endpoints
(2) Indicators of final ecosystem
goods & services
Biophysical features, quantities, qualities that require little further translation to make clear their relevance to wellbeing
9
Definition
Two interchangeable terms
(1) Ecological Endpoints
(2) Indicators of final ecosystem
goods & services
Biophysical features, quantities, qualities that require little further translation to make clear their relevance to wellbeing
Many/most natural science indicators don’t meet definition
10
Thought Experiment
• How would you explain the social value of improved “surface water pH”?
–Why does pH matter?
• It signals water and habitat degradation–Why does water and habitat degradation matter?
»Changes in species and their abundance
11
Who Decides What These Endpoints Are?
• All of us do– Ask people what they care about
• Voters
• Psychologists
• Elected representatives
• Marketing professionals
• Social scientists1212
Endpoints: Market vs. Ecological Goods
Obvious Not obvious
1
65
43
2
Slide Number
Workshop on Indicators of Final Ecosystem Services for Streams
Attachment 3 -- Page 19

13
1. A system of production
Biophysical features that constantly interact
2. Goods we “consume”
The system’s endpoints
13 14
Our Philosophy
• Keep measuring what we already measure
• But add to the suite of measures– Endpoints to facilitate social assessment
• Methods to link the two
15
Ecological Production Theory
• Inputs transformed into outputs via natural processes
• As a gross generalization– Biophysical inputs (natural science indicators)
– Biophysical outputs (natural science indicators)• A subset of outputs
• Final goods and services (ecological measures for social analysis
16
Examples
Inputs Process OutputPrecipitationLand coverSoils
Hydrological The hydrograph (speed, depth, timing, location of surface water flowsWater quality
Land coverBiological and chemical
Water quality
Habitat characteristics Forage, reproduction, predation
Species abundance
17
An Inconvenient Truth:Dual Measures
• Many ecological commodities are bothendpoint and input– Example
• Water clarity (may be desirable as an end in itself)
• But may also be– A signal of other conditions (anoxia)
– An input to other biophysical production (seagrass)
18
Examples
Endpoint Biophysical Process Different Endpoint
Trout abundance Forage and predation relationships Bird abundance
Forest acres Hydrological processes Species abundance
Wetland acres Hydrologic processes Flood pulse regulation
1
65
43
2
Slide Number
Workshop on Indicators of Final Ecosystem Services for Streams
Attachment 3 -- Page 20

19 20
One group of users in particular place at particular time
A different group of users
21
Think about “Users”
• The social science mindset
• A way to identify endpoints that are directly used, enjoyed– “final goods and services”
• Helps organize the natural system into a system of production
22
Some History & a Metaphor for Us
• Medical science in the 1960s– Inhaled particulate matter reduces “oxygen transfer rates in the lung”
– Are oxygen transfer rates an endpoint/final good or service?
• What is the value of oxygen transfer rates?– Answer requires further biophysical translation
23
No further translation necessaryThus, amenable to social analysis
24
1
65
43
2
Slide Number
Workshop on Indicators of Final Ecosystem Services for Streams
Attachment 3 -- Page 21

25
These Public Health Endpointsas Metaphor
• The linkage between health science and social analysis
• The way actions are justified
• Politically/socially influential
1
65
43
2
Slide Number
Workshop on Indicators of Final Ecosystem Services for Streams
Attachment 3 -- Page 22

1
How Can We Use The Final Services Concept In Monitoring
Design?July, 2009
Paul L. RingoldUS EPA, ORD, NHEERL
Western Ecology Division, Corvallis, OR
2
Key Questions
• What biophysical features, quantities and qualities require little further translation to make clear their relevance to human wellbing?
• How do we identify these?– Complete set– Avoid double counting
3
A Working Hypothesis to Defining Indicators of Final Services
• Identify significant user categories• Identify direct or tangible uses for each
user category– Stream Components
• Indicators
4
An Example for One User Category
• Catch and release angler– Stream Component 1: Taxa and sizes of fish– Stream Component 2: Aesthetics of location– Stream Components 3…n?
5
One Example
• Catch and release angler– Stream Component 1: Taxa and sizes of fish
• Presence, abundance, P(catch), Catch per unit effort?
– Stream Component 2: Aesthetics of location• Visual features, odor, noise…
– Stream Components 3…n?
6
One Example
• Catch and release angler– Stream Component 1: Taxa and sizes of fish– Stream Component 2: Aesthetics of location– Attributes 3…n?
• Choice, tradeoff or value– Measures of individual attributes, or
Integrated measure
1
65
43
2
Slide Number
Workshop on Indicators of Final Ecosystem Services for Streams
Attachment 3 -- Page 23

7
One Example
• Catch and release angler– Stream Component 1: Taxa and sizes of fish– Stream Component 2: Aesthetics of location– Attributes 3…n?
• Choice, tradeoff or value– Measures of individual attributes, or
integrated measure
Social Science Research Question
8
Second Example
• Irrigation Water– Stream Component 1: Water Quantity and
Timing– Stream Component 2: Chemistry– Stream Component 3: Biology?
9
Second Example
• Irrigation Water– Stream Component 1: Water Quantity and
Timing• Water availability, or• Water use
– Stream Component 2: Chemistry• Salinity, Selenium….
– Stream Component 3: Biology?• Absence of pathogens• Absence of T&E species
10
Working Hypothesis Part 1: “User”Categories
7 Categories• Agriculture • Industry • Municipal • Non-Use• Recreational Use • Spiritual/Cultural• Transportation
Number of Subcategories5720302
19
11
“User” Categories and Subcategories (1/2)
• Agriculture– Irrigation, Livestock, Aquaculture, Processing,
Grazing• Industry
– Cooling water, Processing, Mining, Hydro, Extracting, Receiving, Consumption
• Municipal– Drinking Water Source, Receiving
12
“User” Categories and Subcategories (2/2)
• Non-Use• Recreation
– Water contact, Viewing, Extracting• Spiritual/Cultural• Transportation
– Commercial, Tourism/Recreation
1
65
43
2
Slide Number
Workshop on Indicators of Final Ecosystem Services for Streams
Attachment 3 -- Page 24

13
Working Hypothesis Part 2: Stream Components
• Quantity • Physical Qualities • Chemical• Biological• Landscapes
14
Working Hypothesis Part 2: Stream Components
• Quantity – Amount,Timing….
• Physical Qualities – Temperature, Conductivity, Stream Bed, Clarity….
• Chemical– Chemical Water Quality Criteria, Odor….
• Biological– Pathogens, Ecosystem Health, Fish, Wildlife,
Plants….• Landscapes
– Human Experience Shed….
15
Identify Direct Uses
Quantity Chemical Biological LandscapeAgricultureIndustryMunicipalNon-UseRecreationSpiritual / CulturalTransportation
Stream Components
Use
r Cat
egor
ies
16
Identify Direct Uses
Quantity Chemical Biological LandscapeAgricultureIndustryMunicipalNon-UseRecreationSpiritual / CulturalTransportation
Stream ComponentsU
ser C
ateg
orie
s
17
Quantity QualityMarch 18, 2009 Physical Chemical Biological Landscapes
Amount TimingTemperat
ureConduct
ivityStream
Bed ClarityDissolved Oxygen
Chemical Water Quality Criteria Odor Pathogens
Ecosystem Health / Biotic
Integrity Fish Wildlife Plants
Human "Experience
Shed"I Agriculture
a) Irrigationb) Livestockc) Aquacultured) Processinge) Grazing
II Industrya) Cooling Waterb) Processingc) Miningd) Hydroelectrice) Extracting (Sand and Gravel)f) Discharge
g) Extraction for ConsumptionIII Municipal
a) Drinking Water Sourceb) WWTP Sink
IV Non-Use a) Existence/Option/Bequest ? ? ? ? ? ? ? ? ? ? ? ? ? ? ?
V Recreational Usea) Water Contactb) Viewingc) Extracting
VI Spiritual/Cultural ? ? ? ? ? ? ? ? ? ? ? ? ? ? ?VII Transportation
a) Commercialb) Tourism/Recreation
This attribute is posited to be of direct use to specific user categoriesThis attribute is posited to not be of direct use to specific user categories
Stream Attributes Posited to be a components of Indicators of Final Ecosystem Service to Specific User Categories and SubcategoriesWorking Hypothesis
Human "Use" Categories and Subcategories
18
Not Just Individual Indications
• Interpretation• Aggregation• Temporal and Spatial Scales
1
65
43
2
Slide Number
Workshop on Indicators of Final Ecosystem Services for Streams
Attachment 3 -- Page 25

19
Indicators and Spatial Scales
• User definition of a site?• Ecological definition of a site
– Asymptote in Metric – Effort Curve– Capture sufficient natural variability– Best Professional Judgment
20
Additional Biophysical Measures to Support Welfare Assessment?
• Substitutes– Relevance, location, function
• Complements– Access infrastructure
• Definitions vary by user category?
21
Questions
• Useful approach?No → Alternative to identifying a full set of indicators?
• Modify user categories?Yes → Substantively different indicatorYes → Substantial additional user category
• Modify stream attribute categories?Yes → Substantively improve capacity to understand human welfare
• More Examples?
1
65
43
2
Slide Number
Workshop on Indicators of Final Ecosystem Services for Streams
Attachment 3 -- Page 26
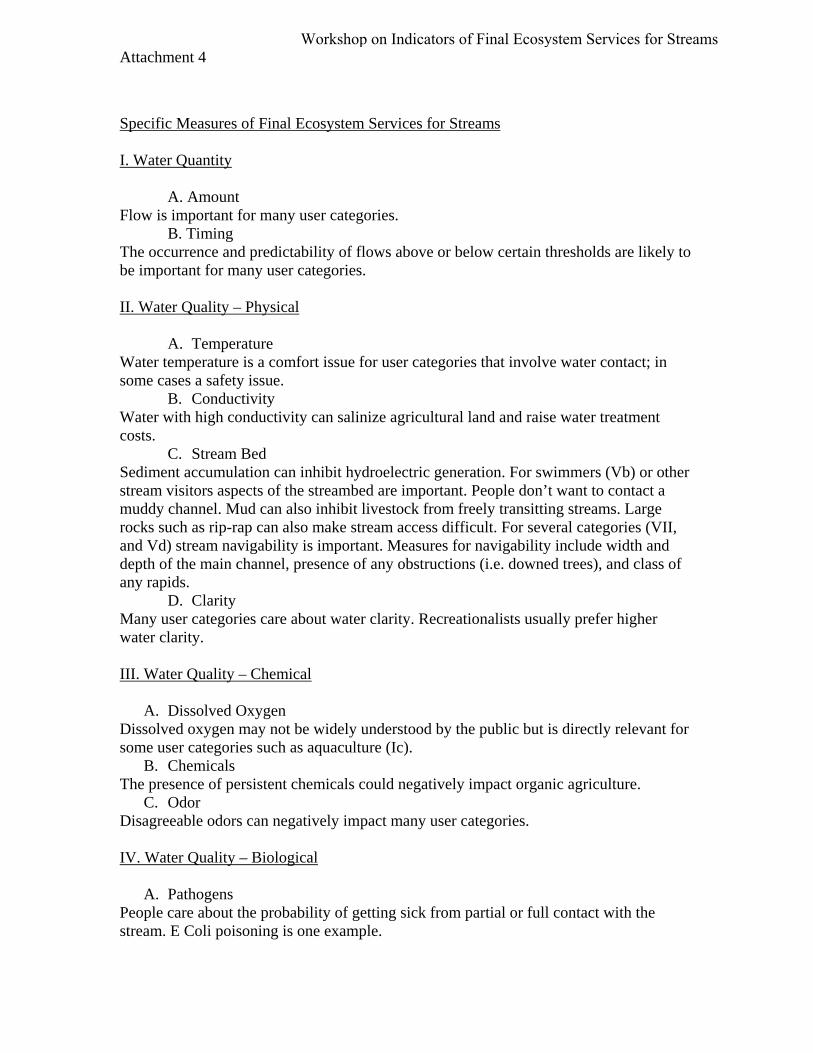
Attachment 4
Specific Measures of Final Ecosystem Services for Streams I. Water Quantity
A. Amount Flow is important for many user categories. B. Timing The occurrence and predictability of flows above or below certain thresholds are likely to be important for many user categories. II. Water Quality – Physical
A. Temperature Water temperature is a comfort issue for user categories that involve water contact; in some cases a safety issue.
B. Conductivity Water with high conductivity can salinize agricultural land and raise water treatment costs.
C. Stream Bed Sediment accumulation can inhibit hydroelectric generation. For swimmers (Vb) or other stream visitors aspects of the streambed are important. People don’t want to contact a muddy channel. Mud can also inhibit livestock from freely transitting streams. Large rocks such as rip-rap can also make stream access difficult. For several categories (VII, and Vd) stream navigability is important. Measures for navigability include width and depth of the main channel, presence of any obstructions (i.e. downed trees), and class of any rapids.
D. Clarity Many user categories care about water clarity. Recreationalists usually prefer higher water clarity. III. Water Quality – Chemical
A. Dissolved Oxygen
Dissolved oxygen may not be widely understood by the public but is directly relevant for some user categories such as aquaculture (Ic).
B. Chemicals The presence of persistent chemicals could negatively impact organic agriculture.
C. Odor Disagreeable odors can negatively impact many user categories. IV. Water Quality – Biological
A. Pathogens People care about the probability of getting sick from partial or full contact with the stream. E Coli poisoning is one example.
Workshop on Indicators of Final Ecosystem Services for Streams

Attachment 4
B. Ecosystem Health / Biotic Integrity “Naturalness” and “Ecosystem Health” are frequently stated desires especially within the non-use category.
C. Fish For anglers (Category V.c) appropriate indicators would include abundance of desired taxa and sizes of fish and their appearance. For anglers consuming fish the presence of contaminants would also be important. Biofouling which can arise from fish, wildlife or plants is important for water intake users, but especially for IIa, IIb, and IIIa.
D. Wildlife Typically the presence of wildlife is positive. Biofouling which can arise from fish, wildlife or plants is important for water intake users, but especially for IIa, IIb, and IIIa.
E. Plants Different user categories may enjoy seeing riparian vegetation, and may have preferences for specific species. Biofouling which can arise from fish, wildlife or plants is important for water intake users, but especially for IIa, IIb, and IIIa. Some plants interfere with grazing. V. Landscapes
A. Aesthetics (Human "Experience Shed") A measure that represents all five senses is important. Studies exist that have developed aesthetic indices. The presence of garbage reduces aesthetic enjoyment. Sometimes particular groups of people care about very specific things so an exhaustive list of specific measures is difficult.
B. Genetic Diversity Maintaining genetic diversity has been tied to nonuse values, a category which includes existence, option, and bequest values. The Education and Research user category also has a stake in genetic diversity.
Workshop on Indicators of Final Ecosystem Services for Streams