report - itto meranti plywood-fina… · based resins (urea-formaldehyde,...
TRANSCRIPT

1
LIFE CYCLE ASSESSMENT FOR ENVIRONMENTAL
PRODUCT DECLARATION OF TROPICAL PLYWOOD
PRODUCTION IN MALAYSIA AND INDONESIA
REPORT
PREPARED FOR
INTERNATIONAL TROPICAL TIMBER ORGANIZATION
GAN K. S. & M.Y. MASSIJAYA
MARCH 2014
1
TABLE OF CONTENTS
Background Introduction
2 3
Product definition
4
Main product standards
4
Description of the plywood manufacturing companies
5
Raw materials and composition
5
Manufacturing process
5
Goal and Scope
19
System boundary
19
Functional unit
19
Software
20
Assumptions
20
Life Cycle Inventory Data
21
Life Cycle Inventory Analysis - Cut-off criteria - Allocation for co-products
22
Life Cycle Impact Assessment data sources
22
Impact Assessment Results
23
Identification of significant issues
25
Conclusion
26
Bibliography
27
Appendix 1 – Environmental impact category
28

2
LIFE CYCLE ASSESSMENT FOR ENVIRONMENTAL PRODUCT
DECLARATION OF MERANTI PLYWOOD PRODUCED IN MALAYSIA
AND INDONESIA
Background
Environmental certifications, eco-labels and environmental claims abound in the market place, creating confusion among companies and consumers alike. Many of these claims focus on one or two product attributes. Others are more comprehensive but may lack commonalities in scope or evaluation methods to allow straight forward comparison of products. Some have no scientific basis. Many claim to make reference to ISO 14040 and ISO 14044 in establishing the environmental impacts through Life Cycle Assessment (LCA). However, in comparison of one product to another using LCA results it is essential that the same attributes be compared within the same family of products to ensure consistency. There are possibilities that LCAs are conducted at different levels and bases making them difficult to be compared. Environmental Product Declarations (EPDs) are based on Product Category Rules (PCR) that specify the parameters to be considered for a given group of products. EPD provides complete, credible data and allows for a fair basis of comparison among products. An EPD is a comprehensive, internationally recognized report that compiles and standardizes technical sustainability information, eliminating the need to wrestle with a dozen or more individual documents. No other single certification or label combines all of these factors. EDPs solve the problems associated with manufacturer of products publishing undifferentiated, selective, unverified, misleading, incomparable and often incomprehensible environmental data derived from non standard methodologies. EPD nowadays is gaining market momentum as a tool that communicates the environmental performance of a product; in this project it is to measure the environmental performance of meranti plywood production.
The important foundation that an EDP is built upon is the Life Cycle Assessment. An LCA compiles and evaluates, according ISO 14040, the inputs, outputs and the potential environmental impacts of a product system throughout the life cycle. Information generated from the process will be relevant, verifiable and comparable. LCA evaluations have been used in many industries and fields of research, and it is helpful to assess building products and assemblies in an integrated design process.
Considering the developments related to EPD and LCA, as well as the increasing international timber markets’ requirements for green products (e.g. Green building rating systems like BREEAM in the UK), ITTO has commissioned this study to conduct LCA on meranti plywood where EPD can be established depending on the schemes or Product Category Rules used. The outputs will fill critical gaps in the environmental performance of tropical wood products; and increase market acceptance and specification of tropical/meranti wood products as a green building material.

3
Introduction
Life Cycle Assessment (LCA) is normally conducted for a product system from cradle-to-grave, by
accounting all the environmental impacts from the resource extraction to end-of-product disposal
based on a series of LCA standards created by the International Organisation for Standardization
(ISO): ISO 14040 and ISO 14044. LCA as defined by ISO 14040 and ISO 14044 is compiling and
evaluation of inputs and outputs data, and the potential environmental impacts of a product system
during the product’s lifetime. The result may then be used for: identifying opportunities to improve
the environmental aspects of a product at the various stages in its life cycle, decision making in
industry and organization in the selection of products for application, and marketing of the products
(e.g. an environmental claim, eco-labelling scheme or environmental products declarations).
There are basically three type of environmental labels or declarations under ISO 14020 series: Type I
environmental labelling programme is a voluntary, multi-criteria-based third party programme (ISO
12024:1999(E)), Type II environmental labelling is self-declared environmental claims that may be
made by manufacturers, importers, retailers or anyone else who are likely to benefit from such
claims (ISO 14021:1999(E)), and Type III environmental declarations that present quantified
environmental information on the life cycle of a product to enable comparisons between products
fulfilling the same function (ISO 14025:2006). Product Category Rules (PCRs) for product groups are
developed for communication of environmental claims (Type III) such as PCR Wood Materials (IBU
2009), Product Category Rules (PCRs) for North American Structural and Architectural Wood
Products (UN CPC 31), Sustainability of construction works—Environmental product declarations,
and Core rules for the product category of construction products (BS EN 15804:2012). Depending on
the schemes or PCRs, the declared environmental impacts are Global Warming Potential (GWP),
Acidification Potential (AP), Eutrophication Potential (EP), Photochemical Ozone Creation Potential
(POCP) and Ozone Depletion Potential (ODP) (Appendix 1). Other environmental impacts such as
Terrestrial Ecotoxicity Potential (TEP), Human Toxicity Potential (HTP), Freshwater Aquatic
Ecotoxicity Potential (FAEP), Marine Aquatic Ecotoxicity Potential (MEP), and Abiotic Depletion
Potential (ADP) may also be included. There are also schemes that only deal with GWP or
greenhouse gas emission (GHG) in terms of carbon dioxide emission, normally known as carbon
footprint (PAS 2050:2011).
There are active developments of LCA tools and applications in Europe, North America and Japan.
However, in the tropical timber producing and processing regions in South East Asia, there are very
few studies or attempts to conduct LCA on the tropical timber products (Murphy 2004). LCA study of
the timber product does not only involve foreground data on timber and the manufacturing
processes, but also other local inputs and outputs (background data) to holistically represent the
whole product system or life cycle. It requires quality local background datasets that may not be
available to assess the whole product system satisfactorily, e.g. local electricity and fuel supply,
transportation.

4
Plywood companies in Malaysia and Indonesia use mainly tropical/meranti timbers supplied from
forest concession areas owned by their subsidiary companies or purchased from other suppliers and
the plywood is exported and may be further processed by the users. The further processing in some
cases, use phase and end-of-product disposal may be varied and are not fixed. For this study on
plywood manufacturing, LCA was conducted from cradle-to-gate. Thus the first task was to conduct
gate-to-gate life cycle inventory at the plywood companies and then to quantify the environmental
impact based on established background databases available for major input materials particularly
logs and resin. The upstream operation or log extraction and transportation and resin were based on
available local dataset and references. These issues were discussed and agreed at a pre-study
workshop with stakeholders representing plywood companies/associations, ITTO representatives
and the consultants/researchers. The meeting also agreed to conduct the study at three to four
representative plywood companies each in Malaysia and Indonesia.
Product definition
Meranti or tropical plywood is made using mixed light to medium hardwoods consisting mainly of
meranti groups of timbers in Malaysia and Indonesia. The plywood is used widely in the building
construction sector as its strength, durability and cost make it a preferred building material. A small
volume may be used for furniture manufacture. Plywood is made using veneers composed with
wood grain perpendicularly to each other with mainly formaldehyde based resin. Plywood is
normally made up of odd number of veneers, e.g. 3, 5, 7, 9, 15. The overall plywood thickness may
range from 3 mm up to 28 mm and the sizes are usually 3’ x 6’ and 4’ x 8’. Besides making the main
product—plywood, a plywood plant may also sell dried veneer and other products like laminated
veneer lumber (LVL) and block board using timber recovered from peeler cores.
Main product standards
Referenced standards used in the plywood plants are,
No Standards TITLE 1 MS 228:1991 Specification for Plywood (First Revision)
2 MS 544 : PART 4 : SECTION 1 : 2001
Code of Practice for Structural Uses of Timber: Part 4 : Timber Panel Products: Section 1 ─ Structural Plywood
3 MS 544 : PART 4 : SECTION 2 : 2001
Code of Practice for Structural Uses of Timber Part 4 : Timber Panel Products : Section 2 ─ Marine Plywood
4 BS 1088-1: 2003 Marine plywood – Part 1: Requirements
5 BS EN 314-1: 1993 Plywood – Bonding quality Part 1. Test methods
6 BS EN 314-2: 1993 Plywood – Bonding quality Part 2. Requirements 7 JAS MAFF, Notification no
1751, 2008 Japanese Agricultural Standard For Plywood
8 MTIB-CB-PS-01:09/2013 Plywood Certification Standard

5
Description of the manufacturing companies
The plywood companies in Malaysia and Indonesia are privately owned manufacturing entities that purchase raw materials from forest concession owners. Some companies may also own the concession areas and normally these are operated independently. The plywood companies are usually large, producing more than 5,000 m3/month of various types of plywood. Usually, the plywood plants will use all the wood wastes generated for process heat and co-generation of electricity for their own consumption. Additional electricity requirement is obtained from the national electricity grid. In some places, coal may be used to generate electricity and thermal requirement in the companies.
Raw materials and composition
The main raw materials are tropical timber obtained locally. The common timber species are meranti group (42%), keruing group (7%), kapur (0.5%) and the mixed light hardwoods (50.5%) based on actual data collected. In this region, logs are normally delivered using tug boats. The formaldehyde based resins (urea-formaldehyde, melamine-urea-formaldehyde and phenol-formaldehyde) are supplied by local adhesive companies.
Manufacturing process
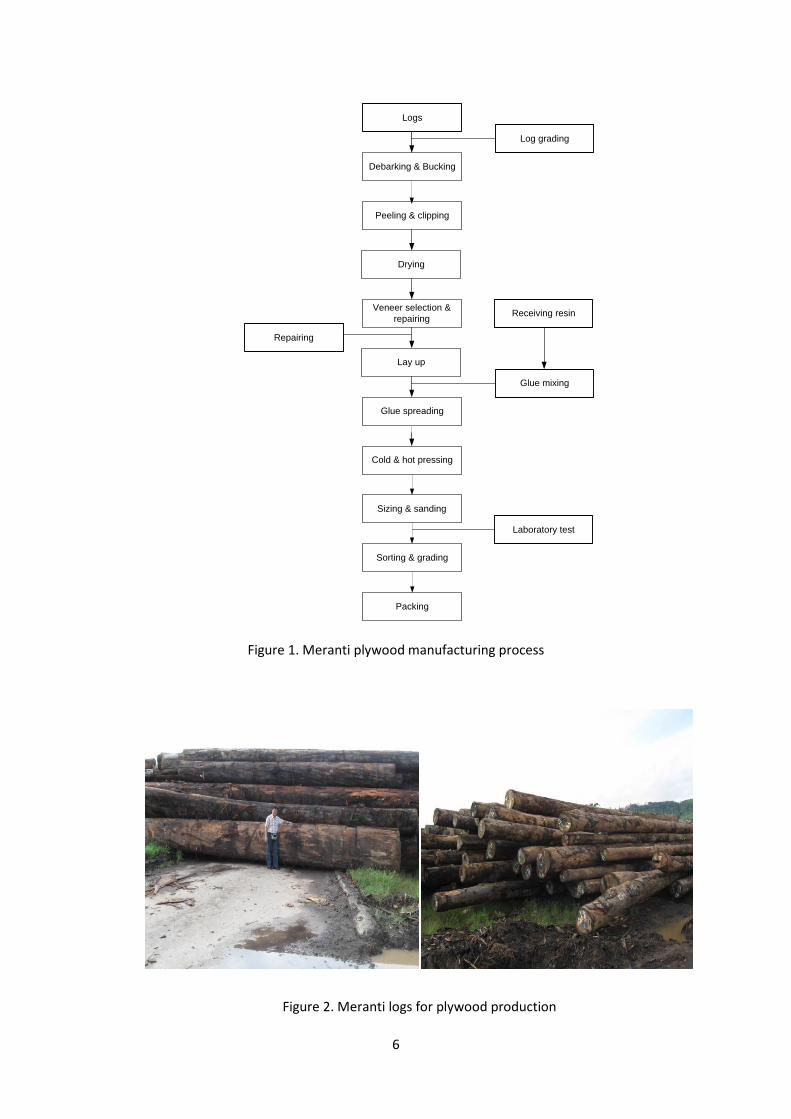
Plywood production process in general are the same among the plywood companies. However, they may vary in terms of specific condition based on their raw material condition, equipment/machines, thickness, kind of plywood and the target quality of the produced plywood. Figure 1 describes the meranti plywood manufacturing process in Indonesia and Malaysia.
Brief description of the plywood production process are as follows;
Log yard: Meranti logs as plywood raw material are sorted in log pond or log yard, especially to determine the wood species and log quality. In general, log pond is used for floater wood species and log yard is used for sinker wood species. Figure 2 shows the condition of the meranti log for plywood production.
6
Logs
Lay up
Glue spreading
Veneer selection &
repairing
Drying
Peeling & clipping
Debarking & Bucking
Cold & hot pressing
Log grading
Packing
Sorting & grading
Sizing & sanding
Glue mixing
Laboratory test
Repairing
Receiving resin
Figure 1. Meranti plywood manufacturing process
Figure 2. Meranti logs for plywood production
7
The wood species used in the plywood companies sampled were mainly the family of meranti species for face veneer. For core veneer, all wood species are permitted when they do not affect its utilization. Table 1 shows an example of log receiving standard of the plywood industry sampled.
Table 1. Log receiving standard
No. Item For Face Veneer For Back or Core
1. Length 300 cm up 100 cm up
2. Diameter 40 cm up 18 cm up
3. Crack Total length of crack on both side log end shall not be more than 10% of the log length.
Total length of crack on both side log end shall not be more than 20% of the log length.
4. Knot (Sound Knot) Permitted up to diameter of 10 cm and up to a number of 2 in every 2 m length.
Permitted.
5. Decay Permitted up to a depth of one twelfth of the radius of the log
Permitted to up to a depth of one eight of the radius of the log.
6. Worm hole Permitted up to a depth of one twelfth of the radius of the log.
Permitted to up to a depth of one eight of the radius of the log
7. Twist of the grain Permitted up to an angle of 100 of the log’s axis.
Permitted up to an angle of 150 of the log’s axis.
8. Ring crack Permitted if 10 cm2 from log center.
Permitted if 15 cm2 from log center.
9. Others Permitted if slight Permitted if slight.
Bucking: Logs emerge from the debarker after having been stripped of its bark (debarking). The meranti logs were transported using hoist to the bucking/cross-cutting section into billets/blocks for peeling. In some plywood companies, meranti logs may have been debarked in the forest concession area, so debarking process in the plywood industry is not necessary. The logs cut to 3, 4, 6 and 8 feet based on the order and the stardard used. Figure 3 shows the bucking process.
Log grading and cleaning: The cut logs/billets are then graded and transported to the log washer using conveyor. The logs were cleaned using water spray. The log grading and washing process can be seen in Figure 4.

8
Figure 3. Log cutting process.
Figure 4. Log grading and cleaning.
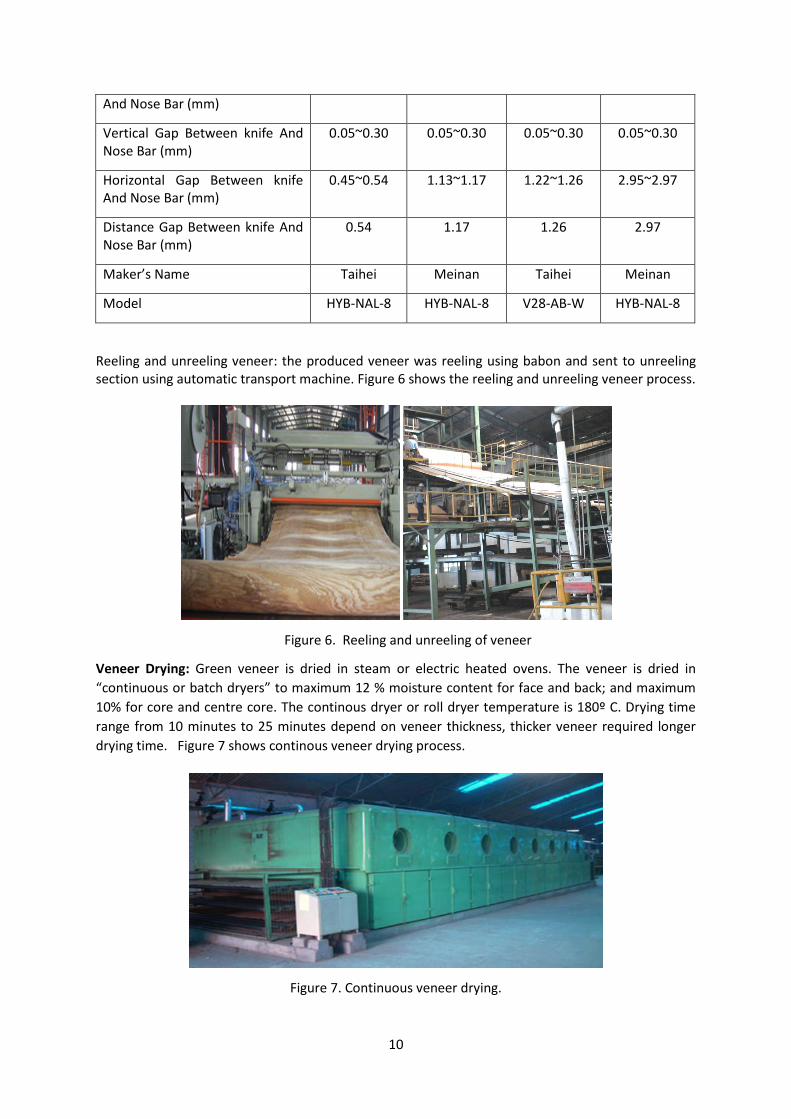
Peeling: Log centering before peeling process using laser projection as shown in Figure 5. The block is peeled using rotary lathe. Rotary veneer is the most popular technique in veneer production for ordinary plywood production. The veneer thicknesses for core veneer were 1.3 mm; 1.6 mm; 2.2 mm; 3.6 mm; and 4.0 mm, while the face and back veneer thicknesses were 0.60 mm; 0.65 mm; 0.70 mm; 0.80 mm; 0.85 mm; 1.70 mm. Figure 6 shows the peeling process of meranti log.

9
Figure 5. Log centering
Figure 6. Peeling process of meranti log.
Table 2 shows the sample of the veneer peeling common parameters of meranti plywood company in Indonesia and Malaysia.
Table 2. Veneer peeling conditions
Parameter
Veneer Thickness (mm)
0.60 1.30 1.40 3.30
Peeling Speed (m/min) Max 200 Max 200
Max 200
Max 200
Knife Angle (°) 19°30` 19°30` 19°30` 19°30`
Cutting Angle (°) 21°00` 21°00` 21°00` 21°00`
Clearance Angle (°) 0° 0° 0° 0°
Vertical Gap Between Spindle 0~0.6 0~0.6 0~0.6 0~0.6
10
And Nose Bar (mm)
Vertical Gap Between knife And Nose Bar (mm)
0.05~0.30 0.05~0.30 0.05~0.30 0.05~0.30
Horizontal Gap Between knife And Nose Bar (mm)
0.45~0.54 1.13~1.17 1.22~1.26 2.95~2.97
Distance Gap Between knife And Nose Bar (mm)
0.54 1.17 1.26 2.97
Maker’s Name Taihei Meinan Taihei Meinan
Model HYB-NAL-8 HYB-NAL-8 V28-AB-W HYB-NAL-8
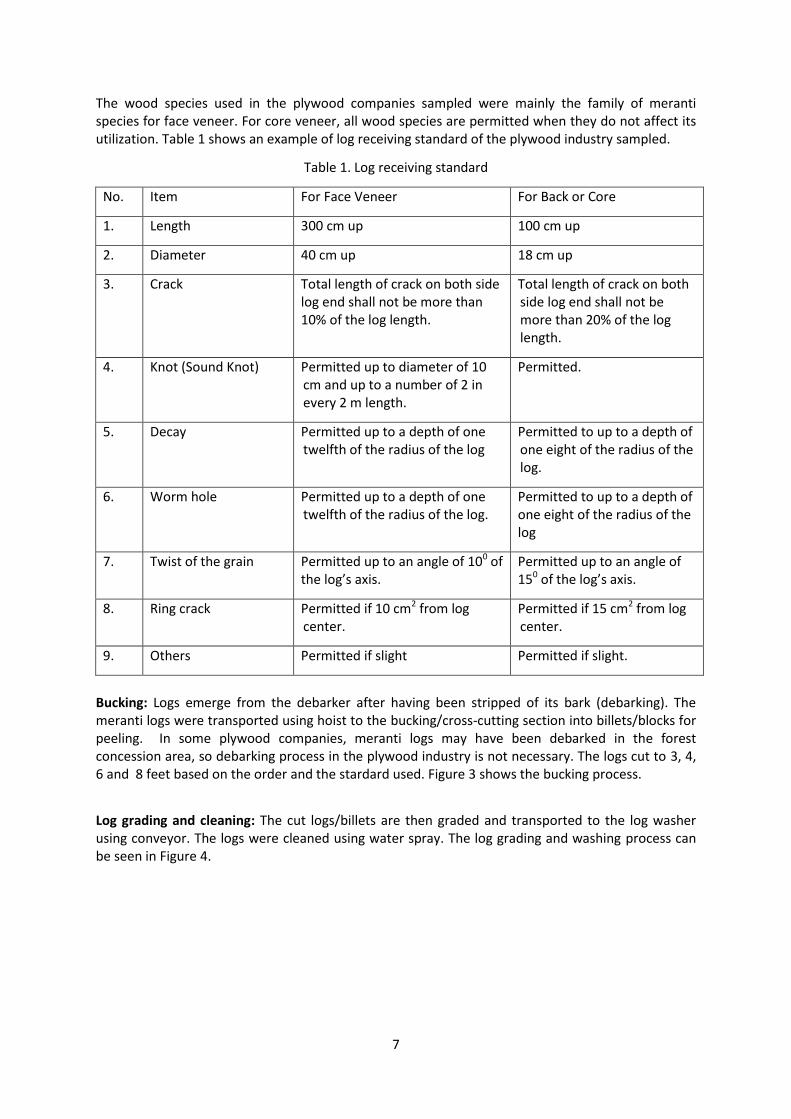
Reeling and unreeling veneer: the produced veneer was reeling using babon and sent to unreeling section using automatic transport machine. Figure 6 shows the reeling and unreeling veneer process.
Figure 6. Reeling and unreeling of veneer
Veneer Drying: Green veneer is dried in steam or electric heated ovens. The veneer is dried in
“continuous or batch dryers” to maximum 12 % moisture content for face and back; and maximum
10% for core and centre core. The continous dryer or roll dryer temperature is 180º C. Drying time
range from 10 minutes to 25 minutes depend on veneer thickness, thicker veneer required longer
drying time. Figure 7 shows continous veneer drying process.
Figure 7. Continuous veneer drying.

11
Table 3 shows an example of veneer drying condition on meranti plywood industry in Indonesia and Malaysia.
Table 3. Dryer operation conditions
Type item Continuous dryers Roll Dryer
No.5 No. 1 No.2 No.3 No.4
Number Sections
Number of Decks
Lenght of Heating Section (m)
18
3
36
17
3
34
18
3
36
17
3
34
14
6
28
Steam Pressure (kg/cm2)
10~15 10~15 10~15 10~15 10~15
Temperature
(°C)
In 170~190 170~190 170~190 170~190 150~175
Out 140~180 170~190 140~180 147~190 165~185
Feeding Speed (m/minute)
20-40 20-40 4-18 8-15 4-14
Dry Time (minute) 0.9-1.8 0.8-1.7 2.0-4.5 2.3-4.3 2.0-7.0
Dry Veneer Thickness (mm)
0.80 2.00
Maker’s Name UROKO GREENZE
BACH
UROKO GREENZEB
ACH
BABCOCK
Model CD-2.8Mx18Hs=3cs3D
EBD.III 280/34M.k (65)
CD-2.8Mx18Hs=3cs3D
EBD.III 280/34M.k(65)
RD VI 460/28Mk (45) “l”
After dryer, each dried veneer should be separated to face, back and inner layer and proceed to next processing step.
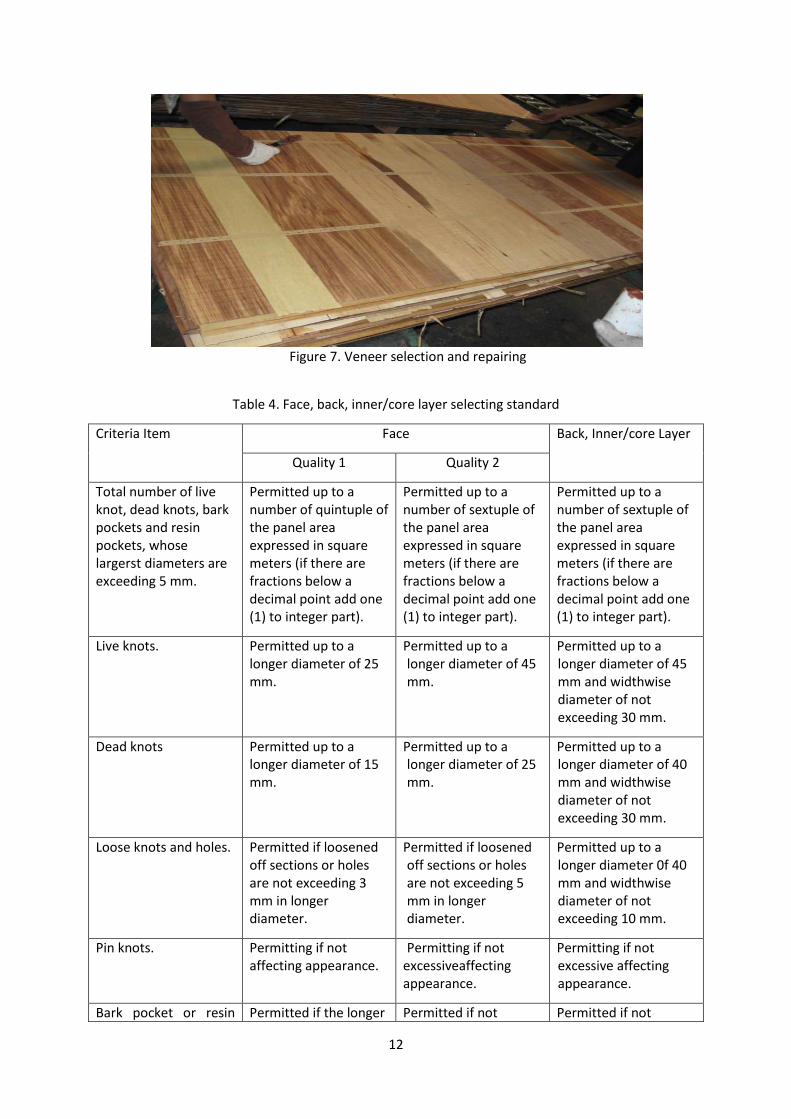
Veneer selection and repairing; Dried veneer than selected based on their quality and repaired if necessery. Figure 7 shows veneer selection and repairing process. Table 4 shows an example of face, back, inner veneer selecting standard of meranti plywood industry in Indonesia and Malaysia.
12
Figure 7. Veneer selection and repairing
Table 4. Face, back, inner/core layer selecting standard
Criteria Item Face Back, Inner/core Layer
Quality 1 Quality 2
Total number of live knot, dead knots, bark pockets and resin pockets, whose largerst diameters are exceeding 5 mm.
Permitted up to a number of quintuple of the panel area expressed in square meters (if there are fractions below a decimal point add one (1) to integer part).
Permitted up to a number of sextuple of the panel area expressed in square meters (if there are fractions below a decimal point add one (1) to integer part).
Permitted up to a number of sextuple of the panel area expressed in square meters (if there are fractions below a decimal point add one (1) to integer part).
Live knots. Permitted up to a longer diameter of 25 mm.
Permitted up to a longer diameter of 45 mm.
Permitted up to a longer diameter of 45 mm and widthwise diameter of not exceeding 30 mm.
Dead knots Permitted up to a longer diameter of 15 mm.
Permitted up to a longer diameter of 25 mm.
Permitted up to a longer diameter of 40 mm and widthwise diameter of not exceeding 30 mm.
Loose knots and holes. Permitted if loosened off sections or holes are not exceeding 3 mm in longer diameter.
Permitted if loosened off sections or holes are not exceeding 5 mm in longer diameter.
Permitted up to a longer diameter 0f 40 mm and widthwise diameter of not exceeding 10 mm.
Pin knots. Permitting if not affecting appearance.
Permitting if not excessiveaffecting appearance.
Permitting if not excessive affecting appearance.
Bark pocket or resin Permitted if the longer Permitted if not Permitted if not

13
pocket. diameter is not exceeding 30 mm.
conspicuous. conspicuous.
Sound burls or chicken track.
Permitted if slight. Permitted if not conspicuous.
Permitted if not conspicuous.
Discoloration or stain. Permitted if slight. Permitted if not conspicuous.
Permitted if not conspicuous.
Decay Not permitted. Permitted if very slight. Permitted if very slight.
Open splits or chips Permitted up to a length of 20% of the panel length, up to a width of 1.5 mm and up to a number of two.
Permitted up to a length of 40% of the panel length, up to a width of 4.0 mm and up to a number of three, or up to a length of 20% of the panel length, up to a width of 2 mm and up to a number of six.
Permitted up to a length of 40% of the panel length, up to a width of 6.0 mm.
Cross break Permitted if slight. Permitted if slight. Permitted if slight.
Worm holes. As to those than linear worm holes are, permitted up to a longer diameter of 1.5 mm, and if they are not dark-rimmed and not located collectively.
As to the linear worm holes, permitted up to a longer diameter of 10 mm, and if they are dark-rimmed, and located in the numbers less than quadruple of the panel area expressed in the square meters (if there are fractions below a decimal point, add one (1) to the integer part).
Permitted if not excessive.
Permitted if not excessive.
Rough grain Permitted if slight. Permitted if not excessive
Permitted if not excessive
Open joints Permitted if joint parts are color matched and there is no opening
Permitted if openings of joints are not so noticeable.
Permitted if openings of joints are not so noticeable.
14
with the joints.
Other defects Permitted if slight. Permitted if not conspicious.
Permitted if not conspicious.
Lay up: The veneer then lay up perpendicular fiber orientation with the adjacent veneer. Table 5 shows an example veneer composition of meranti plywood industry in Indonesia and Malaysia.
Tabel 5. Veneer composition of meranti plywood
Veneer position Veneer Thickness
3 plies 5 plies 7 plies
Face 0.60 1.30 1.50
Core 1.40 3.30 3.30
Center core - 3.30 3.00
Core - - 3.30
Center core - - 3.00
Core - 3.30 3.30
Back 0.60 1.30 1.50
Total veneer thickness 2.60 12.50 18.90
Total plywood thickness 2.40 11.50 17.50
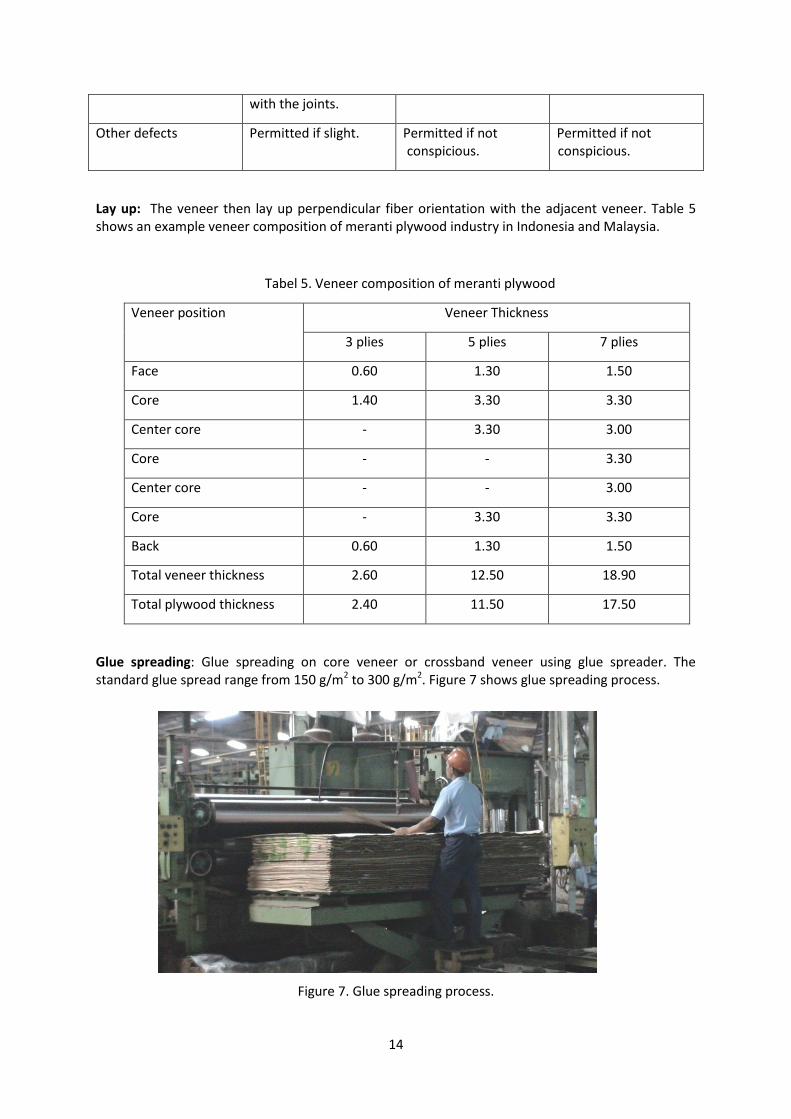
Glue spreading: Glue spreading on core veneer or crossband veneer using glue spreader. The standard glue spread range from 150 g/m2 to 300 g/m2. Figure 7 shows glue spreading process.
Figure 7. Glue spreading process.

15
Table 6 shows an example of glue composition of melanime formaldehyde and urea formaldehyde adhesives of meranti plywood industry in Indonesia and Malaysia.
Table 6. Glue composition of Melamine Formaldehyde and Urea Formaldehyde resin.
Resin Melamine Formaldehyde Urea Formeldehyde
Melamine formaldehyde
6.5 kg -
Urea formaldehyde - 6.5 kg
Flour 1.1 kg 0.7 kg
Melamine powder 0.3 kg -
Hardener 0.5 kg 0.3 kg
Catcher 0.6 kg 0.6 kg
Total 9.0 kg 8.1 kg
Glue spread amount 150 – 300 g/m2 150 – 300 g/m2
Viscosity 3-15 3-15
pH 6 + 1 6 + 1
Cold pressing: Cold pressing facilitate the adhesive develop better glue bonding through better glue transfer, wetting and penetration process. The pressure is 8 + 1 kg/cm2 for 30 minutes. Open assembly time 20 to 30 minutes, closed assembly time 240 minutes. Figure 8 shows the cold pressing process and Table 7 lists the cold press settings.
Figure 15. Cold pressing process.
Figure 8. Cold press station

16
Table 7. Cold pressing standard
Plywood size Material size (cm)
Pressure Gauge (kg/cm2)
Unit Pressure (kg/cm2)
Pressing Time (min)
920 x 1830 960 x 1880 8.0 ± 0.8 10 ± 1
30 1230 x 2440 1270 x 2490 14.1 ± 1.4
Ø Cylinder (cm) : 37.5
Size of Platen (cm) :140 cm x 280 cm
Open assembly time : 20 ~ 30 minutes
Closed assembly time : 240 minutes
Hot pressing: Heat and pressure are used to cure the resin, thereby bonding the veneers together to make plywood (pressing). The pressure is 8 + 1 kg/cm2 . The standard average pressing time is 25 second per mm plywood thickness. The pressing tempeture is 110 – 115oC for UF and MF bonded plywood. Figure 8 shows hot pressing process. Table 8 shows an example of hot pressing standard meranti plywood industry in Indonesia and Malaysia.
Figure 16. Hot pressing process.
Figure 8. Hot pressing of plywood
Table 8. Hot pressing process settings
Plywood size (mm)
Material Size (cm)
Pressure gauge (kg/cm2)
Unit
pressure
(kg/cm2)
Temperature (oC)
Steam pressure
Pressing
time (min)
920 x 1,830
96 x 188 82 + 8 10 + 1 110 - 120 0.1 + 0.05 MPa
2.4 = 70

17
1230 x 2440
127 x 249
143 + 14
11.5=430
17.5=620
Ø Cylinder : 37.5 cm
Size of Platen : 137 x 270 cm
Sizing/cutting: After hot pressing, the plywood panels are cut to the standard size 122 cm x 244 cm or based on the order size
Putty process: The defects were minimized by putty process. Figure 9 shows the plywood putty process.
Figure 9. Plywood putty process.
Sanding process: The outer layers of plywood (face and back) are sanded using sander machine. The
standard sanding speed depend on the plywood thickness. For 2.40 mm plywood thickness, the
standard sanding speed is 58 + 3 m/min. Sand paper grits standard depend on the plywood
thickness. For 2.4 mm plywood thickness, the sand paper grit standard for head no.1, 2, and 3 are
150, 180, and 240, respectively. Figure 10 shows sanding of plywood.
Figure 10. Plywood sanding process.
18
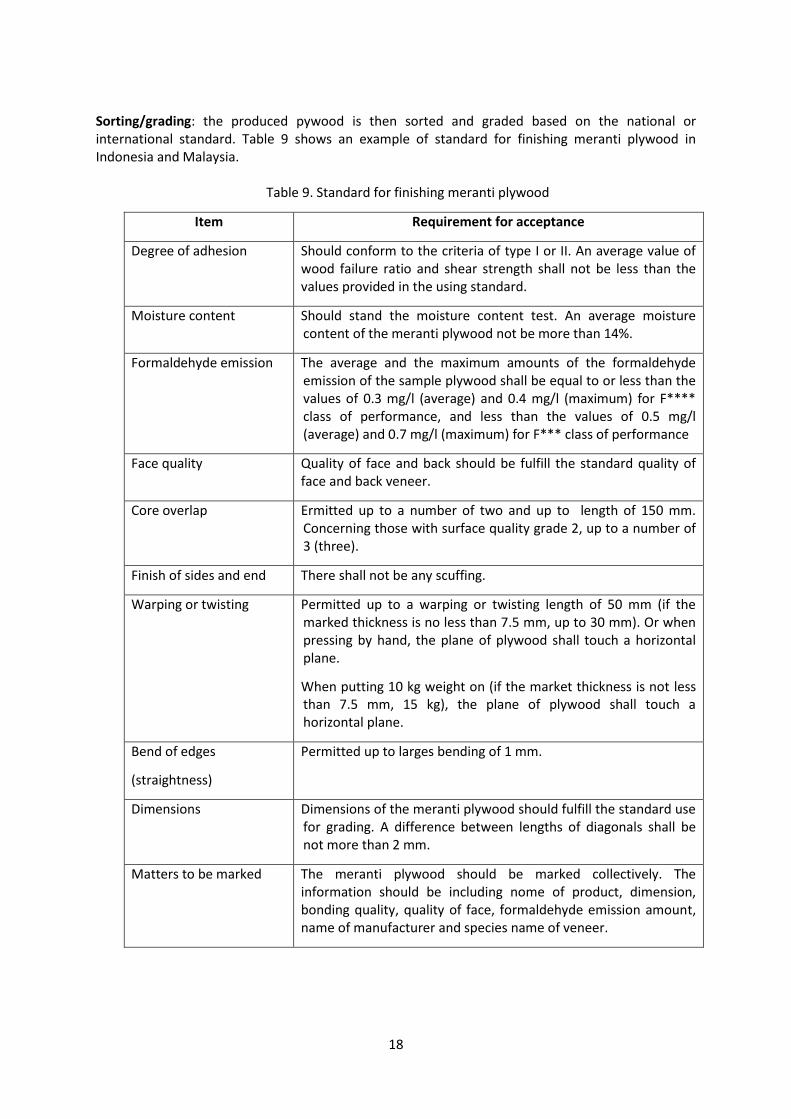
Sorting/grading: the produced pywood is then sorted and graded based on the national or international standard. Table 9 shows an example of standard for finishing meranti plywood in Indonesia and Malaysia.
Table 9. Standard for finishing meranti plywood
Item Requirement for acceptance
Degree of adhesion Should conform to the criteria of type I or II. An average value of wood failure ratio and shear strength shall not be less than the values provided in the using standard.
Moisture content Should stand the moisture content test. An average moisture content of the meranti plywood not be more than 14%.
Formaldehyde emission The average and the maximum amounts of the formaldehyde emission of the sample plywood shall be equal to or less than the values of 0.3 mg/l (average) and 0.4 mg/l (maximum) for F**** class of performance, and less than the values of 0.5 mg/l (average) and 0.7 mg/l (maximum) for F*** class of performance
Face quality Quality of face and back should be fulfill the standard quality of face and back veneer.
Core overlap Ermitted up to a number of two and up to length of 150 mm. Concerning those with surface quality grade 2, up to a number of 3 (three).
Finish of sides and end There shall not be any scuffing.
Warping or twisting Permitted up to a warping or twisting length of 50 mm (if the marked thickness is no less than 7.5 mm, up to 30 mm). Or when pressing by hand, the plane of plywood shall touch a horizontal plane.
When putting 10 kg weight on (if the market thickness is not less than 7.5 mm, 15 kg), the plane of plywood shall touch a horizontal plane.
Bend of edges
(straightness)
Permitted up to larges bending of 1 mm.
Dimensions Dimensions of the meranti plywood should fulfill the standard use for grading. A difference between lengths of diagonals shall be not more than 2 mm.
Matters to be marked The meranti plywood should be marked collectively. The information should be including nome of product, dimension, bonding quality, quality of face, formaldehyde emission amount, name of manufacturer and species name of veneer.

19
Packing: The plywood is packed and marked based on the standard. Number of plywood per pack/crate for plywood thickness 2.40 mm, 11.50 mm, and 17.50 mm are 250, 50, and 35 pieces, respectively. The following matters should be marked collectively: name of product, dimensions, bonding quality, quality of face, formaldehyde emission amount, and name of manufacturer. If a species name of veneer is marked, other those stipulated above, the species name shall be marked collectively in a group. Figure 11 shows plywood packing process.
Figure 19. Plywood packing process.
Figure 11. Packing of plywood for storage/shipment
Goal and Scope
The goal of this study was to determine the cradle-to-gate Life Cycle Impact Assessment on the
manufacturing of meranti plywood in Malaysia and Indonesia. The results will be used to gauge the
environmental load of the meranti plywood manufactured in this region.
System boundary
LCA may be conducted for cradle-to-grave, cradle-to-gate or gate-to-gate depending on the purpose
and need of the study. Cradle-to-grave assessment includes resource extraction, processing,
transportation/delivery, use-phase and final product disposal. For primary products, such as
plywood, normally the use-phase and final product disposal are not fixed and it will be more
appropriate to conduct the assessment up to the gate. For this study, the system boundary was set
for cradle-to-gate assessment (Figure 12). In this case, cradle-to-gate LCA includes log extraction,
resin production, manufacturing of plywood and transportation within these phases.
Functional unit

20
One cubic meter (1 m3) of industry–standard size plywood of 914 x 1829 mm (3 x 6 ft) or 1219 x 2438
mm (4 x 8 ft).
Software
Microsoft Excel was used for modelling the overall system. GaBi 6 software—System and database
for Life Cycle Engineering, GaBi Life Cycle Inventory databases for fuel and Malaysia electricity
database by SIRIM Berhad.
Assumptions
a. The data collected on inputs and outputs were representative of the current manufacturing
practices of meranti plywood in Malaysia and Indonesia.
b. Default values for emission data were obtained from commercial databases and published
reports considered as representative of the current scenario.
Log yard
Peeling & Clipping
Veneer drying
Bucking &
debarking
Wo
od
wa
ste
s
Plywood & Co-
products
Sanding &
trimming
Cold & hot
pressing
Composing & glue
application
Bo
iler
& c
o-
ge
ne
ratio
n
Electricity
Heat
Electricity grid
Water
Internal
transportation Diesel
Resin
Harvesting &
transportation

21
Figure 12. System boundary for cradle-to-gate assessment—dashed line. Solid-line boxes are
foreground processes and broken-line boxes are background databases/processes
Life Cycle Inventory Data
Field briefing and survey were conducted in seven plywood companies. However, one company did
not provide any data and another returned incomplete dataset and were excluded in the
assessment. The general profiles of the remaining five plywood companies assessed in this study are
listed in Table 10. Twelve monthly datasets were collected and calculated to provide the input and
output data of materials and energy for one cubic meter of plywood produced (Table 11). Data for
both unit process approach and overall or black-box approach were collected. However, there were
significant difficulties for the plywood companies to provide data at unit process levels and thus
incomplete data and high discrepancies. Thus, only the overall data or black box approach was
collated and analyzed.
Table 10. Profiles of plywood companies engaged in this study (Companies A, B and C were based in
Indonesia, and D and E in Malaysia)
Company
Unit A B C D E
Monthly log input m3 11,322 15,314 21,164 40,000 24,849
Monthly plywood production m3 6,702 10,495 11,249 22,272 15,042
Co-products Blockboard, veneer
Blockboard, lamineboard
Blockboard, Veneer
LVL Veneer
Electricity National grid
Co-generation
- - -
Coal power plant
- - -
Table 11. LCI Inputs to produce a unit (one cubic meter) of plywood
Company
Unit A B C D E
Inputs Raw materials Log m3 1.69 1.46 1.88 1.84 1.76
Resin: Urea formaldehyde kg 134 103 73 66 83
Hardener kg 17 11 10 11 17
Energy/Water Electricity – grid kWh 16.0 9.7 150.9 17.7 92.0
Electricity – co-generation kWh - - - 264.3 46.0
Electricity – coal kg 44.7 38.1 - - -
Diesel litre 0.135 0.130 0.941 5.635 5.790
22
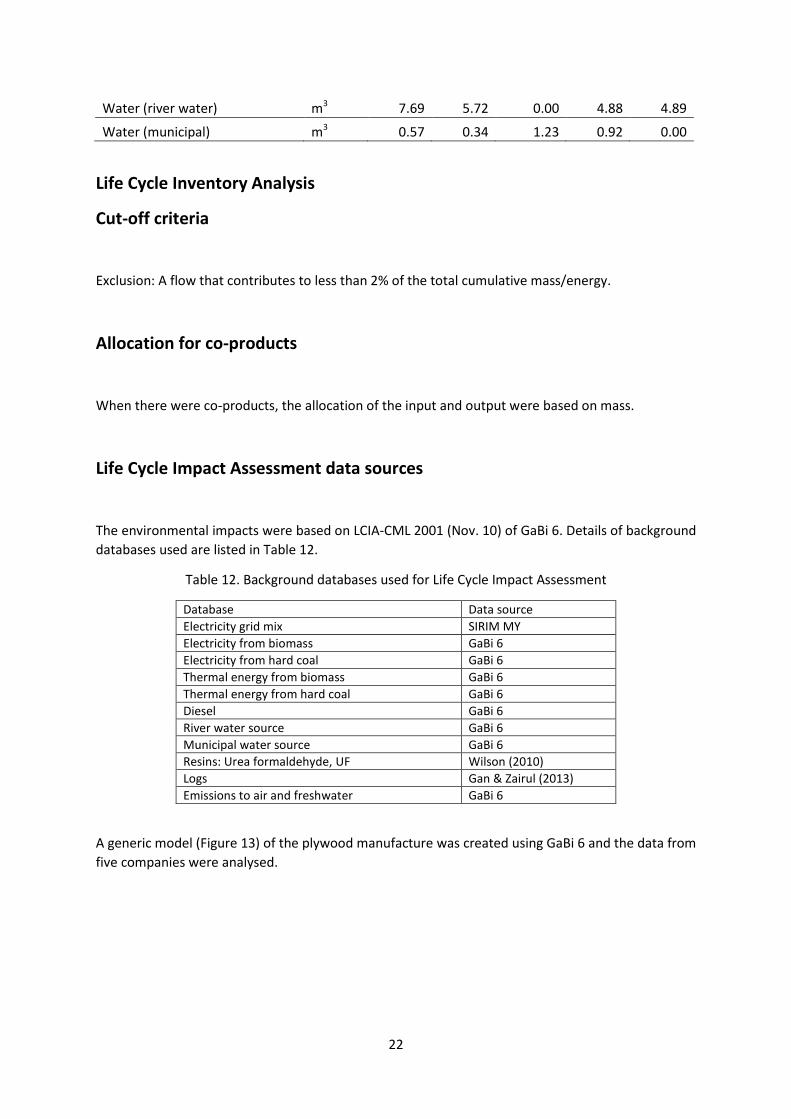
Water (river water) m3 7.69 5.72 0.00 4.88 4.89
Water (municipal) m3 0.57 0.34 1.23 0.92 0.00
Life Cycle Inventory Analysis
Cut-off criteria
Exclusion: A flow that contributes to less than 2% of the total cumulative mass/energy.
Allocation for co-products
When there were co-products, the allocation of the input and output were based on mass.
Life Cycle Impact Assessment data sources
The environmental impacts were based on LCIA-CML 2001 (Nov. 10) of GaBi 6. Details of background
databases used are listed in Table 12.
Table 12. Background databases used for Life Cycle Impact Assessment
Database Data source
Electricity grid mix SIRIM MY
Electricity from biomass GaBi 6
Electricity from hard coal GaBi 6
Thermal energy from biomass GaBi 6
Thermal energy from hard coal GaBi 6
Diesel GaBi 6
River water source GaBi 6
Municipal water source GaBi 6
Resins: Urea formaldehyde, UF Wilson (2010)
Logs Gan & Zairul (2013)
Emissions to air and freshwater GaBi 6
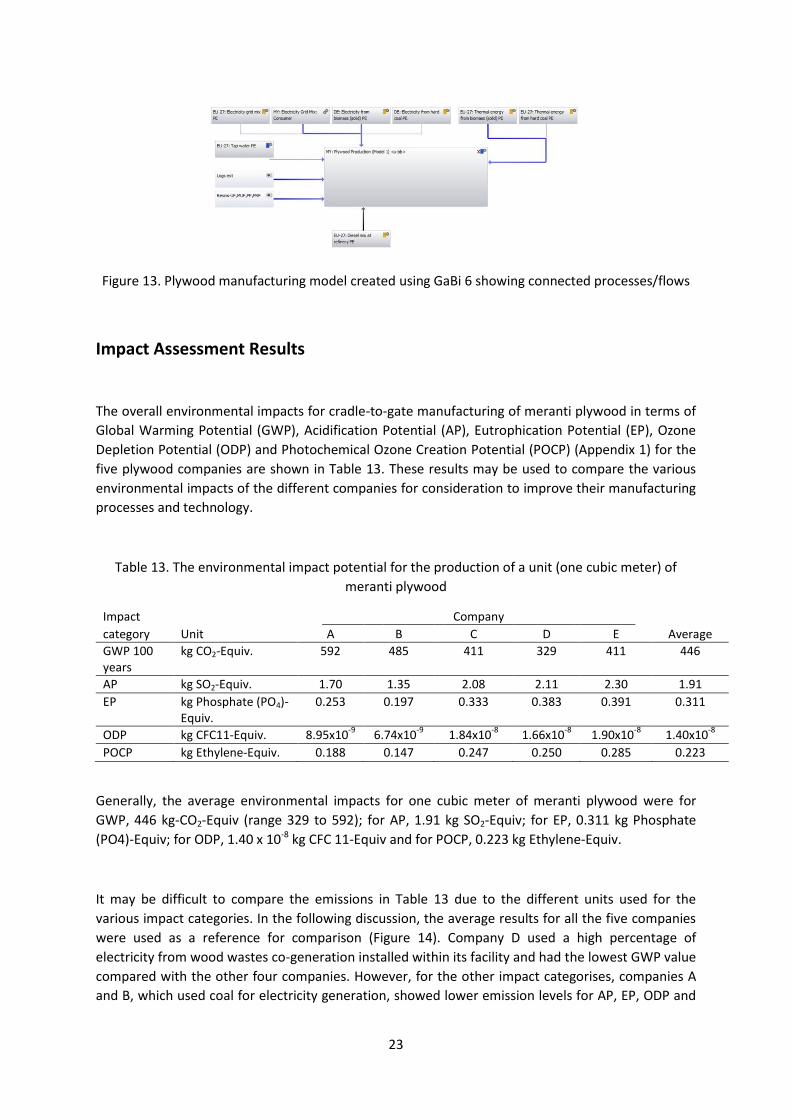
A generic model (Figure 13) of the plywood manufacture was created using GaBi 6 and the data from
five companies were analysed.
23
Figure 13. Plywood manufacturing model created using GaBi 6 showing connected processes/flows
Impact Assessment Results
The overall environmental impacts for cradle-to-gate manufacturing of meranti plywood in terms of
Global Warming Potential (GWP), Acidification Potential (AP), Eutrophication Potential (EP), Ozone
Depletion Potential (ODP) and Photochemical Ozone Creation Potential (POCP) (Appendix 1) for the
five plywood companies are shown in Table 13. These results may be used to compare the various
environmental impacts of the different companies for consideration to improve their manufacturing
processes and technology.
Table 13. The environmental impact potential for the production of a unit (one cubic meter) of
meranti plywood
Impact
Company category Unit A B C D E Average
GWP 100 years
kg CO2-Equiv. 592 485 411 329 411 446
AP kg SO2-Equiv. 1.70 1.35 2.08 2.11 2.30 1.91
EP kg Phosphate (PO4)-Equiv.
0.253 0.197 0.333 0.383 0.391 0.311
ODP kg CFC11-Equiv. 8.95x10⁻⁹
6.74x10⁻⁹
1.84x10⁻⁸
1.66x10⁻⁸
1.90x10⁻⁸
1.40x10⁻⁸
POCP kg Ethylene-Equiv. 0.188 0.147 0.247 0.250 0.285 0.223
Generally, the average environmental impacts for one cubic meter of meranti plywood were for
GWP, 446 kg-CO2-Equiv (range 329 to 592); for AP, 1.91 kg SO2-Equiv; for EP, 0.311 kg Phosphate
(PO4)-Equiv; for ODP, 1.40 x 10⁻⁸ kg CFC 11-Equiv and for POCP, 0.223 kg Ethylene-Equiv.
It may be difficult to compare the emissions in Table 13 due to the different units used for the
various impact categories. In the following discussion, the average results for all the five companies
were used as a reference for comparison (Figure 14). Company D used a high percentage of
electricity from wood wastes co-generation installed within its facility and had the lowest GWP value
compared with the other four companies. However, for the other impact categorises, companies A
and B, which used coal for electricity generation, showed lower emission levels for AP, EP, ODP and
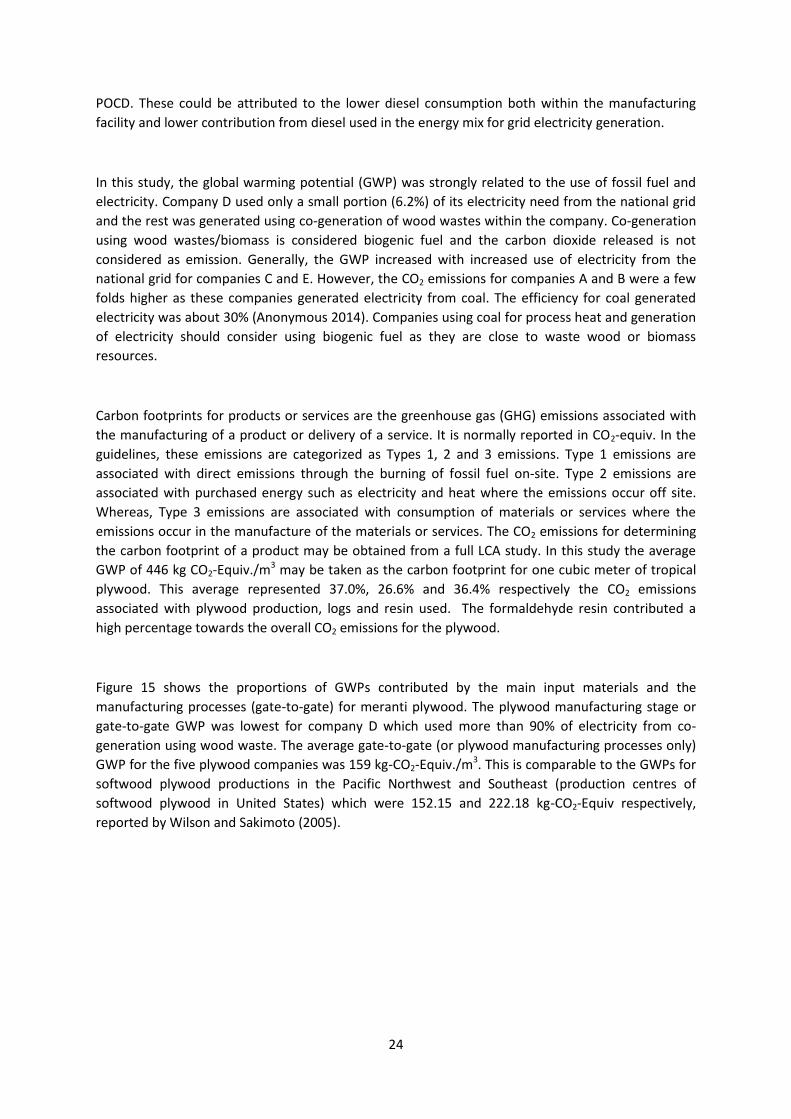
24
POCD. These could be attributed to the lower diesel consumption both within the manufacturing
facility and lower contribution from diesel used in the energy mix for grid electricity generation.
In this study, the global warming potential (GWP) was strongly related to the use of fossil fuel and
electricity. Company D used only a small portion (6.2%) of its electricity need from the national grid
and the rest was generated using co-generation of wood wastes within the company. Co-generation
using wood wastes/biomass is considered biogenic fuel and the carbon dioxide released is not
considered as emission. Generally, the GWP increased with increased use of electricity from the
national grid for companies C and E. However, the CO2 emissions for companies A and B were a few
folds higher as these companies generated electricity from coal. The efficiency for coal generated
electricity was about 30% (Anonymous 2014). Companies using coal for process heat and generation
of electricity should consider using biogenic fuel as they are close to waste wood or biomass
resources.
Carbon footprints for products or services are the greenhouse gas (GHG) emissions associated with
the manufacturing of a product or delivery of a service. It is normally reported in CO2-equiv. In the
guidelines, these emissions are categorized as Types 1, 2 and 3 emissions. Type 1 emissions are
associated with direct emissions through the burning of fossil fuel on-site. Type 2 emissions are
associated with purchased energy such as electricity and heat where the emissions occur off site.
Whereas, Type 3 emissions are associated with consumption of materials or services where the
emissions occur in the manufacture of the materials or services. The CO2 emissions for determining
the carbon footprint of a product may be obtained from a full LCA study. In this study the average
GWP of 446 kg CO2-Equiv./m3 may be taken as the carbon footprint for one cubic meter of tropical
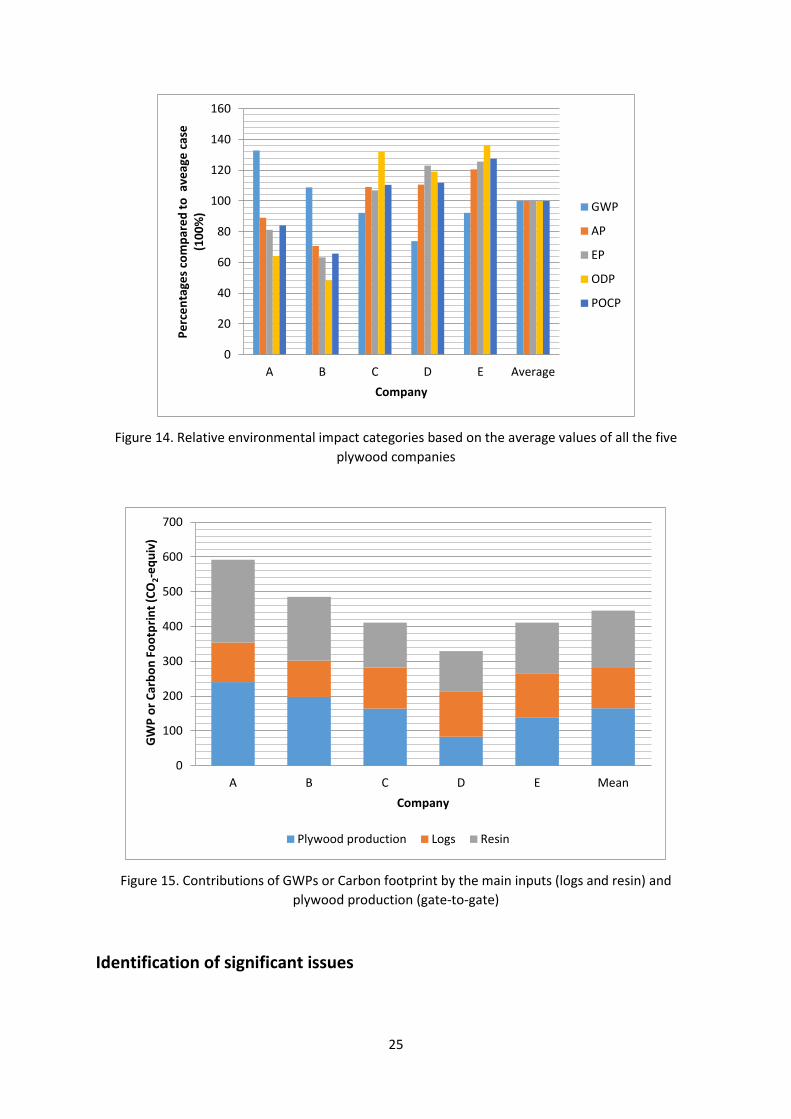
plywood. This average represented 37.0%, 26.6% and 36.4% respectively the CO2 emissions
associated with plywood production, logs and resin used. The formaldehyde resin contributed a
high percentage towards the overall CO2 emissions for the plywood.
Figure 15 shows the proportions of GWPs contributed by the main input materials and the
manufacturing processes (gate-to-gate) for meranti plywood. The plywood manufacturing stage or
gate-to-gate GWP was lowest for company D which used more than 90% of electricity from co-
generation using wood waste. The average gate-to-gate (or plywood manufacturing processes only)
GWP for the five plywood companies was 159 kg-CO2-Equiv./m3. This is comparable to the GWPs for
softwood plywood productions in the Pacific Northwest and Southeast (production centres of
softwood plywood in United States) which were 152.15 and 222.18 kg-CO2-Equiv respectively,
reported by Wilson and Sakimoto (2005).
25
Figure 14. Relative environmental impact categories based on the average values of all the five
plywood companies
Figure 15. Contributions of GWPs or Carbon footprint by the main inputs (logs and resin) and
plywood production (gate-to-gate)
Identification of significant issues
0
20
40
60
80
100
120
140
160
A B C D E Average
Pe
rce
nta
ges
com
par
ed
to
ave
age
cas
e
(10
0%
)
Company
GWP
AP
EP
ODP
POCP
0
100
200
300
400
500
600
700
A B C D E Mean
GW
P o
r C
arb
on
Fo
otp
rin
t (C
O2-
eq
uiv
)
Company
Plywood production Logs Resin
26
The environmental impact in terms of GWP was strongly associated with the use of input materials
(logs and resin), electricity and diesel. Consumption of logs per unit plywood or recovery influenced
the GWP associated with log extraction and transportation to the logyard. At the gate-to-gate stage
the GWP was greatly influenced by the thermal and electricity use. For companies using co-
generation from wood waste, the GWPs were increasingly lower as the percentage of electricity
from co-generation increased. For companies using coal generated electricity, the environmental
load, particularly GWP value, may be more than double.
For other environmental impact categories, the lower consumption of diesel per unit production had
led to lower EP, AP, ODP and POCP.
Conclusion
Life Cycle Assessment was used to evaluate the environmental performance of meranti plywood
made using tropical timber harvested from sustainably managed forest and urea-formaldehyde
resin. The results are representative of the selected export orientated plywood companies in
Indonesia and Malaysia. The company profiles differ due to specific practices such as capacity,
recovery, co-products, co-generation and fuel used. The study reveals that the main sources of
environmental impacts are raw material consumptions and electrical energy sources. To improve the
environmental performance of meranti plywood, companies could:
i) improve the recovery of log input
ii) conduct co-generation using biomass for thermal and electricity needs in the
manufacturing process
iii) use optimum amounts of resin for the targeted quality
iv) improve material flow in the manufacturing process to reduce internal transportation.
This may be adjusted for Environmental Product Declaration use based on the selected scheme or
Product Category Rules.

27
Bibliography
Anonymous. 2014. Coal Matters—Coal and Electricity Generation. 6 pp. World Coal Organisation
webpage www.worldcoal.org Downloaded on 3 January 2014.
BS EN 15804:2012. Sustainability of construction works – Environmental product declarations – Core
rules for the product category of construction products. BSI Standards Publication
GaBi 6. PE: GaBi 6 software-System and database for Life Cycle Engineering. Copyright. TM.
Stuttgart, Echterdingen 1992-2014. Retrieved from www.gabi-software.com
Gan K.S. & Zairul Amin R. 2013. LCA on the extraction of logs from hill forest in Peninsular Malaysia.
FRIM (un-published report)
IBU, 2009. Institut Bauen und Umwelt e.V., PCR Wood Materials. Rules for Environmental Product
Declarations (November 2009)
ISO 14021: 1999. Environmental labels and declarations—Self-declared environmental claims (Type
II environmental labelling). International Organisation for Standardisation (ISO), Geneva. 23 pp.
ISO 14024: 1999. Environmental labels and declarations—Type I environmental labelling—Principles
and procedures. International Organisation for Standardisation (ISO), Geneva. 11 pp.
ISO 14025: 2006. Environmental labels and declarations—Type III environmental declarations—
Principles and procedures. International Organisation for Standardisation (ISO), Geneva. 25 pp.
ISO 14040, 2006. Environmental management – life cycle assessment – Principles and framework.
International Organisation for Standardisation (ISO), Geneva. 32 pp.
ISO 14044, 2006. Environmental management – life cycle assessment – Requirements and
guidelines. International Organisation for Standardisation (ISO), Geneva. 46 pp.
Murphy, R.J. 2004. Pre-project report—Review of information on Life Cycle Analysis of Tropical
Timber Products. International Tropical Timber Organisation. 65 pp.
PAS 2050:2011. Specification for the assessment of the life cycle greenhouse gas emission of goods
and services. Retrieved from BSI – British Standards Institution webpage on 5 September 2013.
SIRIM MY. Life Cycle Inventory (LCI) Datasets of Electricity Grid Mix. SIRIM Berhad.
Wilson, J.B. & Sakimoto, E.T. 2005. Gate-to-gate life-cycle inventory of softwood plywood
production. Wood and Fiber Science (37): 58—73.
Wilson, J.B. 2010. Life-cycle inventory of formaldehyde-based resins used in wood composites in
terms of resources, emissions, energy and carbon. Wood and Fiber Science (42):125—143.
28
Appendix 1
Environmental Impact Categories
The five environmental impact categories reported are:
i. Global Warming Potential (GWP)
Greenhouse gas effect is a natural mechanism where reflected infrared radiation is absorbed by
greenhouse gases in the troposphere and is re-radiated in all directions, including back to earth. This
results in a warming effect on the earth surface. An increase in greenhouse gases from
anthropogenic activities will enhance the warming effect. Greenhouse gases are carbon dioxide,
methane, nitrous oxide, sulphur hexafluoride, nitrogen trifluoride, perfluorocarbons and
hydrofluorocarbons. The global warming potentials of these gases are calculated in terms of carbon
dioxide equivalents.
ii. Acidification Potential (AP)
Transformation of air pollutants such as sulphur dioxide and nitrogen oxide into acids will lead to a
decrease in the pH-value of rainwater. This acidification will damage the ecosystems. The
acidification potential is given in sulphur dioxide equivalents (SO2-Eq).
iii. Eutrophication Potential (EP)
Eutrophication is the enrichment of nutrients in aquatic or terrestrial media. In water, it accelerates
the growth of algae that may cause a reduction of oxygen concentration in water that eventually
destroy the eco-system. In soil, it is known to affect plant health and stability. The eutrophication
potentials are calculated in phosphate equivalents.
iv. Ozone Depletion Potential (ODP)
Ozone layer in the stratosphere is created by the disassociation of oxygen atoms that are exposed to
short-wave UV-light. Ozone absorbs the short-wave UV-radiation and releases it in longer wave-
lengths. Only a small proportion of short-wave UV-radiation reaches the earth. This is essential for
life on earth. Anthropogenic emissions that deplete ozone are categorized into two groups: those
that are due to the fluorine-chlorine-hydrocarbons (CFCs) and those due to the nitrogen oxides
(NOx). In this study, the ozone depletion potentials are calculated from the different ozone relevant
substances and reported in CFC 11 equivalents.
v. Photochemical Ozone Creation Potential (POCP)
Photochemical ozone production is also known as summer smog which may damage vegetation and
materials. High concentrations of ozone are also toxic to humans. In LCA, photochemical ozone
creation potentials (POCPs) are quantified in terms of ethylene-equivalents.