report name: research study on food preferences of mature
TRANSCRIPT
THIS REPORT CONTAINS ASSESSMENTS OF COMMODITY AND TRADE ISSUES MADE BY USDA STAFF AND NOT NECESSARILY STATEMENTS OF OFFICIAL U.S. GOVERNMENT POLICY
Voluntary Report – Voluntary - Public Distribution Date: January 08, 2021
Report Number: HK2021-0003
Report Name: Research Study on Food Preferences of Mature Consumers
Country: Hong Kong
Post: Hong Kong
Report Category: Agriculture in the News, Agriculture in the Economy, Market Development Reports
Prepared By: Caroline Yuen
Approved By: Alicia Hernandez
Report Highlights:
In view of the growing aging population in Hong Kong and its potent purchasing power, ATO Hong
Kong commissioned market research on the food preferences of mature consumers through a public
tendering process in 2020. The study was completed in late 2020. This GAIN report provides U.S.
exporters with the findings, which include: the population of the mature/well-off consumers, market size
of the target group’s food consumption, the top ten most wanted products, the perceived
merits/shortcomings of U.S. products, competition, effective marketing channels, dining preferences,
etc. The first page of this report is a one-page summary of the key findings.

[A VIRTUAL PRESENTATION ON THE RESEARCH STUDY IS AVAILABLE AT THIS LINK]


TABLE OF CONTENTS
ItemPage No.
Source: Hong Kong Census and Statistics Department ......................................................... 4

1
1. Background
The U.S. Agricultural Trade Office (ATO) is one of the many overseas offices of the Foreign
Agricultural Service (FAS), an agency of the U.S. Department of Agriculture (USDA). The
ATO in Hong Kong works closely with importers, wholesalers, retailers, and other trade
promotion organizations to increase the sale of U.S. food and agricultural products in Hong
Kong and Macau.
In line with the global trend, Hong Kong is becoming an aging society. The population of
elderly people aged 60 or above will reach 2,635,000 (33.1% of 7,964,000) by 20301, up from
1,971,500 (26.3% of 7,509,200) in 20202. A third of the Hong Kong population will be elderly
in Hong Kong. This structural shift of the population will change the form of the labor market,
impact the economy, and burden social welfare. On the other hand, this emerging market also
brings new opportunities to businesses.
In the area of Consumer-Oriented Agricultural Products, the United States is the most important
supplier to Hong Kong, representing 16% (US$ 3.2 billion) of total value (US$ 19.5 billion) in
20193.
In past studies, U.S. food products were perceived as high-quality, and they were popular among
affluent Hong Kong consumers. If U.S. exporters are interested in the mature consumer market,
they should first explore the opportunity in the affluent segment as well.
In previous studies, the ATO identified certain U.S. products with the best prospects in the Hong
Kong market4. Meanwhile, the preference of mature, well-off consumers may not be the same as
general consumers. More information should be collected for U.S. suppliers to understand this
segment.
Therefore, a research study was initiated by the ATO with the aim to study Hong Kong residents
who are 60 years of age or above and have mid-to-high levels of monthly household income,
HK$50,000 (US$ 6,410) or above. Consumers over 60 years of age are referred to as mature for
the purposes of this report.
The ATO commissioned Consumer Search Group (CSG), a market research agency in Hong
Kong, to design and execute the research study to identify the top U.S. food product types with
the best prospects in the Hong Kong domestic market for mature, well-off consumers. The result
will provide market intelligence to U.S. exporters.
1 Hong Kong Population Projections 2017-2066, Census and Statistics Department, September 2017 2 Population by Age Group and Sex, Population Estimates, Census and Statistics Department 3 “Highly Competitive Retail Sector Remains Stable” ATO Hong Kong, Market updates, July 2019. 4 “Best Prospects Analysis for U.S. Agricultural Exports to Hong Kong, “ATO Hong Kong, Market updates, June 2019

2
This report presents the findings and serves as a reference for U.S. exporters who are interested
in exploring the food market among mature, well-off consumers in Hong Kong.
2. Research Methodology
This study was conducted in two stages. The quantitative study (Survey) collected data about
purchasing behavior, food preferences, and spending among the mature well-off consumers.
Qualitative study (Focus Group Discussion) helped understand the selection process, consumers’
perception, beliefs and values regarding food products from the U.S. and other origins.
2.1 Target Respondents
Target respondents for this research study included those who:
- Are 60 years of age or older;
- Have a monthly household income of HK$50,000 (US$ 6,410) or above;
- Purchase food for themselves or family at least once a week;
- Purchased food on the survey day
2.2 Data Collection Method
2.2.1 Quantitative Stage - Face-to-face Interview
The questionnaire was designed by CSG and approved by the ATO. The questionnaire was
programmed and installed on tablet computers for data collection in the locations listed in
Appendix II of this report. Each interview lasted for around 15 minutes.
Five hundred successful interviews were conducted from August 24 to September 3, 2020. To
ensure the sample is representative of the target group, sample quotas were set according to age,
gender, and geographical distribution (i.e. Hong Kong Island, Kowloon, New Territories) in the
government population data:
Table 1: Sample Size and Sample Quota
Resident area Sample Age group
60+
Sample Gender (Age
60+)
Sample
Hong Kong
Island
28.0%
(140)
60-69 53.6%
(268)
Male 47.4%
(237)
Kowloon 26.0%
(130)
70+ 46.4%
(232)
Female 52.6%
(263)
New
Territories
46.0%
(230)
Source: Hong Kong Census and Statistics Department

3
2.2.2 Qualitative Stage - Focus Group
The purpose of the focus group was to identify and understand the selection process, consumers’
perception, beliefs and values regarding food products. In addition, the result could support and
help explain the results of the quantitative survey with respondents’ real examples and verbatim.
Two sessions of a mini-focus group, each lasting for 90 minutes, were conducted on September
18, 2020. The flow of discussion followed the pre-set discussion guide. Each group consisted of
four respondents. The two focus groups were hosted by the project manager of this research
study.

4
3. Research Findings
3.1 The Market Size of Mature Well-off Food Consumers
According to the Census and Statistics Department, there were 1,778,600 Hong Kong residents
aged 60 or above at the end of year 2019, and 337,100 (19.0%) of them lived in households with
monthly income of HK$ 50,000 or above.
Table 2: Population aged 60 and above in domestic household by monthly household
income Monthly household income (HK$) Population aged
60+ in 2019 Percentage
<10,000 483 400 27.2%
10,000-19,999 343 200 19.3%
20,000-29,999 270 600 15.2%
30,000-39,999 202 100 11.4%
40,000-49,999 142 100 8.0%
50,000-59,999 100 900 5.7%
≥60,000 236 200 13.3%
Overall 1 778 600 100.0%
Source: Hong Kong Census and Statistics Department
To make the market size estimation for this segment, food purchase data was collected from
these mature, well-off consumers in the survey. These included data about the food items
purchased on the survey day, as well as the spending amount and the country of origin of the
food items based on information available and the consumer’s knowledge.
The spending records estimate that mature, well-off consumers spend US$ 1.7 billion (HK$ 13.2
billion) on consumer food purchases in a year. The technical details for this estimation are
shown as in Appendix I.
At the end of 2019, there were 7,520,8005 residents in Hong Kong. Therefore, the population
size of mature, well-off consumers (337,100) is 4.5% of population, while their spending
comprises of 13.4% of food and beverage retail sales in Hong Kong (US$ 12.7 billion in 2019)6.
5 Population by Age Group and Sex, Population Estimates, Census and Statistics Department 6 Retail Foods, Foreign Agricultural Services, U.S. Department of Agriculture, 26 June, 2020.

5
3.2 Characteristics of Mature, Well-off Consumers
I. Mature, well-off consumers are sophisticated
The mature, well-off consumers were well-educated compared to other members of their
generation. One-eighth (12.6 %) of the mature, well-off consumers were tertiary or university
students. This was far more than the proportion of university students in their generation (4.6%
for male and 1.9 % for female in 19767). The share of tertiary graduates was higher among the
highest income group (HK$70,000 or above) (28.4%), and younger group (Aged 60-69) (17.9%).
Table 3: The Education Levels of the Respondents
Monthly Household Income (HK Dollars)
Age Gender
Total 50-59k 60-69k 70K + 60-69 70+ M F Base: 500 206 185 109 268 232 237 263
Primary 14.0 20.4 12.4 4.6 2.2 27.6 11.4 16.3 Secondary 64.0 64.1 69.2 55.0 64.9 62.9 57.8 69.6 Vocational school 9.4 6.8 10.8 11.9 14.9 3.0 11.8 7.2 Tertiary/University 12.6 8.7 7.6 28.4 17.9 6.5 19.0 6.8
Source: CSG Survey Question: What is your highest education level?
The majority of the mature, well-off consumers were retired. Less than a fifth (17.8%) of them
were still working. Among them, nearly half of them (47.2%) were in a manager or above
position. Only 16.9% were either clerical staff or unskilled workers.
Table 4: Work status
Base: All respondents 500 Base: working population 89
Work Full-time 10.0
Owner/Director or above 20.2
Work Part-time 7.8 Senior Management 7.9
Unemployed 0.4 Manager 19.1
Non-working (Housewives /
retired)
81.8 Professional staff 16.9
Clerical staff 6.7
Technical staff 18.0
Unskilled worker 11.2
Source: CSG Survey Question: Do you have a job now? Are you …? What is your occupation?
7 A Graphic Guide on Hong Kong’s Development (1967-2007), Census and Statistics Department, 2008.

6
II. Mature, well-off consumers are influential on food purchases
Mature, well-off consumers purchased food for themselves as well as their family. The majority
of respondents were living with their children who were of working age, and some even lived
with their grandchildren and in-laws. They were responsible for dining matters and concerned
about their food preference and health matters. Therefore, the mature, well-off consumers had
significant influence on the food expenses for their family.
Table 5: The Family Member(s) the Respondents Live With
Member Total No. of co-
living member
Total Other aged 60 +
members
Total
Base: 500 500 500 Spouse 89.8 1 member
4.0 None aged 60+ 19.0
Children 85.4 2 members 19.6 1 member 80.2 Grandchildren 41.0 3 members 26.8 2 members 0.8 In-laws 45.2 4 members 24.2 Parents 0.4 5 members 20.4 6 members 4.4 7 members 0.6 Mean 3.5 Mean 0.8
Source: CSG Survey Question: What family members are you living with? How many members in your household? Is the household member aged over 60?
Some verbatim responses from Questionnaire:
- “I share all foodstuffs with my family members. I am the key person of food purchase. I will
buy a variety of food, such as fish, chicken, pork, beef, lamb, etc. I take turns to eat them. For
each meal, eating vegetables is a must, at least one kind of meat, usually 2 kinds of different
meat.” (Group Male, Aged 64)
- “We have 2 babies at home, so I will be careful in food selection. Foods sometimes contain
chemicals which are harmful to health. Therefore, I will check the origin. There are also
additives. Children will become hyperactive if they intake too much.” (Group 2, Female, Aged
64)

7
III. Mature, Well-off Consumers are Not Conservative
Mature, well-off consumers are not conservative in their food selections. As most of them were
retired and living in well-off families, they wanted to experience new and high-quality food for
enjoyment.
Some verbatim responses from Questionnaire:
- “We are old now, why not just eat as we can eat, why not try new things that we can afford?”
(Group 2, Female, Aged 64)
- “I always want to try new things, if there are choices. For example, I tried Japanese last
time and I haven’t tried Australian before. I want to try Australian no matter it is good or not.”
(Group 2, Male, Aged 64)
- “Some food seems delicious, then I will try. If we see that the packages of the imported fruits
are nice, I will buy some for trial. The most important thing is clean and tidy.” (Group 2,
Female, Aged 60)
- (Respondent) “As it is a new product then I buy it to try.” (Moderator) “Fig is a new fruit?”
(Respondent) “Yes it’s new. It is a new way for eating it freshly. I used to eat dried fig when I
made soup.” (Group 1, Male, Aged 71)
IV. Mature, Well-off Consumers are Health-conscious
Mature, well-off consumers are health-conscious and some of them suffer from certain kinds of
illnesses. Vegetables and fish are common in their diets.
Some verbatim responses from Questionnaire:
- “We concern about health. My wife became a vegetarian and the foods are mainly cooked from
her. Therefore, I eat less meat.” (Group 1, Male, Aged 63)
- “For each meal, eating vegetables is a must, at least one kind of meat, usually 2 kinds of
different meat. For example, fish and chicken etc. I eat fish the most frequent.” (Group 2, Males,
Aged 64)
- “I also have the problem that many elderly are facing – hyperlipidemia for more than ten years.
I pay attention on the diet. I read the nutrition table at the back of the pack of food, such as the
cholesterol and sugar. I buy olive oil as it is healthier.” (Group 1, Male, Aged 63)

8
3.3 Understanding the Food Purchasing Patterns of Mature Consumers
Although they were retired, more than 60% of mature consumers did not purchase food every
day. Therefore, they accepted certain food items that can be stored for long time, such as frozen
food.
Table 6: Frequency of Food Purchase by Income Age and Gender
Monthly Household Income (HK Dollars)
Age Gender
Total 50-59k 60-69k 70K + 60-69 70+ M F Base: 500 206 185 109 268 232 237 263
More than once in a day
2.8 1.9 2.7 4.6 3.7 1.7 0.4 4.9
Once a day 35.8 37.9 36.8 30.3 39.9 31.0 10.1 58.9 Once in two days
31.0 35.4 28.6 26.6 30.6 31.5 34.2 28.1
More than once a week
30.4 24.8 31.9 38.5 25.7 35.8 55.3 8.0
Source: CSG Survey Question: How frequent do you purchase food for you and your family?
Some verbatim responses from Questionnaire:
- “I love storing the foods at home. When they are out of stock, I buy it if I pass by. There is not a
regular frequency for shopping.” (Group 1, Male, Aged 65)
- “I usually buy 1-2 times a week. Foods can be bought conveniently in supermarket and can be
put in the fridge for long time.” (Group 2, Female, Aged 60)
- “To me, chilled food is totally not a problem. Therefore, the food in selling in supermarkets is
the most suitable for me. The foods are packed in a package and I will put it in the
refrigerator.” (Group 2, Male, Aged 64)

9
From the food purchase data collected in the survey, the respondents spent an average of
HK$260 on the day they purchased food. More was spent among the higher income group.
Those having a monthly household income of HK$ 70,000 or above spent on average HK$ 409.4
on the day they purchased food.
Table 7: The spending of the respondent’s food purchase in the survey day
Monthly Household Income
(HK Dollars)
Age Gender
Total 50-59k
60-69k
70K + 60-69
70+ M F
Base: 500 206 185 109 268 232 237 263 HK$100 - HK$199 44.6 59.2 43.2 19.3 41.4 48.3 51.5 38.4 HK$200 - HK$299 30.6 28.6 35.1 26.6 32.1 28.9 25.3 35.4 HK$300 - HK$499 18.6 11.2 18.9 32.1 18.7 18.5 18.1 19.0 HK$500 - HK$999 5.2 1.0 2.7 17.4 6.7 3.4 3.8 6.5 HK$1,000 or above 1.0 - - 4.6 1.1 0.9 1.3 0.8
Mean HK$ 260.6 202.7 238.0 409.4 272.1 247.8 271.5 247.1 Source: CSG Survey Question: We are interested in your most recent food purchase (excl. dining-out and take-out food). Could you please show me what you have bought today? Apart from these, have you bought any other food today? Will you buy any other food?
The popular types of food that the mature food consumers spent the highest amount on are listed
in Table 8.
Regarding their spending on items, the highest was observed on fish and seafood (HK$ 69.5
spent per consumer), followed by pork (HK$ 33.7), and fresh fruit (HK$ 28.0).
On average, each consumer purchased more than one item of vegetables (1.07 items), more than
two-thirds (0.69 item) of consumers purchased fish and seafood, and more than half purchased
fresh fruit (0.59 item).
Despite the relatively high spending on beef (HK$ 21.9) and poultry (HK$ 20.4), the number of
items purchased (0.19 and 0.25 item respectively) were significantly less than pork (0.44 item).
Table 8: Averaged spending per consumer vs. item purchased per consumer
Total Base: 500
Food types Spending per
consumer (HK$) # No. of Item purchased
per consumer ^ Fish & seafood 69.5 0.69 Pork & pork products 33.7 0.44 Fresh fruits 28.0 0.57 Fresh vegetables 24.4 1.07 Beef & beef products 21.9 0.19 Poultry & poultry products 20.4 0.25 Food prep (Pasta, cereal, soup) 11.9 0.27 Wine and beer 10.9 0.10
Dried seafood 7.0 0.02

10
Cereal 4.9 0.06 Oil and fat 4.1 0.05 Dairy products 4.0 0.07 Non-alcoholic beverage 3.7 0.10 Egg 2.8 0.09 Condiment and sauce 2.5 0.06
Source: CSG Survey Question: We are interested in your most recent food purchase (excl. dining-out and take-out food). Could you please show me what you have bought today? Apart from these, have you bought any other food today? Will you buy any other food? # Spending per consumer = Spending of all respondents / 500 ^ No. of Item purchased per consumer = No. of items purchased by all respondents / 500
Among these popular food items, the data shows the spending on fish and seafood (HK$ 52.0
HK$ 105.5), fresh fruits (HK$ 22.7 HK$ 49.8), and beef & beef products (HK$17.5
HK$37.9), increase with the higher income of the consumers. While the spending on pork, fresh
vegetables, and poultry were less sensitive to increasing income groups.
Table 9: Average Spending Per Consumer by Each Product Type (HK$) (Top 15)
(Hong Kong Dollar)
Monthly Household Income
(HK Dollars)
Age Gender
Total 50-59k
60-69k
70K + 60-69
70+ M F
Base: 500 206 185 109 268 232 237 263 Food types Spending per consumer (HK$) # Fish & seafood 69.5 52.0 67.6 105.5 72.8 67.5 71.2 65.6 Pork & pork products 33.7 31.0 33.3 39.4 34.8 25.6 41.0 32.5 Fresh fruits 28.0 22.7 21.0 49.8 30.2 25.8 29.9 25.4 Fresh vegetables 24.4 21.4 25.6 28.2 25.3 20.2 28.2 23.4 Beef & beef products 21.9 17.5 17.3 37.9 25.6 24.1 19.9 17.5 Poultry & poultry products
20.4 11.8 29.6 21.2 17.2 18.9 21.7 24.2
Food prep (Pasta, cereal, soup)
11.9 12.1 9.5 15.4 11.2 12.9 10.9 12.7
Wine and beer 10.9 6.2 7.9 24.9 13.6 16.6 5.8 7.8 Dried seafood 7.0 0.6 0.2 30.9 5.5 6.5 7.6 8.8 Cereal 4.9 6.5 2.1 6.6 5.6 5.0 4.9 4.1 Oil and fat 4.1 4.4 3.0 5.4 4.8 4.7 3.5 3.3 Dairy products 4.0 2.9 3.6 6.5 4.3 3.3 4.5 3.6
Source: CSG Survey Question: We are interested in your most recent food purchase (excl. dining-out and take-out food). Could you please show me what you have bought today? What was the price of the food items, and what are their origin? # Spending per consumer = Spending of all respondents / 500

11
3.4 Market Size of Target Group’s Consumption of U.S. Foods
CSG’s research suggested that 7.7% of the food purchased by the mature, well-off consumers
originated from the United States, which was ranked as the fourth most important source of food
for mature, well-off food purchasers. As the estimated market size of mature well-off,
consumers was US$ 1.698 billion (HK$ 13.2 billion) per year, they spent US$ 130.8 million
(HK$ 1.019 billion) for U.S. food in a year.
Table 10: Estimation of the food purchase share by their country of origin (Top 10)
Country of origin Share of spending on food purchase (%)
Share of spending on imported food purchase (%)
Mainland China 26.3 35.1 Hong Kong 19.8 - Japan 11.7 15.6 United States 7.7 10.3 Australia 7.2 9.5 France 3.0 3.9 Thailand 2.9 3.9 New Zealand 2.3 3.0 Canada 1.4 1.9 Netherlands 1.2 1.5 Taiwan 1.0 1.4
Source: CSG Survey Question: We are interested in your most recent food purchase (excl. dining-out and take-out food). Could you please show me what you have bought today? What was the price of the food items, and what are their origin.
The share of food from Mainland China was high among mature, well-off consumers because
they required fresh items in their diet, especially vegetables and fish and seafood. Therefore,
they needed to buy local food or food imported from mainland China, although they sometimes
hesitated about the safety of foods from mainland China.
Some verbatim responses from Questionnaire:
- “You cannot avoid buying fresh vegetables because it is a must-have item in a meal.” (Group 2,
Female, Aged 64)
- “If you want fresh meat, you only can choose from Hong Kong or China. We cannot only eat the
frozen meat from other countries.” (Group 1, Male, Aged 71)
- “If I make soup at home, I must use fresh meat e.g. pork and shank from China.” (Group 1,
Male, Aged 71)

12
3.5 Share of Spending by Food Types and Opportunity
Regarding the share of U.S. imports among various types of food, U.S. nuts occupied more than
a third (36.1 %) of nuts purchased by mature, well-off consumers, yet the overall spending on
nuts among them was not high.
Instead, U.S. beef occupied around 30% of the consumer’s beef purchase and each consumer
spent a relatively high amount (HK$ 21.9), showing that U.S. beef and its products was an
important food type among mature, well-off consumers.
Wine and beer (11.2%), fresh fruit (9.3%), and poultry (8.9%) from the United States showed a
good share of the mature, well-off market segment, and it would be worthwhile to explore this as
the target consumes’ spending on these food types were high.
Table 11: Top 10 Food Types with a Large Share of U.S. origin vs. Average Spending Per
Consumer
Total Base: 500
Food types U.S. share in food type
(%) ^ Spending per consumer
(HKD) # Nuts 36.1 1.6 Beef & beef products 29.5 21.9 Non-alcoholic beverages 17.4 3.7 Egg 16.5 2.8 Condiment and sauces 12.2 2.5 Wine and beer 11.2 10.9 Juice 10.2 1.1 Fresh fruits 9.3 28.0 Poultry & poultry products 8.9 20.4 Chocolate and Cocoa 8.3 0.9
Source: Question: We are interested in your most recent food purchase (excl. dining-out and take-out food). Could you please show me what you have bought today? Apart from these, have you bought any other food today? Will you buy any other food?
^ U.S. share in food type (%) = $ spent on U.S. origin / $ spent on food from all origins
# Spending per consumer = Spending of all respondents / 500

13
A good amount was spent on pork (HK$ 33.7) (Table 9) per consumer, the share of U.S. pork in
consumers’ pork purchase was low (2.5 %), and it was not in the top ten. As reflected by
consumer’s comments, U.S. pork is not easily available, and its taste is different from the pork
they are used to consuming.
Some verbatim responses from Questionnaire:
- “I sometimes find U.S. pork in supermarkets but there were only a few options” (Group 2,
Female, Aged 64)
- “There are differences between the Chinese pork and U.S. pork. The fresh taste of Chinese pork
is much stronger than U.S. pork, so it is not preferable for making soup.” (Group 1, Female,
Aged 64)
3.6 The Importance of Country of Origin Versus Other Factors in Food Selection
Respondents were asked for their perceived importance of various aspects of food purchasing.
Among all respondents, food safety (92.0%) was the top concern, followed by “Easy to buy”
(72.4%). Price was considered by less than two thirds (66.2%) as important.
Slightly less than half (47.0%) believed the country of origin of the food is an important factor.
Analyzed by income groups, the rating rose from 37.9% among respondents having 50,000 –
59,999 monthly household income, to 62.4% among those more than HK$ 70,000 monthly
household income. This increasing pattern along income levels was also found in the importance
of the portion (30.1% 48.6%), brand (27.7% 54.1%), and nutrition facts (27.2% 45.9%).
To some respondents, the country of origin of food can reflect the safety of the food items.
Table 12: Important Factors for Food Purchase
Source: CSG Survey Question: How do you rate the importance of below factors in food purchases? Please use
a 10 point scale, where 10 represents “Very important” and 1 represents “Not important at all”.
Total Income
50-59k 60-69k 70K +
% of respondents rated important (i.e. 4 or 5 in a 5 point scale)
Food safety 92.0 90.8 92.4 93.6
Easy to buy 72.4 69.4 76.2 71.6
Price 66.2 62.1 75.7 57.8
Shop quality 57.8 45.1 63.2 72.5
Word of mouth 47.0 47.6 49.7 41.3
Origin 47.0 37.9 48.1 62.4
Portion 39.4 30.1 44.3 48.6
Brand 39.0 27.7 42.7 54.1
Nutrition fact 33.8 27.2 34.1 45.9
Package 14.4 10.2 16.8 18.3

14
Some verbatim responses from Questionnaire:
- “If I cannot try the tester in the shop, I can only estimate its quality by its country of origin”
(Group 1, Female Aged 66)
- “Country of origin is important because it is related to food safety. Food nowadays always
contain chemical, plasticizers, etc. Children will become active after eating too much additives.
I have two grandchildren so I will be careful in food selection” (Group 2, Female Aged 64)
3.7 Respondent’s Perception to Various Country of Origin of Food
Customers generally perceived U.S. products as good in quality (81.4% good/very good) and
61.7% believed the food is “Value for money.” The rating was higher than that of New Zealand
(57.0%) and Europe (43.0%) but was slightly lower than Australia (68.0%) and Japan (70.7%).
Higher income groups perceived better value for money of products from the United States and
most of other origins, except for Thailand and mainland China.
Table 13: Perceived to food origin to be “Value for Money”
Total Income
Country of Origin of
Food
“Good Quality” perception
“Value for Money”
perception
50-
59k
60-
69k
70K +
Mainland 24.4 41.3 47.3 41.7 28.6
U.S. 81.4 61.7 50.4 64.9 77.4
Australia 90.7 68.0 59.5 67.7 83.3
New Zealand 85.2 57.0 48.8 61.9 65.2
Brazil 35.1 43.2 36.0 49.0 48.4
Chile 32.7 24.6 19.5 26.9 30.2
Thailand 43.4 45.9 44.4 51.5 39.0
Europe 76.5 43.0 30.2 42.3 69.1
Japan 98.1 70.7 56.2 72.5 94.6 Source: CSG Survey Question: Talking about the country of origin of food, how do you rate their food quality? / Do
you agree their food is “Value for money?” Please use a 5-point scale, where 5 represents “Very good quality” and 1
represents “Very poor quality.”

15
3.8 Top Ten Most Wanted U.S. Food Products
Beef and beef products (88.9%) and fresh fruits (88.5%) were the top two types of foods that the
target consumers respondents would be most likely to buy from the United States. Looking at
each food type, the higher the income group, the more likely the target customers were to buy
U.S. fresh fruits (85.2% 93.1). Similar rises in purchasing intentions with household income
were also observed in nuts (72.7% 92.9%) and fresh vegetables (52.5% 86.2%) categories.
Table 14: The top 10 kinds of food from the U.S. that the target customers are likely to buy
Food types (top 10) Total
Income
50-59k 60-69k 70K +
% of respondents rated likely to buy (i.e. 4 or 5 in
a 5 point scale)
Beef & beef products 88.9 87.5 90.2 88.9
Fresh fruits 88.5 85.2 89.7 93.1
Nuts 79.6 72.7 81.3 92.9
Egg 73.2 70.6 76.2 73.3
Pork & pork products 72.0 66.1 80.0 68.8
Juice 71.3 71.0 71.2 72.7
Poultry & poultry products 66.1 63.3 74.4 60.6
Food prep (Pasta, cereal,
soup)
64.8 55.1 75.6 64.7
Dairy products (incl. milk,
yogurt, butter, cheese)
64.6 51.9 77.3 67.7
Fresh vegetables 64.2 52.5 65.3 86.2 Source: CSG Survey Question: How likely would you purchase [Insert food type] from the U.S. in the future?
Please use a 5-point scale, where 5 represents “Very likely” and 1 represents “Very unlikely.”
3.9 Food Types with the Best Prospects
If the buying intention and existing spending on the food types are considered concurrently, the
prospect of the food type in Hong Kong market can be analyzed by the following two-
dimensional scatter plot. The food types with the best prospects are the types which the target
consumers are spending a high amount, and likely to buy imports from the United States. These
food types are shown in the top-right hand quadrant of the scatter plot as below.

16
Source: Based on responses from CSG Questionnaire
Table 15: Correlation Between the Intention to Buy U.S. Food and Total Spending
Regardless of Country of Origin
Label Beef & beef
products
Pork &
pork
products
Poultry &
poultry
products
Fish &
seafood
Other
meat
products
Likely to buy (%) 88.9 72.0 66.1 56.6 45.3
Spending (HK$) 10,932.6 16,847.9 10,202.8 34,732.9 994.9
Spending (log) 4.0 4.2 4.0 4.5 3.0
Label Nuts Fresh
vegetables
Processed
vegetables
Fresh
fruits
Processed
fruits
Likely to buy (%) 79.6 64.2 37.9 88.5 27.9
Spending (HK$) 818.8 12,202.2 947.6 13,988.7 30.0
Spending (log) 2.9 4.1 3.0 4.1 1.5

17
Label Wine and
beer
Distilled
spirit
Non-alcoholic
beverages
Juice Coffee
Likely to buy (%) 44.0 26.8 34.3 71.3 48.6
Spending (HK$) 5,445.8 1,236.0 1,870.7 557.0 157.9
Spending (log) 3.7 3.1 3.3 2.7 2.2
Label Egg Dairy
products
Condiment
and sauce
Chocolate
and Cocoa
Food
prep
Pet
food
Likely to buy (%) 73.2 64.6 44.4 51.2 64.8 18.2
Spending (HK$) 1,385.8 1,986.5 1,248.7 445.9 5,927.4 97.1
Spending (log) 3.1 3.3 3.1 2.6 3.8 2.0 Source: Based on responses from CSG Questionnaire
3.10 Perceived Merits and Shortcoming of U.S. Products
Generally, U.S. food products were perceived as healthy and safe to consume, with limited use
of pesticides/hormones/additives in growing crops and breeding livestock. Foods were produced
in regulated processes and the quality of products are accredited.
Some verbatim responses from Questionnaire:
- “(Respondent) The standard of American foods is high, and I feel safe to eat. (Moderator)
Compare to European, which standard is higher? (Respondent) Similar with the standard of
European Union. (Group 1, Male, Aged 63)
Among all types of foods, U.S. beef and beef products were better known for their regulated
production and accredited quality.
Some verbatim responses from Questionnaire:
- “I will buy steak imported from USA. The price is fair compared to other countries. Quality is
acceptable.” (Group 2, Male, Aged 64)
- “U.S. Beef are delicious. It has a heavy taste of beef. Good quality” (Group 2, Female, Aged 64)
Regarding shortcomings, apart from its relatively higher price, U.S. food was perceived as having
a lack of freshness due to its long transportation, especially for U.S. vegetables and fish and
seafood products.

18
Verbatim:
- “Freshness and the price are the problems of American-imported vegetables. That is why we
neglect them unless it is stated it is healthier than others.” (Group 1, Male, Aged 71)
- “Fish fillet From USA is not fresh enough. Need more seasoning during cooking” (Group 2,
Male, Aged 64)
The perceived merits and shortcomings of the major food types among the 500 survey
respondents are listed in Table 16 below. The merits that are specific to the food types were
highlighted in blue, and specific shortcomings for the food types were highlighted in red. The
content of marketing communication can be made with reference to these agreed merits. On the
other hand, importers should deal with the shortcomings by improving their product features and
marketing strategy.
Table 16: Merits and Shortcomings of the U.S. Food with the Best Prospects
Merits Shortcomings
Beef & beef products Regulated production process 32.7 Good meat texture 28.1 Nutritious and healthy 26.8 Safe to eat 16.3 Heavy beef flavor 16.3 No hormone used 13.7
Expensive 31.4 Not fresh 3.5 Lack nutritional value 1.2 Worried about cow diseases 1.2
Fresh fruits Nutritious and healthy 53.4 Natural/organic 23.6 No pesticide used 20.3 High quality 16.9 Sweet taste 15.5 Variety of choice 12.2
Expensive 20.3 Long shipping time 4.7 Not fresh 4.7 Not easy to buy 2.0
Pork & pork products Nutritious and healthy 29.4 Regulated production process 22.4 Safe to eat 20.3 No hormone used 20.3 Good meat texture 11.2 Variety to choose 5.6
Expensive 11.9 Not fresh 7.0 Bad meat quality 4.2 Lack nutritional value 2.1 Less meaty flavor 2.1 Long shipping time 1.4
Egg Nutritious and healthy 55.3 Eggs are large in size 33.3 Food safety 22.8 Egg flavor strong 17.1 No hormone used 9.8 Regulated production process 8.1
Expensive 13.0 Light egg flavor 8.1 Not fresh 6.5 Long shipping time 2.4 Hard to buy 1.6 Packaging is easy to be broken 1.6
Nuts Nutritious and healthy 48.6 Nuts are large in size 16.9 Good taste 14.8 Chewy texture 13.4 Regulated production process 12.7 Variety to choose 11.3
Expensive 11.3 Nuts too hard / hurt the teeth 1.4 Not healthy 0.7 Nuts are too salty 0.7
Food prep (Pasta, cereal,
soup)
Nutritious and healthy 35.2 Regulated production process 21.1 Safe to eat 13.3 No pesticide in growing crops 11.7 Variety to choose 9.4 No preservatives added 3.9
Expensive 6.3 Doesn't suit the Chinese taste 1.6 Too much Preservatives 0.8 The portion is too large 0.8 The noodles are too hard 0.8
Dairy products (incl. milk, yogurt, butter, cheese)
Nutritious and healthy 40.2 Quality Assurance 29.1 Safe to eat 22.0 Rich taste 9.4 Natural/organic 7.1 Variety to choose 3.9
Expensive 8.7 Lack nutritional value 3.9 Not fresh 1.6 Short storage period 1.6 Taste is too salty 0.8

19
Poultry & poultry
products
Nutritious and healthy 33.1 No hormone used 30.6 Safe to eat 14.9 Quality Assurance 14.9 Large in size 13.2 Value for money 9.1
Expensive 10.8 Not fresh 7.5 Long shipping time 2.5 Too much hormones 2.5 Bad meat quality 3.3
Fish and Seafood Nutritious and healthy 22.5 Regulated production process 19.4 No pollution / toxin for breeding 15.5 Safe and reliable 12.4 Good meat quality 12.4 Variety to choose 12.4
Not fresh 24.8 Expensive 19.4 Bad meat quality 4.7 Long shipping time 3.9 Lack nutritional value 3.9
Fresh vegetables Nutritious and healthy 49.6 Food safety 46.0 No pesticide used 35.8 Natural/organic 21.9 Fresh produced / delivered 13.1 Safe to eat 13.9
Expensive 17.5 Not fresh 5.8 Long shipping time 2.9 Lack of choices 1.5
Source: The question: Please tell me the merits and shortcomings of the following categories of food from the U.S.
Remarks: Multiple responses. Sum of figures could be more than 100%.
Blue: Specific merits for the food type Red: specific shortcoming for the food type Grey: Common features
3.11 Channels of Food Purchase
Among major distribution channels of food, wet markets (79.2%), ParkNshop / Taste (72.0%),
and Wellcome/Market Place by Jasons (69.4%) are the top 3 channels where the target customers
purchased their foods from.
Some verbatim responses from Questionnaire:
- “I always think that it would be better if I can examine the food in shop so that I know what I am
buying. If I order it online, I don’t know what will be delivered to me finally.“ (Group 2,
Female, Aged 64)
- “I have tried to do online shopping on HKTV mall. It is cheaper than shops. However, it is not
immediately delivered to the door.” (Group 1, Male, Aged 71)
Analyzed by income groups, there were significantly more customers having HK$70,000
monthly household income who purchased food from YATA (29.4%), AEON (24.8%), and
CitySuper (18.3%) than other income groups.
These places provide consumers with a one-stop shopping experience, such that they do not
need to walk around to different shops.
Some verbatim responses from Questionnaire:
- “For shopping, I hope I can buy all the things nearby. Therefore, I do not need to buy
somethings here and buy somethings there.” (Group 1, Male, Aged 71)
- “If I go YATA, I can buy other things at the same time after buying food.” (Group 2, Female,
Aged 60)

20
- “There is large supermarket called “Threesixty” near my home. There are many foods and
restaurants inside, including Chinese or Western dishes. I like shopping there. Yes, as I do not
need to go outside. All can be done in one-stop. It is also comfortable as it is not crowded.”
(Group 2, Male, Aged 64)
In addition, these stores also provide a variety of food and beverage products that are different
from supermarkets and they are well-accepted by these mature, well-off consumers.
Some verbatim responses from Questionnaire:
- “There are many things and more imported goods in AEON. Therefore, I mainly go there.
Everything can be purchased in one-stop. There are many electrical appliance … many things.
Therefore, it is more convenient.” (Group 1, Male, Aged 65)
- “As the pork selling in wet market is very expensive recently, why not I just buy from City’super?
The pork there is marked clearly that it is organic, I think City’super will not cheat. There are
many types of meat, such as chicken from France, steak from Japan, etc. I just buy what I like.”
(Group 2, Female, Aged 64)
Just over four percent (4.2%) of customers purchased food from online channels. “Ztore” (URL:
www.ztore.com) was the most popular one (2.6%), followed by online stores of Fusion (0.8%)
and HKTVmall (0.6%).
Table 17: Channels for Food Purchase Monthly Household Income
(HK Dollars) Age
Total 50-59k 60-69k 70K + 60-69 70+ Base: 500 206 185 109 268 232
Wet market 79.2 84.5 82.2 64.2 78.4 80.2 ParkNshop / Taste 72.0 74.3 74.6 63.3 72.4 71.6 Wellcome / Market Place by Jasons
69.4 70.9 67.6 69.7 71.3 67.2
Frozen meat stores 27.6 26.2 33.0 21.1 28.7 26.3 YATA 21.6 19.9 18.9 29.4 27.2 15.1 AEON 20.0 15.5 22.2 24.8 19.4 20.7 CitySuper 7.0 3.4 4.3 18.3 8.2 5.6 Grocery stores 6.6 6.8 7.6 4.6 6.3 6.9 759 Store 6.0 7.3 7.0 1.8 6.3 5.6 DCH Food Mart 2.2 3.9 1.1 0.9 1.1 3.4 HKTV mall branches 2.0 0.5 3.8 1.8 2.6 1.3 Others (each less than 2%)
6.0 6.3 7.0 3.7 7.1 4.7
Online 4.2 4.9 3.2 4.6 3.4 5.2
Ztore 2.6 4.9 1.6 - 1.1 4.3 Fusion 0.8 - 0.5 2.8 1.1 0.4 HKTV mall 0.6 - 1.1 0.9 0.7 0.4 Market place 0.4 - - 1.8 0.7 - Marks and Spencer 0.2 - - 0.9 0.4 -

21
Source: CSG Survey Question: Could you please tell me where do you buy the food most frequently, include physical shops / online shops? Where else? Remarks: Multiple responses. Sum of figures could be more than 100%.
3.12 Channels to Obtain Food Product Information
Physical shops were important sources of food product information for mature food consumers.
Meanwhile, although a large proportion of consumers visited wet markets, it was relatively less
important as a source of product information than the two major chain supermarkets. Analyzed
by household income, YATA (29.4%), AEON (21.1%), and CitySuper (12.8%) were important
sources of information among high income groups (HK$70,000 or above).
Table 18: Channels Obtaining Food Product Information (Physical Shops)
Monthly Household Income (HK Dollars)
Age
Total 50-59k 60-69k 70K + 60-69 70+
500 206 185 109 268 232 Shops 94.2 94.2 94.6 93.6 94.8 93.5
Wellcome / Marketplace by Jasons
66.2 64.6 69.7 63.3 68.7 63.4
ParkNshop / Taste 64.8 63.6 73.5 52.3 66.0 63.4 Wet markets 57.0 61.2 61.1 42.2 56.7 57.3 YATA 18.4 16.5 14.1 29.4 24.3 11.6 Frozen meat stores 18.2 16.0 24.3 11.9 18.3 18.1 AEON 17.4 12.1 21.1 21.1 16.4 18.5 CitySuper 4.4 1.9 2.2 12.8 5.6 3.0 Grocery stores 4.0 4.4 3.8 3.7 4.1 3.9 759 Store 3.6 3.4 4.9 1.8 4.5 2.6 Other (each less than 2%)
4.8 1.2 3.2 0.4 3.0 1.8
Source: CSG Survey Question: From which channels did you receive information (For example, price, types, brand,
and country of origin) about food?
Some verbatim responses from Questionnaire:
- (Moderator)” In the shop, are you attracted by staffs’ promotion? “(Respondent) “People
always easy to be convinced. I will listen to others easily if they recommend that the food is
delicious.” (Group 2, Female, Aged 64)
- “Sometimes my purchase in the shop is quite impulsive. You just walk around the shop and
come across the product. I don’t know why I want to pick it up and check the label, price, etc.”
(Group 2, Male, Aged 64)
According to the sources outside of shops (Table 19), friends and relatives were an important
source of food information, and it was even more important among lower income groups
(HK$50,000 – 59,999). While traditional advertisements (8.6%) were still important for mature
consumers, especially for the older group (Aged 70+) (12.9%), social media (8.0%) was equally
important, especially for the younger group (Age 60-69) (13.8%).

22
Table 19: Channels obtaining food product information (Outside shops)
Monthly Household Income (HK Dollars)
Age
Total 50-59k 60-69k 70K + 60-69 70+ 500 206 185 109 268 232 Friends/Relatives 12.0 17.5 9.2 6.4 13.1 10.8 Traditional Channels 8.6 8.3 8.1 10.1 4.9 12.9
TV Advertisement 4.6 3.4 3.2 9.2 3.0 6.5 Printed Advertisement 2.4 3.9 1.6 0.9 1.5 3.4 MTR/Bus stops/Transport 1.8 1.0 3.8 - - 3.9 Newspaper or magazine 1.4 0.5 1.6 2.8 1.1 1.7 Others 1.2 1.9 0.5 0.9 1.5 0.9
Social Media 8.0 4.4 10.3 11.0 13.8 1.3 Facebook 7.0 3.9 9.2 9.2 12.7 0.4 Youtube 1.6 1.0 1.6 2.8 2.2 0.9
Websites 2.4 1.9 3.8 0.9 2.6 2.2 HKTV mall 1.2 1.0 2.2 - 2.2 - Ztores 0.8 1.0 1.1 - 0.4 1.3 Others 0.4 0.0 0.5 0.9 - 0.8
Discussion Forum 0.4 1.0 - - 0.4 0.4 Source: CSG Focus Group Remarks: Multiple responses. Sum of selections may not equal total. Sum of figures could be more than 100%. CSG Question: From which channels did you receive information (For example, price, types, brand, and country of
origin) about food? Any other channels?
Some verbatim responses from Questionnaire:
About Traditional channels:
- “I usually read ‘Headliner’ newspaper when I go to yum cha. I receive the latest information
from it” (Group 1, Male, Aged 65).
- (Respondent) “Advertisement from HK JEBN (樓上燕窩莊) is good.” (Moderator) “That is
showing many products and price in one page?” (Respondent) “Yes. So that I can see which
product is the most value for money.” (Group 2, Female, Aged 64)
About social media:
- “I know about the food from YouTube. I do not remember which YouTuber made it, I just search
it by keyword, e.g. food and drink, and the video pops up.” (Group 1, Male, Aged 63)
- “I just watched TV, YouTube. I forget the channels, I watched many of them. I just clicked the
video if I think it is interesting. I watch YouTube almost every day.” (Group 2, Female, Aged 64)
- “I watched YouTube all the times. I firstly have an impression of that food and want to buy it if I
see it in the supermarket. The desire of shopping is strongest when I go shopping in
supermarket. “(Group 1, Male, Aged 63)

23
In addition, it appears that this approach of “content marketing” can be applied for television
programs as well, as some respondents are interested in certain kinds of food ingredients from
television programs.
Some verbatim responses from Questionnaire:
- “I knew that “Queen Crab” from TV. It is promoted by travelling programs. I like watching
travelling programs. It seems delicious so want to try when I come across it in shops.” (Group 2,
Female, Aged 64)
- “I know it from Cookery program. The advertisement of new products will be shown after the
cookery program. I was attracted by the dishes but not the ingredients.” (Group 1, Male, Aged
65)
- “I do not choose those foods that is difficult to cook. If the cooking procedures are complicated,
I do not enjoy even the food is very delicious. (Group 2, Male, Aged 64)\
3.13 The Importance of Country of Origin Versus Other Factors in Foodservice Selection
This research also studied the prospect of U.S. food in foodservice. The research found dining
and buying take out foods, location (55.4%), word-of-mouth (53.8%), and price (53.4%), are the
top concerns among customers. On the contrary, country of origin was of relatively low
importance (27.2%). Analyzed by income groups, the perceived importance of food country of
origin increased with higher household income of the respondents. This increasing pattern was
also found in cuisine (36.4% 52.3%) and nutrition facts (14.1% 37.6%).
Table 20: Important Factors for Food Selection when Dining Out
Food types (top 10) Total
Income
50-59k 60-69k 70K +
% of respondents rated important (i.e. 4 or 5 in a
5 point scale)
Location 55.4 52.9 58.4 55.0
Word of mouth 53.8 51.9 54.1 56.9
Price 53.4 52.4 60.0 44.0
Cuisine 44.6 36.4 49.2 52.3
Origin 27.2 20.9 25.9 41.3
Nutrition fact 21.4 14.1 20.0 37.6 Source: CSG Survey Question: How do you rate the importance of below factors for your food selection when
dining out?Please use a 10-point scale, where 10 represents “Very important” and 1 represents “Not important at
all.”

24
Some verbatim responses from Questionnaire:
- “For dining out, I consider the place and price first. Is it convenient for friends to meet or
nearby the home? Then, I search the interested foods on the menu. I will not consider where the
food is from, be it Australian abalone or American steak it is nothing to do with my choice.”
(Group 1, Male, Aged 71)
- “For example, I want to eat beef today. However, there is only U.S. beef available in the
restaurant. Therefore, I have no choice but accept U.S. beef.” (Group 1, Male, Aged 65)
- “Comfortable environment is important for me. I cannot chat with my friends in some
restaurants. And the taste of dishes must be good. I will ask the waiters for their suggestion
sometimes” (Group 1, Male, Aged 65)
However, it is possible that the experience with the dishes will create perception to the food from
particular country of origin.
Some verbatim responses from Questionnaire:
- “I will simply order steak without paying attention to food origin. Usually, I am curious about
the food origin after eating the steak, when it tastes good or bad.” (Group 2, Female, Aged 60)
- “I will care about the origin only after the meal that was bad, so that I will not order it next
time.” (Group 2, Male, Aged 64)
3.14 Favorite Cuisine and the Origin of Ingredients
According to the research results, Cantonese cuisine was the favorite cuisine among the mature,
well-off consumers. It was followed by Japanese cuisine as their second favorite. Among higher
income groups, the preference for Chinese cuisine became lower (79.1% 61.5%). At the same
time, their preferences became more diversified. In the highest income group, their interest in
Japanese (6.3% 17.4%), French (0.5% 5.5%), and Vietnamese cuisine (0.5% 4.6%) was
higher.
Table 21: Favorite Cuisine
Monthly Household Income (HK Dollars)
Age Gender
Total 50-59k
60-69k
70K + 60-69
70+ M F
Base: 500 206 185 109 268 232 237 263 Chinese 73.0 79.1 73.0 61.5 69.0 77.6 72.6 73.4
Cantonese 55.8 58.3 59.5 45.0 51.5 60.8 54.4 57.0

25
Huai Yang / Shanghai
8.0 9.2 7.6 6.4 8.2 7.8 7.2 8.7
Chiuchow / Fujian 5.8 6.8 4.3 6.4 4.9 6.9 5.9 5.7 Sichuan 2.4 2.9 1.6 2.8 3.7 0.9 3.8 1.1 Other (each 1% or less)
1.0 2.0 0.0 0.9 0.7 1.3 1.2 0.8
Japanese 11.4 6.3 13.5 17.4 15.3 6.9 11.8 11.0 Hong Kongese 4.8 5.3 5.4 2.8 5.6 3.9 4.2 5.3 Thai 2.8 2.9 3.2 1.8 3.0 2.6 3.0 2.7 Taiwanese 2.2 2.4 2.2 1.8 0.4 4.3 2.5 1.9 French 1.4 0.5 - 5.5 1.9 0.9 1.3 1.5 Vietnamese 1.2 0.5 - 4.6 1.1 1.3 2.1 0.4 Italian 1.2 1.0 1.1 1.8 1.1 1.3 1.3 1.1 Other (each 1% or less)
2.0 2.0 1.6 2.7 2.6 1.3 1.2 2.7
Source: CSG Survey Question: Could you please name three of your most favorite cuisines [1st mention]?
The majority (70.0%) of respondents would like to have the ingredients be from local sources.
Nearly a fifth (18.4%) of respondents preferred that their favorite cuisine use food ingredients
from the United States, and this level was around the same among sub-groups.
Table 22: Favorite Cuisine and Preferred Origin of the Ingredients
Monthly Household Income (HK Dollars)
Age Gender
Total 50-59k
60-69k
70K + 60-69
70+ M F
Base: 500 206 185 109 268 232 237 263 Hong Kong local 70.0 67.0 77.8 62.4 69.4 70.7 72.6 67.7 Japan 47.6 39.8 55.7 48.6 50.0 44.8 47.7 47.5 Mainland China 43.2 55.8 39.5 25.7 41.0 45.7 46.8 39.9 Australia 21.0 18.4 22.7 22.9 21.3 20.7 19.4 22.4 U.S. 18.4 15.0 21.6 19.3 17.2 19.8 17.7 19.0 Taiwan 14.6 15.0 17.3 9.2 12.7 16.8 16.9 12.5 Thailand 8.8 9.7 10.8 3.7 8.6 9.1 9.3 8.4 Brazil 4.2 3.9 5.4 2.8 4.5 3.9 3.8 4.6 New Zealand 3.4 3.4 2.7 4.6 3.4 3.4 3.8 3.0 France 2.4 1.0 1.6 6.4 3.0 1.7 2.5 2.3 Korea 2.0 2.4 1.6 1.8 2.6 1.3 1.3 2.7 Italy 2.0 1.5 2.2 2.8 2.6 1.3 1.7 2.3
Source: CSG Survey Question: Referring to your most favorite cuisine [Insert Q8 cuisine], what are the origin
countries of the main ingredients do you expect?
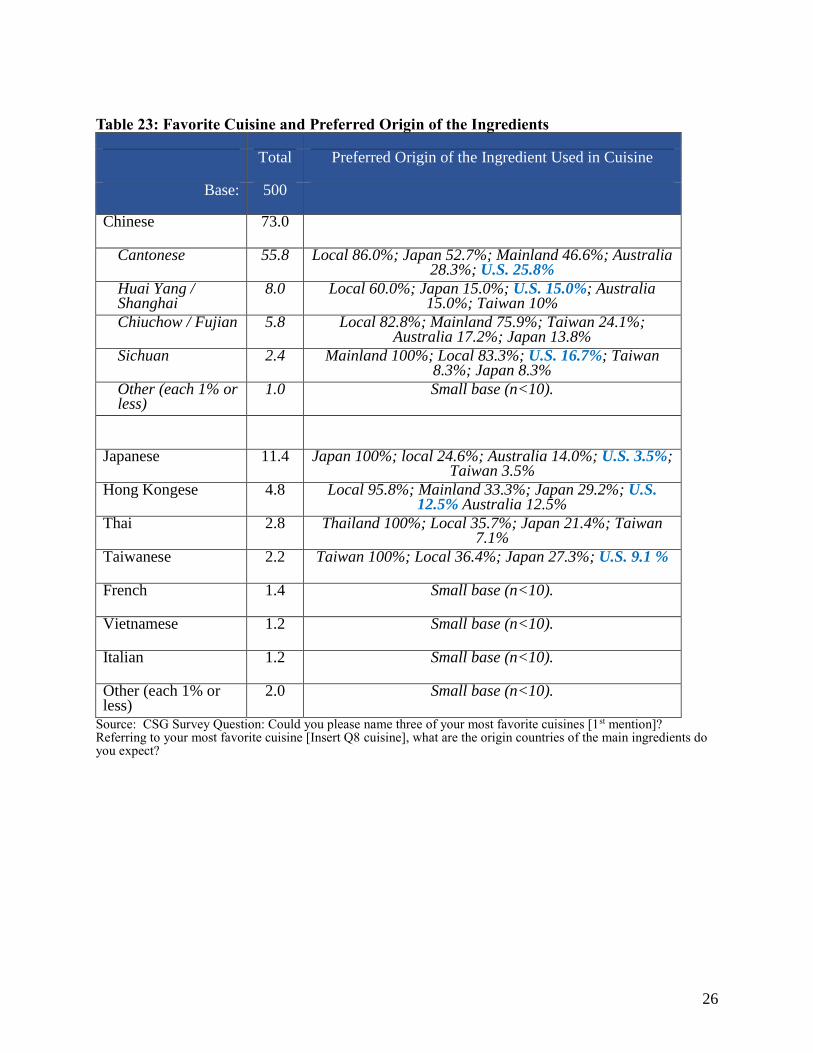
According to the preferred origin of ingredients in each of their favorite cuisines, a good
proportion of consumers agreed to the use of U.S. ingredients in Chinese cuisines, especially
Cantonese cuisine (25.8%), which was preferred by more than half of the respondents. Among
the Asian cuisines, the agreed usage of U.S. ingredients was relatively lower (12.5% or lower).
26
Table 23: Favorite Cuisine and Preferred Origin of the Ingredients
Total Preferred Origin of the Ingredient Used in Cuisine
Base: 500
Chinese 73.0 Cantonese 55.8 Local 86.0%; Japan 52.7%; Mainland 46.6%; Australia
28.3%; U.S. 25.8% Huai Yang /
Shanghai 8.0 Local 60.0%; Japan 15.0%; U.S. 15.0%; Australia
15.0%; Taiwan 10% Chiuchow / Fujian 5.8 Local 82.8%; Mainland 75.9%; Taiwan 24.1%;
Australia 17.2%; Japan 13.8% Sichuan 2.4 Mainland 100%; Local 83.3%; U.S. 16.7%; Taiwan
8.3%; Japan 8.3% Other (each 1% or
less) 1.0 Small base (n<10).
Japanese 11.4 Japan 100%; local 24.6%; Australia 14.0%; U.S. 3.5%;
Taiwan 3.5% Hong Kongese 4.8 Local 95.8%; Mainland 33.3%; Japan 29.2%; U.S.
12.5% Australia 12.5% Thai 2.8 Thailand 100%; Local 35.7%; Japan 21.4%; Taiwan
7.1% Taiwanese 2.2 Taiwan 100%; Local 36.4%; Japan 27.3%; U.S. 9.1 %
French 1.4 Small base (n<10). Vietnamese 1.2 Small base (n<10).
Italian 1.2 Small base (n<10). Other (each 1% or
less) 2.0 Small base (n<10).
Source: CSG Survey Question: Could you please name three of your most favorite cuisines [1st mention]? Referring to your most favorite cuisine [Insert Q8 cuisine], what are the origin countries of the main ingredients do you expect?

27
3.15 Top Ten Most-Wanted U.S. Food Ingredients for Food Service
When asking about the preferred food ingredients imported from the United States, beef and beef
products (85.0%) and fresh fruits (81.8%) were the top two priorities. Such preferences were
even higher among consumers in higher income groups (Beef: 82.1% 91.7%; Fresh fruit:
81.8% 93.1%). Similar patterns were also observed in nuts (53.1% 78.6%) and fresh
vegetables (42.2% 75.9%) categories, although their priorities were lower among overall
respondents.
Table 24: The Top 10 Kinds of Food from the U.S. that the Target Consumers are likely to
Buy
Food types (top 10) Total
Income
50-59k 60-69k 70K +
% of respondents rated likely to order (i.e. 4 or 5
in a 5 point scale) Beef & beef products 85.0 82.1 83.6 91.7 Fresh fruits 81.8 73.8 84.5 93.1 Pork & pork products 69.2 62.5 76.4 68.8 Egg 65.0 60.8 69.0 66.7 Nuts 62.0 53.0 64.6 78.6 Food prep (Pasta, cereal, soup) 60.2 46.9 73.3 61.8 Dairy products (incl. milk, yogurt, butter, cheese)
59.8 50.0 68.2 64.5
Poultry & poultry products 59.5 53.1 66.7 60.6 Juice 58.1 58.1 55.8 63.6 Fresh vegetables 56.9 42.4 63.3 75.9
Source: CSG Survey Question: When you dine-out or order take-out food, how likely would you order the dishes contains [Insert food type] from the U.S.? Please use a 5-point scale, where 5 represents “Very likely” and 1 represents “Very unlikely.”

28
4. Conclusions and Recommendations
Market Size and Share of U.S. Food
The mature, well-off consumers spend US$ 1.7 billion (HK$ 13.2 billion) in consumer food
purchases annually. This is 13.4% of food and beverage retail sales in Hong Kong (US$ 12.7
billion in 2019), while the mature, well-off consumers (337,100) are 4.5% of the population.
In this survey, 7.7% of the food purchased by mature, well-off consumers originated from the
United States. This means that the mature, well-off consumers spend US$ 130.8 million (HK$
1.019 billion) for U.S. food annually.
Key Features of Mature, Well-off Consumers
Mature, well-off consumers should be the market segment that food exporters target. Apart from
the fact that this group of consumers is expanding in Hong Kong, they are also:
Influential: They purchase food for themselves as well as their family. Therefore, they can
control a large amount of food spending on behalf of their family members.
Not conservative: They want to experience new and high-quality food for enjoyment, as most
of them are retired and living in well-off families.
Health-conscious and concerned about food safety: They generally regard U.S. food as
healthy and safe to consume. This is an advantage because health and food safety are the top
concern in the food selection of consumers. Consumers believe that the country of origin of
food can somewhat reflect the safety levels. They generally regarded mainland China, a
major food supplier to Hong Kong, as not reliable in terms of food safety. However, it seems
that they lack a substitute in certain kinds of food from mainland China, such as fresh fish
and fresh vegetables. But if they have a choice in another area such as frozen meats and
canned foods, they accept products from countries worldwide, if they trust the food products
are safe to consume.
This survey identified good potential of U.S. food among mature, well-off consumers as they
have a good perception of U.S. food and have a good intention to purchase it.

29
Food Types with Good Prospects
The following 10 food types listed in Table 25 were analyzed by buying intentions and their
current spending on the food type; they are the best in prospects in the mature, well-off consumer
market.
In marketing communication for consumers, the strengths of the U.S. products listed in Table 25
can be highlighted. In addition, importers should match their product features and marketing
strategy with the consumer’s preferences.
For all types of food, our research suggests that the quality assurance standard and accreditations
should be mentioned in marketing campaign as much as possible. Also, consumers were found
to react positively to statements about natural and organic cultivation, and measures to maintain
the freshness and timely delivery of foods to consumers.
Table 25: Strength of U.S. Food and Message that May Ease Consumers’ Concern Food Type Strength of U.S. Food,
According to Consumers Products Features that Could Address Consumers’ Needs
Beef & beef products - Good meat texture - Heavy beef flavor
- Free of disease related to cow, quarantine procedure
Fresh fruits - Natural/organic
Nuts - Chewy texture - Variety to choose
- Variety of texture and teste, good for health
Egg - Large in size and good
bargain - Strong egg flavor
Pork & pork products - Good meat texture - Meaty flavor
Fish and seafood products - No pollution / toxin for
breeding - Freshness - Good taste and texture
Poultry & poultry products - Big and good bargain - No hormone used - Good taste and texture
Food prep (Pasta, cereal, soup)
- Less pesticide in growing crops
- Variety to choose
- Products suit for variety of cuisines
Dairy products (incl. milk, yogurt, butter, cheese)
- Milky taste - Natural/organic
- Plenty of nutrients
Fresh vegetables - Natural/organic - Variety of choice
Source: CSG Survey Question: Please tell me the merits and shortcomings of the following categories of food from
the U.S.

30
Opportunities of Major Food Items
This research shows U.S. beef has established a prime position in the market, as it has occupied
around 30% of the beef purchases in the mature, well-off market where consumers were
spending a high amount. The data shows the spending on beef is much higher among the high
income group (HK$70,000 +), so it is possible for U.S. exporters to introduce and promote some
luxury beef products in Hong Kong.
Wine and beer (11.2%), fresh fruit (9.3%), and poultry (8.9%) from the United States all had
good shares in the mature, well-off market, and it will be worth the effort to explore acquiring a
larger share in view of consumers’ high spending in these food types.
Similar to beef, as a higher spending on wine and beer and fresh fruits were observed among
high income groups; U.S. exporters should try to introduce high-value items to Hong Kong.
On the other hand, U.S. pork only had a 2.5% share of all pork purchased by mature, well-off
consumers. As the consumer’s spending on pork was even higher than beef (HK$ 33.7 vs. HK$
21.9), and consumers had a good intention to buy U.S. pork, it is worth it for exporters to expand
U.S. pork’s share in the market.
Given the fact that consumers spend a high amount on fish and seafood and fresh vegetables, it
also worth more effort to promote U.S. products in these areas. However, it will be more
challenging to compete with other origins, especially local products and products from the
mainland, in these food categories. The long transportation from the United States makes it
difficult to provide consumers with vegetables and seafood at reasonable prices and with a high
degree of freshness. Instead, U.S. exporters should attract consumers with variety of new
products, and with the appeal of healthy and natural or organic ways of cultivation.

31
Promotion Channels
This research found that physical shops were important channels for food information.
ParknShop, Wellcome, and their sub-brands were influential due to their large market share in
Hong Kong. Meanwhile, the research also identified some consumers preferred purchasing in
large department stores, such as YATA, AEON, and CitySuper, that could provide them with
one-stop shopping experiences. This was attractive for the consumers because they did not need
to walk around to different shops. In addition, these stores also provided variety of food and
beverage that were different from supermarkets and they are well accepted by these mature,
well-off consumers.
Regarding information sources outside shops, this research found that social media was
important for the less mature group (Age 60-69), while traditional ads were still important for the
more mature group (age 70+). Some respondents mentioned that they use social media, such as
Youtube Channels, regularly and from which they acquired much information about food and
cooking. Therefore, social media could be effective in enhancing the adoption of new products
among consumers. Also, the approach of “content marketing” could be applied, as some
respondents are interested in certain kinds of food ingredient from the program or video clips.
Regarding traditional ads, the newspaper was still a popular channel among the mature
consumers. Newspapers could catch the focus of consumers on certain kinds of foods, such that
the food might receive more attention from the consumers when they visit the shops.
Among the foodservice sector, country of origin was not a major concern of consumers. Instead,
they were much more concerned about the location, reputation, and price factors, because they
did not have much control on the selection of food ingredients. Meanwhile, some respondents
commented that they may remember the country of origin when they have bad experiences with
the food. Therefore, the importers need to co-operate with quality food operators when
promoting their products in Hong Kong.
Although more than half of respondents liked Cantonese cuisine, many consumers believed that
U.S. food products could be applied to it. Beef and beef products, fresh fruits, pork & pork
products, eggs and nuts were the top preferences. Therefore, there were plenty of opportunities
to co-operate with traditional Chinese restaurants to promote U.S. food products in Hong Kong.
For other types of cuisines, although customers agreed with using U.S. food, the cuisines were
less popular among the mature, well-off consumers.

32
Appendix I: Technical Details of Market Size Estimation
Interviewers collected all food items purchased in the survey days, including items that was
purchased before and would be purchased after the interviews.
With this information, the total spending on food purchases in a day was calculated for each
respondent. Subsequently, this amount was multiplied by the food purchase frequency as
recorded in the survey. From these data we deduced the monthly and yearly spending of the
respondents.
Some might worry the recorded food spending of a respondent may be higher or lower from their
average spending. However, the effect could be levelled out by collecting a large number of
samples in this survey (i.e. n=500).
Figure A. Average monthly spending of a respondent:
∑ ((Spending on food) x frequency in a week) x 30/7
In this projection, it should be cautioned that the projection also assumed that not every member
in the segment (i.e. 337,100 mature well-off residents) was paying this amount.
To work out this discounted number of consumers, the data of respondents’ household members
were collected in the survey. The research found that for each target consumer there are another
0.814 members aged 60 or above.
Therefore, the discounted population that pay the amount of Figure A is:
337,100 x 1/ (1+0.814) = 185,832
For other members aged 60 or above, they can share a part of their food spending for the family.
Therefore, the survey also collected respondents’ spending on food purchasing for the whole
family. By subtracting Figure A from this figure, the food spending amount by other family
members was obtained.
Figure B. The food spending of remaining family members:
∑ (Family food spending in a week – ((Total sending on food in survey day) x frequency in a week))
500

33
For each respondent, there are another 3.5 household members, and 0.8 member aged 60 or
above.
Figure C. Average spending other age 60 or above members:
∑ (Figure B) x 0.81/ 3.5
This amount was multiplied by reaming member of target segment, i.e.
337,100 – 185,832 = 151,268
Total spending of target group monthly:
Figure A x 185,832 + Figure C x 151,268
= HK$ 4,756.1 x 185,832 + HK$ 1,453.9 x 151,268
= HK$ 883.8 million + HK$ 219.9 million
= HK$ 1.104 billion
= US$ 141.5 million
Total spending of target group annually:
= HK$ 1.1037 billion x 12 months
= HK$ 13.245 billion
= US$ 1.698 billion
500

34
Appendix II: Respondents Data for Face-to-Face Interview
Date Data Collection Venue Data Collection Venue (District)
No. of Respondents
24th August, 2020 Smithfield Road near Kennedy Town MTR
Station Central & Western 12
24th August, 2020 Aberdeen Square Southern 11
24th August, 2020 Kornhill Road, Tai Koo Eastern 7
25th August, 2020 Amoy Garden Kwun Tong 31
25th August, 2020 Bridge between Olympian City and Mong Kok
market Yau Tsim Mong 15
26th August, 2020 Tai Wai Road Sha Tin 15
26th August, 2020 Sha Tin Main Street Sha Tin 21
26th August, 2020 Tai Po Mega Mall Tai Po 30
27th August, 2020 Metro City, Po Lam Station Sai Kung 26
27th August, 2020 Tsuen Wan Plaza Tsuen Wan 13
27th August, 2020 Tsuen Wan Citi Store Tsuen Wan 37
28th August, 2020 Metropole, North Point Eastern 24
28th August, 2020 Timesquare Wan Chai 20
28th August, 2020 Wan Chai Road and Johnston Road Wan Chai 9
29th August, 2020 Whampoa Garden Kowloon City 36
29th August, 2020 Prince Edward West & Hau Wong Road Kowloon City 30
29th August, 2020 Mei Foo Sun Chuen Sham Shui Po 21
30th August, 2020 Caine Road and Castle Road Central & Western 10
30th August, 2020 Near Shau Kei Wan MTR Station Eastern 15
30th August, 2020 Tai Wai Road Sha Tin 13
30th August, 2020 Sha Tin Main Street Sha Tin 22
30th August, 2020 Tai Po Mega Mall Tai Po 10
31st August, 2020 Possession Street, Sheung Wan Central & Western 17
1st September,
2020 Yuen Long Hon Lok Road Yuen Long 11
2nd September,
2020 Sunshine City Plaza, Ma On Shan Sha Tin 29
3rd September,
2020 Caine Road and Castle Road Central & Western 15

35
Appendix III: Interviewing Location
Fieldwork locations No. of sample collected
Hong Kong 140
Smithfield Road near Kennedy Town MTR Station 12
Caine Road and Castle Road 25
Possession Street, Sheung Wan 17
Aberdeen Square 11
Kornhill Road, Tai Koo 7
Near Shau Kei Wan MTR Station 15
Metropole, North Point 24
Timesquare 20
Wan Chai Road and Johnston Road 9
Kowloon 133
Amoy Garden 31
Bridge between Olympian City and Mong Kok market 15
Whampoa Garden 36
Prince Edward Road West & Hau Wong Road 30
Mei Foo Sun Chuen 21
New Territories 227
Tai Wai Road 28
Sha Tin Main Street 43
Sunshine City Plaza, Ma On Shan 29
Tai Po Mega Mall 40
Metro City, Po Lam Station 26
Tsuen Wan Plaza 13
Tsuen Wan Citi Store 37
Yuen Long Hon Lok Road 11
Total 500

36
Appendix IV: Profile of Focus Group Participants
Group 1: 18 September 2020 14:30 – 16:00
Name Gender Age Food purchase
frequency Dine out
frequency Live with spouse?
No. of other co-living members
Monthly household
income
Living District
Participant 1
M 63 Once every two days
Once every two days
Yes Wife
Grandchildren HK$75,000 Sha Tin
Participant 2
M 65 More than once a day
Once a day Yes Wife HK$60,000 Mei Foo
Participant 3
M 71 Once every two days
More than once a day
No
Son-in-law One
Grandchildren Domestic
Helper
HK$100,000 Hung Hom
Participant 4
F 66 Once every two days
More than once a week
No
Nephew Niece-in-law
Nephew Niece-in-law
HK$100,000 Tai Koo
Group 2: 18 September 2020 16:30 – 18:00
Name Gender Age Food purchase
frequency Dine out
frequency Live with spouse?
No. of other co-living members
Monthly household
income
Living District
Participant 1
M 64 Once a day More than once
a week Yes Wife HK$55,000
Yau Ma Tei
Participant 2
F 64 More than once a day
Once a day Yes Husband HK$50,000 Tai Koo
Participant 3
F 60 Once every two days
More than once a day
Yes Husband HK$70,000 Sha Tin
Participant 4
F 64 Once every two days
Once every two days
No Son-in-law
Two Grandchildren
HK$70,000 Sha Tin
Attachments:
No Attachments.