report no. 151la-in appraisal of the industrial credit and...
TRANSCRIPT

FILE COPYReport No. 151la-IN
Appraisal of the Industrial Credit andInvestment Corporation of India Limited India
June 22, 1977
Industrial Development and Finance DivisionSouth Asia Projects Department
FOR OFFICIAL USE ONLY
Document of the World Bank
This document has a restricted distribution and may be used by recipientsonly in the performance of their official duties. Its contents may nototherwise be disclosed without World Bank authorization.
Pub
lic D
iscl
osur
e A
utho
rized
Pub
lic D
iscl
osur
e A
utho
rized
Pub
lic D
iscl
osur
e A
utho
rized
Pub
lic D
iscl
osur
e A
utho
rized
Pub
lic D
iscl
osur
e A
utho
rized
Pub
lic D
iscl
osur
e A
utho
rized
Pub
lic D
iscl
osur
e A
utho
rized
Pub
lic D
iscl
osur
e A
utho
rized

CURRENCY EQUIVALENTS
US$1.00 = Rs 9.00Rs 1 US$0.111Rs 10 million = US$111,000Rs 1.0 million US$111 million
ABBREVIATIONS
CDFC - Commonwealth Development Finance CorporationCGC - Capital Goods CommitteeDEC - Deutsche Gesellschaft fuer Wirtschaftliche
Zusammenarbeit (Entwicklungsgesellschaft)DFC - Development Finance CompaniesDRC - Domestic Resource CostERR - Economic Rate of ReturnFRR - Financial Rate of ReturnGIC - General Insurance Corporation of IndiaGOI - Government of IndiaICICI - Industrial Credit and Investment Corporation of
IndiaIDBI - Industrial Development Bank of IndiaIFCI - Industrial Finance Corporation of IndiaIIG - Inter-Institutional Group1IM - Inter Institutional MeetingIRCI - Industrial Reconstruction Corporation of IndiaKfW - Kreditanstalt fuer WiederaufbauKITCO - Kerala Industrial and Technical Consultancy
OrganizationLIC - Life Insurance CorporationMRTP - Monopolies and Restrictive Trade Practices ActNEITCO - iNorth Eastern Industrial and Technical Consultancy
OrganizationNSIC - National Small Industries CorporationRBI - Reserve Bank of IndiaSBI - State Bank of IndiaSFC - State Financial CorporationSIA - Secretariat for Industrial ApprovalsSIDC - State Industrial Development CorporationSISI - Small Industries Service InstituteSSI - Small Scale IndustrySSIC - State Small Industries CorporationSSIDC - State Small Industries Development CorporationUTI - Unit Trust of India
FISCAL YEARS
GOI, SFCs - April 1 - March 31ICICI - January 1 - December 31IDBI, IFCI, IRCI, RBI - July 1 - June 30

FOR OFFICIAL USE ONLY
INDIA
APPRAISAL OF THEINDUSTRIAL CREDIT AND INVESTMENT CORPORATION OF INDIA LIMITED
TABLE OF CONTENTS
Page No.
SUMMARY AND CONCLUSIONS ............................. i - iii
I. INTRODUCTION ................ 1.......1
II. ENVIROMIENT . ..
General ........ 1............Industrial Sector- Structure andPast Performance . ..... 2
The Environment for Industry. 3Industrial Policies Affecting the
Private Sector . ...... 4
Industrial Finance . . ............... . ... 6
Prospects... 8
III. INSTITUTIONAL ASPECTS. 9Share Capital and Ownership .9
Organization and Staff .9
Procedures and Standards .10Operating Policies .11Relations with Government and Business
Community ... 12
IV. RESOURCES AND OPERATIONS ............................ 12
Resource Mobilization ... 12Resource Allocation ... 14Promotional Activity . 14Development Impact .................. ... 16
V. FINANCIAL ASPECTS ...... 16
Quality of Portfolio . ......... 16
Financial Position ..... . . .. 18
This report is based on an appraisal mission consisting of Messrs. E. Elejaldeand W. Schaefer in November/December, 1976.
This document has a restricted distribution and may be used by recipients only in the performance oftheir official duties. Its contents may not otherwise be disclosed without World Bank/IFC authorizaion.

-2-
Page No.
V 3PECTS .................... ................ 20GOI Policy on Import Licensing andForeign Exchange Allocation 20
Business Forecast . . .................... . 20Resource Requirements . .21
Financial Projections ......................... 22
VII. AGREEMENTS REACHED ....... ............. ..... ............ .. . 23
LIST OF ANNEXES
1. Institutional Finance for Industry in India2. Selected Borrowing and Lending Rates - FY73-August 30, 19763. Distribution of Shareholding as of October 31, 19764. Members of the Board of Directors as of October 31, 19765. ICICI's Financing Strategy for 1977-796. Main Terms and Conditions for Assistance as on October 31, 19767. Resource Position as of September 30, 19768. Details of Foreign Currency Borrowings Concluded up to
October 31, 19769. Details of Rupee Borrowings Concluded up to October 31, 197610. ICICI's Overall Operations11. ICICI's Export Study12. Outline of the Proposed Study of Selected Subsectors
of the Engineering Industry13. Economic Indicators for Projects Approved14. Trend in Arrears (1965 to September 1976)15. Classification of Arrears as of September 30, 197616. Analysis of Equity Portfolio as of September 30, 197617. Income Statements - 1971-75 and Jan.-Sept. 30, 197618. Balance Sheets - 1975-75 and September 30, 197619. Cash Flow Statements - 1971-75 and Jan.-Sept. 30, 197620. Forecast of Approvals, Commitments and Disbursements - 1976-8021. Projected Foreign and Domestic Currency Resource Position - 1976-8022. Projected Income Statements - 1976-8023. Projected Balance Sheets - 1976-8024. Projected Cash Flow Statements - 1975-8025. Estimated Disbursement Schedule
Organization Chart (as on June 30, 1976).
Map - IBRD 3873

INDIA
APPRAISAL OF THEINDUSTRIAL CREDIT AND INVESTMENT CORPORATION OF INDIA LIMITED
SUMMARY AND CONCLUSIONS
i. The Industrial Credit and Investment Corporation of India (ICICI)was established in 1955 with the active participation of the IBRD, which hascontinued to maintain close contact with ICICI, through the provision ofeleven loans amounting to $425 million. The most recent was a $100 millionloan in April 1975, of which $85 million had been credited and $37 milliondisbursed by the end of April 1977.
ii. Over the last 20 years, ICICI has developed into a well managedinstitution with a successful record in industrial financing. The objectivesof the proposed loan of $80 million would be to continue to utilize ICICI asan efficient channel for financing high priority industrial projects many ofwhich are export oriented and/or are located in backward areas. ICICI willcontinue to undertake studies of specific industrial development problems,which will be of direct assistance to ICICI in its operations.
iii. ICICI is a major source of institutional finance for India'sindustry. In 1976, ICICI accounted for about 72% of total foreign exchangeapprovals by the country's industrial term lending institutions. IBRDaccounts for 85% of ICICI's foreign currency resources. ICICI has alsoreceived foreign funds from other official sources such as the USAID, KfW andthe UK. Finally, ICICI has been making efforts to diversify its sources offoreign exchange into commercial funds and has already raised $2 millionthrough a Swiss bond issue. In 1976, ICICI's foreign and rupee disbursementsaccounted for 14% of total disbursements by industrial term lending institu-tions and about 2.5% of total private industrial investment in India. ICICI'srupee funds have been raised through Government borrowings, share issues,internal cash generation, and more recently through a successful series oflarge debenture issues.
iv. ICICI's ownership structure is composed of public sector enterprises(76%), foreign enterprises (14%) with the balance (10%) from the Indian privatesector. ICICI has continued to enjoy strong management and benefit from astrong, well trained staff. Though ICICI maintains close contact with Govern-ment on industrial policy matters, it retains its operational autonomy.
v. ICICI's approvals fell slightly in 1975 to Rs 712 million comparedto Rs 723 million in 1974 due to reduced industrial demand in key subsectors.However, during the first ten months of 1976, approvals were 18% higher (Rs841 million) than in the twelve months of 1975. ICICI has emphasized themodern non traditional industries such as chemicals and petrochemicals (21%),metals and metal products (17%) and machinery manufacture (10%).

- ii -
vi. ICICI's- developmental impact has been substantial. ICICI's ex anteeconomic rates of return (ERRs) calculated on its projects continue to besatisfactory; e.g. weighted ERRs for the larger projects have been 22.6% in1975 and 29.5% for the first half of 1976. ICICT has also increased itslending to backward areas to 40% from 1974 to 1976 compared to 12% from 1955to 1970, Further, the total exports of ICICI's clients increased by 56% from$230 million in 1973/74 to $355 million in 1974/75, the latter representing17% of India's total industrial exports. Similarly, the direct employmentimpact has been satisfactory (fixed cost per job of $16,000 in 1975) consid-ering the size of ICICI's clientele. Finally, ICICI has expanded its promo-tional activities and provides training for many development banking stafffrom both India and abroad, assists clients in the formulation of foreigntechnical and financial collaboration agreements, and gives financial coun-selling and underwriting assistance through its merchant banking unit.
vii. In conjunction with the eleventh loan, ICICI undertook a study ofthe export experience of its clients and the role of incentives, the firstdraft of which was completed at the end of 1976. The study has alreadyprovided valuable insights into the problems and prospects of export manufac-turers and the impact of incentives. Similarly, ICICI intends to undertake twoadditional studies as part of the proposed loan namely (a) review of existingcompany data from the export study to test certain hypotheses concerning"1penetration pricing" in export marketing and (b) a review of the problemsand prospects of selected subsectors of the engineering industry. Finally,ICICI has completed a preliminary study for the creation of a specializedinstitution to finance lower and middle income housing for which it is seekingparticipation by IFC.
viii. ICICI's financial position remains satisfactory, though arrears havecontinued to increase in the past year, as total principal outstanding of loansaffected by arrears was about 18% of the outstanding loan portfolio comparedto 7% in 1973 due to power cuts, credit restrictions, and business recession.The collection ratio was 85% in 1976 compared to 90% from 1971 to 1973. Thearrears position is expected to improve in 1977; ICICI is taking appropriatemeasures to improve collection performance. Loan provisions amounted to Rs 27million at the end of 1975, but will probably increase when the 1976 audit iscompleted. ICICI's net profit as a percentage of average equity has remainedat 11% over the past four years, a satisfactory level. ICICI's debt/ equityratio (Bank definition) was 8.6:1 as of September 30, 1976, or below thecontractual limit of 9:1.
ix. While the prospects for improved industrial growth appear good,the level of ICICI's future operations has been forecast with caution dueto the slackness in demand in certain manufacturing subsectors as well asthe possibility that GOI may allocate more free foreign exchange funds toindustrial capital goods imports thereby reducing the potential demand onICICI should some firms prefer to borrow rupees and buy foreign exchangeto avoid carrying the foreign exchange risk. On the basis of ICICI's presentresource position and of its own and the private industrial sector's foreignresource requirements for the two year period beginning September 1977, a

- iii -
twelfth loan of $80 million is recommended which would account for about 60%of ICICI's foreign currency commitments during this period. ICICI also ex-pects to obtain a $17 million from the Kuwait Investment Company in 1977 which,due to its short lump sum maturity of 5 years, should be blended with Bankfunds. As a consequence, at a maximum, repayments to the Bank of $17 millionwould be spread over years 6-17 rather than years 4-5. Thus, the loan wouldbe made on a flexible amortization schedule including 3 years grace normally,and up to 5 years grace in selected cases. ICICI would relend the proceeds ofthe loan at its normal foreign currency rate (presently 11% ordinary and 10%for backward areas) thereby providing a spread of between 1.5-2.5% which isadequate. The proposed free limit is $4 million the same as in the last fourBank loans.

INDIA
APPRAISAL OF THEINDUSTRIAL CREDIT AND INVESTMENT CORPORATION OF INDIA LIMITED
I. INTRODUCTION
1.01 The Industrial Credit and Investment Corporation of India (ICICI)was established in 1955 with IBRD assistance. Since then, it has receivedeleven loans from IBRD totalling $425 million. The eleventh loan ($100million) was approved in April 1975. By end April 1977, IBRD had credited$85 million and disbursed $37 million, in line with the original schedule.Previous loans were by then fully committed. Only $9 million remained un-disbursed from the tenth loan ($70 million), which is ahead of schedule.
1.02 Over the last 20 years, ICICI has developed into a well managedinstitution with a successful record in industrial financing. A jointstudy undertaken in 1973 by ICICI and IBRD to evaluate ICICI's developmentalimpact, which included ex-post analyses on a representative sample of itsprojects in operation, confirmed that ICICI was allocating resources toeconomically efficient projects. A performance audit by the Bank Group'sOperations Evaluation Department during 1975 for the sixth, seventh andeighth loans also concluded that ICICI's achievements were satisfactory.This report appraises ICICI for a $80 million twelfth loan. It focusseson ICICI's overall performance since the eleventh loan was made. 1/
1.03 While ICICI is making efforts to diversify its sources of foreignexchange, it still needs IBRD support. The objectives of the proposed loanwould be: (i) to continue to utilize ICICI as an efficient channel forfinancing high priority industrial projects many of which are export orientedand/or are located in backward areas; and (ii) to continue to encourage ICICI,to undertake studies of specific industrial development problems, which willbe of direct assistance to ICICI in its operations.
II. ENVIRONMENT
General
2.01 A full assessment of India's present economic position is containedin the Bank's latest Economic Report No. 1529-IN dated April 25, 1977.
2.02 To summarize the current situation: India entered FY76 havingbeen through one of the most difficult periods since Independence. Progressin dealing with long-term development problems had been limited by poor crops,
iJ Appraisal Report No. 637a-IN of March 14, 1975.
-2-
dramatic shifts against India in the terms of trade, and inflation. Adjust-ments to ;:hese immediate difficulties thus became the principal preoccupa-tion in economic management. However, with favorable monsoons and additionalforeign assistance, it now appears that India has successfully weathered theproblems of the recent past. Once again there is the basis for an upturn inthe growth rate of the economy.
2.03 Most important among the favorable factors has been a bumper har-vest which followed years of poor or modest agricultural output. Foodgrainproduction in FY76, estimated at around 117 million tons, exceeded the pre-vious record of FY71 by 8%. Oilseeds, sugarcane and cotton also reached newproduction peaks and provided ample supplies for the agro-industries. In FY77,a good harvest is again expected of at least 110 million tons of foodgrains.Secondly, deficiencies in the supply of basic commodities and of infrastruc-tural inputs such as energy and transport, which had been prevalent in thepast, have been eased. Electricity generation and domestic production ofcoal, oil, cement and steel all increased by over 10% during FY76 and by afurther 15% in the first eight months of FY77. Finally, the increased supplyof agricultural and industrial products and of services, together with thedemand restraint imposed by the Government since mid-1974, put a virtual stopto inflation. From April 1975 to March 1976, the Wholesale Price Index fellby 8.1%o Although from April to September 1976 the Index rose by 11%, it wasstill 5% lower in September 1976 than in September 1974.
2.04 On the balance of payments front, there have been a number of en-couraging developments. Firstly, the rapid build-up of foodgrain stocks toa level of 17 million tons by December 1976 provides a buffer against theimpact of a future crop failure on the balance of payments and has reducedcurrent import requirements. Secondly, despite generally unfavorable worldtrading conditions, export earnings rose by 9% in FY76, and seem likely torise by more than this in FY77. Thirdly, the value of petroleum imports wasstabilized in FY76 (although thete is likely to be a rise in FY77), and steelimports have been progressively reduced in FY76 and FY77 as a result ofincreased domestic production. Finally, increased production and loweredworld prices have reduced fertilizer import values quite sharply. As a resultof these factors, imports rose only 5% in value in FY76 and the trade deficitfell by almost $100 million. Developments so far in FY77 suggest a moredramatic improvement in the trade balance this year. Moreover, since net aidrose 49% in FY76 and India received substantial inflows of private remittancesduring the past one and a half years, reserves rose by almost $800 million inFY76, and are continuing to rise at a comparable rate in FY77. These reservesgive India added flexibility in adjusting to a higher rate of growth in thefuture.
Industrial Sector - Structure and Past Performance
2.05 India's industrial output has grown on average by only about 3.5%per annum since 1965 and manufacturing presently accounts for 16% of NDP,
-3-
as opposed to 14% in FY61. 1/ Within the manufacturing sector, there havebeen gradual changes in structure which reflect the priorities of the Gov-ernment's industrial development strategy with consumer goods industriesnow contributing less to value added. For example, the food processing andtextile industries' combined share has fallen from 43% in FY61 to 28% inFY75. Over the same period, the share of "basic" industries, (defined toinclude basic metals industries, chemicals and fertilizers), together withthe engineering industry, increased from roughly 40% of value added in manu-facturing to somewhat more than 50%.
2.06 While some two-thirds of manufactured output is estimated to comefrom registered plants, which are predominantly medium and large scale, themore labor-intensive unregistered, mainly small scale, sector employs two-thirds of the industrial labor force. The Government dominates mining andpower generation and, to an increasing extent, the "basic" industries withinthe manufacturing sector. Nonetheless, according to the 1970 Annual Surveyof Industry, almost 80% of industrial value added originated in the privatesector, and within the manufacturing sector, the figure was 85%. Even allow-ing for the recent nationalization of part of the textile industry, privateindustry must still account for at least three-quarters of output from themanufacturing sector. Within the private sector, food, paper, tobacco anda number of other industries make important contributions, but textiles,chemicals and engineering goods continue to be dominant.
2.07 In the last three years, industrial performance has improved sub-stantially. In FY74, industry grew by a mere 1%, and in FY75 growth was2.5%. With an improved supply position the industrial growth rate roseto 5.5% in FY76. Production of key manufacturing inputs, like steel, coal,and electric power improved dramatically in that year; capital goods produc-tion, which had declined by 4% in FY75, also recovered to the level of FY74;but the output of consumer goods slumped by 1.9%. In FY77, overall industrialgrowth (defined to include electricity and mining) is expected to be about10%. Selected data for the first nine months of the fiscal year show thatthe growth in the output of capital goods over the corresponding period ofFY76 was 8.5%, while consumer goods production has increased by 15.8%. Thesustained buoyancy of intermediate goods producing industries is indicated bythe 22.3% increase in steel production and the 14.2% rise in electricitygeneration. However, inventories of intermediate goods are high by historicalstandards, which indicates a continued constraint on final demand.
The Environment for Industry
2.08 Over the last fifteen years, both supply and demand factors havehindered industrial growth. Supply constraints have perhaps been more per-sistent. Through much of this period prior claims on foreign exchange con-strained the availability of essential intermediate inputs not manufactured
1/ If industry is more broadly defined to include the remainder of thesecondary sector - utilities and construction - then value added inindustry constitutes about 23% of NDP.

-4-
in India, and affected the supply of inputs, such as steel, at times whendomestic production was unable to match demand. Equally the unpredictableeffect of the monsoon on the supply of agricultural raw materials, such ascotton, has constrained industrial growth. Moreover, agricultural supplybottlenecks have tended to coincide with power shortages, since hydro supplyis also dependent on the monsoon.
2.09 However, when these supply constraints have not been binding, de-mand has usually been depressed. All of the four possible sources of growingdemand - import substitution, exports, the derived demand from the growth ofother major sectors and investment - have been weak. Thus, the principalopportunities for import substitution were largely exhausted by the mid-1960s;while exports have recently contributed to growth, they still constitute avery small part of total sales; the relatively slow growth trend of agricul-ture of little more than 2% has restricted demand for consumer goods; and,finally, Government real investment has remained stagnant, although this haschanged recently (para 2.24).
Industrial Policies Affecting the Private Sector
2.10 General, The Government has placed central emphasis on rapid in-dustrialization and national self-sufficiency as the keys to development. Atthe same time, the Government has sought to curb the concentration of economicpower through expanded public ownership, restrictions on the growth of "largehouses" and "dominant undertakings"; reservation of many products to the small-scale sector as well as special assistance to it; and finally support fordevelopment in backward regions. The aim of self-sufficiency has largelymanifested itself in the pursuit of import substitution as well as curbs onforeign-owned firms and other forms of foreign involvement in industry.
2011 The main instruments of industrial policy have been central licen-sing of investment and imports, physical allocation of "scarce" domesticallyproduced raw materials and controls on industrial prices. This system hasitself tended to conflict with other aims, especially that of curbing economicconcentration, since large firms are much better able to bear the overhead costsof dealing with a centralized bureaucracy. Controls have also restricted theability of firms to respond to changed opportunities, especially in overseasmarkets, and thus hampered exports. The extent of excess capacity indicatesthat the planning, which is the basis of the industrial licensing system hasbeen far from successful. Finally, price controls appear to have had a harmfuleffect on investment and modernization in such crucial industries as cottontextiles, sugar, and cement.
2.12 In the last two years there have been a number of important develop-ments in industrial policy. In the face of poor industrial performance andmuch underutilized or inefficiently utilized capacity, GOI has been reconsi-dering elements of its strategy. It recognized that existing capacity mustbe utilized more efficiently; that public sector enterprises should meet morecommercially oriented criteria for output, price, and profitability; and thatthere must be an increasing emphasis on exporting. It has taken a number ofmeasures to boost industrial growth, including liberalization of licensingprocedures, relaxation of import and other controls, fiscal incentives andmore emphasis on industrial modernization.

- 5 -
2.13 Liberalization of Licensing Procedures. The process of simplifyingprocedures for the issue of industrial and other licenses started in 1973 whena time limit on the disposal of licensing applications was established. 1/Subsequent changes towards liberalization of licensing have taken four majorforms. Firstly, diversification of production has been allowed in industrialmachinery, machine tools, electrical equipment, steel castings, and steelforging industries within the overall licensed capacity of a particular under-taking, in order to facilitate fuller utilization of installed capacity.Secondly, 15 export-oriented engineering industries are now allowed to growautomatically in a five-year period by 25% over their licensed capacity.Thirdly, 21 selected industries in the medium-scale sector have been exemptedfrom licensing and "Large Houses" and foreign companies (as defined in theForeign Exchange Regulation Act, FERA, 1974 2/) have been permitted to expandin 30 other industries subject to certain conditions. Finally, 29 selectedindustries have been allowed to utilize their installed capacity fully. Ingeneral, the obstacles posed by licensing procedures have been virtuallyeliminated for all except the Large Houses and FERA companies, for which theobstacles have been reduced.
2.14 Relocation of Controls and Fiscal Incentives. Import controls havebeen significantly liberalized and the procedures for obtaining export incen-tives and necessary raw materials have been streamlined. Export duties havebeen abolished on a number of commodities. Excise duties also have been re-duced for 45 industries and the rate of income tax has been lowered. 3/ Fur-ther, price controls have been lifted for many finished manufactures and priceincreases permitted for cement, coal and coke, commercial vehicles and aluminum.Distribution controls on industrial materials have been lifted for almost allitems. The Dividend Ordinance of 1974 was allowed to lapse in July 1976 thusremoving the restriction on payment of dividends.
2.15 Modernization. GOI has announced a modernization program for thetextiles, cement, jute, sugar and engineering industries. The scheme will bemonitored by IDBI, although ICICI will take the lead in the engineering in-dustry. GOI's disbursement targets are Rs 2,000 million per year for the nextthree years of which the engineering sector would account for about 20%, al-though it is unlikely that this level of disbursements can be achieved. Themodernization funds will be on-lent at 7.5%, compared with a normal lendingrate of 11%.
1/ The procedural changes then effected have had a marked impact in clearingthe backlog of cases and accelerating the process of issuing industriallicenses/letters of intent and approvals of applications for capital goodsclearances and foreign collaboration.
2/ FERA was also amended during 1976 to make the maximum foreign ownershipallowed more flexible if the company was exporting at certain levels.
3/ The FY77 budget provided for a reduction in the marginal rate of incometax from 77% to 66%. The basic exemption level was also raised. Tostimulate investment, the FY77 budget permitted companies an investmentallowance of 25% on the value of plant and machinery.
-6-
2.16 isodernization is, of course, an ongoing process which has beentaking place for some time - about 10% of ICICI's approvals over the lasttwo years have been for financing modernization, replacement and balancingequipment. Therefore, the main change will be the additional incentive forfirms to modernize as a result of the availability of cheaper funds. How-ever, the Government has not yet announced many of the details of theseprograms nor, more importantly, of how the basic structural problems ofthese industries are to be tackled.
2.17 The modernization fund will largely be used for financing localequipment, and will, therefore, not affect the demand for the proposed loan.The proceeds of the loan may be used in part to support the modernizationneeds of ICICI's clients (although not on a subsidized basis) as has beendone in the past. As such, the loan will complement the Government's mod-ernization fund. However, there are wider issues that need to be tackledand, with this in mind, ICICI will undertake studies of selected engineeringsubsectors which would include an analysis of their modernization require-ments.
2.18 Conclusion. These various changes mark a cumulatively significanteffort on the part of GOI to tackle the problems of India's private industrywithin the context of the overall policy framework. However, major tasks doremain, especially the generation of a satisfactory demand growth and increasedemphasis on efficiency in the use of resources. The improved export perform-ance and increased Government expenditures on top of the higher agriculturalincome from recent good harvests help explain the recent upturn in industrualdemand. To sustain it, the Government will have to continue efforts to en-courage exports and private investment and, of greatest importance for theimmediate future to raise the level of public expenditure. Within such frame-work, ICICI has an important role to play in providing funds for investmentand, through its project appraisal, in guiding resources in an efficientdirection.
Industrial Finance
2.19 Financial Institutions. Annex 1 describes the institutional struc-ture for industrial financing in India. The system is well developed andthere are sufficient institutions to cover the different needs both at theState and at the all-India levels. During FY76, disbursements by the finan-cial institutions (excluding commetcial banks) accounted for about 15% ofgross fixed capital formation in industry. The Industrial Development Bankof India (IDBI), the apex institution for industrial financing in the country,accounted for 30% of the institutions' disbursements, followed by all theState Financial Corporations (SFCs) together (23%) and ICICI (14%). 1/ ICICI
1/ Total disbursements by all the institutions were Rs 4.3 billion. IDBIand the SFCs are associated with the World Bank Group through two linesof credit where IDBI refinances the foreign exchange lending operationsof the SFCs at the state level in the medium- and small-scale industry.

-7-
accounts for about three quarters of the institutional financing in foreignexchange. There is extensive joint financing among the financial institu-utions 1/ working at the all-India level and coordination is working well.One problem with the financial system has been the lack of equity capitalfor new entrepreneurs. In the medium- and large-scale sector, this is beingtackled through the institution of the joint sector where a private firm joinswith the State Government to implement a project. This "joint sector" is alsobeing used as a promotional tool by State Governments, as it offers the at-tractiveness of combining private sector management with Government resourcesand leverage in matters affecting licensing, availability of infrastructureand raw materials, etc. 2/. For small-scale industries, a "special capital"mechanism has been established to bridge the equity gap. 3/ Overall, w^Jhilemost of the State level institutions need strengthening, the financing systemis adequate.
2.20 Interest Rates. The Central Bank rate was raised from 6% to 7% inJune 1973 and again to 9% in July 1974. The resources available to banks forlending were curtailed and the cost to banks of its borrowings and deposits,as well as the cost to borrowers of bank funds, was raised. Further, ceilingson credit expansion were imposed and commercial banks' liquidity ratios mademore stringent. Also, in July 1974, a tax of 7% on commercial bank interestincome was imposed, and is passed on to final borrowers. As shown in Annex 2,the rate of interest on fixed deposits is now 8% (1-3 years), and the maximumrate (for deposits of over 5 years) is 10%. Long-term lending rates byfinancial institutions range from 9.5%-12%. The commercial banks' primelending rate is now 15%, though most banks charge more (up to 16.5% includingabout 1% tax). ICICI's lending rates are in line with the country's ratestructure (para 3.11).
2.21 Capital Market. The capital market has been weak during the pastfew years. Total capital 4/ raised fell from Rs 902 million in FY73 to Rs 703million in FY74, and to Rs 613 million in FY75 although it increased to Rs 939million in FY76. The decline was mainly in the issue of debentures due tothe weak secondary markets; the capital raised as ordinary and preferenceshares (inclusive of rights issues) actually increased from Rs 569 million
1/ About half of ICICI's financing (by amount) during 1974 and 1975 wasjoint financed either with IDBI and the Industrial Finance Corporationof India (IFCI), or both.
2/ IBRD is considering a loan for financing this type of project throughIDBI which would include technical assistance for project identificationand preparation at the State level. ICICI also finances the jointsector (para 4.08).
3/ Refer to the appraisal report for the IDBI/SFCs II project (No. 1158-IN,of May 6, 1976; para 4.03).
4/ Including bonds but excluding bonus issues,

- 8 -
in FY73 to Rs 687 million in FY74, although it declined to Rs 423 million inFY75 and again increased to Rs 812 nkillion in FY76. RBI's price index forordinary shares increased from 103.1 at the end of FY73 to 125.5 at the endof FY74, but declined to 99.4 at the end of FY75 as a result of legislativerestrictions on the distribution of dividends. The index rose to 102.4 atthe end of FY76 and to 106.8 by August 1976 after the dividend restrictionswere lifted (para 2.14). However, the lapsing of the Dividend RestrictionsOrdinance did not have a substantial impact on the market because the highinterest rates make deposits with commercial banks quite attractive. Dataon capital issues for the first half of FY77 also reflect the slump in thestock market. The total capital raised between April to September 1976 wasRs 516 million compared with Rs 650 million in the corresponding period in1975.
2.22 The limited available data on underwriting reveals that in FY75, 90%of the total amount of equity issued to the public was underwritten; in FY74the corresponding figure was 97%. In FY75, underwriters, as part of theirobligation, had to take up equity shares for Rs 31 million compared with Rs 39million in FY74. During the early 1970s, brokers were active underwriters.Subsequently, with the slackening of activity in the capital market, brokerslost interest in this activity and the bulk of the underwriting is now beingdone by the financial institutions. The stock market should improve graduallyas the impact of the recent incentives by GOI (para 2.14) begins to be felt.
Prospects
2.23 After the improved economic performance in FY76, India startedFY77 with foreign exchange reserves equal to more than 4 months' imports,improved foodstocks, a growing export performance, and a substantiallybetter supply of energy and other inputs. These improvements do not rule outthe reappearance of supply shortages in the future as general prospects de-pend on uncontrollable factors such as the behavior of the monsoon, the per-formance of foreign economies, etc. Thus, the opportunities for growth aremuch better. The need remains for GOI to boost industrial exports, to con-tinue liberalizing imports, and to increase public investment because of itsdirect relationship to growth and because of the underutilization of capacityin the capital goods industries. Apart from the steps that GOI has taken toboost the investment climate, its budget for FY77 provides for a substantialincrease in investments and plan expenditures. 1/ Further, domestic savingsas a percentage of national income, which were around 13% during FY73-FY75,increased to 14.5% in FY76. All in all it is likely that over the next fewyears, India will be able to achieve real GDP growth of 4%-6% and exportgrowth of more than 7%.
1/ The overall Plan outlay (including states) for FY77 has been increasedby about Rs 19 billion or 32% on top of an increase of 25% in FY76.

-9-
III. INSTITUTIONAL ASPECTS
Share Capital and Ownership
3.01 ICICI's original paid-up capital was Rs 50 million and it has beengradually increased to Rs 150 million at present. Annex 3 shows ICICI'sprincipal shareholders as of October 31, 1976. With the latest capital inflowof Rs 25 million in 1975, the Indian public sector shareholding increased to76%, compared with 71% at the end of 1974. 1/ Foreign shareholding decreasedfrom 18% to 14% and the share of Indian private investors, from 11% to 10%.After an amendment to the Indian Company Act in February 1975, ICICI is nowconsidered a Government Company (its direct and indirect public sector share-holding is more than 50%). Except for a minor change in the procedure forselecting auditors (para 5.09), this has not had any impact on ICICI's opera-tions.
Organization and Staff
3.02 Board of Directors. ICICI's Board is competent and experienced.Of the 16 members, 4 have been appointed since 1975. The members representleading industrial groups (4), foreign shareholders (2), ICICI (3), publicfinancial institutions (3), GOI (2) and state level institutions (2) (Annex 4).Mr. H.T. Parekh continues to be ICICI's Board Chairman. The Board meets oncea month, with good attendance, and decides on all project proposals above Rs Imillion. 2/ It takes a keen interest in ICICI's affairs and is kept wellinformed.
3.03 Management. ICICI's management has not changed much over the lasttwo years and remains effective. Mr. Parekh, formerly Executive Chairman, hasnow delegated all executive power to the Managing Director although he con-tinues to be the Chairman of the Board. Mr. S.S. Mehta remains ManagingDirector and has responsibility for all operational aspects of ICICI. ICICI'smiddle management is also capable and experienced. The management style isflexible and informal.
3.04 Staff. As of June 30, 1976, ICICI's staff numbered 454 of whom187 were professionals, compared to 154 professionals as of June 1974. Mostof the new staff were assigned to support departments, such as accounts, legal,personnel and administration. The staff in the Projects Department, ProjectsPromotion Department, and Regional Offices also increased as envisioned ear-lier but they remain understaffed due to recent resignations/transfers inparticular the Project Promotion Department and the Regional Offices. ICICI's
1/ As in previous issues, a number of foreign shareholders either did notparticipate or sold their shares entirely.
2/ Smaller loans are decided by a committee headed by the Managing Director(up to a limit of Rs 10 million a month). Equity and debenture sales byICICI are decided upon by an Investment Committee headed by the Chairman.

10 -
recrui;rev program for the first half of 1977 should fill these gaps. l/For undt -A-ing the modernization program (paras 2.15-2.17). ICICI intends toexpand its staff gradually as necessary taking into account ICICI's absorptivecapacity and the need to maintain the high quality of its "normal" operations.
3.05 The quality of ICICI's staff remains high and its personnel andtraining policies continue to be sound. Staff morale is good and turnoverlow. Over 60% of the professionals have worked for ICICI for more than 5years.
3.06 Organization. ICICI's organizational structure (see attached chart)is sound. The Managing Director is the top executive assisted by the GeneralManager who concentrates on personnel, follow-up, accounts, legal and resourcemobilization, whereas the Deputy General Manager concentrates on projectevaluation and promotion, administration and the Regional Offices. Two newoperational units were established in 1976: an internal audit cell and aspecial operations cell. Apart from dealing with problem projects, the latteris also responsible for the sales from ICICI's investment portfolio under theguidance of the Investment Committee of the Board. Standard follow-up workhas also been reorganized (para 3.08). The role of the Regional Offices hasbecome more important, particularly in follow-up, legal work, appraisals ofloans below Rs I million, and "routine" project promotion. Moreover, a newRegional Office was recently established in Delhi. 2/ ICICI has employedmanagement consultants to help improve present data processing techniquesand to computerize the foreign exchange repayment schedules and other partsof its accounts. The new system should become operational by mid-1977.
Procedures and Standards
3.07 Appraisal. ICICI's appraisal standards continue to be of highquality. Appraisal reports remain precise and incisive. The analysis oftechnical, financial and market aspects is thorough and the economic analysisis adequate.
3.08 Follow-Up. ICICI's follow-up activities have been reorganized re-cently. Apart from the creation of a separate department in charge of problemprojects, the Follow-up Department has reorganized its activities into fourcells, i.e., implementation, rehabilitation, normal follow-up, and arrears.Further, the reporting responsibilities for follow-up between Regional Officesand headquarters have been defined more clearly. Coordination between ap-praisal and follow-up work remains good through weekly meetings to discussspecific projects under follow-up. The clients submit detailed quarterly
1/ ICICI intends to recruit four more professionals for the Project Depart-ment, two more for the Promotion Department, two more for the EconomicsDepartment and one for each of the three Regional Offices during thefirst half of 1977.
2/ ICICI has Regional Offices also in Calcutta and Madras. Over the pasttwo years the professional staff increased by 2 on a net basis in theCalcutta Office, by 1 net in the Madras Office, and by 6 net in thenewly-created Delhi Office.

- 11 -
progress reports which ICICI regularly reviews. Those companies which showpotential problems and those already on the problem list, are visited byICICI's staff at least once a year. ICICI also reserves the right to appointa director on the borrowers' board and has done so in 79 cases.
3.09 Procurement and Disbursement. ICICI insists upon competitive quota-tions from three or more reputed manufacturers/suppliers. The price and thesuitability of the equipment proposed to be purchased is subject to a carefulcheck by the staff, increasingly supplemented by comparisons on the basis ofexperience with similar projects. ICICI's procurement procedures are appro-priate given the nature of its business. Disbursement procedures also remainsatisfactory. Since November 1975, ICICI has opened its owfn letters of creditin order to provide speedier service to its clients.
Operating Policies
3.10 General. While ICICI has no formal policy statementD, its Memorandumof Association, complemented by Board resolutions adopted from time to timesand Government guidelines, provide satisfactory guidelines for ICICI0s activ-ities, which are satisfactory. 1/ ICICI's Board of Directors has approved astatement of financing strategy for the next two years (Annex 5) which showsthat it intends to continue to concentrate its investments in the followingsix priority sectors: (a) export industries; (b) power and transport; (c)agricultural inputs and outputs; (d) industries basic to industrial expansion;(e) mass consumption goods; and (f) balancing and modernization projects.About 80% of ICICI's lending by amount in 1975, and 88% in the first 10 monthsof 1976 as well as 82% of ICICI's pipeline of projects is in these sectors.
3.11 Terms of Assistance. Annex 6 shows ICICI's interest rates and othercharges as of October 1, 1976. ICICI's lending rates were last increased onDecember 1975. For ordinary loans, local currency rates were increased from10.25% to 11%, and foreign currency rates from 10.5% to 11%. 2/ For conces-sionary loans (backward areas), local currency rates were increased from 805%to 9.5%, and foreign currency rates from 9.5% to 10%. With inflation runningat a rate of 8% in FY77, ICICI is now lending at positive real rates ofinterest of 1.3%-2.8%, and with long-term inflation expected at around 8%-9%,its rates are expected to remain positive in real terms.
1/ For example, decisions on exposure in individual enterprises continueto be made on the merits of each case. As of June 30, 1976 ICICI hadan exposure of more than 10% (amount of approvals net of cancellationsand repayments as percent of ICICI's equity) in 17 companies with thelargest exposure amounting to 31%, which is still acceptable, consider-ing the quality of the companies. None of them is in financial dif-ficulties and all have satisfactorily serviced their debts to ICICIand others.
2/ ICICI also charges an additional interest rate of 1% to private limitedcompanies since it does not have the opportunity to enjoy equity parti-cipation.

- 12 -
Relations with Government and Business Community
3.12 Relations between GOI and ICICI continue to be good. ICICI's Re-gional Office in Delhi keeps close contact with GOI officials and GOI has tworepresentatives on ICICI's Board. ICICI is represented in 7 GOI Committees/Public Bodies concerned with industrial investment. ICICI enjoys full oper-ating autonomy within the framework of GOI policies.
3.13 ICICI's relations with other financial institutions remain good.Coordination between them is working well both at the all-India and Statelevel through Inter Institutional Meetings (IIMs) and Inter InstitutionalGroups (IIGs) respectively (Annex 1, para 7 to 11). ICICI works closelywith its clients and provides them various forms of assistance in projectpreparation and arrangement of technical and financial collaboration agree-ments with foreign partners.
IV. RESOURCES AND OPERATIONS
Resource Mobilization
4.01 General. As of September 30, 1976 ICICI's resources totalled Rs 5.1billion, of which foreign exchange accounted for Rs 2.8 billion (55%). ICICI'sresource position is summarized in Annex 7.
4.02 Foreign Currency. Most of ICICI's foreign currency resources(Annex 8) have come from IBRD. Of total foreign exchange resources of $492million as of October 31, 1976, eleven IBRD lines of credit account for $422million (85%). Fifteen KfW lines of credit (latest in 1976) account for 10%and six UK lines of credit (latest in 1975) for 3% of foreign currency re-sources; the rest (1%) was provided by one USAID line of credit (1961) and oneSwiss bond issue (1973). The latter was the first commercial diversificationof ICICI's sources of foreign exchange. ICICI has meanwhile continued to makeattempts to mobilize new foreign commercial funds, and is finalizing negotia-tions for a Kuwait Dinars 5 million ($17 million) loan from the Kuwait Invest-ment Company in mid 1977, at about 8.75% and repayable in lump sum after fiveyears. It also has been negotiating a $5 million loan with a foreign commer-cial bank. ICICI's plans for further diversification of its foreign exchangesources are satisfactory (para 6.04).
4.03 Blending. The Kuwaiti borrowing will be repayable in lump sumafter five years. Since most of ICICI's projects require longer maturities(maximum 15 years), this presents an operational problem for ICICI. For spe-cific subprojects financed from both IBRD and Kuwaiti funds, IBRD would allowICICI to allocate relatively more of the earlier maturities (years four andfive) for repayments to the Kuwait Investment Company. The size of theproposed loan offers ICICI the opportunity to blend effectively. From pastexperience, some 40% of an average ICICI subloan is repaid in the first fiveyears. Thus, to obtain a reflow of $17 million by the fifth year, ICICI wouldonly have to lend some $43 million (or $26 million in IBRD funds). Thus

- 13 -
the impact of the proposed blending operation on the repayment schedule byICICI to IBRD would be small. At the maximum, 1/ it would imply repayments toIBRD of $17 million over years 6-17 rather than in years 4-5. The proposedamortization schedule of 17 years, including 3 years grace normally and 5years grace in selected cases, would be within present IBRD guidelines on loanrepayment terms for India.
4.04 Foreign Exchange Risk on 1977 Kuwaiti Dinar Loan. ICICI would bor-row the Kuwaiti Dinars in a lump sum and would convert them into US dollarsand invest the dollars until disbursment. At commitment (loan signature)of these funds to subprojects, ICICI would pass on the exchange risk to sub-borrowers by denominating the sub-loan in Kuwaiti Dinars at the exchangerate which prevailed at the time when ICICI converted these funds into dol-lars. ICICI expected to commit these funds in an average period of about6 months, during which it would be taking some exchange risk. Since thealternative to bearing the risk might be more costly in view of: (i) the highcost of hedging (about 4%); and (ii) the past stable relationship between theUS dollar and the Kuwaiti Dinar coupled with the relatively short time ICICIwould be exposed in that currency (the exposure would reduce gradually overthe six month period) ICICI is prepared to accept the small exchange risk. 2/
4.05 Local Currency. The bulk of ICICI's total local resources of Rs 1.6billion as of September 30, 1976 was financed from ICICI's own bond issues(40%). The rest was financed from GOI and IDBI loans (37%) and share capitaland reserves (23%) (Annex 9). Prior to 1975, ICICI had difficulties in rais-ing rupee resources for its expanding rupee lending (para 4.07), because itsdebentures did not have trustee security status. GOI has meanwhile grantedthis status to ICICI debentures so that ICICI could issue rather large semi-annual bond issues totaling Rs 303 million in 1976, and Rs 193 million in1975 compared to Rs 55-80 million annual bond issues before. Though ICICI'seffort in helping develop the financial markets by floating these debenturesis laudable, little actual mobilization of primary savings is generated inthis process. ICICI, like other financial institutions is mostly tappingresources which have already been mobilized by commercial banks and otherinstitutions (primarily insurance companies). This is, however, the resultof traditional investment habits and the lack of secondary markets for deben-tures, which are major obstacles to attracting funds directly from the public.Also, RBI controls all debenture issues by determining amounts, maturity andrates of interest, thus limiting ICICI from making the yield on its debenturesmore attractive.
4.06 Mobilization at Project Level. ICICI's financing constitutes onaverage about 20% of total project cost. That means that for every rupeeinvested by ICICI an additional four rupees are invested from other sources.
1/ However, ICICI would actually select subprojects for blending on a caseby case basis giving preference to those requiring shorter maturities.Thus, repayments to IBRD would be delayed in only few cases.
2/ ICICI took a similar exchange risk at the time of its Swiss bond issue($2.1 million equivalent) in 1973.

14 -
Some 20% a. e~ financed by other financial institutions and the balance by thepromoters contribution and internal cash generation. ICICI also financesprojects jointly with foreign financial institutions, such as IFC, CDFC andDEG, thus serving as catalyst for iavestment.
Resource Allocation
4.07 Overall Operations. Characteristics of ICICI's operations and adiscussion of recent trends are in Annex 10. Reflecting the stagnating eco-nomic conditions in 1975 and the economic recovery in 1976, ICICI's total netapprovals fell slightly in 1975 to Rs 712.3 million as compared to Rs 722.6million in 1974, but picked up substantially in the first ten months of 1976when approvals were 18% higher (Rs B41.3 million) than in the twelve monthsof 1975. Commitments present a similar picture. They dropped slightly fromRs 585.0 million in 1974 to Rs 546.3 million in 1975, but increased sharplyto Rs 745.8 million in the first ten months of 1976. Disbursements, whichshow a time lag compared to approvals and commitments, fell from Rs 555.3million in 1974 to Rs 545.8 million in 1975 although they are estimated toreach Rs 655 million in 1976. ICICI's loan disbursements account for about15% of those of all-India financial institutions and about 2.5% of totalprivate industrial investment in India.
4.08 As a result of improved availability of domestic capital goods, rupeeloan approvals increased as a percentage of total approvals from 24% in 1974to 43% in the first ten months of 1976, as compared to 71% and 42% respectivelyfor foreign currency loans. The percent for guarantee, underwriting and directsubscription approvals varied from 5% to 15%. ICICI has continued to emphasizelending to the modern and non-traditional sectors such as chemicals/petrochem-icals (21%), metals and metal products (17%) and machinery manufacture (10%).Joint sector projects amounted for 13% from 1974 to 1976. Half of its loansare to new clients and some 7% of its loans to new entrepreneurs. 39% of itslending during 1975 and the first 10 months of 1976 was for projects in back-ward areas. The financial performance of ICICI clients improved from 16%return on total capital employed in 1973/74 to 18% in 1974/75.
Promotional Activity
4.09 ICICI's traditional promotional activity includes (i) training oflocal development bank staff from SFCs and SIDCs; (ii) participation in in-dustrial surveys conducted throughout India and assistance in implementationof project ideas; (iii) coordination and cooperation with both State and All-India institutions through Inter-Institutional Group meetings; 1/ and (iv)financing the preparation of feasibility studies and supporting technicalconsulting services (Annex 1, para 6). IDBI, as the apex financing institu-tion in the country, usually takes the lead in the above activity, and ICICI'spromotional contribution is more significant in non-traditional activities.
1/ Annex 1, para 11 discusses the functions of the IIG. ICICI has lead res-ponsibility for initiating promotional activities through the IIGs inAndhra Pradesh, Gujarat, Karnataka, Maharashtra and Tamil Nadu.

- 15
4.10 ICICI's new promotional activity can be classified irnto: (i) iden-tification of projects that would fill gaps in the industrial sector; (ii)support to the financial system; and (iii) preparation of sectoral/policystudies. ICICI's project gap identification activity started in late 1973with the creation of the Project Promotion Department. One of the projectideas (an industrial estate for small-industry in West Bengal) has alreadybeen financed and two others (sand beneficiation and sponge iron) are underconsideration. A fourth project (methyl chlorosilane) has met with dif-ficulties in completing collaboration arrangements. Seven other projectsare under active preparation of identification. The performance of the Pro-motion Department has been good but it needs to be allocated more staff (para3.04).
4.11 ICICI's recent support to the financial system has been mainly byits merchant banking activities which started in 1973. Through these activ-ities, ICICI provides financial services and advice to companies for raisingcapital (Annex 10, para 7). More recently, ICICI has prepared a feasiblitystudy for the creation of a specialized institution to finance lower andmiddle income housing. Its creation is under discussion with GOI. ICICIexpects to provide 5% of the initial Rs 100 million share cap4 tal and isseeking participation by IFC.
4.12 ICICI involvement in the preparation of sector/policy studies wasinitiated under the eleventh IBRD loan, when ICICI undertook to prepare astudy on the problems and prospects of manufactured exports based on a sampleof its clients. The study, which is summarized in Annex 11, provides a con-siderable amount of useful information and is unique in its attempt to analyzeissues related to exports at the firm level. ICICI intends to review existingcompany data from the export study to test certain hypotheses for a penetra.tion pricing study, in particular the determination of the factors responsiblefor the observed increase over time in the ratio of export to domestic prices.Knowledge of the underlying causes for low initial export prices might permitimproved understanding of the efficiency of different export marketing strat-egies. This first stage of study would be completed by September 30, 1977.Provided the first stage shows sufficient evidence that penetration pricingexists, ICICI would agree with IBRD on an outline for the second stage ofthis study, and would assess work to be done, including possibly an analysisof prices and quality of product in third countries for comparison.
4.13 ICICI will also undertake a study on selected subsectors of theengineering industry at the company level to analyze the factors affectinginvestment demand in particular for modernization and replacement. The studywould, among others, focus on (i) demand prospects both in the domestic andexport markets; (ii) upgrading of technology; (iii) domestic subcontractingarrangements to ancillaries; and (iv) the overall employment impact of alter-native investment strategies. The study would initially concentrate on theautomobile industrial subsector, and a first draft questionnaire is scheduledto be ready by July 15, 1977 and to be sent to IBRD for comments. A draftreport would be ready by March 1978. The content and timing of the study foranother subsector would be determined subsequently. An outline of the studyis in Annex 12.

- 16 -
Development Impact 1/
4.14 In 1975, ICICI calculated ex ante economic rates of return (ERR)on on 30 projects 2/ (Annex 13) which ranged from 11.0% to 70.0%. Theweighted 3/ average economic rate of return was 22.6% while the weightedaverage financial rate of return (FRR) was 14.8% which is satisfactory. Sim-ilarly, for six months of 1976, ex ante ERR calculations on 17 projects rangedfrom 9.0% to 40.0% with a weighted average ERR of 29.5% and FRR of 15.6%. Theaverage fixed investment per employee was $16,000 in the case of 108 projectsapproved in 1975 which is satisfactory considering the fact that ICICI financesthe medium and large scale sector. Further, to promote regional development,ICICI has increased its lending to backward areas from 12% of total approvals(1955 to 1970) to around 40% (1974 to 1976). Finally, from FY74 to FY75, thetotal exports of ICICI's clients increased by 56% from $230 million to $355million, or from 15% to 17% of India's total industrial exports (Annex12). 4/
V. FINANCIAL ASPECTS
Quality of Portfolio
5.01 Loans. Annex 14 shows the trend in ICICI's arrears for 1965 to1976. As of September 30, 1976, ICICI's overdues of principal and interestwere Rs 98 million, (but dropped slightly to Rs 94 million as of December 31,1976), compared with Rs 60 million as of December 1975, Rs 51 million as ofDecember 1974, and Rs 41 million as of December 1973. The total principaloutstanding of loans affected by arrears was Rs 455 million, or about 18% ofthe outstanding loan portfolio, compared with 7% in 1973. The increase inarrears was due mainly to the special problems faced by Indian industry since1972; power cuts in 1973; credit restrictions in 1974; and in particular,business recession in 1975. From past experience, it takes some time after
1/ ICICI's developmental impact which included ex post analysis on the proj-ects it has financed was examined in a Special Study undertaken in 1973jointly by the Bank and ICICI, the results of which were incorporated inthe appraisal report of the eleventh loan to ICICI (Report No. 637a-INdated March 14, 1975). One of the major conclusions of this study wasthat ex post economic and financial rates of return have generally beensimilar to those calculated ex ante.
2/ As agreed with IBRD under previous loans, ICICI calculates the ERR forall new and expansion projects when its proposed assistance is morethan Rs 5 million and total capital cost is more than Rs 25 million.
3/ Weighted according to capital costs at market prices.
4/ This relates to 374 companies for which information was available.
- 17 -
the start of business revival for firms showing liquidity problems during arecessionary phase to normalize operations. Thus, the arrears problem is notlikely to start improving substantially until around mid-1977.
5.02 Annex 15 shows the characteristics of ICICI's arrears as ofSeptember 30, 1976. Compared with the position in 1974, two sub-sectors,metals and metal products, and electrical equipment, account for a majorportion of the increase in arrears (40% and 33%, respectively). As a per-centage of the total portfolio affected by arrears, they account for 19% and18% respectively. The performance of both sub-sectors was considerably in-fluenced by past developments including power cuts and recession (parti-cularly the recession in the construction industry for metal products), andit should improve gradually. Further, ICICI has proposed to GOI a reductionin excise duties for some of the products and in the case of electricals,(dry cells), a review of export incentives. Other subsectors which account fora major portion of the increase in arrears such as chemicals/petro-chemicals(15%), 1/ are also those that were particularly affected by recession andincreases in excise duties.
5.03 ICICI's arrears list now covers 120 companies (out of over 1,000),of which some 30 are facing long-term management, marketing or environmentalproblems. The rest comprise certain new companies passing through initialteething difficulties, market entry, or others whose cash flows have beenaffected in various degrees by recession. ICICI and its auditors have re-viewed each project in ICICI's portfolio, and based on security considera-tions as well as long-term viability, concluded that provisions are suffi-cient to cover possible losses. 2/ Further, ICICI is now undertaking a majoreffort to improve arrears. It has reorganized its normal follow-up work and
1/ Chemicals and petrochemicals account for 18% of the portfolio affectedby arrears.
2/ Provisions for loans (principal) amount to Rs 27 million or about 1% ofthe outstanding loan portfolio in 1975. This compares favorably withan actual write off of bad debts amounting to Rs 4 million over thepast five years. Only one of ICICI's clients is among the "sick units"that have resorted to IRCI for assistance. Provisions are likely toincrease after the audit for the 1976 financial year is completed.These reserves against doubtful debts provide for possible losses onprincipal repayments; they are not passed through the revenue/expenseaccounts but allocated directly in the balance sheets as reserves.Prior to 1973, doubtful interest income was included in the revenueaccounts and a provision was made as an expense against their recovery.For the 1973 to 1975 accounts this doubtful interest income is notaccrued as income, but added directly to current assets in the balancesheets against a current liability account called "interest in suspense".This "interest in suspense" procedure has been adopted to avoid paymentof tax on income that might not be realized (provisions are not deduc-tible in India).

18 -
created a .,-arate cell to concentrate on difficult projects (paras 3.06,3.08), Inri idual accounts continue to be watched closely and loans arerescheduledl, where appropriate. ICICI in many cases has assisted clientsin obtaining working capital finance, and has also taken up policy problemswith GOI. ICICI has also imposed changes in some projects, for example,new management. 1/ From a discussion on the problems of some 40 of ICICI'smost difficult projects, it seems clear that ICICI is taking satisfactoryaction. ICICI is in control of the situation and no major divergence fromits present approach is recommended.
5.04 Investments. As of September 30, 1976 ICICI's equity portfoliocomprised common share investments of Rs 146.9 million in 250 companies andpreference shares of Rs 91.8 million in 67 companies. Some 50% of the equityportfolio was in companies operating profitably and paying dividends, 21%in companies under construction or start-up and 29% in companies in difficul-ties, of which about 2% was in some jeopardy (Annex 16). 2/ The averagemarket price of the common shares was 105% above book value, substantiallylower than the 132% on June 30, 1974, reflecting the trends in the stockmarket (para 2.22). The average dividend yield was about 4.4% in 1976, al-though taking into account also capital gains after tax the average yieldwas 6.4% which is satisfactory. As of December 31, 1975, ICICI also helddebentures of Rs 150.3 million in 67 companies. In 1975, the average yieldon debentures was 7.7%. ICICI's investment portfolio continues to be sound,and is well managed.
Financial Position
5.05 Profitability. Annex 17 shows income statements from 1971 toSeptember 1976. Net profits after tax increased from Rs 25.0 million in 1973to Rs 26.6 million in 1974, Rs 35.0 million in 1975 and are estimated atRs 35.2 million in 1976. The relatively sharp increase in 1975 was mainlydue to tax concessions, including the reversion of excess provisions forincome tax and surtax to income. 3/ ICICI's net profit as percent of averageequity stayed over the four years at about 11%, a satisfactory level. ICICIincreased dividend payments in 1975 to 11% as compared to 10% in the pre-vious years, partly to show a good dividend record for its next capital issuewhich is expected in 1977. Such dividends allowed for a satisfactory profit
1/ Only 2 cases were pending in the courts as of October 1976. ICICI'swillful defaulters are very few.
2/ ICICI makes no specific provisions for its equity investments, but thenet capital gains realized from the sale of investments is earmarkedto a capital reserve fund which was Rs 38 million as of October 1976.This is an adequate cushion.
3/ Profits before tax increased from Rs 51 million to Rs 52 million, Rs 56million and Rs 65.3 million respectively.

- 19 -
plough-back of 53%. Administrative expenses remained under control at 0O5[-0.6% of average total assets. However, because the average cost of bor-ow--ings increased faster than the return on loans (partly due also to increasedlending in backward areas at concessional rates), the spread on lending oper-ations declined from 2.8% in 1973-74 to 2.5% in 1975-76. As a result, pzofitafter tax and provisions declined from 1.3% of an average total assets in1973 to 1.1% in 19760 Profitability, although relatively lo0, 4is sti-il ade-quate, and the declining trend is expected to be reversed by 1978 (para 6.07footnote).
5.06 Capital Structure, Annex 18 shows ICICI"s balance shees s as ofDecember 31, 1971-1975, and September 30, 19760 Total assets almost doubledfrom Rs 1.8 billion in 1972 to Rs 3,0 billion in 1975 and Rs 3.4 billion in1976, There was a particularly Large increase (30%) in 1975 mailn7y becauseof a 40% increase in foreign currency loans outstanding. Thls, however, isnot due to particularly large disbursements, but rather, the result of adifferent method of converting the foreign currencies in rupee equivalent. 1/As of December 1975, net worth plus provisions constituted 1-% of the loanand investment portfolio. Foreign currency loans accounted for 59% and rupeeloans for 30% of total assets while IBRD borrowings were 48% of ICICII's equityand liabilities. The debt/equity ratio was 8.6:1 as of September 30, 1976,below the 9:1 contractual limit, which will be maintained since ICICI isalready a highly leveraged company.
5.07 Liquidity. Annex 19 shows ICICI's cash flow statements for 1971through 1975 and the first nine months of 1976. ICICI's liquidity has re-mained adequate with a debt service coverage at about 1,2:1 exceot for 1975when it fell to 1.03:1 due to a lump sum repayment of a Rs 60 million bond.It is estimated at 1.13:1 for 1976 (1,05:1 assuming pro-rata allocations onbonds outstanding which have not yet fallen due). This is the minimum accept-able level. The debt service coverage should increase further as the arrearssituation begins to improve (para 6.11).
5.08 Market Quotation. ICICI's net worth as of December 1975 Was Rs 277million, so that the book value of each of its 1,5 million shares was Rs 185compared to Rs 100 par value. From January to October 1976, the market priceranged from Rs 95 to Rs 101 per share, or about 51% to 55% of the book value.During this period only 5% of the shares were traded. At the closing priceof Rs 93 in December 1975, ICICI's dividend yield was 11.8% and the price/earnings ratio was about 4.0:1. The relatively low share price reflects thepoor stock market conditions.
5.09 Audit. Because ICICI is now considered a Government Company (para3.01), GOI, on the advice of the Comptroller Auditor-General, can appoint theauditors of ICICI. However, N.M. Raiji & Co. and Ray & Ray continued to auditICICI's accounts for 1975 which were presented without qualification0 For
1/ Before 1975, ICICI converted its foreign currency loans and borrowingsinto rupees at the central exchange rate at the time of disbursement.Now ICICI uses the current exchange rate, which results in substantiallylarger loans and borrowings in rupee equivalent as most foreign curren-cies had substantially appreciated against the rupee over the past years.

- 20 -
1976, a new auditor, Lodha Co., replaced Ray & Ray. GOI follows the practiceof appointing new auditors about every three years and for reasons of con-tinuity N.M. Raiji & Co. continues as ICICI's auditor for the time being.
VI. PROSPECTS
GOI Policy on Import Licensing and Foreign Exchange Allocation
6.01 Recent dramatic improvements in India's foreign exchange positionshould permit GOI to pursue an increasingly expansionary macro-economicpolicy. If adopted, this would also increase the demand for private invest-ment and lead to an increased demand for loans from the industrial financialinstitutions. At the same time, GOI is likely to increase the allocationof free foreign exchange for industrial purposes. In this situation, somefirms may prefer to use rupees, either their own or borrowed, and convertthem into foreign exchange loans. The foreign exchange financing require-ments for ICICI over the next two years have been conservatively assessedin recognition of some possible preference for rupee loans.
Business Forecast
6.02 Annex 20 shows the forecast of ICICI's approvals, commitments anddisbursements through 1980. Total approvals, which were about Rs 950 mil-lion in 1976, are projected to increase annually by 10% in nominal terms toRs 1.4 billion by 1980. Total approvals would be equally divided betweenforeign currency loans and rupee loans and investments. Thus, the trendtowards an increasing proportion of local currency financing 1/ is expectedto continue as the Indian capital goods industry develops further. Commit-ments and disbursements of foreign currency loans would grow annually at 10%and 12%, respectively, although for local currency the growth will be fasteras the backlog of uncommitted approvals is larger. 2/ ICICI's pipeline ofprojects, particularly for foreign exchange financing, mainly includes in-dustries of high priority. 3/ Further, ICICI's proven capability foridentifying and appraising economically viable projects is evidence that itwill continue to allocate IBRD funds efficiently under the new loan. Giventhe improved economic conditions, it is likely that investment activity willbe at least maintained, and ICICI's projections have been prepared on thatbasis.
1/ Local currency approvals accounted for 46% during 1974-1976.
2/ There was a large increase in rupee approvals during 1976.
3/ Refer to para 3 of Annex 5 (Strategy Statement). It should be borne inmind that the pipeline is only indicative of the projects to be financedin the future, as most of the projects in it are yet to be appraised andICICI will undertake further project identification and promotion in thecourse of the proposed loan.

- 21 -
6.03 The above forecasts do not take into account the impact of themodernization program (paras 2.15-2.18) since at the time of negotiationsmany details had not been worked out and the level of demand for the schemewas not clear. The modernization scheme should not affect the forecast offoreign currency operations since of the five industries covered, onlyengineering would require some imported equipment, roughly estimated at10% of disbursements for the sector. 1/ However, it may affect the projec-tion of rupee operations in terms of amounts (these would probably increase)and also in terms of the nature of the financing (some balancing and modern-ization proposals which ICICI would have financed under its normal operationswill now come under the subsidized scheme). Regarding the impact of the mod-ernization program on ICICI's financial position, as ICICI will be appraisingthe projects to be financed and will have the power to accept or rejectproposals, it will only get involved with operations it considers viable.Further, any additional funds required for the program will be provided byGOI/IDBI so that ICICI's resource position will not be affected. However,there may be an impact on ICICI's capital structure (para 6.10) and ICICI'sprofitability (para 6.08).
Resource Requirements
6.04 Foreign. The proposed loan would cover the gaps in ICICI's foreigncurrency resource requirements between September 1977 (the time when the loanwould become effective) and September 1979. Annex 21 shows ICICI's projectedforeign currency resource position through 1980. From January 1977 throughSeptember 1979 foreign currency commitments would be about $174 million.Against this, ICICI had foreign currency resources available for commitmentof about $40 million on December 31, 1976 and expects to raise throughSeptember 1979, some $30 million from traditional sources (about $4 millionper year from KfW and $6 million per year from UK). It expects to obtain$17 million from the Kuwait Investment Company during 1977 and further com-mercial borrowings of $5 million in 1978 (para 4.02). 2/ This leaves a gapof about $82 million which forms the basis for the proposed $80 million IBRDloan. It would account for about 60% of ICICI's foreign currency commitmentsbetween September 1977 and September 1979. For 1979 and 1980, ICICI also plansto obtain an additional $30 million from non-traditional sources.
6.05 The loan would be made to ICICI to meet the foreign cost of capitalgoods and services of subprojects sponsored by productive enterprises. Aswith other IBRD loans to development finance companies, eligible enterpriseswould be broadly defined so as to include not only manufacturing, but also
1/ Or about $5 million assuming half of GOI's targets for the next 3 yearsare achieved. Further, engineering units eligible for the program (thoseover 15 years old) are mostly additional to ICICI's normal clientele inthis sector (the most modern firms). Moreover, it is not clear whetherimported equipment would be included under the subsidized scheme.
2/ This excludes the modernization programs as any funds required for thispurpose will be provided separately by GOI/IDBI.

- 22 -
no;- only manufLcturing, but also agro-iadustries, mining, and transportation.The loan is expected to finance mainly private enterprises, although projectsin the public and joint sector would also be eligible. It is proposed thatthe free limit be kept as in the past four loans, at $4 million (with noaggregate).
6.06 Domestic. Annex 21 shows ICICI's rupee resource position through1980. 1/ From 1977 to 1980, disbursements for local currency loans and in-vestments are expected to be Rs 2,015 million. The total rupee requirements,Rs 2,308 million, would be funded by borrowings, mainly debenture issues(57%), loan collections (25%), internal cash generation (5%), share capitalincreases (4%), IDBI counterpart funds from the UK credits (4%), and salesfrom portfolio (3%). The balance of 2% is expected to be financed fromICICI's resources on hand from previous borrowings. ICICI should be ableto raise the required resources as it no longer faces problems placing itsdebenture issues (para 4.05).
Financial Projections
6.07 Annex 22 shows projected income statements for 1976 to 1980. Netprofit after tax and provisions should grow from Rs 30.2 million in 1976 toRs 50.7 million in 1980, or by about 12% per year. The return on average networth would remain at around 11% (due to share capital increases). Profitafter tax and provisions would stay at about 1% on average total assets whichis relatively low but still adequate. 2 Administrative expenses would riserather rapidly by about 18% annually in view of ICICI's increased promotionalactivities, but should remain under control at 0.6%-0.7% of average totalassets. The projected annual dividend rate is 11% implying a satisfactorypayout ratio of about 45%.
6.08 At the margin, ICICI's lending spread now is 2% for foreign cur-rency loans and about 3.5% for rupee loans. To prevent a further declinein profitability IBRD and ICICI reached an understanding that ICICI wouldreview its lending rates periodically and adjust them if necessary taking intoaccount the need to maintain its profitability, inflationary conditions, andother factors. On the basis of existing spreads for foreign and rupee loansand assuming the modernization funds are lent with a spread of about 2% on theaverage with half the modernization program being implemented, ICICI's averagespread at the margin would be 2.5% which is satisfactory.
1/ This excludes the modernization ptograms as any funds required for thispurpose will be provided separately by GOI/IDBI.
2/ The declining trend in ICICI's profitability (para 5.05) is expected tobe stopped around 1978 as the impact of the lending rate increases of1974 and 1975 becomes felt. The average spread on lending operationsis expected to remain at around 2.5% over the projected period, whichis satisfactory.
- 23 -
6.09 Annex 23 shows projected balance sheets for 1976 to 1980. Totalassets are forecasted to grow from Rs 3,447 million at the end of 1976 toRs 5,348 million in 1980, an annual growth rate of 11% per year. The loanand investment portfolio would go up by about the same rate from Rs 3,029million to Rs 4,807 million. Net worth plus provisions, should remain atabout 11% of the total portfolio. With its present program of share capitalincreases (Rs 30 million per year), ICICI's contractual debt/equity ratiowould slowly fall from close to 9:1 at present to 8:1 in 1980, which issatisfactory.
6.10 The modernization program could have a substantial impact on ICICI'scapital structure. Assuming half the modernization program is implemented,the net increase in ICICI's disbursements would be Rs 200 million annually.This would bring its contractual debt/equity ratio to almost 10:1 by 1978.To solve this problem ICICI would have to either: (i) increase annually itsshare capital by about Rs 30 million (in addition to the Rs 30 million alreadyplanned) so as to bring the ratio back to an 8.5:1 level; or (ii) arrange tomanage its part of the modernization program on an agency basis, for a fee,without incuring any liability. Either alternative would be acceptablealthough (i) is the most likely to be implemented since GOI prefers it.GOI has indicated that it would support ICICI in obtaining sufficient fundsfor increasing its share capital.
6.11 Annex 24 shows projected cash flow statements through 1980. Col-lections are expected to improve gradually from 85% of amounts due in 1976,to 90% for 1977-1980. 1/ This improvement seems attainable given past ex-perience, 2/ the expected improvement in the economy, and the emphasis beinggiven to follow-up (para 5.03). On this basis, the debt service ratio wouldbe above 1.2:1 (1,1:1 assuming pro-ratio allocations on bonds outstanding notyet fallen due) throughout the projected period which is satisfactory. Annex25 shows the disbursement schedule for the proposed loan.
VIII. AGREEMENTS REACHED
7.01 The proposed $80 million loan would be relent initially by ICICIat rates varying between 10.0% (backward areas) and 11% (ordinary). Theamortization schedule would be flexible with three years grace and 17 yearsmaturity, though in selected cases, 5 years grace would be permitted toenable ICICI to blend Bank funds with the $17 million loan from the KuwaitInvestment Company. Every subproject involving ICICI financing of more than$4 million, including outstanding commitment, would require IBRD approval.This is the same free limit as in the last four IBRD loans. During negotia-tions ICICI's strategy statement was discussed and agreed with IBRD.
1/ The balance would either be rescheduled or would remain in arrears.
2/ Collections over amounts fallen due during the year were 90% in 1971-73,93% in 1974, 91% in 1975 and 85% in 1976.

- 24 -
7.02 During-negotiations, understandings were reached with ICICI on itsstaffing plans for its normal operations, the blending operations with theKuwait funds, an outline for the future work on the export study and engi-neering study, further plans to diversify its sources of foreign exchange,periodic review of ICICI's lending rates to maintain its profitability anda detailed plan for its share capital increases to maintain and improve itsdebt/equity ratio.

ANNEX 1Page 1
INDIA
APPRAISAL OF THEINDUSTRIAL CREDIT AND INVESTMENT CORPORATION OF INDIA LIMIT'ED
Institutional Finance for Industry in India
1. Financial Institutions. Industrial financing institutions can beclassified into those working at the all-India levels, and those at Statelevel. At the all-India level, IDBI, ICICI, IFCI, LIC and UTI 1/ are themain sources of long-term finance. At the State level, the primary institu-tions are the SIDCs, the SFCs, the SSICs, and the SSIDCs 2/. Also working atthe all-India level, but playing a more restricted role (para 2) are IRCIand NSIC 3/. IDBI, as the apex institution for industrial financing in thecountry, is responsible for coordinating the activities of these institu-tions. It also provides finance to some, particularly, to SFCs, and morerecently, SIDCs, mainly through IDBI's refinance facilities (commercial banksalso avail of IDBI's refinance facilities). Appendix 1 shows the financialassistance provided by these institutions over the period FY72-FY76 4/.
2. The previous appraisal report on ICICI 5/ discusses in more detailthe role and characteristics of the above institutions. Briefly, term lend-ing for all-India is the main responsibility of IDBI, ICICI, and IFCI,although they also make equity investments and underwrite public issues.Their total financial assistance approved up to March 31, 1976 was Rs 26billion. Securities and capital market activities are the responsibilityof LIC an UTI. However, LIC has also become an important provider of rupeeloans. Total approvals by LIC and UTI up to March 31, 1976 were Rs 4.4 bil-lion. IRCI was established to provide financial and managerial assistance
1/ Industrial Development Bank of India (IDBI), Industrial Credit andInvestment Corporation of India (ICICI), Industrial Finance Corpora-tion of India (IFCI), Life Insurance Corporation of India (LIC),Unit Trust of India (UTI).
2/ State Industrial Development Corporations (SIDCs), State Financial Cor-porations (SFCs), State Small Industries Corporations (SSICs), andState Small Industries Development Corporations (SSIDCs). In someStates, the work of SIDCs is done by SIICs (State Industrial InvestmentCorporations).
3/ Industrial Reconstruction Corporation of India (IRCI), and National SmallIndustries Corporation (NSIC).
4/ Excluding NSIC, SSICs and SSIDCs whose financial assistance is modest,involving hire purchase finance.
5/ Number 637a-IN of March 14, 1975.

ANNEX 1Page 2
to `sick-indcs '.ies" in West Bengal but has started diversifying its opera-tio-a geographially. Up to March 31, 1976 its total approvals were Rs 327.3million. The only all-India financial institution not catering to themedium-and large-scale sector is NSIC, whose financial assistance consistsof hire purchase financing amounting to Rs 862 million (in terms of valueof machinery) as of March 31, 1976.
3. At the State level, medium- aAd large-scale industries are theresponsibility of SIDCs, which apart from promotional activities make loansand equity investments (Rs 2.1 billion of approvals up to March 31, 1976).A substantial proportion went to the joint and public sectors. SFCs, whichrecently received a second line of credit from IDA (Report No. 1158-IN ofMay 6, 1976), are mainly involved in fitancing the small-scale, and also themedium-scale sector (Rs 7.5 billion of approvals for both up to March 31,1976). While their role varies somewhat from state, SSICs are usually respon-sible for the distribution and allocation of raw materials to small industries,although some are also involved in modest amounts of hire purchase financingas are the SSIDCs, although the main activity of the latter is the promotionand management of industrial estates.
4. Attachment 1 indicates that during FY76, approvals by financialinstitutions were Rs 6.6 billion and disbursements, Rs 4.3 billion. Of thetotal approvals, IDBI accounted for 39% (excluding its refinance of SFCs toavoid double counting) followed by the SFCs (23%), and ICICI (12%). ICICIprovided about 72% of foreign exchange approvals, followed by the SFCs (20%),and IFCI (8%). It is difficult to estimate accurately the contributionsof these institutions in relation to total industrial investment in India ascapital formation data are not reliable. On the basis of capital formationestimates for 1975, their disbursements accounted for about 13% of fixedcapital formation in industry. Rough estimates based on a sample of ICICIclients indicate that of the private sector's investments in fixed and cur-rent assets during FY75, internal cash generation financed 36%, foreign in-vestment and institutional finance 36%, bank borrowings for working capital23%, and capital issues 5%.
5. Commercial Banks. Apart from providing short-term working capitalto the economy, commercial banks also provide term financing estimated at10%-15% of their total outstandings 1/. Outstanding industrial term loans byscheduled commercial banks were as of March 28, 1976, Rs 2.2 billion to small-industries and Rs 3.2 billion (rough estimate) to medium and large industries.Since the nationalization of 14 commercial banks in 1969, credit to the small-scale sector has substantially increased. There is an extensive network ofbank branches in India totalling 21,200 in 1976 (8,300 in 1969), or one branchfor every 26,000 people.
1/ Commercial banks in India comprise the State Bank of India, 14 nationalizedbanks, 450 other scheduled banks in India and 14 foreign banks. Depositsby scheduled commercial banks were Rs 140 billion as of tIarch 28, 1976.

ANNEX 1Page 3
6. Consultancy Organizations. At the initiative of IDBI7 a number ofinstitutions have been created 1/, mainly to identify project ideas, prepareproject profiles and feasibility reports, as well as to look for and assistentrepreneurs in implementing these projects. While not involved in financing,these organizations are worth mentioning because of the contribution they canmake to assist financial institutions in project appraisal and implementation.It is still too early to judge their promotional effectiveness. Hiowever, theyhave already made an impact in assisting SFCs and commerical banks to completetechno-economic evaluations of a number of their proposed projects. In addi-tion, these organizations are expected to build a pool of technical expertisewhich is so badly needed in the areas they serve.
7. Coordination. There is a substantial amount of joint financing,particularly amongst the all-India term lending institutions0 About halfof ICICI's financing (by amount) during 1974 and 1975 was joint financed withIDBI, IFCI or both 2/. The institutions started joint financing to avoidundue exposure in large or risky projects or when underwriting arrangementswere required so as to avoid underwriting relatively large portions of acertain issue. All-India financial institutions have their own Inter-insti-tutional (IIM) meetings in order to coordinate their activities.
8. The Industrial Development Bank of India (IDBI) initiated the IIMin 1965. The Chief Executive of IDBI is the Chairman of this group whichalso includes the Chief Executives of ICICI, the Industrial Finance Corpora-tion of India (IFCI), the Life Insurance Corporation of India (LIC), theUnion Trust of India (UTI) and, since April 1976, the General InsuranceCorporation of India (GIC). The meetings of the IIM discuss and decide on:(a) policy matters including allocation of institutional finance betweenvarious industrial sectors keeping in view national priorities; (b) thecontribution by each of the institutions to financing relatively largeprojects (generally those requiring financial assistance of more than Rs 5million; many of these projects are financed by at least two of the abovelisted all-India financial institutions to reduce their individual exposureparticularly in underwriting); (c) waiver of exercise of the conversionoption 3/; (d) the promoters' contribution to the project cost; (e) businessplans for the participating institutions on the basis of a review of loanapplications pending and in the pipeline.
1/ The Kerala Industrial and Technical Consultancy Organization (KITCO),The North-Eastern Technical Consultancy Organization (NEITCO), andthe Bihar Industrial and Technical Consultancy Organization (BITCO)were created between 1972-74. New technical consultancy agencies havebeen set up by IDBI in Andhra Pradesh, Uttar Pradesh and Orissa during1976. IFCI is setting up similar institutions in Himachal Pradesh andRajasthan.
2/ LIC and/or UTI also participated in most of these cases.
3/ Each All-India financial institution has the option to convert 20%of its rupee loans into share capital of the borrower.
ANNEX IPage 4
9. Senior Executive Meetings (SEMs) take place twice a month in betweenthe III meetings. In the first monthly meeting, senior executives of theorganizations discuss more detailed matters such as the: (a) stipulation ofconversion terms; (b) nomination of directors in the borrower's boards (c)decision on the institution which would take the lead in appraisal and follow-up; and (d) exercise of conversion options. The second SEM each month isdevoted to review project supervision, particularly problem projects.
1Oo A lead bank system was established, by which one insti-tution would take the "lead"' in appraisal and follow-up, although eachreserves the right to submit to its own toard a recommendation by its stafffor each project. The arrangement has been streamlined gradually and by nowapplication forms, reporting requirements, legal documentation for disburse-ments, etc., have been standardized to avoid duplication of efforts and anadditional burden on the clients. The "lead" bank arrangement is workingreascnably well.
11. Apart from the establishment of the lead bank system which helpscoordination among all-India institutions, better coordination at the Statelevels being attempted through cross representation on Board of Directorsand through Inter-Institutional Group (IIG) meetings. IIG meetings compriserepresentatives of all State level and all-India financial institutions,including commercial banks. Where the states are small, one group coversseveral contiguous states. These groups meet periodically and cover a rangeof subjects including participation of the different institutions in projectfinancing; new project proposals and their relation to the state industrialpolicy; the state investment program and the need for financial resourcesand the availability of private entrepreneurs to participate in state pro-moted projects.
12. Evaluation. In terms of availability of services, the financialsystem in India is adequate. There is a tendency at the State level to createnew institutions as the need arises, rather than utilize the expertise alreadyavailable. However, this can be justified to a certain extent when takinginto account the diversified culture of the country and efforts are being madeto improve coordination (para 11). Many of the above institutions have beensuffering from resource constraints due to GOI's strict monetary policy, butthis was necessary, and should improve the lending environment in the long run.A problem has been the lac;; of equity capital by medium and small entrepre-neurs to start industries. In the case of medium and large industries, thishas been partly tackled through the institution of the joint sector, where aprivate firm joins with the State Government to implement a project 1/. Thejoint sector is also being used as a promotional tool by State Government, asit offers the attractiveness of private sector management combined with
1/ The joint sector is defined as enterprises with 25% equity capitalprovided by a private partner and 26% equity provided by the StateGovernment or its controlled corporations. The balance of equityis placed with the general public.

ANNEX 1Page 5
the benefits of the State Government's superior leverage in matters affectinglicensing, availability of inputs, etc. In addition, IDBI and IFCI are exper-imenting with interest-free loans to medium-scale entrepreneurs towards theircontribution to the equity of projects, although the amounts are modest. Forsmall-scale industries, SFCs are also establishing a "special capital" mecha-nism to solve this problem (refer to the appraisal report for the secondIDBI/SFCs project No. 1168-IN, para 4.03). Overall, while most of the State-level institutions need strengthening, the financing system is adequate.
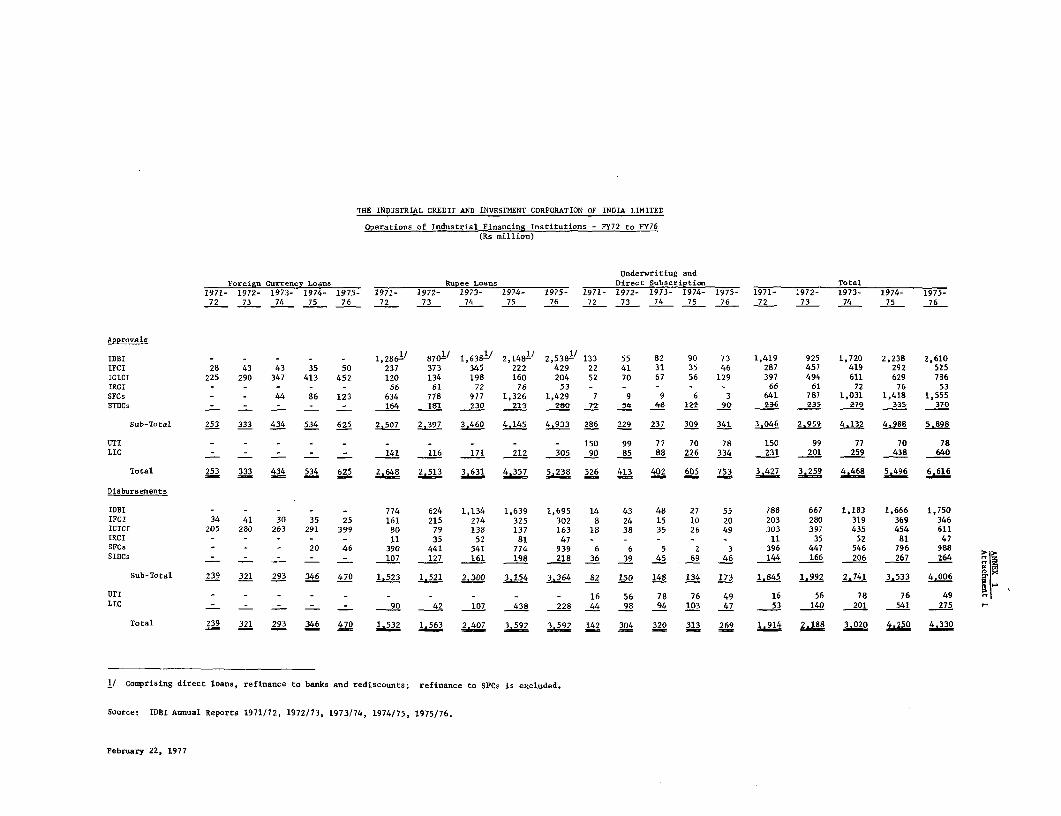
THE INDUSTRIAL CREDIT AND INVESTMENT CORPORATION OF INDIA LIMITED
Operations of Industrial Financing Institutions - FY72 to FY76(Rs million)
Underwriting andForeign Currency Loans Rupee Loans Direct Subscription Total
1971- 1972- 1973- 1974- 1975- 1971- 1972- 2973- 1974- 1975- 1971- 1972- 1973- 1974- 1975- 1971- 1972- 1973- 1974- 1975-72 73 74 75 76 72 73 74 75 76 72 73 74 75 76 72 73 74 75 76
Approvals
IDBI - - - - - 1,286-1 8701' 1,6381/ 2,148-1 2,538-/ 133 55 82 90 73 1,419 925 1,720 2,238 2,610IFCI 28 43 43 35 50 237 373 345 222 429 22 41 31 35 46 287 457 419 292 525ICICI 225 290 347 413 452 120 134 198 160 204 52 70 67 56 129 397 494 611 629 786IRCI - - - - - 66 61 72 76 53 - - - - - 66 61 72 76 53SFCs - - 44 86 123 634 778 977 1,326 1,429 7 9 9 6 3 641 787 1,031 1,418 1,55557DCs _ - - - - 154 181 230 213 280 l2 54 48 122 90 236 235 279 335 370
Sub-Total 253 333 434 534 625 2.507 2,397 3.460 4,145 4.933 286 229 237 309 341 3.046 2.959 4.132 4.988 5.898
UTI - - - - - - - - - - 150 99 77 70 78 150 99 77 70 78LIC - - - - - 141 116 171 212 305 90 85 88 226 334 231 201 259 438 640
Total 253 333 434 534 625 2.648 2.513 3.631 4.357 5.238 26 413 402 605 753 3427 3259 468 5.496 616
Disbursements
IDBI - - - - - 774 624 1,134 1,639 1,695 14 43 48 27 55 788 667 1,183 1,666 1,750IFCI 34 41 30 35 25 161 215 274 325 302 8 24 15 10 20 203 280 319 369 346ICIci 205 280 263 291 399 80 79 138 137 163 18 38 35 26 49 303 397 435 454 611IRCI - - - - - 11 35 52 81 47 - - - - - 11 35 52 81 47SFCs - - 20 46 390 441 541 774 939 6 6 5 2 3 396 447 546 796 988 >SIDCs _ - - - - 107 127 161 198 218 36 39 45 69 46 144 166 206 267 264
Sub-Total 239 321 293 346 470 1 523 1.521 2.300 3.154 3.364 82 150 148 134 173 1845 1.992 2.741 3,533 4.006 2
UTI 16 56 78 76 49 16 56 78 76 49 'LIC - - - - -90 42 107 438 228 44 98 94 103 47 53 140 201 541 275 -
Total 239 321 293 346 470 1.532 1.563 2.407 3.592 3 592 142 304 320 313 269 1 914 2188 3.020 4.250 4.330
1/ Comprising direct loans, refinance to banks and rediscounts; refinance to SPCs is excluded.
Source: IDBI Annual Reports 1971/72, 1972/73, 1973/74, 1974/75, 1975/76.
February 22, 1977
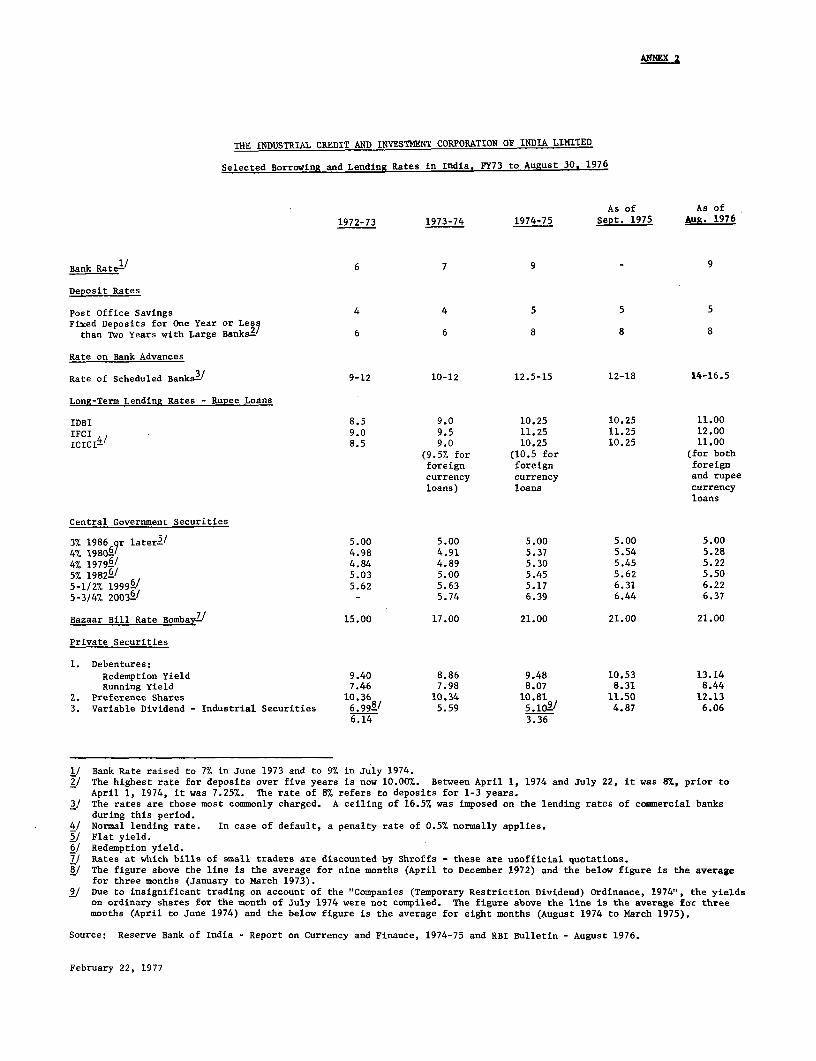
ANNE 2
THE INDUSTRIAL CREDIT AND INVESTMENT CORPORATION OF INDIA LIMITED
Selected Borrowing and Lending Rates in India. FY73 to August 30. 1976
As of As of
1972-73 1973-74 1974-75 Sept. 1975 Aug. 1976
Bank Ratel/ 6 7 9 - 9
Deposit Rates
Post Office Savings 4 4 5 5 5Fixed Deposits for One Year or Less
than Two Years with Large Banks2/ 6 6 8 8 8
Rate on Bank Advances
Rate of Scheduled Banks,3 9-12 10-12 12.5-15 12-18 14-16.5
Long-Term Lending Rates - Rupee Loans
IDBI 8.5 9.0 10.25 10.25 11.00IFCI 9.0 9.5 11.25 11.25 12.00ICICI-/ 8.5 9.0 10.25 10.25 11.00
(9.5% for (10.5 for (for bothforeign foreign foreigncurrency currency and rupeeloans) loans currency
loans
Central Government Securities
3% 1986 r lateri/ 5.00 5.00 5.00 5.00 5.004%. 19SL6? 4.98 4.91 5.37 5.54 5.28
4% 19796/ 4.84 4.89 5.30 5.45 5.225% 19826/ 5.03 5.00 5.45 5.62 5.50
5-1/2% 19996/ 5.62 5.63 5.17 6.31 6.225-3/4% 20036/ - 5.74 6.39 6.44 6.37
Bazaar Bill Rate Bombay// 15.00 17.00 21.00 21.00 21.00
Private Securities
1. Debentures:
Redemption Yield 9.40 8.86 9.48 10.53 13.14Running Yield 7.46 7.98 8.07 8.31 8.44
2. Preference Shares 10.36 10.34 10.81 11.50 12.13
3. Variable Dividend - Industrial Securities 6.998/ 5.59 5.102/ 4.87 6.066.14 3.36
1/ Bank Rate raised to 7% in June 1973 and to 9% in July 1974.2/ The highest rate for deposits over five years is now 10.00%. Between April 1, 1974 and July 22, it was 87., prior to
April 1, 1974, it was 7.25%. The rate of 87 refers to deposits for 1-3 years./ The rates are those most commonly charged. A ceiling of 16.5% was imposed on the lending rates of commercial banks
during this period.4/ Normal lending rate. In case of default, a penalty rate of 0.5% normally applies.5/ Flat yield.6/ Redemption yield.7/ Rates at which bills of small traders are discounted by Shroffs - these are unofficial quotations.
8/ The figure above the line is the average for nine months (April to December 1972) and the below figure is the average
for three months (January to March 1973).9/ Due to insignificant trading on account of the "Companies (Temporary Restriction Dividend) Ordinance, 1974", the yields
on ordinary shares for the month of July 1974 were not compiled. The figure above the line is the average for three
months (April to June 1974) and the below figure is the average for eight months (August 1974 to March 1975).
Source: Reserve Bank of India - Report on Currency and Finance, 1974-75 and RBI Bulletin - August 1976.
February 22, 1977

AUll 3
TiZ DDUSTRIAL CRSDIT AD 7mtV2NET C01.ORPOU11 OF IIDID LIMtnD
Distribution of Sbarabolding as of October 31. 1976
so. of No. ofNDIA Sharaholdert $beraa Amunt Percentage
Official Sector
Life Insurance Corporationof India 319,761 31,976.100
New India Assurance Co. Ltd. 165,977 16,597,700Unit Trust of India 153,308 15,330,800Sank of India 89,346 8,934,600General Insurance Corporationof India 71,624 7,162,400
National Inursuance Co. Ltd. 71,209 7,120.900Punjab National bank 63,150 6,315,000BSnk of Bsarods 52,831 5,283,100Dnited Bank of India 31,030 3,103,000Oriental Fire & Geral
Insurance Co. Ltd. 29,049 2,904,900United Co_ercial Bank 24,500 2,450,000Indian Overseas Bank 20,689 2,068,900United India Fire & GeneralInsurance Co. Ltd. 18,499 1,849,900
Central Bsank of India 10,693 1,069.3009 Other Official Sectorshareholdars holding lessthan 7,500 shares each 13,005 1,300,500
23 1,134,671 113.467,100 75.64
Private Sector
Indo-Burma Petroleum Co. Ltd. 19,992 1,999,200Scindia Steam NavigationCo. Ltd. 11,501 1,150,100
Clive Row Invest ent HoldingCo. Ltd. 9,497 949,700
Associated Cement Co. Ltd 9,363 936,30056 Other private sector abare-holders holding les than7,500 ahares etch 45,505 4,550,500
1,911 Individual shareholdersholding less than 7,500shsres each 53,320 5,332,000
1,971 149,178 14,917,800 9.95
1,994 1,283,849 128,384,900 85.59
7018108
The Chartered Bank 37,500 3,750,0006 Others holding leest than7,500 shares each 12,173 1,217,300
9 49,673 4,967,300 3.3,w
U.S.A.
Bank of America N.T. & S.A. 18,750 1,875,000
Bank of Americs 18,700 1,870,000Citibank N.A. 1,0 ,0.0Olin Corporation 1,500,000Aerica espress InternationalBanking Corporation 10,000 1,000,200Northwest International Sank 7,499 749,9007 Others holding less than7,500 shares each 15.726 1,572,600
13 98,177 9,817,700 6.54
Federal Republic of Gerranv
Deutsche Bank AG 22,500 2,250.000Dresduer Bank AG 18,750 1,875,000
2 41,250 4,125,000 2.75
Jap-n
Bank of Tokyo Ltd. 7,500 750,000The Mitsui Bank Ltd. 7,500 750,000The Industrial Bank of Japan Ltd. 3,552 355,200
3 18,552 1.855,200 124
Sweden
Skandinaviska Enaskilda Bsanken 1 4,500 450,000 0.30
France
Banque Nationale de Paris 3,999 399,900 0.27
Total number of Shares andShareholders 2,023 1.500,000 150,000.000 100,00
Februgry 22, 1977

THE INDUSTRIAL CREDIT AND INVESTMENT CORPORATION OF INDIA LIM1TED
Members of the Board of DirectorsaS of October 31. 1976
Year of
Name Appointment Age Principal Present Position
Mr. H. T. Parekh* 1968 65 Chairman, ICICIM4r. J. S. Baj* 1973 62 ChaLirman, Tamil Nadu Industrial
Investment CorporationVice Chairman, ICICI
Mr. Raghu Raj 1976 59 Chairman and Managing Director,Industrial Development Bankof India
Mr. K. K. Birla* 1959 57 Managing Director,Birla Brothers Pvt. Ltd.
Mr. D. P. Goeaka 1959 60 ChairmanOctavius Steel & Co. Ltd.
Mr. N. A. Palkhivala 1959 56 Advocate, Supreme Court of IndiaChairman, Associated CementCo. Ltd.
Mr. L. J. Mulkern 1963 56 Senior Vice PresidentBank of America, N.T. & S.A.,Tokyo, Japan
Mr. N. M. Wagle* 1966 61 Chairman,The State Industrial andInvestment Corporation ofMaharashtra Ltd.Chairman, Paville FashionsPvt. Ltd.
Mr. M. V. Sohonie 1969 64 Company DirectorHr. R. V. Raman 1973 57 Secretary, Ministry of Industry
and Civil Supplies, Governmentof India
Mr. M. Sen Sarma 1974 59 Chairman and Managing DirectorUnited Bank of India
Mr. M. D. McWilliam 1975 43 General ManagerThe Chartered Bank, London
Mr. M. V. Arunachalam 1975 48 Chairman,T. I. Diamond Chain Ltd.
Mr. K. P. A. Menon 1976 49 Additional SecretaryMinistry of FinanceDepartment of BankingGovernment of India
Mr. S. S. Mehta* 1973 58 Managing Director, ICICI( Dr. Phirose B. Nedhora* 1974 49 Joint Managing Director, ICICIMr. J. M. Ahrens(Alternate Director forMr. L. J. Mulkern) 1973 52 Regional Vice President
South Asia Regional OfficeBank of America,N.T. & S.A., Bombay
Mr. N. H. Green(Alternate Directorfor Mr. M. D. McWilliam) 1975 47 Chief Manager in India
The Chartered Bank
* Members of the Board's Investment COMittee which decidesthe disposition of ICICI's securities portfolio.
@ On deputation to the World Bank.
February 22, 1977

ANNEX 5Page 1
INDIA
INDUSTRIAL CREDIT AND INVESTMENT QORPORATION OF INDIA LIMITED
ICICI's Financing Strategy(Approved by ICICI's Board of Directors)
As a development banking institution, ICICI's financing policiesmust continue to subserve national objectives in the industrial sphere.The early years of ICICI coincided with a phase in the country's indus-trialisation efforts diTected towards a diversification and a deepeningof its industrial structure. In this phase, the financial assistanceprovided by ICICP largely performed the task of building up capacities.in the non-traditional sector f- the. undan industry; The non-traditionalindustries and the new industries are still major claimants of ICICI'sassistance, and its support to traditional industries, relatively smallin the past, has been of-critical value to several of the establishedcompanies in this field which were undertaking balancing and productimprovement progwammes for strengtlkening their competitive capacity withinthe country and in the export market.
2. In the coming period, ICICI sees for itself a considerably largerrole in the financing of traditional industries as well as several of theolder enterprises established during the fifties and the early sixties whoseneeds of modernisation are likely to receive increasingly, the attentionof the financial institutions. As part of this, ICICI, alongwith othernational financing institutions would also be assuming its share offinancing the modernisation of five industries, namely, Cotton Textiles, JuteTextiles, Sugar, Paper and Engineering.
3. For many years now ICICI's appraisals and evaluation proceduresfor projects have given weightage to the socio-economic aspects. The economicindicators for a large majority of ICICI financed projects have generallybeen favourable. A rising proportion of ICICI's assistance in recent yearshas gone to projects in the backward regions of the country and, presently,nearly 40 per cent of ICICI's new financing is in such projects. Otherconsiderations which receive appropriate weightage in ICICI's financing arethe need to encourage new entrepreneurs in Indian industry, and export-oriented projects.
4. Industrywise, ICICI's financing priorities remain substantiallyunchanged. Reproduced below is a list of six priority areas which willreceive attention from ICICI.
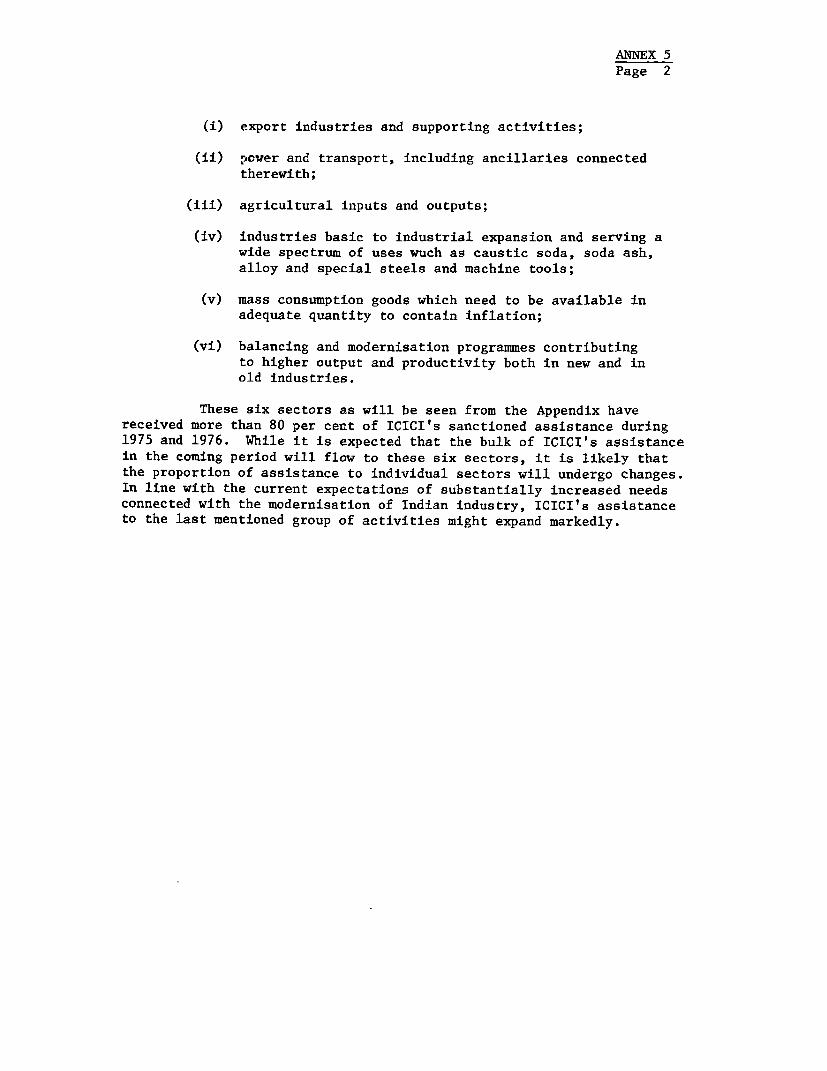
ANNEX 5Page 2
(i) export industries and supporting activities;
(ii) power and transport, including ancillaries connectedtherewith;
(iii) agricultural inputs and outputs;
(iv) industries basic to industrial expansion and serving awide spectrum of uses wuch as caustic soda, soda ash,alloy and special steels and machine tools;
(v) mass consumption goods which need to be available inadequate quantity to contain inflation;
(vi) balancing and modernisation programmes contributingto higher output and productivity both in new and inold industries.
These six sectors as will be seen from the Appendix havereceived more than 80 per cent of ICICI's sanctioned assistance during1975 and 1976. While it is expected that the bulk of ICICI's assistancein the coming period will flow to these six sectors, it is likely thatthe proportion of assistance to individual sectors will undergo changes.In line with the current expectations of substantially increased needsconnected with the modernisation of Indian industry, ICICI's assistanceto the last mentioned group of activities might expand markedly.

ANNEX 5Appendix
ICICI Assistance During 1975 and 1976 to IndustriesCovered by Six Priorities
(Rupees in Million)
1975 1976Total Totalassis- % distri- assist- % distri-tance bution ance bution
1. Export industries andsupporting activities(including shipping) 345 39% 469 42%
2. Coal, power, transport(other than shipping -including ancillaries) 73 8% 100 9%
3. Agricultural inputs andoutputs 16 2% 24 2%
4. Selected basic industries(caustic soda, alloy andspecial steels, andmachine tools, etc.) 95 11% 139 12%
5. Mass consumption goods 113 12% 125 11%
6. Balancing and moderni-sation programmes. 70 8% 135 12%
Total of the six groups 712 80% 992 88%
Gross sanctions to allindustries 885 100% 1123 100%

ANNEX 6
THE INDUSTRIAL CREDIT AND INVESTMENT CORPORATION OF INDIA LIMITED
Main Terms and Conditions for Assistance(As on October 1, 1976)
Standard Concessional-/
A. Rates of Interest
i) Foreign currency loans 11.0% p.a. 10.0% p.a.ii) Rupee loans 11.0% p.a. 9.5% p.a.
iii) Additional interestrate for loans toprivate limited companies 1.0% p.a. Exemption on
selective basis
B. Commitment Charge on FE loans 10% p.a. 1.0% p.a.on RL loans 1.0% p.a, 0.5% p.a.
(Charged on undrawn portion ofloan, and starts from the date ofsanction for foreign currencyloans and 6 months after thesanction or signing of the Headsof Agreement, whichever is earlier,for rupee loans)
C. Underwriting Commission
i) Shares 2.5% 1.25%ii) Debentures 1.5% 0.75%
D. Grace Period Upto 3 years Upto 5 years
E. Repayment Period Upto 12 years Upto 20 years
1/ For assistance to projects in backward districts,concessional terms are applicable for the firstRs 20 million term loans comprising rupee andforeign currency loans and Rs 10 million under-writing, provided by the Central financinginstituti*ns.
Note: In certain cases, rupee lineBbf creditwere extendedat a rate higher by 1% over the normal rate.
February 22, 1977

ANNEX 7
THE INDUSTRIAL CREDIT AND IVRSTNENT CORPORATION OF INDIA LIMITED
Resource Position as of September 30. 1976
Re million
Reservea (sembei 30, 1g6) 201.2
Pour G"e1msat of Ka&.a LoSsi
Total 325.0
Les: Regpents jt 3. 162.0
Losue and Grants from ovgmesft of Indiaout of UV Intereet Differentisal Fnd(Net) 11.4
Nine IDBI Loans
Total 253.9
Lees: Repayments 52 201 .0
Debentures 62C .0
Total Resouroce 134$.6
Less: Loans and InvestmentsOutstanding 1051.9
Net Pixed Assets 16.0 103e.9
Resources Available for Disbursement 300.7
Less: Undisbursed Commitment 1 24.6
Resouroes Available for Commitnent 8' .1
Porei eWrmen, Iaaouro.
Eleven IBED Lines of Credit
Total S 435.0 m.
Less: Cancellations and Repayments S 177<L. 2315.7
One AID Line of Credit
Total S 5.0 n.
Less: Coeilationa azd Repayments S 4.9 0.9
Fifteen EfW Lines of Credit
Total DN 124.5 a.
ZeaE: Repayments DN 2L.2-m. 30'0.3
Sil U.K. Lines of Credit
Total £ 8.0 a.
Leas: Cancellations l 0.2 a. 142.1
First Swiss Bond IJsue SP 8.0 a.
L ej: Hanagement Pee & UnderwritingCommissiop SP 0 26.5
Total Resouroes 2785.5
Le_ss Loean Outstanding 1826.5
aeaouroes Available for Disbursement 959.0
Leess TJndiaburaed Connitaant 507.7
Resources Available for Conmaitnent 451.3
Notes (1) Guarsntees have been ignored tOroughout.
(2) The amounts a.pproved but not committed are rupees:Rs 532.7 zillion and foradgn ourrenogee: B 513.5 aillion.
e.br-" 22. 1977
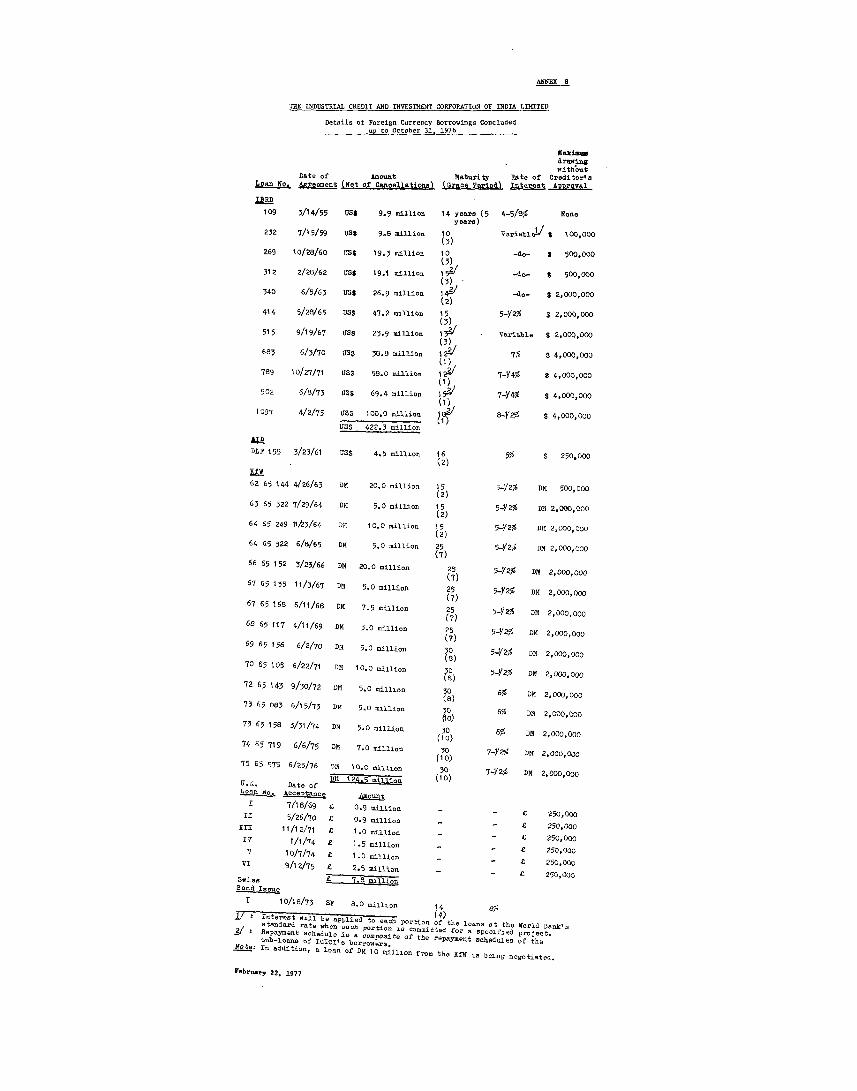
ANNEX 8
THE INDUSTRiA. CREDIT AND INVESTMENT CORPORATION OF INDIA LIMITED
Details of Foreign Currency Borrowings Concludedup to October 31, 1976
drawing
withoautDate of Amount Maturity Rate of Creditor's
Loan No. _reeoent (Net of Canoellations) (Orape Period) lterest Approval
IBRD
109 3/14/55 US$ 9.9 million 14 yearo (5 4-5/8% None
y ear s)
232 7/i5/59 US$ 9.8 jillion 10Y Variable).Y S 100,000
(3)269 10/28/60 US$ 19.3 million 10 -do- S 500,000
312 2/28/62 US$ 19.1 million 153 -do- 500,000
(3)340 6/5/63 US5 26.9 millio. 14?'/ -do- 3 2,000,000
(2)
414 5/28/65 USS 47.2 million 15 5-y2% 3 2,000,000
(3)515 9/19/67 US8 23.9 million 1 3
9/ Varitble S 2,000,000
683 6/3/70 11S2 38.8 million 123/ 7% 8 4,000,000
(1)789 10/27/71 US1 58.0 million 12i/ 7-Y4S, 8 4,000,000
902 6/8/73 DS8 69.4 million I53/ 7-Y4% 8 4,000,000
(1)1097 4/2/75 USS 100.0 million t8"/ 8-Y2q S 4,000,000
US8 422.3 million
D119 155 3/23/61 US$ 4,5 million 16 5% $ 250,000(2)
KrM
62 65 144 4/26/63 DR 20.0 million 15 5-y2% DX 500,000
(2)63 65 522 7/29/64 DM 5.0 million 15 5-y2% D11 2,000,000
(2)5-2 i200,0
64 65 249 11k3/64 D.11 10.0 million (2 5-Y2% DII 2,000,000
(2)
64 65 322 6/8/65 DM 5.0 million 25 5-Y2% DM 2,000,000
(7)
66 65 152 3/23/66 DM 20.0 million 25 5-Y2% DM 2,000,000(7)
67 65 135 11/3/67 DM 5.0 million 25 5-Y2% DM 2,000,000(7)
67 65 168 6/11/68 DM 7.5 million 25 5-Y2% DM 2,000,000(7)
68 65 117 4/11/69 DM 5.0 million 25 5-Y256 DM 2,000,000(7)
69 65 156 6/2/70 DMf 5.0 million 30 5-Y2% DM 2,000,000
(8)70 65 105 6/22/71 DM 10.0 million (8 5-Y2%j DM 2,000,000
72 65 143 9/30/72 DM 5.0 million 30 6% D1M 2,000,000
(8)73 65 083 6/15/73 DM 5.0 n.llion 30 6% D5 2,6000,000
(1 0)012,0,0
73 65 158 3/31/74 DM 5.0 million 30 6% DM 2,000,000(10)
74 65 719 6/6/75 Dl, 7.0 million 30 7-Y2% DMH 2,000,000(10)
75 65 575 6/25/76 DII 10.0 million 30 7-Y2% Dl 2,000,000
u.r., ~ ~ DI Daeof 1 24.3 million (10)U.1.0. Date of M Z
I,en No Ae2ptoanne Amount
C 7/18/69 z 0.9 million -250,000
II 5/26/70 S 0.9 million _ 250,000
IrI 11/12/71 J 1.0 million -250,000
V 10/7/74 0 1.5 million I C 250,000
VI 9/12/75 C 2.5 million - - C 250,000
Snis£ 7.8 mullIon
Bond Isaue
r 10/18/73 SF 8.0 million 14 8
standard rate vhen such portion .o committed for a spat fted prorect.2/ lloPaYment Schedule oaonent o the foroyen spchfedus ofj the
,ub-boans of IChIT'. borroeOntoreamet.cedle f h
Note In addition, e loan of DM 10 milluon from the KIfW S beong nogotiated.
Pebrury 22, 1977

_NNEY 9_
TOe INDUSTRIAL CRRDIT AND I9VER9 ST CORPORATION OF INDIA LIMITED
Details cf 002cc Rorrowengse Cooaladed
Ranig vi,-Date of hArnt MatPrity Rate of Repaymoent a-via Capital
Loan Fo. AMoveent PA wiorl1oao- FLe oodS 1nterest Betins in nd Debt_
governOOt Loant :
1 I/29/55 75 30 ycare Free of 1970 subordirAted to(15 yoara) interest all debi aAd
paid-up sharecapi
tal
2 10/26/59 100 22 4y2% 1971 SD'bordirated to(11 ) foreien debt
(oxoept SF.bonde only)
3 7/31/65 100 16 5% for It 90 1970 _do_(5) million,
5Y2% forpi Io million
4 7/30/66 50 1(5 5Y29 1t971 -do-__ 5)
325
IDBI Loans:
I 11/1/66 50 15 5-5/89 1972 _do-
2 5/10/67 30 14 4-5/8% 1972 _do-(4)
3 11/27/68 25 15 5_5/8% 1974 _do-
4 6/13/69 1a 15 5-5/0% 1975 -do-(4)
5 2/17/71 18 14 sY4f 1976 _do-(4)
6 3/22/72 18 14 623% 1977 _do_(4)
7 11/26/7 28.5 14 6-3/4% 1979 -do-(4)
8 9/3/74 19 1 4 7-3/4% 1979 _do-.(4)
9 11/26/75 47.4 14 7-3/4S 1980 -do-_ (4)
253.9
Dobeotvre Ireugn:
1 10/27/67 60 Redeemed Rn 6% - -N.o-eebe. 3,1975
2 11/25/69 50 Redeemable at 651 - Subordina:e topar on December foreign dobt1, 1980 (except S1'
Bonds onl)
3 6/1/72 70 Redeemablc at 6, - -do-par on July 1,1984
4 3/20/73 9O Redeenablo at 6% - -do-par on Ipril 1,1985
5 5/30/74 90 Redeemiablo at 6Y4% - -do-par on uae 15,1966
6 2/10/75 55 Redeemable at 6Y4% - -do-par on Aipil 1,1985
7 8/2/75 137,5 aRedeemable at 6Y4% - -do-par on Septom-bgr 1, 1990
8 4/26/76 137.5 -Rad.eooble et 6Y43 - _do_par on lEay t5,1991
9 9/9/76 165.0 aRedeble at 6y454 - _-do-par on October
_ 1 5, 1992
9.15.0
G Coaranteed by the Covernment of India aR regards the repayment of preocipaLand the payment of intereat.
1cl,a-re 22, 1977

ANNEX 10Page 1
INDIA
APPRAISAL OF THEINDUSTRIAL CREDIT AND INVESTMENT CORPORATION OF INDIA LIMIT.D
ICICI's Overall Operations
Trends
1. General. As a result of declining demand in certain key industrialsubsectors, ICICI's total net approvals declined slightly from Rs 722.6 mil-lion in 1974 to Rs 712.3 million in 1975. However, during the first tenmonths of 1976, total net approvals amounted to Rs 841.3 million, or a growthof 41% on an annual basis over 1975 (Attachment 1). Similarly, for the sameperiod in 1976, commitments amounted to Rs 745.8 million, or 63% more than thelevel in 1975 on an annual basis, part of which is explained by the level ofguarantees (Rs 87.8 million) compared to nothing in 1975. These sharp in-creases are not yet reflected in the level of disbursements though by the endof 1976 these are expected to reach Rs 655 million compared to Rs 546 millionin 1975.
2. Loans. Foreign currency loans have accounted for 61%, and localcurrency loans for 22% of total ICICI approvals since its inception. From1973 to the first ten months of 1976, foreign currency loans accounted for56% of total approvals, and rupee loans 30% (para 12). Foreign currency loansincreased from Rs 442 million in 1973 to Rs 515 million in 1974, then declinedto Rs 353 million during the business recession, and are expected to increaseto Rs 425 million in 1976. By contrast, local currency loans increased fromRs 175 million in 1973 to Rs 361 million for the first ten months of 1976.
3. Investments. ICICI's investment operations include both directsubscription and underwriting of debentures and share issues. The two combinedconstitute 14% of ICICI's total approvals since its inception and 8% of totalapprovals in the first 10 months of 1976. The decreasing trend in the propor-tion of this type of financing by ICICI, contrasted with the growth of rupeeloans, reflects ICICI's resource constraints. Most equity investments areexecuted in conjunction with a loan, and for large projects they are arrangedjointly with other financial institutions.
4. Including underwriting and direct subscription, investment c ora-tions by ICICI reached Rs 127.8 million in 1975 compared to Rs `4.2 millionin 1974, mainly due to increased debenture subscriptiors. Atta3chment 2 sum-marizes the changes in the volumes and types (shares and debentures) ofICICI's investments. In view of the weak state of the secondary markets,investment in debentures is now mainly done through direct subscription rather
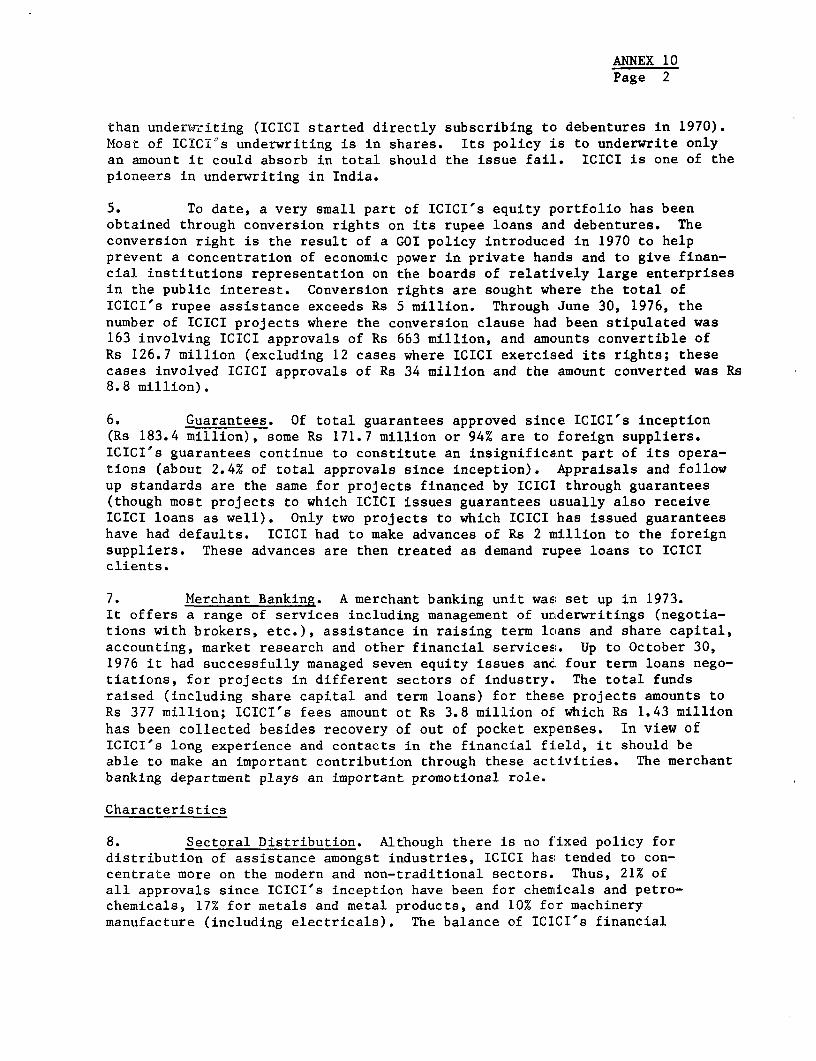
ANNEX 10Page 2
than underwriting (ICICI started directly subscribing to debentures in 1970).Most of ICICI0s underwriting is in shares. Its policy is to underwrite onlyan amount it could absorb in total should the issue fail. ICICI is one of thepioneers in underwriting in India.
5. To date, a very small part of ICICI's equity portfolio has beenobtained through conversion rights on its rupee loans and debentures. Theconversion right is the result of a GOI policy introduced in 1970 to helpprevent a concentration of economic power in private hands and to give finan-cial institutions representation on the boards of relatively large enterprisesin the public interest. Conversion rights are sought where the total ofICICI's rupee assistance exceeds Rs 5 million. Through June 30, 1976, thenumber of ICICI projects where the conversion clause had been stipulated was163 involving ICICI approvals of Rs 663 million, and amcunts convertible ofRs 126.7 million (excluding 12 cases where ICICI exercised its rights; thesecases involved ICICI approvals of Rs 34 million and the amount converted was Rs8.8 million).
6. Guarantees. Of total guarantees approved since ICICI's inception(Rs 183.4 million), some Rs 171.7 million or 94% are to foreign suppliers.ICICI's guarantees continue to constitute an insignificant part of its opera-tions (about 2.4% of total approvals since inception). Appraisals and followup standards are the same for projects financed by ICICI through guarantees(though most projects to which ICICI issues guarantees usually also receiveICICI loans as well). Only two projects to which ICICI has issued guaranteeshave had defaults. ICICI had to make advances of Rs 2 million to the foreignsuppliers. These advances are then treated as demand rupee loans to ICICIclients.
7. Merchant Banking. A merchant banking unit was set up in 1973.It offers a range of services including management of underwritings (negotia-tions with brokers, etc.), assistance in raising term loans and share capital,accounting, market research and other financial services. Up to October 30,1976 it had successfully managed seven equity issues anc four term loans nego-tiations, for projects in different sectors of industry. The total fundsraised (including share capital and term loans) for these projects amounts toRs 377 million; ICICI's fees amount ot Rs 3.8 million of which Rs 1.43 millionhas been collected besides recovery of out of pocket expenses. In view ofICICI's long experience and contacts in the financial field, it should beable to make an important contribution through these activities. The merchantbanking department plays an important promotional role.
Characteristics
8. Sectoral Distribution. Although there is no fixed policy fordistribution of assistance amongst industries, ICICI has tended to con-centrate more on the modern and non-traditional sectors. Thus, 21% ofall approvals since ICICI's inception have been for chemicals and petro-chemicals, 17% for metals and metal products, and 10% for machinerymanufacture (including electricals). The balance of ICICI's financial

ANNEX 10Page 3
assistance has gone to textiles (8%), automobiles and cycles (6%), pulpand paper products (6%), rubber (5%), ceramics and glass (4%), shipping (4%)and other industries (19%). The trends have remainded relatively constantin the last few years (Attachment 3). Though ICICI assists a wide range ofindustries, its financing of traditional industries, such as textiles, ismostly for meeting balancing equipment needs. In view of ICICI°s expertisein the technologically advanced projects, and of the fact that other insti-tutions cater more to the traditional sectors, the sectoral distributionof ICICI's financing is adequate.
9. Geographical Distribution, The geographical distribution of ICICI'sapprovals of financial assistance from 1955 to October 31, 7976 is as follows(see Attachment 3): Western India (53%), South India (25%), North East India(6%), North India (14%), and East India (2%). Compared to the national aver-ages 1/, a definite skew in favor of Western India is apparent which i's inpart due to the fact that a large proportion of non-traditional industries arelocated in Western India. The strengthening of the Regional Offices should bea useful device to help ICICI attain a better overall geographical distribu-tion of its financial assistance.
10. Diversification of Clientele. As of June 30, 1976 approvals offinancial assistance by ICICI aggregated Rs 7.2 billion for 1,919 projectsand 1,070 clients. Of these 1,919 projects, 849 (or 44%) were sponsored byclients which had received financial assistance from ICICI previously. Interms of amounts financed, these projects accounted for 48% of ICICI'stotal approvals, a reasonable ratio for a development finance company whichhad been in operation for almost 20 years with well established clients havingsizeable cash flows. Some 142 projects, accounting for 6% of total ICICIfinancing, were established by a new entrepreneurs 2/.
11. ICICI has financed mainly private sector industries, although it hasalso financed some public and increasingly, joint sector companies (companieswith Government ownership between 25%-49%). Up to June 30, 1976 it had ex-tended assistance of Rs 468.5 million to 56 Joint Sector companies, whichrepresented 6% of its total approvals as of the same date. This is almostdouble the assistance compared to June 30, 1974 (Rs 240.9 million to 27companies). It had also financed 13 projects with Government ownership above51%; sanctions were Rs 108 million. Though a nominal amount of ICICI°s financ-ing has gone to small scale industries, large and medium-scale industrieshave been the major beneficiaries of ICICI's assistance.
1/ The geographical distribution of industrial value added in India for1969 was: Western India (41%), South India (18%), North East India(22%), North India (13%), and East India (6%); however, the figuresare not strictly comparable since the overall data for India includeboth private and public sector investment.
2/ Persons who had no ownership of industrial plants in the past.

ANNEX 10Page 4
12. Local Currency and Import Financing. ICICI is the main source offoreign currency finance for large projects 1/ in India. In 1975/76, it pro-vided 72% of the foreign currency loans extended by term Lending institutions;SFCs and IFCI provided the rest. The recent increase in ithe importance ofrupee financing is mainly due to the inproved availability of Indian capitalgoods, improvements in ICICI's local resource position, and increased demanddue to the credit squeeze on commercial banks particularly during the period1975-76.
13. Nature of Project. Since in¢eption to October .31, 1976, ICICIhad approved assistance to 1,998 projects, of which 592 (accounting for 33%of ICICI's assistance by amount) were new projects, and 1,406 (accounting for67% of ICICI's assistance by amount) were projects for expansion of capacity,balancing or modernization. For the first ten months of 1976, new projectsaccounted for 33% of approvals, expansion (31%), modernizat..on, balancingand replacement (14%), diversification (13.0%), research and development(2.0%) and other (7.0%) which is representative of previous years.
14. Size of Loans. Because ICICI caters mainly to big clients, theaverage size of its loans is relatively large. During 1974, 1975 and thefirst ten months of 1976, the average size of loans was $344,386 per projectin the case of rupee loans. Details on the size of ICICI's loans are given inAttachments 4 and 5.
15. Maturity of Loans. Foreign currency loans committed during 1974,1975 and the first ten months of 1976 had somewhat shorter maturities thanduring previous years. Only 39% of the total number of loans had terms often years or more (as compared to 53% for 1955 to 1976), 58% (45%) between5 and 10 years and 3% (2%) less than 5 years (Attachment 4). On the otherhand, the maturities of local currency loans remained about the same. During1974, 1975 and the first ten months of 1976, 42% (by amount) of local currencyloans committed had terms of more than 10 years, and 4% less than 5 years(Attachment 5).
16. Project Execution. Attachment 6 gives data on the projects com-pleted from 1973 through September 30, 1976. 66% of the projects completedduring that period were ready on schedule, or with less than one year delay.Unpunctual completions are mainly due to import license delays, changes inproject design and late delivery of machinery. The trend in cost overrunsis favorable. The percentage of projects completed within the estimatedcosts increased from 41% in 1973 to 44% the first 9 months of 1976, mainlyas a result of the control of inflation. The impact of the reduced infla-tion should be even more apparent in future years. ICICI is carefully moni-toring developments in this area and reviewing carefully the project costat the time of appraisal. During 1975 and the first six months of 1976,
1/ Small and medium sized projects benefit from the IDA credit and Bankloan to IDBI through the State Financial Corporations.

ANNEX 10Page 5
some Rs 32 million (20% of total approvals for the projects), was for sup-plementary financing to meet overruns. Usually, ICICI expects the promotersto bring in their own funds to cover cost overruns (as stipulated in the loanagreements) but ICICI is willing to be flexible when this financing is out ofthe promoter's capacity. ICICI's policy of financing overruns only on themerits of each case is adequate.
18. Clients' Financial Performance. Attachment 7 gives comparativefinancial data for a sample of 651 ICICI clients in operation during periodsApril to March 1973-1974 and 1974-75. The somewhat improved economic envi-ronment is reflected in a steady improvement of performance. On the average,these companies earned a return on total capital employed of 18.2% during1974/75 compared to 16.1% and 15.2% during 1973/74 and 1972/73, as cement,chemicals and petrochemicals, ferrous metal products, pulp paper and paperproducts, rubber, shipping, sugar, improved their prof.Lability during 1975.Food products, glass and pottery and machinery manufactured maintained thesame level as 1974. The overall performance of ICICI's portfolio in termsof profitability remains satisfactory.

Attachment 1
THE INDUSTRIAL CREDIT AND INVESTMENT CORPORATION OF INDIA *LIMITED
Summary of Operations to October 31, 1976(Rs in million)
Foreign DirectCurrency Rupee Guaran- Under- Subscrip-Loans Loans tees writing tion Total
A. Approvals-
1966 105.6 50.8 - 33.1 2.3 191.61967 65.5 49.0 32.0 68.5 2.0 217.01968 206.2 24.7 13.6 59.0 1.8 305.31969 186.6 39.8 0.8 69.9 0.8 297.91970 224.8 58.8 9.0 37.1 10.4 340.11971 264.1 158.3 -12.8 24.5 29.7 463.81972 430.8 113.5 3.7 43.7 33.5 625.21973 441.7 174.5 0.1 44.0 34.2 694.51974 514.5 173.9 - 37.1 -2.9 722.61975 353.1 200.6 30.8 47.1 80.7 712.31976 (Jan.-Oct.) 355.1 360.7 60.3 65.6 -0.4 841.3
Cumulative 4,646.6 1,700.3 183.4 802.3 250.5 7,583.1since 1955 - -
B. Commitments-/
1966 88.0 34.0 - 50.1 2.3 174.81967 72.9 76.6 32.5 54.5 2.0 238.51968 92.7 19.9 - 73.8 1.8 188.21969 250.0 28.4 0.8 42.5 0.8 322.51970 146.9 53.9 11.5 58.9 7.4 278.61971 299.2 91.4 - 21.6 8.9 421.11972 272.1 88.9 - 43.1 15.7 419.81973 551.6 134.6 1.5 32.6 25.0 745.31974 376.6 173.4 6.3 23.9 4.8 585.01975 349.1 106.4 - 51.4 39.4 546.31976 (Jan.-Oct.) 400.0 204.1 87.8 32.2 21.7 745.8
Cumulative 4,193.7 1,253.3 180.1 713.9 188.3 6,529.3since 1955 - -
C. Disbursements
1966 145.2 50.8 - 35.6 2.2 233.81967 102.0 50.7 - 47.2 2.5 202.41968 72.2 39.7 - 50.9 1.7 164.51969 108.3 38.5 - 31.8 1.9 180.51970 202.4 40.2 - 26.9 6.7 276.21971 271.0 83.1 - 8.9 9.0 372.01972 351.9 75.8 - 18.2 15.1 461.01973 359.2 106.1 2.0 14.4 22.3 504.01974 369.2 157.7 0.1 21.0 8.3 556.31975 371.0 134.2 0.1 24.2 16.3 545.81976 (Jan.-Oct.) 279.4 146.2 - 20.9 22.2 468.7
Cumulative 3.629.0 1,132.2 2.2 41L-Q 164.7 5,340.0since 1955 - - _
Note: Foreign currency figures have been converted at the current parity ofthe rupee.
1/ Net of cancellations.
Febrnarv 22, 1Q77

ANNEX 10Attachment 2
THE INDUSTRIAL CREDIT AND INVESTMENT CORPORATION OF INDIA LIMITED
Underwriting of and Direct Subscription toShares and Debentures to October 31, 1976
(Rs in million)
Underswiting Direct SubscriptionYear Shares Debentures Total Shares Debentures Total
Approvals-/
1966 11.9 21.2 33.1 2.3 - 2.31967 40.3 28.2 68.5 2.0 - 2.01968 17.5 41.5 59.0 1.8 - 1.81969 32.5 37.4 69.9 0.8 - 0.81970 17.8 19.3 37.1 8.4 2.0 10.41971 22.5 2.0 24.5 17.7 12.0 29.71972 30.7 13.0 43.7 7.5 25.9 33.41973 42.4 1.6 44.0 8.7 25.5 34.21974 31.1 6.0 37.1 2.6 -5.5 -2.91975 45.6 1.5 47.1 5.6 75.1 80.71976 (Jan.-Oct) 65.3 0.3 65.6 4.6 -5.0 -0.4
Cumulative 543.2 259.1 802.3 105.5 145.0 250.5since 1955 _
Commitmentsl/
1966 28.9 21.2 50.1 2.3 - 2.31967 25.9 28.6 54.5 2.0 - 2.01968 24.8 49.0 73.8 1.8 - 1.81969 16.0 26.5 42.5 0.8 - 0.81970 45.4 13.5 58.9 7.4 - 7.41971 16.6 5.0 21.6 7.9 1.0 8.91972 29.8 13.3 43.1 10.2 5.5 15.71973 29.6 3.0 32.6 9.3 15.7 25.01974 14.1 9.8 23.9 3.6 1.2 4.81975 52.1 -0.7 51.4 8.9 30.5 39.41976 (Jan.-Oct.)29.7 2.5 32.2 5.6 16.1 21.7
Cumulative 462.6 251.3 713.9 103.2 85.1 188.3since 1955 -_
Disbursements
1966 18.8 16.8 35.6 2.2 - 2.21967 19.6 27.6 47.2 2.5 - 2.51968 12.2 38.7 50.9 1.7 - 1.71969 9.1 22.7 31.8 1.9 - 1.91970 15.7 11.2 26.9 6.7 - 6.71971 7.0 1.9 8.9 8.0 1.0 9.01972 10.4 7.8 18.2 9.6 5.5 15.11973 14.4 - 14.4 8.5 13.8 22.31974 14.0 7.0 21.0 5.0 3.3 8.31975 23.0 1.2 24.2 9.3 7.0 16.31976 (Jan.-Oct) 20.9 - 20.9 6.1 16.1 22.2
Cumulative 242.9 169.0 411.9 103.1 61.6 164.7since 1955 -- _
1/ Net of cancellations.
February 22, 1977

ANNEX -- 10Attachment 3
THE INDUSTRIAL CREDIT AND INVESTHENT CORPORATION OF INDIA lIMITED
Comparative Statement of Financial Assiatance Approved
1974 to October 31, 1976(Re million)
1974 1975 1976 (Jan.- Oc:t.) 1955 to Oct. 31 1976
No. of Net % of No. of Net 'Iof No. of Net %or No. of Net 7 of
Industry Projects Approvals Total Projects Apptovale Total Projects Approvals Total Projects Approvals Total
Cement 2 4.3 0.6 1 45.0 6.3 2 23.0 2.7 33 224.2 3.0
Chemicals 4 Petrochemicals 46 137.9 19.1 37 124.5 17.5 56 232.'. 27.6 392 1,610.2 21.2
Electrical Equipment 31 36.0 5.0 13 66.6 2.3 12 38.7 4.6 200 472.8 6.2
Electricity, Gas and Steam 3 0.4 0.1 - 1.1 0.1 8 7.1 0.9 35 137.0 1.8
Food Products (other thansugar) 4 0.9 0.1 7.6 1.1 1 6. 7 0.8 46 68.4 0.9
Glass, Pottery etc. 6 28.8 4.0 12 17.5 2.5 1 10.( 1.2 81 288.8 3.8
Machinery Manuf-actor
(other than Electricals) 19 111.3 15.4 27 138.4 19.4 25 54.1 6.5 239 778.5 10.3
Metals & Metal Products 26 99.1 13.7 33 164.1 23.0 12 30.2 3.6 294 1,269.0 16.7
Pulp, Paper sod PaperProducts 6 31.3 4.3 12 41.6 5.8 14 84.? 10.0 105 457.0 6.0
Rhbber Products 8 114.3 15.8 4 19.7 2.8 7 52.2 6.2 46 386.2 5.1
Shipping 2 23.2 3.2 - .0.4* - 3 77.1 9.2 16 322.4 4.3
Sugar 5 17.2 2.4 6 23.2 3.3 15 72.'. 8.6 51 200.7 2.6
Textiles 10 53.8 7.4 6 8.3 1.2 11 43. 5.1 188 574.2 7.6
Transport Equipment 9 34.5 4.8 14 29.9 4.2 10 65.6 7.8 106 452.7 6.0
Wood, Cork and Hardboard 2 3.5 0.5 3 7.4 1.0 5 14.? 1.7 20 50.5 0.7
Miscellaneous 4 26.1 3.6 14 S7.8 9.5 14 29.. 3.5 146 290.5 3.8
Total 183 722.6 100.0 187 712.3 100.0 196 841.1 100.0 1 998 7,583.1 100.0
Geographical Distribution
Andhra Pradesh 5 2.7 0.4 9 37.3 5.2 18 85.0 10.1 69 306.1 4.0
Assam 1 6.4 0.9 3 2.3 0.3 2 10.4 1.2 12 62.2 0.8
Bihar 4 19.7 2.7 4 52.1 7.3 - -5.,'* -0.7* 49 455.0 6.0
Gujarat 16 56.1 7.8 15 38.4 5.4 17 82.' 9.8 258 885.0 11.7
Hlaryana 5 9.9 1.4 4 -12.6* -1.8* 12 31.21 3.7 75 183.7 2.4
Himachal Pradesh - - - 1 0.2 - 2 6. ' 0.8 3 6.9 0.1
laJmu & Kashmir - - - - - - 2 9.0 1.1 2 9.0 0.1
Karnataka 10 89.2 12.3 9 32.4 4.5 12 56.: 6.7 116 491.0 6.5
Kerala 3 16.3 2.3 10 21.5 3.0 3 0.7 0.1 49 143.4 1.9
Madhya Pradesh 5 29.6 4.1 - 9.7 1.4 6 38.' 4.6 36 169.3 2.2
Maharashtra 85 257.0 35.6 69 146.7 27.7 65 254.6 30.3 776 2,549.9 33.6
Meghalaya - - - - - - 2 5.4 0.6 2 5.4 0.1
OIri-s 1 9.2 1.3 2 6.5 0.9 2 42.6 5.1 27 163.1 2.2
P-njab 2 15.2 2.1 1 19.5 2.7 4 14.4 1.7 12 53.1 0.7
Rajasthan 5 40.0 5.5 4 37.3 5.2 6 23. ' 2.8 29 178.2 2.4
Tamil Nadu 13 77.2 10.7 23 128.0 18.0 9 50.1 6.0 168 827.4 10.9
Uttar Pradesh 9 23.4 3.2 5 47.3 6.7 14 54.4 6.5 89 381.6 5.0
West Bengal 8 12.5 1.7 20 44.8 6.4 14 66. ' 7.9 169 481.9 6.4
Union Territories
Am.daman - - - 1 3.0 0.4 - - - 1 3.0 -
Arunachal Pradesh 1 3.1 0.4 - - - - - - 1 3.1 -
Chandigarh - -0.2* - - 0.2 - - -0.* - 8 15.6 0.2
Delhi 5 6.6 0.9 - .1.0* -0.1* 1 -0.4* - 21 47.5 0.6
Goa 4 38.0 5.2 7 48.3 6.8 5 19. 2.3 25 156.0 2.1
Pondicherry 1 10.7 1.5 - - - - -5.0* -0.6* 1 5.7 0.1
Total 183 722.6 100.0 187 712.3 100.0 196 841.2; 100.0 1,998 7,583.1 100.0
Nature of Project
New Projects 51 244.7 33.9 63 243.7 37.0 77 238.5 28.3 592 2,533.0 33.4
Modernization Balance, etc. 132 477.9 66.1 124 448.6 63.0 119 602.1E 71.7 1,406 5,049.0 66.6
Total 183 722.6 100.0 187 712.3 100.0 196 841.:1 100.0 1,998 7,583.0 100.0
Type of Clients
New Entrepreneurs 5 33.9 4.7 13 38.3 5.4 21 71. ' 8.5 142 483.5 6.4
Other 178 688.7 95.3 174 674.0 94.6 175 769.6 91.5 1,856 7,099.6 93.6
Total 183 722.6 100.0 187 712.3 100.0 196 841.:; 100.0 1,998 7,583.1 100.0
Local vo. Foreign
Local Currency - 208.1 28.0 - 359.2 50.4 - 486.2 57.8 - 2,936.5 38.7
Foreign Currency - 514.5 71.2 - 353.1 49.6 - 355.1 42.2 - 4,646.6 61.3
Total 183 722.6 100.0 187 712.3 100.0 196 841.:1 100.0 1,998 7,583.1 100.0
Notes: 1. Geographical Distribution - West India: Gujarat, Madhya Pradesh, Maharashtra, Goa.
South India: Karnataka, Kerala, Tamil Nadu, Pondicherry.East India: Andhra Pradesh, Orissa, Andaman.North India: Himachal Pradesh, Jammu & Kashmir, Haryana, Punjab, Rajasthan. Uttar Pradesh, Chandigarh, Delhi.
North East India: Assam, Bihar, West Bengal, Arunachal Pradesh, Meghalaya.
2. Negative due to subseqoent cancellations.
February 22, 1977
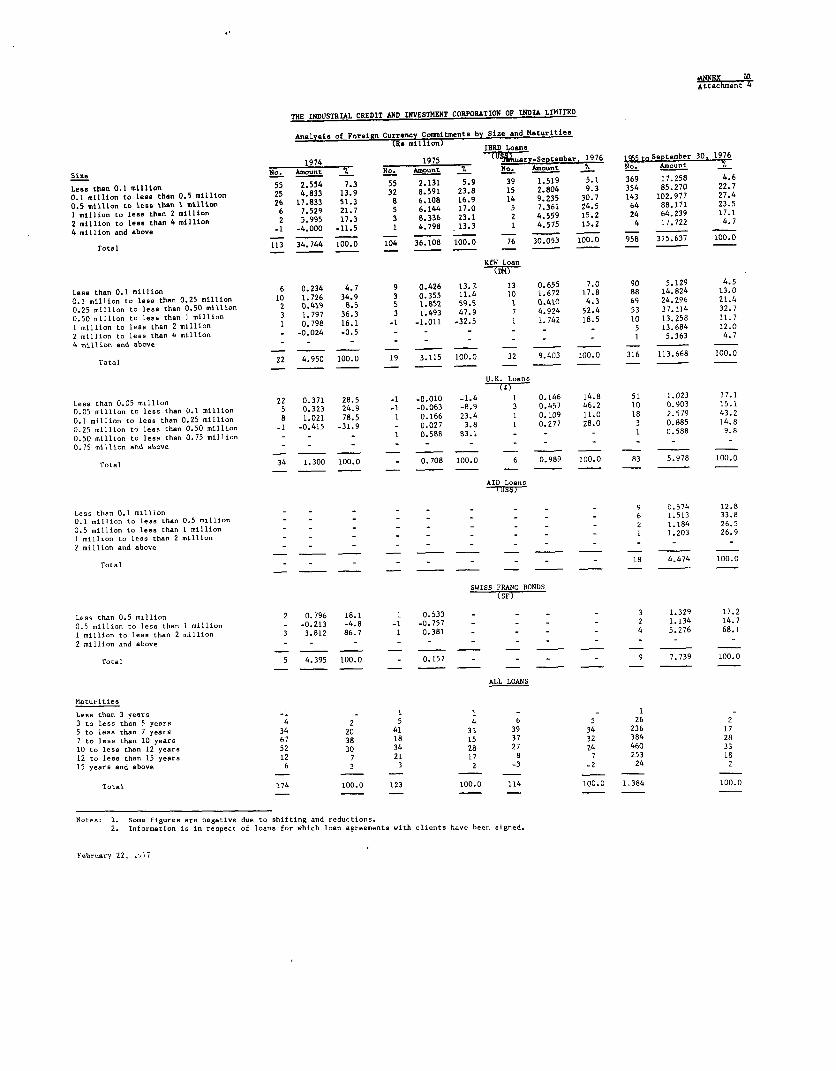
THE INDUSTRIAL CREDIT AND INVESTMENT CORPORATION OF INDIA LIMITED
Analysis of Foreign Currency Commitments by Size and Maturities(Rs million) IBRD Loans
1974 1975 (U ary-Seetember, 1976 195 5 Sevtember 30, 1976Size No. Amount %. No. Amount % No. AmAount %
Less than 0.1 million 55 2.554 7.3 55 2.131 5.9 39 1.519 5.1 369 17.258 4.6
0.1 million to lose than 0.5 million 25 4.833 13.9 32 8.591 23.8 15 2.804 9.3 354 85.270 22.7
KfW Loan
0.1 million to less than 0.2 million 10 17.726 34.9 3 0.355 11.49 0 162 78 8 14 925 3. 4 0.824 13.0
0.25 million to less than 0.50 million 2 .2419 .5 5 6.4521 5.5 17 07.410 24.3 69 24.296 21.4
0.50 million to less than 1 million 3 .797 136.3 3 1.3 47.9 7 4.55924 52.4 5 37.234 132.7
2 million to less then 4 million - -0.024 -0.5 _ - _ _ _ _ 5 13.64 14.704 million and above
Total 22 4.950 100.0 19 3100.0100.0 32 9.4()3 100.0 316 113.668 100.0
U.K. Loans
(DM)
Less than 0.05 million 22 0.371 28.5 -9 -0.010 _1.4 1 0.146 14.6 91 1.023 17.10.05 million to less than 0.1 million 5 0.323 24.9 _1 _0.063 -8.9 3 0.457 46.2 10 0.903 15.00.1 million to less then 0.25 million 8 1.021 78.5 1 0.166 23.4 1 0.109 11.0 18 2.579 43.20.25 million to less than 0.50 million -1 -0.415 -31.9 _ 0.027 3.8 1 0.277 28.0 3 0.885 14.80.50 million to less than 0.75 million - - - 1 0.588 93.1 - - - 1 0.588 9.80.75 million and above - - -_ _ _
Total 34 1.300 100.0 1 0.708 100.0 6 0.989 100.0 83 5.978 100.0
AID. Loans7T-
Less than 0.1 million - - - - - - - - - 9 0.574 12.10.1 million to less than 0.5 million - - - -4- - -_ - - - 6 1.513 33.80.5 million to less than 1 million - - - _ _ _ _ _ _ 2 1.184 26.51 mllion to less than 2 million - - - - - - - - - 1 1.203 26.92 miion and above
Total - _ - - - - - - - 18 4.474 100.0
SWISS FRANC BONDS
Leo. than 0.5 million 2 0.796 18.1 1 0.533 - - - - 3 1.329 17.20.5 million to less than I million - -0.213 -4.8 -I -0.757 - - - - 2 1.134 14.71 million to less than 2 million 3 3 812 86.7 1 0.381 _ _ _ _ 4 5.276 68.12 million and above - - -
Total 5 4-395 100.0 _ 0.157 - _ _ _ 9 7.739 100.0
ALL LOANIS
Maturities
Less than 3 years -2 0 1 I _ I 2
3 to less than 5years 4 2 5 4 6 5 26 25 to lees then 7 years 34 20 41 33 39 34 236 177 to lens than 10 yeats 67 38 18 15 37 32 384 2910 to less than 12 years 52 30 34 28 27 24 460 3312 to less than 15 years 12 7 21 17 8 7 253 1815 years and above 6 3 3 2 -3 -2 24 2
Total 174 100.0 123 100.0 10.0 00.0 1.384 100.0
Notes: 1. lone fiyures are negative doe to shifting and redoctions.2. Information is in respect of loans for which loan agreements vith clients have been signed.
12ehrea.y 22, ; . r 7
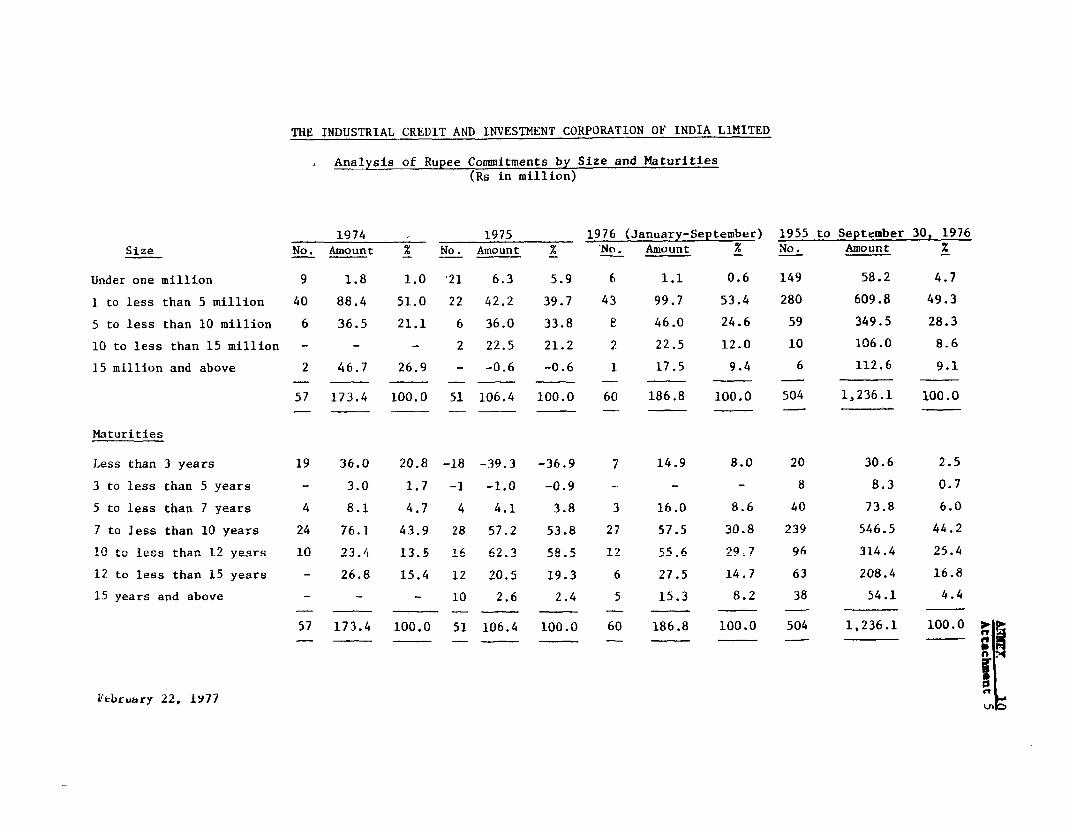
THE INDUSTRIAL CREDIT AND INVESTMENT CORPORATION OF INDIA LIMITED
Analysis of Rupee Commitments by Size and Maturities(Rs in million)
1974 1975 1976 (January-September) 1955 to September 30, 1976Size No. Amount % No. Amount % No. Amount X No. Amount x
Under one million 9 1.8 1.0 '21 6.3 5.9 6 1.1 0.6 149 58.2 4.7
1 to less than 5 million 40 88.4 51.0 22 42.2 39.7 43 99.7 53.4 280 609.8 49.35 to less than 10 million 6 36.5 21.1 6 36.0 33.8 8 46.0 24.6 59 349.5 28.310 to less than 15 million - - - 2 22.5 21.2 2 22.5 12.0 10 106.0 8.615 million and above 2 46.7 26.9 - -0.6 -0.6 1 17.5 9.4 6 112.6 9.1
57 173.4 100.0 51 106.4 100.0 60 186.8 100.0 504 1,236.1 100.0
Maturities
Less than 3 years 19 36.0 20.8 -18 -39.3 -36.9 7 14.9 8.0 20 30.6 2.53 to less than 5 years - 3.0 1.7 -1 -1.0 -0.9 -- - - 8 8.3 0.75 to less than 7 years 4 8.1 4.7 4 4.1 3.8 3 16.0 8.6 40 73.8 6.07 to less than 10 years 24 76.1 43.9 28 57.2 53.8 27 57.5 30.8 239 546.5 44.210 to less than 12 years 10 23.4 13.5 16 62.3 58.5 12 55.6 29z7 96 314.4 25.412 to less than 15 years - 26.8 15.4 12 20.5 19.3 6 27.5 14.7 63 208.4 16.815 years and above - - - 10 2.6 2.4 5 15.3 8.2 38 54.1 4.4
57 173.4 100.0 51 106.4 100.0 60 186.8 100.0 504 1,236.1 100.0 : %
February 22, 1977

THE INDUSTRIAL CREDIT AND INVESTHENT CORPORATION OF INDIA LIMITED
Cost Overruns and Delays in Projects Completed in 1973, 1974 1975 and 1976
(Rs in '000)
1973 1974 1975 1976 (Jan. - Sept.)No. of Initial No. of Initial No. of Initial of InitialProjects % Estimates Actual ProJects % Estimates Actual Proiects % Estimates Actual Projects 7. Estimates ActualInvestment Coste
Projects completed withinestimates 51 40.8 510,652 502,663 40 44.0 313,297 307,063 35 38.1 349,109 344,137 24 44.4 201,064 200,614With overrun within 25% 46 36.8 897,550 1,009,327 27 30.0 301,721 325,327 32 34.8 580,504 647,991 16 29.6 1,307,920 1,552,023With overrun 25-50% 14 11.2 249,195 341,497 10 11.0 803,960 1,070,496 14 15.2 438,000 604,090 7 13.0 466,143 634,610With overrun over 50% 4 3.2 1,865 3,123 4 4.0 201,570 308,240 6 6.5 159,142 261,119 4 7.4 714,534 1,077,627Information not yet available 10 8.0 1/ 1/ 10 11.0 2/ 2/ 5 5.4 3/ 3/ 3 5.6 4/ 4/
125 100.0 1,659,262 1,856,610 91 100.0 1,620,548 2,011,126 92 100.0 1,526,755 1,857,337 54 100.0 2,689,661 3,464,874
7. Actual over initial estimate 11.9', 24.10/. 21. 7. 28.8%Completion Periods
Projects completed on schedule 28 22.4 9 9.9 11 12.0 8 14.8With less than one year delay 69 55.2 47 51.6 43 46.7 25 46.3With delays over one year 21 16.8 32 35.2 30 32.6 19 35.2Information not yet available 7 5.6 3 3.3 8 8.7 2 3.7
125 100.0 91 100.0 92 100.0 54 100.0
1/ Initial estimate was Es 507.9 million.1/ Initial estimate was Rs 274.6 million.2/ Initial estimate was Rs 7.7 million.4/ Initial estimate was Rs 2.8 million.
February 22, 1977

THE INDUSTRIAL CREDIT AND INVESTMENT CORPORATION OF INDIA LIMITED
FinancLal Performance of ICICI Clients In Operation
(Data for 651 Companies Covering April-March 1973-74 and 1974-75)
Profits Before Profits After Value Added asGross Profits Tax as 7. of Return on Total Tax as % of Wages as % of % of
Industry Group Ye-r as % of Sales Sales Capital Employed Net Worth Valuee Added Gross Capital
Total Sample 1973-74 16.3 8.7 16.1 11.4 50.8 28.3(651 companies) 1974-75 16.2 9.1 18.2 13.6 49.8 30.0
Automobiles and Cycles 1973-74 14.4 6.3 14.9 10.3 53.4 27.2(25 companies) 1974-75 13.1 4.4 13.0 6.5 55.0 26.6
Cement 1973-74 11.4 -0.6 4.1 -5.9 58.3 16.8(11 companies) 1974-75 15.3 5.2 11.4 6.1 48.2 20.5
Chemicals & Petrochemicals 1973-74 23.6 12.3 16.4 14.1 35.1 26.0(98 companies 1974-75 25.2 15.8 23.7 22.4 30.8 31.4
Electrical Equipment 1973-74 21.8 16.8 32.5 15.2 52.1 35.1(61 companies) 1974-75 18.4 13.3 24.8 14.0 58.7 33.3
Food Products (excl. sugar) 1973-74 7.4 4.5 17.6 9.4 50.3 34.7(17 companies) 1974-75 7.3 4.1 17.2 10.6 48.2 32.9
Glass and Pottery 1973-74 22.2 11.6 16.9 8.9 49.1 31.2(16 companies) 1974-75 Z1.2 9.2 16.3 13.2 49.2 32_6
Machinery Manufacture 1973-74 15.8 8.2 16.0 13.2 52.7 34.6(79 companies) 1974-75 14.9 7.2 16.3 10.2 53.9 34.4
Metal Products (ferrous) 1973-74 18.1 7.7 11.9 7.4 54.9 22.8(55 companies) 1974-75 17.9 9.3 16.0 10.6 52.2 25.9
Metal Products (non-ferrous) 1973-74 14.5 3.4 6.8 1.2 53.9 19.0(18 companies) 1974-75 14.0 3.8 8.1 2.0 55.0 20.4
Power Generation andDistribution 1973-74 17.6 9.4 11.0 7.4 22.0 14.6(8 coupanies) 1974-75 15.3 8.8 12.9 7.9 36.5 16.0
Pulp, Paper and Paper ProducLt 1973-74 21.1 10.8 15-0 11.7 43.8 23.9(35 companies) 1974-75 28.9 20.4 30.8 22.9 33.9 35.0
Rubber Products 1973-74 10.9 4.9 14.9 9.1 56.1 32.4(14 companies) 1974-75 11.5 6.5 18.3 13.6 50.0 32.9
-i ~Shtpting 1973-74 32.0 14.6 9.1 18.2 23.9 15.4(3 companies 1974-75 38.5 20.5 14.9 29.4 .21.2 20.8
Sugar 1973-74 10.2 3.5 9.2 8.1 38.4 14.1tr3 io.panies) 1974-75 12.3 5.0 12.5 11.8 34.0 16.4
Textiles 1973-74 14.0 7.6 18.2 16.2 61.6 38.8(66 companies) 1974-75 10.7 4.5 13.5 9.4 67.7 36.9
Diversified Comapnie_s_ 1973-74 13.4 7.5 17.4 12.8 49.2 30.3(44 compeniesY1 1974-75 13.6 8.2 19.5 11.4 48.8 31.6
Miscellaneous 1973-74 10.2 5.1 13.4 7.4 62.9 35.5(86 companies) 1974-75 9.8 4.7 15.0 9.4 62.1 37.5
February 22, 1977
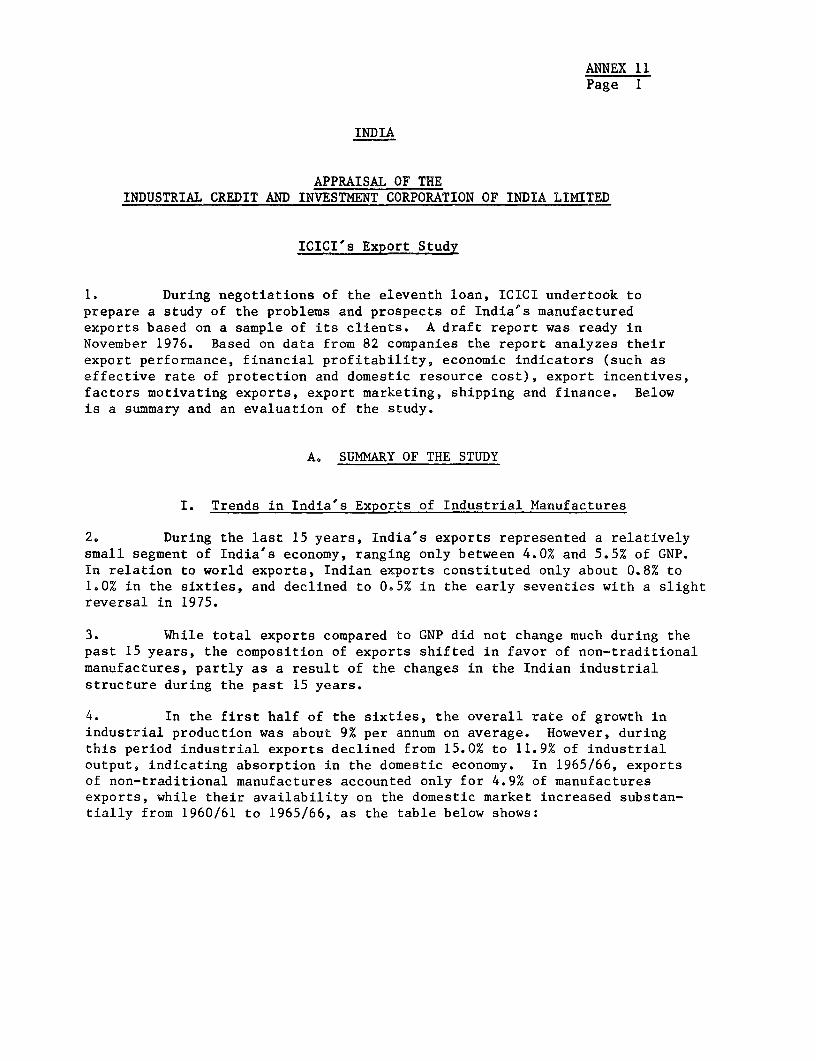
ANNEX 11.Page 1
INDIA
APPRAISAL OF THEINDUSTRIAL CREDIT AND INVESTMENT CORPORATION OF INDIA LIMITED
ICICI's Export Study
1. During negotiations of the eleventh loan, ICICI undertook toprepare a study of the problems and prospects of India's manufacturedexports based on a sample of its clients. A draft report was ready inNovember 1976. Based on data from 82 companies the report analyzes theirexport performance, financial profitability, economic indicators (such aseffective rate of protection and domestic resource cost), export incentives,factors motivating exports, export marketing, shipping and finance. Belowis a summary and an evaluation of the study.
A. SUMMARY OF THE STUDY
I. Trends in India's Exports of Industrial Manufactures
2. During the last 15 years, India's exports represented a relativelysmall segment of India's economy, ranging only between 4.0% and 5.5% of GNP.In relation to world exports, Indian exports constituted only about 0.8% to1.0% in the sixties, and declined to 0.5% in the early seventies with a slightreversal in 1975.
3. While total exports compared to GNP did not change much during thepast 15 years, the composition of exports shifted in favor of non-traditionalmanufactures, partly as a result of the changes in the Indian industrialstructure during the past 15 years.
4. In the first half of the sixties, the overall rate of growth inindustrial production was about 9% per annum on average. However, duringthis period industrial exports declined from 15.0% to 11.9% of industrialoutput, indicating absorption in the domestic economy. In 1965/66, exportsof non-traditional manufactures accounted only for 4.9% of manufacturesexports, while their availability on the domestic market increased substan-tially from 1960/61 to 1965/66, as the table below shows:

ANNEX 11Page 2
Indigenous Supplies as Percent of Total Supplies
1960/61 1965/66
Textile Machinery 31 62Machine Tools 35 38Iron and Steel 64 83Aluminum 42 74Soda Ash 60 90Caustic Soda 72 75
Thus, in the first half of the sixties, industries in the non-traditionalsector emerged primarily as import substitution industries.
5. The second half of the sixties was characterized by stagnation ofindustrtial production, with a substantial decline in the capital goods in-dustry. During this period, non-traditional exports increased at over 15%p.a. in value, whereas total exports increased by 14% p.a.
6. The first part of the seventies was characterized by extremelyrapid export growth of non-traditional manufactures. Between 1972/73 and1974/75 (the period covered in the study), non-traditional exports grew at54% p.a. compared to an average growth of India's exports of 29% p.a. Asa result, the share of non-traditional exports in total exports grew from10% in 1972/73 to 14% in 1974/75. This may be attributed to: (i) thesubstantial real devaluation of the rupee since August 1971, compared tomajor currencies other than the British pound; and (ii) exploitation ofopportunities in the South East Asian countries and the Middle East (OPEC)countries.
II. The Sample
7. From the 625 manufacturing clients of ICICI as of December 1974,for whom export data were available, 150 companies were selected to partici-pate in the study. Eventually, 82 companies (60 exporting, 20 non-exporting)representing 29 products were used in the sutdy sample based on availabledata, which covered the period of 1972/73 to 1974/75.
III. Export Performance of ICICI Assisted Companies
General
8. Between 1973/74 and 1974175, the total exports of a sample of 374clients increased by 56% from Rs 2.1 billion (1973/74) to Rs 3.2 billion;
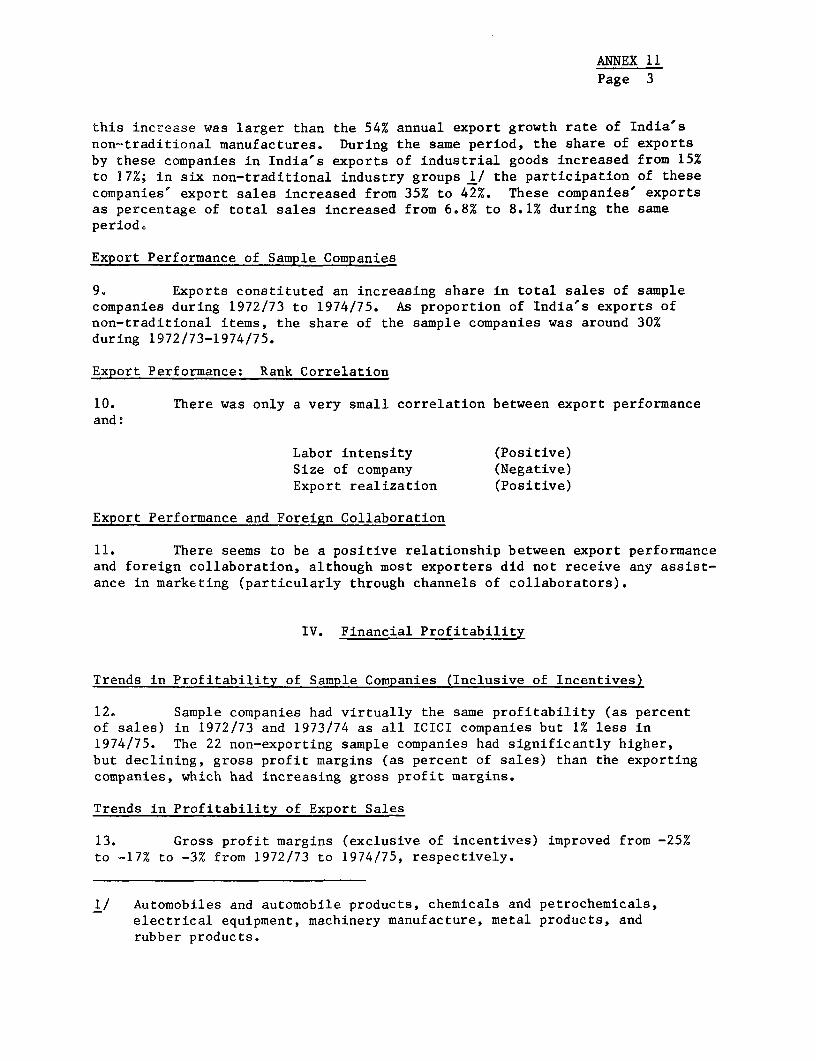
ANNEX 11Page 3
this increase was larger than the 54% annual export growth rate of India'snon-traditional manufactures. During the same period, the share of exportsby these companies in India's exports of industrial goods increased from 15%to 17%; in six non-traditional industry groups 1/ the participation of thesecompanies' export sales increased from 35% to 42%. These companies' exportsas percentage of total sales increased from 6.8% to 8.1% during the sameperiod.
Export Performance of Sample Companies
9. Exports constituted an increasing share in total sales of samplecompanies during 1972/73 to 1974/75. As proportion of India's exports ofnon-traditional items, the share of the sample companies was around 30%during 1972/73-1974/75.
Export Performance: Rank Correlation
10. There was only a very small correlation between export performanceand:
Labor intensity (Positive)Size of company (Negative)Export realization (Positive)
Export Performance and Foreign Collaboration
11. There seems to be a positive relationship between export performanceand foreign collaboration, although most exporters did not receive any assist-ance in marketing (particularly through channels of collaborators).
IV. Financial Profitability
Trends in Profitability of Sample Companies (Inclusive of Incentives)
12. Sample companies had virtually the same profitability (as percentof sales) in 1972/73 and 1973/74 as all ICICI companies but 1% less in1974/75. The 22 non-exporting sample companies had significantly higher,but declining, gross profit margins (as percent of sales) than the exportingcompanies, which had increasing gross profit margins.
Trends in Profitability of Export Sales
13. Gross profit margins (exclusive of incentives) improved from -25%to -17% to -3% from 1972/73 to 1974/75, respectively.
1/ Automobiles and automobile products, chemicals and petrochemicals,electrical equipment, machinery manufacture, metal products, andrubber products.
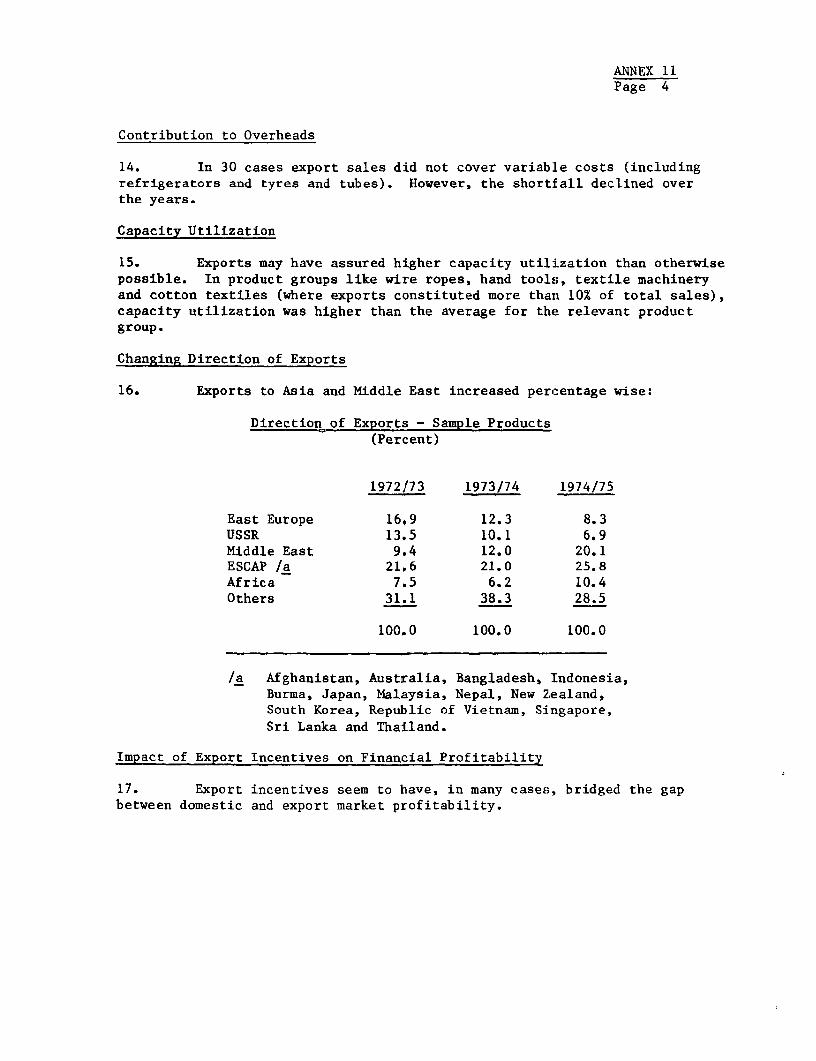
ANNEX 11Page 4
Contribution to Overheads
14. In 30 cases export sales did not cover variable costs (includingrefrigerators and tyres and tubes). However, the shortfall declined overthe years.
Capacity Utilization
15. Exports may have assured higher capacity utilization than otherwisepossible. In product groups like wire ropes, hand tools, textile machineryand cotton textiles (where exports constituted more than 10% of total sales),capacity utilization was higher than the average for the relevant productgroup.
Changing Direction of Exports
16. Exports to Asia and Middle East increased percentage wise:
Direction of Exports - Sample Products(Percent)
1972/73 1973/74 1974/75
East Europe 16,9 12.3 8.3USSR 13.5 10.1 6.9Middle East 9.4 12.0 20.1ESCAP /a 21.6 21.0 25.8Africa 7.5 6.2 10.4Others 31.1 38.3 28.5
100.0 100.0 100.0
/a Afghanistan, Australia, Bangladesh, Indonesia,Burma, Japan, Mialaysia, Nepal, New Zealand,South Korea, Republic of Vietnam, Singapore,Sri Lanka and Thailand.
Impact of Export Incentives on Financial Profitability
17. Export incentives seem to have, in many cases, bridged the gapbetween domestic and export market profitability.

ANNEX 11Page 5
V. Economic Indicators
Effective Rate of Protection
18. In respect of eight I/ products out of 22, the Effective Rate ofProtection on exports (ERPE) is higher than the Effective Rate of Protectionon domestic sales (ERPD), indicating a bias for export sales. This is cor-roborated by the financial profitability in export sales which was greaterthan that in domestic sales.
Domestic Resource Cost
19. For seventeen products (paper, heavy commercial vehicles, electricmotors, tyres and tubes, refrigeration equipment) out of 22 the adjustedDRCs 2/ were less than or equal to Rs 8.0 per US$1, indicating that domesticproduction had a comparative advantage. For most products, the crude DRC wasabove Rs 8.0 per US$1, particularly also for those wlhere exports constituteda significant protion of sales. For many of these products, export incentivesseem to have been important inducements. The correlation between DRCs andexport incentives, though rather insignificant, is adverse. A number ofproducts 3/ had high DRCs and a high proportion of incentives which in somecases represented new market entrants using presumably penetration prices togain a foothold in export market. Export incentives bridged the gap betweensocial profitability and private profitability in a large majority of cases.
VI. Export Incentives
20. Export incentives as proportion of f.o.b. value of exports ofsample companies declined from 32.9% to 26.4% to 14.9% in the respectiveyears 1972/73 to 1974/75, due to time lags in claims, and actual reductionin incentives.
21. A trend towards decline in the percentage premium realized onnomination of REP licenses also confirms the improvement in the supplysituation of indigenous inputs at competitive prices.
1/ Cables, steel tubes, machine tools, textile machinery, switchgears,cement, hand tools, and wire ropes.
2/ ICICI calculated three types of DRCso (a) "crude" - measures the domes-tic resource cost at market price of earning one US$; (b) "adjusted" -indigenously purchased tradable inputs are revalued at border pricesand wages are revalued at the shadow wage rate of 0.5; (c) "short run" -only variable cost components are included.
3/ Switchgears, machine tools, tyres and tubes and diesel engines.

ANNEX 11Page 6
VII. Factors Mlotivating ExportS
22. Export obligation ranked first in factors motivating export maketentry. Availability of export incentives ranked first in factors motivatingcontinued exports.
VIII. Export Marketing and Shipping
23, Factors hampering growth of exports were lack of brand image, longdelivery periods, and lack of pre- and after sales service.
24. The absence of an effective market information system was one ofthe major marketing problems.
25. Most established exporters complained about non-availability ofshipping space and high freight rates.
IX. Export Finance
26. No conclusions are made concerning the impact of availability andterms of export credit on export performance, due to lack of adequate data.
B. EVALUATION OF THE STUDY
General
27. The study is quite well done and should be very useful to IBRD,ICICI and GOI since it provides a detailed microeconomic evaluation of theeffects of export promotion policy. The discussion below evaluates what thestudy shows about the financial profitability and economic efficiency ofexports. The implications for ICICI itself, and dr-4rable follow-up workare also reviewed.
Consequences of Export Promotion Policy
28. Financial Profitability. The most important and reliable conclu-sion of the study is that overall the incentive system has bridged the gapbetween domestic and export market profitability. This is shown for thelonger run by the comparison of effective rates of export subsidization witheffective rates of protection on domestic sales. In addition, the short runDRC indicates the high profitability of exports on ' short run marginal cost

ANNEX 11Page 7
basis. Perhaps equally important, profitability without incentives hasimproved over the period studied, because of India's devaluation and improvedexport realization after initial penetration pricing. At the same time, theaggregate effect of the incentive system seems to have declined to almostexactly the same extent as market profitability improved. Thus, grossprofitability of exports remained fairly constant, but incentives becamea less important factor in determining it.
29. While the incentive system has been effective overall, a comparisonbetween the effective rate of subsidization on export sales and the effectiverate of protection on domestic sales shows that there are wide variations,with differences of more than 100% for several products, giving 8 indust:i*esa bias towards export sales and in the other 14 industries a bias towardsdomestic sales. Even though the effective rate of protection on domesticsales based on f.o.b. realizations overstate the extent of protection, suchlarge differences are in principle undesirable since social profitabilityconsiderations call for providing equal incentives to exports and to importsubstitution since, from the point of view of the national economy, a dollarearned in exporting is equivalent to a dollar saved through import substi'tution.
30. Economic Efficiency. For 17 out of 22 products, the "adjusted' DRCwas lower than Rs 8.0 per US dollar and this provides some indication (howeverslight) that many of India's exports were efficient.
Subsequent Work
31. ICICI will continue to update the information contained in the studyon a regular basis and also explore in more detail the importance of exportfinance, shipping and export marketing as factors influencing export perfor-mance. In addition, ICICI would review existing company data to test certainhypotheses for a penetration pricing study, in particular the determinationof the factors responsible for the observed increase over time in the ratioof export to domestic prices.
Implementation of the Study
32. The main value of the study is for GOI. The analysis and resultswill be used as a part of the ongoing dialogue on export policy. For ICICIitself, the study should have a number of benefits: (i) it will be in abetter position to advise its clients on export incentives and procedures,and to encourage them to plan for exports at the initial stages of projectpreparation; and (ii) it can discuss the detailed implications of policywith GOI on an informed basis.

ANNEX 12Page 1
INDIA
APPRAISAL OF THEINDUSTRIAL CREDIT AND INVESTMENT CORPORATION OF INDIA LIMITED
Outline of a Proposed Study of Selected Subsectorsof the Engineering Industry
1. ICICI proposes to conduct a study of selected subsectors of theengineering industry. For ICICT the usefulness of the study consists inunderstanding better the factors affecting investment decisions of firmsassisted by it. The study would also be of broader interest in so far asit will help identifying different aspects of each subsector having a bearingon policy. The study will examine in detail aspects such as the structure,the demand prospects both in the domestic and the export markets and the needfor upgradation of technology. For each subsector a questionnaire will bedesigned to focus larger attention on problems and aspects which are moreimportant for it. An attempt will also be made to estimate broadly the in-vestment needs of each subsector, including for modernization and diversi-fication.
2. The study will investigate in detail performance of individualfirms which will possibly provide understanding of problems common to thesubsector and indicate why some firms (through, say, produce diversification,R & D activities, etc), have performed better than others.
3. The study will examine factors which will encourage investmentactivity in each subsector. An assessment will be made of the impact ofGovernment policies, particularly industrial licensing policy, trade policy,policy regarding import of technology and price contro:L.
4. Another aspect which will be covered in the Study is the develop-ment of ancillary industries and attempts will be made to estimate its likelyimpact on employment. In addition, aspects of ancillary products such aspricing, selling, terms, quality, technical assistance provided by the large-scale units will also be examined both quantitatively and qualitatively.For automotive industry, which we propose to take up first, a few majorcomponents supplying ancillary industries having inter alia export andsmall industry implications will be investigated.
5. While available information from the published sources (e.g. GOIReports, Bank Studies, Balance Sheets) will be extensively used, this willbe supplemented by information available within ICICI and collected throughquestionnaire, interviews and plant visits. From the experience of the ExportStudy, however, it would clearly appear that attempting to get detailed infor-mation from each firm on aspects like cost of production by sub-products/varieties, c.i.f. prices of imports (particularly if these are not imported)will present difficult problems, Attempts will, therefore, be made to

ANNEX 12Page 2
collect data on these aspects for major items, say, the most important sub-products, important inputs and so on.
6. ICICI proposes to take up automotive industry (including auto an-cillaries) as the first subsector for investigation. Apart from this sector(inclusive of ancillary industries) being one of the largest subsectors ofthe engineering industry on ICICI's portfolio it offers an opportunity toexamine most, if not all, of the issues which relate to the engineering sectoras a whole, and which are of interest to ICICI, IBRD and GOI. There are38 firms on ICICI's portfolio in this group. Firms in this subsector whichare not in ICICI's portfolio will also be covered. ICICI proposes to approachSFCs and seek their assistance in obtaining information from their clients.
7. The background information on this subsector is being collected.The first draft of the questionnaire for automotive industry will be readyby July 15, 1977 and will be sent to the Bank for comments. By August end,the questionnaire may be finalized.
8. While the study will necessarily draw upon firm-level information,this will be used to form judgement on various aspects. Presentation ofinformation will be on an aggregative basis. Tentatively, ICICI expectsto complete the draft report by March end 1978. Selection of another sub-sector will be made after some progress is made with this study.
April 29, 1977

ANNEX 13
TEE INDUSTRIAL CREDIT AND INVEBTMENT CORPORATION OF INDIA LIMITED
REconomic Indicators for Proiects Apprve-d in 1975 (ICICI Asaistance Rs 5 Million)(Inke accordin to ra at _1l
4fliee)
Reoonsto Narket Iffeotivi Rate Domeeestt/Rate of Rate of _l Prot Rostig Rource
L&MnD UAL91 Produot 3e omx~ u0 e -cost
Alkali & Chemicals Raw Veedioides 70.0 28.0 -62.0 -47.6 3.80
%ELS Expansion Transfomers 50.0 35.0 8.5 8.0 7.50
Carbon Corpn. NMe Graphite Electroies 50.0 19.0 -47.0 -39.0 6.60
Alkali & Chemioals New Pharmaceutioals 45.0 19.4 -14,5 -10.6 5.96
Andhra Sugars Expansion Caustic Soda 42.0 23.0 -12.7 -8.5 3.10
W.G. Forge Now Machined Crankshafts 34.6 17.0 30.0 26,5 6.00
Perfect Circle Victor Now Piston rings 33.0 28.0 37.3 26.0 6.70
Lakchmi Machine Expansion Textile Machinery 30.6 25.1 6.3 4.4 6.30
NIRLON New Rubber Conveyor-belting 29.7 13.1 -15.7 -11.3 7.22
A. P. Steele NoM Steel billets 29,4 11.7 -33.6 -22.0 8.51
IISCO New C.I. Spun Pipes 28.0 17.0 -5.0 -4.0 7.90
Mahavir Spg. New Low and medium 27.0 14.0 -16,7 -13.3 6.75counts yarn
ehbstar Nev Tyree 27.0 16.4 3.5 2,5 8.00
Orooca Tyres Now Tyres 26.6 16.7 -3.2 -2.4 9.70
Rohtas Paper Expansion Paper 26.2 10.0 7.6 5.0 7.30
Premier Auto Expansion Cars & Trucks 25.6 24,0 18.6 16.2 6.70
Xeltron New Electronic Components 23.0 13.0 9.8 7.4 9.40
Seohasayee Paper Expansion Paper 23.0 10.0 -20.0 -11,4 8.50
Chowgule Metals New Iron Ore Pellets 21.0 16.1 - - 6.82
Rational Rayon Now Nylon Tyre Cord 21.0 13.0 23.0 16.0 11.80
Andhra Sugars Now Aspirin 20.0 15.0 105.2 34.9 9,20
Baroda Rayon New Nylon Tyre Cord 19.5 12.2 30.0 19.0 12.00
Kothari (Madras) New Caustic Soda/Ammonium 19.0 17.5 18.7 14.7 7.80
Chloride
Lak.hai Auto Loone Now Textile Mchinery 18,0 11.0 15.3 11.8 7.80
N.K. Synthetios Now Acrylic Fibre 16.0 16.5 139.0 78.0 11.70
U.P. Cenento Expansion Cement 16.0 11.5 76.0 25.0 7.60
D.C.M. New Castings 14,0 12.0 52.0 36,0 9.00
Greaves (Diesel) New Dietel Cginee 12.5 16,0 87.6 60.7 7.80
Nagarjuns Steele New Steel Strips 11.2 12.0 42.0 26.0 8.00
POeYha New Tin Cane 11.0 12.0 90.0 62.0 10.70
I/ The exchange rates for the period under review wer. tSanuary-Septoober U,S1S 1 = Rs 7.97October-December U,S.5 1 - R 8,86
Econonio and Market Rsate. of Return for Projects ClassifiedAccording to Industry Groups
No. ofProjocts Eoonomic Marketwherl ERR Rate of Return Rate of Return'S Greater Simpis Weighted Simple Weighted
Induetry Projects than MRR A' A vAr AZr aver A La.
Cement 1 1 16.0 16.0 11.5 11.5
Choje.ale &Petrochemicals 9 8 34.4 27.2 17.5 15.2
ElectricalEquipment 2 2 36.5 35.8 24.0 25.4
Automobile. 2 2 29.3 28.3 26.0 2j5.5
Metal Produots (F) 6 5 23.0 21.2 14.3 14. 9
Metal Products (NF) 1 - 11.0 11.0 12.0 1 '.0
Machinery Mfg. 3 2 20.4 18.9 17.4 16.2
Paper 2 2 24.6 23.8 10.0 1(.0
Textiles 1 1 27.0 27.0 14.0 1c,0
Rubber Products 3 3 27.8 27.0 15.4 16.3
All Industries 30 26 27.3 22.6 16.6 1'.8
Febemo-y 22, 1977

ANNEX 13Page 2
THE INDUSTRIAL CREDIT AND INVESTMENT CORPORATION OF INDIA LIMITED
Economic Indicators for Project Approved in 1976 (Jan.-June)
(Ranked According to their Internal Rate of Return at World Prices)
Economic harket Effective Rate DomesticNew or Rate of Rate of of Protection Resource
Name of Company Expansion Product Return Return Balassa Corden Cost7(T 15V 7W 77F (Rs/U.S. )Shardlow India Limited Exp. Forgings 40.0 25.0 7.6 5.7 9.2Kunal Engineering Ltd. Exp. Spindles 39.0 29.0 1.4 1.2 7.4Escorts Limited New Pistons & Piston
Pins 39.0 21.5 -4.3 -3.2 6.8Mysore Cement Ltd. New Portland Cement 37.0 17.2 -15.9 -9.4 7.0Karnataka Scooters Ltd. New Scooters 35.0 12.0 -4.6 -4.0 8.5South India Viscose Ltd. Exp. Rayon Grade Wood
Pulp 34.0 22.0 9.6 6.9 6.0Ashok Leyland Ltd. Exp. Heavy Commercial 9 8.5 -39.0 -37.0 6.7
Vehicles 2. . 3. 3. .Jiyajeerao Cottm Mills Ltd. Exp. Soda Ash 28.4 12.0 52.0 24.4 10.0
(Saurashtra Chemicals)Orissa Tyros Ltd. New Tyres & Tubes 26.7 16.7 -3.2 -2.4 9.7Raymond Woollen Mills Ltd. Exp. Woollen/Worsted 25.0 22.8 42.0 30.0 11.0
WeavingAtul Products Ltd. Exp. Caustic Soda 21.0 9.5 10.0 5.0 9.8Shree fligvijay Woollen Mills Exp. Wool Tops 20.5 12.0 10.5 - 8.5
Precision Fasteners Ltd. Exp. High Tensile Nutsand Bolts 19.5 15.5 65.0 43.0 10.7
Citurgia Biochemicals Ltd. New Citric Acid 18.4 16.0 50.9 40.7 9.2Gajra Bevel Gears Ltd. New Crown Wheel & 17.5 10.0 16.4 11.0 9.5
Pinion sets &Differentialgear kits
NGEF Ltd. ERp. Transformers 16.3 17.5 44.0 34.0 9.3Polymers Corp. of Gujarat New Methyl Methacryl- 9.0 13.0 173.0 82.0 13.0
Ltd. ate Monomer(MK A)
pQ, Of EOVU' M hrket RateProjects where or Return of Return
No. of ERB is greater Simple Weighted Simple WeightedIndustry Projects than MRR Average Averag Avzae ivzrjat
Automobiles andAutomobiles Anci-
Ilaries 4 4 30.1 31.8 13.0 13.5
Cement 1 1 37.0 37.0 17.2 17.2
Chemicals & Petro-chemicals 5 4 22.2 23.6 14.5 15.8
(25.5)** (28.2)
Electrical Equipment 1 0 16.3 16.3 17.5 17.5
Machinery Manufacture 1 1 39.0 39.0 29.3 29.3(Textile Machinery)
Metal Products 2 2 29.8 32.4 20.3 21.5(Ferrous)
Rubber Products 1 1 26.6 26.6 16.7 16.7
Textiles 2 2 22.8 22.9 17.4 17.8(Woollen)
17 15
_1/ The exchange rates for the period under review were: January - MarchUS$l = Rs 9.04; April - June US$1 = Rs 9.15.
2/ Figures in brackets are excluding the methyl methacrylate monomer project.
February 22, 1977

ANNEX 14
THE INDUSTRIAL CREDIT AND INVESTMENT CORPORATION OF INDIA LIMITED
Trend in Arrears (1965 to September 1976)(Rs. in million)
Principal and Interest Principal in krrears Principal OutstandingNo. of Principal in Arrears as X of Total Loans as % of Total Loans
Year Companies Outstanding Principal Interest Total Outstanding Outstanding
1965 11 24.440 0.050 0.690 0.740 0.01 5.29
1966 17 50.990 2.420 1.360 3.780 0.32 6.79
1967 46 160.650 17.630 9.560 27.190 2.12 19.38
1968 46 140.000 21.390 13.230 34.620 2.56 16.83
1969 40 125.720 22.540 11.380 33.920 2.59 14.47
1970 46 121.700 24.800 15.100 39.900 2.50 12.40
1971 41 99.900 14.700 12.600 27.300 1.30 8.90
1972 48 107.863 23.016 13.355 36.371 1.75 8.19
1973 42 107.633 23.839 17.044 40.883 1.58 7.14
1974 47 124.739 29.999 21.019 51.018 1.73 7.20
1975 77 256.269 35.354 24.684 60.038 1.51 10.97
September1976 124 455 280 57 532 40 603 98.135 2.26 17.96
Notes:
1. The following shows loans rescheduled by ICICI:
1965 1966 1967 1968 1969 1970 1971 1972 L973 1974 1975 Sept. 1976
Amounts rescheduled 7.1 8.6 5.1 19.4 13.7 11.8 33.3 16.8 .9.0 11.9 11.5 23.6
Principal outstandingof loans scheduled 22.3 52.9 50.2 82.3 72.8 41.2 87.8 52.6 44.4 45.1 54.5 76.8
Principal outstandingof loans in arrearsplus principal out-standing of loansrescheduled as %of total loans out-standing 10.1% 13.8% 25.4% 26.7% 22.9% 16.6% 16.7% 12.2% ].0.1% 9.8% 13.3% 20.9%
2. The deterioration of the arrears situation from 1967 to 1969 reflects the impact of the rupeedevaluation of 1966 (from Rs 4.76 = R1.00 to Rs 7.5 = US$1.00).
3. F'gures for principal outstanding, principal and interest in arrears as well as amountrescheduled of foreign currency loans are calculated at current rates for 1975 ;.nd 1976.
February 22, 1977

ANNIEX 1.5
THE INDUSTRIAL CREDIT AND INVESTMENT CORPORATION OF INDIA LIMITED
Classification of Arrears as of September 30, 1976(R. in thous..dsd
Principal in PrinoipslPrinoipal and Intsrest Arrears as % Outstanding as
No. of No. of principal in Arroars of Total Loans % of Total LoansProjects Co upanies Outstanding Zrin cipal Interest Total Outstanding Outstandinm
A. AGO OF 841&2S
0 - 3 mDonths 38 33 105,807 16,038 6,364 24,402 0.63 4.173 - 12 months 67 56 199,001 22 675 16,094 38 769 0.89 7.85
12 - 24 months 24 21 96,325 10,568 7,849 18,417 0.41 3.80Over 24 monthe 15 14 54,147 8,251 8,296 16,547 0.33 2.14
144 124 455,280 57,532 40,603 98,135 2.26 t7.96
B. lNDUSTRIAL BREAKDOWN
Chemicals and Petrochemicals(except Fertilisers) 14 11 55,269 9,751 6,241 15,992 0.38 2.18
Electrioal Rtuipment 32 27 80,759 10,724 5,535 16,259 0.42 3.18
Fertilisera and Pesticides 3 3 25,946 145 3,282 3,427 0.01 1.02Food Products (other than Sugar) 2 2 5,736 1,219 - 1,219 0.05 0.23
Glass, Pottery etc. 11 a 27,292 3,054 2,930 5,984 0.12 1.00Machinery Manufacture (other than
Electrical) 12 8 13,520 1,633 1,193 2,826 0.06 0.53Metals and Metal Products 28 28 87,640 15,927 13,603 29,530 o.63 3.46Printing and Publishing 5 4 2,525 428 268 696 0.02 0.10Pulp, Paper and Paper Products 7 7 43,633 3,498 2,278 5,776 0,14 1.72
Rubber Products 3 3 24,171 1,162 15 1,177 0.05 0.95
Sugar 6 6 27,795 2,331 1,203 3,534 0.09 1.10Textiles 6 6 34,214 3,145 2,132 5,277 0.12 1.35
Transport Equipment 8 6 17,982 1,974 949 2,923 0.08 0.71Wood, Cork and Hardboard 2 1 2,543 140 - 140 Neg. 0.10
Miscellaneous 5 4 6,255 2,401 974 3,375 0.09 0.25
144 124 455,280 57,532 40,603 98,135 2.26 17.96
C. 8iANDt3N BLUEZ2 OP GIENT 12
Small ~~~ ~~~ ~~~12 10 31,875 1,784 1,844 3,628 0.07 12Smedu 45 39 61,881 10,776 4,834 15,610 0.42 2.44
Medium 87 75 361,524 44,972 33,925 78,897 1.77 14.26
Total 144 124 455,280 57,532 40,603 98,135 2.26 17.96
D. GZOGRAPHICIL BEAK_DOWN01
Andhra Pradesh 6 4 35,655 9,752 7,795 17,547 0. 14Assam ~ ~ ~ ~ ~~~~~~2 2 18,000 668 492 1,160 0.02 0.71
Aihassr 2 59 629 419 1,048 0,02 0.08
GuBarat 18 154 42551 4,161 2,284 6,445 0.17 1.60Guaryat 46 4 50,455 45 267 312 Neg. 0.21Haryanatak4 5 4 22,239 1,481 1,617 3,098 0,05 0.88
Karnataa 9 4 30,511 2,049 1,958 4,007 0.08 1.20
1:oAhya Pradesh ~ ~ ~ ~~4 3 15,605 156 535 691 0.01 0.62,dhya Pr-desh 33 27 60,196 7,617 2,532 t0,149 0.30 2.37
Rajasthan 3 ~ ~~~~ 3 9,337 767 334 1,101 0.3.7f~ilJooNad 22 18 liO,619 14,352 13,853 2 8,205 0.57 4.30
'Jttar Pradesh 14 14 65,464 8,423 4,765 13,188 0.34 2.58
Vaest Rengal 18 16 23,426 4,569 2,067 6,636 0.18 0.92
Union TerritoriesCandiga Trh- res2 2 5,962 952 601 1,553 0.04 0.23
Delhi 2 2 12,483 1,911 1,084 2,995 0,07 0.43
144 124 455,280 57,532 40,603 98,135 2.26 17.96
1/ Sall: Gross. f-ed assets up to Rs 2.5 olltioc.Mediam: Gross fixed assets over Rs 2.5 million up to Rs 10 million.Lrge: Gross fixed assets over R. l0 million.
February 22, 1977
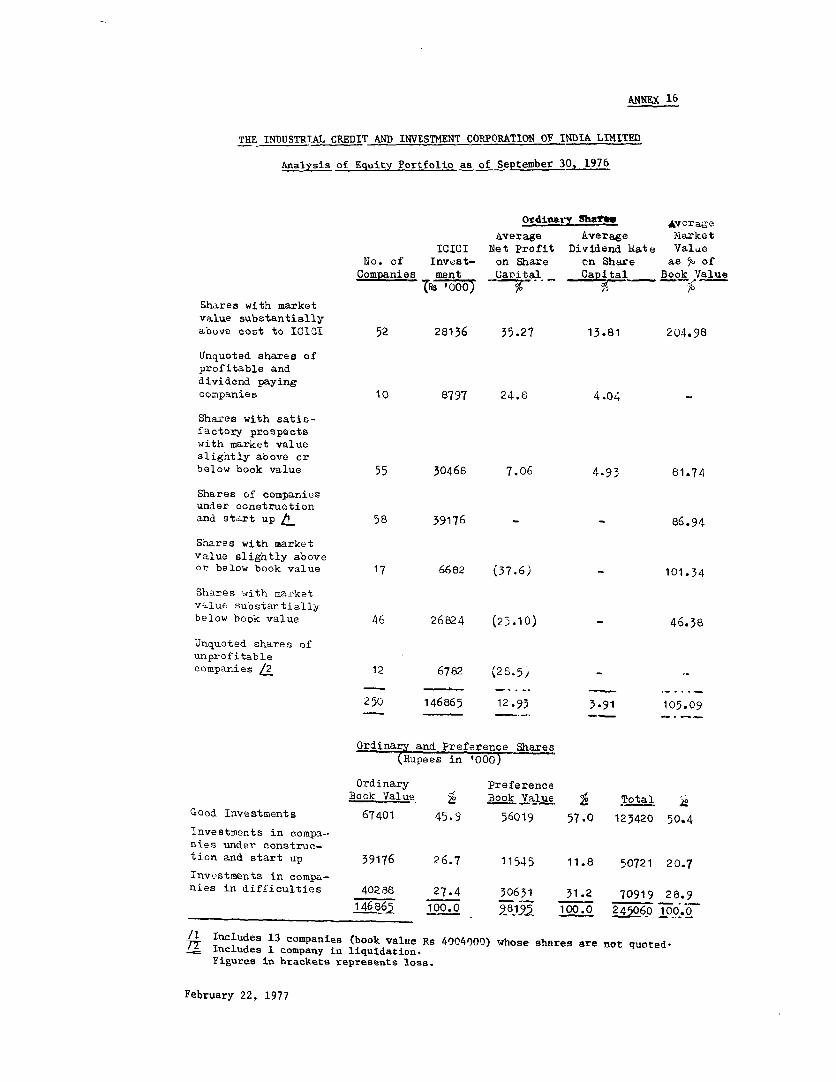
ANNEX 16
THE INDUSTRIAL CREDIT AND INVESTMENT CORPORATION OF INDIA LIMITED
Analysis of Equitv Portfolio as of September 30, 1976
Ordinary shatt Avcrrage
Average Average Market
ICICI Net Profit Dividend hate ValueNo. of Invest- on Share cn Share as %- ofCompanies ment Uarital_ Capi tal Book Value
(RS '000) ° 7
Shares with marketvalue substantiallyabove cost to ICICI 52 28136 35.27 13.81 204.98
Unquoted shares ofprofitable anddividend payingcompanies 10 8797 24.8 4.04
Shaxes with satis-factory prospectswith market valueslightly above orbelow book value 55 30468 7.06 4.93 81.71
Shares of companiesunder construetionand start up k 58 39176 - - 86.94
S'hares with marketvalue slightly aboveor below book value 17 6682 (37.6) - 101.34
Shares with marketv-lue substantiallybelow book value 46 26824 (25.10) - 46.38
Unquoted shares ofunprofitablecompanies & 12 6782 (2S.5' -
250 146865 12.93 3.91 105.09
Ordinary and Preference Shares(Rupees in '000)
Ordinary PreferenceBook Value _ a Book Value f Total i
Good Investments 67401 45.9 56019 57.0 123420 50.4
Investments in compa-nies under construc-tion and start up 39176 26.7 11545 11.8 50721 20.7
Investments in compa-nies in difficulties 40288 27.4 30631 31.2 70919 28.9
14686 100.0 TO1O5 100.O 2450601.0
/1 Includes 13 companies (book value Rs 40040)00) whose shares are not quoted-
Includes 1 company in liquidation.Figures in brackets represents loss.
February 22, 1977

ANNEX 17
THE INDUSTRIAL CREDIT AND INVESTMENT CORPORATION OF INDIA LIMITED
Income Statements, 1971-75 and Jan.-Sept. 1976(Rs in million)
(Jan-Sept.)
1971 ~j22 1927 127 1 1976INCOME
Interest on Temporary Investmentsand Deposits 4.63 6.14 7.85 8.94 7.98 5.81Interest on Rupee Loans andDebentures 30.29 33,40 37.34 46.17 54.26 51.43Interest on Foreign CurrencyLoans 72.28 88,34 115,28 133.95 164.50 126.59Dividends 6.78 8.19 7,57 6.50 8.01 7.42Capital Gains 7,59 6,92 6.79 3.93 6.05 5.64Underwriting Commission &Brokerage 0,43 0.57 0,57 0,59 0.95 0.43Guarantee Commission 0.38 0.35 0,31 0,33 0.32 0.42Other Income 0.48 023 0.53 0.55 1.04 1,93
122.86 144.28 176.24 200.96 243.11 199.67
Salaries etc. 3.88 4.64 5,56 6.34 9.09 6.79Other Administrative Expenses 2.59 2,64 4.Q8 4.29 6,20 4.58Interest & Discount on Debentures 6.77 9.02 14.81 20.92 30.68 26.70Interest on Rupee Loans 19.68 19,63 18.53 19.16 18.84 15.46Interest on ForeignCurrency Loans 47.40 60.76 82.00 96.38 120.29 92.19
Interest on Deferred Dividends - - - - 0.14 0.30Provisions for Doubtful Debtsl/ 1.42 1,44 - - 1.54 -
Bad Debts Written off - 1,12 0.07 1.94 0.80 -31 74 125.05 149.03 187.58 146.02
Profit Before Taxes 41.12 45.03 51.19 51.93 55.53 53 65Less: Taxes 18.32 21.73 26.24 25.29 23.34 26.50-Add Back: Excess Provision forIncome Tax and Sur-Tax onPrevious Years - - - 2.85 -
Net Profit 22.80 23.30 24.95 .6 35.04 27.15
Dividend 7.81 10.00 10.21 12.50 16.50 -Dividend Pay-out Ratio (%) 34.2 42.9 40.9 46.9 47.1 -Net Profit/Average Equity (%) 13.3 11.7 11.3 10.2 11.4 11.6Average Cost of RupeeBorrowings (%) 4.8 5,0 5.2 5.3 5.6 5.6Average Cost of ForeignCurrency Borrowings (%) 6.5 7.0 7.5 8.0 7.1 6.9
Interest Spread 3.1 2.8 2.8 2.9 2.5 2.5Earnings per Share (R4-A 22,80 23.30 16,63 17.76 23.36 18.10Administrative Expenses/Average Total Assets (%) 0.4 0.4 0.5 0.5 0.6 0.5
Profit before Tax and Provi-sioaa/Average Total A.asotu(% 2.8 2e7 2,6 2.3 2.1 2.2
Profit after Tax and Prov pioon.fAverage total Asset. (X) - 1.6 1.4 1.3 1.2 1.3 1.1
1/ These provisions relate to doubtful interest income only.2/ Tax liability estimated at 50% of Profit.3/ On increased capital in 1971 and 1973.41 Provisions made for principal have also been taken into account when calculating
these ratios.
February 22, 1977

ANNEX 18
THE INDUSTRIAL CREDIT AND INVESTMENT CORPORATION OF INDIA LIMITED
Balance Sheets, 1971-75 and September 30, 1976(Rs in million)
D.csba' 31. Sept. 30,2219 1972 i 1974 122i 1976
ASSETS
Temporar In_vestments etc.15.8 14.0 14.6 15.8 10.3 10.3Industrial Assistance
Shares 169.0 173.5 184.1 196.5 222.9 245.1Debentures 125,1 130.3 143.3 152.5 150.3 146.6Loans in rupees 283.4 311.3 jZ1.6 461.1 .0 667.1
577.5 615.1 699.0 810.1 923.2 1058.8
Loans in foreign 842.3 998.6 1134.1 1270.5 1785.8 1867.6currencies
Fixed Assets (Net) 6.6 7.4 10.3 11.3 13.8 15.9
Current Assets and Advances
Cash and bank balance 56.6 95.0 146.6 84.3 140.8 348.2Other assets and advances 78.0 106.1 119.4 147.8 160.5 198.2
1576.8 1836.2. 2124.0 2339.8 1034.4 3499.0
EQUITY lND LIhBILITIES
Share capital 87.5 100.0 125.0 126.8 150.0 150..02,Reserves surplusi/ 97.6 113.1 128 .1 146.4 154.3 183 1-=
(and grants) 185.1 217.1 253.7 273.2 304-3 jj2t
RuDee Borrowings
Debentures 110.0 180.0 260.0 350.0 482.5 620.0Government of India 297.2 274.4 246.6 219.3 191.7 170.5IDBI 141.0 fS1.0 171.5 130.0 215.1 20T.0
548.2 605 4 6.1 7492. 889.3 22L.
Foreign Currency Borrowings -
I3RD 654.5 796.0 929.5 1035.8 1453.8 1493.7IID 13.0 10.1 7.3 4.0 1.0 0.7KfW 118.3 131.7 139.7 145.9 213.4 237.3Swiss Bonds - - 15.1 15.1 _27.S _28-9
785.8 937.8 1221.6 1200.8 1695.7 1760.6
Current liabilities 57.7 79.9 100.6 116.5 145,1 413.2jS76.8 1836.2 2124.0 2359.8 121Lj 3499.0
Guarantees outstanding 48.5 47.8 46.3 41.2 34.1 97.4
Debt/equity ratio asdefined in Bank Loan 7.6 7.8 7.8 8.0 7.9 8.7Agreement
V Reserves upto December 31, 1974 include dividends to be paidat the beginning of the following year from the current year'searnings. From 1975, the practice of providing dividend out ofprofits has been introduced.
2/ Tax liability estimated at 50% of profit.
Notes In 1975 and thereafter the figures of foreign currency loans havebeen arrived at by converting each currency into rupees at the currentrate of exchange as against the past practice of conversibn at the centralrate of exchange at the time of disbursement.
February 22, 1977

ANNEX 19
THE INDUSTRIAL CREDIT AND INVESTMENT CORPORATION OF INDIA LIMITED
Cash Flow Statements, 1971-75 nnd January-September, 1976(Rs in million)
_q nvDFLlDcember 21. ___ Jan.-Sept.
~SOURCMS3ta 55 7 ,9i ,J __6_
Profit before tax 41Q1 45.0 510.2 51, oI 584 53.6
Add back: non-cash charges(Depreoiation, provision,write off etc.) j,-j 2. A0 _'-S.3 0.8L
Cash generation from operations 42.6 '1X Z ' 3542 596 54.4Increase in share capital 12,5 1205 2500 108 2301Draw-down on foreign
currency borrowinge 204.7 265.8 27i.3 293.5 36840 254i1 l/
Domestic currency borrowings 18,0 8907 9lGcO 11006 24001 139.3-Loan oalleotionas
AgQiaiL domestic currency 48,9 45.5 55n3 7105 5605 40,9Agaiuift foreign currency 85oO 109o9 14601 1 561 241o4 201.7Sales from portfolio:
Shares 5.3 13.7 1ii7 6,7 6.4 403Debentures 9.4 5.9 3a3 1 .o 4.e 307
Sales from temporary investmsnts ' 1o8 - 5.5
426o6 592.7 67`i .8 695.5 1004,6 698.4
Increase in fixed assets 0.8 2,8 1 0O 309 2.6Increase in temporary investments 5.1 - 0,6 1, 2
Disbursement of loanst
Domestio currency 87.6 7303 114q.1 161&O 147.3 158.0
Foreign currency 204.7 265.8 2T10O 293b5 371,1 254,1Equity Investments:
Shares 1703 i8,3 23.8 19.1 32.8 26,6Debentures 2.9 I11, 16,4 10,3 2,2 4.o
Repayments: -
Against domestic currency 16(8 52,6 3603 39.4 102,0 3709borrowings
Against foreign currency 76.4 106,2 13168 163&4 227.5 201,0borrowings I
Paid to Government and Banks 6,1 8,4 3.9 20.9 3065 17eion account U.K. funds
Increase in receivablesv accrued 13.0 28.0 13.4 28.4 7.3 330O
income etc.
Less increase in payables, (15,7) (22.2) (21,3) (15,9) (11.5) (286,4,)1deferred items etc.
Payment of tax 18.3 21,7 26,2 25.3 23,3 26.5Payment of dividend '7.8 10OG 10,2 12.5 16,5Increase (decrease) in short- (13,7) 38,1-7 52,8 (62,3) 56.5 207,5term investmento and cash
12 6 "U, >-'7 6t'arS
Debt Service Coverage 1.48 1.28 1.25 120 1.03
1/ Rs 258,6 million being application money received on debentures issued inthe month of September 1976 is included as an item of use of funds in'Inerease in payables, deferred itnen ote.9 are: Dot uh s a saurees
item against 'Domestic currency borrowings' column, as the same wereallotted onty on neteher 1, 1o7A.
February 22, 1977

ANNEX 20
THE INDUSTRIAL CREDIT AND INVESTMENT CORPORATION OF IUDIA LIMITED
Forecast of Approvals, Commitments and Disbursements, 1976-80(Rs million)
Actual Estimated Proiected1974 1975 1976 1977 1978 1979 1980
Approvals
Rupee loans 173.9 200.6 398.9 390.0 430.0 480.0 530.0Guarantees - 30.8 60.3 20.0 20.0 20.0 20.0Investments - Shares 33.7 51.2 75.5 76.0 85.0 86.0 9:3.0
Debentures 0.5 76.6 0.3 34.0 40.0 44.0 52.0
208.1 359.2 535.0 52(0.0 575.0 630.0 695.0
Foreign currency loans 514.5 353.1 415.0 525.0 575.0 635.0 700.0
Total Approvals 722.6 712.3 950.0 1,045.0 1,150.0 1,265.0 1,395.0= = =z -- = - -=_
Commitments
Rupee loans 173.4 106.4 250.0 366.5 401.5 430.5 479.0Guarantees 6.3 - 47.0 20.0 20.0 20.0 20.0Investments - Shares 17.7 61.0 46.0 75.0 81.5 86.5 90.5
Debentures 11.0 29.8 32.0 15.0 35.0 40.0 43.0
208.4 197.2 375.0 476.5 538.0 577.0 632.5
Foreign currency loans 376.6 349.1 480.0 525.0 570.0 630.0 690.0
Total Commitments 585.0 546.3 855.0 L 5 1108.0 1,207.0 1,322.5
Disbursements
Rupee loans 157.7 134.2 190.0 3113.0 403.5 432.0 488.0Guarantees 0.1 0.1 - - - -
Investments - Shares 19.0 32.3 33.5 49.0 55.5 60.5 70.0Debentures 10.3 8.2 31.5 18.5 33.5 39.5 47.0
187.1 174.8 255.0 385.5 492.5 532.0 605.0
Foreign currercy loans 369.2 371.0 400.0 416.5 459.5 568.0 645.0
Total Disbursements 556.3 545.8 655.0 802.0 952.0 1,100.0 1,250.0
February 22, 1977

ANNEX 21
THE INDUSTRIAL CREDIT AND INVESTMNT CORPORATION OF INDIA LIMITED
Projected Foreign and Domestic Currency Resource Position, 1976-1980
Estimated - - - - - - - - - Pro1ected - - - - - - - - - - - - -1976 1977 1978 1979 1980 1977-80
I. Foreign (US$ million)
Resources available for commit-ment at beginning of year 88.8 39.3 87.9 39.5 79.4 -
Less: New commitments 53.3 58.3 63.3 70.0 76.7 268.3
Plus: New resources:KfW 3.8 3.8 3.8 3.8 3.8 19.2UK - 6.1 6.1 6.1 6.1 24.4Middle East/OtherCommercial - 17.0 5.0 20.0 10.0 52.0
IBRD - 80.0 - 80.0 - 160.0
Sub-total 3.8 106.9 14.9 109.9 19.9 251.6
Resources available for commit-ment at end of year 39.3 87.9 39.5 79.4 22.6 -
Number of months succeedingyear's commitments 8 17 7 12 4
II. Local (Rs million)
Resources available for disburse-ment at beginning of year 156.6 249.1 280.2 256.1 249.4 _
Plus: Sources:
Internal cash generation-/ 18.1 23.2 26.2 29.9 35.8 115.2Collection on rupee loans 79.6 108.4 132.9 158.6 182.8 582.7Sales from portfolio 15.0 16.0 17.0 18.0 19.0 70.0Increase in share capital - 30.0 30.0 30.0 30.0 100.0Debenture issues plus borrowings 277.5 279.5 304.5 330.0 95.0 1,309.0Loan collections against UK funds-/ 10.5 13.2 18.7 24.0 29.7 25.6
Sub Total 400.7 470.3 529.3 590.5 692.3 2,262.4Less: Requirements:
Loan disbursements 190.0 318.0 403.5 432.0 488.0 1,641.5Investment disbursements 65.0 67.5 89.0 100.0 117.0 373.5Fixed asset acquisition 7.0 6.5 10.0 11.6 12.5 41.6Repayment of loans 46.2 47.2 50.9 53.6 49.5 201.2Redemption of debentures - - - - 50.0 50.0
Sub-total 308.2 439.2 553.4 597.2 718.0 2,307.8
Resources available for disburse-ment at end of year 249.1 280.2 256.1 249.4 223.7
1/ Net of taxes and dividends.
2/ Payments made to GOI and banks out of counterpart funds from IDBI. Thus, as maturities of borrowingsand loans don't match, ehie is a source of local currency funds.
February 22, 1977
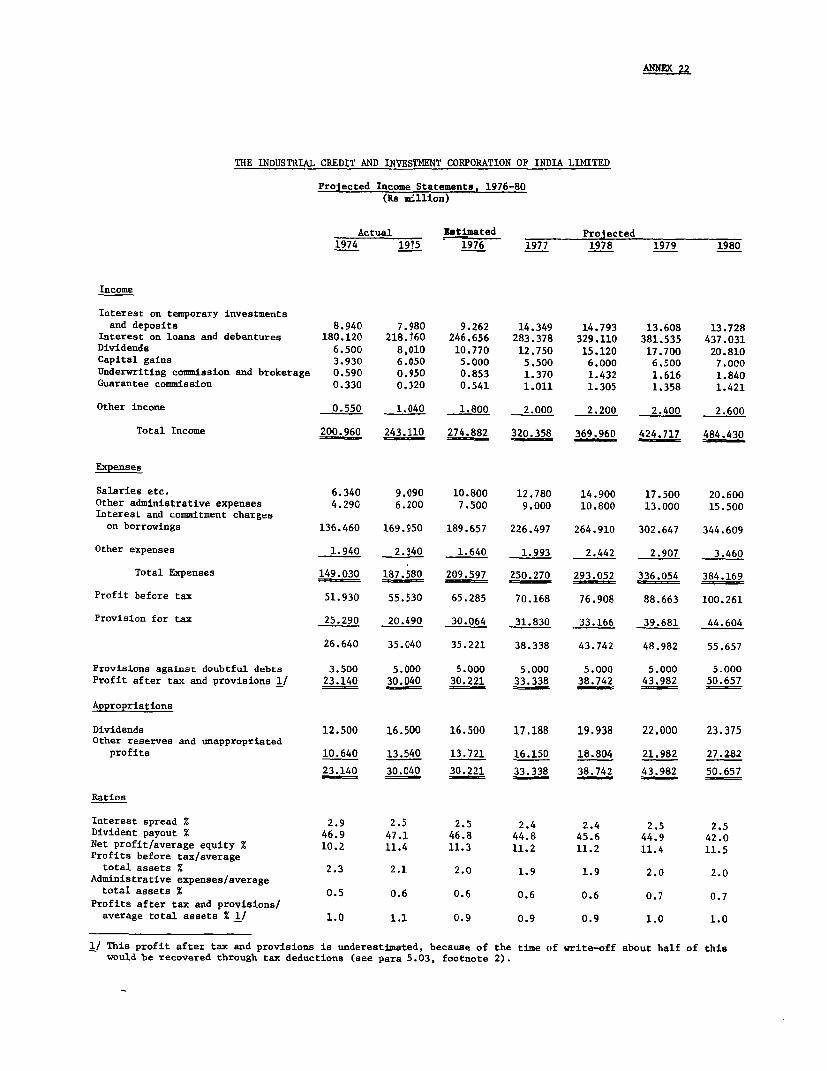
ANNEX 22
THE INDUSTRIAL CREDIT AND INVESMENT CORPORATION OF INDIA LIMITED
Projected Income Statements, 1976-80(Rs million)
Actual Estimated _ Proiected1974 1975 1976 1977 1978 1979 1980
Income
Interest on temporary investmentsand deposits 8.940 7.980 9.262 14.349 14.793 13.608 13.728
Interest on loans and debentures 180.120 218.160 246.656 283.378 329.110 381.535 437.031Dividends 6.500 8,010 10.770 12.750 15.120 17.700 20.810Capital gains 3.930 6.050 5.000 5.500 6.000 6.500 7.000Underwriting commission and brokerage 0.590 0.950 0.853 1.370 1.432 1.616 1.840Guarantee commission 0.330 0.320 0.541 1.011 1.305 1.358 1.421
Other income 0.550 1.040 1.800 2.000 2.200 2.400 2.600
Total Income 200.960 243.110 274.882 320.358 369.960 424.717 484.430
Expenses
Salaries etc. 6.340 9.090 10.800 12.780 14.900 17.500 20.600Other administrative expenses 4.290 6.200 7.500 9.000 10.800 13.000 15.500Interest and commitment chargeson borrowings 136.460 169.950 189.657 226.497 264.910 302.647 344.609
Other expenses 1.940 2.$40 1.640 1.993 2.442 2.907 3.460
Total Expenses 149.030 187.580 209.597 250.270 293.052 336.054 384.169
Profit before tax 51.930 55.530 65.285 70.168 76.908 88.663 100.261
Provision for tax 25.290 20.490 30.064 31.830 33.166 39.681 44.604
26.640 35.040 35.221 38.338 43.742 48.982 55.657
Provisions against doubtful debts 3.500 5.000 5.000 5.000 5.000 5.000 5.000Profit after tax and provisions 1/ 23.140 30.040 30.221 33.338 38.742 43.982 50.657
Appropriations
Dividends 12.500 16.500 16.500 17.188 19.938 22.000 23.375Other reserves and unappropriated
profits 10.640 13.540 13.721 16.150 18.804 21.982 27.2<82
23.140 30.040 30.221 33.338 38.742 43.982 50.657
Ratios
Interest spread % 2.9 2.5 2.5 2.4 2.4 2.5 2.5Divident payout % 46.9 47.1 46.8 44.8 45.6 44.9 42.0Net profit/average equity % 10.2 11.4 11.3 11.2 11.2 11.4 11.5Profits before tax/averagetotal assets % 2.3 2.1 2.0 1.9 1.9 2.0 2.0
Administrative expenses/averagetotal assets % 0.5 0.6 0.6 0.6 0.6 0.7 0.7
Profits after tax and provisions/average total assets % 1/ 1.0 1.1 0.9 0.9 0.9 1.0 1.0
1/ This profit after tax and provisions is underestimated, because of the time of write-off about half of thiswould be recovered through tax deductions (see para 5.03, footnote 2).

ANNEX 23
THE INDUSTRIAL CREDIT AND INVESTMENT CORPORATION OF INDIA LIMITED
Projected Balance Sheets, 1975-80(Rs million)
Actual Estimated Projected1974 1975 1976 1977 1978 1979 1980
Assets
Cash and short-term deposits 84.5 140.8 209.3 232.6 201.2 237.5 214.9
Receivables, accrued income etc. 147.6 160.5 176.6 198.0 224.3 249.7 280.2
232.1 301.3 385.9 430.6 425.5 487.2 495.1
Temporary investments 15.8 10.3 12.3 12.3 12.3 12.3 12.3
Outstanding loans:
Foreign currency loans 1,270.5 1,785.8 1,944.9 2,050.9 2,159.6 2,240.0 2,360.2Rupee loans 461.1 550.0 656.9 859.2 1,119.5 1,381.7 1,673.4
Outstanding investments:
Shares 196.5 222.9 250.4 296.4 351.5 411.3 483.7Debentures 152.5 150.3 176.8 189.6 216.8 250.2 289.3
Total loans and investments 2,080.6 2,709.0 3,029.0 3,396.1 3,847.4 4,283.2 4,806.6
Fixed assets (net) 11.3 13.8 19.2 23.7 31.3 40.0 50.0
Total Assets 2,339.8 3,034.4 3,447.2 3,864.3 4.318.9 4 5,368.0
Liabilities and Equity
Current liabilities 116.5 145.1 171.7 189.2 211.9 238.5 266.4
Foreign currency borrowings 1,200.8 1,695.7 1,835.6 1,951.7 2,076.2 2,223.2 2,379.6Rupee loans 749.3 889.3 1,120.6 1,352.9 1,606.5 1,882.9 2,178.4
1,950.1 2,585.0 2,956.2 3,304.6 3,782.7 4,106.1 4,558.0
Share capital 126.8 150.0 150.0 180.0 210.0 240.0 270.0
Reserves against doubtful debts 22.0 27.0 32.0 37.0 42.0 47.0 52.0Other reserves and unappropriatedprofits 124.4 127.3 137.3 153.5 172.3 194.3 221.6
273.2 304.3 319.3 370.5 424.3 481.3 543.6
Total Liabilities and Equity 2,339.8 3,034.4 3,447.2 3,864.3 4,318.9 4,825.9 5,368.0
Guarantees outstanding 41.2 34.1 79.4 132.3 134.5 139.0 144.6
Ratios
'..TD debt/equity ratio 9.66 9.45 10.56 10.24 10.39 9.86 9.55Debt/equity ratio (Bank definition) 8.00 7.94 8.73 8.58 8.42 8.16 8.10Current ratio 2.1 2.1 2.3 2.3 2.0 1.9 1.8
Note: In 1975 and thereafter the figures of foreign currency loans have been arrived at by convertingeach currency into rupees at the current rate of exchange as against the past practice of conversionat the central rate of exchange. The debt/equity ratio calculations for 1974, however, are based oncurrent exchange rates. The calculation of the debt/equity ratios excludes reserves against doubtfuldebt from the equity base.
February 22, 1977

ANNEX 24
THE INDUSTRIAL CREDIT AND INVESTMENT CORPORATION OF INDIA LIMITED
Projected Cash Flow Statements, 1976-80(Rs million)
Actual Estij-ated Rxc'ected1975 1976 1977 1978 1979 1980
Sources
Profit before tax 58.4 65.3 70.2 76.9 88.7 100.3
Add back non-cash charges(Depreciation write off) 0.9 1.6 2.0 2.4 2.9 3.5
Cash generation from operations 59.3 66.9 72.2 79.3 91.6 103.8
Increase in share capital 23.1 - 30.0 30.0 30.0 30.0
Drawdown on loans:
Foreign currency borrowings 368.0 400.0 416.5 459.5 568.0 645.0Rupee borrowings 240.1 277.5 279.5 304.5 330.0 395.0
Loans and debentures convertedinto equity - 4.0 8.0 11.6 12.3 16.4
Loan collections:
Foreign currency loans 241.4 241.0 310.5 350.8 487.6 524.8
Rupee loans 56.5 79.6 108.4 132.9 158.6 182.8
Sales from portfolio:
Shares 6.4 10.0 11.0 12.0 13.0 14.0
Debentures 4.3 5.0 5.0 5.0 5.0 5.0
1,004.6 1,084.0 l.241.l 1,385.6
Uses
Increase in fixed assets 3.1 7.0 6.5 10.0 11.f 13.5
Disbursements of loans:
Foreign currency loans 34.1 400.0 416.5 459.5 548.0 645.0Rupee loans 147.3 190.0 318.0 403.5 432.0 488.0
Equity investments:
Shares 32.8 33.5 49.0 55.5 60.5 70.0Debentures 2.2 31.5 18.5 33.5 39.5 47.0
Equity investment due to conversion - 4.0 8.0 11.6 12.3 16.4
Repayments:
Rupee loans 42.0 46.2 47.2 50.9 53.6 49.5Foreign currency borrowings 258.0 260.1 300.4 335.0 421.0 488.6
Redemption of rupee debentures 60.0 - - - - 50.0
Increase in receivables etc. 7.3 19.4 22.2 27.1 26.2 31.3Less increase in payables etc. (11.5) (22.8) (17.5) (22.7) (26.6) (27.9)Payment of tax 23.3 30.1 31.8 33.2 39.7 44.6Payment of dividend 12.5 16.5 17.2 19.9 22.0 23.4Increase (decrease) in cash etc. 56.5 68.5 23.3 _ 4) 36.3 _22. 0
0 10084.0 1,241.1 1,385.6 1 696.1 1,916.8
Debt Service Coverage 1.03 1.13 1.22 1.25 1.31 1.21
February 22, 1977

ANNEX 25
THE INDUSTRIAL CREDIT AND INVESTNENT CORPORATION OF INDIA LIMITED
Estimated Disbursement Schedule for the Proposed Twelfth Loan(US$ million)
Amount %
1978 January - March 0.2 0.3April - June 1.0 1.3July - September 3.1 3.9October - December 4.7 5.8
9.0 11.3
1979 January ° March 5.0 6.3April - June 5.5 6.8July - September 6.0 7.5October - December 6.5 8.2
23.0 28.8
1980 January - March 7.0 8.8April - June 7.5 9.3July - September 8.0 10.0October - December 6.0 7.5
28.5 35.6
1981 January - March 5.5 5.8April - June 5.0 6.3July - September 4.5 5.6October - December 2.5 3.2
17.5 21.9
1982 January - March 2.0 2.4
80.0 100.0
February 22, 1977


THE INDUSTRIAL CREDIT AND INVESTMENT CORPORATION OF INDIA LIMITEDORGANIZATION CHART(AS ON JUNE 30, 19761
| G-EAL METI.. OF -HA R-.
(AS DP..EATO1I O
< | 6~~~EORRETART 0 001S ARRIODAST GENERAL ROASRR S'AAL ASCISET ACOULTANT SANDOER
(H.R. HIRWADI |(CV. AIDRHAI lEE K11 (HI . KCHARII
16 3HRGAA1 M HAfSAI5A 3EDORODIC DEFSAER- DEPAHDHRT MANTEDNL )OSHO ____C 3HAH_____R AO) __ PEDDARI CH EF ___D MELLO_
SIAISIAS OEPAODORSR RHANOShcsss OFFICES SASOACAS Nl>§YsSlo<8l CDHEODRHIOATIO1S AADIE SEERADIDOR EARDHE1 DEPARTMENT SECTION OFEASTUEST REEAERSIFLE
AICINIDI, AEFADERDOD OOEARDRSNT DEFARDOENT OFFARDORCE~~~~M ..- T
0(1 I' 14 1711(01 101 RI 101 1101 (0.) 1101CI(I(4 (SI (RI 10110110CHIEF AEF~."IO-R CIE FFC - JOIT MA.OR --N-E M1ANASER CRIE. 0ZFF00S OFFICE- "OIR -SIR DEPOD 0-S-DOT CE RE
(00 HORASCAI IL-OA-AS OS -- EAR-TI I---HH .. -RRTA.D I. SHA-DA-WRRAN IC OTAIH D HA. ITS E-OARI ISA JOA-EHI I0 -RELLI IN -CAH- -S.SAI IOAND-AE-ASAR ERR-AR IS.H H OR-F. 01F -)-RNAOI (A.-ENA-1D IN-T H A DALL T.-DAI VOS EDTA) (AC 05-01 liDT EAHI-D


BRD 3873R
72 - , E RAN ABA6AANA JANUARY '9751_v A--I\t TB E T 0
\ t C H I N A t .~~~~~~~~~~~~~~~~~~~~~~ ~ ~~~~ N D i A IV 5 C * A .VN
e ) .S XV6ALJ _,.GAL
s g :. _ : k s (~~~~~~~~~~~~~~T I B E T)
B-' Ti_ -..V,~~~~~~~~~~~~~
/ . ,,~~~~~~D, DLH I A,t_ , , <
. . , S,_ 4 ( t\.\ .1R;m!B BNH U TAN BRO' N,,
\^1 JAIPUR ,GRAHC ~ A'$ '-
C H I N ~~HA R\BGBN
[ - - 1 << '+"'' ' tt <2<-0> \~~~~~~~~~~~~~~~~~~~~1 BANGLADESH 4g
SINDRI 9 NDAN 03A0A
L ^ v [,, ! - R . D~~~~~~~~~~~DE S HlRASEP?WS ,i! 1 .
, A I> 9 , ;,A /,,,, *) _,,L 8HILAI t HIRAKUD
-0 - -- ' /'i \ ZB O3 'S A'AA
-20- A TROM BAY ;2'-90U8AY SEO SD o H A :> A oR S. . 8 _ .} S Z ef -
POONA F s z J - rnr;rl
's. §-'B EEL GA UM . ,I N D I A>> ,>: - ,:v ~~~~LOCATION OF MAJOR INDUSTRIL CENTERS
_ ~ ~ ~ GC 66 A> AA ~U
> f 8HADRAVATri \ ,D I,,dUSErTEJI 9enteK
sb M~~~~~~~~~~~~~~~~~~~ Steel Ffantst.4RiiA-fXFtHC < * \ ~~~~~~~~~~Fortifizet PlarIts
9 '. BANGALORE M i *---2t. tFiADRAS A BAGntsm j _ , _ ~~~~~~~~~~~~~~~Stote rr U-ion Terr,to,y 130-4a,.is
;.-'_ Int-ntional BrCndAris
'. ' -1 ~~NEYVELI:FACT;VOL '\~AO _ A L A
~~~~i° CttH}N\S:"t ~~~~~~~~~~~~~~~~~~~~~~~~~~~~~~~~~~~~,A, MES -
L G/3,ANKA IOD 30 0
BOMBAY !A TROMBAY I ,4YA := 0 4D0 6o a! ti~~~~~~~~9LOM5fTIR r
70- 90,~~AR1~A,'A.' ~ A6.o