report no. 168194 - documents & reports - all … eqiivalents currncy unit = yuan (y)= 100 fe...
TRANSCRIPT

ES~ESMAPGo 6II Wmsr*T
_NW Ifin qi~'c St Manement Assistance Prgramme
at /qq4t
ChinaEnergy Efficiency and Pollution Control In
Township and Village Enterprices (TVE)Industry
Report No. 168194
Pub
lic D
iscl
osur
e A
utho
rized
Pub
lic D
iscl
osur
e A
utho
rized
Pub
lic D
iscl
osur
e A
utho
rized
Pub
lic D
iscl
osur
e A
utho
rized

4
JOINT UNDP / WORLD BANKENERG'C SECTOR MANAGEMENT ASSISTANCE PROGRAMME (ESMAP)
PURPOSE
The Joint UNDP/World Bank Energy Sector Management Assistance Programme (ESMAP) waslaunched in 1983 to complement the Energy Assessment Programme, established three years earlier.ESMAP's original purpose was to implement key recommendations of the Energy Assessmentreports and ensure that proposed investments in the energy sector represented the most efficient useof scarce domestic and external resources. In 1990, an international Commission addressedESMAP's role for the 1990s and, noting the vital role of adequate and affordable energy ineconomic growth, concluded that the Programme should intensify its efforts to assist developingcountries to manage their energy sectors more effectively. The Commission also recommended thatESMAP concentrate on making long-term efforts in a smaller number of countries. TheCommission's report was endorsed at ESMAP's November 1990 Annual Meeting and prompted anextensive reorganization and reorientation of the Programme. Today, ESMAP is conducting EnergyAssessments, performiuig preinvestment and prefeasibility work, and providing institutional andpolicy advice in selected developing countries. Through these efforts, ESMAP aims to assistgovernments, donors, and potential investors in identifying, funding, and implementing economicallyand environmentally sound energy strategies.
GO VERIVAANCE AND OPERATIONS
ESMAP is governed by a Consultative Group (ESMAP CG), composed of representatives of theUNDP and World Bank, the governments and institutions providing fimancial support, andrepresentatives of the recipients of ESMAP's assistance. The ESMAP CG is chaired by the WorldBank's Vice President, Finance and Private Sector Development, and advised by a TechnicalAdvisory Group (TAG) of independent energy experts that reviews the Programme's strategicagenda, its work program, and other issues. ESMAP is staffed by a cadre of engineers, energyplanners and economists from the Industry and Energy Departnent of the World Bank. TheDirector of this Department is also the Manager of ESMAP, responsible for administering theProgramme.
FUNDING
ESMAP is . cooperative effort supported by the World Bank, UNDP and other United Nationsagencies, the European Community, Organization of American States (OAS), Latin AmericanEnergy Organization (OLADE), and countries including Australia, Belgium, Canada, Denmark,Germany, Finland, France, Iceland, Ireland, Italy, Japan, the Netherlands, New Zealand, Norway,Portugal, Sweden, Switzerland, the United Kingdom, and the United States.
PURTHER INFORMATION
For further information or copies of completed ESMAP reports, contact:
ESMAPc/o Industry and Energy Department
The World Bank1818 H Street N.W.
Washington, D.C. 20433U.S.A.

China
Energy Efficien.y and Pollution Control in Townshipand Village Enterprises (TVE) Industry
December 1994
Results of a Joint Study by ESMAP and theChina Ministry ofAgriculture 's Department of Energy and
Environmental Protection, the Department of Township Enterprises,and the State Planning Commission's Energy Research Institute.
Power Development, Efficiencyand Household Fuels DivisionIndustry and Energy DepartmentThe World Bank1818 H Street N.W.Washington, D.C. 20433
This document has restricted distribution and may be used by recLpients onlyin the petfonnance of their official duties. Its contents may not oth.wisebe d rlosed wihout tNDP or World Bank authicontan.

ABBREVIATIONS AND ACRONYMS
ABC Agricuktural Bank of ChinaBAU Business as usualCO2 Carbon dioxideGDP Gross domestic productESMAP Energy Sectr Maagement Assistance ProgrammeFYP Five-Year PlanGEF Global Environment FacilityIRkR innal rte of retrnKgce Kilogram of coal equivalentkW KilowattkWh Kilowatt hourMOA Ministry of AgiculteMTCE Million tons of coal equivalentNEPA National Environmental Protction AgencySOE State-owned enterpriseSO2 Sulphur dioxideTCE Tons of coal equivalentTVCE Township and village collective enterpriseWVE Township and village enterpisetpa tons per annumIpy tonsperyear
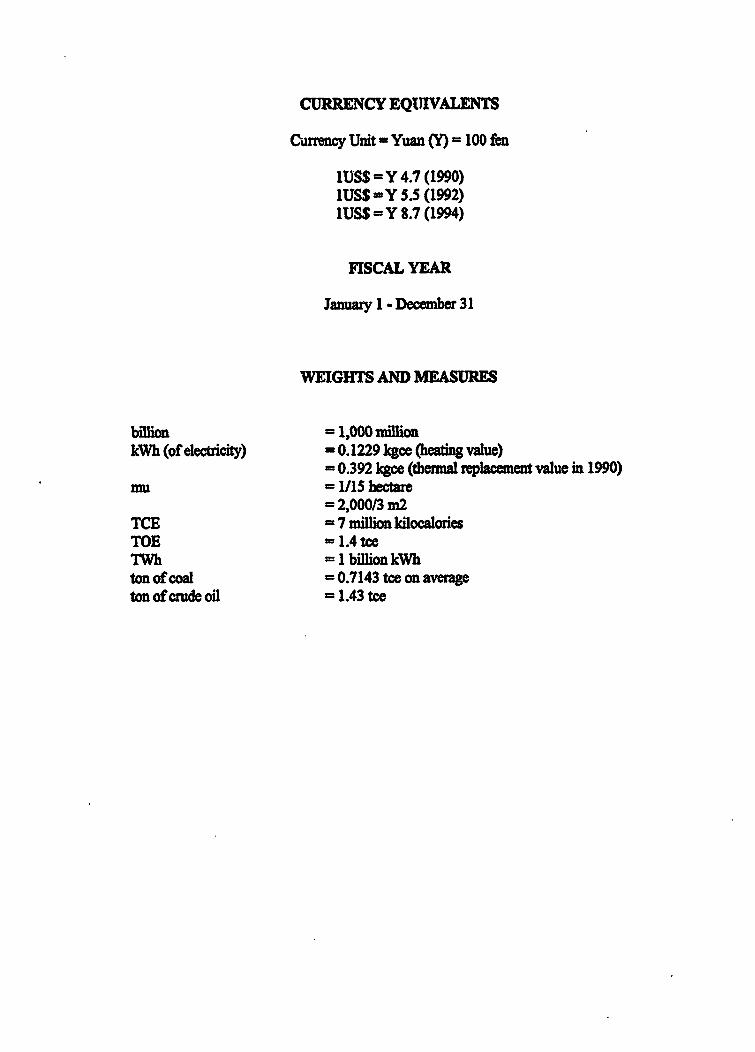
CURRENCY EQIIVALENTS
Currncy Unit = Yuan (Y)= 100 fe
1US$ = Y 4.7 (1990)lUS$ =Y S.5 (1992)1US$ =Y 8.7 (1994)
FISCAL YEAR
January 1 - Decemnber 31
WEIGHTS AND MEASURES
bDlmon = 1,000 nilokWh (of electricity) = 0.1229 kgce (heating value)
= 0.392 kgce (themal replacment value in 1990)muI = 1/l5 hectare
= 2,000/3 m2TCE = 7 million kilocaloriesTOE = 1.4 tceTWh = 1 bilion kWhton of coal = 0.7143 toe on avemeton of crude oil = 1.43 tce

TABLE OF CONTENTS
PREFACEEXECUITIV SUIvMARY ................. i
I. OVERVIEW 1.
Role of Township Enterprises in the National Economy .Key Chamaeteristics of TVEs .TVE hie ... 2Energy TUitization .3Environmental Issues .4Objectives and Methodology of the Study ............................ , . 5Key TVE Industries Selected for the Study .6
IL. INDUSTRY PROFILES .7
A. The Brick Industry .7Introduction .7Technologies Currently Used .8Technical Improvements .9Size and Scale Factors . 1Environmental Factors .12
B. TheCokeIndustry .12Introduction .12Technologies Currently Used .13Technical Improvements .1Size and Scale Factors .16
C. Metal Castings Industry .17Introduction .17Technologies currently used .18Technical Improvements .19Size and Scale Factors .20Environmental Factors .20
m. CASE STUDIES OF INVESTMENT OPTIONS .22
A. The Brick Industry .22Specific Investment Cases .22Results of Case Studies .24Energy and Pollution Impacts .26
B. The Coke Industry .26Specific Investnent Cases .26Case A Data and Assumptions .27Case B Data and Assumptions .27Case C Data and Assumptions .27Results of Case Study .28Energy and Pollution Impacts .29

C. The Metal Castings Indusy ....................................... . 29Specific Investnent Cases ....................................... 29Results of Case Studies ....................................... 31Energy and Pollution Impacts ....................................... 3 1
Net Costs of Energy Savings and Carbon Dioxide Abatement ...................................... 32Summary ............................... 33
IV. CONCLUSION4S AND RECO0MMENDATIONS .34Introduction .34Directions gor Technical Improvements . 34
Brickmaking .35Metal Casing .36Cokemaking .37
Policy Implications .37Recommendations .39
REFERENCES ............................................. 41
ANNEXESAnnex A Accelerated Investment Scenarios ............................................. 42Annex I. Output Shares under Accelerated Scenarios ............................................. 53Annex II. Cash Flow and Sensitivity Tables ............................................. 55Annex Im. Energy Consumption of Metl casting Industry .......................................... 78Annex IV. Brick Industry: Additional Information ............................................. 80Annex V. Metal castings Industry: Intenational Comparisons .................................... 82

Preface
This report is one of the outputs of a technical assistance activity to China by theUNDP/World Bank Energy Sector Management Assistance Program (ESMAP). Part of thefinancing for the activity was provided by the UNDP Project e:. Greenhouse Gas Emissionsexecuted by the World Bank, into which results of the study was provided as inI;4L The studywas conducted jointly by a World Bank/ESMAP team and a Chinese team consisting of staff ofthe Ministry of Agriculture's Department of Energy and Environmental Protection and theDepartment of Township Enterprises, the State Planning Commissior's Energy ResearchInstitute and several local experts. Four reports were prepared by the Chinese teatn during thecourse of the study. In addition, short technical papers on the subject industries werecommissioned with the Energy Technology Support Unit (ETSU) and the Coal ResearchEstablishment, both of the United Kingdom. Thesr materials were used as bases for writing theoverall report.
The ESMAP team consisted of Ernesto N. Terrado, Principal Energy Planner (TaskManager), Barry Tunnah, Energy Conservation Specialist (Consultant) and Peter Johanssen,Industrial Policy Analyst (Consultant). The Chinese team was led by Mme. Deng Keyun and Mr.Zhang Lujiang of the Ministry of Agriculture. The valuable assistance of the local team as wellas by officials in the cities of Chengdu, Jiexiu and Tianjin are gratefully acknowledged. Researchassistance at the World Bank was provided by Zhang Zhihong. Donald Hertzmark (Consultant)assisted in the economic and financial analyses. The final report was writen by Emesto Terradoand Barry Tmnnah. Robert Taylor, Todd Johnson and Kurt Schenk reviewed the drafts andprovided valuable suggestions.

ExecuiveSummary
Overview: Role of Township Enterprises in the National Economy
1. As a consequence of China's rual economic reform, township and villageenterprises in China experienced remarkable growth in the last decade and now play a vital rolein the overall economy. Table I summarizes the breakdown by ownersnip types.
Table 1. TVE Ownership Breakdown (1993)No. of Enterprises Output Value Number of
Ownership (million) (bin Yuan) Employees(million)
Collective (Township and Village) 1.5 (7%) 1170 (677%) 51.5 (49%/)Private (Joint and Individual) 19.3 (93 %) 588 (33%) 54.3 (51%)All TVEs 20.8 (100%) 1751 (100%) 105.8 (100%)
Source: Sttical Digest of Township Enterpises (1993)
2. The output of TVEs increased at an average rate of about, 30% annually from1985-1992. In 1992 they accounted for 32 % of the national social product and 66 % of the ruralsocial product. Operating outside the framework of state ownership, TVEs are characterized bymarket orientation and autonomous financial operation. State control of TVEs is exercised onlythrough taxation, allocation of credits, rules on employment of labor, safety regulations,environmental regulations and other indirect means. Despite their smaller scale, older equipmentand less educated staff studies have shown that TVEs are generally more efficient in economicterms than State Owned Enterprises (SOEs). The reason appears to be the TVEs higherflexibility (due to their relatively small size) and their better ability to exploit local resources(due to close ties to the community). Furthermore, TVEs generally do not have the SOE's burdenof financing employee social security and other benefits. The TVEs are administered by the localgovernments in accordance with the national and provincial economic and social developmentplan and the state industrial policy.
lVE Induy
3. In this study, attention is focused on the collective enterprises because a vastmajority of the industries in the three analyzed sub-sectors belong to this category. IndustrialTVEs account for about two-thirds of total output value by all township enterprises, as shown inT-,le 2. It is projected that by the year 2000 TVEs will make up 50% or more of total nationalin istrial production.
Table 2. Relative Share of Industrial Enterprises Compared to All TVEs, 1992Number of Output Value Number of EmployeesEnterprise (bin Yuan) (million)(million)
Indusirial TVEs 7.9 1319 63.4All TVEs 20.8 1758 105.8Shae of Industrial Enwrises 38% 75% 60%
Souce: Statistical Digest of Township Etrpise (1993)

H ii -
4. In 1990, TVE industry consumed 142 million tce, consisting of 79 % coal, 16%electricity and 5.4% fuel oil. (See Figure 1). This represented 14.5% of total national energyconsumption and about 24% of total industrial energy consumption.
SeuaWm of EEnera S. TVEs tend to pay higher prices forconsurnp (1#) fuels than SOEs (which until recently obtained fuelsTotl: 142 million t largely at lower, in-plan prices) and thus may have
more incentive to adopt energy conservation practices.16ecttcIty Fue Oil Nevertheless, considering their generally small
production scale, aging equipment and often outdatedproduction processes, there is substantial potential forenergy savings in. TVE industry. That energy
79% conservation efforts are imperative is underscored byprojections indicating that TVE energy consumptionwill reach 240 million tce (of which raw coal will
reach 230 million tons) in 2000 and 330 million tee (of which raw coal will be 290 million tons)in 2010.
M.yectives and MebOdOQlog of e Stdv
6. Previous studies conducted by the Bankl (See, for example Ref 3) and othershave already examined macroeconomic policy issues and have identified key structural reformsthat need to be implemented to ensure the continued growth of the TVE sector. These studiesrecomn ended broad policy initiatives to improve the current legislative and incentiveframeworks, the provision of services to rural firms, and reforms in coal allocation and pricing.The present study is focused on technical improvements in energy efficiency, and aims toidentify specific policy measures, strategies and programs at the plant level that would promoteenergy conservation and help improve the economic efficiency of the WVE industry sector. Themethodology involved conducting case studies for energy efficiency improvements in selectedTVE industies, analyzing the costs and benefits of generic investment options and determiningindustry-wide replicability of the findings.
7. Brick and tile, coke and metal castings were selected for the case studies. Thesethree TVE inductries collectively account for about 40% of raw coal consumed, almost half ofthe total energy consumed and almost half of the total CO2 released to the atmosphere by allTVE industries in China.
Industry Profles
Brickmaking
8. Bricks are the leading construction materials in China and WVE industries nowproduce over 90% of total market demand (See Table 3). The rest are produced by a few largestate-run enterprises. Thirteen provinces account for about 85% of all TVE industry brick or atotal of about 355 billion pieces in 1990.

- iii -
Table 3. Position of TVE Brickmaking Industries(Outputs in 100 million pcs)
Year 1985 1986 1987 1988 1989 1990 1991 1992National Output 2942 3750 3911 4688 4716 4572TVE Output 2573 3447 3824 4528 4346 4174 4254 4955% TVE 87.5 91.9 95.8 96.6 92.2 91.3
Soure: Reference I
9. The most common brick production method in use in TVE industry todayutilizes the basic annular kiln (also knowr as the "Hoffman" type) with natural drying, i.e.,laying out in stacks in the open air and direct sunlight, of the green bricks. Over 90% of bricksare produced ir, this manner. The breakdown of production by kiln type for 1990 is shown inTable 3.
Table 4. TVE Brick Output According to Kiln Type (1990)
Kiln Type Output, Percent of TVE100 million pcs Output
Primitive indigenous kilns 313 7.5Annular kiln
Natal drying; solid bricks 3790 90.8Artificial drying; solid bricks 54 1.3Artificial dryig; hollow bricks 13 0.3
Tunnel kilnsArtificial drying; solid bricks 3 0.07Artificial drying; hollow bricks 1 0.03
Total 4174 100.0Source: Reference I
10. Improvements that have been made over the last few years include theincorporation of increasing amounts of coal dust and high carbon fly ash (e.g. from power plants)in the raw material clay that contribute to the energy required in firing. A second development isthe shift to the artificial drying process where combustion gases exhausted from the stack arechannelled into a drying section through which the green bricks are passed.The typical Hoffmankiln operation is characterised by a relatively large land use, both for the production of the mainraw material (clay) and for the stacking of green bricks for drying. A typical brick works makingsay 10 million standard bricks per year occupies 30 mu (20,000 M2). Artificial drying results insignificant land savings and higher productivity (year round operation) but may result in higherenergy intensity due to the need for supplemental fuel. Another relatively recent development isthe production of hollow or perforated bricks that enable significant savings in material andenergy with little effect on brick structural properties.
Cok Making
11. Most of the coke used in China is produced by large (greater than 100,000tonnes/yr) mechanized ovens in state-run enteprises. In 1990, of the total of 73 million tonnes ofcoke produced in China, about 70% was produced by mechanized ovens. The rest was producedin numerous, small scale TVE industries mainly by non-mechanized means, 90% of them in justseven provinces. A breakdown of TVE coke output by type of oven in 1990 is as follows:

iv.
Iable 5. TVE Coke Output by Oven Type (1990)
Coke Oven Type Million tonnes PelcentPrmiive Indigenous 4 6 24.7PX 11.8 63AJX-1 1.0 5.4Types P9, 75 0.7 3.8Small Mechanical 0.5 2.7Large Mechanical 0.0 0.0
Total 18.6 100.0Source: Reference I
12. Many of the ovens still used in TVE cokemaking, including the PX and JX-1types, are relatively simple and do not recover the chemicals, tars or gases released in theprocess. Very roughly, this represents a loss of 3.2 to 4.0 million TCE annually, as well as severepollution impacts from gaseous emissions and liquid effluents discharge.
13. The third generation Types 75 and 89 designs either burn most of the byprodu-.tsor recover the tar. Coal consumption is improved to about 1.4 TCE per ton coke and pollution issubstantially reduced compared to the earlier models. However, there is little motivation forretrofit-conversion of an existing operational PX or JX- oven to Type 75 or 89 since the cost isnot significantly less than building an improved oven on a clear site. Without stronger regulatroymeasures, technical improvements are therefore only attractive to producers when an existingoven or plan' reaches the end of its economic life - typically ten years for most ypes of ovenused in the TVE industry- and a new plant musi be built As regards mechanical ovens, only thevery large ones (over 200,000 tpy) that recover and market gas products are likely to beeconomic. Their substantially higher cost is certain to be a major constaint to adoption by TVEsin the near term.
Mestal Csings Idy
14. In 1990, Chinese industries used 10 million tonnes of metal castings, secondhighest in the world. About 42% of these were produced by 13,200 TVE enterprises. The outputvalue of this contribution was about 6.3 billion Yuan. Eleven provinces account for nearly 80%of the total TVE castings output.. Nearly all (99%) of TVE metal casting work is on ferrousmaterials, i.e., iron and steel. The quality and durability of the products are way behind thoseproduced by developed countries. The position and profitability of the China's TVE castingindustry in the future will depend on how quickly it can upgrade the quality of its products that,in turn, depends on how quickly it can convert to more modern and efficient production methods.Such conversion will very likey also result in significant reduction in cool use per unit output.
15. TVE castings enterprises are divided in this report into four rough categories: (a)Backward -- typically using manual production methods, producing say 1000 tonnes of castingsper year, (b) Less Backward -- using mostly manual methods and a small proportion ofmechanized molding facilities, making say 3000 tonnes per year; (c) Moderate or General level -- using mechanized molding, a hot blast cupola, and making about 5000 tonnes per year, and (d)Advanced level -- using a mechanized or semi-automatic molding line, a complete sandprocessing system, using a hot blast cupola with computer controlled charging system or aduplex melting set, and making 5000 tonnes per year or more.

.V.
16. The shares of total output of the various categories in 1990 are shown below:
Table 6. Output Distribution of Castings Industry by Technology Category (1990)
Technology Output Percentmillion tonnes
Backward 2.058 49.0Less backward 2.100 50.0Moderate level 0.042 1.0Advanced level 0.0 0.0
4.200 100.0Source: Reference I
Case Studies of Investment Options
17. The technical improvements examined include conversion or retrofit of existingoperation, consolidation into larger scale operation, establishment of new, more efficient plantsand a combination of such actions. The base cases were chosen so that they represent typicalsituations in each industry, such that potential replicability of desirable improvements ismaximized.
TheBricdkIndugIr
18. Two basic cases were chosen for economic investigations:
£aase A, involving the consolidation of several small plants producing solidbricks and using artificial drying into one large plant producing solid bricks (Al)or hollow bricks (A2) and using artificial drying; and
Case B the conversion of an existing plant producing solid bricks and usingnatnral dtying to one producing hollow bricks and using artificial drying.
19. Case A takes care of the prevalent situation where most brickworks are smalland may need first to be consolidated before any technical renovation is carried out. Foranalytical purposes, Case A is broken into two discrete steps or subcases (Al and A2), asfollows:
Al Consolidating production in a larger plant and conversion to artificialdrying.: replacement of ten typical small plants (each making 5 million solidbricks/yr. using Hoffman kilns, natural drying) by one larger plant (50 millionsolid bricks/yr. using the Hoffman kiln, artificial drying).
AZ Conversion to hollow brick production: conversion of one existing largeplant producing 50 million solid bricks /yr. using a Hoffman kiln with artificialdrying to a plant of the same capacity, same kiln, with artificial drying butproducing standard clay hollow bricks.
20. Case B, meanwhile, is analyzed by using three different plant capacities: 5, 10and 20 million solid bricks/yr. (subcases B1, B2 and B3). The purpose of the exercise is todetennine the minimum economic scale for this type of conversion.

.vi-
Coke Makin
21. The case studies chosen for the cokemaking industry were as follows:
Case A. The replacement of 5 typical PX coke ovens of 10,000 tpy capacity byone new plant producing 50,000 tpy, either with JKH-89 (Case Al) or TJ-75oven,; (Case A2);
Case B. The establishment of a small mechanized coke oven (HQ-3) of 50,000tpy capacity, as a replacement for 5 PX ovens, each of 10,000 tpy capaeity;
Case (C. The establishment of a refinery processing 3000 tpy tar, collected fromadjacent Type 89 plants.
Meta Castinags,
22. The two case studies chosen for the metal castings industry involve theintroduction of more energy-efficient technology and more modern casting processes to typicalTVE foundries:
Case A Transformation of five 3,000 t/yr foundries using standard cold blastcupola melting and manual molding with clay-bonded sand, to three 5,000 t/yrfoundries with duplex melting (cold blast cupola plus electric holding furnace)and using automated resin-bonded sand molding.
as B Establishment of one new 5,000 t/yr plant with internally heated hotblast cupola and automated resin-bonded sand molding line, as an alternative tofive 1,000 tfyr traditional foundries using cold blast cupola and manual clay-bonded sand molding.
Results of Case Studies
23. The results of financial and economic analysis for the three industries aresummarized in Table 7 below.
24. Brick. Consolidation of small brickworks and conversion to artificial drying(Case Al) is clearly a highly beneficial investment from both the TVE's and the country'sviewpoint (large land savings, high IRRs). Extending Case Al to the production of hollow bricks(not shown in the above but also investigated) is also a viable inrvestment but less so than Alalone. However, it does not make economic sense to take an existing plant already usingartificial drying and convert it to hollow brick production (Case A2) mainly because of theadditional extruder cost Existing plants still using natural drying can be viably converted tonatural drying and hollow brick production if the scale is at least 20 million bricks/yr (CaseB3).The major constraints to more rapid implementation of the above identified viableconversions are: (1) the difficulty of consolidating small brickworks, especially when owned byseveral townships, and (2) the high cost of special extuders for hollow brick production.
25. Coke. Replacing small PX plants with a larger third-generation model JKH-89 orType 75 (Case A) appears to have acceptable economic rates of return but low financial rates ofreturn. However, in all cases it was found that these indicators are extremely sensitive tovariations in operating costs and coke prices. Just a fall of 3-5% in coke prices from current

. vii -
levels, for example, can make the investments completely uneconomic. Replacing the small PXplants with a mechanical oven of only 50,000 tpy capacity (type HQ-3) has marginal rates ofreturn and, like the previous case, the economics is extremely sensitive to changes in operatingcost and coke prices. Thus, while these options represent improvements over the highlypolluting PX models, they do not appear to be viable long-term alternatives to the currentsituation; the only valid reason for renovations would be environmental concerns. Theestablishment of a centralized tar refinery of at least 3,000tpy is the only positive case analyzed;it is clearly a highly beneficial investment in economic and environmental terms.
Table 7. Summary of Feasibility Analyses
Incremental DiscountedCase Investment, Financial Analysis Economic Analysis Payback,
'000 Yuan NPV IRR, % NPV IRR, % YearsBrick.Al 2,183 1,648 29.4 3,705 47.2 6-7
(1,283-1,782) (23-31) (3,218-3,906) (37-52)A2 500 Negative Negative Negative Negative NABi 621 -192 5.0 -111 8.25 NA
937 (-172 to -318) (2-6) (-vQ to -279) (4-10)B2 850 100 14.8 274 20.1 6-7
1,062 (-42 to +140) (11-16) (85-380) (14-23)
B3 1,105 636 22.2 1,725 45.6 4-51,381 (451-716) (20-33) (1,478-1,937) (36-48)
Coke:Al 2,905 819 15.7 950 22.8 7-8
(-1,164 to (7-27) (-2,550 to +5,374) (<0 to +73)+3,324)
A2 2,865 1,501 16.8 2,858 40.1 5-6(-929 to (8-28) (-643 to +7,281) (4-90)+3,559)
B 6,125 -569 10.0 1,126 17.6 NA(-1,829 to (5-30) (-1,087 to +11,261) (6-68)+5,171)
C 3,199 27,620 30.8 66,787 53.4 4-5Metal Castings:
A 31,590 6,000 15.0 42,860 32.7 8-9(-37,390 to (<0 to 32) (-32,690 to (<0 to 61)42,040) 1^5,500)
B 9,930 3,730 18.0 11,270 28.5 6-7(-7,450 to (-2 to (-7,7100 to (4 to 49)13,080) +32) 27,310)
26. Metal Castings. The two investment cases examined are attractive from thecountry's viewpoint but the financial rates of return are both less than 20%. Both cases representmajor changes in the operational process, and the use of relatively high-technology equipment.These are reflected in the higher investment requirements compared to the brick and coke casesand, in the case of A, a relatively longer payback period. While both cases are sensitive to bothinput and output pri^es, they are much less so than in the coke cases. Considering the continuingimportant role of the TVE castings industry to the overall industrial devlopment of China, and

- viii -
the recognized need to upgrade the currently backward status of this industry, the aboveidentified economic investments deserve support. The major barrier to faster adoption of theseoptions by the TVE metal casting sector is the high capital cost-and correspondingly longpayback periods--and the need for special training in the new expertise required.
Energ and Pollution mpacts
27. Except for the conversion of brickworks from natural to artificial drying thatresults in greater energy consumption', all of the cases shown to be economically viable alsoresult in coal savings and reduction of smoke, dust and CO2 and SO2 emissions (see Chapter 3).In addition, the phasing out of indigenous and PX ovens reduce groundwater pollution from tarand other chemical discharges. The net cost of carbon dioxide abatement are negative forinvestments found to be viable in all three industries, reflecting that these benefits are onlyadditional to the profitability gains.
Accelerated Investment Programs
23. The identified economic investments in the TVE brickmaking and metal castingsindustries may not be undertaken at any significant pace due to various constraints mentionedabove. Well-designed interventions, such as capacity building, intermediation of the infonnationmarket and fiscal incentives, can accelerate the level of investments in the more efficientprocesses. The discussions below examine accelerated investment programs that could havegreater impact on TVE-wide coal savings and reduction of CO2 and S02 emissions. Theseimpacts were estimated at two levels of accelerated investments: Low Accelerated scenario andHigh Accelerated scenario (See Annex A).
29. The Business-as-Usual (BAU) scenario was first determined; it represents thebest estimate of what the industry situation up to the year 2010 would be if no interventions byway of promoting improved technologies or raising new investment funds are made. The twoaccelerated scenarios were then used to estimate the impacts of active industiy upgradingprograms implemented starting in 1995. Implicit in the two accelerated cases am the additionalefforts on human resources development and the promotion of new technologies and bestprctices that will be crucial to achieving higher rates of adoption of new processes.
30. The estimated investment under the BAU scenario and the incrementalinvestment required for the accelerated upgrading scenarios in the two industries are shown inTable 7.
1 This Is because, aside ftom increased coal ase, more electlty input is required for the blowers. The benefitsof conversion to the brlckworks are in shorter drying time, extended plant operatrng period per year (since the process isno longer affected by bad weather conditions) and thus Increased brick output greater labor productivity and, mostimportantly. substantially reduced land requirement.

I ix-
Table 7. Investment Levels, Million YuanBrickmaking and Metal Castings
BAU (rotal) Low vs. BAU High vs. BAU(Difference) (Difference)
1995-2000 7,909 7,246 12,6002000-2005 13,866 5,765 13,1952005-2010 22,540 5,224 11,883
31. The resulting estimated incremental impacts on coal savings and reduction ofS02 and C02 emissions are shown in Table 8.
Table 8. Incremental Impacts of Accelerated ProgramsBrickmaking and Metal Castings
Low vs. BAU High vs. BAU
Coal, C02, S02, Coal C02, S02,thousand thousand thousand thousand thousand thousandTCE tonnes C tonnes TCE tonnes C tonnes
1995-2000 147 3,957 180 296 4,035 1852000-2005 415 3,617 163 825 5,264 2382005-2010 755 3,536 154 1,531 9,760 420
Conclusions
32. Energy efficiency initiatives for TVEs must be approached at two levels:through structural or policy reforms, and through cechnical improvements. There is scope foreffective interventions at the plant level in TVEs, to ensure that industry transformation is guidedto the use of appropriate technologies and efficient practices in the medium term. Although anumber of Government initiatives in technology transfer are beginning to be implemented, mostTVEs still have very limited access to technologies and best practices. The present study hasfocussed on brickmaking, coke making and metal casting because they collectively account forabout half of total coal use by TVEs; furthermore, these industries represent vital inputs toinfrastructure (bricks) and machinery (coke and castings), the demand for which can be expectedto keep pace with the very rapid growth of the overall economy. The study found that in Chinatoday relatively low-cost technical innovations that are highly appropriate to TVE conditionsexist in the brick and cokemaking industries and need to be more widely disseminated. Incokemaking, however, the study found that efficiency improvements confined to the currentscales of production are only marginally economic and do not represent long-term solutions tothe problems faced by this particular TVE enterprise.
Policv Implications
33. In TVEs the driving force for energy conservation is not the desire to save coalbut the need to maintain a market share in an increasingly competitive environment. Inenterprises with high energy consumption, energy conservation can help streamline costs andenable them to adapt to changing market conditions. The TVEs are more likely than the SOEs toface realistic, market-based input prices and this fact, together with their profit-oriented nature,will predispose them to adapt efficient technologies if not hindered by lack of relevant technical

_x_
information or access to up-to-date capital goods. Improving access by TVEs to these factors islikely to prove more effective in consenring energy than regulations and administrative sanctions
34. Ownership issues can be a barrier to implementing technical upgradingprograms. The intimate relationship that exists between the TVEs and local governments canlead to conflicts of interest between regulatory and ownership functions. This could bemanifested in, inter alia, inadequate enforcement of environmental regulations and slow phasingout of highly inefficient plants. Strengthening enterprise law and clarifying property rights aswell as promoting share-holding may help some TVEs outgrow their present communityorientation and induce cross-sectoral cooperation.
35. It is important to continue efforts to create a "level playing field" between TVEsand SOE's regarding access to finance, capital goods, inputs, skilled manpower and technicalassistance. The "1986 Regulations" established an institutional framework and supportmechanisms for energy conservation but these seem to be directed more at the larger SOEs thanat TVEs. Technological support to TVEs needs to be strenghtened. The knowledge about energyefficient technologies and the operational experience of plants who have successfully introducedsuch technologies need to be disseminated through training courses, workshops or other types ofpromotional events.
36. On environmental policy, it should be noted that in areas where air pollution isalready serious, the construction of even a new, energy efficient plant will firther worsen localair quality. This implies that a program to support introduction of efficient technologies in TVEsmust ensure that old plants are shut down when new ones are being constructed in order toachieve an actual improvement of air quality in very polluted areas.
Recommendations
37. Considering the significant economic and environmental benefits of thetechnical improvements described in this study, it is recommended that a prgmm to gp=de theTVE brickworks and metal casting industies be prepared. The program will consist of: (a)inlesmen in technical process improvements and restructuring initiatives, i.e., establishmentof larger, more efficient plants to replace a number of smaller, inefficient ones--along the lines ofthe cases studied in this report; (b) cApa&i builig activities-including industry-specifictraining on good practices and other energy saving approaches; sector-wide awarenesscampaigns, and the development of capabilites in existing county level energy conservationcenters to effectively support specific technical needs of the subject industries, and (c) activeenforcement of environmental regulations at the local level. The upgrading program to beprepared for the suject industries could be structured into three phases: a three-year pilot phasestarting inl995, followed by a five-year expansion phase and a full implementation phasethereafter
38. The future of coke production in China points inexorably to the direction ofWestern type large-scale mechanical (LSM) ovens which are environmentally cleaner and moreeconomic. The TVE sector should be encouraged to phase out its support for small-scaleindigenous co-ke production. A more active program of inspection, application of environmentalpenalties and shutting down of highly polluting PX plants should be carried out by TVEs.Existing JKH-89, TJ-75 and similar improved models should be allowed to continue operationbut should not be extended any subsidies or special assistance. The establishment of new

-xi-
cokeworks that do not recover their gas byproducts should be discouraged over the mediumterm. If new small-scale cokeworks are to be built, they should, at a minimum, be required toutilize new designs such as the JKH-89 and TJ-75 or later models. For all new cokeworks, acomprehensive environmental impact statement should be made to show that there will be no netincrease in pollutant emission in the area.
39. The preparation of the proposed prgm should be made a major compnent ofthe proposed UNDP GEF technical assistance project ($5-6 million) directed at TVEs that MOAexpects to be approved shortly. Availability of these resources provide an opportunity to: (a)prepare the proposed program, including the conduct of additional supporting investigations, and(2) implement the pilot phase. The additional work needed are more detailed techno-economicinvestigations of the promising investment cases that were identified broadly in the presentstudy, and more incisive determination of realistic options for addressing the various policy andimplementation issues that were raised but not resolved in the present study. There is need, forexample, to make a deeper assessment of the barriers and possible approaches to encouragingconsolidation of several small-scale TVE operations to a larger one-an implementation issuethat has not often been successfully resolved in past projects. There is also need for a moreintensive review of the various existing programs for dissemination of technical information toTVEs, how effective they have been and how best to integrate them under a coherent overallsystem. These additional preparatory work could be conducted within the framework of aninstitutional study on "how to efficiently implement energy conservation initiatives in TVEs ".
40. The objectives of pilot phase implementation would be to demonstratefeasibility, develop the human resource base needed to appraise, implement and sustain thesetype of projects in TVEs, and acquire experience in institutional coordination. The pilot phasecould start with several typical plants representing the three industries in one or a few provinces.The communities/provinces chosen should have a record of being active in implementingtechnical renovations, where the chances of program success are maximized. These sites may ormay not be the same ones where the present case studies were done. Based on the experienceacquired in the pilot phase and the availability of financing sources, the upgrading programwould be expanded into several more provinces. The third phase would aim for a nationwideprogram. The output of the pilot phase would include a detailed definition of the follow-upexpanded investment project.

L Overview
Role of Township Enterprises in the National Economy
1.1 As a consequence of China's rural economic reform, township and villageenterprises in China experienced remarkable growth in the last decade and now play a vital rolein the overall economy. Known as brigades and communes before 1983, "township enterprises"or "township and village enterprises (TVEs)" is now the general term applied to all enterprises ofdifferent ownership as long as they are non-state owned. Business activities by TVEs permeateevery part of the national economy and every aspect of social commodity production andexchange, including industry, construction, transportation, commerce, food service, serviceindustry and collectively run agricultural and livestock farms in rural areas. TVEs includecollective enterprises (owned by townships or villages), joint enterprises (owned by severalhouseholds) and individual enterprises (owned by one household). Table 1 summarizes thebreakdown by ownership types.
Table 1.1 TVE Ownership Breakdown (1993)
No. of Output Value Number ofOwnership Enterprises (bln Yuan) Employees
(million) (million)Collective (Township and 1.5 (7%) 1170(67%) 51.5 (49/)Village) 19.3 (93 %) 588 (33%) 54.3 (5 1%)Private (Joint and Individual)All TVEs 20. 8 (1 00%) 1751 (100%) 105.8 (100%)
Source: Statistical Digest of Township Enterpre (1993)
1.2 The output of TVEs increased at an average rate of about 30% annually from1985-1992. In 1992 they accounted for 32 % of the national social product and 66 % of the mralsocial product. The emergence of numerous township enterprises has accelerated the formationand development of small towns in mrual areas: there were only about 9,000 small towns in 1986but over 40,000 in 1990.
Key Characteristics of TVEs
1.3 Operating outside the framework of state ownership, TVEs are characterized bymarket orientation and autonomous financial operation. Market needs and trends generallydetermine production paerns, pricing of goods and other day to day decisions. On average,more than 85% of needed raw materials and fuel are obtained in the competitive market. Statecontrol of TVEs is exercised only through taxation, allocation of credits, rules on employment oflabor, safety regulations, environmental regulations and other indirect means.
1.4 Compared to state-owned enterprises (SOEs), equipment and technology used inTVEs are generally older, mostly of 1950 to 1970 vintage, although acquisition of modemequipment has intensified in recent years. While the average educational level of TVEemployees and managers is still far below that of SOEs, the number of employees with collegelevel education has increased by over 300% since 1986. Despite these deficiencies, studies haveshown that TVEs are generally more efficient in economic terms than SOEs. The reason appears

-2 -
to be the TVEs higher flexibility (due to their relatively small size) and their better ability toexploit local resources (due to close ties to the community). A major advantage over SOEs is thatTVEs are not required to allocate funds for social security and similar benefits to its employees.
1.5 Extemal financing of TVEs are commonly in the form of revolving capital loansand fixed asset loans obtained mainly from the Agricultural Bank of China (ABC) and ruralcredit cooperatives. Revolving capital loans supplement regular enterprise funds for day-to-daymanagement and production, and for seasonal purchase of raw materials. The loan periodusually does not exceed a production cycle, i.e., a maximum of one year. Fixed asset loanssupplement funds for capital goods investment of newly-established enterprises, and providefunds for technical innovation and large-scale equipment repair. The loan period ranges from Ito 4 years, depending on the specific purpose. Interest rates for ABC loans are set uniformly bythe state and are relatively low. Rural credit cooperatives are allowed to charge higher interestrates and generally do so.
1.6 At the state level, ail TVEs come under the jurisdiction of the Ministry ofAgriculture (MOA) and its "Department of Township Enterprises". At the provincial level,control is exercised through a Provincial Rural Enterprise Bureau; similar offices also exist at thecity and township levels. The local Rural Enterprises Bureau have the power to issue and revokelicenses to operate to TVEs. The TVCE enterprises are administered by the local govermments inaccordance with the national and provincial economic and social development plan and the stateindustrial policy.
TVE Industry
1.7 In this study, attention is focused on the collective enterprises, also oftenabbreviated TVCE's (Township and Village owned Collective Enterprises) because a vastmajority of the industries in the three analyzed sub-sectors belong to this category. IndustrialTVEs account for about 75% of total output value by all township enterprises, as shown in Table2, and roughly one-third of total industrial output in China. It is projected that by the year 2000TVEs will make up 50% or more of total national industrial production.
Table 1.2. Relative Share of Industial Enterprises Compared to All TVEs, 1992
Number of Output Value Number of EmployeesEntaprises (bin Yuan) (million)(million)
Industri TVEs 7.9 1319 63.4All TVEs 20.8 1758 105.8Share of Industrial Enterprise 38% 75% 60%
Sowce: Stistical Digest of Township Enteprises (1993)
1.8 The phenomenal growth experienced by TVE industry during the brief span of adecade is shown in Table 3. Between 1981 to 1990, the average increase in annual total outputvalue was about 39 %.
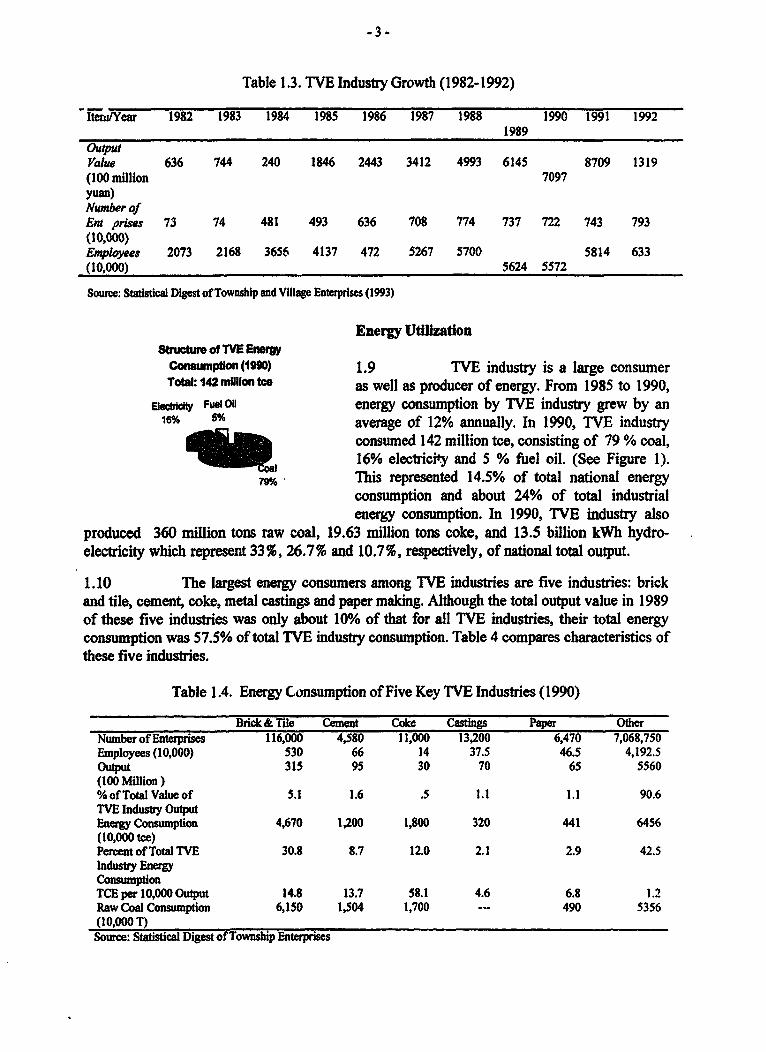
Table 1.3. TVE Industry Growth (1982-1992)
IiGenwYear 1982 1983 1984 1985 1986 1987 1988 1990 1991 19921989
OutpValue 636 744 240 1846 2443 3412 4993 6145 8709 1319(100 million 7097yuan)Number ofEn prises 75 74 481 493 636 708 774 737 722 743 793(10,000)Employees 2073 2168 3656 4137 472 5267 5700 5814 633(10,000) 5624 5572
Source: Statstical Digest of Township and Village Enterprises (1993)
Energy UtilizationStrucWte of TVE Enerw
Consumpton (190) 1.9 TVE industry is a large consumerTotal: 142 millon1tee as well as producer of energy. From 1985 to 1990,
Ebltict Fuel OU energy consumption by TVE industry grew by an16% 5% verage of 12% annually. In 1990, TVE industry
consumed 142 million tce, consisting of 79 % coal,16% electricity and 5 % fuel oil. (See Figure 1).
79% This represented 14.5% of total national energyconsumption and about 24% of total industrialenergy consumption. In 1990, TVE industry also
produced 360 million tons raw coal, 19.63 million tons coke, and 13.5 billion kWh hydro-electricity which represent 33%, 26.7% and 10.7%, respectively, of national total output.
1.10 The largest energy consumers among TVE industries are five industries: brickand tile, cement, coke, metal castings and paper making. Although the total output value in 1989of these five industries was only about 10% of that for all TVE industries, their total energyconsumption was 57.5% of total TVE industry consumption. Table 4 compares characteristics ofthese five industries.
Table 1.4. Energy Consumption of Five Key TVE Industries (1990)
Brick & Tile Cement Coke Castings Paper OtherNumber of Enterprises 116,000 4,580 11,000 13,200 6,470 7,068,750Employees (10,000) 530 66 14 37.5 46.5 4,192.5Output 315 95 30 70 65 5560(100 Million )%ofTotalValueof 5.1 1.6 .5 1.1 1.1 90.6TVE Industry OulputEner Consumption 4,670 1,200 1,800 320 441 6456(10,000 toe)Percent of Total TVE 30.8 8.7 12.0 2.1 2.9 42.5Industry EnergyConsumptinTCE per 10,000 Output 14.8 13.7 58.1 4.6 6.8 1.2Raw Coal Consumption 6,150 1,504 1,700 - 490 5356(10,000T)Source: Statstical Digest of Township Enterprises

-4-
1.11 No definitive studies exist that compare energy efficiencies of State-ownedindustries and TVE plants engaged in similar production lines. SOEs as a group consume muchmore energy than TVE industry b-i this is due mainly to their larger scale and heavy-industryconcentration. . Although small-scale TVEs employing traditional methods are clearly wastefulof energy (such as traditional coke making kilns, small iron smelters, etc), these are graduallybeing phased out by a combination of environmental regulations and market factors. TVEs tendto pay higher prices for fuels than SOEs (which until recently obtained fuels largely at lower, in-plan prices) and thus may have more incentive to adopt energy conservation practices.Nevertheless, considering their generally small production scale, aging equipment and oftenoutdated production processes, there is substantial potential for energy savings in TVE industry.
1.12 That energy conservation efforts are imperative is underscored by projectionsindicating that T1VE energy consumption will reach 240 million tce (of which raw coal will reach230 million tons) in 2000 and 330 million tce (of which raw coal will be 290 million tons) in2010. For China as a whole, the primray energy consumption per unit of GDP is higher thanmost other countries, including some low-income countries such as India. A major reason is theinordinately high-share of the industrial sector in the GDP in the Chinese economy (46% in 1988as compared to only 30% for India); in general, the industry sector in all countries has a higherenergy intensity of output than the other sectors. Compounding this factor is the predominance oflow-value goods in China's current industrial mix, resulting in relatively higher energy input fora given value of output goods (Ref. 2). For the TVE sector, the energy consumed per unit ofproduct for heavy coal-using industries is much higher than Westem equivalents. For example,bricks produced in indigenous kilns in China consume about 2.6 TCE/10,000 bricks incomparison with about 0.9 TCE/10,000 bricks in the U.K. Significant reductions in currentenergy intensity could be achieved, however, without necessarily adopting high-technologyprocesses in the West. Many locally developed energy-efflcient innovations are already practicedin some parts of China and need only to be disseminated widely.
1.13 The Chinese Government puts a high priority on energy conservation. Some ofthe key policy pronouncements on energy management that have been made officially include:the "Temporary Regulations on Issues of Comprehensive Utilization of Resources," issued bythe former State Economic Commission and reissued by the State Council in 1985; the"Temporary Regulations of Energy Conservation Management" issued by the State Council in1986,; and the "Regulations on further Strengthening Electricity usage" originally issued by theformer State Economic Commission and the State Planning Commission and reissued by theState Council in 1987. Primarily through Govenment mandated structural reforns, commercialenergy intensity has in fact been reduced by about 30% during the last decade.
Environmental Issues
1.14 The five industries previously mentioned are also the heaviest polluters amongall TVE industries. The paper making industry is responsible for most of the water pollution,accounting for almost half of the sewage discharge by all TVE industries. The brick and tileindustry, on the other hand, discharges the largest amount of waste gases, mainly emissions fromcoal combustion. These are shown in Table 1.5.

- 5 -
Table 1. 5. Waste Gas Emissions of TVE Industries, 1989
Brick & Tile Cement Coke Casting Paper Making OtherWaste Gas Emissions 5, 2,540 39 49 520 3,582(100 million standard m3)%ofTotal 41.9 20.8 3.3 0.4 4.3 29.3S02 125 21 6.1 3.6 10CO, 2,879 620 1000 94 278 3498Source: Nadonal Study on Pollution Sources of TVE Indiuty, 1990.
1.15 Pollution monitoring and control in TVEs are the responsibility ofenvironmental protection bureaus situated at the provincial, municipal, county and townshiplevels. Maximum permissible emission levels and penalty schedules are set at the state level bythe National Environmental protection Agency (NEPA), in coordination with environmentalprotection units within most of the ministries and state enterprises. Although there has beenmuch improvement in recent years, enforcement of regulations at the local level is generally stillspotty and inadequate. TVEs desiring to upgrade their processes and reduce polluting dischargesare hampered by lack of access to appropriate abatement technologies and financing.
1.16 From the global warming standpoint, the brick and tile, cement, coke and metalcastings industries --all heavy coal users-are responsible for most of the greenhouse gases(mainly carbon dioxide) emitted into the atmosphere.
Objectives and Methodology of the Study
1.17 Previous studies conducted by the Bank (See, for example Ref. 3) and othershave already examined macroeconomic policy issues and have identified key structral reformsthat need to be implemented to ensure the continued growth of the TVE sector. These studiesrecommended broad policy initiatives to improve the cuffent legislative and incentiveframeworks, and the provision of services to rural firms. There is no doubt that in all aspects ofTVE operation, including energy use, fundamental policy reforms that provide the rightincentives to enterprises to improve their overall economic efficiency have greater impact thanspecific programs. There is, however, also an important role for initiatives at the plant level thatbuild upon and concretize broad policy prescriptions. The present study is focused on energyaspects, and aims to identify specific policy measures, strategies and programs at the plant levelthat would promote energy conservation and help improve the economic efficiency of the TVEindustry sector. The methodology involved conductng case studies for energy efficiencyimprovements in selected TVE industries, analyzing the costs and benefits of generic investmentoptions and determining industry-wide replicability of the findings.
1.18 It was initially intended to also examine local pollution issues and identify cost-effective means to reduce TVE industry emissions. Lack of resources prevented this particulareffort. The study thus limited itself to the energy efficiency aspects plus the quantification of thepotential for reduction in carbon dioxide gas emissions that would be achieved by improvementsin coal utilization efficiency2. The latter data would be an input to the UNDP-GEF/World Bankstudy on controlling greenhouse gas emissions in China.
2 Sorne of the technical upgrading for energy efficiency tiat were eventuaily Identiffed by this study also result insignificant reduction of iocal pollution Impacts. For example, te conversion of indigenous coking kilns into modifiedmodels that retover tar drastically reduces ground water pollution by effluents.

-6 -
1.19 A Chinese team drawn from the Ministry of Agriculture's Departnent of Energyand Environmental Protection and the Department of Township Enterprises, the State PlanningCommission's Energy Research Institute and several local experts was constituted for the study.The team, assisted by ESMAP staff and international consultants, conducted the selection of keyTVE industries, identified specific plants in suitable counties that would be subjected to the casestudies, conducted the field work and prepared the economie and financial analysis of identifiedenergy efficiency investnent options. Three major reports prepared by the Chinese team resultedfro,m these efforts. The present report summarizes the overall findings.
Key TVE Industries Selected for the Study
1.20 The subject industries were selected based mainly on their share of TVE energyconsumption, the potential for greenhouse gas abatement resulting from the proposed fuelefficiency investments, gross output value and employment. The five industries previouslymentioned clearly topped the list. Cement and paper making w!ere then excluded becauseongoing or upcoming Bank studies or loans would be dealing with these particular industries andwill likely cover similar ground, as well. Thus, brick and tile, coke and rnetal castings werefinally selected for the case studies. These three TVE industries collectively account for about40% of raw coal consumed, almost half of the total energy consumed and almost half of the totalC02 released to the atmosphere by all TVE industries in China.

-7-
IL Industry Profiles
2.1 This Chapter provides an overview of the position of each of the subjectindustries in the national context, reviews the production technologies currently in use in Chinaand discusses the types of technical improvements that are worth introducing in the immediatetenm (See also Annex III for additional industry data). The constraints to technical upgradingimposed by existing plant sizes are then considered, as well as the environmental impacts ofpresent practices.
A. The Brick InduntryIntroduction
2.2 Brick and tile production has long been a major rural industry in China, withbrickworks located in almost every municipality, province and astonomous region. The earlybrickworks required little itnput; they utilized a very simple technology that needed only laborand required almost no capital investment. The raw materials, mainly clay, is available all overthe country. Bricks are the leading construction materials in China and TVE industries nowproduce over 90% of total market demand (See Table 2.1). The rest are produced by a few largestate-run enterprises.
Table 2. 1. Position of TVE Brickmaking Industries(Outputs in 100 million pcs)
Year 1985 1986 1987 1988 1989 1990 1991 1992National Output 2942 3750 3911 4688 4716 4572TVE Output 2573 3447 3824 4528 4346 4174 4254 4955% TVE 87.5 91.9 95.8 96.6 92.2 91.3
Source: Statistic Di#es of Township Enteprise in China
2.3 Thirteen provinces account for about 85% of all TVE industry brick or a total ofabout 355 billion pieces in 1990 (See Table 2.2).
Table 2.2. Major Brick-Producing Provinces (1990)Eterprses Employees - Ouput - Percent of TV
Province Number (10,000) (lOOmllpcs) (100 mill. Yuan) OutputHenan 10300 47.1 558 28.7 13.4Shandong 10310 65.4 539 55 12.9Jiangsu 10810 62.2 472 44.9 11.3Hebei 5550 14 382 22.2 9.2Anhui 5800 36.7 249 18.2 6.0Guangdong 5690 16.3 208 14.3 5.0Hubei 5170 25.7 199 17.2 4.8Zhejiang 2670 25 192 15.9 4.6Sichuan 9050 25.4 189 13.6 4.5Shanxi 5960 14 173 8.4 4.1Shanxi 5420 17.4 163 9.8 3.9Liaoning 2100 17 117 11 2.8Hunan 2000 8.9 108 5.7 2.6Totat 80,830 375.) 3,S49 264.9 85.1
Source: Staiftic Digest ofTownship Enterpris in China

*8-
Technologies Currently Used
A.4. The most common brick production method in use in TVE industry todayutilizes the basic annular kiln (also known as the "Hoffman" type) with natural drying, i.e.,laying cat in stacks in the open air and direct sunlight, of the green bricks. Over 90% of bricksare produced in this manner. About 8% of total production, however, is still by batch process 'nprimitive indigenous kilns. Although some TVE brickworks already use modern tunnel kilns(which are highly efficient but very capital intensive), bricks produced this way account for lessthan 1% of total TVE output. The breakdown of production by kiln type for 1990 is shown inTable 3.
Table 2.3. TVE Brick Output According to K:ln Type (1990)
Kiln Type Output, Percent of TVE Output100 milion PCs
Primitive indigenous kilns 313 7.5Annular kiln
Naural drying; solid bricks 3790 90.8Artificial drying; solid bricks 54 1.3Artificial drying; hollow bricks 13 0.3
Tunnel kilnsArtificial drying; solid bncks 3 0.07Artfficial drg; holow bricks 1 0.03
Total 4174 100.0Source: Ener Efficiency and Pollution Contol bI TVE Industries, Mmistry of Agriculum, Beijing, July 1993
2.5 The process of brick production using the annular kiln can be briefly describedas follows: raw material clay is usually dug from agricultural land and is blended and mixed withwater in an agitator, then passed through rollers to produce a smooth paste. The material isextruded under pressure into blocks; individual bricks are made by wire-cutting the blocks.
2.6 The extruded green bricks must then be dried before firing in the kiln itself Inthe conventional process, the bricks are stacked outside and allowed to dry naturally in the sun.Most plants protect the bricks from bad weather by covering the piles with straw matting. Thetypical Hoffman kiln operation is thus characterised by a relatively large land use, both for theproduction of the main raw material (clay) and for the stacking of green bricks for drying. Atypical brickworks making say 10 million standard bricks per year occupies 30 mu (20,000 MI).
2.7 Following drying, which may take from one to two weeks depending onmoisture content and the weather, the green bricks are stacked in the inlet section of the kiln.Here they are dried firther and preheated by exhaust combustion gases from the section of thekiln being fired. As the firing chambers in the kiln are ignited in turn, the green bricks enter thefiring zone. Firing takes about 7-8 days, after which the bricks are allowed to cool beforeunloading. Cool combustion air is passed over the hot bricks to accelerate the cooling and topreheat the air before it enters the fring chambers.
2.8 The annular kiln operates continuously, with the bricks staying stationary andthe fiing chamber moving around the kiln (in the unmnel kiln previously mentioned, the bricksare stacked onto cars which move through the kin countercurrent to the combustion gases). Theaverage energy consumption of a Hoffman kiln is 1.0 to 1.1 TCE per 10,000 bricks. This heavyuse of cooal makes the TVE brick industry ia major source of C02 and S02 emissions.

-9-
Technical Improvements
2.9 A well designed Hoffman kiln utilizes as much as possible the waste heatobtained from firing the fuel. Improvements that have been made over the last few years includethe incorporation of increasing amounts of coal dust and high carbon fly ash (e.g. from powerplants) in the raw material clay w}ich is then extruded into green bricKs. In some plants, the levelof fuel fired "internally" has reached 100 percent for most practical purposes - that is, theamount of fuel fired from the roof of the standard Hoffman kiln is ai>ost zero. While thisprocedure has been widely adopted by about 8000 plants representing aboxut 20 percent of brickoutput), some plants still have not tried it and could no doubt benefit from the procedure byusing low grade and waste materials as fuels.To encourage wider use of this innovation, theincremental energy provided by internally-fired low-grade fuels are allowed, by SPC regulations,to be excluded in the official accounting of total energy used for production.
2.10 The natural brick drying process is highly vulnerable to the weather. Thedestruction of green bricks during stormy weather can be substantial and conventionalbrickmaking plants are therefore usually only able to work for about 8 months per year in mostregions of China - the rainy regions of the south prevent longer operation of brick plants, whilecold and frosty weather in the north prevents the drying of green bricks also. There is thereforean interest in most regions in the recent application of artificial drying methods to prolong thebrick producing time and to remove the risk of storm damage.
2.11 In the artificial drying process, combustion gases exhausted from the stack arechannelled into a drying section through which the green bricks are passed. Usually acountercurrent arrangement is used to make full use of the available waste heat, with the hotgases being passed into the end of the dryer from which the dried bricks are withdrawn. Thecoldest gases emerge at the end of the dryer into which the fresh green bricks are passed. Toensure adequate drying in a reasonable period, it is usually necessary to fire supplementary fuelin the dryer section or to use steam. The artificial drying process therefore results in an increaseof conventional energy use because of the replacement of solar energy by the extra fuel or steam.
2.12 However, even with some increase in specific energy use, the ni iin advantage ofthe artificial drying system is the increase in productivity that results - the brick plant canproduce for 12 months of the year as green brick drying is no longer subject to weatherconditions. The need for land area for stacking bricks is also essentially eliminated, withsubstantial savings in land cost and the release of the land for productive agricultural use. Brickquality control is improved and the plant is not dependent on the weather to produce high qualitybricks.
2.13 These may take the form of bricks with a wide range of different configurationsof holes, - square, rectangular or round. The void fraction also varies widely although themajority of hollow bricks made in China today have void spaces up to about 25 percent only.The manufacture of hollow bricks is much the same as that of standard solid bricks but there isusually a need for a higher pressure extruder to be used (or vacuum extrusion) to maintain thesharp edges and compacted texture of the brick. The manufacture of hollow bricks brings anumber of advantages:
(1) Less weight of clay for a given volume of brick (savingspercent);
(2) Faster firing and lower energy use per unit of productvolume (saving in drying time typically 15 percent, bakingrate say 10 percent faster, enery saving 20-50 percent);

-10-
(3) Better heat insulation properties of walls made with hollowbricks, and lower thermal mass of the building as a whole(saving up to say 30 percent of space heating energy);
(4) Lower weight of brick per volume of wall built, making iteasier for bricklayers to handle and allowing faster workin the construction industry, and
(5) Lower transport costs per unit volume of building material(saving say 20 percent).
2.i4 Hollow bricks have been used for many years in many countries but the idea isquite new in China. In 1990, only about 1.4 billion hollow bricks were produced out of a total of417.4 billion bricks or 0.3 percent of TVE brick output. In recent experiments in the UK, it wasfound that higher than customary perforation volumes in clay bricks up to 40 percent had littleeffect on brick properties3.
2.15 At present, it is estimated that more than 80 percent of bricks in the UK have aperforation volume of 15 to 25 percent: for structural design purposes, no distinction is madebetween solid bricks and those containing up to 25 percent perforations. Tests showed that it wasfeasible to manufacture bricks in standard format with much higher levels of perforation withoutany major modification to the manufacturing process itself. The requirements of current designcodes relating the strength of bricks to the strength of masonry walls are still met by bricks with40 percent perforations and masonry constructed of 20 and 40 percent perforated bricks showedno practical differences in durability, resistance to rain penetration or fire resistance.
2.16 The tests suggested that significant energy savings could therefore be achievedby increasing the proportion of bricks made with at least 25 percent perforations andsubsequently by manufacturing bricks with perforation levels even higher. It has been estimatedthat the fuel savings for drying and firing are about X/2 percent when an increase in perforationof X percent is made (e.g. an increase from 20 to 40 percent perforation will give fuel savings of10 percent). In addition, increasing the level of perforation reduces the mass of clay materialsprocessed per brick and specific electricity requirements change by about 6.5 kWh per tonne ofoutput in a typical clay preparation plant.
2.17 Finally, it is worth noting that alternatives to the traditional raw materials used inbrickmaking are being investigated. Some minerals such as shales are already being used tomake high quality bricks: shale is quarried from hills around Chengdu, for example, and thus theuse of valuable agricultural land is avoided. Other potential raw materials include industrialwastes of vanous kinds, such as power plant fly ash, colliery waste and gangue from coalwashing. Many of these materials contain carbon and therefore contribute some energy to thekiln when mixed in with the usual raw materials.
2.18 In summary, the main technical characteristics of Chinese brick kilns are asfollows:
3 ETSU Future Practice Report No 27, The Developrnent of Highly Petforated Bricks, Energy TechnologySupport Unit, Harwell, England, March 1992

-11-
Table 2.4. Characteristics of Chinese Brick Kilns
Kiln Type Drying Method Energy Consumed per 10,000 pcsCoal Electricity, Overall,TCE kWh TCE
Indigenous Natual 2.0-2.5 0 2.0-2.5Annular, solid brick Natural 1.10 150-200 1.12Annular
solid bricks Artificial 1.12 300-400 1.15hollow bricks Artificial 0.60 400-500 0.64
Continuous tunnelsolid bricks Artificial 1.30 330-430 1.34hollow bricks Arificial 0.80 450-550 0.85
Source: Refrce I
2.19 Figures for capital investmnent are presented below:
Type of Kiln or Conversion Capital Cost, Yuan per10,000 Mcs. per year
Annular/Hoffian kilnnatural drying, solid bricks 430artificial drying, solid bricks 400artificial drying, hollow bricks 600
Tunnel kilnartificial drying, solid bricks 2000artificial drying, hollow bricks 2100
Conversionnatural drying to artificial/solid bricks. 440natural.dryinglsolid to artificial/hollow 820artificial drying/solid to hollow bricks 60
Source: Reference I
2.20 These figures suggest that replacement of annular (Hoffman) type kilns bymodem tunnel kilns is not likely to happen in China for some time, as potential advantages inlower operating labour and improvements in quality control - factors which make thecontinuous tunnel kiln the dominant equipment used in western brick plants - are not at presentable to offset the large capital cost disadvantage of the tunnel kiln. The added cost of hollowbrick kiln systems compared with the traditional Hoffman kiln making solid bricks can howeverbe overcome by the savings in fuel.
Size and Scale Factors
2.21 As was shown in previous tables, a total of 100,500 TVE plants produced 417.4billicn bricks in 1990, an average of a little over 4 million bricks per plant. Since there arerelatively few plants producing 50 million bricks per year or more, this means there are a largenumber of very small producers.
2.22 In general, new brickworks are unlikely to be built to produce under 10 millionbricks per year and it is thought unlikely that a small kiln could justify the retrofitting of anartificial dryer (see also Case Study B). A regulation in Xinjin County, Sichuan Province,requires new plants to produce at least 10 million bricks per year otherwise permission to buildand operate a new works vill not be given. In addition, the regulation requires plants producing50 million bricks/yr to occupy less than 30 mu (about 2 hectares): this in effect means that such

- 12 -
plants must use artificial drying to comply with the area limitation. There are of course variationsin the regulations from county to county.
Environmental Factors
2.23 The TVE brick industry is the largest emitter of CO2 anongst TVE industries. In1989, 28.7 million tonnes of C02 were discharged, about one-third of the total C02 emissions ofTVE industry. Typical emissions are as follows:
Table 2.5. Pollutant Emissions from Various Brick Kilns
Kiln Type CO2 emission S02 emissiontonnes C110,000 pcs tonnes per O,000 pcs
Indigenous 1.13 0.05Annular/Hoffinan
natual drying, solid br 0.62 0.027artificial drying, solid br. 0.63 0.027artificial drying, hollow br 0.37 0.016
Tunnelartificial drying, solid br. 0.8 0.035artificial drying, hollow br. 0.48 0.02
Souwe: Refeeuce 1
2.24 The extensive use of land for raw materials and for drying green bricks by thenatral method is another important factor. At present, about 1 million mu are occupied: asalready mentioned, a typical brickworks producing 10 million bricks per year using naturaldrying occupies 30 mu (20,000 M2). In rainy and humid areas in the south of China, even largerareas are necessary.
2.25 With respect to the basic technologies used, the emissions of smoke and dust arenormally well controlled, with the possible exception of plants using batch-type indigenous typekilns. These are still used to produce a significant quantity of bricks each year (over 310 millionbricks or 7.5 percent of TVE brick production) and emit smoke at ground level. Nationalstandards are not met and the pollution is serious. The continued operation of such kilns is underpressure from authorities and it is anticipated that most will be phased out within about 7-10years.
The Coke Industry
Introduction
2.26 Coke, the product obtained from destructive distillation of coal, is an importantraw material for the chemical, metallurgical and machinery manufacturing industries. Most ofthe coke used in China is produced by large (greater than 100,000 tonnes/yr) mechanized ovensin state-run enteprises. In 1990, of the total of 73 million tonnes of coke produced in China,about 70% was produced by mechanized ovens. The rest was produced in numerous, small scaleTVE industries mainly by non-mechanized means, 90% of them in just seven provinces. Theproduction growth in these provinces between 1985 to 1989 is shown in Table 2.6.
2.27 There are few TVE-run mechanized coke ovens. They are generally small (about50,000 tpy capacity) and total production in 1989 was less than 0.5 million tonnes. The morenumerous non-mechanized ovens (also called "indigenous") range from primitive batch typekilns to highly improved, modified models that were developed locally. The most widely used

- 13 -
modified klilns today are the so-called PX , JX-1, Type JKH-89 and Type TJ-75 ovens. Asinvestment in the simplest indigenous kilns is estimated to be only 1 yuan per tonne coke,farmers in heavy coal producing provinces entered the cokemaking business in large numbers inthe last decade. By 1990, there were 10,000 TVE enterprises engaged in cokemaking, employingover 150,000 people and generating output value of 3.5 billion yuan. The average coalconsumption for the TVE industry is about 1.9 TCE per tonne of coke produced. Many of theovens still used in TVE cokemaking, including the early generation modified types, are relativelysimple and do not recover the chemicals, tars or gases released in the process. Very roughly, thisrepresents a loss of 3.2 to 4.0 million TCE annually, as well as severe pollution impacts fromgaseous emissions and liquid effluents discharge.
Table 2.6. Coke Production by TVEs (Non-Mechanized Ovens)(10,000 tonnes)
Year 1985 1986 1987 1988 1989National TVETotal 881 1088 1317 1477 1852Provinca Breakdown:Shanxi 192 397 474 652 959Guizhou 131 144 158 151 187Sichuan 113 138 145 156 84Yunnan 99 120 153 147 185Shandong 108 87 94 82 67Henan 119 64 118 78 66Hebei 20 19 51 67 60talof 7provinces 782 969 1193 1333 1681
% ofNational TVE Total 88.8 89.1 90.6 90.3 90.8Source: Statistical Digest of Townhip Eutpries
Technologies Currently Used
2.28 A breakdown of TVE coke output by type of oven in 1990 is as follows:
Table 2.7. TVE Coke Output by Oven Type (1990)dCoke Oven Type Million tonnes Percent
Primitive Indigenous 4.6 24.7PX 11.8 63.4lX-I 1.0 5.4Types89,75 0.7 3.8Small Mechanical 0.5 2.7Large Mechanical 0.0 0.0
Total 18.6 100.0Souce: Refence I
2.29 The most basic type of coking oven still in use today .s the primitive indigenousoven: this consists of little more than a heap of coal which is ignited at the bottom. Coalconsumption is usually in the range 2.0-2.5 TCE per tonne of coke, all the byproducts are burnedand thus lost, and the quality of coke produced is low. The pollution caused by the indigenousovens is serious as the combustion products are released about 2 metres above ground level.Water used for coke quenching can easily permeate through the soil and contaminategroundwater resources. Most provinces officially prohibit the operation of indigenous ovens butthis is apparently not strictly enforced: in 1990, about 4.6 million tonnes of coke (around one

- 14-
quarter of TVE coke production) was still made from indigenous ovens, although the total isexpected to drop sharply in the next 5 years or so.
2.30 Various improved ovens have been developed, the first generation of whichincludes the PX type. This consists of a rectangular pit into which coal is loaded and coveredwith a fire channel made of refractory bricks. A tar ditch is built in the centre of the bottom ofthe oven. The bricks are covered with coal ashes and small chimneys - typically 20, each about0.5 meters high - are installed along the centre of the top. The coal is ignited using gas fromadjacent ovens. A mixture of gas and tars is collected through the tar ditch: about 4-5 kgs of tarper tonne of coke are collected and the gas is burned off (unless required to ignite other ovens).Coal consumption amounts to 1.56 TCE per t coke. Coke quality is somewhat improved (someup to first grade metallurgical grade). However, combustion products are released at ground leveland this causes serious pollution.
2.31 Representative of the second generation of improved oven is the JX-1 type oven.This oven has modified gas passages in which gases and tars are burned, leading to shortercoking times and higher coke quality. The byproducts are more completely burned before releaseto atmosphere through a 30-40 meter stack. Coal consumption is reduced to about 1.43 TCE per tcoke, which is only 20 percent greater than the figure for large scale mechanical ovens (1.2 TCEper t coke). Although pollution is reduced, the top of the JX-I oven is still covered by coal ashesand combustion products can leak through, in addition to which a great deal of dust is releasedduring the coke quenching stage. As for the PX oven, water and chemicals can escape into theground from the tar ditch at the bottom of the oven.
2.32 The third generation of improved ovens includes the Type JKH-89 and the TypeTJ-75 ovens. The T3-75 oven is built with a brick roof and has modified firing channels at thebottom of the oven which result in faster heating of coal, shorter time for coke production andhigher coke quality. Coal consumption is in the range 1.35-1.40 TCE coal per t coke but nobyproducts are recovered: all are burned in the gas passages and combustion gases aredischarged through a 45 meter stack. Pollutant emissions are greatly reduced and the risk ofgroundwater contamination is minimal.
2.33 The JKH-89 oven represents a major innovation. The top of the oven is sealed bya mobile cover, slid into place on rails. The combustion zone on top of the coal is increased insize, which improves the thermat efficiency of the oven and leads to complete combustion ofgases and some tars. The coal is loaded with the mobile covers removed, and the quenching ofcoke after production occurs with the covers in place, thus reducing the dust and vapour releasesubstantially. The JKH-89 oven also has a cast iron tar ditch at the bottom through which it ispossible to recover about 12 kg tar per tonne coke (compared with 5 kg for the PX type). Tarpermiation into groundwater is effectively reduced to nil. Coal consumption is typically under1.4 TCE per t coke, and coke quality is generally first or top grade metallurgical coke.
2.34 There are very few examples of mechanical coking ovens in TVE industry. Allare relatively small (about 50,000 tpy coke production) and coke quality is generally poorer thanthat from the modified types such as the JKH-89 and TJ-75. Coal consumption is typically 1.4TCE per t coke. Although the mechanical ovens can recover all byproduct chemicals, tars andgases, there is usually little demand for the gas which must therefore be burned or evendischarged directly to atmosphere. High maintenance standards are required for this type of ovenand this is frequently a problem. Often there are serious leaks of pollutants from leaking doors ofthe mechanical ovens and even during the normal charging and levelling operations.

15 -
2.35 In summary, coal consumption figures for the ovens used by TVE industry aretypically as follows
Table 2.8. Typical Coal Consumption Data for TVE Industry Coke Ovens (1990)
Coke Oven Type TCE/tonne cokePrimiive Indigenous 2.50PX 1.56JX-1 1.43Types 75, 89 1.39Small-scale mechanized 1.40
Industy average 1.9Conmare: large- scale mechanized 1.20
Source: Reference I
Technical Improvements
2.36 There is generally little that can oe done to improve the operational efficiency ofan existing oven as its basic performance is already set by the original design. Technicalimprovements are therefore only feasible when an existing oven or plant reaches the end of itsuseful life - typically ten years for most types of oven used in the TVE industry-- and a newplant must be built. The new plant may be able to utilize some equipment and other materialsfrom the old plant, in which case the capital investment will be generally less than when a totallynew plant is built. Thus, any improvements in coal consumption, coke quality or recovery of by-products by improved or mechanical ovens must be seen in the context of the capital investmentrequired for the various types of coke oven when constructed new, and when converting from anold type to a modified oven. These estimated investments are as follows:
Table 2.9. Estimated Capital Investments for Coke Ovens, New and Conversions (1990)
Coke Oven Type Yuan per annualtonne of coke
New rX 40New JX-1 45New Type 75 or 89 58New small mechanized - 123New large mechanized 600Conversion
of PX to Type 75 or 89 58of JX-1 to Type 75 or 89 55
Souce: Refrence 1
2.37 The figures suggest that conversion of PX ovens to Type 75 or 89 ov ias is likelyto proceed rather slowly, as the cost of conversion is not less than building an improved oven ona clear site. It is also seen that the cost of mechanical ovens is substantially higher than any othertype, a major factor that is certain to deter potential investors, especially as the cheaper butimproved Type 75 and 89 ovens can give comparable operating results in terms of coalconsumption and coke quality, for example.
2.38 The development of improved versions of non-mechanical ovens appears to be acontinuing effort, at least in some provinces. For exanple, an improved version of type JKH-89oven was visited at Jiexiu City in early 1993. The new design is based on the standard moveableroof cover JKH-89 but has a larger coal volume with a different shape and modified gas

-16-
passages. Coking time is said to be much reduced, coke production rates are increased for agiven ground area, coke quality is at least as good and perhaps better, and the increased capitalinvestment is quite small. The modified JKH-89 ovens are undergoing extensive testing andevaluation at present.
Size and Scale Factors
2.39 A review of plant sizes was carried out and it was confirmed that TVE cokeplants generally produce under 50,000 tonnes of coke per year. The smallest plants are those stilloperating indigenous ovens, and these may produce only a few hundred tonnes annually. Themoderate size of most of the plants reflects the capability of average village and township ownedenterprises to fund, organize and operate industrial facilities, and to organize the transport of rawmaterials and delivery of products. Typical sizes of coke plants are as follows:
Table 2.10. Typical Plant Scale of TVE Coke Industries
Coke Oven Type Typical annual outputtonnes
PX 10,000Type 89 50,000Type 75 50,000Small mechanized 25-50,000
2.40 Until the late 1980's, most TVE coke plants recovered little tar: most tars wereburned in situ within the coke oven itself or in the stack ducts. With the. arrival of coke ovenswhich were able to recover tars, small low temperature zr refineries began to appear in somecoke plants.
2.41 The small mechanized coke plant was never a real success when operated byiVEs. The simpler and cheaper Type 75 and 89 coke ovens were favored instead. Large scalemechanized plants are usually associated with the recovery of gases and tars: they are typicallyoperated as part of a metallurgical complex or by a municipal system supplying gas to a city.There are no TVE owned large scale mechanized plants to date.
Environmental Factors
2.42 Data from field observations give the following typical emission levels for thevarious types of coke ovens used in China today:
Table 2.11. Pollutant Emission Levels from Various Coke Ovens
Oven Type C02 S02as kg C per toone coke kg per tonne coke
Indigenous 625 21.5PX 390 13AlX-l 357 12.3Types 75, 89 252 2.8Small mechanized 350 12.0Large mechanized 218 6.7
Sou: Rernc I

- 17-
C. Metal Castings IndustryIntroduction
2.43 The casting industry occupy a very important position in the industrial systemworldwide, since castings represent 54-55% of the weight of machine products and 65-80 % ofmachine tools. In 1990, Chinese industries used 10 million tonnes of metal castings, secondhighest in the world. About 42% of these were produced by 13,200 TVE enterprises thatemployed 375,000 people. The output value of this contribution was about 6.3 billion Yuan. Thegrowth of castings production in China in the last decade is shown in Table 1.
Table 2.12. Growth in TVE Castings Output
Year 1980 1986 1987 1988 1989 1990Output of TVE, 1.56 3A3 3.99 4.67 4.24 4.20
Million tonnes% of National Total 21.1 34.3 37.6 42.5 40.3 42.0
Source: Staistical Digest of Townip Enterprises
2.44 The rapid growth of the township castings industry reflect both the overallindustrial development of China and the shift in castings production from state-run machineryindustries to TVEs over the years. As environmental regulations began to be enforced morestrictly in medium and large cities, and as labor costs climbed in state-run enterprises, theproduction of metal castings that do not require high technical specifications have beengradually relegated to the townships. Eleven provinces account for nearly 80% of the total TVEcastings output. Except for Shanxi, these are provinces with relatively well-developed machineryindustries.
Table 2.13. TVE Castings Output by Province (1990)
Province Output % in TVE Total10,000 t Casting Output
Shanxi 56 13.3Jiangsu 52 12ALiaoning 41 9.8Hebei 38 9.0Shanghai 35 8.3Shangdong 32 7.6Sichuan 24 5.7Jilin 22 5.2Tianjing 13 3.1Beijing 11 2.6Hubei 8 1.9
Total 332 78.9Data source: Statistical Digest of Township Enterprises in provinces, 1990.
2.45 Metal castings are classified as ferrous or non-ferrous. Nearly all (99%) of TVEmetal casting work is on ferrous materials, i.e., iron and steel. Of this, about 92% is focussed oniron casting, because of the relatively simpler equipment and technology needed, and the easieraccess to raw materials. Low grade grey iron castings account for most of the iron castings outputof TVE foundries.

-18-
2.46 Although China ranks high in metal castings output and in the number offoundries, the quality and durability of the products are way behind those produced by developedcountries. Dimensional accuracy is generally I to 2 grades lower and roughness is I to 2 gradeshigher. Energy costs account for 15% of production cost, in contrast to about 4-5% for developedcountries. The reject rate is 10-15% as compared to only 2% in developed countries. The mainreason is the low level of technology employed-most TVE foundries use manual productionmethods. About 88% of TVE castings are produced by cold blast cupolas, considered energyinefficient and the melting process difficult to control. The small size of most TVE foundriesprevents investment in modem equipment such as mechanized molding lines.
2.47 Global trends indicate that overall production of castings will gradually shift todeveloping countries. The position and profitability of the China's TVE casting industry in thefuture will depend on how quickly it can upgrade the quality of its products that, in turn, dependson how quickly it can convert to more modern and efficient production methods. Suchconversion will very likey also result in significant reduction in coal use per unit output.
Technologies Currently Used
2.48 For convenience in discussing production methods, TVE castings enterprises aredivided in this report into four rough categories:
3 Backward - typically using manual production methods,simple workshops, most likely a locally-made cold blastcupola, producing say 1000 tonnes of castings per year
* Less bkward - using mostly manual methods and a smallproportion of mechanized molding facilities, a cold blastcupola, and making say 3000 tonnes per year.
• Modet levl - using mechanized molding and sandprocessing system, a hot blast cupola; making about 5000tonnes per year.
* Advancedlevl - using a mechanized or semi-automaticmolding line, a complete sand processing system, withgood measuring and control equipment, using a hot blastcupola with computer controlled charging system or aduplex melting set (including an electric inductionfurnace); making 5000 tonnes per year or more.
2.49 The classification of the TVE castings industry into these four categories is, ofcourse, somewhat arbitrary and size considerations are a major factor. In the TVE industry today,it is considered that there are almost no advanced level foundries, although some plants arebeginning to install more comprehensive control systems and are developing the duplex meltingconcept The distribution of foundries is estimated as follows:

- 19-
Table 2.14. Output Distribution of Castings Industry by Technology Category (1990)
Output PercentTechnology million tonnesBackward 2.058 49.0Less backward 2.100 50.0Moderate level 0.042 1.0Advanced level 0 0
4.200 100.0Source: Refercuce I
Current energy consumption per unit of output have been estimated as follows:
Table 2.15. Energy Consumption in TVE Foundries
Total Energy Coal UsedTechnology ICE/tonne TWE/tonne
good good castingscastings
Backward 0.80 0.79Less backward 0.65 0.63Moderate 0.50 0.48Advanced 0.40 0.24
Source: Refence I
Technical Improvements
2.50 The capital investment needed to set up foundries at the various levels ofcomplexity are estimated below, together with typical upgrading costs for existing facilities:
Table 2.16. Capital Costs per Annual Tonne of Castings Capacity
Yuan/tonneBackward 580Less backward 785Moderate 1890Advanced 2406Upgrading: backward to 1557
moderateUpgrading: moderate to 2106
advanced
2.51 It is clear from these figures that the cost of setting up a simple backwardoperation is quite low, and the cost of upgmding to more complex and energy efficient plants ishigh. This suggests that it will be difficult to encourage upgrading within the TVE castingsindustry even though the return on investment for technical renovation may be quite attractive intheory. It is more likely that in future advanced plants will be constructed as new facilities, ratherthan resulting form major technical upgrading of existing foundries.

*20-
2.52 Within the foundry, the key areas where technological transformation could beintroduced are in:
* Melting Plant* Mold making materials* Sand treatment* Testing and control
2.53 Significant improvements in energy efficiency and castings quality can beachieved by better control over the melting process, the use of more modern techniques formolding and more attention to operating details. As a rule, electric melting furnaces providebetter control of metal specifications, but cupolas are extremely cost-efficient and preferable forrelatively larger operations and where lower grade casts are acceptable. Hot blast cupolas aregenerally more energy efficient than cold blast cupolas but are diffiicult to mauintain effectively.Duplex melting, which combines a cold blast cupola and an electric induction furnace forsuperheating addresses to some degree the shortcomings of purely cold clast cupola melting andimproves energy economy. Mechanized molding lines offer high throughput and reliability andcan dramatically reduce the reject rate. Because of their high cost, they are obviously arenovation option only for the relatively large TVE foundries with stable markets. Finally,experience with small and medium scale foundries in the West have shown that simple"housekeeping" practices can reduce energy use by 10-20%. For TVEs, this suggests thatawareness campaigns, energy efficiency audits and training programs can be highly beneficial.
Size and Scale Factors
2.54 The TVE foundry industry consists of a large number of plants, often producinga wide range of castings in total quantities that are quite small .The average output per enterprisewas only 318 tons in 1990 (as compared to over 5000 tons in Japan, for example). Unlike inother industries, the phasing out of small plants and a restructuring into fewer, larger plants is notnecessarily the optimal trend. Even in the West, the foundry industry has generally maintainedits small-to-medium size enterprise character. The reason is that the demand for castings cover awide range and the range is changing constantly. At one extreme, for example, automobilecomponent suppliers make a large number of castings but the value per tonne of products is low.At the other end, a supplier for aerospace castings produce small quantities using specialmaterials with a very high value per tonne of product. Both types of foundries fulfill importantindustrial needs and operate profitably. All types of foundries share the same principle ofmelting metal and pouring it into a mold but the technology they employ is different.
2.55 In China, many foundries engaged in bulk production of castings are still belowminimum economic scale and must be encouraged to scale up to economic size. Scaling up andadopting mechanized will reduce energy use and improve product quality. For the small"jobbing" foundries that specialize in a variety of castings that are demanded in smallerquantities, however, scaling up may be pointless and adopting automated operations may beuneconomic. The overall strategy for improving the economic and energy efficiency of the TVEindustry sector must careully consider the distinct characteristics of these two discrete industrysegments.

-21 -
Environmental Factors
2.56 The pollutant emissions from TVE foundries are estimated to be at thefollowing average levels:
Table 2.17. Emissions from TVE Foundries
C02 S02 emissionsemissions kg/tonw
tonnes CtonneBackward 0.58 8.5Less backward 0.46 7.7Moderate 0.35 2.8Advanced 0.17 0.2
Source: Reference 1
2.57 A major pollution problem of the castings industry is the excessive amount ofdust discharged by cupolas, sand shake-out and sand treatment operations. Presently, cloth-bagsystems are used to control dust pollution by cupolas but are not completely effective.Conversion to processes that do not discharge as much dust, such as electric furnace melting andresin molding, will obviously be environmentally beneficial.
-22-
m. Case Studies of Investment Options
3.1 This section presents specific technical improvements available to the brick,coke and metal castings industries in TVEs. The improvements include conversion or retrofit ofexisting operation, consolidation into larger scale operation, establishment of new, more efficientplants and a combination of such actions. The base cases were chosen so that they representtypical situations in each industry, such that potential replicability of desirable improvements ismaximized. Economic and financial analyses of each case is then made to determine cost-effectiveness of the proposed improvements.4
The Brick Industry
Specific Investment Cases
3.2 Trends in the TVE brick industry are towards the use of larger kilns and thephasing out of primitive indigenous kilns and the smallest Hoffinan types. While definitely notcommon, the possibility of several townships joining together to construct a larger plant withjoint ownership is not impossible: an example of such ajoint venture was seen in Xinjin Countynear Chengdu. Brickworks with artificial drying (recycling stack gases to dry the green bricks)are gradually being built, encouraged by some local authorities because of its reduced land use.The manufacture of hollow bricks is proceeding more slowly but is increasingly recognized ashaving the potential to significantly reduce raw material and energy requirements..
3.3 With these considerations, two basic cases were chosen for economicinvestigations:
iaLA, involving the consolidation of several small plants producing solidbricks and using artificial drying into one large plant producing solid bricks (Al)or hollow bricks (A2) and using artificial drying; and
Case B the conversion of an existing plant producing solid bricks and usingnattual drying to one producing hollow bricks and using artificial drying.
3.4 Case A takes care of the prevalent situation where most brickworks are smalland may need first to be consolidated before any technical renovation is carried out. Foranalytical purposes, Case A is broken into two discrete steps or subcases (Al and A2), asfollows:
AL Consolidating production in a larger plant and conversion to artificialdrying: replacement of ten typical smnall plants (each making 5 million solidbricks/yr. using Hoffman kilns, natural drying) by one larger plant (50 millionsolid bricks/yr. using the Hoffinan kiln, artificial drying).
4 Collection of operating data for the base cases and Initial economic and financial analyses were done byChinese teams. There were some areas of differences betwen these analses and those subsequently carried out byESMAP using the same data. In the original submissions, the new project in each case received a first year benefit calledthe mretrevar of working capital from the old project. This amount was equal to the total Investment in the coke cases andwas smaller for brick. Inclusion of these sums had the e11ect of incraeasmg the apparent rates of retum for each case,significanty so for coke. In this report, these sums were excluded from analis, as is deemed appropriate by standardfiranndal management texts. However, the working capital for the project ilself, as well as Its return at the end of the finalyear, was left in the financdal analysis but exduded from the economic analis. The positive figures for the'SalvagelRetievar line in year 1 are only salvage values, wherever such values are greater than zero.

- 23 -
A2 Conversion to hollow brick production: conversion of one existing largeplant producing 50 million solid bricks /yr. using a Hoffman kiln with artificialdrying to a plant of the same capacity, same kiln, with artificial drying butproducing standard clay hollow bricks.
3.5 Case B, meanwhile, is analyzed by using three different plant capacities: 5, 1 0and 20 million solid bricks/yr. (subcases BI, B2 and B3). The purpose of the exercise is todetermine the minimum economic scale for this type of conversion.
3.6 In each of the cases, a variety of brick and coal prices was used in order to testthe sensitivity of the results to changes in costs and prices. In addition, a scenario with higher-than-expected investment costs was run for each option in order to establish further sensitivity tokey parameters. The following two tables show the key technical and financial parameters foreach case:
Case A:
Case: Al - With Project Al - Without A2 - With Project A2 - WithoutTechnology Hoffman Kiln- Hoffman Kiln- Hoffnan Kiln- Hoffmnan Kiln-
Artificial Drying Natural Drying Artificial Drying Artificial____________ ___________ ___________ Hollow Bricks Dryig
Brick Product Solid Solid Hollow SolidBrick Selling Price,YuanhIO,OOOpcs 825-875 825-875 800-850 825-875Coal Use, Tonnes 1.12 1.1 0.66 1.12Electricity Use, kWh 191.5 150 253.6 171.5Land Use, Mu 30 300 30 30
Case B:
Case Annual Output Coal Use, Electricity Use1o,000 pcs/yr. Ton/l 0,000 pcs kWh/ 0,000 pcs
BI With Project 750 0.66 230Without Project 500 1.1 150
B2 With Project 1500 0.6 230Without Project 1000 1 140
B3 With Project 3000 0.63 230Without Project 2000 1.05 140
3.7 It will be noted from the above tables that conversion from natural to artificialdrying results in greater energy consumption per piece of brick produced. This is because, asidefrom increased coal use, more electricity input is required for the blowers. In natural drying,which takes much longer, considerable energy input is obtained from free direct solar radiationand air drying. The benefits of conversion to the brickworks lie in shorter drying time, extendedplant operating period per year (since the process is no longer affected by bad weatherconditions) with attendant increased brick output, greater labor productivity and, mostimportantly, substantially reduced land requirements. As mentioned earlier, the benefits ofshifting to hollow brick manufacture are savings in raw material and coal consumption. There is

-24 -
a loss in revenue per britk due to the lower market price of hollow bricks. The effect of thisprice differential is examined in the sensitivity cases reported in the Annex.
3.8 All of the incremental analyses assumed 1992 prices, a discount rate of 12% anda time horizon of 10 years for the analyses. The opportunity cost of land was assumed to beabout 1000 yuan/mu. The operating period was assumed to be 8 months per year for all naturaldrying cases and 12 months for the year after conversion to artificial drying. For Case A2, theonly capital investment required is a more powerful extruder suitable for hollow-brickproduction. Details of incremental investments and operating costs, as well as the cash flowtables for all cases are in Annex It.
Results of Case Studies
3.9 Table 3.1 below summarizes the results of financial and economic analyses. Ineach case the "medium" case or base case is listed with the range of results for variations inprices and costs shown below the medium case figure.
Table 3.1 Results of Economic and Financial Analyses
Incremental DiscountedCase Investment, Financial Analysis Economic Analysis Payback,
'000 Yuan NPV _MR, % NPV IR% YearsAl 2,183 1,648 29.4 3,705 47.2 6-7
(1,283-1,782) (23-31) (3,218- (37-52)3,906)
to 500 Negative Negative Negative Negative NABI 750 -192 5.0 -111 8.25 Not
937 (-172to-318) (2-6) (-58 to -279) (4-10) ApplicableB2 850 100 14.8 274 20.1 6-7
1,062 (-42 to +140) (11-16) (85-380) (14-23)B3 1,105 636 22.2 1,725 45.6 4-5
1,381 (451-716) (20-33) (1,478- (3648)1,937)
3.10 The range of results shown below the medium case figure represents a series ofexcursions on the basic set of assumptions. Printouts of the excursions on the base case areshown in the Annexes. The low end of the range is due largely to an assumed higher price forbricks, since a more attractive price for existing output reduces the attractiveness of incrementalinvestments. The high end of the range shows the result of decreasing output prices. Otherexcursions are possible with respect to capital investments and operational costs. The "B" casesabove show what happens if, ceteris paribus, investment costs rise by 25%. In general, theresults proved to be robust. That is, small variations in prices of costs did not generally shift acase from the desirable to undesirable side of the ledger or vice versa. In the sensitivity analysisit was found that the operational costs were more important than were the prices for bricks. Forthe two strongly positive cases, Al and B3, operational costs would need to rise by more than35% before either became uneconomic. The marginal case, B2, would need to show decreases inoperational costs to become economic.

- 25 -
3.11 Case A:1 The overall good results for Case Al reflect attaimnent of economiesof scale. The EIRR is very high and is due in part to the valuation of land saved by theconversion to artificial drying. The FIRR, is also high, indicating an attractive possibleinvestment. The somewhat long payback periods (exceeding 6 years) reflect the the high initialcost. The range of rates of return indicates that the investment is attractive at most reasonable '
variations on costs and prices. These results indicate that consolidation of small brickworks andconversion from natural to artificial drying is beneficial to the country. Ho-wever, where smallerbrickworks are owned by several townships, consolidation into a larger operation will requirenegotiations and the drawing up of appropriate agreements. This inconvenience may deter someinvestment in favor of the status quo.
3.12 CaseA2: A conversion of an "Al" plant to hollow brick production, results innegative economic and financial rates of return if considered against the alternative of anenlarged and upgraded plant as specified in option Al. In other words, plants that have alreadyupgraded to larger size and artificial drying will not show gains from conversion to hollow brickproduction. The reduced material and energy costs are worth less than the reduced value ofoutput (hollow bricks have a lower price than solid ones) and the cost of increased investmentfor the new extruder. Analysis shows that no reasonable reduction (less than 50% drop) in thecost of new extruders for hollow-brick production will make this investment both economicallyand financially attractive
3.13 When tested against the alternative of current brick production methods, acombination of Al and A2 would show positive returns, though lower than for Al alone.
3.14 One important constraint affecting implementation of investments for hollow-brick production is the present unavailability of good high-pressure extruders, considerednecessary for dimensional stability of the hollow green bricks. Imported equipment isprohibitively expensive. However, cheaper locally made versions are slowly appearing withChinese equipment suppliers. The availability of cheaper high-pressure extruders would make ashift to hollow-brick production even more attractive.
3.15 Case BI1: The financial and economic analysis of Case BI is clearly unattractivefrom all viewpoints, due to the very small plant capa.ity. The investment cost for this unit is70% that of a unit with twice the capacity. None of the excursions on the base case show afeasible rate of retum.
3.16 Cases B2 and B3: The benefits of the investment Cases B2 and B3 lie inincreased output, coal savings and reduced raw material requirements. Case B3 has very goodEIRR and FIRR, and a short payback period. Case B2, because of its smaller scale of operation,has an margins! FIRR of 15% and a longer payback peried than does B3. In sum, it is a lessattractive investment than is B3. In the economic analysis of Case B2, all of cases show positiveresults. However, the mean value of the NPV is small relative to B3. Case B3 is positive underall cases examined. At no time does the FIRR go below 20% and the EIRR is almost 40% at itsworst and almost 50% at its best.
3.17 In summary, the investment cases Al and B3 are definitely worth promoting forthe brick industry. Due to the various constraints discussed above (difficulty of arrangingconsolidations, need for special extruder for hollow bricks, etc) , the investments are unlikely to

-26 -
proceed at any significant pace without some intervention, e.g.,brokering of agreements betweentownships, financial incentives, information dissemination, etc..
Energy and Poluntion Impacts
3.18 Net energy savings and reduction in C02 and S02 emissions resulting from thetwo main cases are summarized in Table 3.2, below. Case A combines Al and A2 sequentially,i.e., consolidation and conversion to artificial dtying, followed by a shift to hollow bricksproduction. The impact on coal use and emissions were calculated based on the end result ot thetwo steps. Case B takes only the results of B2, the minimum plant capacity (10 millionbHick3/yr.) for which conversion to artificial drying and shift to hollow bricks production wasfound to be viable.
Table 3.2. Energy and Pollution Reduction
Coal and Electricity C02 Emissions S02 EmissionsTCVE/0,000 bricks ton/1O million bricks tons/1O million bricks
Case A: With Project 2069 88.3Without Projec 3449 147.2Reduction 2030 1380 58.9
Case B2: With Project 377 16.1Without Project 628 26.8Reduction 389 25) 10.7
B. The Coke Industry
Specific Investment Cases
3.19 The two main cases examined in this section were conversion from the currentprimitive design to the Type 75 and JKH-89 ovens. Each of these is superior to the current smallovens and the PX-type oven in terms of energy use, product quality and emissions. Largemechanized ovens probably represent the future direction for TVE coke plants, as typical plantcapacities increase and sufficient demand for the gas byproduct in new urban areas is reached. Inthe short term, it is unlikely to see any significant switch to mechanized ovens because of theirvery high capital costs. Nevertheless, it was thought useful to compare the economics ofestablishing a relatively small mechanized oven (the "B" case) with that of establishing a JKH-89 or TJ-75 plant (the "A" cases).
3.20 The viability of establishing a centrally located tar refining facility to process theeffluents of several coke making plants was also examined. Already practiced in somecommunities, refining of tar adds to the revenues of the coke plant and reduces potentialpollution of groundwater.
3.21 The case studies chosen for the cokemaking industry are detailed immediatelybelow:
Case A. The replacement of 5 typical PX coke ovens of 10,000 tpy capacity byone new plant producing 50,000 tpy, either with JKH-89 (Case Al) or TJ-75ovens (Case A2);

-27-
Case B. The establishment of a small mechanized coke oven (HQ-3) of 50,000tpy capacity, as a replacement for 5 PX ovens, each of 10,000 tpy capacity;
Case C. The establishment of a refinery processing 3000 tpy tar, collected fromadjacent Type 89 plants.
Case A Data and Assumptions
3.22 The incremental investment is about 2.9 million Yuan for Case Al and slightlyless than this figure for Case A2. There is a net increase in operating costs in both subcases butthe sales revenues are also increased significantly due to the higher quality of coke produced.Table 3.3 compares some unit indicators for each type of oven:
Table 3.3. Coke Oven Characteristics
Investment Coke Tar Environmental Productivity,Model Yuan/t Coke Price Recovery, Fines, t coke/employee/yr
Yuan/Ton kg/I coke Yuan/t CokePX 40.3 178 3 7.8 190JKH-89 58.1 228 12 0 200TJ-75 57.3 228 0 0 210
3.23 The analyses assumed a construction period of 6 months for the 75 and 89 ovens(3 months for the PX) and a lifetime of 10 years for all three types of ovens, a discount rate of12% and 1992 prices.
Case B Data and Assumptions
3.24 The operating parameters for the mechanized oven case were obtained fromexisting plants in China. The model used (HQ-3) has 48 chambers, each measuring roughly 4.9by 0.3 by 2.4 meters. The cycle period is 14 hours. The coal load is 2.3 tons/hole, the coke yieldis 0.71% and the tar yield is 4%. The investment cost per ton of coke is about twice that of theJKH-89 and TJ-75, totaling 6.1 million Yuan for the 50,000 tpy size. Coke yield and tar recoveryare higher than in the modified ovens.
3.25 The construction period for the HQ-3 is assumed to be one year and the projectlifetimne, 10 years. The discount rate used is 12 % and all prices are 1992 prices.
Case C Data and Assumptions
3.26 The proposed tar refinery extacts phenol from the coke tar by using sodiumhydroxide, after which the alkaline phenolic sodium is separated from the hydrocarbon mixture.Tar, diesel and washing oil are distilled from the hydrocarbon mixture. The alkaline liquid isneutralized with sulfuric acid and phenol is recovered by distillation. The 3000 tpy refinerywould occupy about 25 mu and would require an investment of about 3.2 million Yuan for thebuildings and equipment. Construction period is one year, production reaches 80% of capacity inthe second year, and 100% in the third year. Project lifetime is assumed to be 12 years. Adiscount rate of 12 % was used.

-28-
Results of Case Studies
3.27 The following table summarizes the results of financial and economic analysee.The cash flow tables for all cases examined are in Annex II. The Base or Medium option foreach case is listed in each cell, with the range of values calculated shown in parentheses belowthe base case results. The range of results shown below the medium case figure represents aseries of excursions on the basic set of assumptions. Printouts of the excursions on the base caseare shown in Ainex II.
Incremental DiscounteCase Investnent, Financial Analysis Economic Analysis d Payback,
'000 Yuan NPV IRR % NPV IRR, % YearsAl 2,905 419 15.7 950 22.8 7-8
(-1,164 to +3,324) (7-27) (-2,550 to (<0 to +73)+5,374)
A2 2,865 1,501 16.8 2,858 40.1 5-6(-929 to +3,559) (8-28) (-643 to (4-90)
+7,281)B 6,125 -569 10.0 1,126 17.6 NA
(-1,829 to +5,171) (5-30) (-1,087 to (6-68)+11,261)
C 3,199 27,620 30.8 66,787 53.4 4-5
3.28 The Low end of the range is due largely to a reduced price for coke while theHigh end shows the result of increasing output prices. In the Low case the pnce of coke wasdown 10% from the Medium case, while the High case shows the effects of a coke price that is7.5% higher than in the base case. The results indicate that the coke price is the key outputvariable in this investment analysis. The price of tar recovered (for case Al) is not significant inimproving project economics. At the same time, the prices of raw materials, mostly coal, canhave a significant impact on the economic viability of existing or new plants. For example,reducing the operations costs of a type 89 plant by 10% will increase the F)IRR by 2 percentagepoints. In general, the economics of existing plants improve considerably if input costs arelower.
3.29 C8 Al and A2:. From the country standpoint, the rates of return seem to begenerally attractive for these options in the Base cases, with the Type-75 oven-with a smallerinitial investment and higher coke output-appearing to be somewhat more attractive. Thefinancial rates of return are less attractive. Coke prices must go up by about 7-8%, to Y2.45/t, inorder for such investments to be worthwhile relative to the assumed financial "hurdle rate" of20%. In all cases,however, the rates of return and the NPVs have proved highly sensitive tosmall changes in coke price, capital costs andparticularly on operating costs. Just a fall of 3-5%in coke prices from current levels, or higher operating costs can quickly set the projecteconomics on an undesirable path. In order for the Type-89 oven to be a worthwhile investment,the value of the recovered tar must be higher than the cost of the additional investment andoperational costs. At the present time, that does not appear to be the case.

-29 -
3.30 Several JKH-89 and Type 75 ovens now appear to be operating profitably inTVEs, possible due to a combination of high coke prices (many sell their products in theinternational market), preferential prices for coal raw materials and other local financialincentives. There is also no question that these improved models are environmentally superior tothe PX models. However, their still small scale of operation and (consequently) their extremesensitivity to operating csots and coke price make them an option that is not sensible torecommend for the long term.
3.31 Case B: The economic and financial returns for this case are marginal. As withthe "A" options, the results were found to be highly sensitive to the price of coke; prices wouldneed to remain above Y230/t to assure profitable operation. The scale of operation of thismechanical ovenis too small to make it a viable alternative to indigenous ovens.
3.32 Case C The analyses indicate that establishing centralized tar refineries is anextremely attractive investment from both country and TVE viewpoints. The investment is alsoenvironmentally beneficial.
Energy and Pollution Impacts
3.33 The reductions in energy consumption and pollutant emissions achieved byconverting PX ovens to the more recent types of modified ovens is shown in the following table:
Table 3.4. Cokeworks: Energy and Pollution Impacts of Investments
Case Al Case A2(Type 8) (Type 75)
Energy Savings (coal saved andincreased tar yield; reduced 7260 TCE 7310 TCEelectricity use in Case A2)
Pollutant Reductions:smoke, dust 745 t 735 tS02 280 t 350 tC9O 7500 t 6900 t
3.34 It is important to note, however, while emissions from Type 75 or 89 ovens aresubstantially lower than PX ovens, they still emit sigificant quantities of smoke, dust, S02 andC02. This suggests that regions already heavily polluted by coking activities, such as Jiexiu Cityin Shanxi Province, would require environmental improvement initiatives other than technologyupgrading.
The Metal Castings Industry
Specific Investment Cases
3.35 The two case studies chosen for the metal castings industry involve theintroduction of more energy-efficient technology and more modern casting processes to typicalTVE foundries:

-30 -
3.36 Case A Transformation of five 3,000 t/yr. foundries using standard cold blastcupola melting and manual molding with clay-bonded sand, to three 5,000 t/yr. foundries withduplex melting (cold blast cupola plus electric holding furnace) and using automated resin-bonded sand molding.
3.37 Case B Establishment of one new 5,000 tlyr. plant with internally heated hotblast cupola and automated resin-bonded sand molding line, as an alternative to five 1,000 t/yr.traditional foundries using cold blast cupola and manual clay-bonded sand molding.
3.38 Case A examines the feasibility of upgrading foundries making a wide range ofshort run castings ("jobbing" foundries).The duplex technology proposed is widely used injobbing foundries in the West where a hot blast cupola is used to melt efficiently, and the iron isthen held in either a channel induction furnace or a coreless induction furnace until a sufficientamount is accumulated for pouring. This method gives maximum flexibility in the sizes ofcastings which may be produced but has a small energy penalty for holding the iron.
3.39 Case B addresses foundries making a small number of long run castings("repetition" foundries).The conversion to hot blast reduces coke consumption. There will be anadditional electricity requirement for the operation of the automated molding line. A reduction inscrap rate is expected due to quality improvements resulting from improved mold-making andmolten metal handling.
3.40 For Case A, the incremental investment cost is 31.6 million Yuan. For Case B,the total investment in the new plant is 9.93 million Yuan, of which about half of which is due tothe cost of the vertically parted flaskless molding lines. In both cases, annual operating costswith project are almost double those without the project, mainly due to greatly increasedelectricity consumption and increased raw materials costs.5 There is some reduction in labor andoverhead costs as a result of the project. There is considerable reduction in coke consumption.Investment costs are recouped from increased revenues due to the higher unit selling prices ofproducts resulting from improved quality of the casts (See Tables xx to xx, Annex xx).
3.41 The incremental analysis assumed that, for Case A, one year is spent on thetechnical renovation work, that the renovated foundry reaches 50% of capacity on Year 2 and100% of capacity on Year 3. For Case B, it is assumed that the construction period for the newplant is 2 years. For both cases, a lifetime of 15 years is assumed for the new plants and that theconstruction period for the old or alternative foundry is two years. All analyses are based on1992 prices and a discount rate of 12%. The same types of variations used for the previous twoindustries were used to obtain a range of returns for the casting industry. Prices for the outputwere varied up and down by 15%. Variable costs were varied up and down by 5-10% andinvestment costs were changed in various cases by 5, 10 and 25%. The low end of the rangeshows a true worst case with low product prices (-15%), high investment costs (+5%), and highvariable costs (+100%). The converse was true for the best (High) case.
5 Pig iron, scrap steel and resin sand comprise over 90% of raw material costs. Coke and electicity arerelatively insignificant

- 31-
Results of Case Studies
Incremental DiscountedCase Investment, Financial Analysis Economic Analysis Payback,
'000 Yuan NPV IRR, % NPV IRR, % YearsA 31,590 6,000 15.0 42,860 32.7 8-9
-37,390 to 42,040 <0 to 32 -32,690 to 106,500 <0 to 61B 9,930 3,730 18.0 11,270 28.5 6-7
-7,450 to 13,080 -2 to +32 -7,7100 to 27,310 -4 to 49
3.42 The base case analyses show that both investments are economic. The financialrates of return, however, are both less than 20%, with Case A being slightly less attractive thanCase B no doubt due to its much higher investment costs. Both cases are sensitive to changes inoutput and input prices but less so than with the coke cases. The most important factor in theanalysis of the investment is the product price. It should be noted that as the country's pricingsystem becomes more free, declines in product prices will go through to the input markets so thatthe static case comparisons used here probably show more response to price changes than wouldbe the case in reality.
3.43 Both cases represent major changes in the operational process, and the use ofrelatively high-technology equipment. These are reflected in the higher investment requirementscompared to the brick and coke cases and, in the case of A, a relatively longer payback period.The major barriers to adoption of these options by the TVE metal casting sector are the highcapital cost and the need for specialized training for operating the high precision equipment.
Energy and Pollution Impacts
3.44 For CaseA, the anticipated changes in energy use and emissions are estimated asfollows:
Before AfterUpgradig Upgradin
Coke consumedtonnes/yr. 8334 3658ttt casings 0.56 0.24
Electricity usedthousand kWh/yr. 129 2955
kWh/t 0.01 0.20Coal usedtonnes/yr. 1364 0t/t castings 0.09 0
Totd TCE 9121 4736TCE/t castings 0.61 0.32Emissions
CO2 as tonnes C 6621 2595tC/t 0.44 0.17
S02 kg 115500 3000kg/t 7.7 0.2
Smoke/dust kg 136500 7200kg/t 9.1 0.48

-32 -
3.45 For C=,R the anticipated changes are:
Before After UpgradingUpgrading
Coke consumedtonnesyr. 3056 1220tltcastings 0.611 0.244
Electricity usedthousand kWh/yr. 47 2332
kWb/t 0.01 0.47Coal used
tonnes/yr. 500 0ttcastings 0.10 0
Total TCE 3344 2117TCE/t castings 0.67 0.42Emissions
C02 as tonnes C 2428 865tCtt 0.49 0.17
502 kg 42500 1000kgft 8.5 0.2
Smoke/dust kg 50000 2400kg/t 10 0.48
Net Economic Cost of Energy Savings and Carbon Dioxide Abatement
3.46 For each of the investment cases discussed above in the brick, coke and metalcastings industries, the net cost per tonne of coal equivalent saved and per tonne of carbondioxide abated may be calculated by dividing the net present worth of the incrementalinvestment by the discounted amounts of energy savings or carbon dioxide reduction (a negativenumber). The Table below shows the costs of reducing carbon on a per tonne basis.
3.47 For the investments found economic (EIRR>12%) the positive NPV can beviewed as a negative net cost of carbon reduction. Only one case in the brick industry was foundtO have a negative NPV in the "medium" option. Consequently, for most of the cases examinedthe net costs of reducing C02 and coal use are negative. This underscores the idea that theenvironmental and energy benefits of the "good" investments are really a bonus to the economicbenefits realized by the projects. For the coke options it should be noted that the putativereductions in C02 will only be realized if the coal that is replaced in that industry is not usedelsewhere in expanding coking capacity. The Table below shows the cost of C02 reduction fortwo options for each industry.
Table 3.5: Net Cost of Carbon Reduction From Representative TVE InvestmentsIndustry Case Cost of Carbon Reduction
(Y/tonne)EmQnomic Finncial
Brick Al (5,166) (2,524)B2 (2,310) (841)
Coke Al (26) (23)A2 (86) (32)
Casting A (2,422) (339)B (2,400) (795)

- 33 -
3A8 The casting investments are unambiguously positive (i.e., negative net cost) intheir efficiency of reducing emissions. For the other cases, the results are mixed. For the brickindustry, both case Al and B2 are quite positive. The relative robustness of the brick resultsindicate that under most circumstances this case will show low or negative costs of carbon andother emissions reductions. The coke investments appear to be marginal from a carbonstandpoint, in spite of the relatively large emission reductions. Improving the economics of theproject with higher coke prices will reduce the economic cost of carbon reduction. For example,in Coke Case Al, the economic and financial costs of carbon reduction fall to -Y148/t and -Y92/t, respectively, when the price of coke rises to Y245/t. From an environmental standpointidue cost of reducing emissions in the coke industry is small, regardlesb of the cost of the type ofoven (75 or 89) that is constructed, less than +$2.50/tonne at worst. However, these costs ofemissions reduction will remain the same economically regardless of where such coke industryinvestments are made.
Summary
3A9 Although the feasibility of specific actual cases still needs to be investigated, theabove discussions have identified promising generic investment options in the brickmaking andmetaicasting. industries:
3.50 For brickwM rks, the consolidation of smaller plants to larger operationsexceeding 10 million pcs/yr capacity, conversion from natural to artificial drying process, andmanufacture of hollow bricks are attractive from the viewpoints of both the country and theTVEs and should be supported.
3.51 For metaLcasting, scaling up to at least 5,000 tpy operation and technicalupgrading of TVE foundries (conversion to duplex melting by small "jobbing" foundries andconversion to hot blast cupolas by "repetition" foundries) should be supported.
3.52 The findings for the cokemaking industry, however, are not as positive. Exceptfor the establishment of centralized tar processing plants that was shown to be beneficialfrom all viewpoints, the analyzed cases of conversion to more energy-efficient but stillrelatively small-scale coke production methods are only marginally economic and extremelysensitive to variations in operating costs and product price.
- 34 -
IV. Conclusions and Recommendations
Intodtn
4.1 The TVE industry sector has consistently been a major contributor to theeconomy and its continued growth and profitability is consequently a priority concern of theGovernment. Energy is an important input to almost all TVE production processes; presently, thesubsector accounts for almost a quarter of total industrial energy consumption. Efforts toimprove energy efficiency clearly have direct impact on the competitiveness of TVE industries.Since coal is the most widely used fuel, now comprising over 70% of all energy consumned, thereis an important environmental dimension, as well. Reducing coal use in TVEs will make verysignificant contributions to the reduction of carbon dioxide, sulfur dioxide and other gasesemitted to the atmosphere.
4.2 Energy efficiency initiatives for TVEs must be approached at two levels:through structural or policy reforms, and through technical improvements. TVE industriescomprise a highly diverse collection of processes, products and scales of operation. It isimportant that overall industry restructuring policies be based on an understanding of thetechnical characteristics of the different individual industries. For exanple, because of thedispersed markets that brickworks serve in this large country, small-scale operations (relative toWestern standards) can be expected to be still important in the foreseeable future in China. Onthe other hand, it seems certain that economic and environmental limitations will eventually leadthe cokemaking industry to the large-scale, mechanical ovens of the West.
4.3 There is scope for effective interventions at the plant level in TVEs, to ensurethat industry transformation is guided to the use of appropriate technologies and efficientpractices in the medium term. Significant disparity in production practices and energyefficiencies presently exist across regions of the country for the same industry. Although anumber of Government initiatives in technology transfer are beginning to be implemented, mostTVEs still have very limnited access to technologies and best practices information.
4A4 The present study has focussed on brickmaking, coke making and metal castingbecause they collectively account for about half of total coal use by TVEs; furthermore, theseindustries represent vital inputs to infr^structwe (bricks) and machinery (coke and castings), thedemand for which can be expected to keep pace with the very rapid growth of the overalleconomy. The study found that in China today relatively low-cost technical innovations that arehighly appropriate to TVE conditions exist in the brick and cokemaking industries and need to bemore widely disseminated. In cokemaking, however, the study found that efficiencyimprovements confmed to the current scales of production are only marginally economic and donot represent long-term solutions to the problems faced by this particular TVE enterprise.
Directions for Technical Impovenemets
4.5 Relative to Western practices, production methods for the brickmaking,cokemaking and metal castings industries in TVEs are still primitive. It is useful to put the statusof each of these three TVE industries in international perspective.

- 35-
Brickmaking
4.6 Aside from having much higher average plant size and productivity (bricksproduced per man-year), the brick industries in Western countries have far more stringentrequirements for structural strength, appearance and quality than in China today. Theserequirements in turn need special equipment and processes that are highly capital intensive.Tunnel kilns dominate brick production in the West. This is a continuous, automated productionmethod where bricks are stacked on wagons which travel though the kiln, normally on railsystems. The flow of gases through the tunnel is carefully controlled using blower fans anddampers, allowing improved heat distribution and exchange. Labor requirements are low.However, a modem tunnel kiln with a capacity of 25 million bricks per year would cost aboutUS$1S-20 million, obviously a substantial investment figure for TVEs.
4.7 Fuel consumption comparisons may show higher energy intensity for someWestern brickworks but there are difficulties in making direct comparisons. In Westernbrickworks significant amounts of power, especially electricity, are normally used for automatedand ancillary operations, in the interest of higher throughputs and less labor inputs. Someadvanced features, such as precise electronic control of air flow and kiln temperature, enablesignificant energy savings. Others, such as higher powered extrusion systems, lead to moreenergy consumption. Also, in the West, there is need to produce more variety of product types tosuit consumer preferences. For example, there is significant demand for facing bricks withspecial color effects; this requires special techniques that often involve higher energy inputs. Theenhanced value of the product offsets the added energy costs. This type of demand is not yet afactor in China.
4.8 Technical developments in brickmaking that are appropriate for adoption inChina in the near to medium terms can be summarized as follows (see also Annex IV):
• Carh'onaceous addbes - consumed as body fuel, have the potential to contribute30% to 60% of energy in firing. Require consistent supply, thorough materialpreparation and mixing and appropriate formingtextrusion processes
o Perforadions - high void content (up to 40%) can result in significant fuel savingsbut is economic in Chinese TVE plants only if extrusion equipment is already used.Degree of perforation is limited by clay type.
* Artif#cial Drying - requires recycling of waste kiln heat, supplemented by premiumfuel (gas or oil). Appears to be feasible for larger plant (50 million bricks pa) only,with benefits due mainly to increasing the production season to 12 months a year.Artificial drying also avoids losses or delays due to weather and permits a widerrange of material compositions to be brought to firing condition.
• High Effwciency Driers - further fuel savings are achievable with improved driertechnology, giving a rapid payback and reduced emissions
* High Pressure Formnkg - offers the opportunity to reduce the rmoisture content,resulting in energy savings in the drier. Suitable only for plant with artificial drying,but has quick payback period for larger plant.

- 36 -
Metal Casting
4.9 China's castings production per capita is small in comparison with the developedcountries, a reflection of the still low requirements of its industrial sector. An importantyardstick of the technological development of a country's foundry industry is the proportion ofspheroidal graphite (SG) iron production in relation to grey iron and steel. China producesrelatively large quantities of cast steel but only a small proportion of SG iron, suggesting that ithas not yet been able to exploit this advanced material to a great extent (See Annex V).
4.10 In terms of energy usage, the fundamental melting operations appear to be usingabout twice as much coke per tonne of casting as would be expected in modem Western plant.Part of this may be attributed to poor quality coke, outmoded technical design or ineffectivemaintenance, but a significant fraction appears to be due to differences in operating practice. Inthe West, there is a move away from cupola melting to electric firnaces due to the increasingcost of meeting emission standards. The need for dust removal plants with cupolas effectivelyworks against small capacity plants. Coreless induction furnaces and channel induction furnacesare likely to become favored in China in the near term because they are especially suitable forsmall foundries, and where product quality and flexibility of operation are important.
4.11 The proposed technical upgrading of TVE foundries (conversion to duplexmelting by "jobbing" foundries, conversion to hot blast cupolas by "repitition" foundries) are inline with accepted Western foundry industry practice, and the predicted energy efficiency aftertrnsformation is comparable with average performance in similar-sized foundries. However,Western experience suggests that to achieve such efficient operation, even with a modem plant,requires expertise and awareness which may be still beyond the experience of a significantproportion of TVE foundry managers and technical staff. It is important that the technicalrenovations the be pursued in parallel with tining and good practice guidelines.
4.12 There are two specific areas where awareness campaigns should be targeted:
4.13 Yked Improvements. The improvement of yield has a direct effect on theenergy consumption per tonne of finished castings. The use of awareness campaigns in this areahas resulted in savings of 1-2% in the UK foundry industry, where the importance of yield isalready well understood. In an environment such as the TVEs it is considered that the currentyields must be very low, and that dramati c savings are possible.The improvement of yield has adirect effect on the energy consumption per tonne of finished castings. The use of awarenesscampaigns in this area has resulted in savings of 1-2% in tlhe UK foundry industry, where theimportance of yield is already well understood. In an environment such as the TVEs it isconsidered that the current yields must be very low, and that dramatic savings are possible.
4.14 Changes in melwt practice. In foundries equipped with coreless inductionfumnaces, these may be used for iron melting. In the case of short production runs (for examplefor test pieces or if there are few orders) it is more efficient to melt in these fumaces rather thanto always use the cupola.

- 37 -
Cokemaking
4.15 Most of coke manufacture in the West are by modem mechanical ovens ofcapacities greater than 200,000 tonnes per year. The capacity of the average TVE cokeworks israted in the tens of thousand tons per year. The advantage of the modern Western ovens arebetter product quality, less emissions and capability to recover by-products. The disadvantage isthe very high capital costs: a 10-oven battery would cost over $33 million while a 50-ovenbattery would cost about $80 million (an oven normally has a capacity of 5000 tpa). For China,the minimum economic size is more likely the latter, and the sale of gas would be a prerequisiteto being economic. The high capital costs of such plants is bound to be a major constraint to theiradoption by TVEs.
4.16 The establishment by SOEs of large-scale mecha&, .. ovens in areas adjacent tourban centers where gas could be piped is likely to increase in pace in the near term. Suchprojects, along with increasingly stringent enforcement of environmental regulations will nodoubt displace coke production by indigenous ovens in these areas and ease TVE enterprises outof the business. This development would be clearly beneficial from economic and environmentalviewpoints. Although as shown elsewhere in this report the energy efficiency of Chinese-developed modified kilns already approaches that of mechanical ovens, they have serioustechnical limitations in containing harmful solid, liquid and gaseous emissons. 3y their intrinsicdesign, materials of construction and automated controls, mechanical ovens are superior in termsof meeting pollution standards. Aside from greenhouse gases, of particular concern are toxicgases such as polycyclic aromatic hydrocarbons and benzene that, even in mechanical ovens, aredifficult to totally contain.
Policy Iica
4.17 In TVEs the driving force for energy conservation is not the desire to save coalbut the need to maintain a market s:hare in an increasingly competitive environment. Inenterprises with high energy consumption, energy conservation can help streamline costs andenable them to adapt to changing market conditions. Presently, the introduction of modern,energy efficient equipment is often made only as part of a rehabilitation and/or upscaling of anold plant which has reached its economic life. Clear evidence of this can be found in all threeanalyzed subsectors.
4.18 The TVEs are more likely than the SOEs to face realistic, market-based inputprices and this fact, together with their profit-oriented nature, will predispose them to adaptefficient technologies if not hindered by lack of relevant technical information or access tc up-to-date capital goods. Improving access by TVEs to these factors is likely to prove moreeffective in conserving energy than regulations and administrative sanctions.
4.19 Ownership issues can be a barrier to implementing technical upgradingprograms. When earlier restrictions on rural industrialization were lifted in the late 1970's andearly 1980's, the collective type of ownership that characterize TVEs allowed a quickestablishment of industrial enterprises through a pooling of existing capital and skills. Laterregulations defined ownership rights to TVEs as residing in the entire peasant's collective of the
6 This section draws heavily from A. Ody's "Rural Enterprise Development in China, 1986-90"(1992).
-38^
township or village, and were to be exercised through the local representative congress orthrough the collective economic organization representing all peasants. This close link to thelocal community presents major advantages for TVEs in terms of access to local resources andmotivation of employees. But the special ownership structure has also given rise to problemssuch as difficulties in connection with development of firms across jurisdictional boundaries anddifficulties in attracting external investors. The intimate relationship that exists between theTVEs and local governments can furthermore lead to conflicts of interest between regulatory andownership functions. This could be manifested in, inter alia, inadequate enforcement ofenvironmental regulations and slow phasing out of highly inefficient plants. Strengtheningenterprise law and clarifying property rights as well as promoting share-holding may help someTVEs outgrow their present community orientation and induce cross-sectoral cooperation.
4.20 It is important to continue efforts to create a "level playing field" between TVEsand SOE's regarding access to finance, capital goods, inputs, skilled manpower and technicalassistance. The "1986 Regulations" established an institutional framework and supportmechanisms for energy conservation but these seem to be directed more at the larger SOEs thanat TVEs7. For example, for technical assistance to SOEs on energy efficiency at the plant level,the State Economic and Trade Commission established "testing centers" in each province,autonomous region and municipality. The SSTC has also several energy conservation centers invarious provinces (all in all, over 200 centers exists, two or more in some cities). No equivalentset-up exists to serve TVE industries. To fill this gap, the Ministry of Agriculture initiallyestablished three energy conservation centers for TVEs in Shanghai, Tianjin and Dalian, andplans to eventually set up a network of such centers all over the country. The situation obviouslyneeds a careful re-examination; it has been reported that there is little communication betweendifferent centers and that many of the centers are underutilized. What appears to be lacking is amarket study to first determine the magnitude and types of assistance routinely needed byvarious industries. Such information could then be used to determine the type of services, andhence staffmg and equipment, needed in the centers-in other words, a business plan. There islittle to justify the establishment of separate energy services for SOE and TVE industries; thewhole institutional framework for energy support services needs to be improved.
4.21 The technological support to TVEs needs to be strenghtened. The knowledgeabout energy efficient technologies and the operational experience of plants who havesuccessfully introduced such technologies need to be disseminated through training courses,workshops or other types of promotional events. It is not clear whether existing programs such asSPARK (launched in 1986 by the SSTC) are effet tively addressing this need. However, theoverall shortage of credit appears to have obstructed earlier hopes of accelerating the program.SPARK's direct support has now only reached a very small proportion of the TVE population.
4.22 The access to qualified personnel is an important issue for the technologicaldevelopment of TVE's. The situation today is very inhomogeneous. While on the one hand thereare strong links to the advanced domestic industrial sector in provinces like Jiangsu andZhejiang, and good intemational connections in provinces like Guangdong, Fujian andShandong, there is considerable isolation in the more distant interior provinces. Generallyspeaking ithe TVE sector has difficulty in recruiting more highly trained and experienced staff in
7 In 1991, MOA issued "Temporary Regulations on Energy Conservation Management forTownship and Village Collective Industrial Enterprises" that provided very general administrativeguidelines.

-39-
managerial, fnancial and technical fields. Graduates from colleges and from SecondaryTechnical Schools and Skilled Workers Schools have traditionally been assigned directly to theSOE sector. While a variety of public programs have been launched in order to encourageshorter-term advisory assignments for SOE technicians to rural firms (one example is theSPARK Program's secondment program of so-called "Sunday Engineers" to TVE's), the currentlack of training programs to upgrade the managerial and technical skills of TVE staff remains amajor obstacle to the successful introduction of efficient technologies in the TVE sector.
4.23 Finally, an important observation must be made with regards to environmentalpolicy. A new, energy efficient plant may have lower emission levels than existing plants but itdoes not mean that all such new projects should be supported. It should be noted that in areaswhere air pollution is already serious, the construction of even a new, energy efficient plant willfiurther worsen local air quality. This implies that a program to support introduction of efficienttechnologies in TVEs must ensure that old plants are shut down when new ones are beingconstructed in order to achieve an actual improvement of air quality in very polluted areas.
Recommendations
4.24 Considering the significant economic and environmental benefits of the technicalimprovements described in this study, it is recommended that a program to upgrade the TVEb-rickworks and metal casting industries be prepared. The program will consist of: (a)investments in technical process improvements and restructuring initiatives, i.e., establishmentof larger, more efficient plants to replace a number of smaller, inefficient ones-along the lines ofthe cases studied in this report; (b) a b ing activities-including industry-specifictraining on good practices and other energy saving approaches; sector-wide awarenesscampaigns, and the development of capabilites in existing county level energy conservationcenters to effectively support specific technical needs of the subject industries, and (c) activeenforcement of environmental regulations at the local level. The upgrading program to bepreparmd for the subject industries could be structured into three phases: a three-year pilot phasestarting inl995, followed by a five-year expansion phase and a full implementation phasethereafter
4.25 The future of coke production in China points inexorably to the direction of Westerntype large-scale mechanical (LSM) ovens which are environmentally cleaner and moreeconomic. The TVE sector should be encouraged to phase out its support for small-scaleindigmous coke prodction. A more active program of inspection, application of environmentalpenalties and shutting down of highly polluting PX plants should be carried out by TVEs.Existing JKH-89, TJ-75 and similar improved models should be allowed to continue operationbut should not be extended any subsidies or special assistance. The establishment of newcokeworks that do not recover their gas byproducts should be discouraged over the mediumterm. If new small-scale cokeworks are to be built, they should, at a minimum, be required toutilize new designs such as the JKH-89 and TJ-75 or later models. For all new cokeworks, acomprehensive environmental impact statement should be made to show that there will be no netincrease in pollutant emission in the area.
4.26 The preparation of the proposed program should be made a major component of theproposed _ NP GEF technical assistance project ($5-6 million) directed at TVEs that MOAexpects to be approved shortly. Availability of these resources provide an opportunity to: (a)prepare the proposed program, including the conduct of additional supporting investigations, and

-40-
(2) implement the pilot phase. The additional work needed are more detaled techno-economicinvestigations of the promising investnent cases that were identified broadly in the presentstudy, and more incisive determination of realistic options for addressing the various policy andimplementation issues that were raised but not resolved in the present study. There is need, forexample, to make a deeper assessment of the barriers and possible approaches to encouragingconsolidation of several small-scale TVE operations to a larger onc -an implementation issuethat has not often been successfully resolved in past projects. There is also need for a moreintensive review of the various existing programs for dissemination of technical infonnation toTVEs, how effective they have been and how best to integrate them under a coherent overallsystem. These additional preparatory work could be conducted within the framework of aninstitutional study on "how to efficiently implement energy conservation initiatives in TVEs ".
4.27 The objectives of pilot phase implementation would be to demonstrate feasibility,develop the human resource base needed to appraise, implement and sustain these type ofprojects in TVEs, and acquire experience in institutional coordination. The pilot phase could startwith several typical plants representing the three industries in one or a few provinces. Thecommunities/provinces chosen should have a record of being active in implementing technicalrenovations, where the chances of program success are maximized. These sites may or may notbe the same ones where the present case studies were done. Based on the experience acquired inthe pilot phase and the availability of financing sources, the upgrading program would beexpanded into several more provinces. The third phase would aim for a nationwide program. Theoutput of the pilot phase would include a detailed definition of the follow-up expandedinvestment project.

-41 -
References
1. Ministry of Agriculture, Energy Efficiency and Pollution Control in Township and VillageEnterprise (TVE) Industry: OverviewReport, Beijing, China, July 1993.
2. Taylor, R., China Energy Conservation Study, IBRD, Report No. 10813-CHA, (1993)
3. Ody, A., Rural Enterprise Development in China, 1986-90, IBRD (1992).
4. Ministry of Agriculture, Energy Efficiency and Pollution Control in Township and VillageEnterprise (TVE) Industry. Case Studies Report, Beijing, China, July 1993.
5. Ministry of Agricultue, Energy Efficiency and Pollution Control in Township and VillageEnterprise (TVE) Industry: Summary Report, Beijing, China, July 1993.
6. Energy Techrology Support Unit, Review of Optionsmfor the Brickmaking Industry,Oxfordshire, U.K., July 1993.
7. Energy Technology Support Unit, Review of Options for the Metal Casting Industry,Oxfordshire, U.K., August 1993.
8. CRE Technical Services, Application of Modern Cokemaking Technology to China,Gloucestershire, U.K., February 1993.

- 42 -Annex APage I of 11
Annex "A". Accelerated Investment Scenarios
Introduction
Many of the identified economic investments in the brickmaking and metal casting TVEindustries are not likely to be undertaken at any significant pace due to various constraints. Well-designed interventions, such as capacity building, intermediation of the information market andfiscal incentives, can accelerate the level of investments in the more efficient processes. Thepurpose of this section is to estimate the impacts of accelerating the investment program onTVE-wide coal savings and reduction of CO2 and SO2 emissions.
First, based on cutrent market trends and anticipated developments in these twoindustries, the likely outputs of brick and metal castings from TVE plants using various types ofproduction processes have been estimated through 2010. The corresponding energyconsumptions and pollutant emissions will depend on the types of brick kilns and foundries usedto make these products. In the brick industry, for example, the extent to which hollow bricks canreplace the traditional solid bricks in suitable applications will be a major factor in potentialenergy savings.. In the metal castings industry, most of current production are in the "backward"category (manual operation, cold blast cupola melting, etc) and efficiency improvements will bemade mainly by industry movements towards the "Less Backward" and "General" categories.
Three scenarios were chosen as bases on which to develop forecasts of product outputs,energy use and emissions in the two TVE industries - business as usual (BAU), and both lowand high rates of acceleratd technical renovations and construction of new capacity. The BAUscenario was developed based on a combination of official projections and opinions of industryexperts on the pace and direction of current trends in TVE industrial development in China. Itrepresents the best estimate, subjective though it may be, of what the industry situation over thenext 1S years would be if no interventions by way of promoting improved technologies or raisingnew investment funds are made.
The accelerated scenarios consider the impacts of active industry upgrading programsimplemented starting in 1995. The main difference between the "low" and "high" acceleratedscenarios is the level of investment assumed available for phasing out of highly inefficientoperations, process and equipment upgrading, and establishment of new capacity, as described inthe previous Chapter. Implicit in the two accelerated cases are the additional efforts on humanresources development and the promotion of new technologies and best practices that will becrucial to achieving higher rates of adoption of new processes.
A. Brickmaklog
It is expected that TVE brick output will remain a very high proportion of the nationalbrick output: currently, TVE production is about 90 percent of the market. TVE brick productionis expected to rise by about 2 percent per year uo to 2000 and to continue to rise thereafter atabout 1 percent per year. The forecasted output of the TVE brick industry is thus as follows:
Table 4.1. Foreca of TVE Brick Output(100 million pieces per year)
1990 41741995 47002000 50002005 53002010 5500
Source: Reference 5

- 43 AnnexAPage 2 of 11
Business As Usual Scenario
For the business as usual scenario, it is assumed that production by primitive indigenouskilns is eliminated only by 2010. Also, the share of output held by tunnel kilns will remain low atunder I percent. While production using natural drying will remnain the single largest process, itwill shrink from over 90 petcent of the output to about half by 2010. The use of artificial dryingsystems is expected to accelerate after 2005, representing about 46 percent of output by 2010. Itis also expected that hollow brick production will rise significantly to reach 27 percent of outputby 2010. Under the BAU scenario, the total capital investment required in the period to 2010 isestimated to be 32, 850 million yuan. The projected contributions of different types of brick kilnare as fo1lows:
Table 4.2. TVE Brick Plant Output by Kiln Type - BAU Scenario(100 million pieces)
Year: 1990 1995 2000 2005 2010Indigenous 313 282 225 147 0
AnnumarlHoffinannaural drying, solid bricks. 3790 4181 4200 3848 2941artif drying, solid bricks. 54 129 280 571 1044
arif. drying, hollow bricks. 1 3 103 285 712 1478Tunnel
artif.drying,solidbricks. 3.0 3.3 6.0 11.4 18.1artif. drying, hollow bricks 1.2 1.4 4.2 10.2 19.2
Totals 4174 4700 5000 5300 5500Source: Reference 5
A graphical representation of the above table (Figure 4.1 on next page) and thecorresponding ones for the accelerated cases provide a more convenient way to compare detailsof tethree scenarios.
Based on these disaggregated output figures, estimates were made of the coalconsumption and pollutant emissions over the period to 2010, as follows:
Table 4.3. Energy and Emissions Projections - BAU1990 1995 2000 2005 2010
Total coal consumption, million tce/y 48.7 53.8 55.7 56.2 53.3CO2 emissions, million t C/y 27.5 30.3 31.5 31.9 30.5SO? emissions, million t/y 1.2 1.3 1.4 1.4 1.3
Source: Reference 5
Low Accelenrtd S-cenan
This scenario assumes additional investment of 16,531 million Yuan on brickworksupgrading over the 15 year period, or an average of 1100 million Yuan per year. This wouldenable the total phasing out of indigenous kilns by the year 2000, more rapid replacement ofnatural drying Hoffman kiln with artificial drying processes and a significant growth in hollowbricks production. The more capital-intensive tunnel kilns will begin to be established in greaternumbers by the year 2000. By 2010, the share of natural dried bricks will decline to about 25%from about 91% in 1990. Hollow bricks would constitute some 46% of total production. Theprojected contributions of the different types of brick kilns under this scenario are graphicallyshown in Figure 4.2 (for tabular presentations of this and susequent charts in this Chapter, seeAnnex H).

- 44 - AnnmU APage 3 of I1
Figure 4.1: Brick-Business as Usual
I
I~~~~~~~~~~~~~
I I IIII I 0 W.ad uoN Ol

- 45- Ann-xA
Page 4 of 11
Figure 4.2: Brick: Low Accelerated
1~~~~~~~~~~~~~~~~
I AC FS
I'd USflI A

-46- Annex APage 5 of 11
High Accelerated Scenario
In this scenario, the use of natural drying processes is expected to be eliminated almostentirely by 2010. The manufacture of hollow bricks by the artificial drying process will be moreactively promoted. With rapid rural development absorbing unwanted labour released from theTVE brick industry, an increase in the use of tunnel kiln technology is envisioned. All of thesecome at much higher investment cost, estimated to be 62,579 million Yuan between 1995 and2010 or 34,267 more than the BAU case. The contributions of different types of brick kilns underthis scenario are illustrated in Figure 4.3.
The investment schedules for each of the scenarios are summarized in Table 4.4.
Table 4.4. Five-Year Investnents
BAU Low High
1990-1995 45371995-2000 5414 12348 173662000-2005 9097. 14257 211212005-2010 13800. 18236 24091
Potential Impact
Both of the accelerated scenarios result in greater reductions in yearly coalconsumption, and carbon dioxide and sulfur dioxide emissions in the brickmaking industry thanwould be achieved under the BAU scenario. The correponding yearly differences (orincremental reductions) between each scenario and the BAU case were calculated and thenadded over five-year periods. The results are summarized in Table 4.5.
Table 4.5. Incremental Reductions in Coal Use and Emissions: Five-Year Cmnulative
Low vs. BAU High vs. BAU
Coal, C02, S02, Coal, C02, S02,million thousand thousand million thousand thousandTCE tonnes C tonnes tonnes tonnes C tonnes
1995-2000 7.54 3850 176.45 8.12 3810 177.702000-2005 7.32 3260 152.59 11.00 4540 217.49
2005-2010 7.99 2870 135.39 20.58 8380 382.65
B. The Metal Castings IndustryOutut Forecasts
The output of TVE castings plants is likely to grow at an annual rate of about 5.4percent. The TVE share of national castings output is expected to increase steadily from about42 percent in 1990 to 52 percent by 2000 and to 60 percent by the year 2010. The forecast outputof the TVE castings industry is thus as follows:

- 47 - Annex APage 6 of 11
Figure 4.3: Brick: High Acclerated
1~~5
-d U | " 0 |
96"_"$~~~~~~

-48- Annex APage 7 of 11
Table 4.6 Forecast of TVE Castings Output
Million tonnes per Percent of nationalyear output
1990 4.20 42.01995 5.16 45.22000 7.17 52.42005 9.28 56.12010 12.00 60.0
Business As Usual Scenaio
For the BAU scenario, the projected contributions of different categories of foundries areshown in Table 4.7. In this scenario, it is assumed that the production share of "General" and"Advanced" categories of foundries rise gradually until they constitute 60% of total productionby 2010. The rise in the share of these two categories results from investments in thesetechnologies, as well as conversion fro "Backward"and Less Backward"technologies. It isestimated that there will still be significant amounts of investments in the capacity expansion ofthe two lower technologies, mostly before 2010. These are also summarized graphically inFigure 4.4.
Table 4.7. Output by Category of Foundry - BAU Scenario(million tonnes per year good castings)
1990 1995 2000 2005 2010Backward 2.06 2.30 2.75 2.43 1.11
Less backward 2.10 2.58 3.40 3.73 3.69General 0.04 0.24 0.W4 2.31 5.22
Advanced 0.00 0.05 0.18 0.81 1.98Totals 420 5.17 7.17 9.28 12.00
Source: Reference 5
The corresponding total coal consumption and C02 and S02 emissions for the BAUscenario are estimated to be as follows:
Table 4.8. Energy and Emissions Projections - BAU
1990 1995 2000 2005 2010Total energy consumption, million TCE 3.03 3.65 4.90 5.84 6.69
CO2 emissions, million t C 2.18 2.61 3.49 4.08 4.54S02 emissions, thousand t 34 40 52 56 53
Smoke/dust discharge, thousand t 41 49 63 68 63Souce: Reference 5
Low Accelerated S
In this scenario, it is assumed that the share of casting production at the "General"category will increase to 50% by 2010, becoming the dominant production method. Productionunder the Advanced category will increase to 20% by that time. The level of investment neededbetween 1995-2010 will be 10% higher than that for the BAU case. The share of outputs of thedifferent categories of foundries over the years will be as shown in the Figure 4.5.

~~ 49 ~~ AunnexAPage 8 of 11
Figure 4.4: Castings-Business as Usual
_ _ ~~~~~~~~~~~~~N
fl | FY, . , .: E | ! ' jS .U
X11 I _m>s'n'99:- I f' -..a,

- 50 -cmA
Page 9 of II
Figure 4.5: Castings: Low Acclerated
4, ., . ._______~~~~~%-.,
_~~L__^
l ~I
wumitl'~ 1111wq I

- 51-Am APage 10 of I1
HighAcceleated Snario
For the "high accelerated" scenario, it is assumed that the casting output from Backwardand Less Backward categories of foundries will drop from almost 99% in 1990 to only 30% by2010. By that time, most production will be by General and Advanced types of foundries, withoutput from Advanced foundries reaching nearly 25% share. This scenario will requireinvestment between 1995-2020 of about 20% over the BAU case. The resulting share of outputsamong the different foundry categories will be as shown in the Figure 4.9.
The investment schedules for each of tiae scenarios are summarized in Table 4.4.
Table 4.9. Five-Year Investmentsin Million Yuan
BAU Low Hige1995-2000 1,255 - -
1995-2000 2,495 2,807 3,1432000-2005 4,769 5,374 5,9402005-2010 8,740 9,528 10,332
potential Impact
Both of the accelerated scenarios result in greater reductions in yearly coal consumption,and carbon dioxide and sulfur dioxide emissions in the brickmaking industry than would beachieved under the BAU scenario. The correponding yearly difference, (or incrementalreductions) between each scenario and the BAU case were calculated and then added over five-year periods. The results are summarized in Table 4.5.
Table 4.10. Incremental Reductions in Coal Use and Emnissions: Five-Year Cumulative
Low vs. BAU Hign vs. BAUCoal, C02, S02, Coal, C02, S02,
thousand thousaud thousand thousand thousand thousandTCE tonnes C tonnes TCE tonnes C tonnes
1995-2000 139 107 3.45 288 225 7.162000-2005 408 357 '0.51 814 724 20.752005-2010 747 666 18A7 1,510 1,380 37.07
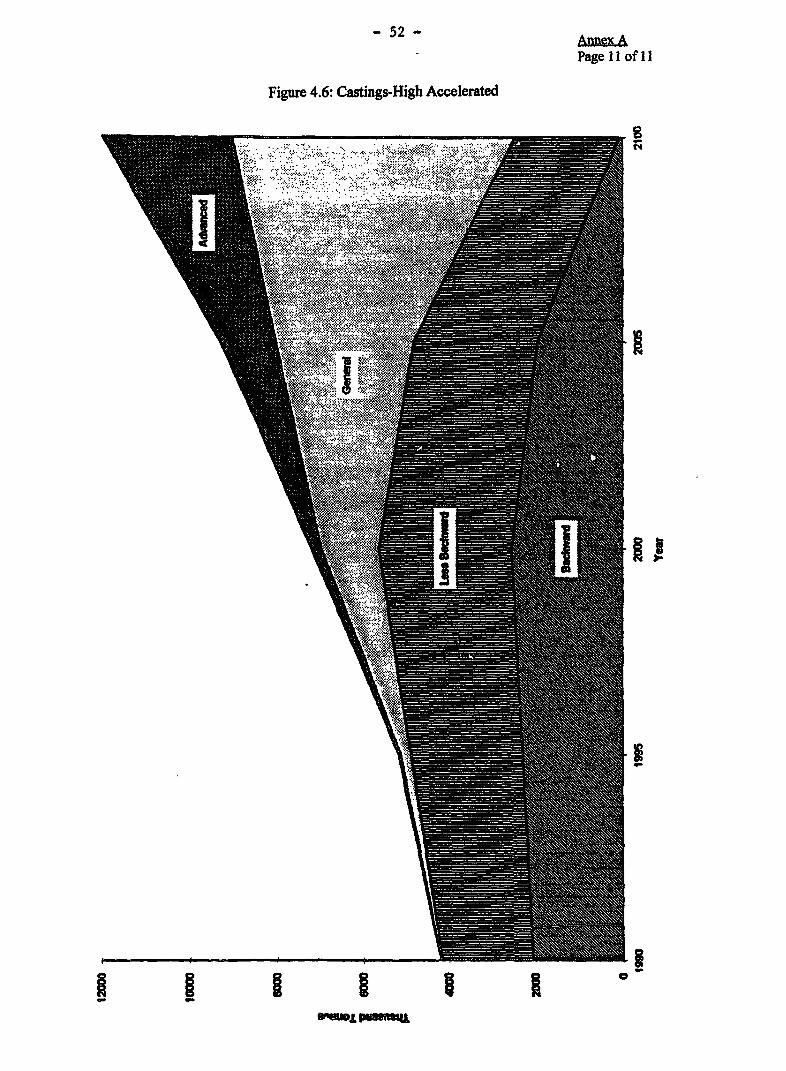
- 52- AnnxAPage 11 of 11
Figure 4.6: Castings-High Accelerated
U~~ I i a 1
\S.
\x x

- 53- Annex IPage I of 2
Annex I. Output Shares Under Accelerated Scenarios
Table 1. Brickmaking: Output Under Accelerated Scenarios (billion pieces)Indigenous Natural Annular Annular Tunnel Tunnel Total
Drying Solid Hollow Solid HollowLow Acceleration
1990 31.30 379.00 5.44 1.26 0.30 0.12 417.421995 28.17 418.17 12.93 10.26 0.33 0.14 470.002000 0.00 386.75 45.54 46.24 10.83 10.64 500.002005 0.00 302.85 77.29 98.40 25.83 25.64 530.002010 0.00 146.13 109.07 201.33 46.83 46.64 550.00
High Acceleration
1990 31.30 379.00 5.44 1.26 0.30 0.12 417.421995 28.17 418.17 12.93 10.26 0.33 0.14 470.002000 0.00 352.19 51.42 47.92 24.33 24.14 500.002005 0.00 191.73 117.76 124.05 48.33 48.14 530.002010 0.00 0.07 99.36 294.10 78.33 78.14 550.00
Table 2. Brickmaldng: Coal Consumption and Emissions Under Accelerad ScenariosLow Acceleration High Accelemation
Coal C02 S02 Coal C02 S02mtce million t of million t mtce million t of million t
carbon carbon990 48.68 27.45 1.20 48.68 27.45 1.20
1995 53.75 30.34 1.32 53.75 30.34 1.322000 52.42 29.95 1.30 52.42 29.95 1.302005 51.76 30.07 1.30 51.76 30.07 1.302010 45.06 27.16 1.17 45.06 27.16 1.17

- 54 Annex IPage 2 of 2
Table 5. Metal Casting: Output Under Accelerated Scenarios (thousand tons)Backward Less Backward General Advanced Total
Low Acceleration1990 2058.00 2100.00 42.00 0.00 4200.001995 2296.26 2579.10 239.74 44.90 5160.002000 2647.00 3244.59 1084.37 194.04 7170.002005 2185.25 3260.56 2805.40 1024.56 9275.772100 604.46 2996.51 5998.54 2400.49 12000.00
High Acceleration1990 2058.00 2100.00 42.00 0.00 4200.001995 2296.26 2579.10 239.74 44.90 5160.002000 2540.11 3081.16 1325.26 223.47 7170.002005 1930.78 2854.12 3216.09 1274.78 9275.772100 78.89 2389.88 6564.99 2966.24 12000.00
Table 6. Metal Casting: Coal Consumption and Emissions Under Accelerated ScenariosLow Acceleration High Acceleration
Coal C02 S02 Coal C02 S02thousand thousand t of thousand t thousand thousand t of thousand ttce carbon tce carbon
1990 3032.40 2174.64 33.78 3032.40 2174.64 33.781995 3651.25 2611.54 40.06 3651.25 2611.54 40.062000 4846.39 3446.03 50.56 4786.86 3398.79 49.072005 5680.09 3938.86 51.74 5517.76 3792.31 47.652100 6390.77 4270.73 45.49 6085.53 3984.99 38.05

Table 1: Brickmaking Economic Cash Flow: Opftons Al and A2 (10,000 Yuan)Year 1 2 3 4 5 6 7 8 9 10
Option: Case: IAl MediumCapacity 50% 100% 100% 100%e 100% 100% 100% 100% s00% 100%/oInvestment 218.30 0.00 0.00 0.00 0.00 0.00 0.00 0.00 0.00 0.00Working Capital 90.00 10.00 0.00 0.00 0.00 0.00 0.00 0.00 0.00 0.00Operational Costs 76.33 152.66 152.66 152.66 152.66 152.66 152.66 152.66 152.66 152.66 IRevenues/Benefits 222.50 445.00 445.00 445.00 445.00 445.00 445.00 445.00 445.00 445.00Salvage/Retrieval of 100.00 0.00 0.00 0.00 0.00 0.00 0.00 0.00 0.00 100.00WKNet Benef (62.13) 282.34 292.34 292.34 292.34 292.34 292.34 292.34 292.34 392.34
INCREMENTAL CASH FLOW
Investment 218.30 0.00 0.00 0.00 0.00 0.00 0.00 0.00 0.00 0.00Working Capital 90.00 10.00 0.00 0.00 0.00 0.00 0.00 0.00 0.00 0.00Operational Costs (193.63) (117.30) (117.30) (117.30) (117.30) (117.30) (117.30) (117.30) (117.30) (117.30)Revenues/Benefits (222.50) 0.00 0.00 0.00 0.00 0.00 0.00 0.00 0.00 0.00Salvage/Retrieval of 100.00 0.00 0.00 0.00 0.00 0.00 0.00 0.00 0.00 100.00WKNet Benefit (237.17) 107.30 117.30 117.30 117.30 117.30 117.30 117.30 117.30 217.30IRR 47.20Yo%NPV (Y x 10A4) 370.51
. . .~~~~~~
ILF

Table 1 (cont)
Option: Case:A2 MedlumCapacty 50% 100% t00% 100% 000% 100% 000% 100% 100% 100%h 100%Investment 268.30 0.00 0.00 0.00 0.00 0.00 0.00 0.00 0.00 0.00Working Capital 0.00 0.00 0.00 0.00 0.00 0.00 0.00 0.00 0.00 0.00Operatfonal Costs 68.35 136.70 136.70 136.70 136.70 136.70 136.70 136.70 136.70 136.70RevenueslBeneltis 211.38 422.75 422.75 422.75 422.75 422.75 422.75 422.75 422.75 422.75Salvage/Retrieval of 100.00 0.00 0.00 0.00 0.00 0.00 0.00 0.00 0.00 0.00WKNet Benefit (25.28) 286.05 286.05 286.05 286.05 286.05 286.05 286.05 286.05 286.05
INCREMENTAL CASH FLOWInvestment 268.30 0.00 0.00 0.00 0.00 0.00 0.00 0.00 0.00 0.00Working Capital 0.00 0.00 0.00 0.00 0.00 0.00 0.00 0.00 0.00 0.00Operational Costs (201.61) (133.26) (133.26) (133.26) (133.26) (133.26) (133.26) (133.28) (133.26) (133.26)Revenues/Benefits (233.63) (22.25) (22.25) (22.25) (22.25) (22.25) (22.25) (22.25) (22.25) (22.25)Salvage/Retrieval of 0.00 0.00 0.00 0.00 0.00 0.00 0.00 0.00 0.00 0.00WKNetBenefit (300.32) 111.01 111.01 111.01 111.01 111.01 111.01 111.01 111.01 111.01IRR 34.38%NPV (Y x 10*4) 259.98
5 , .~~~~~~~~~~~'

Year 1 2 3 4 5 6 7 8 9 10
Option: Case: mAl Medium C
Capacity 50%O 100% 100% 100% 100% 100% 100% 100%K 100% 100%Investment 218.30 0 0 0 0 0 0 0 0 0 LKWorking Capital 90 10 0 0 0 0 0 0 0 0 3Operational Costs 74.83 149.66 149.66 149.66 149.66 149.66 149.66 149.66 149.66 149.66 -nRevenues/Benefits 222.50 445.00 445.00 445.00 445.00 445.00 445.00 445.00 445.00 445.00 6Salvage/Retrieval of 100 0 0 0 0 0 0 0 0 100 WKA 97.82 231.48 231.48 231.48 231.48 231 A8 231.48 231.48 231.48 231.48 oTaxes 52.71 119.58 119.58 119.58 119.58 119.58 119.58 119.58 119.58 119.58 uNet Benefit (113.34) 165.76 175.76 175.76 175.76 175.76 175.76 175.76 175.76 275.76 W-n
INCREMENTAL CASH FLOW 00
Investment 218.30 0 0 0 0 0 0 0 0 0 °Working Capital 90 10 0 0 0 0 0 0 0 0 U
Operational Costs (168.13) (93.30) (93.30) (93.30) (93.30) (93.30) (93.30) (93.30) (93.30) (93.30)RevenueslBeneflts (222.50) 0.00 0.00 0.00 0.00 0.00 0.00 0.00 0.00 0.00 ISalvage/Retrieval of 100 0 0 0 0 0 0 0 0 100 Cf
WK itA (76.18) 57.47 57.47 57.47 57.47 57.47 57.47 57.47 57.47 57.47 ~Taxes (44.15) 22.73 22.73 22.73 22.73 22.73 22.73 22.73 22.73 22.73 °Net Benefit (218.52) 60.57 70.67 70.57 70.57 70.57 70.57 70.57 70.57 170.57 8IRR 29.40% 0NPV (Y x 10A4) 164.85 U,
IL>

Table 2 (coat)
Option: Case:A2 MedlumCapacty 50W/ 100% 100% 10% 100% 100% 100%O% 100% 100% 100YoInvestment 268.3 0 0 0 0 0 0 0 0 0Working Capial 135 15 0 0 0 0 0 0 0 0OperatTonal Costs 67.00 134.00 134.00 134.00 134.00 134.00 134.00 134.00 134.00 134.00Revenues/Benefits 211.38 422.75 42275 422.75 422.75 422.75 422.75 422.75 422.75 422.75Salvage/Retrieval of 100.00 0.00 0.00 0.00 0.00 0.00 0.00 0.00 0.00 150.00WKA 83.23 214.29 21429 214.29 21429 21429 21429 214.29 21429 21429Taxes 46.23 111.38 111.38 111.38 111.38 111.38 111.38 111.38 111.38 111.38Net Benefit 05.16) 162.37 177.37 177.37 177.37 177.37 177.37 177.37 17737 327.37
INCREMENTAL CASH FLOWInvestnent 268.30 0.00 0.00 0.00 0.00 0.00 0.00 0.00 0.00 0.00Working Capital 135.00 15.00 0.00 0.00 0.00 0.00 0.00 0.00 0.00 0.00Operational Costs (175.96) (108.96) (108.96) (108.96) (108.96) (108.96) (108.96) (108.96) (108.96) (108.96)Revenues/Benefits (233.63) (22.25) (22.25) (22.25) (22.25) (22.25) (22.25) (22.25) (22.25) (22.25)Salvage/Retrieval of 100.00 0.00 0.00 0.00 0.00 0.00 0.00 0.00 0.00 150.00WKA (90.78) 40.28 40.28 40.28 40.28 40.28 40.28 40.28 40.28 40.28Taxes (50.62) 14.53 14.53 14.53 14.53 14.53 14.53 14.53 14.53 14.53Net Benefit (310.34) 57.18 72.18 72.18 72.18 72.18 72.18 72.18 72.18 222.18IRR 19.75%NPV (Y x lOA4) 102.63
(Dio _

-I
<Year 1 2 3 4 6 6 7 8 9 10 WOption: Case:61 Medirtm 3Capacity 50% 100%'f 100% 1 100% 100% 100% 100Y 100t% 100% 100%Investment 75.00 0.00 0.00 0.00 0.00 0.00 0.00 0.00 0.00 0.00 aWorking Capital 13.50 1.50 0.00 0.00 0,00 0.00 0.00 0.00 0.00 0.00Operational Costs 15.24 30A8 30.48 30.48 30.48 30.48 30.48 30.48 30.48 30.48 0Revenues/Benefits 31.71 63.41 63.41 63A1 63.41 63.41 63A1 63.41 63.41 63.41 3Salvage/ReWteval of 10.00 0.00 0.00 0.00 0.00 0.00 0.00 0.00 0.00 15.00WK
CNet Benefit (62.03) 31.43 32.93 32.93 32.93 32.93 32.93 32.93 32.93 47.93 m-n
INCREMENTAL CASH FLOW 3
0Investment 75.00 0.00 0.00 0.00 0.00 0.00 0.00 0.00 0.00 0.00 wWorking Capital 13.50 1.50 0.00 0.00 0.00 0.00 0.00 0.00 0.00 0.00 IOperational Costs (8.72) 6.52 6.52 6.52 6.52 6.52 6.52 6.52 6.52 6.52 ERevenues/Benefits (12.79) 18.91 18.91 18.91 18.91 18.91 18.91 18.91 18.91 18.91Salvage/Retrieval of 10.00 0.00 0.00 0.00 0.00 0.00 0.00 0.00 0.00 15.00WK
wANet Benefit (82.57) 10.89 12.39 12.39 12.39 12.39 12.39 12.39 12.39 27.39 2IRR 8.25%NPV (Y x t0^4) (11.14)
IoII

Table 3 (cont)
Option: Case:B2 MediumCapacity 50% 100% 100% 100% 100% 10 100% 100% 100% 100% 100%Investment 85.00 0.00 0.00 0.00 0.00 0.00 0.00 0.00 0.00 0.00Working CapItal 0.00 0.00 0.00 0.00 0.00 0.00 0.00 0.00 0.00 0.00Operational Costs 30.85 61.70 61.70 61.70 61.70 61.70 61.70 61.70 61.70 61.70Revenues/Beneffts 63.41 126.83 126.83 126.83 126.83 126.83 126.83 126.83 126.83 126.83Salvage/Retrieval of 20.00 0.00 0.00 0.00 0.00 0.00 0.00 0.00 0.00 0.00WKNet Benefit (32.44) 65.13 65.13 65.13 65.13 65.13 65.13 65.13 65.13 65.13INCREMENTAL CASH FLOW
0%Investment 85.00 0.00 0.00 0.00 0.00 0.00 0.00 0.00 0.00 0.00Working Capital 0.00 0.00 0.00 0.00 0.00 0.00 0.00 0.00 0.00 0.00Operational Costs (16.46) 14.39 14.39 14.39 14.39 14.39 14.39 14.39 14.39 14.39Revenues/Benefits (25.59) 37.83 37.83 37.83 37.83 37.83 37.83 37.83 37.83 37.83Salvage/Retrieval of 0.00 0.00 0.00 0.00 0.00 0.00 0.00 0.00 0.00 0.00WKNet Benefit (94.13) 23.44 23.44 23.44 23.44 23.44 23.44 23.44 23.44 23.44IRR 20.11%NPV (Y x 10^4) 27.45
Al

Table 3 (contj
Option: Case:B3 MediumCapacity 50% 100% 100% 100% 100%Y 100% 100%e 100 100% O100%Investment 110.50 0.00 0.00 0.00 0.00 0.00 0.00 0.00 0.00 0.00Working Capital 0.00 0.00 0.00 0.00 0.00 0.00 0.00 0.00 0.00 0.00Operational Costs 49.56 99.12 99.12 99.12 99.12 99.12 99.12 99.12 99.12 99.12Revenues/Benefits 126.83 253.65 253.65 253.65 253.65 253.65 253.65 253.65 253.65 253.65Salvage/Retrieval of 20.00 0.00 0.00 0.00 0.00 0.00 0.00 0.00 0.00 0.00WKNet Benefit (13.24) 154.53 154.53 154.53 154.53 154.53 154.53 154.53 154.53 154.53
INCREMENTAL CASH FLOW
IInvestment 110.50 0.00 0.00 0.00 0.00 0.00 0.00 0.00 0.00 0.00Working Capital 0.00 0.00 0.00 0.00 0.00 0.00 0.00 0.00 0.00 0.00Operational Costs (34.11) 15.45 15.45 15.45 15.45 15.45 15.45 15.45 15.45 15.45Revenues/Benefits (51.18) 75.65 75.65 75.65 75.65 75.65 75.65 75.65 75.65 75.65Salvage/Retrieval of 0.00 0.00 0.00 0.00 0.00 0.00 0.00 0.00 0.00 0.00WKNet Benefit (127.57) 60.20 60.20 60.20 60.20 60.20 60.20 60.20 60.20 60.20IRR 45.59%NPV (Y x 10A4) 172.50
e L

-I
Year 1 2 3 4 5 6 7 8 9 10Option: Case: -Bt Medlum
Capacity 50% 100% 100% 100% 100% 100% 1 100% 100% 100% 100% 0
Investment 75 0 0 0 0 0 0 0 0 0Working Capital 13.5 1.5 0 0 0 0 0 0 0 0 -nOperatonal Costs 14.52 29.04 29.04 29.04 29.04 29.04 29.04 29.04 29.04 29.04 5'Revenues/Benefits 31.71 63.41 63.41 63.41 63A1 63.41 63.41 63.41 63A1 63.41 3SalvagelRetrieval of 10 0 0 0 0 0 0 n 0 15 IWK -A 5.59 20.78 20.78 20.78 20.78 20.78 20.78 20.78 20.78 20.78 0Taxes 4.21 12.21 12.21 12.21 12.21 12.21 12.21 12.21 12.21 12.21 = Net Benefit (65.52) 20.66 22.16 22.16 22.16 22.16 22.16 22.16 22.16 37.16
0INCREMENTAL CASH FLOW '
0
Investment 75 0 0 0 0 0 0 0 0 0 XWorking Capial 13.5 1.5 0 0 0 0 0 0 0 0 Operational Costs (6.74) 7.78 7.78 7.78 7.78 7.78 7.78 7.78 7.78 7.78 ERevenues/Benefits (12.79) 18.91 18.91 18.91 18.91 18.91 18.91 18.91 18.91 18.91 oSalvage/Rebieval of 10 0 0 0 0 0 0 0 0 15 Q.WK wA (14.85) 0.34 0.34 0.34 0.34 0.34 0.34 0.34 0.34 0.34Taxes (6.68) 1 33 1.33 1.33 1.33 1.33 1.33 1.33 1.33 1.33 oNet Benefit (77.88) 8.31 9.81 9.81 9.81 9.81 9.81 9.81 9.81 24.81 °IRR 5.02% 0
NPV (Y x t0^4) (19.25)
0~~~09>i

Table 4 (cont)
Option: Case:B2 MediumCapacity 50% 100%o 100% 100% 100%e 100%o 100% 100% 100%e 100o%Investment 85 0 0 0 0 0 0 0 0 0Working Capital 27 3 0 0 0 0 0 0 0 0Operational Costs 30.85 61.70 61.70 61.70 61.70 61.70 61.70 61.70 61.70 61.70Revenues/Benefits 63.41 126.83 126.83 126.83 126.83 126.83 126.83 126.83 126.83 126.83Salvage/Retrieval of 20.00 0.00 0.00 0.00 0.00 0.00 0.00 0.00 0.00 30.00WKA 15.87 44.44 44.44 44.44 44.44 44.44 44.44 44.44 44.44 44.44Taxes 10.27 25.56 25.56 25.56 25.56 25.56 25.56 25.56 25.56 25.56Net Benefit (69.71) 36.56 39.56 39.56 39.56 39.56 39.56 39.56 39.56 69.56
INCREMENTAL CASH FLOW
Investment 85.00 0.00 0.00 0.00 0.00 0.00 0.00 0.00 0.00 0.00Working Capital 27.00 3.00 0.00 0.00 0.00 0.00 0.00 0.00 0.00 0.00Operational Costs (16.46) 14.39 14.39 14.39 14.39 14.39 14.39 14.39 14.39 14.39Revenues/Benefits (25.59) 37.83 37.83 37.83 37.83 37.83 37.83 37.83 37.83 37.83Salvage/Retrieval of 20.00 0.00 0.00 0.00 0.00 0.00 0.00 0.00 0.00 30.00WKA (20.22) 8.35 8.35 8.35 8.35 8.35 8.35 8.35 8.35 8.35Taxes (9.61) 5.69 5.69 5.69 5.69 5.69 5.69 5.69 5.69 5.69Net Benefit (91.52) 14.75 17.75 17.75 17.75 17.75 17.75 17.75 17.75 47.75IRR 14.75%NPV (Y x 104) 9.99

'abIl 4 (cont)
Option: Case:B3 MediumCapacity 50% 100%O 100% 100% 100% 100% 100% 100% 100% 100%Investment 110.5 0 0 0 0 0 0 0 0 0Working Capital 54 6 0 0 0 0 0 0 0 0Operationai Costs 48.21 96.42 98.42 98.42 96.42 96.42 96.42 98.42 98.42 96.42Revenues/Benefits 126.83 253.65 253.65 253.65 253.65 253.65 253.65 253.65 253.65 253.65Salvage/Retrieval of 20.00 0.00 0.Q0 0.00 0.00 0.00 0.00 0.00 0.00 60.00WKA 51.18 121.80 121.80 121.80 121.80 121.80 121.80 121.80 121.80 121.80Taxes 28.23 64.15 64.15 64.15 64.15 84.15 64.15 64.15 64.15 64.15Net Benefit (94.11) 87.08 93.08 93.08 93.08 93.08 93.08 93.08 93.08 153.08 ci
INCREMENTAL CASH FLOW
Investment 110.50 0.00 0.00 0.00 0.00 0.00 0.00 0.00 0.00 0.00Working Capital .4.00 6.00 0.00 0.00 0.00 0.00 0.00 0.00 0.00 0.00Operational Costs (Y7.90) 20.31 20.31 20.31 20.31 20.31 20.31 20.31 20.31 20.31Revenues/Benefits (51.18) 75.65 75.65 75.65 75.65 75.65 75.65 75.65 75.65 75.65Salvage/Retrieval of 20.00 0.00 0.00 0.00 0.00 0.00 0.00 0.00 0.00 60.00WKA (39.50) 31.12 31.12 31.12 31.12 31.12 31.12 31.12 31.12 31.12Taxes (18.85) 17.08 17.08 17.08 17.08 17.08 17.08 17.08 17.08 17.08Net Benefit (148.93) 32.26 38.26 38.26 38.26 38.26 38.26 38.26 38.26 98.26IRR 22.21%NPV (Y x 10^4) 63.60

yew1 1 2 3 4 5 6 7 a 9 10
Opton Case A1 Meiuml
B*CashPo B!CMiK 50°h 100%Y 101/6 100% 100%f 100o% 100i% 100Yo 10P/ IO%/ I
Investent 290.50 o.o o.o0 0.00 0.00 0.00 0.00 0.00 0.00 0.00
WoddngCapi 0.00 o.0 0.00 o.0o 0.00 0.00 0.00 o.o 000 0.00 m
Op0m0ondCods 512.34 1.024.67 1,024.67 1,02467 1,024.67 1,024.67 1,024.67 1,024.67 1,024.67 1,024.67 n
Re Feseneft 590.00 1,180.00 1,140.00 1,140.00 1,140.00 1,140.00 1,14Q0.0 1,140.00 1,140.00 1,140.00 D
Re vat oVM 0.00 0M 0.00 0.00 0.00 0.00 0.00 0.00 0.00 0.00 o
Emvr. Fine Paid aO0 o0.M 0.00 0.00 0.00 0.0 0.00 0.0 0.0 0.00
Net Benet (21284) 155.33 115.33 115.33 115.33 115.33 15.33 115.33 115.33 115.33 p
INCREMENTALCASH FLOW 5
Irvestment 290.50 o.0 0.00 0.00 0.00 0.00 o.oo 0.00 0.00 ao
uAdg cap 0.00 o.00 0.00 o.00 o.00 o.00 o.00 o.a0 0.00 0.00
OpmMoalbCosts 6.57) 225.77 225.77 225.77 225.77 225.77 225.77 225.77 225.77 225.77 0
R_anumnet (30M.00) 290.00 250.0 250.00 250.00 250.00 250.00 25D.00 250.00 250.00
RetvloftW .o0 0.00 0.00 0.00 0.00 o.00 0.00 0.00 o.oo00 0.
Emwr. Fine Avoided 38.80 38.80 38.80 38.80 38.80 38.80 38.80 38.80 38.80 38.80
Net Benelt (265.14) 103.03 63.03 63.03 63.03 63.03 83.03 63.03 63.03 8303
IRR 22.85%°NPVO(x 1(N) 9502 CosVtCarboniduced 2824)A

Table 5 (cont)
Option CaseA2 MediumProject Cash Flow
Capac 50WY 100% 100%o 100% 1 1 1.00 1.00 1.00 1.00Inwestet 288.50 0.00 0.00 0.00 0 0 o.o00% 0 0 0
MbnCapita 000 0.00 0.00 0.00 0 0 0.00 0 0.00 0Opeatin Costs 491.84 98327 98327 98327 98327 98327 983.27 983.27 27 98327
Rev_mnsMeriefb 570.00 1,140.00 1.140.00 1,140.00 1,140.00 1,140.00 1,140.00 1,140.00 1,140.00 1,140.00RebAvaofVW 0.00 0.00 0.00 0.00 0.00 0.00 0.00 0o. 0.00 0.00Ew*. Fins Paid 0.00 0.00 0.00 0.00 0.00 0.00 0.00 0.00 0.00 0.00
Net Beneft (208.14) 158.73 158.73 158.73 158.73 15B.73 158.73 156.73 158.73 156.73
INCREMENTAL CASH FLOWN
hnvestenrt 286.50 0.00 0.00 0.00 0.00 0.00 0.00 0.00 0.00 0.00Wofddng CXap 0.00 0.00 0.0 0.0 0.00 0.00 0.00 0.00 0.00 0.00
CpmonalCosts (311.07) 180.57 180.57 180.57 180.57 180.57 180.57 180.57 180.57 180.57R (320.00 250.00 250.00 250.00 250.00 250.00 250.00 250.00 250.00 250.00
Rebivaof VK 0.00 0.00 000 0.00 0.00 0.00 O.00 0.00 0.00 0.00Envir. Fine Avoided 38.80 3880 38.80 38.80 38.80 38.80 38.80 38.80 38.80 38.80
Net BenefR (256.64) 10823 108.23 108.23 10823 10823 10823 10823 108.23 10823ORR 40.15%NPV Y x 10A4) 285.75 Cost Catbn mduod (85.77)
11

Year 1 2 3 4 5 6 7 8 9 10
Optbn CaseAl Mediu
0Caped SOY5 100Yo 100Ye 1C00% 1Y0 100W 100% 100l% 100Yo 100%/0
Iwnestme 290.50Woofl"CapiTE 282.60 31.40
Openx00S Costs 512.34 1,024.67 1,024.67 1,024.67 1,024.67 1,024.67 1,024.67 1,024.67 1,024.67 1.024.67 9PR _nasgeneft 590.00 1,180.00 1,180.0 180.0 1,180.00 1,8000 1,10. 1,180.00 1,180.00 1,180.00 a
ReIbvSIofV\1U 0.00 314.00A O252) 7.98 7.98 7.98 7.98 7.98 7.98 7.98 7.98 7.98
Taxes 2431 77.50 77.50 77.50 77.50 77.50 77.50 77.50 77.50 77.50 0Erhr. Fb ePWd O.00 0.00 0.00 0.00 0.00 0.00 0.00 0.00 0.00 0.00 !.
Net fBetst (495.44) 46.43 77.83 77.83 77.83 77.83 77.83 77.83 77.83 391.83 0
IREMENTAL CASHFLOW
hnvestmn 290.50 o.0 O. 0.00 0.00 0.00 0.00 0.00 0.00 0.00 °VWCddngaCiWta 282.6D 31.40 0.00 0.00 0.00 o.00 0.00 O.M0 0.00 0.00 0
OpdoaRolCosts (26.57) 225.77 225.77 225.77 225.77 225.77 225.77 225.77 225.77 225.77 1RemwmBmuse s MOO30) 290.0 290.00 290.00 290.00 290.0 290.00 290.00 290.00 290.0 0
RetrIeval ofW O00 O.00 OQO O.0 0.00 0.00 0.00 0.00 0.00 314.00 *A (67.55) (27.05) (27.05) (27.05) (27.05) (27.05) (27.05) (27.05) (27.05) (27.05)
Taxes (45.61) 7.57 7.57 7.57 7.57 7.57 7.57 7.57 7.67 7.57 *Emwr. FineAvoided 38.80 38.80 38.80 38.80 38.80 38.80 88.80 38.80 38.80 38.80 D
NetBenef (50212) 64.06 96.46 95.46 95.46 95.46 95.46 95.46 95.46 409.46IRR 15.680/oNPV(YxIOf4) 81.88
_ L

Table 6 (cOnt)
OpSon CaseA2 Medun
CaaIKty 50Yo 100°h 100%S 100%PM 100%° 100%/0 100 100%o 100% 100%/onwestmnt 288.60 0.00 0.00 0 0.00 0.00 0.00 0.00 0.00 0.00
VWoddnkgCapit 2808 31.20 0.00 0.0 0.0 0.00 0.0 0.00 0.00 0.00OptdondalCosts 490.3 980.71 980.71 980.71 980.71 960.71 980.71 980.71 980.71 980.71
Aelto 570.00 1,140.00 1,140.00 1,140.00 1,140.00 1,40.00 1,140.00 1,140.00 1,140.00 1,140.00RebWMaofWK 0.00 0.00 0.00 0.00 0.00 o.00 0.00 0.00 0.00 312.00
A (M86M) 15.14 15.14 15.14 15.14 15.14 15.14 15.14 15.14 15.14Taxes 24.60 77.81 7781 77.81 77.81 77.81 77.81 77.81 77.81 77.81
Enl. Fis Paid o.00 o.0 0.00 0.00 o.o0 o.00 o.00 0.00 0.00 o.o0NetBenefk (487.88) 50.28 81.48 81.4b 81.48 81.48 81.48 81.48 81.48 393.48
co
CRMEN TAL CASH FLOW
InwesTment 286.50 0.00 0.00 0.00 0.00 0.00 O. 0.00 0.00 0.00V CbddnCapkie 280.80 31.20 0.00 O.00 0.00 0.00 0.0 0.00 0.00 0.00
Opeatioli Costs (308.55) 181.81 181.81 181.81 181.81 181.81 181.81 181.81 181.81 181.81Revem (sEne S 320.00) 250.00 250.00 250.00 250. 250.00 250.00 250.00 250.00 250.00
Rebi;SfVa00W0 0.00 0.00 0.0 0.00 0.00 o.0o o.0 o.0 312.00A (63.63) (19.89) (19.89 (19.89) (19.89 (19.89 (19.8-b (19.89) (19.89) (19.8)
Taxes (45.32) 7.88 7.88 7.88 7.88 7.88 7.88 7.88 7.88 7.88Envr. Fie Avokded 38.80 38.80 38.80 38.80 38.80 38.80 38.80 38.80 38.80 38.80
NetBeneft (494.83) 67.91 99.11 99.11 99.11 99.11 99.11 99.11 99.11 411.11IRR 16.79%NPV rYx 10^4) 105.43
11S

Year 1 2 3 4 5 6 7 8 9 10Opbon Case
S1 Medium 2:C"dChEbw
Capa*d 50 i/0 101fi/. 100% 100% 100% 100% 100% 100% 10% / -InesbTnt 612.50 0.00 0.00 0.00 0.00 0.00 0.00 0.00 0.o0 0.00o
WodciCapial 21281 23.65 0.00 O.C0 0.00 0.00 0.00 0.00 0.00 0.00Opelal1 1Costs 375.32 750.63 750.63 750.63 750.63 750.63 750.63 750.63 750.63 750.63
R P Pfiq 484.50 969.00 969.00 96.00 969.00 969.00 969.00 969.00 969.00 969.00 iRebievaofVWK 0.00 0.00 0.00 0.00 0.00 0.00 0.00 0.00 0.00 236.45 :
A (15.6 62.97 62.97 62.97 62.97 62.97 62.97 62.97 62.97 62.97Taxes 24.32 85.95 85.95 85.95 85.95 85.95 85.95 85.95 85.95 85.95
Envi.FinePad 17.55 35.10 35.10 35.10 35.10 35.10 35.10 35.10 35.10 35.10 1NethBenlt (716.12) 108.77 132.42 t342 132.42 132.42 13242 132.42 13242 368.87 =
INCREMENTAL CASH FLOW
hwesenert 61250 0.00 0.0o O.OD o. 0.00 0.00 0.00 0.00 0.00 Wo"il Capiad l21281 23.65 0.00 0.00 0.00 0.00 0.00 0.00 o.0 0.00
Opetinail Costs (423.59 (48.27) (4827) (4827) (4827) (4827) (4827) (4827 (4827) (4827) ORsve5dsSwks ('05.5M 79.00 79.00 79.00 79.00 79.00 79.00 79.00 79.00 79.00 o
Rebiwu of WK 0.00 0.00 0.00 0.00 0.00 0.00 0.00 0.00 0.00 236.45 0A (50.72) 27.94 27.94 27.94 27.94 27.94 27.94 27.94 27.94 27.94 O
Taxes (45.61) 16.03 16.03 16.03 16.03 16.03 16.03 16.03 16.03 16.03Envir. Fine Avoided 21.25 3.70 3.70 3.70 3.70 3. 3.70 3.70 3.70 370
Netbeneft (740.36) 91.30 114.94 114.94 114.94 114.94 114.94 114.94 114.94 351.39IRR 10.01%NPV (Yx 104) (56.93
1K
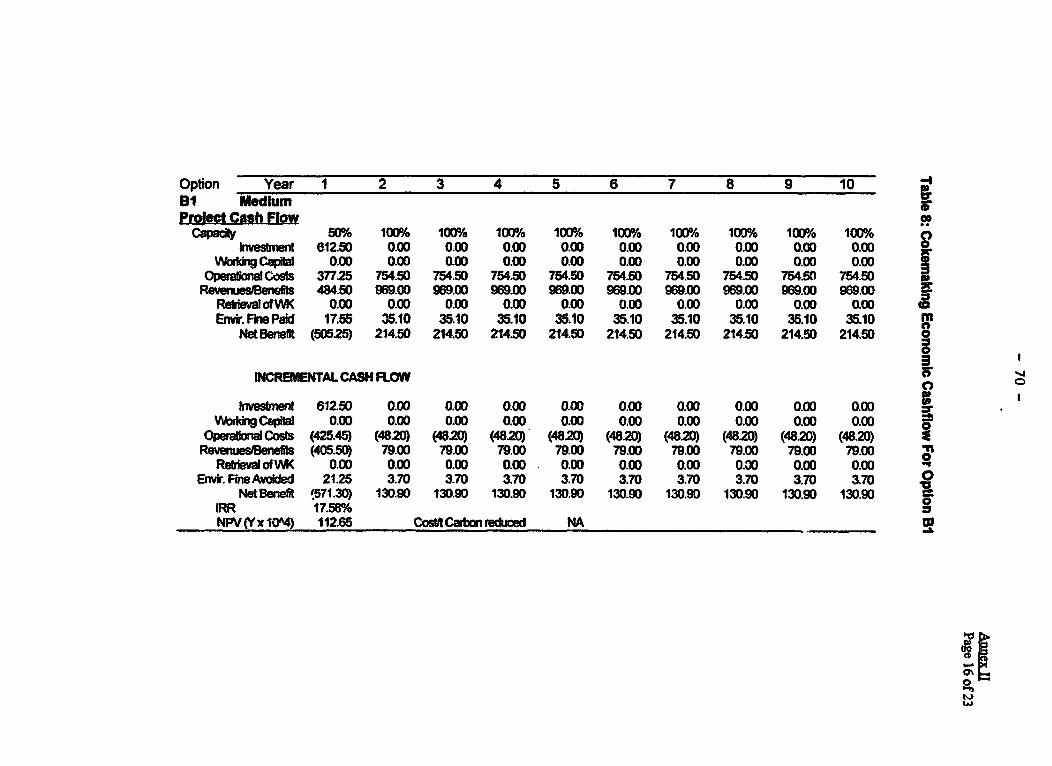
Option Year 1 2 3 4 5 6 7 8 9 10 0Si Medium EEProetg Cash Flw
CapadIy 50% 100% 100% o 100%o 100% 100% 100% 100% 100% 100%/ C)knresment 612.50 0.00 0.00 0.00 0.00 0.00 0.00 0.00 0.00 0.00 0Attciug 0.00 0.00 0.00 0.00 0.00 0.00 0.00 0.00 0.00 0.00 Opemlona Costs 37725 754.50 754.50 754.50 754.50 754. 754.50 754.0 754.5n 754.50 IRevemesklenet ms 484.50 969.00 959.00 96900 9690 960 96.0 969.00 969.00 969.C0
RebiJoefVWK 0.00 0.00 0.00 0.00 0.00 0.00 0.00 0.00 0.00 0.00 3Envir. Fie Paid 17.55 35.10 35.10 35.10 35.10 35.10 35.10 35.10 35.10 35.10
NeBeneimt (50525) 214.50 214.50 214.50 214.50 214.50 214.50 214.50 214.50 214.50 84CREMENTAtLCASH R-OW
0
invesnmen 612.50 0.00 0.00 0.00 0.00 0.00 0.00 0.00 0.00 0.o0V*bingCapi 000 0.00 0.00 0.00 0.00 0.00 0.00 0.00 0.00 0.00
OpwakomWCosts (425.45) (4820) (4820) (4820) (4820) (4820) (4820) (4820) (4820) (48.20)Revemuesenees (405.50) 79.00 79.00 79.00 79.00 79.00 79.00 79.00 79.00 79.00 In
RebiB fVWK 0.00 O.00 0.00 0.00 0.00 0.00 0.00 0.00 0.00 0.00 REnvir. FineAvoided 2125 3.70 3.70 3.70 3.70 3.70 3.70 3.70 3.70 3.70 0Netbftv W571.30) 130.90 130.90 130.90 130.90 130.90 130.90 130.90 130.90 130.90
IR 17.%/o 0NPV (Y x14) 1t265 Costft Carbnreduod NA _ _
. ,~It'x

A6.OYear 1 2 3 4 5 6 7 8 S 10 11 12 13 14 15A6.1 OutpA ofwkh 0% 50°h 100%o 100D% 100%o 100%0o 10 100%h 100%h 100%0G 100% 100° 100° 100% 100%o
P*dA 62 Tok Cost (1,374) 13,168 25,59 25,5092,59 25,509 25,509 25,59 2 5,509 269 25,09 25,509 25,509 25,09 16X34 I
A62L1 rwNesbrnt 22113 9,477 (2,16A622 Opelon cos (23,857) (488) 18,441 18,441 18,441 18,441 18,441 18,441 18,441 18,441 18.441 18,441 18,441 18,441 18,441
A623 Taxes (3,155) 652 7,008 7,068 7,08 7,068 7,068 7,068 7,068 7,068 7.008 7,068 7,068 7,008 7,068 78A6.3 Curnert hd 3,525 3,525 (7,050)
A 6.4 BoneMi (28,114) 2297 32,707 32,70 32,707 32,707 32,707 32,707 32,707 32707 32,70732,707 32,707 32,707 32,707AUWStet9eneft (28,740) (10,870) 7,197 7,197 7,197 7,197 7,197 7,197 7,197 7,197 7,197 7,197 7,197 7,197 16,403
A6.6 Resu" IRR 15.03%YONPV(Y0 6.00
Table tO Eco c An adysls Cashlw of Caslng Cae A (bcmn Aalsts)
A6.1 Outpt of wfh 0% 50%h 100%o 100%o 100% 100%o 100% 100%o 100%P 100%h 100%o 100% 10%o 10CPh 100%
A62 Tol Cost (1.961) 9,116 18,790 18,790 18,790 iB.790 18,790 18,790 18,790 18,790 18,790 18,790 18,790 18,790 16,635A62.1 nvesbTert 22,113 9,477 (t,156)
A 622 Opealon cost (24,064) (361) 18,790 18,790 18,790 18,790 18,790 18,790 18,790 18,790 18,790 18,790 18,790 18,790 18,790A6.3Cunentfbnd 0 0 0 I
A6A BeneSt (28,114) 2,297 32,7073Z,703Z7032,707 2707 32,707 32707 32707 3,707 32707 3270732,707 32707A6.5NetBenerwt (2,163) (6,82 13,917 13,917 13,917 13,917 13,917 13,917 13,917 13,917 13,917 13,917 13,917 13,917 16,072
A 6.6 Resut IRR 32.70%NPV(Y10M 42886
s 1>~~~~~~~~~I

-I
Table 11. Financial Analysts Cashflow of Casting Case B (Incremental Analysis)
B6.1 wOutlpofvh 0% 30% 80% 10% 100Yo 100% 100 Yo 100% 100% 10D%100% 100h% 1001% 10o 1 00/o
B 62 Tot Cost (.0) (Z132) 557 3.207 3.207 3,207 3,207 3,207 3,207 3,t0 3,207 3,207 3,207 3,207 288
962.1 twestmen 6,951 29 (1.133)
96.2.2 Operaton st (9,389) (5,439) 6 1,328 1,328 1,328 1,328 1,328 13 1,328 1, 1,32 ,328 11 1,328
B62-3Taxes (1,061) (65) 1,162 1,879 1.879 1,879 1,879 1,879 1,879 1,879 1,879 1,879 1.879 1,87 1,879 '
B6.3 Current d 893 893 (1,786 3B 6.4 Bonet (10,398 (5.538) 23 5,803 5,803 5, 03 5,83 5,803 5803 5,83Q 5,803 5,803 5,803 5,803 5,803 0
85 Net Bernm (7,792 (3AM06) 2,006 2,596 2,598 2.596 25925 2,598 29 2.59 26.6 2,596 ,Z598 5,514 3B6.6RdSu tRR 17.97%
NPVY10' 3.73 o
Ar"ex Tab"s 12 Ecomnanl Analysis CasNhfiwoof Caslg Case B (Incmmntm Ana lyss)
P ~~~~~~~~~~~~~~~~~~~2
6 6.1 OuptAof wfth 0%/ 30%o 80% 100%/ 100% 100%/ 100%/ 100%a 100% 100%* 100%/ 100%/ 1000% 100%/ 100%/
projectB6.2TotaICot (2,59 (2,418) (389) 1.614 1.614 1,614 1,614 1.614 1,614 1,614 1,614 1,614 1.614 1,614 482 .
B6.2.1 Investrtnt 6,951 2,979 (1,133) W
B6.220pemaoncsot (949n) (5AM37) (389) 1,614 1.614 1,614 1.614 1,614 1,614 1,614 1,614 1,614 1.614 1,814 1,614 '
B63Cunentfund 0 0 0
8 64 Beneft (10,398 (5,58 2563 S,803 5,803 5,803 5,803 5,803 5,803 5,803 5,803 5,803 5,803 5,803 5,803
B6.5NetBenel (7,859) (3.119) 2g951 4,188 4,188 4,188 4,188 4,188 4,188 4.188 4,188 4,188 4,188 4,188 5,321 1B6.6 Resut IRR 28.490/ %
NPVI(YIO%) 11.27
ar
co
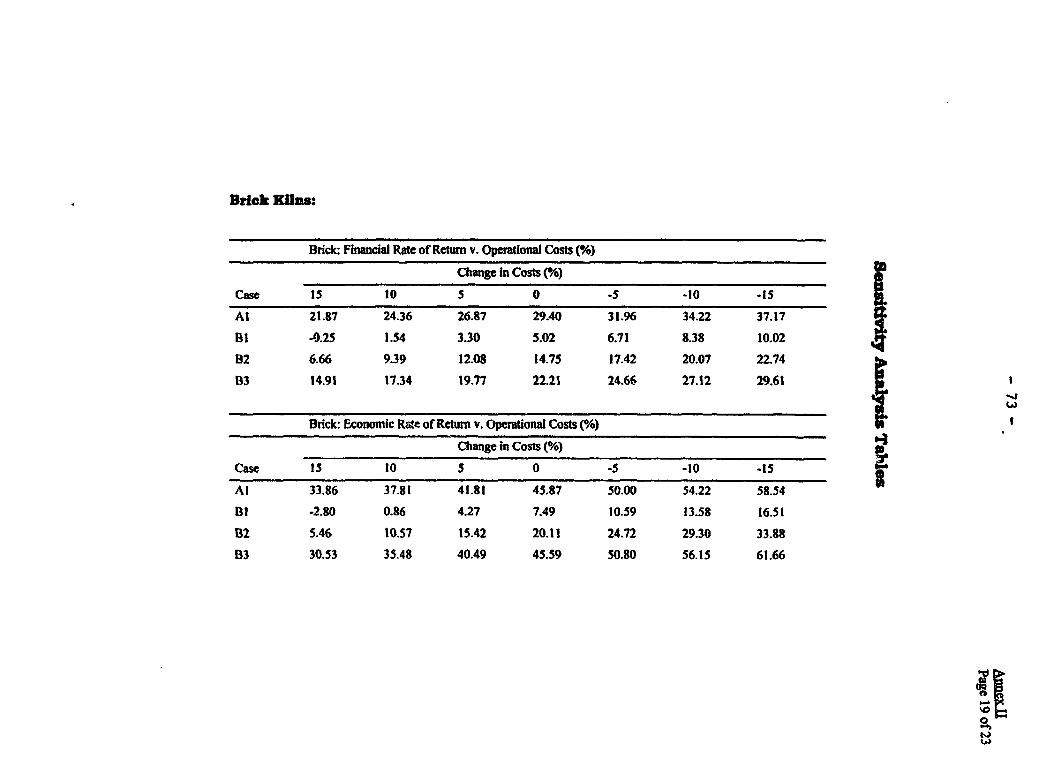
Brick KUns:
Brick: Financial Rate of Return v. Operational Costs (0%)
Change In Costs (%)
Case 1S 10 5 0 -5 -10 -1I
Al 21.87 24.36 26.87 29A0 31.96 34.22 37.17 I11 -0.25 1.S4 3.30 5.02 6.71 8.38 10.02
82 6.66 9.39 12.08 14.75 17.42 20.07 22.74
B3 14.91 17.34 19.77 22.21 24.66 27.12 29.61
Brick: Economic Rate of Return v. Operational Costs (%/6)
Change in Costs (%)
Case 15 10 5 0 -5 -10 -IS
A1 33.86 37.81 41.81 45.87 50.00 54.22 58.54
B11 -2.80 0.86 4.27 7.49 10.59 13.58 16.51
82 5.46 10.57 15.42 20.11 24.72 29.30 33.88
B3 30.53 35.48 40.49 45.59 50.80 56.15 61.66
11E

Brick: Financial Rate of Return v. Brick Prices (°)
Change in Prices (%)
Case 15 10 5 0 -5 -10 -1I
Al 26.63 27.51 28.43 29.40 30.42 31.49 32.62
Bl 7.57 6.74 5.89 5.02 4.13 3.22 2.29
B2 18.21 17.08 15.93 14.75 13.55 12.31 11.04
13 25.97 24.75 23.49 22.21 20.89 19.54 18.16
Brick: Economic Rate of Return v. Brick Prices (%)
Change in Prices (°)
Case 15 10 S 0 -5 -10 -15
Al 39.76 41.64 43.67 45.87 48.26 50.86 53.72
Bl1 12.05 10.59 9.08 7.49 5.83 4.08 2.23
132 26.00 24.13 22.17 20.! 17.95 15.67 13.25
B3 51.66 A).72 47.70 45.59 43.37 41.04 38.59
Brick: Rate of Return v. Capital Costs (%)
Change in Costs (%/)
Economic Financial
Case 25 0 -25 25 0 -25
Al 36.51 45.87 60.02 23.40 29.40 38.56
Bl 2.71 7.49 14.44 2.25 5.02 9.00
B2 14.13 20.11 28.88 11.01 14.75 20.14
B3 36.42 45.59 59.33 18.36 22.21 27.40
CXDE0
* IL~~~~~~~~~~~~~~~~~~~~~~

Coke Oven: Financial Rate of Return v. Operational Costs (%)
Change in Costs (%/o)
Case 15 10 5 0 -S -10 -15
Al -6.04 1.26 8.46 15.68 23.06 30.68 38.64
A2 -4.17 2.85 9.80 16.79 23.95 31.34 39.07
B -2.91 1.54 5.83 10.01 14.12 18.2 22.28
Coke Oven: Economic Rate of Retun v. Operational Costs (%)
Change in Costs (%/9)
Case IS 10 S 0 -5 -10 -15
Al <0 <0 <0 22.85 52.37 85.71 126.92
A2 <0 <0 15.06 40.15 67.16 99.36 139.77
B -21.61 -3.81 7.67 17.58 26.96 36.29 45.83
0~~~~~~~~~~~
Coke Oven: Financial Rate of Return v. Coke Prices (%/e) n
Change in Prices (%) gCase 15 10 5 0 -5 -to -15
Al 18.80 17.79 16.75 15.68 14.57 13.43 12.24
A2 19.89 18.89 17.86 16.79 15.69 14.55 13.37
B 10.13 10.09 10.05 10.01 9.97 9.93 9.88
Coke Oven: Economic Rate of Return v. Coke Prices (%)
Change in Prices (Yo)
Case 15 10 5 0 -5 -10 -15
Al 32.75 29.92 26.66 22.85 18.29 12.66 5.29
A2 46.28 44.48 42.45 40.15 37.52 34.47 30.90
B 17.15 17.28 17.42 17.58 17.74 17.97 18.11 jl
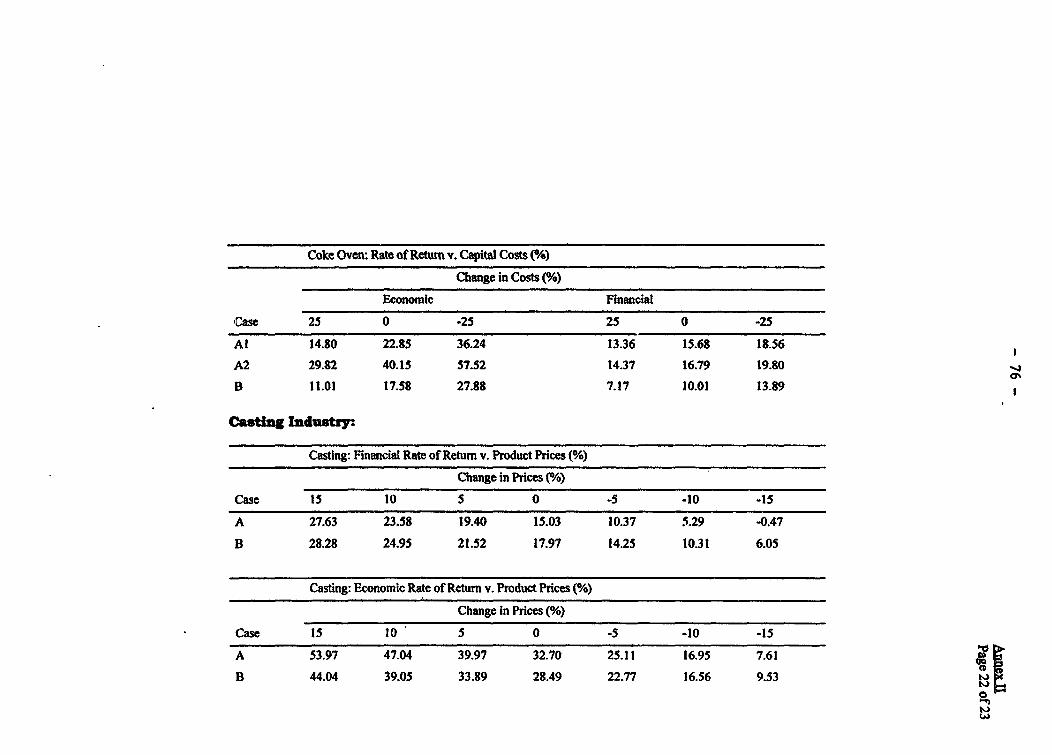
Coke Oven: Rate of Retum v. Capital Costs (%)
Change in Costs (Yo)
Economic Financial
Case 25 0 -25 25 0 -25
Al 14.80 22.85 36.24 13.36 15.68 18.56
A2 29.82 40.15 57.52 14.37 16.79 t9.80
B 11.01 17.58 27.88 7.17 10.01 13.89
Casting Industry:
Casting: Financial Rate of Return v. Product Prices (%)
Change in Prices (%)
Case 15 10 5 0 -5 -10 -15
A 27.63 23.58 19.40 15.03 10.37 5.29 -0.47
B 28.28 24.95 21.52 17.97 14.25 10.31 6.05
Casting: Economic Rate of Return v. Product Prices (°/O)
Change in Prices (%)
Case 15 10 5 0 -5 -10 -15
A 53.97 47.04 39.97 32.70 25.11 16.95 7.61
B 44.04 39.05 33.89 28.49 22.77 16.56 9.53 IL

Casting: Financial Rate of Retum v. Operational Costs (%/6)
Change in Costs (%o)
Case IS 10 5 0 -S -10 -15
A 3.34 7.44 11.31 15.03 18.64 22.19 25.69
B 9.0S 12.11 15.07 17.97 20.83 23.65 26.46
Casting: Economic Rate of Return v. Operational Costs (%)
Change in Costs (%)
Case 15 10 5 0 -S -10 -15
A 15.80 21.74 27.33 32.70 37.93 43.07 48.14
B 15.98 20.38 24.52 28.49 32.31 36.03 39.66
Casting: Rate of Return v. Capital Costs (%/*)
Change in Costs (°)
Economic Financial
Case 25 0 -25 25 0 -25
A 11.64 32.70 41.03 26.95 15.03 9.70
B 23.55 28.49 35.53 14.19 17.97 23.29
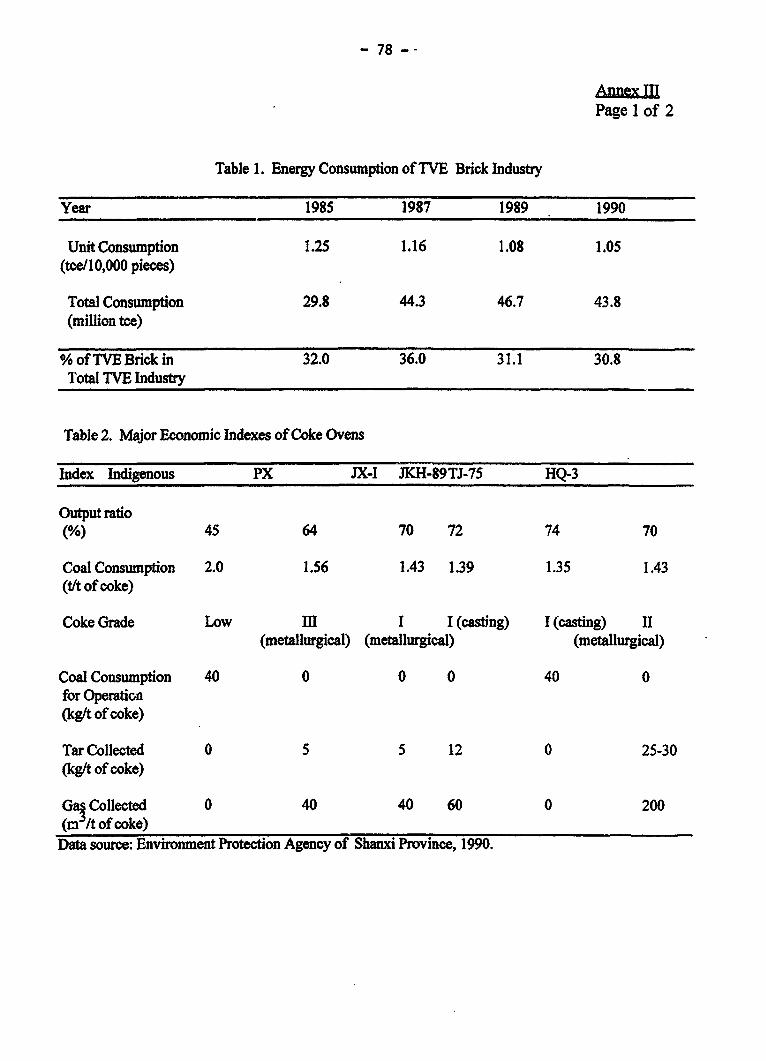
- 78 --
Annex IJPage 1 of 2
Table 1. Energy Consumption of TVE Brick Industry
Year 1985 1987 1989 1990
Unit Consumption 1.25 1.16 1.08 1.05(tce/I0,000 pieces)
Total Consumption 29.8 44.3 46.7 43.8(million tce)
%ofTVEBrickin 32.0 36.0 31.1 30.8Total TVE Industry
Table 2. Major Economic Indexes of Coke Ovens
Index Indigenous PX JX-I JKH-89TJ-75 HQ-3
Output ratio(%) 45 64 70 72 74 70
Coal Consumption 2.0 1.56 1.43 1.39 1.35 1.43(t/t of coke)
Coke Grade Low m I I (casting) I (casting) II(metallurgical) (metallurgical) (metallurgical)
Coal Consumption 40 0 0 0 40 0for Operation(kg/t of coke)
Tar Collected 0 5 5 12 0 25-30(kg/t of coke)
Ga3 Collected 0 40 40 60 0 200(r /t of coke)
Data source: Environment Protection Agency of Shanxi Province, 1990.

- 79 -
Annex II[Page 2 of 2
Table 3. Comprehensive Energy Consumption of Metal Casting Industry(kgce/ton of casting)
Industry Casted Steel Pig Iron Fine Casting Ferrous Die Casting
Heavy Machinery 1,700-2,200 750-1,180
Mining Machinery 1,200-1,800 630-1,020
Engineering Mach. 900-1,259 521-782 3,5004,500
Standard & General Mach. 532-762
StreamPropelling Machine 1,000-1,300 700-800 2,500-3,000 1,800-2,000
Boiler 550-600 2,500-3,000 1,800-2,000
General Mach. 1,000-1,3000 700-800 2,500-3,000 1,800-2,000
Intemal 450-750 3,100-3,500 1,800-2,300Combustion Engine
Tractor 950-1,300 450-650 3,100-3,500 -1,800
Agro-Machinery 668-807 1,454-2,056
Large Electric 539.1 971.7Engine
Y-system 800-410 290.1Electric Engine
Heavy-Duty Truck 380-480
Medium-Duty Truck 700-900 2,200-3,200 1,800-2,000
Light-Duty Truck 2,920 650-850
Optical histrument 792.8 5,546.69 2,216.3 3,466
Automation Instument 792.8 5,546.69 2,216.3 3 ,466
Machine Tool 600-850Data source: JBJ14-86 Standard of the Minisry of Machinery and Electronics, China.

Annex IV- 80 -- Pagelof2
Annex IV. Brick Industry: Additional Information
Table 1. Comparison of UK and Chinese TVE Brick Industries
UK Chinese TVETotal annual brick 4,000 mi!;ion 400,000 millionproductionKiln Technology 50% tunnel 90 % Hoffman
41% other cont. 8% primitive9% intermittent 2% other
Typical Plant Size 35M bricks/yr IOM bricks/yrProductivity 500k bricks/man- 87k bricks/man-
year yearFuel Type 70%/o premium ?95% premium
6% added body fuel ?5% body fuel24% inherent b. fuel
Premium Fuel Type 80% gas P>90% coal10O electricity7o coal3% oil
Overall/Best Premium 2.1 /0.5 1.05 /0.7Fuel Consumption(tce/10000 bricks)
Sources: UK: "Fuel Usage in the Manufacture of Clay Building Bricks",Ceram Res Paper 790, 1990.
Table 2. ETSU Assessment of Application of Artificial Drying
Plant Size lOin bricks pa (intia) Plant Size SOm bricks pa (afterdrier)
Estimated capital cost $40K $IOOKOutput improvements Sm bricks pa 16m bricks paRec-ired margin for a payback of $4/thousand $3/thousand*<2 yea
*Comparisons of sees price with operating costs in the 'Case Study Reporf (Section 2-2) suggests thatthis margin is bug L .iiieved, although this appears rather high.
Table 3. ETSU Assessment of Application of Improved Driers
Capacity SOM bricks paCapil Cost $30KAnnual drier energy consumption (Gross) 100 TJ paEstimated savings* 20 TJ pa
-$18,000 paPayback period 1.6 years

-81 -Annex IVPage 2 of 2
Table 4. ETSU Assessment of Application of High Pressure Extrusion
Plant Size SOm bricks paMarginal additional cost of high pressure extrusion of $50Kpressing equipmentDJying energy saved 200 MJItAnmual energy saved 20 TJ paValue of saving* $18,000 paPayback period 2.5-3.0 years
*Figure assumes that driers require a 20% premium fuel use (in addition to heatrecovered from the kiln). The assumed price of gas or oil is $4.5/GJ.
Table S. ETSLJ Assessment of Application of Kiln Improvements
Plant Size Plant SizelOm bricks pa SOm bricks pa
Estimated additional capital costs $30K $75KAnnual coal consumption (tce) 700 3500Annual fuel cost saving* $2,400 $12,000Payback period > IO years 6 years
*Assumes a coal price of $17/tonne (CV = 26 GJ/tonne)
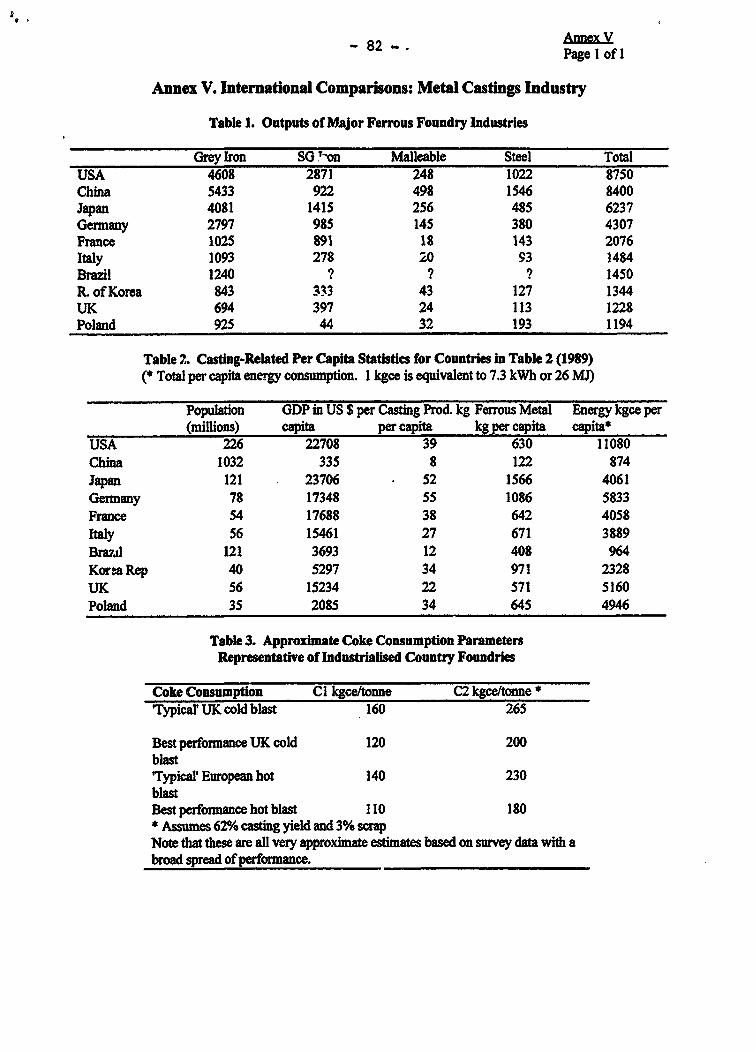
Annex V- 82 - - Page I of I
Annex V. Intemational Comparisons: Metal Castings Industry
Table 1. Outputs of Major Ferrous Foundry Industries
Grey ro SG -on Malleable Steel TotalUSA 4608 2871 248 1022 8750China 5433 922 498 1546 8400Japan 4081 1415 256 485 6237Germany 2797 985 145 380 4307France 1025 891 18 143 2076Italy 1093 278 20 93 1484Brazil 1240 ? ? ? 1450R. of Korea 843 333 43 127 1344UK 694 397 24 113 1228Poland 925 44 32 193 1194
Table 2. Casting-Related Per Capita Statistics for Countries in Table 2 (1989)(* Total per capita energy consumption. 1 kgce is equivalent to 7.3 kWh or 26 MJ)
Population GDP in US $ per Casting Prod. kg Ferrous Metal Energy kgce per(millions) capita per capita kg per capita capita*
USA 226 22708 39 630 11080China 1032 335 8 122 874Japan 121 23706 52 1566 4061Germany 78 17348 55 1086 5833France 54 17688 38 642 4058Italy 56 15461 27 671 3889BrazAI 121 3693 12 408 964KorM mRep 40 5297 34 971 2328UK 56 15234 22 571 5160Poland 35 2085 34 645 4946
Table 3. Approximate Coke Consumption ParametersRepresentative of Industrialised Country Foundries
Coke Consumption Cl kgcettonne C2 kgce/tonne *
Tpical' UK cold blast 160 265
Best performance UK cold 120 200blastTypical' European hot 140 230blastBest performance hot blast 110 180* Assumes 62% casting yield and 3% scrapNote that these are all very approximate estimates based on smvey data with abroad spread of performance.

Joint UNDP/World BankENERGY SECTOR MANAGEMENT ASSISTANCE PROGRAMME (ESMAP)
LIST OF REPORTS ON COMPLETED ACTIVITES
Region/w Act7Wltpertitle Date Number
SUB-SAHARAN AFRICA (AFR)
Africa Regional Anglophone Africa Household Energy Workshop (English) 07/88 085/88Regional Power Seminar on Reducing Electric Power SystemLosses in Africa (English) 08/88 087/88
Insttional Evaluation of EGL (English) 02/89 098/89Biomass Mapping Regional Worksbops (English - Out of Prt) 05/89 -
Francophone Household Energy Workshop (French) 08/89 103/89Iterafrican Electrical Engineering Cclege: Proposals for Short-and Long-Term Development (English) 03/90 112/90
Biomass Assessment and Mapping (English - Out of Print) 03/90 --Angola Energy Assessment (English and Potguese) 05/89 4708-ANG
Power Rehabilitation and Technical Assistance (English) 10/91 142/91Benin Energy Assessment (English and French) 06/85 5222-BENBotswana Energy Assessment (English) 09/84 4998-BT
Pump Electrification Prefeasibility Study (English) 01/86 047/86Review of Electricity Service Comnection Policy (English) 07/87 071/87Tui Block Farms Electrification Study (English) 07/87 072/87Household Ener Issues Study (English - Out of Print) 02/88 -
Urban Household EnerW Strategy Study (English) 05/91 132/91Burkina Faso Energy Assessment (English and French) 01/86 5730-BUR
Techoical Asistance Program (English) 03/86 052/86Urban Household Energy Strategy Study (English and French) 06/91 134/91
Burudi Energy Assesment (English) 06/82 3778-BUPetroleum Supply Management (English) 01/84 012/84
s Report (English and French) 02/84 011/84Presentaion of Energy ThXojects for the Fourth Five-Year Plan(1983-1987) (English and French) 05/85 036/85
Improved Charcoal Cookstove Strategy (English and French) 09/85 042/85Peat Utization Project (Eglish) 11/85 046/85Energy Assssm (English and French) 01/92 9215-BU
Cape Verde Energy Assessment (Engish and Portuguese) 08/84 5073-CVHousehold Energy Strategy Study (Engish) 02/90 110/90
Centrl AfricanRepublic Energy Assessement (French) 08/92 9898-CAR
Cbad Elements of Strategy for Urban Household EnergyThe Case of N'djamena (Fench) 12/93 160/94
Comoros Energy Assessment (English and French) 01/88 7104-COMCongo Energy Asssmen (English) 01/88 6420-COB
Power Development Plan (English and French) 03/90 106/90Cote d'Ivoire Energy Assessment nglish and French) 04/85 5250-IVC
Improved Biomass Utilizadon (English and French) 04/87 069/87Power System Efficiency Study (Out of Print) 12/87 --
Power Sector Efficiency Study (French) 02/92 140/91Ethiopia Energy Assement (English) 07/84 4741-ET

-2 -
Regin/Cow" Aci/Rport le Daue Number
Ethiopia Power System Efficiency Study (English) 10/85 045/85Agriculatual Residue Briquetting Pflot Project (English) 12/86 062/86Bagasse Study (English) 12/86 163/86Cooking Efficiency Project English) 12/87 --
Gabon Energy Assessment (Englsh) 07/88 6915-GAThe Gambia Energy Assesment (English) 11/83 4743-GM
Solar Water Heating Retrofit Project (English) 02/85 030/85Solar Photovoltaic Applications (English) 03/85 032/85Petroleum Supply Maagement Assistanc: (English) 04/85 035/85
Ghana Energy Assessment nglish) 11/86 6234-GHEnergy Rtionalization in the Industrial Sector (English) 06/88 084/88Sawmill Residues Utlization Study (English) 11/88 074/87Industrial Energy Efficiency (English) 11/92 148/92
Guinea Energy Assessnment (Out of Print) 11/86 6137-GUIHousehold Energy Strategy (English and French) 01/94 163/94
Guinea-Bissau Energy Assesment (Egish and Portuguese) 08/84 5083-GUBRecommended Technical Assistance Projects (Englsh &Portuguese) 04/85 033/85
Management Options for the Electric Power and Water SupplySubsectors (Eaglish) 02/90 100/90
Power and Water Isttutional Retructring (French) 04/91 118/91Kenya Er Assessmt (English) 05/82 3800-KE
Power System Efficiency Study (English) 03/84 014/84Stas Report (Engish) 05/84 016/84Coal Conversion Action Plan (Engish - Out of Print) 02/87 --Solar Water Heatig Study (English) 02/87 066/87Pen-Urban Woodfuel Development (Englis) 10/87 076/87Power Master Plan (English - Out of Print) 11/87 -
Lesotho Energy Assessment (English) 01/84 4676-LSOLiberia Energy Asseme (English) 12/84 5279-LBR
Recommeded Technical Assistance Projecs (English) 06/85 038/85Power System Efficiency Study (English) 12/87 081/87
Madagas Energy Assessment (English) 01/87 5700-MAGPower System Efficiency Study (English and French) 12/87 075/87
Malawi Energy Assessmem (English) 08/82 3903-MALTechnical Assisnce to Improve the Efficiency of FuelwoodUse in the Tobacco Industry (Egish) 11/83 009/83
Stas Report (English) 01/84 013/84Mali Energy Assessment (English and French) 11/91 8423-MLI
Household Energy Strategy (English and French) 03/92 147/92IslamiC Republicof Maurtania Energy Assesment (English and Prench) 04/85 5224-MAU
Household Energy Strategy Study (English and French) 07/90 123/90Mauritius Energy Assement (English) 12/81 3510-MAS
Stas Report (Eglish) 10/83 008/83Power System Efficiency Audit (English) 05/87 070/87Bagasse Power Potential (English) 10/87 077/87
Mozambique Energy Assmen (English) 01/87 6128-MOZHousehold Electricity Utization Study (EngIs) 03/90 113/90
Namibia Energy Assessme (English) 03/93 11320-NAM

-3-
R8gionCo/w,Uty Actit7l/Repeft Dle Date Number
Niger Energy Assemnt (French) 05/84 4642-NIRStatus Report (English and French) 02/86 051/86Improved Stoves Project (Englih and French) 12187 080/87Household Energy Conservation and Substitudon (Englishand French) 01/88 082/88
Nigeria Energy Assessment (English) 08/83 4440-UNIEnergy Assessment (English) 07/93 11672-UNI
Rwanda Er. v Assessment (English) 06/82 3779-RWEL- Assessment (English and French) 07/91 8017-RWStatus Report (English and French) 05/84 017/84Improved Charcoal Cooksiove Strategy (English and French) 08/86 059/86Improved Charcoal Production Techniques (English and French) 02/87 065/87Commeldzadon of Improved Charcoal Stoves and Carbonization
Techniques Mid-Term Progress Report (English and french) 12/91 141/91SAL,C SADC Regional Power Interconnecti6n Study, Vol. I-IV (English) 12/93 -
SADCC SADCC Regional Sector: Regional Capacity-Building Programfor Energy Surveys and Policy Analysis (English) 11/91 -
Sao Tomeand Principe Energy Assessment (English) 10/85 5803-STP
Senegal Energy Assessment (Enlish) 07/83 4182-SEStatus Report (English and French) 10/84 025/84Industrial Energy Conservation Study (Eaglish) 05/85 037/85Preparary Assistance for Donor Meeting (English and French) 04/86 056/86Urban Household Energy Strategy (English) 02/89 096/89ntrial Energy Conservation Program 05/94 165/94
Seychelles Energy Assesmen (English) 01/84 4693-SEYElectric Power Syem Efficienq Study (English) 08/84 021/84
Sierra Leone Energy Asement (English) 10/87 6597-SLSomalia Energy Asemen (English) 12/85 5796-SOSudan Mangement Assistance to the Ministry of Energy and Mining 05/83 003/83
Energy Assessment (English) 07/83 4511-SUPower System Efficiency Study (English) 06/84 018/84Status Report (English) 11/84 026/84Wood Energy/Forestry Feasibility (English - i.; if Print) 07/87 073/87
Swaziland Energy Assment (English) 02/87 6262-SWTanzania Energy Assessment (English) 11/84 4969-TA
Peri-Urban Woodfuels Feasibility Study (English) 08/88 086/88Tobacco Curing Efficiency Study (English) 05/89 102/89Remote Sensing and Mapping of Woodlands (En6lish) 06/90 -
Industrial Energy Efficiency Technical Assistance(English - Out of Print) 08/90 122/90
Togo Energy Assessment (English) 06/85 5221-TOWood Recovery in the Nangbeto Lake (English and French) 04/86 055/86Power Efficiency Improvement (English and French) 12/87 078/87
Uganda Energy Assessment nglish) 07/83 4453-UGStats Report (English) 08/84 020/84Insdtutional Review of the Energy Sector (English) 01/85 029/85Energy Efficiency in Tobacco Curing Industry (English) 02/86 049/86Fuelwood/Forestry Feasiblifty Study (Engiish) 03/86 053/86Power System Efficiency Study (English) 12/88 092/88
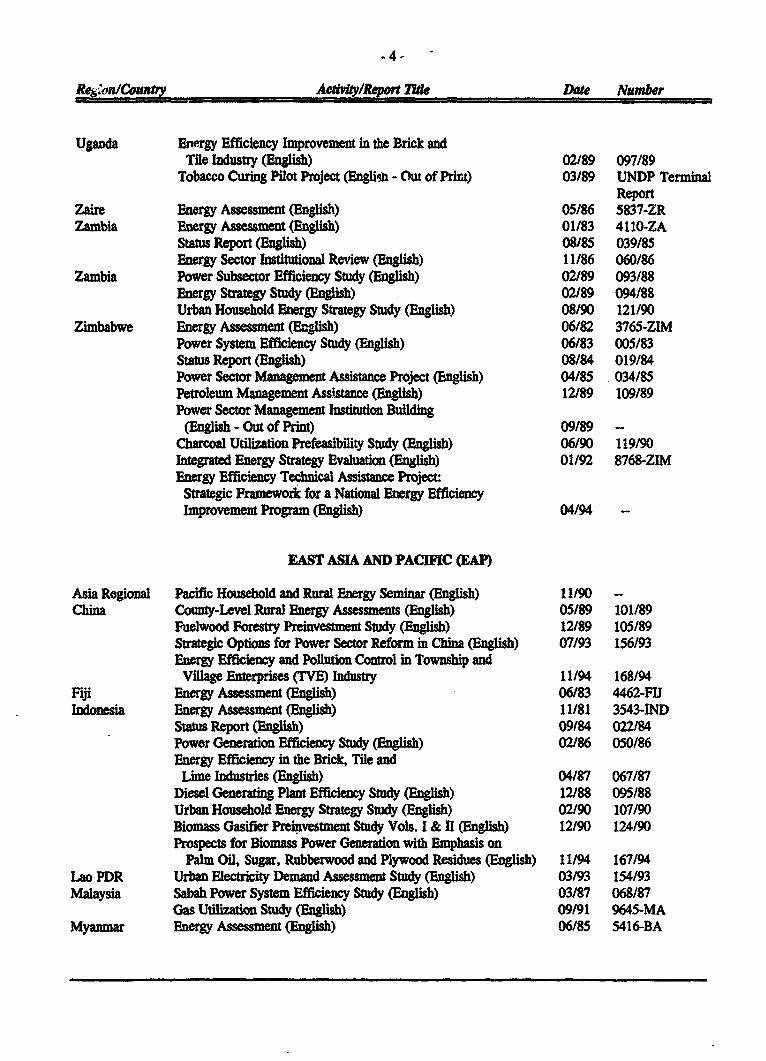
-4.- -
Rtes n/Counh Actii*y/Report TIte Date Number
Uganda Energy Efficiency Improvement in the Brick andTile Industry (Enlish) 02/89 097/89
Tobacco Curing Pilot Project (Englisn - Out of Prit) 03/89 UNDP TerminalReport
Zaire Energy Assessment (English) 05/86 5837-ZRZambia Energy Assment (English) 01/83 4110-ZA
Status Report (English) 08/85 039/85Energy Sector Institudonal Review (English) 11/86 060/86
Zambia Power Substr Efficiency Study (Elh) 02/89 093/88Energy Strategy Study nlish) 02/89 094/88Urban Household Energy Strategy Study (English) 08/90 121/90
Zimbabwe Energy Asse men (Eih) 06/82 3765-ZIMPower System Efficiency Study (English) 06/83 005/83Stas Report (English) 08/84 019/84Power Sector Management Assistance Project (English) 04/85 034/85Petroleum Management Assistance (English) 12/89 109/89Power Sector Management Insiudon Building
(English - Out of Print) 09/89 -
Charcoal Utilization Prefeasibility Study (Englsh) 06/90 119/90Integrated Energy Strategy Evaluation (En"lish) 01/92 8768-ZIMEnergy Efficiency Technical Assist Project:Strategic Framework for a National Energy EfficiencyImprovement Program (English) 04/94
EAST ASIA AND PACIC (EAP)
Asia Regional Pacific Household and Rural Energy Seminar (Engish) 11/90China County-Level Rural Energy Assesm (Englis) 05/89 101/89
Fuelwood Foresty Preinvestment Study (English) 12/89 105/89Steic Options for Power Sector Reform in China (English) 07/93 156/93Energy Efficiency and Pollution Control in Township andVillage Enterprises (IE) Industry 11/94 168/94
Fiji Energy Assessment ngish) 06/83 4462-FIJIndonesia Energy Assessment (English) 11/81 3543-IND
Stats Report (English) 09184 022/84Power Generation Efficiency Study (English) 02/86 050/86Energy Efficiency in the Brick, Tile andLime Industries (Eglish) 04/87 067/87
Diesel Generating Plant Efficiency Study (English) 12/88 095/88Urban Household Energy Strategy Study (English) 02/90 107/90Biomass Gasifier Preinvestmn Study Vols. I & II (English) 12/90 124/90Prospects for Biomass Power Generation with Emphasis on
Palm Oil, Sugar, Rubberwood and Plywood Residues (English) 11/94 167/94Lao PDR Urban Electricity Demand Assement Study (English) 03/93 154/93Malaysia Sabah Power System Efficiency Study (English) 03/87 068/87
Gas Utilization Study (English) 09/91 9645-MAMyanmar Energy Assessment (English) 06/85 5416-BA

-5-
Region/Co wa by Acdvity/Reporl ZltJe Date Number
Papua NewGuinea Energy Assessment (English) 06/82 3882-PNG
Status Report (Engish) 07/83 006/83Energy Straegy Paper (Englsh - Out of Print) - --
Insitudonal Review in the Energy Sector (English) 10/84 023/84Power Tarff Study (Englsh) 10/84 024/84
Pbilippinas Commercial Potential for Power Production fromAgricultual Residues (English) 12/93 157/93
Solomon Islands Energy Assesment (English) 06/83 4404-SOLEnergy Assessment (English) 01/92 979/SOL
South Pacific Petroleum Transport in the South Pacific (English-Out of PriLt) 05/86 --Thailand Energy Assessment (Engish) 09/85 5793-TH
Rural Energy Issues and Opttons (English - Out of Prnt) 09/85 044/85Accelerated Disseminaon of Improved Stoves andCharcoal Kilns (English - Out of Print) 09/87 079/87
Northeast Region Village Forestry and WoodfuelsPreinvestanent Study (English) 02/88 083/88
Impact of Lower Oil Prices (Eglish) 08/88 -
Coal Development and Utilizaton Study (English) 10/89 -
Tonga Energy Assesmen (EngliSh) 06/85 5498-TONVaout Energy Assessmn (EngIh) 06/85 5577-VAVietnam Rural and Household Energy-Lsues and Options (English) 01/94 161/94Western Samoa Energy Assessment (Englsh) 06/85 5497-WSO
SOUTH ASIA (SAS)
Bangldesh Energy Assessme (Engish) 10/82 3873-BDPriority Investment Progra= 05/83 002/83Status Report (Eglish) 04/84 015/84Power System Efficiency Study (English) 02/85 031/85Smal Scale Uses of Gas Prefeasibilit Study (English -(Out of Print) 12/88 -
India Opportnities for Commercialization of NonconventionalEaergy Systems (English) 11/88 091/88
Maharashtra Bagase Energy Efficiency Project (English) 05/91 120/91Mini-Hydro Development on Irrigation Dams andCanal Drops Vols. I, II and Im Enlsh) 07/91 139/91
WimdFarm Pre-Investment Study (English) 12/92 150/92Power Sector Reform Seminar 04/94 166/94
Nepal Energy Assmet (Engih) 08/83 4474-NEPStatus Report (Eglish) 01/85 028/84Energy Efficiency & Fuel Substitution in Industries (English) 06/93 158/93
Pakistan Household Energy Asssm (English - Out of Print) 05/88 -
Assessment of Photovoltaic Programs, Applications, andMarkets (English) 10/89 103/89
National Household Energy Survey and Strategy FomulationStudy: Project Terminal Report (English) 03/94 -
Sri Lanka Energy Assessment (English) 05/82 3792-CE

-6-
R}egion/C. witry Acdvl*y/Reponml. Date Nwnber
Sri Lana Power System Loss Reduction Study (Eaglish) 07/83 007/83Status Report (English) 01/84 010/84
Sri Lanka Industra Energy Conservation Study (English) 03/86 054/86
EUROPE AND CENTRAL ASIA (ECA)
Eastem Europe The Fuure of Natural Gas in Eastern Europe (English) 08/92 149/92Poland Energy Sector Restructming Program Vols. I-V (English) 01/93 153/93Portugal Energy Assessment (English) 04/84 4824-POTurkey Energy Assemen (English) 03/83 3877-TU
MEDDLE EAST AND NORTH AFUCA (MNA)
Morocco Energy Assessment (English and French) 03/84 4157-MORStatss Report (English and French) 01/86 048/86
Syria Energy Assessment (English) 05/86 5822-SYRElectric Power Efficiency Study (Engish) 09/88 089/88Energy Efficiency Improement in the Cement Sector (English) 04/89 099/89Fiergy Efficiency Improvement in the Fertilizer SectorEnglish) 06/90 115/90
Tunisia Fuel Substiution (English and French) 03/90 -
Power Efficiency Study (English and French) 02/92 136/91Energy Mmagement Strategy in the Resial andTerti Sectors (English) 04/92 146/92
Yemen Energy Assessment (English) 12/84 4892-YAREnergy Investmaet Priorities (Engis - Out of Pri) 02/87 6376-YARHousehold Energy Strategy Study Phase I (English) 03/91 126/91
LATIN AMERICA AND TBE CARIBBEAN (LAC)
LAC Regional Regiona Seminar on Electric Power System Loss Reductionin the Caribbean (English) 07/89 -
Bolivia Energy Assessment (English) 04/83 4213-BONational Energy Plan (English) 12/87 -
National Energy Plan (Spanish) 08/91 131/91- La Paz Private Power Technical Assistace (English) 11/90 111/90
Natual Gas Distrbtion: Economics and Regulation (English) 03/92 125/92Prefeasibilizy Evaluation Rural Electrification and DemandAssmnt (English and Spanish) 04/91 129/91
Private Power Generation and Transmission (English) 01/92 137/91Household Rural Energy Strategy (English and Spanis) 01/94 162/94Natural Gas Sector Policies and Issues (English and Spanish) 12/93 164/93
Chile Energy Sector Review (English - Out of Print) 08/88 7129-CHColombia Energy Strategy Paper (English) 12/86 -
Costa Rica Energy Assesment (Egish and Spanish) 01/84 4655-CRRecommended Technical Assistance Projects (English) 11/84 027/84Forest Residues Utilizaticm Study (English and Spanish) 02/90 108/90
DominicanRepublic Energy Assement (English) 05/91 8234-DO
7 -
Reginl/Cogwy AcLi/Rept TIWa Date Number
Eicuador Energ Assessment (Spanish) 12/85 5865-ECEnergy Strategy Phase I (Spanis) 07/88 -
Ecuador Energy Strategy (English) 04/91 -Private Minhydropower Development Study (English) 11/92 --
Energy Pricng Subsidies and Inerfiuel Substitution (English) 08/94 11798-ECEnerg Pricing, Poverty and Social Mitigation (English) 08/94 12831-EC
Guatemala Issues and Options in the Energy Sector (English) 09/93 12160-GUHaiti Energy Assesst m; 'z^! Ft-nch) 06/82 3672-HA
Status Report (Englisb and French) 08/85 041/85Haiti Household Energy Stratjy (English and French) 12/91 143/91Honduras Energy Assessment (English) 08/87 6476-HO
Petroleum Supply Managemen (English) 03/91 128/91Jamaica Energy Assesmen (English) 04/85 5466-JM
Petroleum Procurement, tefining, andDistribution Stady (English) 11/86 061/86
Energy Efficiency Building Code Phase I (Eglish-Out of Print) 03/88 -
Energy Efficiency Standards andLabels Phase I (English -Out of Print) 03/88 -
Management Information System Phase I (English - Out of Print) 03/88 -
Charcoal Production Project (English) 09/88 090/88FIDCO Sawmir Residues Utilization Study (English) 09/88 088/88Energy Sector Strategy and Investment Planng Study (English) 07/92 135/92
Mexico Improved Charcoal Production Within Forest Management for 08/91 138/91the State of Veracruz (English and Spanish)
Pansma Power System Efficiency Study (Englih - Out of Print) 06/83 004/83Paraguay Energy Assessment (English) 10/84 5145-PA
Recommended Technical Assistance Projects (Englith-(Out of Print) 09/85 -
Status Report (English and Spanish) 09/85 043/85Peru Energy Assmen (English) 01/84 4677-PE
Status Report (English - Out of Print) 08/85 040/85Proposal for a Stove Dissemination Program in
the Sierra (English and Spanish) 02/87 064/87Energy Strategy (Engfish and Spanish) 12/90 -
Study of Energy Taxation and Liberaizationof the Hydrocarbons Sector (English and Spanish) 120/93 159/93
Saint Lucia Energy Assmen(English) 09/84 5111-SLUSt. Vincent andthe Grenadines Energy Assement (English) 09/84 51e3-STVTrinidad andTobago Energy Assement (English - Out of Print) 12/85 5930-TR
GLOBAL
Energy End Use Efficiency: Research and StraegyEnglish - Out of Print) 11/89 -
Guideines for Utilty Customer Management andMetering (English and Spanish) 07/91 -
Women and Energy-A Reource Gude

Region/Country Actvly/Repert kle Date Number
The International Network: Policies and Experience (English) 04/90Assessment of Personal Computer Models for EnergyPlanning in Developing Countries (English) 10/91 --
Long-Term Gas Contacs Principles and Applicadons (English) 02/93 152/93Comparative Behavior of Firns Under Public and PrivateOwnership (English) 05/93 155/93
12/01/94

m- -
ESMAPc/o Industry and Energy DepartmentThe World Bank1818 H Street, N. W.Washington, D. C. 20433U.S.A.