report no. 18727 impact evaluation report
TRANSCRIPT

Report No. 18727
Impact Evaluation ReportBuilding Institutions and Financing Local Development:Lessons from Brazil and the PhilippinesMunicipal Development Project in the State of Parana (Loan 3100-BR)Municipal Development Project in the State of Rio Grande do Sul (Loan 3129-BR)
Municipal Development Project in the Philippines (Loan 2435-PH)Second Municipal Development Project in the Philippines (Loan 3146-PH)
December 18, 1998
Operations Evaluation Department
Document of the World Bank
Pub
lic D
iscl
osur
e A
utho
rized
Pub
lic D
iscl
osur
e A
utho
rized
Pub
lic D
iscl
osur
e A
utho
rized
Pub
lic D
iscl
osur
e A
utho
rized

Currency Equivalents
Currency Unit = Brazilian Reals (R$)(As of December 1998)US$1.00 = R$1.20
Currency Unit = Philippines Pesos (P)(As of December 1998)US$1.00 = P39.1
Abbreviations and Acronyms
Brazil:BANRISUL RGS State Commercial BankFAP Financial action planFUNDOPIMES RGS State Urban Development FundFDU Parani State Urban Development FundICR Implementation Completion ReportMDP Municipal development fundOED Operations Evaluation DepartmentPAR Performance Audit ReportParandCidade Parani State Urban Development Fund (under IDB)PEDU MDP in the State of ParandPIMES MDP in the State of Rio Grande do SulRGS Rio Grande do Sul
Philippines:BLGF Bureau of Local Government FinanceCPO Central Project OfficeDOF Department of FinanceDPWH Department of Public Works and HighwaysIRA Internal Revenue AllotmentLGA Local Government AcademyLGU Local Government UnitLOGOFIND Local Government Finance and Development ProjectMDF Municipal Development FundMDP Municipal Development ProjectRPTA Real Property Tax Administration
Fiscal Year: Brazil and Philippines
Government: January 1 -December 31
Director-General, Operations Evaluation : Mr. Robert PicciottoDirector, Operations Evaluation Department : Ms. Elizabeth McAllisterManager, Sector and Thematic Evaluations : Mr. Roger SladeTask Manager : Mr. Kyu Sik Lee

The World BankWashington, D.C. 20433
U.S.A.
Office of the Director-GeneralOperations Evaluation
December 18, 1998
MEMORANDUM TO THE EXECUTIVE DIRECTORS AND THE PRESIDENT
SUBJECT: Impact Evaluation ReportBuilding Institutions and Financing Local Development:Lessons from Brazil and the Philippines
Municipal Development Project in the State of Parana (Loan 3100-BR)Municipal Development Project in the State of Rio Grande do Sul (Loan 3129-BR)Municipal Development Project in the Philippines (Loan 2435-PH)Second Municipal Development Project in the Philippines (Loan 3146-PH)
Sixty three of 75 countries with more than five million people are now pursuing decentralizationpolicies that devolve functions and responsibilities to local governments, but the process ofdecentralization is severely constrained by a lack of institutional capacity among local governments,limited resource mobilization at the local level, and limited access to long-term financing for investmentprograms. Municipal development projects (MDP) aim at mitigating these constraints. Since early 1980s,16 Bank-financed MDPs have been completed in 11 countries, and 19 more MDPs in 15 countries arecurrently being implemented with total lending reaching US$2 billion.
This study assesses the impacts of MDPs on the institutional capacity building of localgovernments for fiscal and financial management and for planning and implementation of investmentprograms. It also assesses direct impacts on the beneficiaries as anticipated by the projects, and indirectside-effects on the development of local economies focusing on employment and income generation. Thestudy evaluates the impacts of two successful MDPs each in the Philippines and Brazil. They provide arich base for the study to extract lessons for ongoing and future projects. Three sets of data were collectedand analyzed: municipal finance data of local governments, a sample survey of mayors on capacitybuilding, and a survey of stall-holders in public markets. At both the municipal and the beneficiary levels,the study compared impacts on the participating municipalities with conditions of the non-participatingmunicipalities, and the initial conditions with the impacts after the project implementation.
The Brazil and Philippines MDPs were almost identical in their objectives and design but haddifferent implementation strategies. In Brazil, a statewide "wholesale approach" allowed as manymunicipalities as possible to participate in the fiscal reform program with a technically simple projectsuch as street paving. In the Philippines, a more selective approach allowed a smaller number of eligiblemunicipalities to finance revenue-generating projects such as public markets. In both countries, theprograms had two main instruments: fiscal and financial reform and investment programs. To apply for asub-loan, a municipal government had to submit a financial action plan with a comprehensive reform
2
package. The preparation and implementation of investment sub-projects in turn enhanced institutionalcapacity by offering experience in every phase of a project cycle from feasibility study to constructionwork.
The analyses of the data produced the following results: MDP participating municipalities inBrazil and the Philippines outperformed non-participants on municipal financial autonomy. Furthermore,the deeper the MDP finance, the greater the MDP impact upon participants. Thus, participantmunicipalities relied upon their own revenues to a greater extent than non-participants and succeeded inmobilizing more of these revenues. Property tax collection responded well to the project. Participatingmunicipalities also did much better in direct cost recovery through levying and collecting bettermentcharges. To remain creditworthy, participant municipalities were more successful than others in balancingtheir budgets. Thus, the extensive municipal finance data point to significant MDP impact on thestrengthening of municipal fiscal and financial management.
The results of a survey of mayors in Rio Grande do Sul highlight their awareness of theimprovements made under the MDP project. Participant municipalities valued most highly theinstitutional development interventions aimed at making resource management more efficient andimproving the management of investment sub-projects, which included better procurement procedures.Professional training, information technology, and community participation were also highly valued.Municipality awareness of these advances had an important side-effect: successful participants openlypromoted the MDP project and its principles among municipalities still not involved.
A case study of the MDP-financed public market in Pulilan in the Philippines shows that theproject had significant impact on the development of the local economy. The project not only stimulatedemployment and income generation, it also triggered the development of a new business center near thepublic market, which had significant spill-over effects.
The study concludes that the MDP operations helped reform at the local level; municipalities areaware that participation is a commitment to reform; improved fiscal performance goes hand in hand withmanagement strengthening that gives mayors a more entrepreneurial view of their administration; andmunicipalities are more sensitive to MDP impacts the deeper MDP funding goes. Based on thesefindings, the study recommends that MDP policy reform instruments be diversified to broaden projectimpacts; for successful impacts, good project design must be achieved as later course correction isdifficult; and competition among municipalities should be promoted through disseminating successstories. The most important element for overall success with long-term sustainability, however, is in asound policy and fiscal decentralization framework, since participating municipalities should eventually"graduate" from the MDP program, which is a transitory institutional mechanism, and should startborrowing from the capital market.

Contents
Preface............................................................................................................................................. v
1. Introduction ....................................................................................................................... I
Rationale for the Study ................................... .............. I
MDPs in Urban Lending.............................................1
Objectives, Scope, and Approaches to the Study................ ............ 2
Objectives.................................................2Scope....................................................2Approaches................................................2
Methods and Data................................................. 3
2. Evaluation Logic: Instruments and Expected Impacts......................5
MDP Project Objectives and Components, and Key Institutions ................. 5
Main Project Instruments and Expected Impacts2............................
Fiscal and Financial Reform Package..............................6Institutional Capacity Building through Investment Programs ............. 6Expected Development Impacts pa.......................................................6
3. Impacts on Municipal Fiscal and Financial Management ............. ....... 9
Introduction ...... as.................................................. 9
Municipal Financial Autonomy Versus Revenue Sharing............... ....... 9
Own Revenue Generation through Property Taxes .................... ...... 12
Direct Cost Recovery .............................................. 14
Budget Surplus/Deficit ........and.Financial.Manag ...................................... 16
Financial Deepening...................... ...................... ..... 18
4. Impacts on Local Government Capacity Building........................ 21
Introduction ..... n t ......... ......................................... 21
Field Surveys .............................................................. 21
Direct and Indirect Cost Recovery ............................. ........ 23
Local Financial Management ................................. ....... 24
Sub-project Management and Implementation g................................................... 25
Information Technology, Training, and Community Participation at the
Municipal Level................................................................................. 26Conclusions and Recommendations........................... ............. 28
5. Impacts on Local Economic Development ......................... ..... 29
Introduction CostRr...............y..................................... 29
The Public Market in Pulilan. ......................................... 29
Survey Results ................... ............................... 30
Change in Sales and Income................................... 30
This report was prepared by Mr. Kyn Sik Lee (Task Manager) and Mr. Roy Gilbert(Consultant). It was edited by Mr. William B. Hurlbut. Administrative assistance wasprovided by Ms. Romayne Pereira.

ii
Commuting ..................................... .......... 31Quality of Infrastructure Services........................... 31
Indirect Impacts ......................................... ......... 32Expanding Market Linkages with other Municipalities and Regions..............32Employment Side-Effects ..................................... 33Emerging Real Estate Market ................................... 33
6. Agenda for the Future ................................................................................................. 35Changing Demand for Project Finance................................... 35
MDP in Parand ................... ................... ....... 35MDP in Rio Grande do Sul .......................................... 35MDP in the Philippines ............................... ..... ......... 35
7. Conclusions and Lessons .......................................................................................... 37Conclusions...................... ..................... ......... 37Lessons for Future Operations .............................. .......... 38
R eferences ..................................................................................................................................... 39
Annexes
A. Data and M ethodology ............................................................................................................ 41B. Additional Data Analysis of Municipalities-By Population Size Category....................45C. Performance Audit of the Brazil MDPs: Lessons and Recommendations....................51D. Performance Audit of the Philippines MDPs: Lessons and Recommendations............53E. Public M arket Survey Questionnaire ................................................................................ 55
Tables
Table 3.1: MDP Project States/Provinces: Selected Indicators ......... ............... 9Table 3.2: Impacts upon Financial Autonomy.................................... 1Table 3.3: Impacts upon Own Revenue Mobilization ........... ................... 12Table 3.4: Impacts upon Property Tax Collection ....................... ... ........ 13Table 3.5: Impacts upon Direct Cost Recovery (Brazil Only) ........................ 15Table 3.6: Impacts upon Municipal Budget Surplus/Deficit ......................... 17Table 3.7: Impacts upon Own Revenues by Degree of Financial Deepening (Brazil Only)......... 19Table 4.1: MDP-sponsored Institutional Development Interventions ................... 22Table 4.2: Impacts upon M unicipal Cost Recovery.................................................................. 23Table 4.3: Impacts upon Municipal Financial Planning and Management................................ 24Table 4.4: Impacts upon Municipal Management of Investment Sub-projects.........................26Table 4.5: Impacts upon Computerization and Training........................................................... 27Table 5.1. Characteristics of Stall-holders (average value) .......................... 30Table 5.2. Change in Sales and Income............... .................. ..... 31Table 5.3. Commuting Distance and Travel Time................................ 31Table 5.4. Quality of Services at the Market (percent of respondents answering "excellent" or
"good")...................................................... 32Table 5.5. Origin of Goods to be Sold at the Market (mean percentage for each cell).............. 32Table 5.6. Origin of Customers to the Market (mean percentage for each cell) ............ 33

Ill
Figures
Figure 3. 1: Impacts upon Financial Autonomy ............................. ..... 10Figure 3.2: Impacts upon Own Revenue Mobilization.............................11Figure 3.3: Impacts upon Property Tax Collection........................... 13Figure 3.4: Impacts Upon Direct Cost Recovery in Brazil .................. ......... 15Figure 3.5: Impacts upon Municipal Surplus/Deficit........................... 17Figure 3.6: Impacts upon Own Revenue by Degree of Financial Deepening ..... .......... 19Figure 4.1: PIMES Institutional Development Interventions ......................... 22Figure 4.2: Impact upon M unicipal Cost Recovery.................................................................. 23Figure 4.3: Impact upon Municipal Planning and Management............................................... 24Figure 4.4: Impact upon Municipal Management of Investment Sub-projects... .............. 25Figure 4.5: Impacts upon Computerization and Training........................... 27

tp
V
Preface
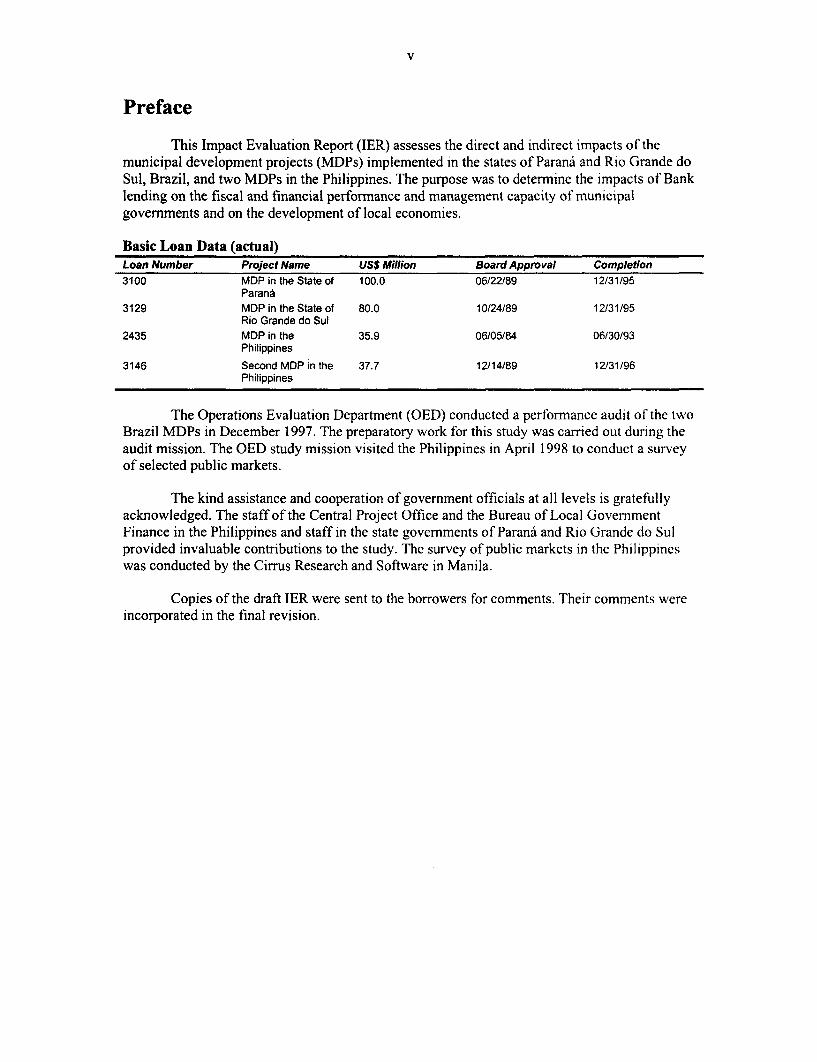
This Impact Evaluation Report (IER) assesses the direct and indirect impacts of themunicipal development projects (MDPs) implemented in the states of Parand and Rio Grande doSul, Brazil, and two MDPs in the Philippines. The purpose was to determine the impacts of Banklending on the fiscal and financial performance and management capacity of municipalgovernments and on the development of local economies.
Basic Loan Data (actual)Loan Number Project Name US$ Million Board Approval Completion3100 MDP in the State of 100.0 06/22/89 12/31/95
Paran63129 MDP in the State of 80.0 10/24/89 12/31/95
Rio Grande do Sul2435 MDP in the 35.9 06/05/84 06/30/93
Philippines
3146 Second MOP in the 37.7 12/14/89 12/31/96Philippines
The Operations Evaluation Department (OED) conducted a performance audit of the twoBrazil MDPs in December 1997. The preparatory work for this study was carried out during theaudit mission. The OED study mission visited the Philippines in April 1998 to conduct a surveyof selected public markets.
The kind assistance and cooperation of government officials at all levels is gratefullyacknowledged. The staff of the Central Project Office and the Bureau of Local GovernmentFinance in the Philippines and staff in the state governments of Parani and Rio Grande do Sulprovided invaluable contributions to the study. The survey of public markets in the Philippineswas conducted by the Cirrus Research and Software in Manila.
Copies of the draft IER were sent to the borrowers for comments. Their comments wereincorporated in the final revision.

1
1. Introduction
1.1 Sixty three of 75 countries with more than five million people are now pursuingdecentralization policies that devolve functions and responsibilities to sub-national governments(Davoodi and Zou, 1998). Such decentralization is severely constrained, however, by (i) a lack ofinstitutional capacity among sub-national governments, especially a lack of technical personnel toprepare and implement projects; (ii) limited resource mobilization at the local level, and (iii)limited access to long-term financing for investment programs. Municipal development projects(MDPs) are intended to mitigate these constraints. This study evaluates the extent to which MDPshave achieved these objectives based on recently examined cases in Brazil and the Philippines.
Rationale for the Study
1.2 Since the early 1980s, 16 Bank-financed MDPs have been completed in 11 countries,including Brazil, the Philippines, Jordan, and C6te d'Ivoire. Nineteen more MDPs in 15countries, including Georgia, Tunisia, and the West Bank and Gaza, are currently beingimplemented with total lending reaching US$2 billion' The MDP lending instrument has becomepopular in the Bank's urban sector because its project concept is consistent with the current Bankemphasis on demand-driven, bottom-up approaches with strong ownership and localparticipation.
1.3 OED commissioned this impact evaluation study to '-zlp disseminate the lessons ofsuccessful MDPs. The study grew out of recently completed performance audits of the first twoMDPs in the Philippines (OED, 1997) and the second MDP in Parani and the first MDP in RioGrande do Sul in Brazil (OED, 1998). The Performance Audit Reports (PARs) coveredimplementation experiences and remaining issues. The agenda for the future that was identifiedregarding future policy and operational direction is summarized in Chapter 6, and the lessonsdrawn and recommendations provided in the PARs appear as Annexes C and D.
1.4 The PARs found that the Brazil and Philippines projects had significant impacts onimproving the living conditions and the productivity of the residents in the participatingmunicipalities. Moreover, their unintended indirect impacts on the local economy have beensignificant. The performance audit of MDP I and II in the Philippines showed that small,resource-poor municipalities could successfully complete a small revenue-generating sub-projectsuch as a public market, and later, after they became more creditworthy and technically capable,could come back to the program to finance more complex infrastructure sub-projects. Thisexperience shows the importance of sequencing project components according to the speed ofinstitutional learning of the borrowers. As the Brazil PAR (OED, 1998, para. 5.2) points out, theparticipating municipalities should eventually "graduate" from the MDP program, which is atransitory institutional mechanism, and start borrowing from the capital market.
MDPs in Urban Lending
1.5 The legacy of the World Bank's urban lending operations during the past two decadescan be characterized as a sequence of paradigm shifts from (a) sites and services and slumupgrading projects for low-income areas, to (b) citywide infrastructure projects for selected cities,to (c) MDPs to reach numerous municipalities by encouraging competition among them. In the
1. This study deals with only those MDPs that had a municipal (or urban) development fund as part of the projectdesign.

2
1980s, the MDPs shifted the urban project design from a complex supply-driven (top-down)approach to a demand-driven (bottom-up) approach that provided a large number ofmunicipalities with access to credit they could use to finance their own investment projects.
1.6 The Parand Market Towns Development Project in Brazil (Loan 2343, approved in1983), and the First Municipal Development Project in the Philippines (Loan 2435, approved in1984) were the first group of MDPs approved in early 1980s. In both Brazil and the Philippines,the MDP programs have been successful during the past two decades. In Brazil, the Banksubsequently undertook an MDP for the state of Santa Catarina (Loan 2623, approved in 1985),and continued its operations in Parani with a second MDP in that state (Loan 3100, approved in1989) and an MDP in the state of Rio Grande do Sul (Loan 3129, approved in 1989). Three morestates, Minas Gerais (Loan 3639), Ceard (Loan 3789), and Bahia (Loan 4140), are nowimplementing MDPs with loan amounts ranging from US$100 to US$150 million. More than2,100 municipalities come under the purview of these five MDPs in Brazil.
1.7 In the Philippines, a second MDP (Loan 3146) was approved in 1989 and was followedby a third MDP (Loan 3455. approved in 1992) to meet the strong demand for financing amongthe municipalities in that country. A fourth project, called Local Government Finance andDevelopment Project (LOGOFIND) is now in preparation in the Philippines with a proposed loanamount of US$100 million.
Objectives, Scope, and Approaches to the Study
Objectives
1.8 This study has two objectives: (i) to assess impacts of MDPs on the institutional capacitybuilding of local governments for fiscal and financial management and for planning andimplementation of investment programs; and (ii) to assess both "direct" impacts on thebeneficiaries as anticipated by the projects, and "indirect" (longer-term) impacts on thedevelopment of local economies focusing on employment and income generation in theparticipating municipalities.
Scope
1.9 The study evaluates the impacts of two MDPs each in the Philippines and Brazil: the firstand second MDPs in the Philippines (Loans 2435 and 3146) and the MDPs in the states of Paraniand Rio Grande do Sul in Brazil (Loans 3100 and 3129). These four successful projects provide arich base for the study and a rare opportunity to extract lessons about the institutional learningprocess over an extended period.
Approaches
1.10 This study assesses impacts at two levels: the municipal level and the beneficiary (firmand household) level. At the municipal level, it analyzes municipal finance data collected inBrazil and the Philippines and a sample survey of mayors in Rio Grande do Sul. It documentsimpacts on financial autonomy; local revenue generation; cost recovery; creditworthiness;planning, budgeting, and accounting practices; project preparation and implementation; andtechnical skills of staff. The historical data allow comparison of the conditions "before theproject" with those "after the project." The cross-section data for both participating and non-

3
participating municipalities allow comparison of fiscal and financial performance "with versuswithout" the projects.
1.11 At the beneficiary level, the study analyzes survey data from two case studymunicipalities in the Philippines to assess the impacts of an MDP-financed public market onemployment creation and income generation, and to evaluate the indirect impacts on localeconomic development. Most participating municipalities in the Philippines financed publicmarkets (OED, 1997). The data allow comparison of the conditions "before the project" with theimpacts "after the project," and comparison of the impacts "with the projects" with the conditions"without the project." The impacts documented include: job creation; income generation;increases in land and real property values; changes in the quality of life from basic services suchas street paving, water supply, and garbage collection; time savings from efficient commuting andaccess to services; and better access to infrastructure services.
Methods and Data
1.12 The study uses six evaluation instruments: (i) review and analysis of projectimplementation data in the municipalities and implementation agencies; (ii) interviews withgovernment officials and nongovernmental organizations; (iii) interviews with beneficiaries andsite visits; (iv) municipal finance data collected for all municipalities in the two states in Braziland two provinces in the Philippines; (v) a survey of mayors of 26 municipalities in Rio Grandedo Sul regarding the project's impact on local capacity building; and (vi) sample surveys of stall-holders and shop owners in two municipalities in the Philippines constituting an experimentgroup and a control group. More details on data collection are in Annex A.
1.13 At both the municipal and the beneficiary levels, the study was designed to contrast andcompare project impacts on the participating municipalities (experiment group) with the non-participating municipalities (control group)-a with versus without project evaluation approach.In addition, the data document the initial conditions and the outcomes and impacts after projectimplementation-a before versus after project approach.

u
a
5
2. Evaluation Logic: Instruments and Expected Impacts
MDP Project Objectives and Components, and Key Institutions
2.1 In Brazil, the second MDP in Parand and the first MDP in Rio Grade do Sul wereprepared concurrently by the same project team and using identical project objectives and design.The projects had four objectives: (i) to increase the institutional capacity of municipalities andstate urban development agencies to plan, finance, and execute investment programs; (ii) toimprove the fiscal and financial management capacity of municipalities; (iii) to provide basiceconomic and social infrastructure in urban areas; and (iv) to improve targeting of urbanprograms to lower-income populations. These objectives were to be achieved through threecomponents: (a) creation of an Urban Development Fund providing a long-term line of credit tomunicipalities; (b) establishment of strict municipal creditworthiness and managementimprovement standards as conditions for allowing local governments to participate in the fund;and (c) on-lending to municipalities to finance infrastructure investments such as streetimprovements and community facilities such as health posts and day care centers.
2.2 In ParanA, the state government's Secretariat of Urban Development had overall projectresponsibility for Parana MDP II (known locally as the PEDU project, the name used in the restof the report). The Parand Municipal Assistance Foundation handled day-to-day projectmanagement. In Rio Grande do Sul, the MDP (known locally as the PIMES project, the nameused in the rest of the report) was executed by the RGS State Development Bank, which latermerged with the State Commercial Bank.
2.3 In the Philippines, the second Municipal Development Project (MDP II) was an extensionof the first (MDP I) for different regions with identical project objectives and design. The projecthad four objectives: (i) to establish an institutional mechanism, the Municipal Development Fund(MDF), to provide local governments with direct access to long-term development finance; (ii) toestablish a national-level technical intermediary, the central project office; (iii) to strengthen localtechnical and financial capacity for project implementation and service management through atraining program; and (iv) to improve local fiscal performance through the Real Property TaxAdministration (RPTA) program. The project had five components: (a) improving basicinfrastructure services such as water supply, sanitation, roads, drainage, public markets; (b)upgrading various maintenance activities; (c) upgrading real property tax records for improvingtax collections; (d) training local government staff; and (e) technical assistance for projectimplementation and local budgeting and fiscal administration.
2.4 In the Philippines, the Department of Public Works and Highways (DPWH) was the leadagency for the projects. The central project office carried out project implementation under theDPWH. The Department of Finance managed the MDF, and the department's Bureau of LocalGovernment Finance administered the RPTA programs. The Local Government Academyimplemented the Municipal Training Program under the Department of the Interior and LocalGovernment.
Main Project Instruments and Expected Impacts
2.5 The MDPs in Brazil and the Philippines were almost identical in their objectives anddesign, with some variations in implementation strategy. In Brazil, the project implementationtook a statewide "wholesale approach" to cover as many municipalities as possible in thefinancial reform program with a technically simple investment project such as street paving. Such
6
a simple investment project served as an "entry ticket" to participate in the reform program. In thePhilippines, the project implementation took a more selective approach, focusing on a smallernumber of municipalities that are eligible to participate in the program, and allowing revenue-generating investment projects such as public markets. But in both cases, the programs had twomain instruments: fiscal and financial reform and investment programs.
Fiscal and Financial Reform Package
2.6 In both Brazilian states, OED's performance audits confirmed that the project improvedthe fiscal and financial management capacity of participating municipalities. The project designrequired strict municipal creditworthiness and management improvement standards as conditionsfor allowing local governments to participate in the program. To apply for a sub-loan, a municipalgovernment had to submit a financial action plan (FAP) analyzing the municipality's debt-servicing capacity (with revenue and expenditure projections) and demonstrating the sub-project's eligibility for financing based on required technical standards. The FAP also presents aplan for institutional development, including training and technical assistance needs (OED, 1998).The FAP has been the key instrument for financial and fiscal reforms. Also, the requirement forsequencing of institutional reform before allowing physical investments was an effective way ofminimizing possible implementation delays and cost recovery problems.
2.7 In the Philippines too, OED's performance audits confirmed that the participatingmunicipalities improved their fiscal and financial performance significantly (OED, 1997). Theprojects in the Philippines also required an explicit financial reform package similar to the FAP inBrazil. In the Philippines, however, the RPTA program was implemented by a unit in theDepartment of Finance.
Institutional Capacity Building through Investment Programs
2.8 In both Brazil and the Philippines, the preparation and implementation of investment sub-projects financed by MDP served as a second major instrument for enhancing the institutionalcapacity of local governments. In both countries, OED's performance audits confirmed that theprojects achieved their objective of increasing the institutional capacity of municipalities and thegovernment's urban development agencies to plan, finance, and execute investment programs.The projects gave officials of participating municipalities opportunities to learn all phases ofproject preparation and implementation, from identification to appraisal to completion. Inaddition to improving their fiscal and financial management through the reform package (FAP),the participating municipalities had learned by experience in every phase of a project cycle,including the feasibility study for a sub-project; economic and financial analysis for costrecovery; and technical analysis for engineering design, procurement, and construction work.Furthermore, by using computers funded under the project, many municipalities were able tostreamline payroll, cadastre, accounting, and budget operations and improve overalladministrative efficiency.
Expected Development Impacts
2.9 The study documents empirically the impacts of MDPs on the following areas:
* Fiscal and financial performance of local governments, focusing on fiscal autonomy,local revenue generation, cost recovery, and budget balance as presented in Chapter3.

7
* Local governments' institutional capacity for investment planning, budgeting, andaccounting, and project preparation and implementation as presented in Chapter 4.
* Local economic development focusing on income and employment generation andthe quality of urban services as presented in Chapter 5.


9
3. Impacts on Municipal Fiscal and Financial Management
MDP participant municipalities in Brazil and the Philippines outperformed non-participants on municipal financial autonomy, direct and indirect cost recover,and balancing the budget. Furthermore, the deeper the MDP finance, the greaterthe MDP impact upon participants. Thus, participant municipalities relied upontheir own revenues to a greater extent than non-participants and have succeededin mobilizing more of these revenues. Property tax collection-a focus of MDPconditionalities and technical assistance-responded well to the project.Participant municipalities also did much better in direct cost recovety throughlevying and collecting betterment charges. To help them remain creditworthy,participant municipalities were more successfid than others in balancing theirbudgets. Thus, extensive municipal finance data point to significant MDPimpact on the strengthening of municipal fiscal and financial management.
Introduction
3.1 This chapter reports the impacts upon municipal finances of financial reform programsintroduced by MDP in Brazil and the Philippines. Table 3.1 summarizes key characteristics of thefour project areas studied and their composite municipalities.
3.2 Altogether, the projects covered 850 municipalities. Then, as now, municipalities inBrazil were much smaller, more varied in population size, and much more numerous than theirPhilippine counterparts. Both states in Brazil are as urbanized as the country itself. ThePhilippines provinces-as part of metropolitan Manila-are more urbanized than the country as awhole. While the Brazilian states enjoy levels of GDP per capita similar to the national average,the levels in the Philippine provinces are above their respective national average. The Philippines'lower levels of income, nevertheless, have implications for municipal finances, as this chapterwill show.
Table 3.1: MDP Project States/Provinces: Selected Indicators
Indicator Brazil PhilippinesParanh Rio Grande National Bulacan Laguna National
do SulTotal population 1996 (millions) 9.0 9.6 157.1 1.8 1.5 71.9Urban population as share of total (%) 77.9 78.6 78.4 69.7 75.4 54.9GDP per capita PPP 1991 (US$) 5,138 5,168 5,142 - - 3,550All municipalities 1996 (number):
total 371 426 4,974 24 29 1,610apop. >250,000 4 4 - 0 0 -pop. 50,000-250,000 25 36 - 19 7 -pop. 10,000-50,000 162 125 - 5 22 -pop. 2,000-10,000 177 248 - 0 0 -pop. <2,000 3 13 - 0 0 -
MDP project municipalitieso (number) 364 152 - 17 4 -Average pop. per municipality (number) 24,269 22,597 31,584 67,549 52,138 44,658Sources: MOP IES database: Brazil census 1996; World Development Indicators 1998 CD-ROM; Philippines MOP study team.a. Aggregate of 'cities" (82) plus 'municipalities (1,528).b. MDP project municipalities are defined as those that participated fully in both MOP investment and technical assistance component programs.
10
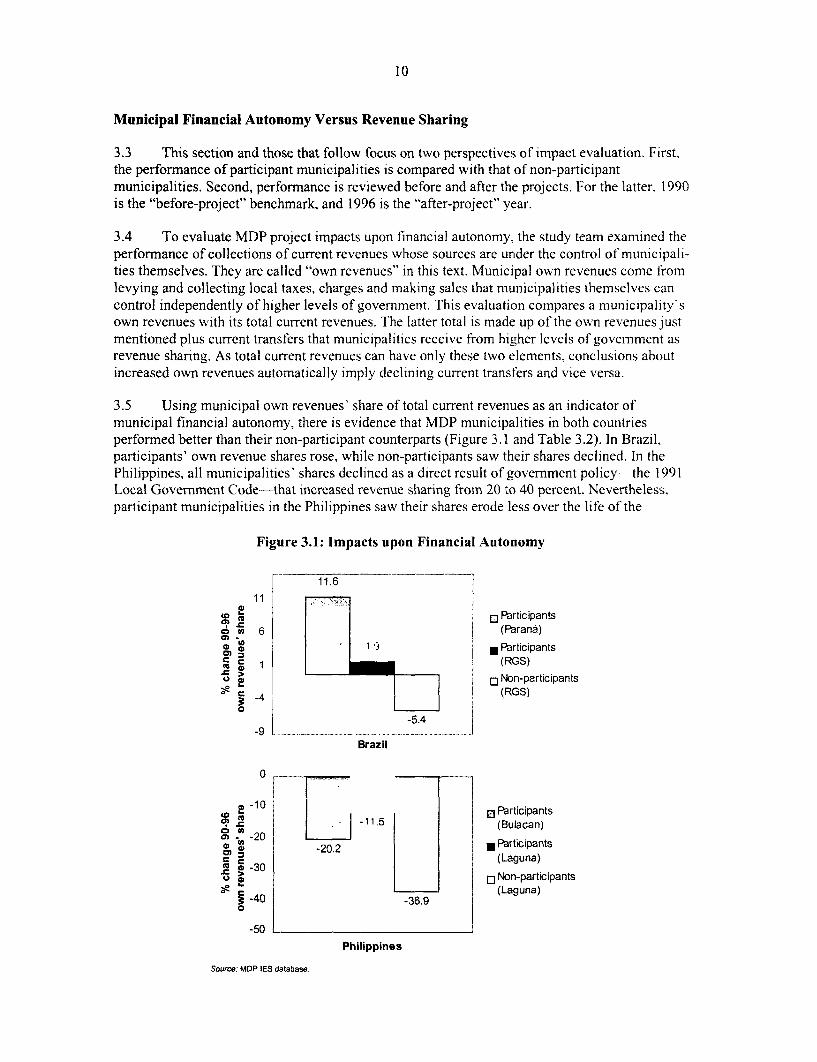
Municipal Financial Autonomy Versus Revenue Sharing
3.3 This section and those that follow focus on two perspectives of impact evaluation. First,the performance of participant municipalities is compared with that of non-participantmunicipalities. Second, performance is reviewed before and after the projects. For the latter, 1990is the "before-project" benchmark, and 1996 is the "after-project" year.
3.4 To evaluate MDP project impacts upon financial autonomy, the study team examined theperformance of collections of current revenues whose sources are under the control of municipali-ties themselves. They are called "own revenues" in this text. Municipal own revenues come fromlevying and collecting local taxes, charges and making sales that municipalities themselves cancontrol independently of higher levels of government. This evaluation compares a municipality'sown revenues with its total current revenues. The latter total is made up of the own revenues justmentioned plus current transfers that municipalities receive from higher levels of government asrevenue sharing. As total current revenues can have only these two elements, conclusions aboutincreased own revenues automatically imply declining current transfers and vice versa.
3.5 Using municipal own revenues' share of total current revenues as an indicator ofmunicipal financial autonomy, there is evidence that MDP municipalities in both countriesperformed better than their non-participant counterparts (Figure 3.1 and Table 3.2). In Brazil,participants' own revenue shares rose, while non-participants saw their shares declined. In thePhilippines, all municipalities' shares declined as a direct result of government policy-the 1991Local Government Code-that increased revenue sharing from 20 to 40 percent. Nevertheless,participant municipalities in the Philippines saw their shares erode less over the life of the
Figure 3.1: Impacts upon Financial Autonomy
11.6-_ _
11 - -
Participantsu)~ 6 (R3ran6)
1 E bParticipants
(RGS)> Non-participants
(RGS)5-4-5.4
-9Brazil
0
1 -10 -- Participants=-11.5 (Bulacan)
S-20.2Participants
(Laguna)we-30[3 Non-participants
n ----- (Laguna)a -40 -36.90
-50Philippines
Source: MDP IES database.
11
Table 3.2: Impacts upon Financial Autonomy
Own revenues' share of all current municipal revenues (percent)Brazil Philippines
1990 1996 1990 1996
Participants (Paran6) 12.9 14.4 Participants (Bulacan) 56.0 44.7
Participants (RGS) 16.2 16.5 Participants (Laguna) 68.9 61.0
Non-participants (RGS) 14.7 13.9 Non-participants (Laguna) 42.8 27.0Source: MDP IES database.Notes: For details of participant and non-participant municipalities, see Annex Table Al .Own (current) revenues = municipalities own taxes, charges and sales.All current revenues = own revenues plus current transfers from higher levels of government. RGS = Rio Grande do Sul
projects. Of course, the MDP projects were designed and implemented to encourage and assistmunicipalities to mobilize more financial resources of their own. As a corollary, participantmunicipalities became less dependent upon fiscal transfers after the projects, unlike non-participants.
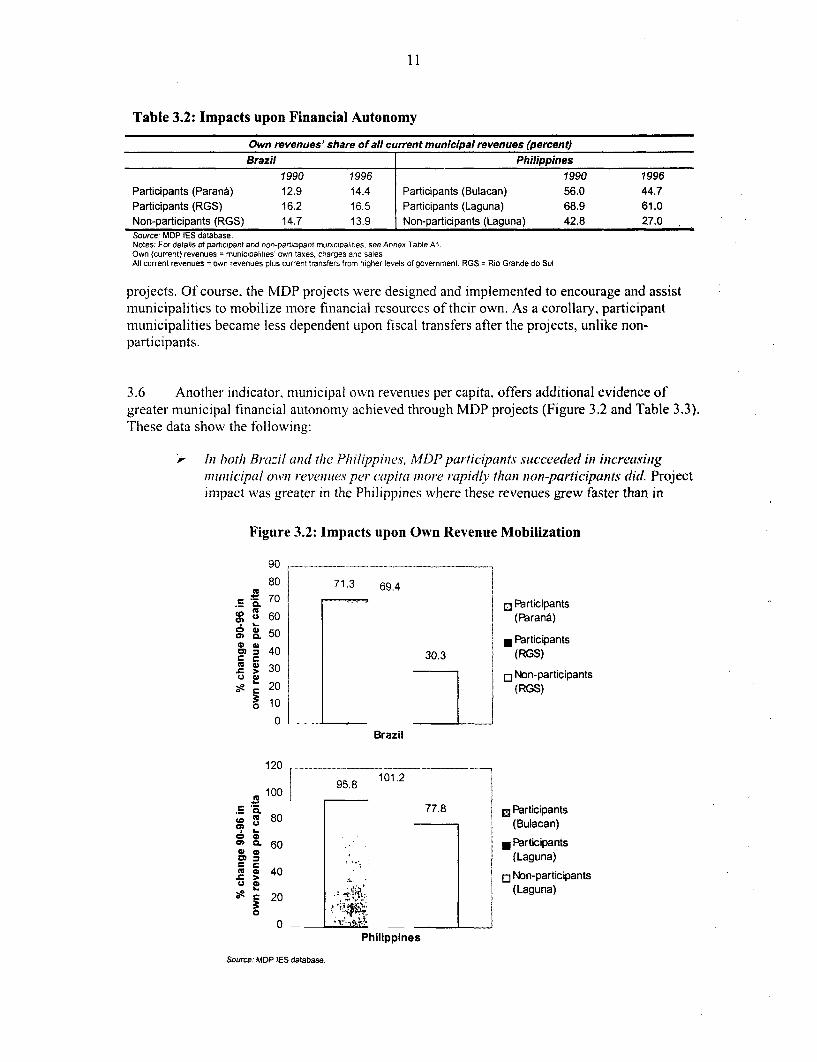
3.6 Another indicator, municipal own revenues per capita, offers additional evidence ofgreater municipal financial autonomy achieved through MDP projects (Figure 3.2 and Table 3.3).These data show the following:
In both Brazil and the Philippines, MDP participants succeeded in increasingnunicipal own revenues per capita more rapidly than non-participants did. Projectimpact was greater in the Philippines where these revenues grew faster than in
Figure 3.2: Impacts upon Own Revenue Mobilization
90
80 71.3 69.4
.S - 70 -R-articipantso u60 (Parant)
40 3 Participants= 40 30.3 (RGS)
r e 30 3 Non-participantsc20 (RGS)
10
0Brazil
120 - - -101.2100 95.8
,S C& 77.8 M Participants'g 80 -(Bulacan)
* M 60 .Participants(Laguna)
>40 O Non-participants
20 (Laguna)
0-Philippines
Source: MDP IES database.
12
Table 3.3: Impacts upon Own Revenue Mobilization
Own revenues per capita (constant 1996 US dollars)Brazil Philippines
1990 1996 1990 1996Participants (Parant) 24.81 42.50 Participants (Bulacan) 4.51 8.83Participants (RGS) 38.25 64.78 Participants (Laguna) 6.80 13.68Non-participants (RGS) 36.96 48.15 Non-participants (Laguna) 3.24 5.76Source: MDP IES database.Note: See Table 3.2. Local currency values converted to US dollars using year average exchange rates.
Brazil. Nevertheless, the level of own revenues per capita in the Philippines-withits lower level of income-is still below Brazil's.
> Before the MDP projects in 1990, and in both countries, participant and non-participant municipalities had similar levels of own revenue per capita. By projectcompletion in 1996, participant municipalities had higher levels than non-participants (Table 3.3). Besides confirming MDP project impacts, this points to afairly even playing field for municipalities at the outset, a feature particularlystriking in Rio Grande do Sul. It precludes the notion of self-selection that mighthave induced only better-performing municipalities to participate in the MDPprojects. The results for Laguna may not be reliable, though, since the province hadonly four participants.
3.7 The data point to significant MDP project impacts encouraging and helping greater fiscalautonomy of participant municipalities. Evidence of this includes rising shares of municipalincome coming from municipal own revenues and from municipal efforts to raise more of theirown revenues from citizens. MDP projects provided important incentives for municipalities tomove in this direction. Mayors understood that more municipal revenue meant greater access toMDP (and other) credit and greater ease in paying off loans. MDP project design includedrequirements that mayors make efforts in this direction in order to qualify for loans. MDP projecttechnical assistance to encourage tax collection helped municipalities develop and strengtheninstruments to raise more revenues (discussed further in Chapter 4).
Own Revenue Generation through Property Taxes
3.8 One of the main sources of municipal own revenue generation in both countries is fromtax levied on residential, commercial, and industrial properties in urban areas. For themunicipalities in Brazil, such property tax collections typically accounted for 15 to 25 percent ofall municipal own revenues. In the Philippines, the equivalent range was 26 to 33 percent. MDPproject design in both countries focused specifically and explicitly upon improving property taxcollections and provided technical support for local administrations to improve property taxadministration.
3.9 We therefore looked at the performance of property tax collection as an indicator ofmunicipal effort to enhance fiscal autonomy and improve creditworthiness? Through this
2. Evidence of improved property tax collection resulting from MDP improvements to property cadastres in Brazil wasalso examined, but little was found to support this link. Little cadastral improvement went beyond modernizing theregister in city hall; much of it failed to lead to effective broadening or deepening of collections. More comprehensivepackages of technical assistance-notably those including efforts to improve collections-were found to be moreeffective.
13
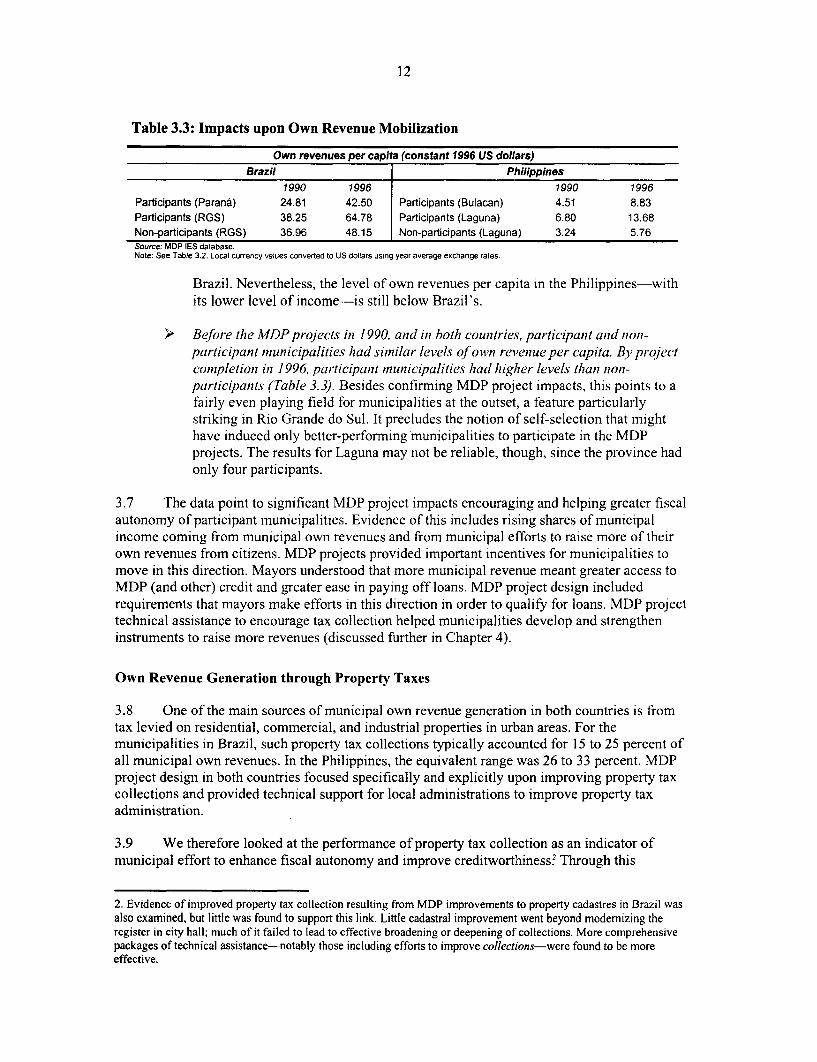
indicator per capita collection in both Brazil and the Philippines was found to respond positivelyto MDP project interventions. While property tax per capita increased for all municipalities inboth countries during the 1990-96 period, it increased more rapidly in MDP participantmunicipalities-except for Parani-than in non-participants (Figure 3.3 and Table 3.4).
Figure 3.3: Impacts upon Property Tax Collection
700 ..
600 547.1
S500 434.7 ParticipantsS54(Paran6)
a * 400X * Participants.S 300 259.4 (RGS)
o 200 0 Non-participantsa (RGS)a 100
0Brazil
100 86.8
0- 80 E Participants(Bulacan)
60 48.1 * Participants(Laguna)
40 31.9[ Non-participants
Co .(Laguna)o 20
0Philippines
Source: MDP IES database.
Table 3.4: Impacts upon Property Tax Collection
Property tax per capita (constant 1996 US dollars)Brazil Philippines
(a) 1990 1996 1990 1996
Participants (Parana§) 1.87 6.72 Participants (Bulacan) 1.31 1.94
Participants (RGS) 2.63 17.02 Participants (Laguna) 2.43 4.54
Non-participants (RGS) 1.96 10.48 Non-partici pants (Laguna) 1.16 1.53Source: MDP IES database.Notes: See Tables 3.2 and 3.3
3.10 A review of property tax per capita as an impact indicator highlights the following:
Participant municipalities in both countries-except those in Parand-improvedproperty tax collections during 1990-96 more than non-participants did (Figure3.3). The performance of participants in RGS, where property tax per capitaincreased more than fivefold over the life of the MDP, is outstanding. These results

14
reflect work done through MDP financial action plans (FAPs) in Brazil thatconsistently emphasized improvements in property tax as a key to municipaleligibility to participate in the project. Similarly in the Philippines, the favorableresults reflect the successful Real Property Tax Administration (RPTA) Program,supported by MDP.
> The weaker performance of Parana compared to RGS has three causes: (i) lessrigorous control in Parand than in RGS of project conditionalities that requiredimproved tax performance through MDP Financial Action Plans (FAPs), (ii)participants in Parani were second-time MDP participants and, in their eyes, FAPproperty tax conditions that the previous MDP did not require may have lackedcredibility; and (iii) MDP project leverage in ParanA was weaker; the 100 percentcoverage of municipalities precluded the possibility of excluding municipalitieslacking compliance with FAP conditions.
3.11 Study findings thus point to significant MDP impacts upon property tax performance atthe municipal level. This result was expected as it goes to the heart of the original designs of theMDP projects. In both countries, the MDP projects focused upon property tax as the principalinstrument for raising local revenue and increasing the financial autonomy of municipalities. Achallenge for the future will be to replicate this impact with other key items of revenue, such asthe municipal service tax (ISS) in Brazil.
Direct Cost Recovery
3.12 In addition to indirect cost recovery through stimulating and assisting the collection oflocal taxes, MDP projects also urged municipalities to pursue direct cost recovery from programinvestments themselves. In Brazil, this was through levying betterment charges upon familiesdirectly benefiting from the investments made. In the Philippines, MDP operations aimed atdirect cost recovery through allowing municipalities to borrow and invest in revenue-generatingservices, such as local public markets. This section of the report discusses the Brazilian case. Toevaluate MDP project impacts in Brazil, the study team examined the performance of bettermentcharges levied and collected per capita at the municipal level.
3.13 The cost recovery performance of participant municipalities in RGS was much better thanmunicipalities that did not participate in the MDP project. For Parand participant municipalitieson the other hand, direct cost recovery performance weakened (Figure 3.4 and Table 3.5).

15
Figure 3.4: Impacts Upon Direct Cost Recovery in Brazil
160 __-----
126.3
-110110 Participants
60 (Parans)S. 24.8
C 10 i Participants10 m (RGS)
& -40 O Non-participants
-52 (RGS)
-90Brazil
Source: MOP IES database.
Table 3.5: Impacts upon Direct Cost Recovery(Brazil Only)
Betterment charge per capita (constant 1996 US dollars)1990 1996
Participants (Paran6) 1.27 0.61Participants (RGS) 1.37 3.10Non-participants (RGS) 1.25 1.56Source MDP IES database.Notes: See Tables 3.2 and 3.3
3.14 Highlights from the evidence are as follows:
In levying and collecting betterment charges from beneficiaries, MDP participantsin RGS significantly outperfbrmed non-participants (Figure 3.4). On a per capitabasis, betterment charges were at a similar level for both participants and non-participants in 1990, before the MDP project. By 1996, RGS participants werecollecting twice the amount of betterment charge as non-participants. This outcomewas helped by the enforcement of FAP conditions requiring municipalities to levybetterment charges where possible upon sub-projects financed through MDP.
MDP participants in Parana, on the other hand, had a weaker performance. Afterthe MDP project, betterment charges per capita there were only half the levelobserved before the project. The three causes highlighted earlier for the weakerperformance of Parand municipalities also apply here (para. 3.10). Being the secondoperation in ParanA, MDP II could not have the same demonstration effect uponmunicipalities as a first-time MDP project in RGS did, especially when the firstMDP project in Parani did not have the same cost recovery conditionalities.' Amongthe specific results: 28 participant municipalities in Parani, who used to collectbetterment charges in 1990, stopped collecting them altogether by 1996
3. Through the initial shock of contact with an MDP project, local mayors in RGS were more ready to embracebetterment charges which for many of them constituted a new financial instrument, but one which made access to MDPproject finance easier.
4. By contrast, all MDP participants in RGS that collected betterment charges in 1990 still collected them in 1996 andwere joined by 14 more municipalities by the latter year. Thus, by project completion in 1996, 83.3 percent of RGSparticipants collected betterment charges. The equivalent share for Parani was 41.8 percent.
16
3.15 This evidence points to the achievement of significant MDP impacts upon increaseddirect cost recovery through betterment charges. A necessary condition for such achievements isfor access to MDP funding to be explicitly conditioned upon a municipality's progress towardadopting and implementing direct cost recovery. The fulfillment of this condition also needs to beclosely monitored by the MDP project team during implementation. The different performancesof participant municipalities in Parani and RGS point to the need to have these conditionscorrectly in place at the time of a municipality's first contact with an MDP project.
3.16 In leveraging improvements to direct cost recovery through MDP operations, projectdesigners need to consider the political aspects of betterment charges in particular. Local mayorsoften complain that these charges are unpopular and difficult to administer fairly. Local councilsmust also formally approve them case by case, a process that can involve lengthy politicalnegotiations with opposition councilors.
3.17 Even when success is obtained, there is an important caveat. When levied effectively,betterment charges still only account for a very small proportion of own revenues, not more than5 percent on average. They can nevertheless be significant for recovering the investment costs ofa particular project, up to 70 to 80 percent of the initial outlay, the remaining costs coveredindirectly through property taxes.
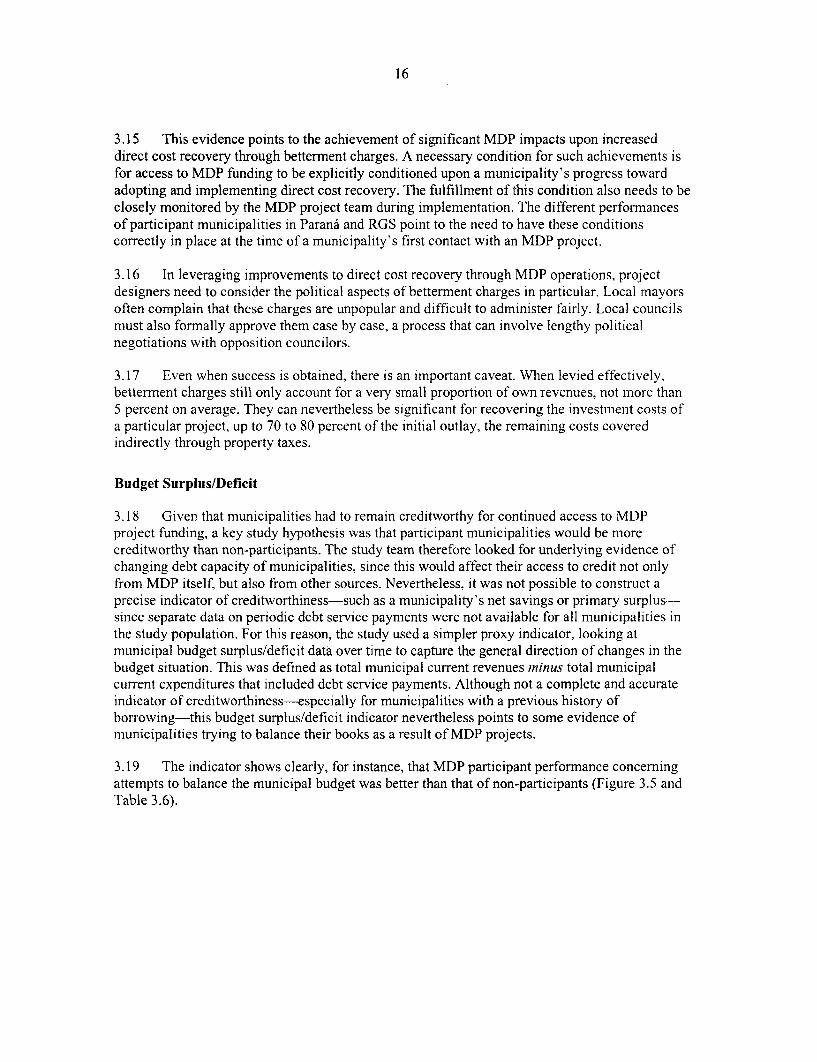
Budget Surplus/Deficit
3.18 Given that municipalities had to remain creditworthy for continued access to MDPproject funding, a key study hypothesis was that participant municipalities would be morecreditworthy than non-participants. The study team therefore looked for underlying evidence ofchanging debt capacity of municipalities, since this would affect their access to credit not onlyfrom MDP itself, but also from other sources. Nevertheless, it was not possible to construct aprecise indicator of creditworthiness-such as a municipality's net savings or primary surplus-since separate data on periodic debt service payments were not available for all municipalities inthe study population. For this reason, the study used a simpler proxy indicator, looking atmunicipal budget surplus/deficit data over time to capture the general direction of changes in thebudget situation. This was defined as total municipal current revenues minus total municipalcurrent expenditures that included debt service payments. Although not a complete and accurateindicator of creditworthiness-especially for municipalities with a previous history ofborrowing-this budget surplus/deficit indicator nevertheless points to some evidence ofmunicipalities trying to balance their books as a result of MDP projects.
3.19 The indicator shows clearly, for instance, that MDP participant performance concerningattempts to balance the municipal budget was better than that of non-participants (Figure 3.5 andTable 3.6).

17
Figure 3.5: Impacts upon Municipal Surplus/Deficit
0
Cn W -2C 0 ..
43 Participants-4 (Parana)
-6 * Participants(RGS)
8-7.3 E] Non-participants(RGS)
-10.5-12
Brazil
12 ....
e 9 7.3
Wi 6U) 3 DParticipants
3 (Bulacan), 0 I Participants
e& = -3 -0.8 (Laguna)
o -6 O Non-participantsg $ (Laguna)
46 -9 -7.3
-12-Philippines
Source: MDP IES database.
3.20 The highlights of study findings concerning municipal budget surpluses and deficits are:
Despite deterioration of the financial balance of'all municipalities in Brazil, there is
evidence that the MDP projects helped slow the decline. Thus, RGS participants didnot suffer such serious setbacks as non-participants; neither did Parand participants,but to a lesser degree. Thus, MDP projects helped participant municipalities relievethe negative trend toward increased deficits.
> In the Philippines, the contrasting trends of participant and non-participantmunicipalities are clearer still. Participants there moved out of deficit into surplusover the 1990-96 period, while non-participants reported a sharp fall in the averagebudget surplus they reported at the start of the MDP project. Bulacan participantsactually moved out of deficit and into surplus between 1990 and 1996. On the other
Table 3.6: Impacts upon Municipal Budget Surplus/Deficit
Budget surplus(+) or deficit(-) as share of total revenues (percent)BrazHl Philippines
1990 1996 1990 1996
Participants (Paranti) +0.1 -9.3 Participants (Bulacan) -5.5 +1.8Participants (RGS) +0.8 -6.5 Participants (Laguna) +5.3 +4.5
Non-participants (RGS) +2.8 -7.7 Non-participants (Laguna) +8.9 +1.6-Source: MDP IES database.Notes: Budget surplus/deficit = total current revenues minus total current expenditures (including debt service payments).

18
hand, the large surplus of Laguna non-participants was almost completely wiped outby 1996. These results reflect efforts by participant municipalities to remaincreditworthy in order to gain access to further MDP and other funding.
3.21 We therefore find that participating in MDP projects can help a municipality reduce itsdeficit, if not develop a fiscal surplus. MDP projects provided an important incentive in thisdirection.
Financial Deepening
3.22 For municipalities in Brazil the study examined how different levels of MDP capitalinvestment in relation to total municipal investment at the initial phase of project implementationaffected financial performance of participating municipalities. A lack of data on total investmentprevented a similar analysis for the Philippines' municipalities. Applying a simple concept ofproject leverage to the case of Brazil, it was hypothesized that the degree of MDP project impactwould rise with the share of MDP funding in a municipality's total investment program. Thus, amunicipality more dependent upon MDP funding would be expected to be more responsive andsubject to the requirements of the MDP reform program and show stronger impacts, and viceversa.
3.23 To measure the degree of municipal participation in MDP, a "financial depth" indicatorwas constructed. This indicator measured MDP investment funding at the municipal level as ashare of a municipality's total 1990-92 investment (funded from all sources, including MDP andown revenues). From empirical estimates of this indicator, participant municipalities weregrouped into three categories of financial depth: deep, greater than 50 percent; medium, 25 to 50percent; and shallow, less than 25 percent.
3.24 In search of possible MDP project impacts, the study team examined the own revenueperformance of municipalities-all participants, of course-by the degree of "financial depth."With one important caveat, discussed below, participants with greater MDP financial depthperformed better than participants with more shallow participation in the MDP projects (Figure3.6 and Table 3.7).

19
Figure 3.6: Impacts upon Own Revenue by Degree ofFinancial Deepening
120 109.5
. 100
C,a 8080 63 60.5 Deep
& 60 gMedium
40 0 Shallow
20
0Brazil: Parani
160138.6
140
.S '. 120
P 100
* e 80 63.9 0 Deep
2 60 -Medium
40 . 1. Shallow
20 . 1
0Brazil: Rio Grande do Sul
Source: MDP IES database.
Table 3.7: Impacts upon Own Revenues by Degree of Financial Deepening(Brazil Only)
Own revenues per capita (constant 1996 US dollars)Parand Rio Grande do Sul
1990 1996 1990 1996
Deep 20.44 42.82 Deep 32.04 52.51Medium 26.61 43.38 Medium 42.70 48.03Shallow 26.28 42.18 Shallow 36.36 86.75Source. MDP IES database.Notes: See Tables 3.2 and 3.3.Financial depth is defined as the share of total 1990-92 municipal investment accounted for by MDP project funding. Three groups asfollows: deep = > 50%: medium = 25-50%; shallow = <25%.
3.25 The highlights of the study findings are:
As measured by the increase in the average level of municipal own revenues percapita, "deep "participant municipalities in both Parand and Rio Grande do Sulper-formed better than "medium " ones. This is because deep participantmunicipalities are more subject to the policy influence of MDP projects and aremore likely to play according to the rules than medium or shallow participantmunicipalities. This outcome is a product of the leverage an MDP project canexercise over a municipality that is more dependent upon the project as its mainsource of funding.

20
> The contradictory outcome for "shallow" participant municipalities in RGS. whichappear to have outperformed all others, results from a skewed distribution in whichafew small municipalities reported very high levels of own revenues per capita in1996, which significantly raised the mean observation for that year. Own revenuesper capita is, nevertheless, a particularly important impact indicator to use in thisanalysis given its demonstrated robustness in the earlier "with/without-project"evaluation.
3.26 Evidence gathered by the study team therefore points to greater project impacts whereparticipant municipalities are more closely engaged in the respective MDP projects. This findingcoincides with a widely perceived notion-across many lending sectors within the Bank-thatgreater project leverage can lead to more significant impacts upon project outcomes. The resultobserved is consistent with the hypothesis that the more closely involved with and dependentupon an MDP project a municipality is, the more likely that municipality will respond to andadopt MDP precepts. It should worth noting that the federal government of Brazil provided nosubsidies to the participating municipalities. In the Philippines, the property tax improvementcomponent (RPTA) was part of the national government assistance program implemented by theDepartment of Finance independent of the MDP sub-loans.
21
4. Impacts on Local Government Capacity Building
Direct observation ofselected municipalities highlights their awareness of theimprovements made under the MDP project. Nearly half of PIMES's institutionaldevelopment interventions were to strengthen local tax administration. Amongthe different kinds of intervention, participant municipalities valued most high/vthose aimed at making resource management more efficient and improving themanagement of investment sub-projects, which included better procurementprocedures. Professional training was highly valued. In terms of techniques andprocedures, municipalities reported that the PIMES project helped then betterhandle information technology and community participation. Municipalityawareness of these advances had an important side effect: successful participantsopenly promoted the project and its principles among municipalities still notinvolved.
Introduction
4.1 This chapter reports the findings of impact evaluation "case studies" of participantmunicipalities in the MDP project--called PIMES-in Rio Grande do Sul that was carried out bythe PIMES team in Porto Alegre as part of this evaluation study? The studies were implementedin two stages: (i) field visits by team members to 26 municipalitieg during August-December1997; and (ii) a follow-up telephone/fax survey of the same municipalities during January-March1998. These municipalities do not constitute a random sample; they were selected from those thathad completed all aspects of sub-loan agreements.
4.2 The PIMES team selected municipalities for these studies by taking into account thefollowing factors: (i) representation of different population size groups; (ii) wide range of MDPinstitutional development actions adopted by them; and (iii) broad geographical coverage acrossthe state of Rio Grande do Sul. The aim was to evaluate a group of municipalities that hadparticipated effectively in the MDP project's institutional development (ID) component, butwhich were also representative of municipalities throughout Rio Grande do Sul state as a whole.Twenty-six were chosen as the maximum number of municipalities that could be visited in thefield, given the study's budget constraint.
Field Surveys
4.3 Members of the study team made 1-2 day visits to each municipality to meet with localofficials and collect basic data on the following: (i) municipal administration; (ii) urban planning;(iii) local taxes; and (iv) municipal infrastructure. To compile the data, the team had preparedstandard checklists to apply to all municipalities. In addition, a study team member sat down with
5. This chapter is based upon a report prepared by Jeanette Lontra in March 1998 as part of this study under thesupervision of Aurelio Simon (PIMES, 1998). The terms of reference for the telephone/fax survey was prepared duringthe audit mission in December 1997. Roy Gilbert coordinated the survey work and did translation and editing. SextilioGiacomini, Aldino Dick, Janise Benneet, and Neusa Cunha of the PIMES team participated in earlier stages of thiswork. This task was undertaken fully by the PIMES team without any financial support from the Bank.
6. The municipalities were: Alegrete, Arroio dos Ratos, Bento Gongalves, Boa Vista do Buric6, Butii, Cacique Doble,Campinas do Sul, Candido Godoy, Caseiros, Carazinho, Chapada, Constantina, Dois Irmaos, Dom Feliciano, DoutorMauricio Cardoso, Erebango, Erechim, Farroupilha, Independencia, Jacutinga, Nova Hartz, Novo Hamburgo, Parob6,Santa Rosa, SAo Borja, SAo Jolo da Urtiga.
22
municipal officials to go over a questionnaire with some 70 open-ended questions on thefollowing topics:
* profile of the city;* real estate cadastre;* computerization;* municipal tax code;* urban master plan; and* training and technical assistance.
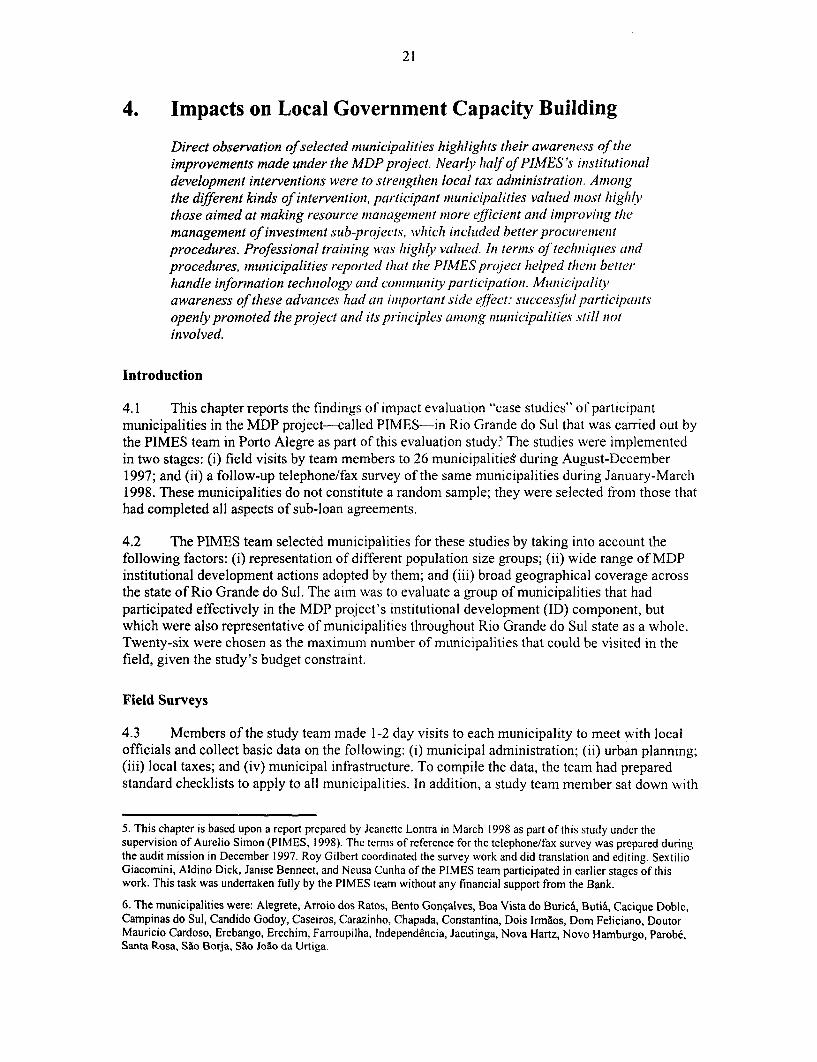
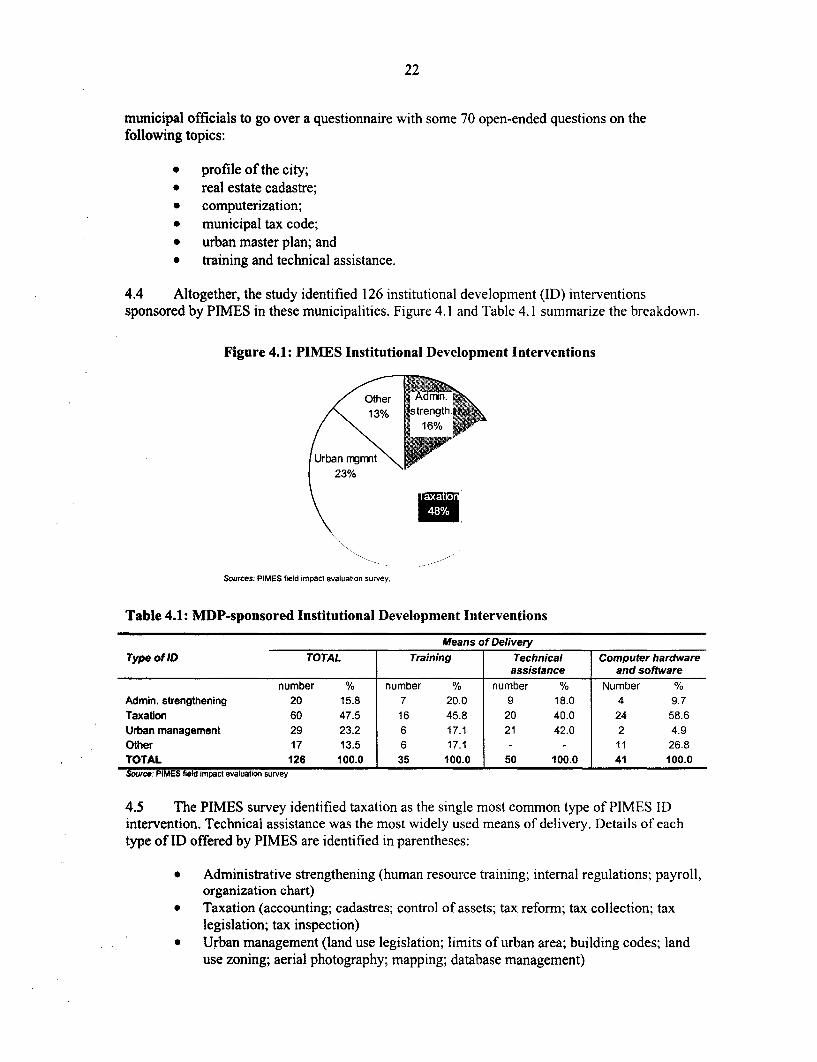
4.4 Altogether, the study identified 126 institutional development (ID) interventionssponsored by PIMES in these municipalities. Figure 4.1 and Table 4.1 summarize the breakdown.
Figure 4.1: PIMES Institutional Development Interventions
Other Adrnn
13%
strengthI'16%
Urban mgmnt23%
Sources: PIMES field impact evaluation survey.
Table 4.1: MDP-sponsored Institutional Development Interventions
Means of DeliveryType of ID TOTAL Training Technical Computer hardware
assistance and softwarenumber % number % number % Number %
Admin. strengthening 20 15.8 7 20.0 9 18.0 4 9.7Taxation 60 47.5 16 45.8 20 40.0 24 58.6Urban management 29 23.2 6 17.1 21 42.0 2 4.9Other 17 13.5 6 17.1 - - 11 26.8TOTAL 126 100.0 35 100.0 50 100.0 41 100.0Source: PIMES field impact evaluation survey
4.5 The PIMES survey identified taxation as the single most common type of PIMES IDintervention. Technical assistance was the most widely used means of delivery. Details of eachtype of ID offered by PIMES are identified in parentheses:
* Administrative strengthening (human resource training; internal regulations; payroll,organization chart)
* Taxation (accounting; cadastres; control of assets; tax reform; tax collection; taxlegislation; tax inspection)
* Urban management (land use legislation; limits of urban area; building codes; landuse zoning; aerial photography; mapping; database management)
23
* Other (mostly computer hardware and software)
4.6 In order to update information already provided and to survey municipalities' ownperceptions of MDP project impacts upon their administration and operations, the PIMES teamfollowed up with a simple questionnaire faxed to each one of these 26 municipalities. Tocomplement the earlier approach of open-ended questions, the fax questionnaire, prepared jointlywith the audit mission (December 1997), asked municipal respondents to rate the quality-through five categories ranging from highly satisfactory to very poor-of MDP impacts in 13areas. Among other things these covered local tax collection, betterment charges, procurementpractices, computerization, and community participation.
4.7 The remainder of this chapter summarizes the impacts of the MDP projects as seen fromthe perspective of participant municipalities themselves. Each section deals with a distinct area ofMDP project intervention.
Direct and Indirect Cost Recovery
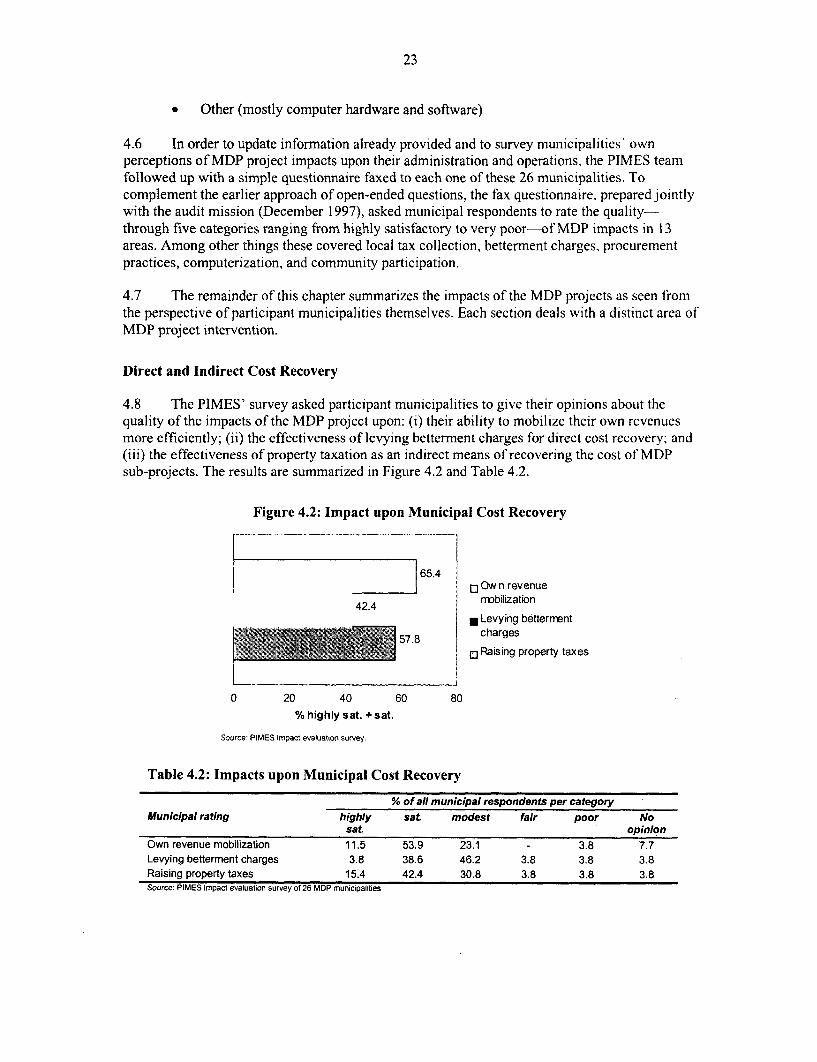
4.8 The PIMES' survey asked participant municipalities to give their opinions about thequality of the impacts of the MDP project upon: (i) their ability to mobilize their own revenuesmore efficiently; (ii) the effectiveness of levying betterment charges for direct cost recovery; and(iii) the effectiveness of property taxation as an indirect means of recovering the cost of MDPsub-projects. The results are summarized in Figure 4.2 and Table 4.2.
Figure 4.2: Impact upon Municipal Cost Recovery
65.4£JOwn revenue
42.4 mobilization
N Levying bettermentcharges
[ Raising property taxes
0 20 40 60 80% highly sat. +sat.
Source: PIMES impact evaluation survey.
Table 4.2: Impacts upon Municipal Cost Recovery
% of all municipal respondents per categoryMunicipal rating highly sat modest fair poor No
sat opinionOwn revenue mobilization 11.5 53.9 23.1 - 3.8 7.7Levying betterment charges 3.8 38.6 46.2 3.8 3.8 3.8Raising property taxes 15.4 42.4 30.8 3.8 3.8 3.8Source: PIMES impact evaluation survey of 26 MDP municipalities
24
4.9 Among the highlights are the following:
> Near unanimity that the impacts of the MDP project had been positive.> The majority of municipalities thought the project had a very positive impact (highly
satisfactory or satisfactory rating) upon their own revenue mobilization and uponproperty tax collections.
> Municipalities reckoned that project impacts upon betterment charges were positivebut slightly more modest.
4.10 Overall, these results indicate a satisfactory MDP project impact upon cost recovery inthe eyes of municipal participants. This finding applies to municipalities of all size categories,although small and medium-sized municipalities are more likely to report highly satisfactoryimpacts than larger ones. These results are particularly significant given that the MDP project wasimplemented during a period of intensive financial change as monetary stabilization took hold inBrazil. Within this difficult context, MDP municipalities made efforts to increase their ownrevenues.
Local Financial Management
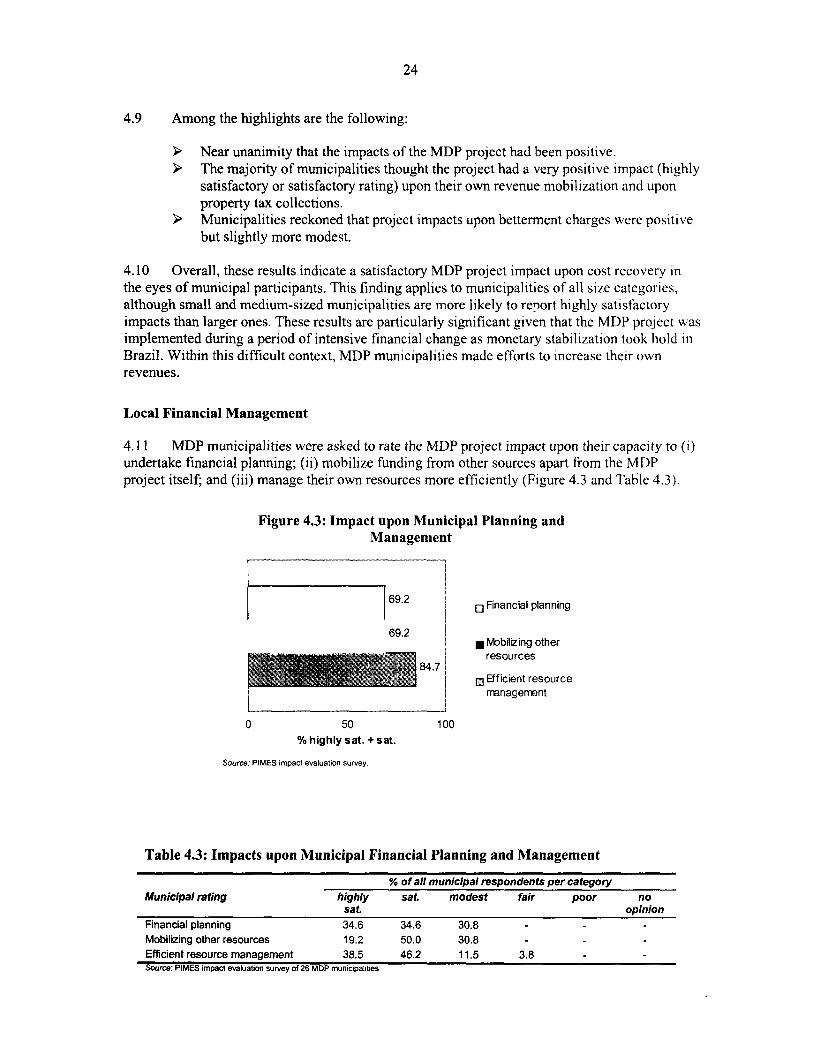
4.11 MDP municipalities were asked to rate the MDP project impact upon their capacity to (i)undertake financial planning; (ii) mobilize funding from other sources apart from the MDPproject itself; and (iii) manage their own resources more efficiently (Figure 4.3 and Table 4.3).
Figure 4.3: Impact upon Municipal Planning andManagement
69.2 62 Financial planning
69.2lVobilizing otherresources
84.7
:i Efficient resourcermanagenent
0 50 100
% highly sat. + sat.
Source: PIMES impact evaluation survey.
Table 4.3: Impacts upon Municipal Financial Planning and Management
% of all municipal respondents per categoryMunicipal rating highly sat. modest fair poor no
sat. opinionFinancial planning 34.6 34.6 30.8Mobilizing other resources 19.2 50.0 30.8 -
Efficient resource management 38.5 46.2 11.5 3.8 -Source: PIMES impact evaluation survey of 26 MDP municipalities
25
4.12 Among the highlights from the evidence are the following:
> A large majority of municipalities report very positively about MDP projects on allthree aspects of municipal financial planning and management.
> Impacts upon improved management of municipal resources were the best rated,with 84.7 percent reporting highly satisfactory or satisfactory.
4.13 These results point to a change in the old image of municipalities as mere public serviceproviders, toward being modem administrations seeking to promote and leverage local economicdevelopment. As examples of steps toward better management, municipalities most oftenmentioned:
* more reliable management reports resulting in better internal controls;* streamlining of information flow through management information systems,
enabling better-informed management decisions;* better understanding of taxation laws and regulations and hence better municipal
relationship with its regulator ("tribunal de contas"); and* greater emphasis upon municipal planning.* rigorous control over revenue collection.
Sub-project Management and Implementation
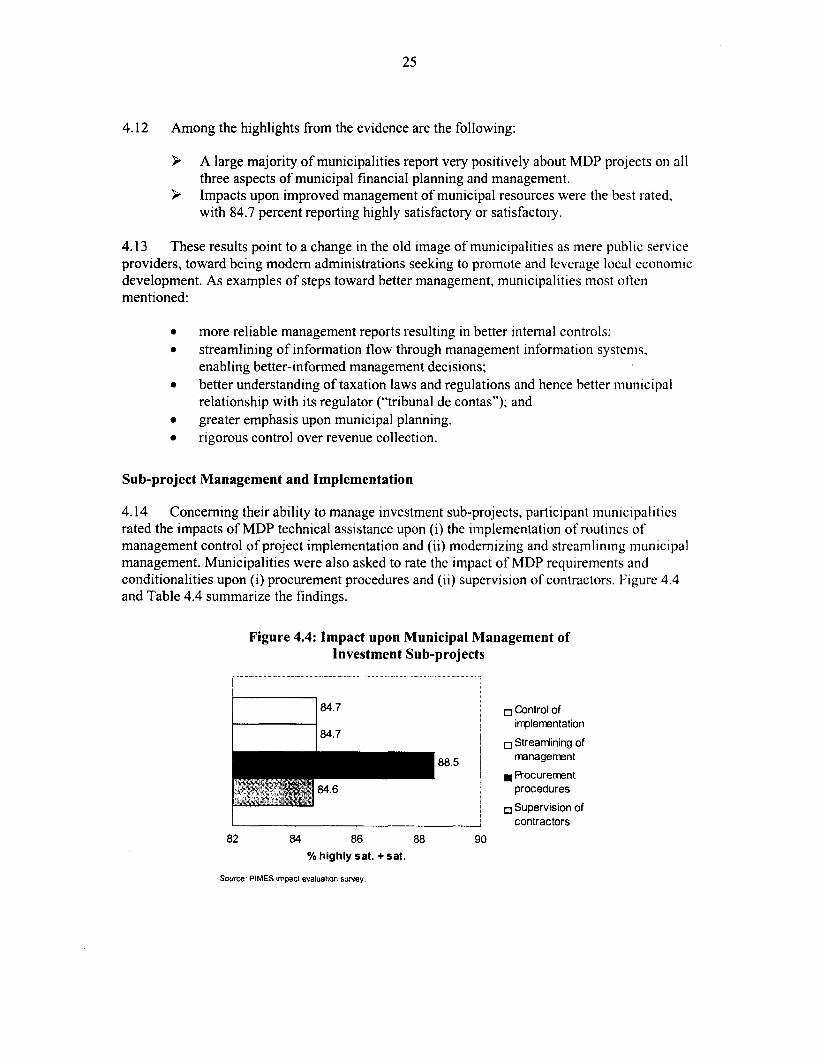
4.14 Concerning their ability to manage investment sub-projects, participant municipalitiesrated the impacts of MDP technical assistance upon (i) the implementation of routines ofmanagement control of project implementation and (ii) modernizing and streamlining municipalmanagement. Municipalities were also asked to rate the impact of MDP requirements andconditionalities upon (i) procurement procedures and (ii) supervision of contractors. Figure 4.4and Table 4.4 summarize the findings.
Figure 4.4: Impact upon Municipal Management ofInvestment Sub-projects
84.7 [3 Control ofirplermentation
84.7O Streanlining of
88.5 nanagenent8 Procurement
84.6 procedures
0 Supervision ofcontractors
82 84 86 88 90% highly sat. + sat.
Source: PIMES impact evaluation survey.

26
Table 4.4: Impacts upon Municipal Management of Investment Sub-projects
% of all municipal respondents per categoryMunicipal rating highly sat modest fair Poor no
sat opinionControl of implementation 46.2 38.5 11.5 - - 3.8Streamlining of management 38.5 46.2 11.5 - - 3.8Procurement procedures 26.9 61.6 11.5 - - -
Supervision of contractors 34.6 50.0 15.4 - - -
Source: PIMES impact evaluation survey of 26 MDP municipalities.
4.15 Among the highlights:
> Most municipalities give high ratings (highly satisfactory and satisfactory) to MDPimpacts on all aspects of municipal management of investment sub-projects.
> The strongest impact was felt by municipalities upon the control of sub-projectimplementation. Through the MDP project, many municipalities learned to applycontrol systems to monitor the physical and financial progress of their sub-projectsfor the first time.
> Municipalities reported favorable MDP impacts upon how they learned to superviseprivate contractors and the works undertaken by them better.
> Finally, special attention should be drawn to procurement procedures; although thetop rating (highly satisfactory) did not score as high as others, only 11.5 percent ofrespondents reported that MDP impact on procurement was modest or less.
4.16 These results confirmed what the PIMES team had observed during its day-to-daymanagement of MDP project implementation. All participant municipalities, small ones inparticular, underwent a major "on-the-job" learning experience as they took advice directly fromPIMES staff or hired consultants to help them manage their investment projects more effectively.The MDP strategy in this regard was to provide as much information as possible tomunicipalities, including model procedures and techniques that they could use to help overcometheir shortcomings.
4.17 Regarding the specific issue of procurement procedures, evidence of favorable MDPimpacts comes also from routine reports of the municipalities' controllers, tribunal de contas.Tribunal reports (over the 1990-96 period) indicate that the incidence of errors by municipalitiesin procurement practices diminished significantly among participants of the MDP project.
Information Technology, Training, and Community Participation at the Municipal Level
4.18 The survey sought municipal opinions upon three other aspects related to the instrumentsof MDP impacts in a more general sense, rather than to a specific branch of municipal
management. Thus, municipalities were asked their opinions about the effectiveness and thequality of the MDP impacts through: (i) the use of information technology in the municipality;(ii) professional training provided under the MDP project; and (iii) community participation indecision making about investment projects. The answers are summarized in Figure 4.5 and Table4.5.

27
Figure 4.5: Impacts upon Computerization and Training
73.1. Information
technology80.9 rofessional
training73.1 Community
participaton
65 70 75 80 85%highly sat. + sat.
Source: PIMES impact evaluation survey.
Table 4.5: Impacts upon Computerization and Training
% of all municipal respondents per categoryMunicipal rating highly sat. modest fair Poor no
sat. opinionInformation technology 42.3 30.8 26.9 - -
Professional training 27.0 53.9 3.8 3.8 - 11.5Community participation 15.4 57.7 23.1 - -Source: PIMES impact evaluation survey of 26 MDP municipalities
4.19 Among the key findings are the following:
> Municipalities were very enthusiastic about innovations in information technologyprovided through the MDP project, nearly half of them rated MDP impact in thisarea as highly satisfactory.
> Municipalities also rated MDP training impacts positively, but less so in the highestcategory.
> Regarding community participation, all municipalities held positive but more variedviews about MDP impacts.
4.20 With rapid innovation in computer hardware and software, the PIMES team encountereda strong demand by municipalities for assistance in this area. In many cases, the introduction ofinformation technology even led to behavioral changes among municipal staff. Accustomed totraditional and obsolete procedures and routines, many of them were obliged to upgrade theirskills to retain a valid professional role within the administration. This in turn led to increaseddemand for training programs, many of them provided under the MDP project. The projectoffered a wide range of courses and programs, which were highly appreciated by municipaladministrations and their employees.
4.21 The positive results achieved in community participation took different forms.Sometimes participation was through local community associations, while at other timesnongovernmental organizations were involved. In cases of community facilities-day carecenters and health posts, for instance-financed through the MDP project, a project requirementcalled for stakeholders to set up "sectoral committees" and help manage these facilities. For otherprojects, consultation more often took the form of merely keeping citizens informed of worksplanned and in progress. More still has to be done in this area, but the PIMES team believes that

28
important first steps were taken under the MDP project. OED's performance audit in December1997 was conducted as a "participatory audit," which provided opportunities for the beneficiaries,including community representatives, to meet and discuss with those from state and localgovernment agencies the project experiences in Parani and RGS (OED 1998: Gonzalez andGonzalez 1997; Osorio 1997). As documented in the PARs, sub-projects such as street paving,day care centers, and health posts were implemented in poor communities, and their impacts onthe welfare of the inhabitants were significant. These conclusions were confirmed at theparticipatory audit workshops.
Conclusions and Recommendations
4.22 This survey was stimulated by the premise that the PIMES project had a major impact inpromoting sustained institutional development in the municipalities of the state of Rio Grande doSul. The PIMES project became a major development partner of municipalities during the 1990-96 period. It also became their only reliable source of funding as alternative sources through adhoc transfers from the federal and state governments practically dried up.
4.23 Through this survey, the following advances made in strengthening municipalities havebeen identified:
* fiscal adjustment and increasing own revenues at the municipal level;* more intense contacts between municipalities, private companies, and the
community;* municipal administrations became more entrepreneurial,* municipal employees became more highly valued as staff- and* more attention given to the environment.
4.24 Apart from these favorable results, the survey demonstrated that municipalities wereaware of the progress made thanks to the support of the project. More generally, awareness at themunicipal level helped local administrations seek new initiatives and elaborate successfulprojects. This finding was true independent of city size or location within the state.
4.25 Municipal awareness itself had an important side effect. Successful participantmunicipalities, whose officials were conscious of progress being made under PIMES, becamestaunch promoters of the project concept among municipalities that had yet to sign on.
4.26 The achievements of the PIMES project came at a time of major changes and difficultiesfor municipalities in the state of Rio Grande do Sul. The logical conclusion is that by helpingmunicipalities to stabilize, PIMES contributed to a more balanced approach to economicdevelopment at all levels.
4.27 As a development program, the PIMES project in Rio Grande do Sul has reachedadulthood and today constitutes a reliable source of funds for municipal development. Moreover,the project has been the object of study as a model for similar programs elsewhere in Brazil-thestates of Minas Gerais and Bahia-and in other countries.
29
5. Impacts on Local Economic Development
MDPs in the Philippines financed numerous revenue-generating sub-projects such aspublic markets. The case study of the MDP-financed public market in Pulilan shows thatthe project had significant impact on the development qf the local economy. The projectnot only stimulated employment and income generation, it also triggered the developmentof a new business center near the public market, which had significant spill-over effects.
Introduction
5.1 Most of the sub-projects financed by MDP in the Philippines were revenue-generating-economic enterprises such as public markets, bus terminals, and slaughterhouses. Under MDP I36 out of 42 participating municipalities financed a public market; under MDP II 30 out of 35participating municipalities did so. OED's performance audits of these two projects confirmedthat the impacts of such sub-projects on the local economy were significant (OED, 1997),especially for the small poor municipalities. For example, Pulilan, a municipality in Bulacanprovince, was in the lowest (sixth) income class of municipalities before it financed a publicmarket through MDP. By 1995, when the MDP project was completed, the municipality hadmoved up to the second income class, and the living standard of its 60,000 people had risensignificantly. During 1991-95, the income of the municipal government rose fourfold from 7million pesos to 25 million pesos.
5.2 This chapter reports the results of a study' that compared the impacts of an MDP-financed public market in Pulilan with conditions in Guiguinto, a municipality in the sameprovince which did not participate in the MDP program. The study compared a random sample of60 stall-holders in the Pulilan public market (experiment group) with a random sample of 60 stall-holders from several locations in Guiguinto (control group). Each sample included stalls sellingmeat, poultry, and fish; fruits, vegetables, and grains; and manufactured goods. Cirrus Researchand Software, a consulting firm in Manila, administered the field survey, prepared the data, andproduced the statistical results. A comprehensive but simple questionnaire (Annex C) was used togather information about location history, extent of markets, employment characteristics,commuting, sales, expenses, income, and the quality of infrastructure services at the market. Thequestionnaire was designed to capture changes over time from 1993 when the market opened to1998 when the survey was conducted. The survey also included the owners of 15 shops near themarket to capture the project's indirect impacts on the development of the local economy. Thefindings reported below highlight the differences between Pulilan's experience and that ofGuiguinto. Also reported are the results of statistical tests conducted between the two groupsregarding increases in sales and income and improvements in the quality of infrastructure servicesat the market.
The Public Market in Pulilan
5.3 Until 1992 when the MDP-financed public market was established, Pulilan had atraditional market (called "talipapa") near the municipal hall with about 20 vendors. When thepublic market opened in 1993 (in the Cutcot area), local entrepreneurs quickly occupied its 170stalls. Most of the vendors in the old market also moved there. Only two years later, using its own
7. This chapter is based on the results of a survey of public markets conducted by Cirrus Research and Software underthe direction of Mari-jo Luciano and under the overall supervision of Millie Villar and Vic Ignacio of the CentralProject Office. The questionnaire (Annex E) was designed jointly by the study teams in Washington and Manila.
30
resources, the municipal government added 32 stalls to the market to meet increasing demand. In1997, a second MDP sub-loan' financed 92 more stalls. As of August 1998, when the survey wasconducted, the market had a total of 294 stalls. Besides these fixed stall-holders, on Saturdaysabout 300 ambulant vendors come to the market grounds to conduct business.
5.4 The public market area has rapidly become a new business center in Pulilan. More than40 new small enterprises have opened near the market since its opening, including largerestaurants, drug stores, a gas station, rural banks, gift shops, and others. The market's adjacentlot has become a busy transport center with a large fleet of tricycles for shoppers and other typesof vehicles. The market not only had direct impact on the welfare of the stall-holders andPulilan's inhabitants but also had significant indirect economic impact, creating transport andcommercial linkages with the rest of the province and other parts of the country. The surveyfindings reported below support this conclusion.
5.5 Guiguinto, which never participated in MDP, has no markets comparable to the one inPulilan. The municipality has one privately established market and several small, informalmarkets. Conditions in the municipality today are similar to those of Pulilan before the MDPproject.
Survey Results
5.6 Of the 60 stall-holders in each sample, 16 (27 percent) relocated to the public market inPulilan while only 5 (8 percent) moved in Guiguinto, indicating that the Pulilan project triggeredchanges in location that may not have otherwise occurred. The stall-holders in Pulilan werecomparable to those of Guiguinto in employment size, number of female workers, hours worked,and monthly salary (Table 5.1). On average, at each stall about two people worked (with onefemale) for 11 hours a day, and the owner's monthly salary was about 18,000 pesos (aboutUS$430).
Table 5.1. Characteristics of Stall-holders (average value)
Pulilan Guiguinto AllNumber of workers (persons) 1.97 1.70 1.83Number of female workers (persons) 1.17 1.20 1.18Hours worked per day 11.30 10.60 10.95Owner's salary per month (pesos) 18,138 17,525 17,832
Change in Sales and Income
5.7 Table 5.2 shows that monthly sales and net income (after expenses) of stall-holders inPulilan more than doubled since they started business in the public market. The stall-holders inGuiguinto, by contrast, had only a slight increase in sales and net income. This large disparitycould have been influenced by the age distribution of the stall-holders in two groups. Twenty
8. The first MDP sub-loan for the public market was for 6.7 million pesos; the second was for 4.5 million. The publicmarket project has been self-financing and has a perfect record for meeting its loan repayment schedule. The mayorwould like to pay off the loan balance in advance if allowed. The market has generated net income (after expenses) ofmore than 2 million pesos per year since 1994 and contributed to municipal revenues. In 1997, the public marketoperation had a budget surplus of 3 million pesos (total revenue of 6 million less total expenditure of 3 million).According to estimates produced by the Central Project Office, as of 1995 its financial rate of return was 27 percentand its economic rate of return was 29 percent. The latter would have been higher had the indirect benefits to the stall-holders been taken into account.

31
stall-holders in Guiguinto started their business at the present location in 1997' which impliesthat they are vendors without fixed business locations. Taking into account this possible bias, thechange in sales and net income was substantially different the two groups.
Table 5.2. Change in Sales and Income
Pulitan (average) Guiguinto (average)First year 1998 % change First year 1998 % change
Monthly sales (pesos) 45,083 93,551 107.5 82,458 87,075 5.6Monthly net income (pesos) 10,921 23,783 117.8 17,382 22,726 30.7
5.8 To statistically test this difference without such a bias, the average value of sales andaverage net income for each age subgroup were calculated and the average annual increases insales and net income were estimated. Based on this constructed data, the null hypothesis--that theaverage annual increases in sales and net income (in real terms) were the same between the stall-holders in Pulilan and those in Guiguinto-can be rejected. The "t" values were 2.7 and 2.0,respectively, at a 5 percent level of significance.
5.9 For those 16 stall-holders in the Pulilan sample that moved to the public market fromanother location, the difference between their mean income at the previous location and that at thepresent location was statistically tested. The null hypothesis-that the mean income level was thesame at the two locations-was rejected. The "t" value was 2.4 at 5 percent level of significance.
5.10 Therefore, the impact of the MDP-financed public market in Pulilan on the increases insales and income of the stall-holders was significant compared to those in Guiguinto, and alsocompared to the level of income at the previous location for those stall-holders who relocated tothe public market from another location.
Commuting
5.11 Table 5.3 shows the median commuting distance from home to the market and themedian travel time for stall-holders in Pulilan and Guiguinto. Although the travel distance inPulilan is twice that in Guiguinto, the travel time was about the same for the two groups. Thisresulted from more efficient transport modes such as a large fleet of tricycles in Pulilan than inGuiguinto.
Table 5.3. Commuting Distance and Travel Time
Pulilan Guiguinto AllMedian commuting distance (kilometers) 3.0 1.5 2.4Median travel time-one way (minutes) 12 12 12
Quality of Infrastructure Services
5.12 The survey asked respondents to rate the quality of 12 infrastructure and municipalservices (listed in Table 5.4) at the time of the survey (1998) compared with the first year the
9. Age Distribution of Stall-holders (Number of stall-holders)
Year started Before 1993 1993 1994 1995 1996 1997Pulilan 11 17 7 8 10 7Guiguinto 16 4 4 5 11 20

32
stall-holder started business at the market. Four quality criteria were used: excellent, good, fair,and poor. Table 5.4 shows for each type of services the proportion of the respondents who ratedits quality as "excellent" or "good." For all items but telephone, the quality of services in the firstyear at the market was better in Pulilan than in Guiguinto. In the case of the Pulilan publicmarket, all services improved substantially over time except for the public toilet. Anyimprovements in facilities in Guiguinto were small and the quality of water supply, public toilet,ventilation, storage, and parking space declined during the period.
Table 5.4. Quality of Services at the Market (percent ofrespondents answering "excellent" or "good")
Pulilan GuiguintoFirst year 1998 First year 1998
Electricity 58 80 49 55Water supply 70 87 30 28Telephone 27 48 27 35Police protection 65 75 38 42Fire protection 70 82 30 32Garbage collection 87 91 32 32Sewerage and drainage 80 83 28 34Public toilet 73 65 22 20Ventilation 80 82 45 42Storage 38 43 22 20
Parking space 85 90 39 35Driveway 88 91 38 42Note: The response rate was 100 percent for the sample of 60 in both municipalities.
5.13 We tested the differences between proportions and rejected the null hypothesis that theproportions of quality ratings in Pulilan are the same as those of Guiguinto. The "t" values rangefrom 2.8 to 8.6 at the 5 percent level of significance (1.5 for telephone service, which was equallypoor in both municipalities).
Indirect Impacts
Expanding Market Linkages with other Municipalities and Regions
5.14 To evaluate the impact of the public market on the creation of transport and commerciallinkages with other municipalities and regions, the survey asked where the goods stall-holderssold had originated and where their customers come from. Tables 5.5 and 5.6 report the origins ofgoods and customers by three categories: from the municipality, from the province, and fromoutside the province.
Table 5.5. Origin of Goods to be Sold at theMarket (mean percentage for each cell)
Pulilan Guiguinto All
From municipality 22.3 14.3 18.3From province 28.4 55.1 41.8From outside province 49.3 30.6 39.9

33
Table 5.6. Origin of Customers to theMarket (mean percentage for each cell)
Pulilan Guiguinto AllFrom municipality 79.6 90.9 85.2From province 15.3 7.0 11.2From outside province 5.1 2.1 3.6
5.15 About half of the goods sold in the Pulilan public market come from outside the province,while a little over half of the goods sold in Guiguinto come from within the province. More than90 percent of the customers in Guiguinto markets are from the municipality, while in Pulilan 15percent come from the province and 5 percent come from outside the province. The findingsshow that the public market in Pulilan established wider transport and commercial linkages withlocations outside the province than Guiguinto did.
Employment Side-Effects
5.16 Twenty eight percent of stall-holders in Pulilan and 17 percent in Guiguinto said that theybegan having a housemaid after they started business at the markets and pay 1,500 pesos permonth for the service. This shows that the public market had an indirect side-effect onemployment generation in addition to the jobs created at the market.
5.17 The survey included 15 small business enterprises near the public market in Pulilan and15 near the informal markets in Guiguinto to capture indirect impacts. In Pulilan 14 out of 15enterprises were established since 1995, indicating rapid expansion of economic activities in thepublic market area. The types of businesses included car services (gas station), banking, tiles,restaurants, clothing, electronics, and drug stores. The average size of employment at theseenterprises was 3.3 persons in Pulilan and 2.3 in Guiguinto.
Emerging Real Estate Market
5.18 According to the municipal government staff in Pulilan, the land price in the publicmarket area was 55 pesos per square meter in 1992 before the market was established. Theresidential area nearby sells at more than 12,000 pesos per square meter in 1998. The surveyfound that 10 of the 15 small enterprises interviewed in Pulilan were renters with an average floorspace of 76 square meters, indicating an active real estate market emerging in the public marketarea. The average floor space of the small enterprises interviewed in Guiguinto was much less,only 41 square meters.


35
6. Agenda for the Future
Changing Demand for Project Finance
6.1 International experience shows that municipalities have different financing needsdepending on their size and their stage of socio-economic development. In the Philippines MDPprogram, which is demand-driven without any restriction, small, resource-poor municipalitiestend to finance rather simple, low-risk, revenue-generating projects first, such as public markets.After successfully completing such a sub-project, they can enhance their creditworthiness withthe increased revenues coming from the project. Then they can expand their investments in publicinfrastructure projects such as roads and drainage (OED, 1997). As municipalities grow, theyhave an increasing need to finance economic infrastructure for production activities such asmanufacturing and commerce as well as social infrastructure for household consumption. Theyare eventually ready to "graduate" from the MDP program and start borrowing from the privatecapital market. Experiences in both the Philippines and Brazil show such progress. This catalyticrole is analogous to the role of the World Bank in helping developing countries until they"graduate" from the Bank.
MDP in ParanA
6.2 ParanACidade (the ongoing Urban Development Fund project financed by theInteramerican Development Bank) has been expanding its operations as a self-financing privatefinancial intermediary. ParandCidade has entered a new phase of providing more diversifiedfinancial services and types of sub-loans. Diversifying the sub-loan product mix to includerevenue-generating sub-projects (with positive externalities such as public markets) could comesooner than diversifying financial services since the latter would depend on the speed of overallcapital market development in Brazil. New financial services could include managing bond issuesfor selected municipalities, introducing risk guarantee functions, and developing mechanisms forthe private sector participation through build-operate-transfer, concessions, and managementcontracts for specific services such as certain maintenance functions. As a "best practice case"ParandCidade is ready to take these challenges and is pushing the frontier of the MDP program. Itwill continue to provide useful lessons for MDPs in Brazil and elsewhere.
MDP in Rio Grande do Sul
6.3 This MDP program regained its momentum and enthusiasm with the return of its original"champions" in the state government in 1995. In 1998, the fund's operations expanded inresponse to high demand and strengthened its financial position. The continued state governmentprotection of the organizational integrity of PIMES within BANRISUL will be crucial for thesustainability of FUNDOPIMES as it pursues further institutional growth. As in Parani, thefuture will require diversification of the loan product mix to include revenue-generating sub-projects and eventually diversification of financial services.
MDP in the Philippines
6.4 To meet the strong demand for MDP financing from LGUs, the Central Project Officeprepared a follow-on project, MDP III, which was approved by the Board in March 1992. MDPIII was a continuation of MDP I and II to strengthen the institutional development process being
36
achieved under the program and to expand development assistance to more LGUs. MDP III wasalso very timely as it was to help the national government develop and carry out itsdecentralization program after the Local Government Code was revised in 1991. The design andcomponents of MDP III were similar to those of MDP I and II, but it did not target any particularregions.
6.5 The fourth follow-on project (LOGOFIND) has been appraised and will be negotiatedearly in 1999. Within a broad policy reform framework (Llanto, et al., 1996), LOGOFIND willaddress the issues associated with the down side of the bottom-up, demand-driven project design.The self-selection process tends to generate competition among LGUs and only those that arecreditworthy and capable of making necessary policy changes are able to participate in the MDPand have access to credit. Many LGUs that are poor and non-creditworthy have been left out,widening interregional income disparities. LOGOFIND intends to implement a policy frameworkaimed at "graduating" more successful LGUs to the private financial markets while providingassistance to weaker LGUs.
37
7. Conclusions and Lessons
The study concludes that MDP operations help reform at the local level;municipalities are aware that participation is a commitment to reform; improvedfiscal performance goes hand in hand with management strengthening that givesmayors a more entrepreneurial view of their administrations; and municipalitiesare more sensitive to MDP impacts the deeper MDP funding goes. Based on thesefindings, the study recommends that MDP policy reform instruments be diversifiedto broaden project impacts;for successful impacts, good project design imust beachieved as later course correction is difficult; competition among municipalitiesshould be promoted through disseminating success stories; MDP projects shouldbe tried even when macroeconomic and political change is rife as the projects havebeen shown to have favorable impacts in such circumstances. The most importantelement for success, however, is in a sound policy and fiscal decentralizationframework.
Conclusions
7.1 The principal findings of this study are as follows:
> MDP operations help refbrmn at the level of local government. Participantmunicipalities increase their fiscal autonomy through collecting more of their ownrevenues-especially property taxes-than non-participants. In a fiscal sense,autonomy helps municipalities have better chances of access to further MDP fundsand to other loans. It also helps them pay off existing obligations. In a political sense,more autonomy gives municipalities a greater role in decentralized decision-making.Local project authorities at the state/provincial level see MDP as an instrument ofreform. Its effectiveness is assured when there are no competing sources of finance oneasier terms for municipalities. Detailed design of MDP projects is crucial indetermining direction of impacts. The MDP projects studied here focused uponproperty tax improvements, precisely the area of municipal finance where the projectimpacts were strongly felt.
> Municipalities consciously perceive MDP participation as a process of reform.Municipalities are not just passive agents of MDP. Best practice municipalities of allsizes consciously buy into MDP's reform program. They are acutely aware of theimprovements planned, conditions attached, what they have to do to take part and, ofcourse, the final achievements made. They associate successful MDP participationwith innovations in their own administrations and their ability to plan and implementsuccessful sub-projects.
A Inproved fiscal performance goes hand-in-hand with management strengthening. TheMDP projects evaluated here started with a level playing field as far as fiscalperformance at the municipal level was concerned. By many indicators-fiscalautonomy, own revenues per capita, budget balance-the performance of participantmunicipalities was better than that of non-participants. As part of the overallimprovement, technical assistance provided through MDP operations helpedmunicipalities become more entrepreneurial, think more about fiscal adjustment, valuetheir staff more highly, interact more closely with private companies and the localcommunities, and be more environmentally conscious.

38
> MDP impacts are sensitive to project leverage. The more closely involvedmunicipalities were in MDP projects, as measured by the share of all their investmentsfunded by MDP, the greater the project impacts upon municipal own revenuegeneration. Being more closely bound up with-and dependent upon-an MDPoperation makes a municipality more likely to follow project policy prescriptions andbe successful in doing so.
> MDP in the Philippines attracted revenue-generating projects. Because of the strictlydemand-driven approach followed in the Philippines, MDP first attracted revenue-generating sub-projects such as public markets. These presented minimum risks forimplementation delays and cost recovery. With the revenues from such projects, theparticipating municipalities were able to enhance their creditworthiness with a strongerfinancial base. This in turn allowed them to expand their investments to infrastructureprojects such as roads, drainage, water supply, and sanitation.
Lessons for Future Operations
7.2 The MDP project experience offers many lessons. The most important are as follows:
MDP policy reform instruments should be diversified. It is important to replicate thesuccess of improving property taxes to other revenue items that make up the remainingthree-quarters of municipal own income in both Brazil and the Philippines. In the caseof Brazil, for instance, future MDP attention might focus upon the widespread LocalService Tax, an increasingly important source of municipal revenue. Designs of futureMDP operations should directly address how to help improving the performance ofbig-ticket items such as these. As in the case of the Philippines, MDP financing ofrevenue-generating projects such as a public market can play a catalytic role in thedevelopment of local economy.
Good design at the outset is crucial to satisfactory MDP impacts. As a municipality'sfirst encounter with an MDP program is crucial, setting the tone for futureparticipation, it is important to carefully calibrate the designs of future MDPoperations at the outset. Conditions and requirements also should be very transparentand easily understood by new municipal participants. Experience shows that an initialmisconception by a municipality-that direct cost recovery is not an MDP projectrequirement, for instance-can prove very difficult to correct later on in a follow-onoperation. It is important to try to get everything right and clear at the outset.
It is important to promote competition through disseminating success stories. Bestpractice municipal participants are an MDP operation's own best promoters. Projectmanagers should take advantage of this important MDP side effect by disseminatingthe experiences of these municipalities, especially among non-participants.
MDP projects can have satisfactory impacts even when change and volatility are rife.The experience of the MDP projects in both Brazil and the Philippines-implementedat a time of major macroeconomic adjustment and political change---demonstrates thatMDP projects can succeed even when macro conditions have yet to stabilize. MDPprojects were implemented during the period of severe macro instability in early 1990sin Brazil and after the "People's Revolution" of 1986 in the Philippines.

39
References
Davoodi, Hamid and Heng-fu Zou. 1998. "Fiscal Decentralization and Economic Growth: ACross Country Study," Journal of Urban Economics. Vol. 43, pp. 244-257.
Gonzalez, Marco and Rodrigo Gonzalez. 1997. Participatory Evaluation Workshop: PIMESProject, Novo Hamburgo. Consultant Report, Operations Evaluation Department, TheWorld Bank.
Lee, Kyu Sik and Alex Anas. 1992. "Costs of Deficient Infrastructure: The Case of NigerianManufacturing." Urban Studies. Vol. 29, pp. 1071-1092.
Lee, Kyu Sik, Alex Anas, and Gi-Taik Oh. 1999. "Costs of Infrastructure Deficiencies inManufacturing in Indonesia, Nigeria, and Thailand." Urban Studies (forthcoming). Alsoavailable as World Bank Policy Research Working Paper No. 1604 (1996).
Llanto, G.M. and et al. 1996. Local Government Units'Access to the Private Capital Markets.Philippines Institute for Development Studies.
Operations Evaluation Department. 1997. Philippines: Perfornance Audit Report, MunicipalDevelopment Project (Loan 2435-PH) and Second Municipal Development Project (Loan3146-PH). Report No. 16800 (June 12), The World Bank.
Operations Evaluation Department. 1998. Brazil: Performance Audit Report, MunicipalDevelopinent Projects in the State of Parand (Loan 3100-BR) and in the State of RioGrande do Sul (Loan 3129-BR). Report No. 18011 (June 12), The World Bank.
Osorio, Hector Hernan. 1997. Participatory Evaluation Workshop, FEDU Project, Sao Jose dosPinhais. Consultant Report, Operations Evaluation Department, The world Bank.
Picciotto, Robert and Rachel Weaving. 1994. "New Project Cycle for the World Bank?" Financeand Development. The World Bank.
Secretariat of Urban Development, State of ParanA. 1997. Urban Policy in the State of Parand:Lessons of Experience, Challenge and Opinions for the Future. International RoundtableMeetings.
Special Program Department (PIMES). 1998. Avaliacao de Impacto do FUNDOPIMES. RioGrande do Sul State Development Bank (BANRISUL).


41 Annex A
Data and Methodology
Data Collection
Local Finance Data: Brazil and the Philippines
1. The study designed and developed a database with detailed unpublished data on thefinances of 427 municipalities in the State of Rio Grande do Sul, 323 municipalities in the Stateof Parand in Brazil, and 53 municipalities in two provinces, Bulacan and Laguna, in thePhilippines. The database design focused upon 15 selected variables of municipal revenues andexpenditures for each state in Brazil and each province in the Philippines. A very large body ofdata was available for each country's municipalities, covering in Brazil up to 75 detailedvariables at the municipal level for every year during 1990-96, the period of projectimplementation.
2. For this reason, the study had to be selective and use only data immediately relevant tomeasuring the impacts of these projects. More than 300 analytical tables were produced to obtainthe results reported in this study. The availability of the data for all municipalities in individualstates and provinces made it unnecessary to draw samples, since analysis could include the entirepopulation of municipalities. Very small (population <2,000) and very large (population>250,000) municipalities were excluded from the data analysis to keep possible outliers fromdistorting observations of the average performance of municipalities. At the design stage of thestudy, specific hypotheses of impact were used to help select key variables for evaluation fromamong the vast array of data available.
Survier of Mayors: Rio Grande do Sul
3. A sample survey of mayors was conducted for 26 municipalities in Rio Grande do Sul toevaluate the project's impacts on municipal capacity building in the areas of financialmanagement and administration including planning, budgeting, and accounting practices;investment project preparation and implementation; and technical capability of staff. Thequestionnaire was drafted jointly with the Bank's audit mission, and the study was coordinated bya Bank consultant.
Public Market Enterprise Survey: Philippines
4. To evaluate the impacts of MDP-financed public market on the development of the localeconomy, Pulilan in Bulacan province of the Philippines was selected as the project municipality.A random sample of 60 stall-holders in the Pulilan public market were selected as the"experiment group" and they were asked about their location history, employment characteristics,commuting patterns, the extent of the markets, changes in sales, expenses, and income during1993-98, improvements of services, and their potential for further growth. In addition, 15 smallshop owners (retail, services, finance, and manufacturing located near the public market) wereinterviewed to document indirect effects of the project on the development of the area coveringemployment creation, land price changes, and the emerging business district. To contrast andcompare the "experiment group," Guiguinto was selected as the non-project municipality in thestudy, and a random sample of 60 stall-holders in several privately organized informal marketsand 15 shop-owners in Guiguinto were selected as a "control group." The same questionnaire

42 Annex A
used in Pulilan was used in Guiguinto to collect the data for a total of 120 stall-holders and 30shop-owners in the study sample. The questionnaire used is reproduced as Annex E.
Additional Points of Methodology for Chapter 3
5. Because of the rigorous reporting requirements of official controllers of local governmentin both countries, a very large body of information on the finances of municipalities is collectedand made available in Brazil and the Philippines. This allowed the gathering of detailed timeseries and cross-sectional data on all municipalities in all four states/provinces where the MDPprojects were implemented. Table Al details the universe of the study at the level of groups ofmunicipalities.
Table Al: Municipalities Evaluated
Number of study municipalities per cohortState/province All Large' Medium" SmalfBrazilParticipants (Paranb) 316 24 156 136Non-participants (Parand) - - - -Participants (Rio Grande do Sul - RGS) 132 24 52 56Non-participants (RGS) 185 12 67 106Total: 633 60 275 298PhilippinesParticipants (Bulacan) 17 14 3 -Non-participants (Bulacan) - - -
Participants (Laguna) 4 4 -
Non-participants (Laguna) 15 - 15 -
Total: 36 18 18 -Source: MDP IES databasea. population 50,000 - 250,000b. population 10,000 - 50,000c. population 2.000 - 10.000RGS = Rio Grande do Sul..Very large (pop. >250,000) and very small (pop. <2.000) muriipalities were truncated from the population of all municipalities evaluated by this study.
6. Thus, the finances of 669 municipalities, 78.7 percent of the total, were reviewed.Excluded from the study were 140 newly created (and mostly small) municipalities in Brazil forwhich time series data did not go back to 1990.0 The Brazilian sample was also truncated byexcluding eight very large municipalities with more than 250,000 inhabitants each and 16 verysmall ones with fewer than 2,000 inhabitants each. Besides eliminating "outliers" from the study,this also gave each country's group of municipalities a similar demographic distribution helpingto make comparative observations across countries more robust. Finally, 17 municipalities wereexcluded from the Philippines that had participated only in MDP technical assistance withoutborrowing under the program; they qualified neither as MDP participants nor as members of acontrol group of non-participants.
7. A central feature of the evaluation design is a comparison of the performance of MDPmunicipalities with the performance of a control group of similar municipalities that did notparticipate in MDP. In Rio Grande do Sul, 185 municipalities-represented in all threepopulation cohorts-did not participate in MDP and provided a natural control group. Parani hadno similar control group, as MDP had covered 100 percent of the municipalities. A second-best
10. Most new municipalities were very small. There were 48 such new municipalities in Parand (average pop. 8,090).In Rio Grande do Sul, 20 participated in the project (average pop. 5,545) and another 72 did not (average pop. 3,929).

43 Annex A
solution to evaluate the performance of ParanA participant municipalities was to compare it withthat of the control group of non-participants in Rio Grande do Sul. A similar design was used forthe Philippines, where Laguna province offered the best control group since MDP coverage inBulacan, as in Parand, had been nearly 100 percent.
8. Comparisons were made using a series of indicators of municipal fiscal performance.Empirical observation of the values of these indicators permitted identification of two kinds ofdifferences: (i) those between MDP participants and non-participants; and (ii) those between theperformance of MDP participants before the project and the same participants after the project.The values of all indicators were tabulated by estimating mean values across groups ofmunicipalities. For property tax per capita, for example, the mean value of all municipalities wasestimated across analytical categories (for example, all participants RGS, large non-participantsLaguna). In other words, the estimates were mean values for the indicators of each municipalitywithin the category; the estimates do not represent the mean value for the category as a whole. Byfocusing upon estimates of average values of these indicators across individual municipalities, theevaluation could more effectively meet its objective of highlighting the effects of MDP impacts atthe level of individual municipalities.
9. Strictly speaking, within an experiment design, data analysis should be limited tocomparisons between 132 participating municipalities (as the experiment group) versus 185 non-participating municipalities (as the control group) in the state of Rio Grande do Sul (see TableAl), since the policy environment and the implementation strategy were different between Parandand RGS. Nevertheless, the study team decided to report the results of the Parand data togetherwith those of RGS to evaluate the general patterns of the project impacts across states because theproject design was identical in the two states. In the Philippines, all municipalities in the provinceof Bulacan participated in MDP, so Laguna, where a large number of municipalities did notparticipate in MDP, was chosen as a control group. Therefore, in the empirical results reported inthis document, the focus of analysis should be given to the comparison between the control andthe experiment groups in RGS and other results should be viewed as being supplementary.


45 Annex B
Additional Data Analysis of Municipalities By Population SizeCategory
Introduction
1. This annex presents additional details of the evaluation of MDP project impacts uponmunicipal fiscal and financial management reported in Chapter 3. Here the same indicators areanalyzed, but disaggregated by municipal size according to population cohorts. In this annex, thecohorts are defined as follows: (i) large municipalities are those with 50,000--250,000 inhabitants;(ii) medium municipalities with 10,000-50,000 inhabitants; and (iii) small municipalities with2,000-10,000 inhabitants.
Municipal Financial Autonomy Versus Revenue Sharing
2. As in Chapter 3, the analysis here looks at two indicators of financial autonomy at themunicipal level: (i) municipal own revenues as a share of all current revenues; and (ii) municipalown revenues per capita. Tables Bl-B3 summarize the data regarding the first indicator bypopulation size of municipality.
Table Bl: Impacts upon Financial Autonomy - Large Municipalities (pop. 50,000-250,000)
Own revenues' share of all current revenues at municipal level (percent)Brazil Philippines
1990 1996 % change 1990 1996 % change(A) (B) (B/A) (D) (E) (EID)
Participants (Paran6) 27.5 32.4 +17.8 Participants (Bulacan) 43.9 55.4 +26.2Participants (RGS) 24.8 23.7 -4.4 Participants (Laguna) 68.9 61.0 -11.5Non-participants (RGS) 20.2 19.7 -2.5 Non-participants (Laguna) - - -Source MDP IES database.Note See Tables 3.2 and 3.3
Table B2: Impacts upon Financial Autonomy - Medium Municipalities (pop. 10,000-50,000)
Own revenues' share of all current revenues at municipal level (percent)Brazil Philippines
1990 1996 % change 1990 1996 % change(A) (B) (B/A) (D) (E) (EID)
Participants (Paran6) 14.1 15.8 +12.1 Participants (Bulacan) 55.8 45.1 -19.2Participants (RGS) 17.6 19.1 +8.5 Participants (Laguna) - - -Non-participants (RGS) 15.1 16.1 +6.6 Non-participants (Laguna) 42.8 27.0 -36.9Source: MDP IES database.Note: See Tables 3.2 and 3.3
Table B3: Impacts upon Financial Autonomy - Small Municipalities (pop. 2,000-10,000)
Own revenues' share of all current revenues at municipal level (percent)Brazil Philippines
1990 1996 % change 1990 1996 % change(A) (B) (8/A) (D) (E) (EID)
Participants (Parana) 8.8 9.3 +5.7 Participants (Bulacan) - - -
Participants (RGS) 11.2 11.1 -0.9 Participants (Laguna) - - -
Non-participants (RGS) 13.8 11.8 -14.5 Non-participants (Laguna) - - -
Source: MDP IES database.Note: See Tables 3.2 and 3.3
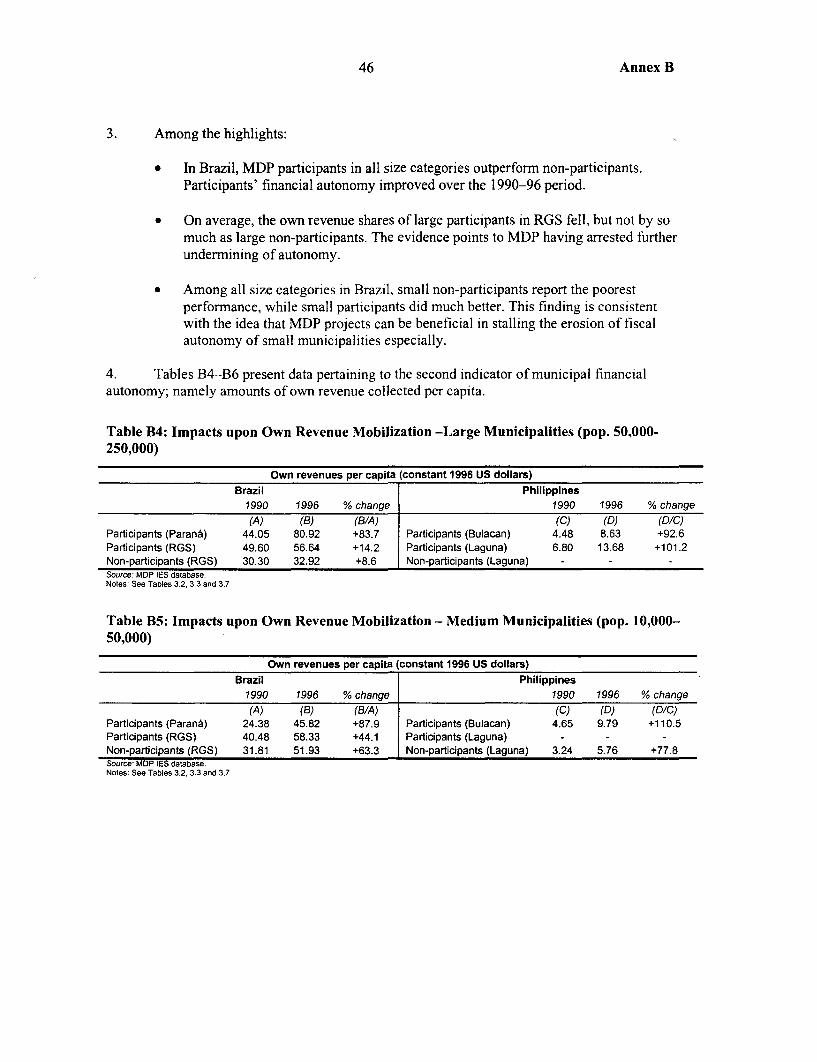
46 Annex B
3. Among the highlights:
* In Brazil, MDP participants in all size categories outperform non-participants.Participants' financial autonomy improved over the 1990-96 period.
* On average, the own revenue shares of large participants in RGS fell, but not by somuch as large non-participants. The evidence points to MDP having arrested furtherundermining of autonomy.
* Among all size categories in Brazil, small non-participants report the poorestperformance, while small participants did much better. This finding is consistentwith the idea that MDP projects can be beneficial in stalling the erosion of fiscalautonomy of small municipalities especially.
4. Tables B4-B6 present data pertaining to the second indicator of municipal financialautonomy; namely amounts of own revenue collected per capita.
Table B4: Impacts upon Own Revenue Mobilization -Large Municipalities (pop. 50,000-250,000)
Own revenues per capita (constant 1996 US dollars)Brazil Philippines
1990 1996 % change 1990 1996 % change(A) (B) (B/A) (C) (D) (DIC)
Participants (Parana) 44.05 80.92 +83.7 Participants (Bulacan) 4.48 8.63 +92.6Participants (RGS) 49.60 56.64 +14.2 Participants (Laguna) 6.80 13.68 +101.2Non-participants (RGS) 30.30 32.92 +8.6 Non-participants (Laguna) - - -Source: MDP IES database.Notes: See Tables 3.2, 3.3 and 3.7
Table B5: Impacts upon Own Revenue Mobilization - Medium Municipalities (pop. 10,000-50,000)
Own revenues per capita (constant 1996 US dollars)Brazil Philippines
1990 1996 % change 1990 1996 % change(A) (8) (B/A) (C) (D) (D/C)
Participants (Parant) 24.38 45.82 +87.9 Participants (Bulacan) 4.65 9.79 +110.5Participants (RGS) 40.48 58.33 +44.1 Participants (Laguna) - - -Non-participants (RGS) 31.81 51.93 +63.3 Non-participants (Laguna) 3.24 5.76 +77.8Source MDP IES database.Notes: See Tables 3.2, 3.3 and 3.7

47 Annex B
Table B6: Impacts upon Own Revenue Mobilization - Small Municipalities (pop. 2,000-10,000)
Own revenues per capita (constant 1996 US dollars)Brazil Philippines
1990 1996 % change 1990 1996 % change(A) (B) (B/A) (C) (D) (DIC)
Participants (Paran6) 21.80 31.45 +44.3 Participants (Bulacan) - - -
Participants (RGS) 31.31 74.27 +137.2 Participants (Laguna) - - -
Non-participants (RGS) 40.97 50.62 +23.6 Non-participants (Laguna) - - -
Source: MDP IES database.Notes: See Tables 3.2, 3.3 and 3.7
5. The highlights:
* The best performance among large municipalities in Brazil is that of Paranaparticipants. Large participants in RGS also did better than RGS non-participants.Since large municipalities in both states similarly share strong administrativecapabilities to improve own revenue mobilization, the study team looked fordifferent project impacts to explain the contrast. Being second-timers in MDPprojects, Parand municipalities had more time than their RGS counterparts to learnthat access to credit is helped by own resource mobilization. For this reason, largeParand municipalities may have been quicker to respond to respond to MDPincentives.
* The less favorable performance by small municipalities in ParanA reflects thedifficulty of monitoring the reform process (with FAP) for a large number ofparticipating municipalities as confirmed by the performance audit (OED, 1998).
* Smaller municipalities in RGS were more sensitive to the initial MDP shockimpact-when gaining access to credit for the first time-which will be sustainablein the long run only if they succeed in permanently consolidating theiradministrative capacity.
* Data for the Philippines reveal that participating municipalities in Bulacan did betterthan non-participants in Laguna in the medium size category.
Own Revenue Generation through Property Taxes
6. Tables B7-B9 present data on the performance of municipalities by size category inmobilizing property tax revenues per capita.
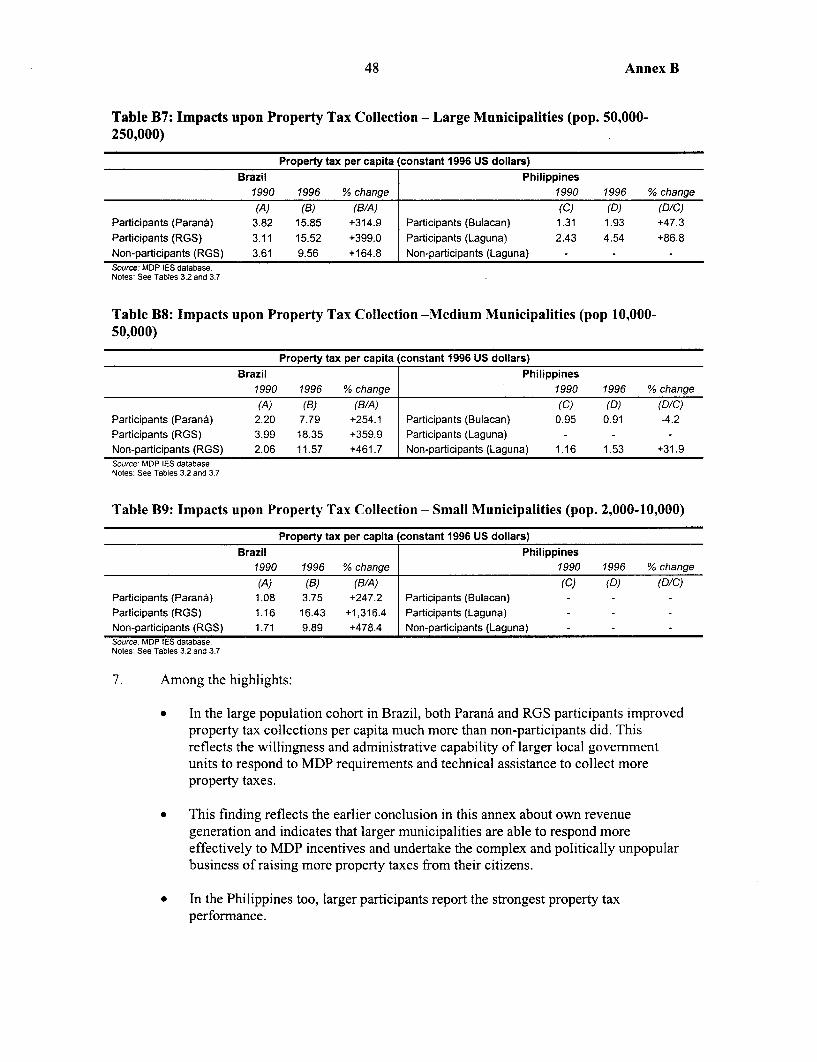
48 Annex B
Table B7: Impacts upon Property Tax Collection - Large Municipalities (pop. 50,000-250,000)
Property tax per capita (constant 1996 US dollars)Brazil Philippines
1990 1996 % change 1990 1996 % change
(A) (B) (B/A) (C) (D) (DIC)
Participants (Parant) 3.82 15.85 +314.9 Participants (Bulacan) 1.31 1.93 +47.3
Participants (RGS) 3.11 15.52 +399.0 Participants (Laguna) 2.43 4.54 +86.8Non-participants (RGS) 3.61 9.56 +164.8 Non-participants (Laguna) - - -Source: MDP IES database.Notes: See Tables 3.2 and 3.7
Table B8: Impacts upon Property Tax Collection -Medium Municipalities (pop 10,000-50,000)
Property tax per capita (constant 1996 US dollars)
Brazil Philippines1990 1996 % change 1990 1996 % change
(A) (B) (B/A) (C) (D) (D/C)Participants (Paran6) 2.20 7.79 +254.1 Participants (Bulacan) 0.95 0.91 -4.2Participants (RGS) 3.99 18.35 +359.9 Participants (Laguna) - - -
Non-participants (RGS) 2.06 11.57 +461.7 Non-participants (Laguna) 1.16 1.53 +31.9Source: MDP IES database.Notes: See Tables 3.2 and 3.7
Table B9: Impacts upon Property Tax Collection - Small Municipalities (pop. 2,000-10,000)
Property tax per capita (constant 1996 US dollars)
Brazil Philippines1990 1996 % change 1990 1996 % change
(A) (B) (B/A) (C) (D) (DIC)
Participants (Parana) 1.08 3.75 +247.2 Participants (Bulacan) - - -
Participants (RGS) 1.16 16.43 +1,316.4 Participants (Laguna) - - -
Non-participants (RGS) 1.71 9.89 +478.4 Non-participants (Laguna) - - -
Source. MDP IES database.Notes: See Tables 3.2 and 3.7
7. Among the highlights:
* In the large population cohort in Brazil, both Parana and RGS participants improvedproperty tax collections per capita much more than non-participants did. Thisreflects the willingness and administrative capability of larger local governmentunits to respond to MDP requirements and technical assistance to collect moreproperty taxes.
* This finding reflects the earlier conclusion in this annex about own revenuegeneration and indicates that larger municipalities are able to respond moreeffectively to MDP incentives and undertake the complex and politically unpopularbusiness of raising more property taxes from their citizens.
* In the Philippines too, larger participants report the strongest property taxperformance.
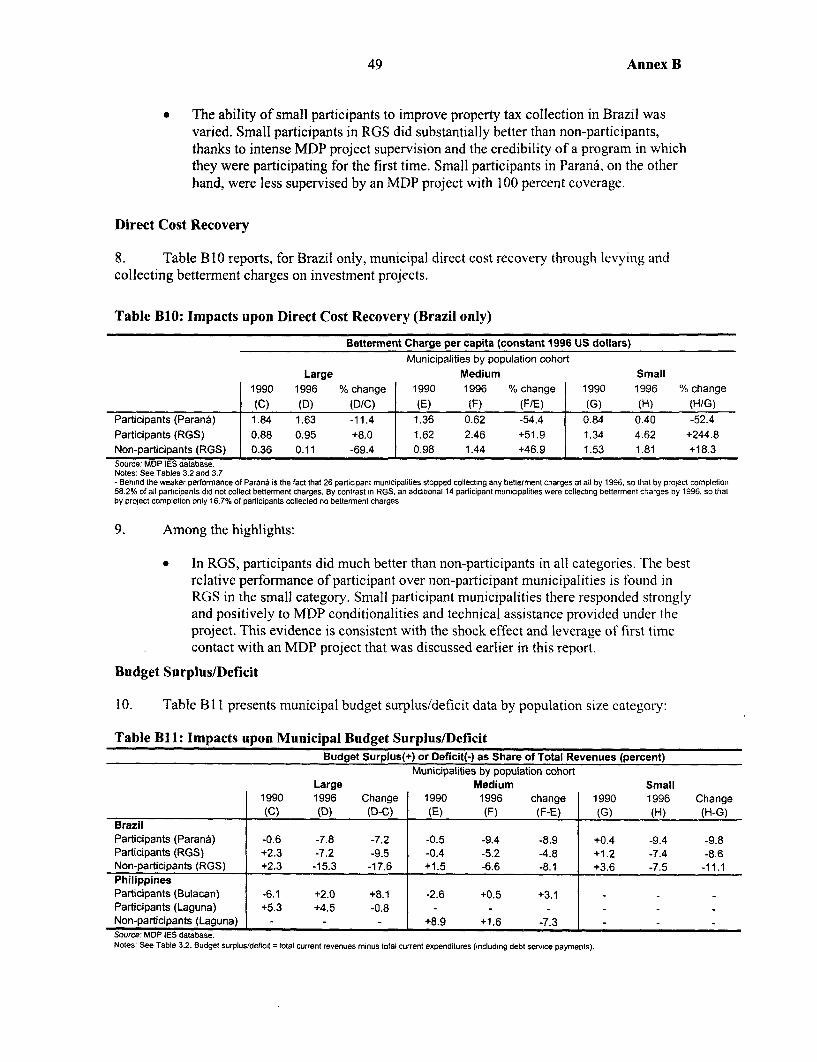
49 Annex B
* The ability of small participants to improve property tax collection in Brazil wasvaried. Small participants in RGS did substantially better than non-participants,thanks to intense MDP project supervision and the credibility of a program in whichthey were participating for the first time. Small participants in Parand, on the otherhand, were less supervised by an MDP project with 100 percent coverage.
Direct Cost Recovery
8. Table B10 reports, for Brazil only, municipal direct cost recovery through levying andcollecting betterment charges on investment projects.
Table B10: Impacts upon Direct Cost Recovery (Brazil only)
Betterment Charge per capita (constant 1996 US dollars)Municipalities by population cohort
Large Medium Small1990 1996 % change 1990 1996 % change 1990 1996 % change
(C) (D) (DIC) (E) (F) (FIE) (G) (H) (H/G)Participants (Parant) 1.84 1.63 -11.4 1.36 0.62 -54.4 0.84 0.40 -52.4Participants (RGS) 0.88 0.95 +8.0 1.62 2.46 +51.9 1.34 4.62 +244.8Non-participants (RGS) 0.36 0.11 -69.4 0.98 1.44 +46.9 1.53 1.81 +18.3Source: MOP IES database.Notes: See Tables 3.2 and 3.7- Behind the weaker performance of Parani is the fact that 26 participant municipalities stopped collecting any betterment charges at all by 1996, so that by project completion58.2% of all participants did not collect betterment charges. By contrast in RGS, an additional 14 participant municipalities were collecting betterment charges by 1996. so thatby project completion only 16.7% of participants collected no betterment charges.
9. Among the highlights:
* In RGS, participants did much better than non-participants in all categories. The bestrelative performance of participant over non-participant municipalities is found inRGS in the small category. Small participant municipalities there responded stronglyand positively to MDP conditionalities and technical assistance provided under theproject. This evidence is consistent with the shock effect and leverage of first timecontact with an MDP project that was discussed earlier in this report.
Budget Surplus/Deficit
10. Table BI I presents municipal budget surplus/deficit data by population size category:
Table BI1: Impacts upon Municipal Budget Surplus/DeficitBudget Surplus(+) or Deficit(-) as Share of Total Revenues (percent)
Municipalities by population cohortLarge Medium Small
1990 1996 Change 1990 1996 change 1990 1996 Change(C) (D) (D-C) (E) (F) (F-E) (G) (H) (H-G)
BrazilParticipants (Parana) -0.6 -7.8 -7.2 -0.5 -9.4 -8.9 +0.4 -9.4 -9.8Participants (RGS) +2.3 -7.2 -9.5 -0.4 -5.2 -4.8 +1.2 -7.4 -8.6Non-participants (RGS) +2.3 -15.3 -17.6 +1.5 -6.6 -8.1 +3.6 -7.5 -11.1PhilippinesParticipants (Bulacan) -6.1 +2.0 +8.1 -2.6 +0.5 +3.1 - - -
Participants (Laguna) +5.3 +4.5 -0.8 - - -
Non-participants (Laguna) - - +8.9 +1.6 -7.3Source: MOP IES database.Notes: See Table 3.2. Budget surplus/deficit = total current revenues minus total current expenditures (including debt service paymenls).

50 Annex B
11. Among the highlights:
* Large participants in both Parani and RGS outperformed non-participants. Largeparticipants in Bulacan reported a significant improvement as, on average, theymoved out of deficit into surplus. These findings demonstrate a similaradministrative strength of larger municipalities in the Philippines reported earlier forthe case of Brazil.
* Medium-sized RGS participants also performed better than non-participants, asmedium-sized participants also did in the Philippines.
* For small municipalities, the differences of performances by participants and non-participants were not very large, participants performed better over time.
Financial Deepening
12. For the case of Brazil only, the data in Table B12 report municipal level performance bydegrees of involvement in the MDP projects:
Table B12: Impacts upon Own Revenues by Degree of Financial Deepening (Brazil only)
Own revenues per capita (constant 1996 US dollars)MDP participant municipalities by population cohort
Large Medium Small1990 1996 % 1990 1996 % 1990 1996 %
change change change(C) (D) (D/C) (E) (F) (F/E) (G) (H) (HIG)
ParaniDeep 36.42 87.91 +141.4 19.61 38.65 +97.1 18.06 39.72 +119.9Medium 43.91 76.54 +74.3 27.79 43.75 +57.4 19.92 32.96 +65.5Shallow 49.29 80.63 +63.6 26.15 52.83 +102.0 23.70 28.24 +19.2Rio Grande do SulDeep 28.65 46.35 +61.8 39.95 63.60 +59.2 20.75 37.52 +80.8Medium 63.91 67.39 +5.4 33.49 48.66 +45.3 41.39 38.32 -7.4Shallow 56.25 56.18 -0.1 36.83 46.77 +27.0 30.00 116.14 +287.1Source: MDP IES database.Notes: See: Tables 3.2 and 3.7. Financial depth defined as the share of total 1990-92 municrpal investment accounted for by MOP project funding Three groups asfollows: (a) "Deep" = > 50%; (b)"Medium" = 25-50%; and (c)"Shallow" = <25%.
13. Among the results:
* The effects of MDP project leverage can be found among all size groups ofmunicipalities. This means that project leverage can affect MDP impacts within allthree categories of municipalities studied here, large, medium, and small.
* Apparently, there are two exceptions: (i) unexpectedly medium-sized "shallow"participants in Parana perform as well as "deep" ones; and (ii) small "shallow"participants outperform all others within their size category. Both are theconsequence of the exceptional performance of a few municipalities creating bias inthe category means reported here.

51 Annex C
Performance Audit of the Brazil MDPs:Lessons and Recommendations
1. Following are the lessons drawn and recommendations made at the project level in thePerformance Audit Report (OED, 1998).
2. In April 1997, a policy seminar was held in Curitiba, Parand, to draw lessons from thepast urban operations for the future work. The lessons were succinctly summarized as follows:"Current trends in political, fiscal, administrative and operational decentralization entrust theprovision of typically local services to local authorities. The Municipal Development Program ofParani has greatly reduced local dependence on State grants through a mechanism that isincreasingly self-financing. This relieves the State of some responsibilities and helps reducesocial tensions by offering a direct response to local needs. It also stimulates municipal taxcollection as a means to improve creditworthiness..." (Secretariat of Urban Development, 1997,p. 41). The overall findings of the audit support this statement. More specific lessons follow.
3. Demand side. The Financial Action Plan, with its stringent conditions for sub-loans, wasan effective incentive for municipal reform. This design, with follow-up monitoring at the time ofsubsequent sub-loan applications, enabled a "wholesale" approach that covered a large number ofmunicipalities.
4. Supply side. The MDP program in Parani demonstrated the institutional evolution of anurban development fund from a government-operated disbursement mechanism to anindependent, self-financing, private financial intermediary for providing long-term credit tomunicipalities. ParanACidade is a "best practice" case for the MDP program; it can be replicatedin other states in Brazil and in other countries.
5. Sequencing ofproject components. The project design, which aimed at setting theinstitutional framework right and putting financial reform in place before undertaking physicalinvestments, reduced the risks for implementation delays and cost recovery.
6. Champions and political support. During implementation, the MDP program in Paranawas not affected by government changes. The MDP program in RGS did suffer from suchchanges and was on the verge of collapse until the original "champions" (those who prepared theproject) returned to power in 1995. Continued political support over time is crucial for successfulproject implementation.
7. The dynamics of municipal development. The MDP program was most effective inassisting smaller, less creditworthy municipalities in remote regions of the states. Large cities hadaccess to alternative sources of financing and better technical capacity. As in the Philippines, inBrazil too, the urban (municipal) development fund is catalytic in helping smaller, resource-poormunicipalities become more creditworthy and financially strong, and in helping them to make atransition to "graduating" from the MDP program and eventually participating in the capitalmarket. But international experience shows that direct participation of municipalities in thecapital market has been slow in most developing countries.
8. MDP as an instrument for rural development. The project's financial and institutionalimpacts were most significant for small and medium-size municipalities in remote regions.
52 Annex C
Enhancing the efficiency and productivity of these market towns should contribute significantlyto the economic and social development process of rural regions. As an important side-effect, thisprocess would reduce regional income disparities between large urban centers and rural areas.
Recommendations
9. Diversify the types of subprojects to be financed. Both ParanACidade and FUNDOPIMESshould expand the scope of the lending program by allowing revenue-generating projects (withpositive externalities) where the private sector can participate.
10. Diversifyfinancial services. ParanaCidade has reached a phase where it could considerdiversifying its financial services to include credit guarantee service; debt financing- and acatalytic role for build-operate-transfer, concessions, contract management, or other services forprivate sector participation. FUNOPIMES could soon follow ParanaCidade's path.
11. Emphasize training. The MDP program in Brazil lacks a continuing training programwith a formal training institute. Since the Brazil MDP is implemented in a "wholesale" mannerfor numerous municipalities, it may be useful to explore the feasibility of establishing a traininginstitute (possibly jointly by several states) to build municipal capacity. This in turn wouldenhance the local capacity to generate high-quality sub-loans and lessen the need for closesupervision by the state's implementation agencies.
12. Streamline municipal administration and management. Computerizing the accountingand budgeting systems and updating financial data would enhance the efficiency of municipaladministration and management. It would also make it easier for ParanaCidade andFUNDOPIMES to monitor continuously the financial health of participating municipalities bysharing a common database. ParandCidade is heading in this direction by adopting sophisticateddata management and operations simulation systems.
13. Use the betterment tax effectively fbr direct cost recovery. This tax for a newinfrastructure service is a one-time "connection fee" to the service. Studies show that low-incomehouseholds and small enterprises tend to have a greater willingness to pay at the margin forreliable services than high-income households and large firms (Lee, Anas, and Oh, 1999; Lee andAnas, 1992). Therefore, this tax measure could be an effective means of direct cost recovery ifthe government commits itself to its implementation.
14. Protect PIMES and FUNDOPIMES from political interference. With a healthy cashposition and the high demand for sub-loans, the PIMES program is entering a critical phase forinstitutional growth and financial stability. Therefore, it is important to protect its organizationalintegrity, financial independence, and its highly dedicated staff in a period of ongoing statereform.
15. Monitor the creditworthiness of municipalities in Parana. Ninety-nine percent ofmunicipalities are participating in Parani. For such a large number of participants, more stringentmonitoring of the Financial Action Plan will be desirable to maintain healthy financial conditionsof both municipalities and the fund.
16. Disseminate lessons learned. The evaluation coordinator of the Federal Ministry ofPlanning participated in the audit mission. He suggested that, upon completion of OED's ongoingimpact evaluation study, a dissemination seminar be held in Brasilia for the Brazilian localgovernment officials involved in MDPs.

53 Annex D
Performance Audit of the Philippines MDPs:Lessons and Recommendations
I. Following are the lessons drawn and recommendations made at the project level in thePerformance Audit Report (OED, 1997).
2. Demand-driven approach, participation, and ownership. A "bottom-up," demand-drivenprogram approach to project financing is more efficient and effective for project implementationthan the "top-down," pre-selected, project-specific approach. Beneficiary local governmentsperform better and show greater commitment to the project when they have primaryresponsibility for project preparation, management, and implementation.
3. Sequencing project components. The institutional framework for project financing (MDF)was put in place before undertaking physical investments. Because of the demand-drivenapproach, MDP attracted revenue-generating sub-projects that presented minimum risks for costrecovery. This outcome showed that sequencing of project components in response to thepreference of the beneficiaries can avoid implementation delays and cost-recovery problems thatoften occur in a complex urban development project prepared in a "top-down" manner.
4. Piloting to mainstreaming analogy. After the participating municipalities complete arather simple, low-risk, revenue-generating project such as a public market, they tend to enhancetheir creditworthiness with a stronger financial base, and expand their investments toinfrastructure projects (such as roads, drainage, water supply, and sanitation). The logic of the"New Project Cycle" (Picciotto and Weaving, 1994) is supported by the experiences of the MDPprogram.
Recommendations
5. Local government finance reform and changing role of MDF. The MDF attracted mainlyrevenue-generating projects with a minimum risk. The LGUs were initially reluctant to financesocial/infrastructure projects with cost-recovery features. These experiences suggest thatsegmenting the demand side of the market, that is, targeting particular types of LGUs forparticular types of sub-projects, should be avoided. Even under LOGOFIND, the credit windowfor the first-time borrowers (poor and less experienced) should continue to be open for simplerevenue-generating projects, while the loan product mix with more complex projects should beoffered to more mature LGUs.
6. Expanded role of local government academy. The role of LGA for training municipalofficials should be expanded from training at the project level (preparation, financing, andimplementation) to building LGU capacity building for planning and implementing a city-wideinfrastructure investment program and managing rapidly expanding urban areas. For example,Santa Rosa faces a tremendous challenge to meet a sharp increase in demand for residential andnon-residential land and all types of infrastructure services as the city is attracting largemultinational firms. The LGA should also expand its dissemination program whereby theexperiences accumulated by the LGUs graduating from MDP can be shared with the newcomers.Mayors and senior officials of Bauan and Pulilan, for example, are already serving as lecturers inthe LGA seminars, but a more proactive program such as "twinning" could be effective.
54 Annex D
7. Reducing disincentives for local revenue generation. The increase in the IRA (revenuesharing) ratio to 40 percent as part of the revised Local Government Code dampened theincentives to generate local revenues. To reduce this disincentive, the audit recommends: (i) theintroduction of matching grants above the standard allocation of IRA tied to the extent of localrevenue collection or of successful cost recovery; (ii) continued support of the RPTA program tocapture tax revenues from the rapidly rising property values, in particular, from the expandingnon-residential tax base in rapidly growing LGUs; and (iii) the introduction of a "presidential"award system according to the level of financial autonomy measured by the ratio of IRA receiptsto the total municipal revenue. For the four cities the audit mission visited, this ratio was: Bauan,16 percent; Santa Rosa, 23; Pulilan, 49; and Butuan City, 79.
8. Private sector participation in maintenance and contract management. To make theproject achievements sustainable in the absence of recurrent budget funds for maintenance andtechnical personnel, LGUs should consider farming out the maintenance activities to private firmsor resort to contract management based on user fees. To protect the financial viability of theMDP-financed economic enterprises (public markets, bus terminals, and slaughterhouses),contract management or other forms of private sector participation could be adopted.Mandaluyong City in Metro Manila has been using a management contract arrangement for itspublic market, and Santa Rosa is considering such an arrangement for its market.
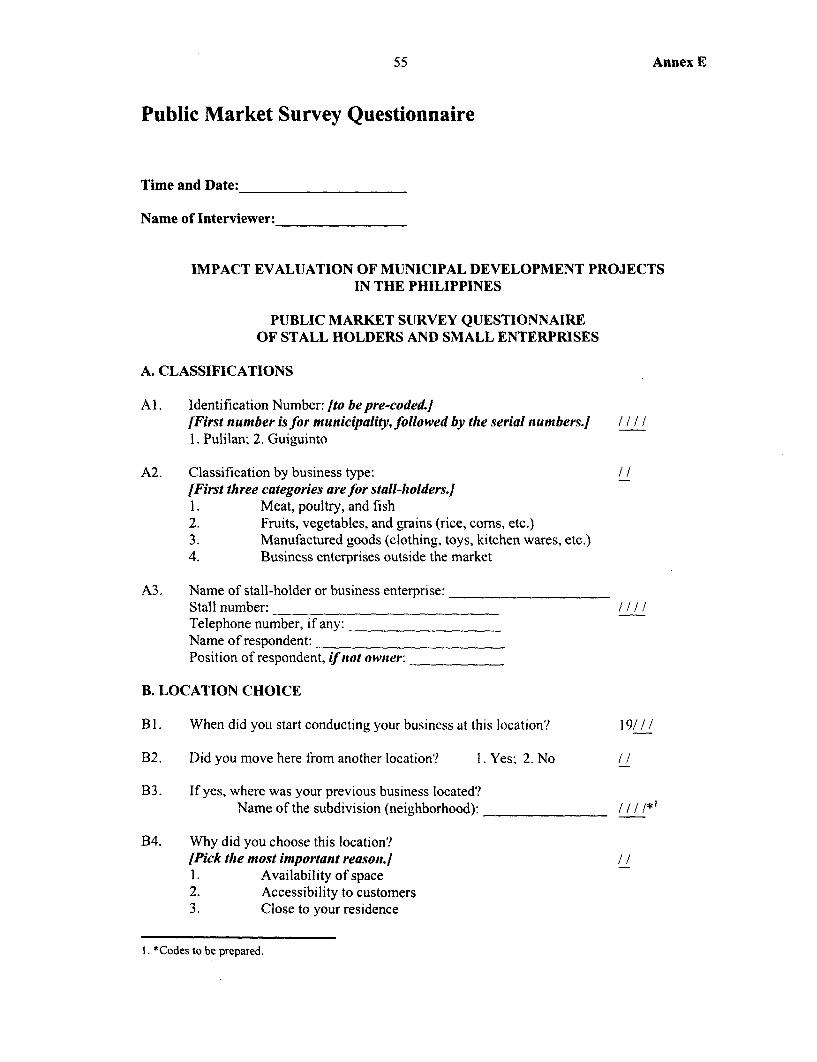
55 Annex E
Public Market Survey Questionnaire
Time and Date:
Name of Interviewer:
IMPACT EVALUATION OF MUNICIPAL DEVELOPMENT PROJECTSIN THE PHILIPPINES
PUBLIC MARKET SURVEY QUESTIONNAIREOF STALL HOLDERS AND SMALL ENTERPRISES
A. CLASSIFICATIONS
Al. Identification Number: Ito be pre-coded.][First number is for municipality, followed by the serial numbers.] / / / /1. Pulilan; 2. Guiguinto
A2. Classification by business type: /I[First three categories are for stall-holders.]1. Meat, poultry, and fish2. Fruits, vegetables, and grains (rice, corns, etc.)3. Manufactured goods (clothing, toys, kitchen wares, etc.)4. Business enterprises outside the market
A3. Name of stall-holder or business enterprise:Stall number: // /Telephone number, if any:Name of respondent:Position of respondent, if not owner:
B. LOCATION CHOICE
B 1. When did you start conducting your business at this location? 19/ / /
B2. Did you move here from another location'? 1. Yes: 2. No / /
B3. If yes, where was your previous business located?Name of the subdivision (neighborhood): / / / /*'
B4. Why did you choose this location'?[Pick the most important reason./ I1. Availability of space2. Accessibility to customers3. Close to your residence
1. *Codes to be prepared.

56 Annex E
4. Good transport access5. Safety6. Others, please specify: *
C. PRODUCTS AND SERVICES
Cl. For stall-holders: what goods do you sell? / / /*For business enterprise: what kind of business is your enterprise engaged in'?[for example, gas station, bank, restaurant, taxi company, pharmacy, etc./
C2. If you sell goods, where do your goods come from?[Please give a rough percentage distribution.]
1. From this municipality / / / /%2. From this province / / / / %3. Outside this province //// %
Total 100%
C3. Who are your customers?[Please give a rough percentage distribution.]
1. Residents of this municipality / // / %2. Residents of this province / / / /%3. People from outside this province //// %
Total 100%
D. EMPLOYMENT
Dl. How many people are working here including yourself? / / / / persons
D2. How many are member of the owner's family? / / / / persons
D3 How many are female workers'? / / / / persons
D4 How many hours do they work per day? Owners / / / hoursHelpers / / / hours
D5. On average, how much do you pay per month'?1. For manager/Caretaker/owner / / / / pesos/month2. For helper //pesos/month
D6. How much do you spend in kinds (meals, transportation and others) per person permonth?
1. For manager/caretaker / / / / pesos/month2. For helper / / / / pesos/month
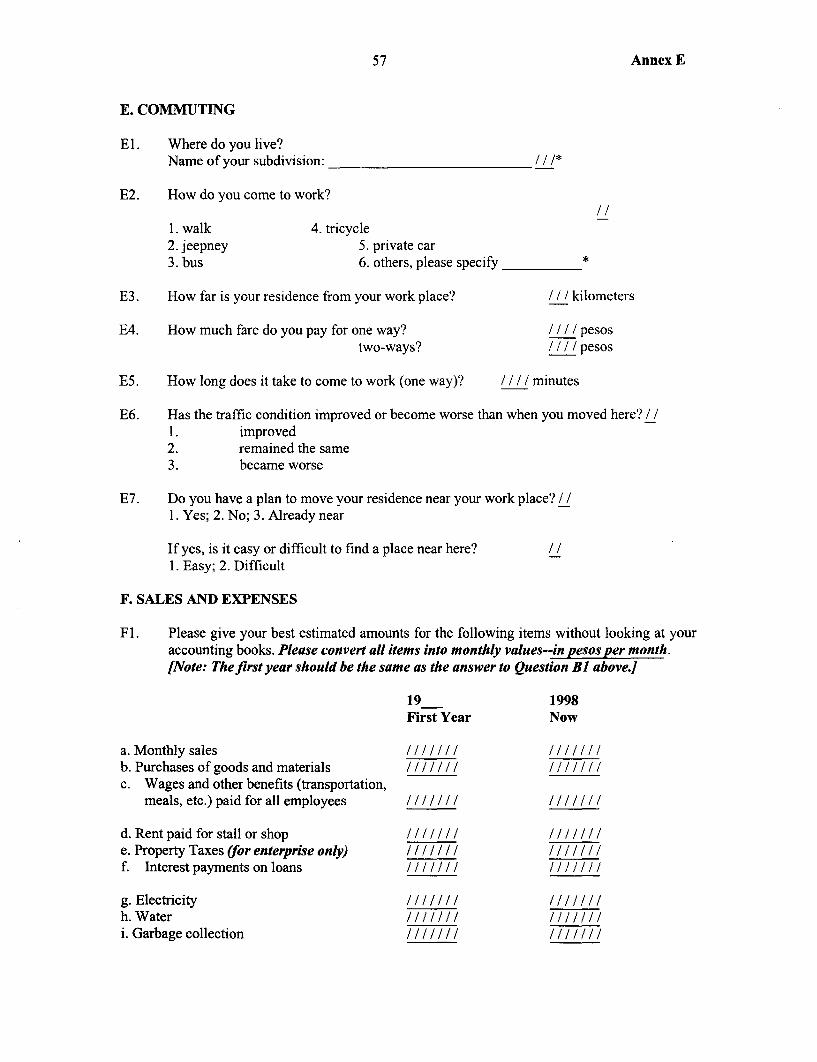
57 Annex E
E. COMMUTING
El. Where do you live?Name of your subdivision: / / /*
E2. How do you come to work?
1. walk 4. tricycle2. jeepney 5. private car3. bus 6. others, please specify *
E3. How far is your residence from your work place? / / / kilometers
E4. How much fare do you pay for one way? / / / / pesostwo-ways? / / / / pesos
E5. How long does it take to come to work (one way)? / / / / minutes
E6. Has the traffic condition improved or become worse than when you moved here? / /1. improved2. remained the same3. became worse
E7. Do you have a plan to move your residence near your work place? /1. Yes; 2. No; 3. Already near
If yes, is it easy or difficult to find a place near here? / /1. Easy; 2. Difficult
F. SALES AND EXPENSES
Fl. Please give your best estimated amounts for the following items without looking at youraccounting books. Please convert all items into monthly values--in pesos per month.[Note: The first year should be the same as the answer to Question BJ above.]
19 1998First Year Now
a.Monthlysales //// ////b. Purchases of goods and materials //// /// /c. Wages and other benefits (transportation,
meals, etc.) paid for all employees /// ////
d. Rent paid for stall or shop //// ///Ie. Property Taxes (for enterprise only) //// ////f. Interest payments on loans //I/// ////
g. Electricity //// ////h.GWater//// ////i. Garbage collection//////////////

58 Annex E
j Communication expenses //// ////k Delivery costs (both buying and selling) / / / / / / / / / / / / / /1. Any other expenses
Please specify_* //// ////m. Total Expenses (in 1000 pesos) /// ////
F2. Roughly, how much monthly income do you (stall-holder or business enterprise) make permonthafter paying all expenses? First year: / / / / / / / / / pesos per month
1998: /////////pesos permonthIf B2 is "yes," monthly income at previous location:./ / / / / / / / / pesos per month
NOTE: SECTIONS "G," "H,"AND "I" ARE FOR STALL-HOLDERS ONLY.
G. PUBLIC MARKET FACILITIES
[Questions GI through G6 are for stall-holders only.]
Gl. How much was the amount of goodwill payment when you moved in? / / / / / //pesos
G2. How did you pay your goodwill money?[Pick the most important source.] //1. Your savings2. Borrowed from a bank3. Borrowed from relatives and friends4. Private money lenders (five-six)5. Others, please specify *
G3. How many stalls do you use now? /l1. When did you started using the second stall? 19/ / /2. When did you start using the third stall? 19//3. If you have one now, when do you expect to have a second stall? 19/ //
G4. Do you have a plan to establish your own business place outside the public market?1. Yes; 2. No. //
G5. If yes, when do you expect to move to the new place? 19/ / /
G6. How was the quality of the following services in the market when you moved here andnow?
[Note : The first year should be the same as the answer to Question BI above.]
Excellent = 1; Good = 2; Fair 3, Poor = 4; Not Applicable = 4
19 1997First year Now
a. electricity //b. water /_/_/
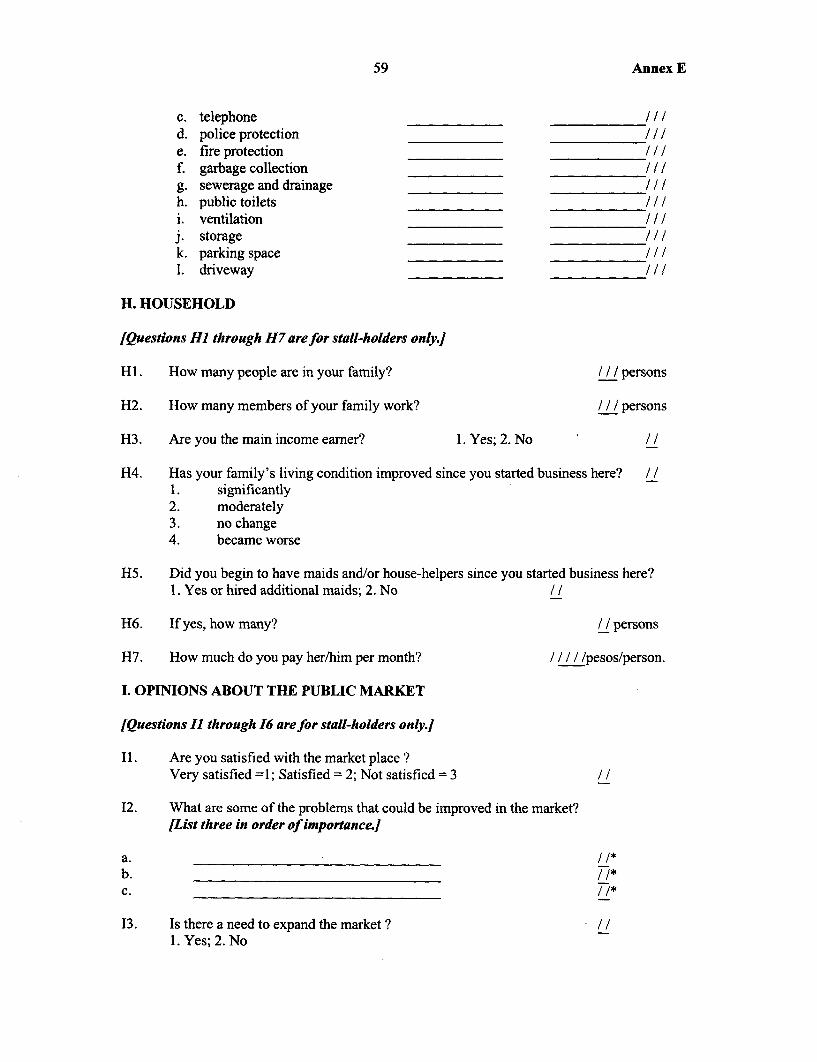
59 Annex E
c. telephone /_/_/d. police protection //e. fire protection //f. garbage collection //g. sewerage and drainage /Ih. public toilets //i. ventilation //j. storage //k. parking space //1. driveway /
H. HOUSEHOLD
[Questions Hi through H7 are for stall-holders only.]
HI. How many people are in your family? / / / persons
H2. How many members of your family work? / / / persons
H3. Are you the main income earner? 1. Yes; 2. No /
H4. Has your family's living condition improved since you started business here? / /I. significantly2. moderately3. no change4. became worse
H5. Did you begin to have maids and/or house-helpers since you started business here?1. Yes or hired additional maids; 2. No / /
H6. If yes, how many? / / persons
H7. How much do you pay her/him per month? / //pesos/person.
I. OPINIONS ABOUT THE PUBLIC MARKET
[Questions I through 16 are for stall-holders only.]
II. Are you satisfied with the market place ?Very satisfied =1; Satisfied = 2; Not satisfied =3 / /
12. What are some of the problems that could be improved in the market?[List three in order of importance.]
a. / /*b. /_/*C. /_/*
13. Is there a need to expand the market? /1. Yes; 2. No

60 Annex E
14. Do you belong to a market vendor's association? / /1. Yes; 2. No
15. How much fees do you pay to the association per month? / / / /pesos/month
16. What services does it provide for you ?[List three in order of importance.]
a. / /*b. /l/*c.__ _/__ __/*__
NOTE: SECTION "J" IS FOR BUSINESS ENTERPRISES ONLY (OUTSIDE THEMARKET).
J. CAPITAL INVESTMENT
[Questions J6 through Questions J14 are for business enterprises only.]
J6. How large is the total floor space? / / / / / square meters
J7. Do you own this place or rent? 1. Own; 2. Rent / /
J8. If you own the place, how much did you pay for this space when you moved here?[The year in Question Bl] / / / / / / 1000 pesos per square meter
J9. How much will you get if you sell it now? / / / / / /1000 pesos per sq. m.
J10. If you rent, how much do you pay per month? / / / / / / pesos per month per sq. m.
J1 1. How much did you spend to set up your business and improvements (i.e., investment forfacilities, equipment, etc.) since you moved here? / / / / / / 1000 pesos.
J12. Do you have a plan to expand your business at this location? 1. Yes; 2. No / /
J13. What is the price of land at this location now (1998) per square meter?/ / / / / / / pesos per square meter
J14. How much was the land price when you moved here? [The same year in Question BI]/ / / / / / / pesos per square meter
K. OTHER GENERAL COMMENTS ON PROBLEMS, AND SUGGESTIONS FORIMPROVEMENTS REGARDING ANY ASPECTS OF YOUR BUSINESSCONDITIONS OR SURROUNDING AREAS.
61 Annex E
K. COMMENTS BY INTERVIEWERS ON ANY PROBLEMS ENCOUNTERED ORANY UNUSUAL INFORMATION TO BE NOTED.