report no. 2015-6 - philippine statistics authority ... · food consumption and nutrition...
TRANSCRIPT

FOOD CONSUMPTION AND NUTRITION
PHILIPPINE STATISTICS AUTHORITY
ISSN-2012-0435
REPORT No. 2015-6
PHILIPPINE STATISTICS AUTHORITY 16th Floor. ETON Cyberpod Centris 3
EDSA. Corner Quezon Avenue,Quezon City
www.psa.gov.ph

FOOD CONSUMPTION AND NUTRITION
PHILIPPINE STATISTICS AUTHORITY
FOREWORD
The Agricultural Indicators System (AIS) is one of the statistical frameworks maintained by the Philippine Statistics Authority (PSA). AIS contains twelve (12) modules and these are updated and released annually. This is the sixth module entitled Food Consumption and Nutrition. It provides information on per capita production, per capita consumption and per capita calories, proteins and fats supply of selected major agricultural commodities. The reference years are 2010 to 2014.
The AIS hopes to cover more agricultural development indicators to support the information needs of our data users. We encourage the readers to give their comments and suggestions on the improvement of the AIS, in general, and the report, in particular. .
LISA GRACE S. BERSALES, Ph.D.
National Statistician and Civil Registrar General
Quezon City. Philippines October 2015
MODULES OF THE AGRICULTURAL INDICATORS SYSTEM
1. Agricultural Structures and Resources
2. Agricultural Credit
3. Output and Productivity
4. Agricultural Exports and Imports
5. Food Sufficiency and Security
6. Food Consumption and Nutrition
7. Population and Labor Force
8. Redistribution of Land
9. Agricultural Exports and Imports
10. Gender-based Indicators of Labor and Employment in Agriculture 11. Economic Growth
12. Prices and Marketing of Agricultural Commodities
13. Inputs
i

FOOD CONSUMPTION AND NUTRITION
PHILIPPINE STATISTICS AUTHORITY
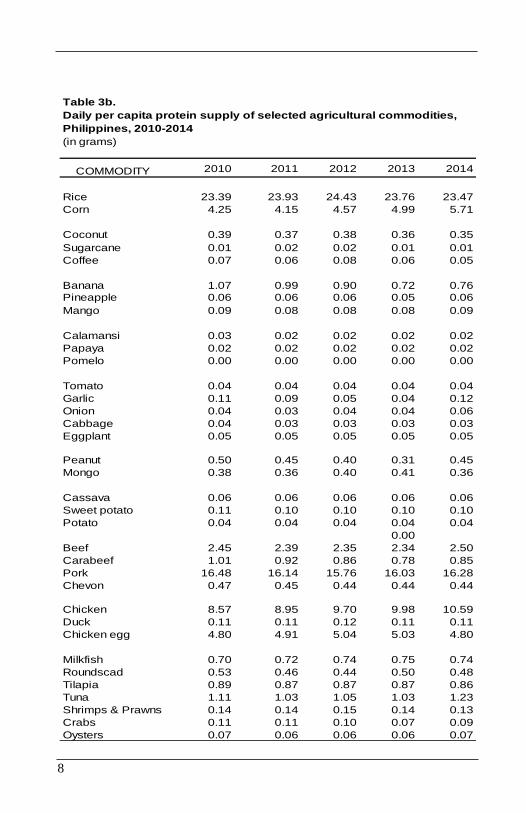
Table 3b.
Daily per capita protein supply of selected agricultural commodities,
Philippines, 2010-2014
(in grams)
COMMODITY 2010 2011 2012 2013 2014
Rice 23.39 23.93 24.43 23.76 23.47
Corn 4.25 4.15 4.57 4.99 5.71
Coconut 0.39 0.37 0.38 0.36 0.35
Sugarcane 0.01 0.02 0.02 0.01 0.01
Coffee 0.07 0.06 0.08 0.06 0.05
Banana 1.07 0.99 0.90 0.72 0.76
Pineapple 0.06 0.06 0.06 0.05 0.06
Mango 0.09 0.08 0.08 0.08 0.09
Calamansi 0.03 0.02 0.02 0.02 0.02
Papaya 0.02 0.02 0.02 0.02 0.02
Pomelo 0.00 0.00 0.00 0.00 0.00
Tomato 0.04 0.04 0.04 0.04 0.04
Garlic 0.11 0.09 0.05 0.04 0.12
Onion 0.04 0.03 0.04 0.04 0.06
Cabbage 0.04 0.03 0.03 0.03 0.03
Eggplant 0.05 0.05 0.05 0.05 0.05
Peanut 0.50 0.45 0.40 0.31 0.45
Mongo 0.38 0.36 0.40 0.41 0.36
Cassava 0.06 0.06 0.06 0.06 0.06
Sweet potato 0.11 0.10 0.10 0.10 0.10
Potato 0.04 0.04 0.04 0.04 0.04
0.00
Beef 2.45 2.39 2.35 2.34 2.50
Carabeef 1.01 0.92 0.86 0.78 0.85
Pork 16.48 16.14 15.76 16.03 16.28
Chevon 0.47 0.45 0.44 0.44 0.44
Chicken 8.57 8.95 9.70 9.98 10.59
Duck 0.11 0.11 0.12 0.11 0.11
Chicken egg 4.80 4.91 5.04 5.03 4.80
Milkfish 0.70 0.72 0.74 0.75 0.74
Roundscad 0.53 0.46 0.44 0.50 0.48
Tilapia 0.89 0.87 0.87 0.87 0.86
Tuna 1.11 1.03 1.05 1.03 1.23
Shrimps & Prawns 0.14 0.14 0.15 0.14 0.13
Crabs 0.11 0.11 0.10 0.07 0.09
Oysters 0.07 0.06 0.06 0.06 0.07
TABLE OF CONTENTS
iii 8
FOREWORD i
LIST OF TABLES i i i
FOOD CONSUMPTION AND NUTRITION
Table 1. Annual per capita production index of selectedagricultural commodities, Philippines, 2010-2014 5
Table 2. Daily per capita consumption index of selectedagricultural commodities, Philippines, 2010-2014 6
Table 3a. Daily per capita calories supply of selectedagricultural commodities, Philippines, 2010-2014 7
Table 3b. Daily per capita protein supply of selectedagricultural commodities, Philippines, 2010-2014 8
Table 3c. Daily per capita fats supply of selectedagricultural commodities, Philippines, 2010-2014 9

FOOD CONSUMPTION AND NUTRITION
PHILIPPINE STATISTICS AUTHORITY
Table 2.
Daily per capita consumption index of selected agricultural commodities,
Philippines, 2010-2014
(2006=100)
2006 INDICES 2014
COMMODITY PER CAPITA (in percent) PER CAPITA
CONSUMPTION 2010 2011 2012 2013 2014 CONSUMPTION
(grams/day) (grams/day)
Rice 325.21 95.89 98.11 100.14 97.42 96.22 312.93
Corn 50.44 88.64 86.64 95.32 104.06 119.11 60.08
Coconut 23.53 96.77 93.16 95.58 90.82 86.40 20.33
Sugarcane 7.67 68.97 106.78 97.91 89.31 90.35 6.93
Coffee 0.85 118.82 109.41 131.76 109.41 83.53 0.71
Banana 97.45 156.46 145.44 132.27 106.27 111.02 108.19
Pineapple 24.77 119.01 115.70 114.70 110.82 117.24 29.04
Mango 26.44 84.23 78.74 75.64 80.22 85.17 22.52
Calamansi 5.81 89.67 85.37 82.10 74.01 71.26 4.14
Papaya 4.55 100.00 92.75 95.16 92.75 95.82 4.36
Pomelo 1.15 80.87 71.30 71.30 68.70 66.96 0.77
Tomato 4.30 109.53 105.81 104.42 105.12 106.98 4.60
Garlic 1.37 64.23 57.66 32.12 21.90 70.07 0.96
Onion 3.51 105.41 87.46 100.00 100.00 150.71 5.29
Cabbage 2.63 133.46 125.10 125.10 123.95 122.81 3.23
Eggplant 5.56 101.98 98.56 99.46 101.44 102.52 5.70
Peanut 2.33 115.02 102.15 91.85 70.39 103.43 2.41
Mongo 1.78 95.51 91.01 101.69 103.37 92.13 1.64
Cassava 5.53 113.92 115.91 113.92 120.43 128.39 7.10
Sweet potato 16.88 89.28 83.59 82.29 82.64 80.81 13.64
Potato 1.78 153.93 149.44 143.26 135.39 130.90 2.33
Beef 5.81 114.11 111.70 109.81 109.29 116.52 6.77
Carabeef 4.54 100.22 91.19 85.02 77.75 83.92 3.81
Pork 49.81 104.40 102.25 99.84 101.53 103.13 51.37
Chevon 1.43 114.69 111.19 106.99 106.99 106.99 1.53
Chicken (dressed) 21.78 129.80 135.58 146.92 151.19 160.51 34.96
Duck (dressed) 0.38 107.89 107.89 115.79 107.89 107.89 0.41
Chicken egg 9.56 109.73 112.03 115.17 114.96 109.73 10.49
Milkfish 6.49 104.31 108.01 110.63 111.86 110.63 7.18
Roundscad 5.32 95.86 84.40 80.83 92.11 87.97 4.68
Tilapia 7.40 117.03 114.73 114.46 114.05 113.24 8.38
Tuna 11.91 90.51 83.80 85.22 83.71 100.00 11.91
Shrimps & Prawns 1.10 137.27 134.55 147.27 137.27 131.82 1.45
Crabs 1.23 98.37 95.93 86.99 64.23 80.49 0.99
Oysters 0.52 126.92 115.38 111.54 115.38 121.15 0.63
6

FOOD CONSUMPTION AND NUTRITION
PHILIPPINE STATISTICS AUTHORITY
1 4
Per Capita Production Per capita production refers to the volume of production of a particular commodity available for each member of the population. Annual per capita production index provides information on the change in the per capita production of the commodity in a given year compared to a base year. It measures the capacity of the country’s agriculture sector to produce food commodities in pace with the growth of the population. In 2014, the annual per capita production of rice increased to 124.20 kilograms. It recorded an index of 107.76 percent or 7.76 percentage points higher than the 2006 record. Corn production at 77.80 kilograms per person in 2014 posted higher index of 111.25 percent. The 2014 per capita production levels of coconut at 147.14 kilograms, sugarcane at 250.60 kilograms and coffee at 0.21 kilogram remained lower than the base year records. Among the fruits, banana and pineapple continued to register increasing and higher indices at 113.87 percent and 119.04 percent, respectively, in 2014. Their corresponding per capita production levels in 2014 were 88.96 kilograms and 25.10 kilograms. On the other hand, the 2014 per capita production of mango, calamansi, papaya and pomelo stayed below the 2006 levels. Above the base year production levels were recorded for vegetables such as tomato, onion, cabbage, eggplant and mongo in 2014. Onion exhibited a remarkable increase in per capita production as it went up to 2.04 kilograms in 2014 and posted higher index of 233.40 percent. Bigger production index continued for cabbage in 2014 at 122.14 percent with respective per capita production of 1.28 kilograms. Per capita production of garlic and peanut remained lower than the base year records. For rootcrops, cassava and potato continuously reported higher indices corresponding to 125.91 percent and 149.35 percent in 2014. Per capita production levels were 25.43 kilograms for cassava and 1.19 kilograms for potato. Below the base year production was still noted for sweet potato. The 2014 per capita production of livestock products such as beef, carabeef and chevon continued to exceed the 2006 records. Their production indices ranged from 103.32 percent to 107.56 percent. Lower than the base year production was reported for pork. For poultry
tributed the highest content of calories, protein and fats. Among the agricultural commodities under review, rice was the prime source of calories. In 2014, rice provided 1,117.16 grams of calories per person per day. Corn contributed 213.88 grams of calories. High calorie contents were supplied by coconut at 37.41 grams, banana at 64.91 and mango at 10.13 grams in 2014. In case of vegetables and rootcrops, sweet potato contained the biggest amount of calories at 12.55 grams followed by peanut at 9.98 grams. For livestock and poultry products, more calories were obtained from pork at 171.06 grams and chicken meat at 86.35 grams and chicken eggs at 62.31 grams. Low supply of calories came from the fishery products. Tuna had bigger daily calorie content at 7.62 grams per person (Table 3a). Rice had the biggest protein content at 23.47 grams per person per day in 2014. Corn supplied about 5.71 grams of protein per person daily. Other good sources were pork, chicken meat and chicken egg with corresponding protein contents at 16.28 grams, 10.59 grams and 4.80 grams. Beef contained 2.50 grams while tuna provided 1.23 grams of protein in 2014. Less than 1.0 gram of protein was contributed by other agricultural commodities (Table 3b). For the fats supply, about 5.63 grams were sourced from rice and 2.58 grams came from corn in 2014. Coconut supplied 3.54 grams of fats contents. About 11.07 grams were provided by pork, around 4.0 grams each by chicken meat and eggs and 1.46 grams by beef. Minimal quantities at less than 1 gram of fats were derived from the other commodities (Table 3c).

FOOD CONSUMPTION AND NUTRITION
PHILIPPINE STATISTICS AUTHORITY
consumption records. Among these crops, onion had the biggest increment as per capita consumption surged to 5.29 grams per day in 2014. Its respective index was estimated at 150.71 percent or 50.71 percentage points more than the base year record. Cabbage consumption per person at 3.23 grams per day in 2014 posted a declining but still higher index at 122.81 percent. An increasing daily consumption was reported for peanut at 2.41 grams per person in 2014 which exceeded the 2006 records by 3.43 percentage points. In contrast, mongo consumption contracted to 1.64 grams per day and went lower than base year estimates. Despite the increase in garlic consumption in 2014 at 0.96 gram, it was still less than the 2006 record. Lower than the base year consumption was continuously recorded for sweet potato. An opposite trend was observed for cassava and potato whose daily consumption per person went up to 7.10 grams and 2.33 grams, respectively. These were 28 to 31 percentage points more than the 2006 records. Except carabeef, the daily per capita consumption records of the livestock products in 2014 were sustained above the base year levels. Beef consumption per person at 6.77 grams per day in 2014 exhibited the biggest index at 116.52 percent. Meanwhile, per capita consumption of pork at 51.37 grams per day in 2014 surpassed the 2006 level by 3.13 percentage points. For poultry products, consumption levels of chicken meat and eggs and duck meat continued to be higher than their respective consumption records in 2006. Chicken had the biggest consumption index of 160.51 percent equivalent to daily per capita consumption of 34.96 grams. The 2014 consumption levels of milkfish, tilapia, shrimps and prawns were going down but remained above the 2006 records. The biggest index was seen for shrimps and prawns which dropped to 131.82 percent in 2014 corresponding to per capita consumption of 1.45 grams per day. Oyster consumption was going up to 0.63 gram in 2014 and it exceeded the 2006 record by 21.15 percentage points. Similarly, tuna consumption increased to 11.91 grams which was equal to the base year estimates. Roundscad and crabs still recorded lesser consumption in 2014. Per Capita Supply of Calories, Protein and Fats Information on the nutrient equivalents of the different food intake measured on per capita per day basis will show the food items that con-
than the base year production was reported for pork. For poultry products, above the base year production was exhibited by chicken meat and eggs and duck meat in 2014. In this year, chicken meat production at 11.6 kilograms per person maintained higher index of 147.53 percent. For duck meat, production index reached 110.62 percent equivalent to per capita production of 0.15 kilogram. For the fishery products, milkfish, tilapia, shrimps and prawns exhibited declining production indices but remained above the 2006 records. These ranged from 106.97 percent to 112.86 percent in 2014. Oyster production at 0.23 kilogram per person indicated increasing and higher production index of 123.06 percent. Below the base year production was noted for roundscad, tuna and crabs. Per Capita Consumption The daily consumption pattern of a commodity of each member of the population measured through an index indicates the movement of consumption in a specified year relative to a base year. The daily per capita consumption of rice dropped to 312.93 grams in 2014 and remained lower than the 2006 record. Meanwhile, corn consumption increased to 60.08 grams per person per day in 2014. It further surpassed the base year consumption at an index of 119.11 percent. Below the base year consumption was recorded for coconut, sugarcane and coffee. Declining daily per capita consumption estimates were noted for coconut at 20.33 grams and coffee at 0.71 gram. Sugarcane consumption went up to 6.93 grams per person per day. Increasing and above the 2006 per capita consumption levels were observed for banana and pineapple at 108.19 grams and 29.04 grams, respectively. Correspondingly, consumption indices rose to 111.02 percent and 117.24 percent. The 2014 daily per capita consumption estimates of calamansi at 4.14 grams, papaya at 4.36 grams, mango at 22.52 grams and pomelo at 0.77 gram were maintained below their respective base year records. In 2014, per capita consumption levels of tomato, onion and eggplant were continuously increasing and stayed higher than their 2006 consumption records. Among these crops, onion had the biggest
3 2

FOOD CONSUMPTION AND NUTRITION
PHILIPPINE STATISTICS AUTHORITY
1 4
Per Capita Production Per capita production refers to the volume of production of a particular commodity available for each member of the population. Annual per capita production index provides information on the change in the per capita production of the commodity in a given year compared to a base year. It measures the capacity of the country’s agriculture sector to produce food commodities in pace with the growth of the population. In 2014, the annual per capita production of rice increased to 124.20 kilograms. It recorded an index of 107.76 percent or 7.76 percentage points higher than the 2006 record. Corn production at 77.80 kilograms per person in 2014 posted higher index of 111.25 percent. The 2014 per capita production levels of coconut at 147.14 kilograms, sugarcane at 250.60 kilograms and coffee at 0.21 kilogram remained lower than the base year records. Among the fruits, banana and pineapple continued to register increasing and higher indices at 113.87 percent and 119.04 percent, respectively, in 2014. Their corresponding per capita production levels in 2014 were 88.96 kilograms and 25.10 kilograms. On the other hand, the 2014 per capita production of mango, calamansi, papaya and pomelo stayed below the 2006 levels. Above the base year production levels were recorded for vegetables such as tomato, onion, cabbage, eggplant and mongo in 2014. Onion exhibited a remarkable increase in per capita production as it went up to 2.04 kilograms in 2014 and posted higher index of 233.40 percent. Bigger production index continued for cabbage in 2014 at 122.14 percent with respective per capita production of 1.28 kilograms. Per capita production of garlic and peanut remained lower than the base year records. For rootcrops, cassava and potato continuously reported higher indices corresponding to 125.91 percent and 149.35 percent in 2014. Per capita production levels were 25.43 kilograms for cassava and 1.19 kilograms for potato. Below the base year production was still noted for sweet potato. The 2014 per capita production of livestock products such as beef, carabeef and chevon continued to exceed the 2006 records. Their production indices ranged from 103.32 percent to 107.56 percent. Lower than the base year production was reported for pork. For poultry
tributed the highest content of calories, protein and fats. Among the agricultural commodities under review, rice was the prime source of calories. In 2014, rice provided 1,117.16 grams of calories per person per day. Corn contributed 213.88 grams of calories. High calorie contents were supplied by coconut at 37.41 grams, banana at 64.91 and mango at 10.13 grams in 2014. In case of vegetables and rootcrops, sweet potato contained the biggest amount of calories at 12.55 grams followed by peanut at 9.98 grams. For livestock and poultry products, more calories were obtained from pork at 171.06 grams and chicken meat at 86.35 grams and chicken eggs at 62.31 grams. Low supply of calories came from the fishery products. Tuna had bigger daily calorie content at 7.62 grams per person (Table 3a). Rice had the biggest protein content at 23.47 grams per person per day in 2014. Corn supplied about 5.71 grams of protein per person daily. Other good sources were pork, chicken meat and chicken egg with corresponding protein contents at 16.28 grams, 10.59 grams and 4.80 grams. Beef contained 2.50 grams while tuna provided 1.23 grams of protein in 2014. Less than 1.0 gram of protein was contributed by other agricultural commodities (Table 3b). For the fats supply, about 5.63 grams were sourced from rice and 2.58 grams came from corn in 2014. Coconut supplied 3.54 grams of fats contents. About 11.07 grams were provided by pork, around 4.0 grams each by chicken meat and eggs and 1.46 grams by beef. Minimal quantities at less than 1 gram of fats were derived from the other commodities (Table 3c).

FOOD CONSUMPTION AND NUTRITION
PHILIPPINE STATISTICS AUTHORITY
5
Table 1.Annual per capita production index of selected agricultural commodities, Philippines, 2010-2014(2006=100)
2006 INDICES 2014COMMODITY PER CAPITA (in percent) PER CAPITA
PRODUCTION PRODUCTION(Kg/annum) (Kg/annum)
Rice 115.25 96.10 99.84 106.02 106.55 107.76 124.20Corn 69.93 97.91 105.13 109.75 107.43 111.25 77.80
Coconut 171.98 96.83 93.48 95.57 90.92 85.55 147.14Sugarcane 279.92 68.77 106.91 97.71 89.44 89.53 250.60Coffee 0.34 84.81 78.00 77.00 66.91 63.12 0.21
Banana 78.12 125.09 123.72 122.38 112.71 113.87 88.96Pineapple 21.09 110.46 112.37 117.82 118.74 119.04 25.10Mango 10.57 83.90 78.65 75.35 78.68 83.86 8.86
Calamansi 2.26 89.46 85.17 81.84 73.93 71.20 1.61Papaya 1.81 98.65 92.18 94.59 93.76 95.67 1.73Pomelo 0.44 80.85 72.60 71.11 68.66 67.55 0.30
Tomato 2.02 108.63 106.34 104.48 104.75 106.41 2.15Garlic 0.14 70.98 66.03 63.09 63.26 62.24 0.09Onion 0.87 166.39 154.99 148.13 156.49 233.40 2.04Cabbage 1.05 131.99 125.96 124.82 123.73 122.14 1.28Eggplant 2.21 101.33 99.41 99.50 101.49 102.35 2.26
Peanut 0.34 94.90 93.55 90.07 88.39 88.71 0.29Mongo 0.30 97.35 116.49 112.39 110.65 107.85 0.32
Cassava 20.20 111.70 115.36 114.04 119.06 125.91 25.43Sweet potato 6.52 89.18 83.56 82.19 82.55 79.87 5.20Potato 0.80 167.61 159.21 155.13 150.11 149.35 1.19
Beef 1.93 108.60 107.47 104.83 104.70 104.71 2.02Carabeef 0.97 116.53 113.49 107.03 104.08 103.32 1.00Pork 17.99 97.61 96.21 95.18 95.14 94.07 16.93Chevon 0.51 115.57 113.91 109.17 107.92 107.56 0.55
Chicken (dressed) 7.57 123.26 128.24 140.51 146.36 147.53 11.16Duck (dressed) 0.14 107.91 108.73 112.87 112.36 110.62 0.15Chicken egg 3.80 109.51 112.03 114.88 114.69 109.58 4.16
Milkfish 3.66 104.89 108.88 110.67 112.78 109.84 4.02Roundscad 2.99 96.32 84.49 80.91 92.23 87.26 2.61Tilapia 2.78 117.31 115.01 114.79 116.40 112.86 3.14Tuna 6.45 95.71 81.60 82.21 82.83 86.83 5.60Shrimps & Prawns 0.54 115.01 111.63 111.04 111.12 106.97 0.58Crabs 0.45 106.92 106.95 99.56 96.43 98.64 0.45Oysters 0.19 124.93 116.91 110.51 116.09 123.06 0.23
20142013201220112010

FOOD CONSUMPTION AND NUTRITION
PHILIPPINE STATISTICS AUTHORITY
Table 2.
Daily per capita consumption index of selected agricultural commodities,
Philippines, 2010-2014
(2006=100)
2006 INDICES 2014
COMMODITY PER CAPITA (in percent) PER CAPITA
CONSUMPTION 2010 2011 2012 2013 2014 CONSUMPTION
(grams/day) (grams/day)
Rice 325.21 95.89 98.11 100.14 97.42 96.22 312.93
Corn 50.44 88.64 86.64 95.32 104.06 119.11 60.08
Coconut 23.53 96.77 93.16 95.58 90.82 86.40 20.33
Sugarcane 7.67 68.97 106.78 97.91 89.31 90.35 6.93
Coffee 0.85 118.82 109.41 131.76 109.41 83.53 0.71
Banana 97.45 156.46 145.44 132.27 106.27 111.02 108.19
Pineapple 24.77 119.01 115.70 114.70 110.82 117.24 29.04
Mango 26.44 84.23 78.74 75.64 80.22 85.17 22.52
Calamansi 5.81 89.67 85.37 82.10 74.01 71.26 4.14
Papaya 4.55 100.00 92.75 95.16 92.75 95.82 4.36
Pomelo 1.15 80.87 71.30 71.30 68.70 66.96 0.77
Tomato 4.30 109.53 105.81 104.42 105.12 106.98 4.60
Garlic 1.37 64.23 57.66 32.12 21.90 70.07 0.96
Onion 3.51 105.41 87.46 100.00 100.00 150.71 5.29
Cabbage 2.63 133.46 125.10 125.10 123.95 122.81 3.23
Eggplant 5.56 101.98 98.56 99.46 101.44 102.52 5.70
Peanut 2.33 115.02 102.15 91.85 70.39 103.43 2.41
Mongo 1.78 95.51 91.01 101.69 103.37 92.13 1.64
Cassava 5.53 113.92 115.91 113.92 120.43 128.39 7.10
Sweet potato 16.88 89.28 83.59 82.29 82.64 80.81 13.64
Potato 1.78 153.93 149.44 143.26 135.39 130.90 2.33
Beef 5.81 114.11 111.70 109.81 109.29 116.52 6.77
Carabeef 4.54 100.22 91.19 85.02 77.75 83.92 3.81
Pork 49.81 104.40 102.25 99.84 101.53 103.13 51.37
Chevon 1.43 114.69 111.19 106.99 106.99 106.99 1.53
Chicken (dressed) 21.78 129.80 135.58 146.92 151.19 160.51 34.96
Duck (dressed) 0.38 107.89 107.89 115.79 107.89 107.89 0.41
Chicken egg 9.56 109.73 112.03 115.17 114.96 109.73 10.49
Milkfish 6.49 104.31 108.01 110.63 111.86 110.63 7.18
Roundscad 5.32 95.86 84.40 80.83 92.11 87.97 4.68
Tilapia 7.40 117.03 114.73 114.46 114.05 113.24 8.38
Tuna 11.91 90.51 83.80 85.22 83.71 100.00 11.91
Shrimps & Prawns 1.10 137.27 134.55 147.27 137.27 131.82 1.45
Crabs 1.23 98.37 95.93 86.99 64.23 80.49 0.99
Oysters 0.52 126.92 115.38 111.54 115.38 121.15 0.63
6

FOOD CONSUMPTION AND NUTRITION
PHILIPPINE STATISTICS AUTHORITY
7
Table 3a.
Daily per capita calories supply of selected agricultural commodities,
Philippines, 2010-2014(in grams)
COMMODITY 2010 2011 2012 2013 2014
Rice 1113.27 1139.08 1162.64 1131.05 1117.16
Corn 159.17 155.57 171.16 186.86 213.88
Coconut 41.90 40.33 41.38 39.32 37.41
Sugarcane 1.59 2.46 2.25 2.06 2.08
Coffee 0.47 0.44 0.53 0.44 0.33
Banana 91.48 85.04 77.34 62.14 64.91
Pineapple 7.66 7.45 7.39 7.14 7.55
Mango 10.02 9.37 9.00 9.54 10.13
Calamansi 1.35 1.29 1.24 1.12 1.08
Papaya 1.18 1.10 1.13 1.10 1.13
Pomelo 0.45 0.39 0.39 0.38 0.37
Tomato 0.80 0.77 0.76 0.77 0.78
Garlic 1.14 1.03 0.57 0.39 1.25
Onion 1.15 0.95 1.09 1.09 1.64
Cabbage 0.67 0.63 0.63 0.62 0.61
Eggplant 0.12 0.12 0.12 0.12 0.12
Peanut 11.10 9.85 8.86 6.79 9.98
Mongo 5.80 5.52 6.17 6.27 5.59
Cassava 6.87 6.99 6.87 7.26 7.74
Sweet potato 13.86 12.98 12.78 12.83 12.55
Potato 1.84 1.78 1.71 1.61 1.56
Beef 16.91 16.55 16.27 16.19 17.26
Carabeef 9.19 8.36 7.80 7.13 7.70
Pork 173.16 169.60 165.60 168.40 171.06
Chevon 3.94 3.82 3.67 3.67 3.67
Chicken 69.83 72.94 79.04 81.34 86.35
Duck 1.75 1.75 1.88 1.75 1.75
Chicken egg 62.31 63.62 65.40 65.28 62.31
Milkfish 4.33 4.49 4.60 4.65 4.60
Roundscad 3.26 2.87 2.75 3.14 3.00
Tilapia 5.54 5.43 5.42 5.40 5.36
Tuna 6.90 6.39 6.50 6.38 7.62
Shrimps & Prawns 0.71 0.70 0.76 0.71 0.68
Crabs 0.57 0.55 0.50 0.37 0.47
Oysters 0.47 0.43 0.41 0.43 0.45
FOOD CONSUMPTION AND NUTRITION
PHILIPPINE STATISTICS AUTHORITY
Table 3b.
Daily per capita protein supply of selected agricultural commodities,
Philippines, 2010-2014
(in grams)
COMMODITY 2010 2011 2012 2013 2014
Rice 23.39 23.93 24.43 23.76 23.47
Corn 4.25 4.15 4.57 4.99 5.71
Coconut 0.39 0.37 0.38 0.36 0.35
Sugarcane 0.01 0.02 0.02 0.01 0.01
Coffee 0.07 0.06 0.08 0.06 0.05
Banana 1.07 0.99 0.90 0.72 0.76
Pineapple 0.06 0.06 0.06 0.05 0.06
Mango 0.09 0.08 0.08 0.08 0.09
Calamansi 0.03 0.02 0.02 0.02 0.02
Papaya 0.02 0.02 0.02 0.02 0.02
Pomelo 0.00 0.00 0.00 0.00 0.00
Tomato 0.04 0.04 0.04 0.04 0.04
Garlic 0.11 0.09 0.05 0.04 0.12
Onion 0.04 0.03 0.04 0.04 0.06
Cabbage 0.04 0.03 0.03 0.03 0.03
Eggplant 0.05 0.05 0.05 0.05 0.05
Peanut 0.50 0.45 0.40 0.31 0.45
Mongo 0.38 0.36 0.40 0.41 0.36
Cassava 0.06 0.06 0.06 0.06 0.06
Sweet potato 0.11 0.10 0.10 0.10 0.10
Potato 0.04 0.04 0.04 0.04 0.04
0.00
Beef 2.45 2.39 2.35 2.34 2.50
Carabeef 1.01 0.92 0.86 0.78 0.85
Pork 16.48 16.14 15.76 16.03 16.28
Chevon 0.47 0.45 0.44 0.44 0.44
Chicken 8.57 8.95 9.70 9.98 10.59
Duck 0.11 0.11 0.12 0.11 0.11
Chicken egg 4.80 4.91 5.04 5.03 4.80
Milkfish 0.70 0.72 0.74 0.75 0.74
Roundscad 0.53 0.46 0.44 0.50 0.48
Tilapia 0.89 0.87 0.87 0.87 0.86
Tuna 1.11 1.03 1.05 1.03 1.23
Shrimps & Prawns 0.14 0.14 0.15 0.14 0.13
Crabs 0.11 0.11 0.10 0.07 0.09
Oysters 0.07 0.06 0.06 0.06 0.07
TABLE OF CONTENTS
iii 8
FOREWORD i
LIST OF TABLES i i i
FOOD CONSUMPTION AND NUTRITION
Table 1. Annual per capita production index of selectedagricultural commodities, Philippines, 2010-2014 5
Table 2. Daily per capita consumption index of selectedagricultural commodities, Philippines, 2010-2014 6
Table 3a. Daily per capita calories supply of selectedagricultural commodities, Philippines, 2010-2014 7
Table 3b. Daily per capita protein supply of selectedagricultural commodities, Philippines, 2010-2014 8
Table 3c. Daily per capita fats supply of selectedagricultural commodities, Philippines, 2010-2014 9
FOOD CONSUMPTION AND NUTRITION
PHILIPPINE STATISTICS AUTHORITY
Table 7Producer's share in consumer peso, selected agricultural commodities,Philippines, 2009-2013(in percent)
COMM0DITIES 2009 2010 2011 2012 2013
Cereals Rice special 43 43 44 42 42 Corngrain yellow 52 58 60 58 53 Corngrain white 55 56 76 68 73
Commercial Coconut, matured 30 37 41 30 30
Vegetables & Legumes Garlic 48 47 59 47 41 Ginger 47 47 41 33 41 Onion Red Creole 53 47 61 67 51 Cabbage 32 22 34 29 29 Pechay, native 39 40 40 39 40 Ampalaya 51 46 48 50 49 Eggplant 46 43 49 46 43 Squash 44 41 42 42 39 Tomato 34 35 34 33 35 Carrots 40 25 38 33 33 Gabi (for ginataan) 42 42 36 35 34 White potato 49 43 44 43 48 Sweet potato 43 44 47 45 43 Habitchuelas 40 35 36 37 38 Mongo, green, labo 66 66 66 60 65 Peanut without shell, dry 82 82 77 80 78 Stringbeans 47 48 48 46 48
Fruits
Banana, Lakatan (green) 43 48 44 44 45 Calamansi 48 39 48 42 37 Mango, Carabao (green) 48 45 45 44 43 Papaya, Hawaiian 57 51 59 47 45 Pineapple, Hawaiian 39 36 42 45 42
9
Table 3c.
Daily per capita fats supply of selected agricultural commodities,
Philippines, 2010-2014
(in grams)
COMMODITY 2010 2011 2012 2013 2014
Rice 5.61 5.74 5.86 5.70 5.63
Corn 1.92 1.88 2.07 2.26 2.58
Coconut 3.96 3.81 3.91 3.72 3.54
Sugarcane 0.00 0.00 0.00 0.00 0.00
Coffee 0.00 0.00 0.00 0.00 0.00
Banana 0.46 0.43 0.39 0.31 0.32
Pineapple 0.06 0.06 0.06 0.05 0.06
Mango 0.04 0.04 0.04 0.04 0.05
Calamansi 0.01 0.01 0.01 0.01 0.01
Papaya 0.00 0.00 0.00 0.00 0.00
Pomelo 0.00 0.00 0.00 0.00 0.00
Tomato 0.01 0.01 0.01 0.01 0.01
Garlic 0.00 0.00 0.00 0.00 0.00
Onion 0.01 0.01 0.01 0.01 0.01
Cabbage 0.00 0.00 0.00 0.00 0.00
Eggplant 0.57 0.55 0.55 0.56 0.57
Peanut 0.96 0.85 0.77 0.59 0.87
Mongo 0.03 0.03 0.03 0.03 0.03
Cassava 0.01 0.01 0.01 0.01 0.01
Sweet potato 0.03 0.03 0.03 0.03 0.03
Potato 0.00 0.00 0.00 0.00 0.00
Beef 1.43 1.40 1.37 1.37 1.46
Carabeef 0.43 0.39 0.36 0.33 0.36
Pork 11.20 10.97 10.71 10.89 11.07
Chevon 0.21 0.20 0.19 0.19 0.19
Chicken 3.28 3.43 3.71 3.82 4.06
Duck 0.13 0.13 0.14 0.13 0.13
Chicken egg 4.38 4.48 4.60 4.59 4.38
Milkfish 0.15 0.15 0.16 0.16 0.16
Roundscad 0.11 0.10 0.09 0.11 0.10
Tilapia 0.19 0.19 0.19 0.19 0.18
Tuna 0.24 0.22 0.22 0.22 0.26
Shrimps & Prawns 0.01 0.01 0.01 0.01 0.01
Crabs 0.01 0.01 0.01 0.00 0.00
Oysters 0.01 0.01 0.01 0.01 0.01

FOOD CONSUMPTION AND NUTRITION
PHILIPPINE STATISTICS AUTHORITY
FOREWORD
The Agricultural Indicators System (AIS) is one of the statistical frameworks maintained by the Philippine Statistics Authority (PSA). AIS contains twelve (12) modules and these are updated and released annually. This is the sixth module entitled Food Consumption and Nutrition. It provides information on per capita production, per capita consumption and per capita calories, proteins and fats supply of selected major agricultural commodities. The reference years are 2010 to 2014.
The AIS hopes to cover more agricultural development indicators to support the information needs of our data users. We encourage the readers to give their comments and suggestions on the improvement of the AIS, in general, and the report, in particular. .
LISA GRACE S. BERSALES, Ph.D.
National Statistician and Civil Registrar General
Quezon City. Philippines October 2015
MODULES OF THE AGRICULTURAL INDICATORS SYSTEM
1. Agricultural Structures and Resources
2. Agricultural Credit
3. Output and Productivity
4. Agricultural Exports and Imports
5. Food Sufficiency and Security
6. Food Consumption and Nutrition
7. Population and Labor Force
8. Redistribution of Land
9. Agricultural Exports and Imports
10. Gender-based Indicators of Labor and Employment in Agriculture 11. Economic Growth
12. Prices and Marketing of Agricultural Commodities
13. Inputs
i

FOOD CONSUMPTION AND NUTRITION
PHILIPPINE STATISTICS AUTHORITY
TERMS OF USE Agricultural Indicators System (AIS) is a publication of the Philippine Statistics Authority. The PSA reserves exclusive right to reproduce this publication in whatever form. Should any portion of this publication be included in a report/article, the title of the publication and the PSA should be cited as the source of the data. The PSA will not be responsible for any information derived from the processing of data contained in this publication.
ISSN-2012-0435 OCTOBER 2015 Please direct technical inquiries to the Agricultural Accounts Division Macroeconomic Accounts Service, Sectoral Statistics Office Philippines Statistics Authority 16/F Eton Cyberpod Centris 3, EDSA corner Quezon Avenue, Quezon City, Philippines, Telephone (632) 376 1954 Email:[email protected] Website:www.psa.gov.ph
Design and Layout Knowledge Management and Communications Division (KMCD)

FOOD CONSUMPTION AND NUTRITION
PHILIPPINE STATISTICS AUTHORITY
ISSN-2012-0435
REPORT No. 2015-6
PHILIPPINE STATISTICS AUTHORITY 16th Floor. ETON Cyberpod Centris 3
EDSA. Corner Quezon Avenue, Quezon City
www.psa.gov.ph